appendix a construction and operation · pdf filea.1 construction schedule a.2 mobilization...
TRANSCRIPT
APPENDIX A
Construction and Operation Information

CALIFORNIA HIGH-SPEED TRAIN PROJECT EIR/EIS AIR QUALITY TECHNICAL REPORT MERCED TO FRESNO SECTION APPENDIX A
Page i
Contents A.1 Construction Schedule A.2 Mobilization A.3 Demolition A.4 Rail Line: Alignment A.5 Alignment: Land Prep Equipment A.6 Rail Line: Rail Equipment A.7 Summary of Roadway Projects A.8 BNSF Ave 21: Roadway Projects A.9 BNSF Ave 24: Roadway Projects A.10 UPRR Ave 21: Roadway Projects A.11 UPRR Ave 24: Roadway Projects A.12 Hybrid Ave 24: Roadway Projects A.13 Hybrid Ave 21: Roadway Projects A.14 Power Supply Stations A.15 Demobilization A.16 Maintenance Facilities A.17 Merced Train Station A.18 Material Hauling

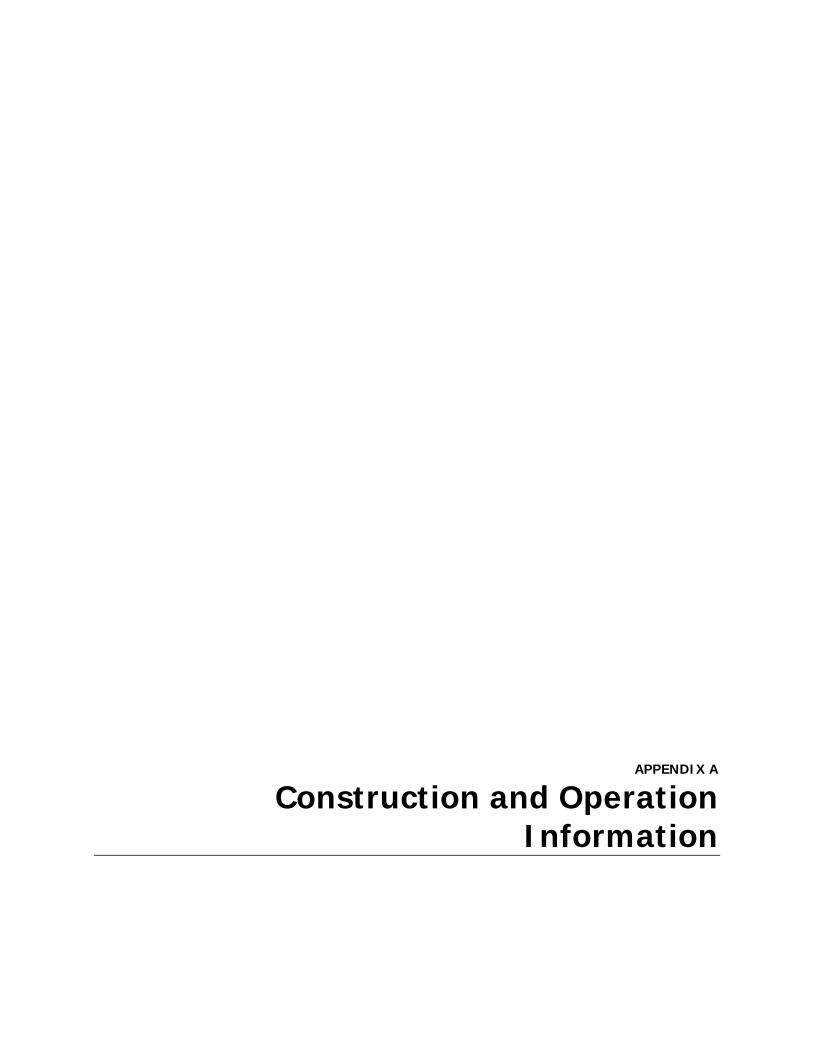
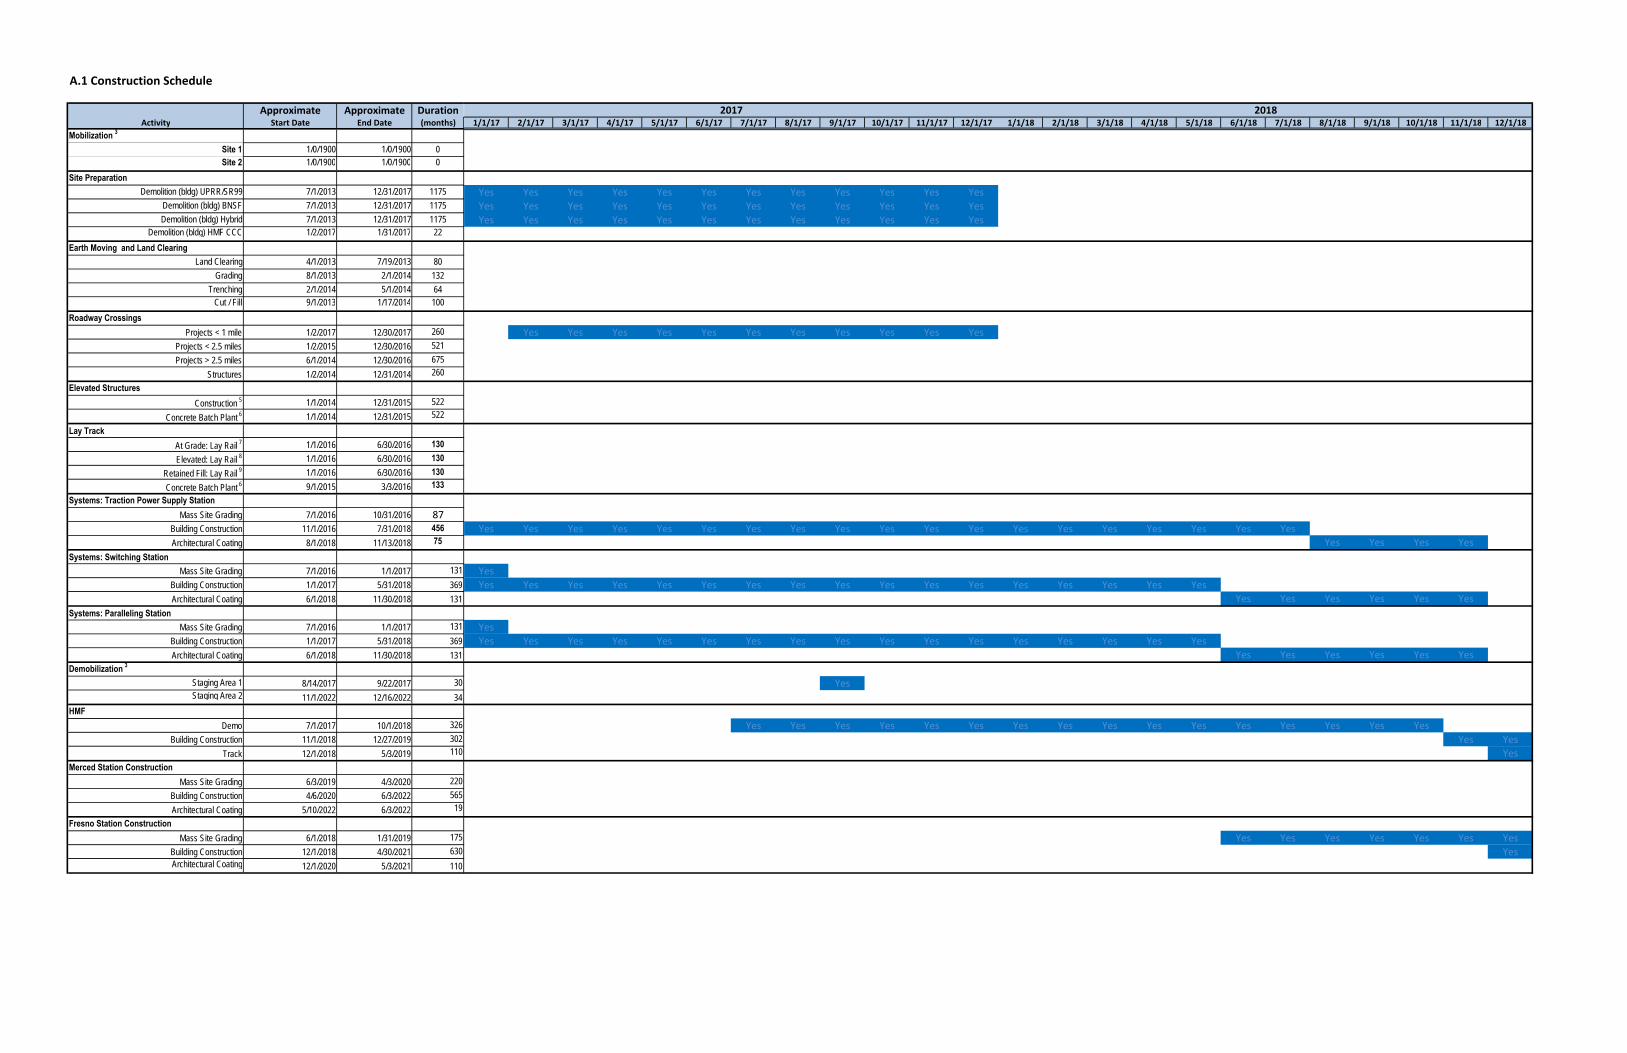
A.1 Construction Schedule
Approximate Approximate DurationActivity Start Date End Date (months) 1/1/13 2/1/13 3/1/13 4/1/13 5/1/13 6/1/13 7/1/13 8/1/13 9/1/13 10/1/13 11/1/13 12/1/13 1/1/14 2/1/14 3/1/14 4/1/14 5/1/14 6/1/14 7/1/14 8/1/14 9/1/14 10/1/14 11/1/14 12/1/14
Mobilization 3 No No No No No No No No No No No No No No No No No No No No No No No NoSite 1 1/0/1900 1/0/1900 0 No No NoSite 2 1/0/1900 1/0/1900 0 No No No No No No No No
Site Preparation No No No No No No No No No No No No No No No No No No No No No No NoDemolition (bldg) UPRR/SR99 7/1/2013 12/31/2017 1175 No No No No No Yes Yes Yes Yes Yes Yes Yes Yes Yes Yes Yes Yes Yes Yes Yes Yes Yes Yes
Demolition (bldg) BNSF 7/1/2013 12/31/2017 1175 No No No No No Yes Yes Yes Yes Yes Yes Yes Yes Yes Yes Yes Yes Yes Yes Yes Yes Yes YesDemolition (bldg) Hybrid 7/1/2013 12/31/2017 1175 No No No No No Yes Yes Yes Yes Yes Yes Yes Yes Yes Yes Yes Yes Yes Yes Yes Yes Yes Yes
Demolition (bldg) HMF CCC 1/2/2017 1/31/2017 22 No No No No No No No No No No No No No No No No No No No No No No NoEarth Moving and Land Clearing No No No No No No No No No No No No No No No No No No No No No No No
Land Clearing 4/1/2013 7/19/2013 80 No No No Yes Yes Yes Yes No No No No No No No No No No No No No No No No NoGrading 8/1/2013 2/1/2014 132 No No No No No No Yes Yes Yes Yes Yes Yes Yes No No No No No No No No No No
Trenching 2/1/2014 5/1/2014 64 No No No No No No No No No No No No Yes Yes Yes Yes No No No No No No NoCut / Fill 9/1/2013 1/17/2014 100 No No No No No No No Yes Yes Yes Yes Yes No No No No No No No No No No No
Roadway Crossings No No No No No No No No No No No No No No No No No No No No No No NoProjects < 1 mile 1/2/2017 12/30/2017 260 No No No No No No No No No No No No No No No No No No No No No No No No
Projects < 2.5 miles 1/2/2015 12/30/2016 521 No No No No No No No No No No No No No No No No No No No No No No No NoProjects > 2.5 miles 6/1/2014 12/30/2016 675 No No No No No No No No No No No No No No No No No Yes Yes Yes Yes Yes Yes Yes
Structures 1/2/2014 12/31/2014 260 No No No No No No No No No No No No No Yes Yes Yes Yes Yes Yes Yes Yes Yes Yes YesElevated Structures No No No No No No No No No No No No No No No No No No No No No No No No
Construction 5 1/1/2014 12/31/2015 522 No No No No No No No No No No No No Yes Yes Yes Yes Yes Yes Yes Yes Yes Yes Yes YesConcrete Batch Plant 6 1/1/2014 12/31/2015 522 No No No No No No No No No No No No Yes Yes Yes Yes Yes Yes Yes Yes Yes Yes Yes Yes
Lay TrackAt Grade: Lay Rail 7 1/1/2016 6/30/2016 130 No No No No No No No No No No No No No No No No No No No No No No No NoElevated: Lay Rail 8 1/1/2016 6/30/2016 130 No No No No No No No No No No No No No No No No No No No No No No No No
Retained Fill: Lay Rail 9 1/1/2016 6/30/2016 130 No No No No No No No No No No No No No No No No No No No No No No No NoConcrete Batch Plant 6 9/1/2015 3/3/2016 133 No No No No No No No No No No No No No No No No No No No No No No No No
Systems: Traction Power Supply Station No No No No No No No NoMass Site Grading 7/1/2016 10/31/2016 87 No No No No No No No No No No No No No No No No No No No No No No No No
Building Construction 11/1/2016 7/31/2018 456 No No No No No No No No No No No No No No No No No No No No No No No NoArchitectural Coating 8/1/2018 11/13/2018 75 No No No No No No No No No No No No No No No No No No No No No No No No
Systems: Switching Station No No No No No No No No No No No No No No No No No No No No No No No NoMass Site Grading 7/1/2016 1/1/2017 131 No No No No No No No No No No No No No No No No No No No No No No No No
Building Construction 1/1/2017 5/31/2018 369 No No No No No No No No No No No No No No No No No No No No No No No NoArchitectural Coating 6/1/2018 11/30/2018 131 No No No No No No No No No No No No No No No No No No No No No No No No
Systems: Paralleling Station No No No No No No No No No No No No No No No No No No No No No No No NoMass Site Grading 7/1/2016 1/1/2017 131 No No No No No No No No No No No No No No No No No No No No No No No No
Building Construction 1/1/2017 5/31/2018 369 No No No No No No No No No No No No No No No No No No No No No No No NoArchitectural Coating 6/1/2018 11/30/2018 131 No No No No No No No No No No No No No No No No No No No No No No No No
Demobilization 3 No No No No No No No No No No No No No No No No No No No No No No No NoStaging Area 1 8/14/2017 9/22/2017 30 No No No No No No No No No No No No No No No No No No No No No No No NoStaging Area 2 11/1/2022 12/16/2022 34 No No No No No No No No No No No No No No No No No No No No No No No No
HMF No No No No No No No No No No No No No No No No No No No No No No No NoDemo 7/1/2017 10/1/2018 326 No No No No No No No No No No No No No No No No No No No No No No No No
Building Construction 11/1/2018 12/27/2019 302 No No No No No No No No No No No No No No No No No No No No No No No NoTrack 12/1/2018 5/3/2019 110 No No No No No No No No No No No No No No No No No No No No No No No No
Merced Station Construction No No No No No No No No No No No No No No No No No No No No No No No NoMass Site Grading 6/3/2019 4/3/2020 220 No No No No No No No No No No No No No No No No No No No No No No No No
Building Construction 4/6/2020 6/3/2022 565 No No No No No No No No No No No No No No No No No No No No No No No NoArchitectural Coating 5/10/2022 6/3/2022 19 No No No No No No No No No No No No No No No No No No No No No No No No
Fresno Station Construction No No No No No No No No No No No No No No No No No No No No No No No NoMass Site Grading 6/1/2018 1/31/2019 175 No No No No No No No No No No No No No No No No No No No No No No No No
Building Construction 12/1/2018 4/30/2021 630 No No No No No No No No No No No No No No No No No No No No No No No NoArchitectural Coating 12/1/2020 5/3/2021 110 No No No No No No No No No No No No No No No No No No No No No No No No
2013 2014
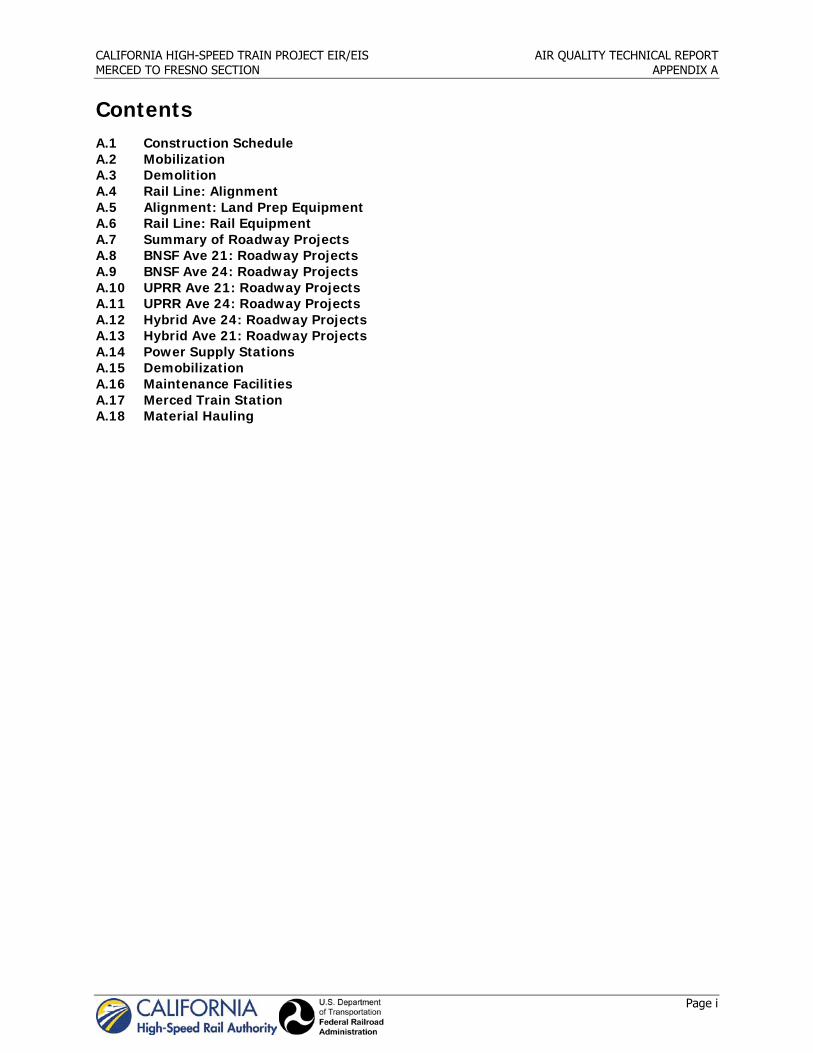
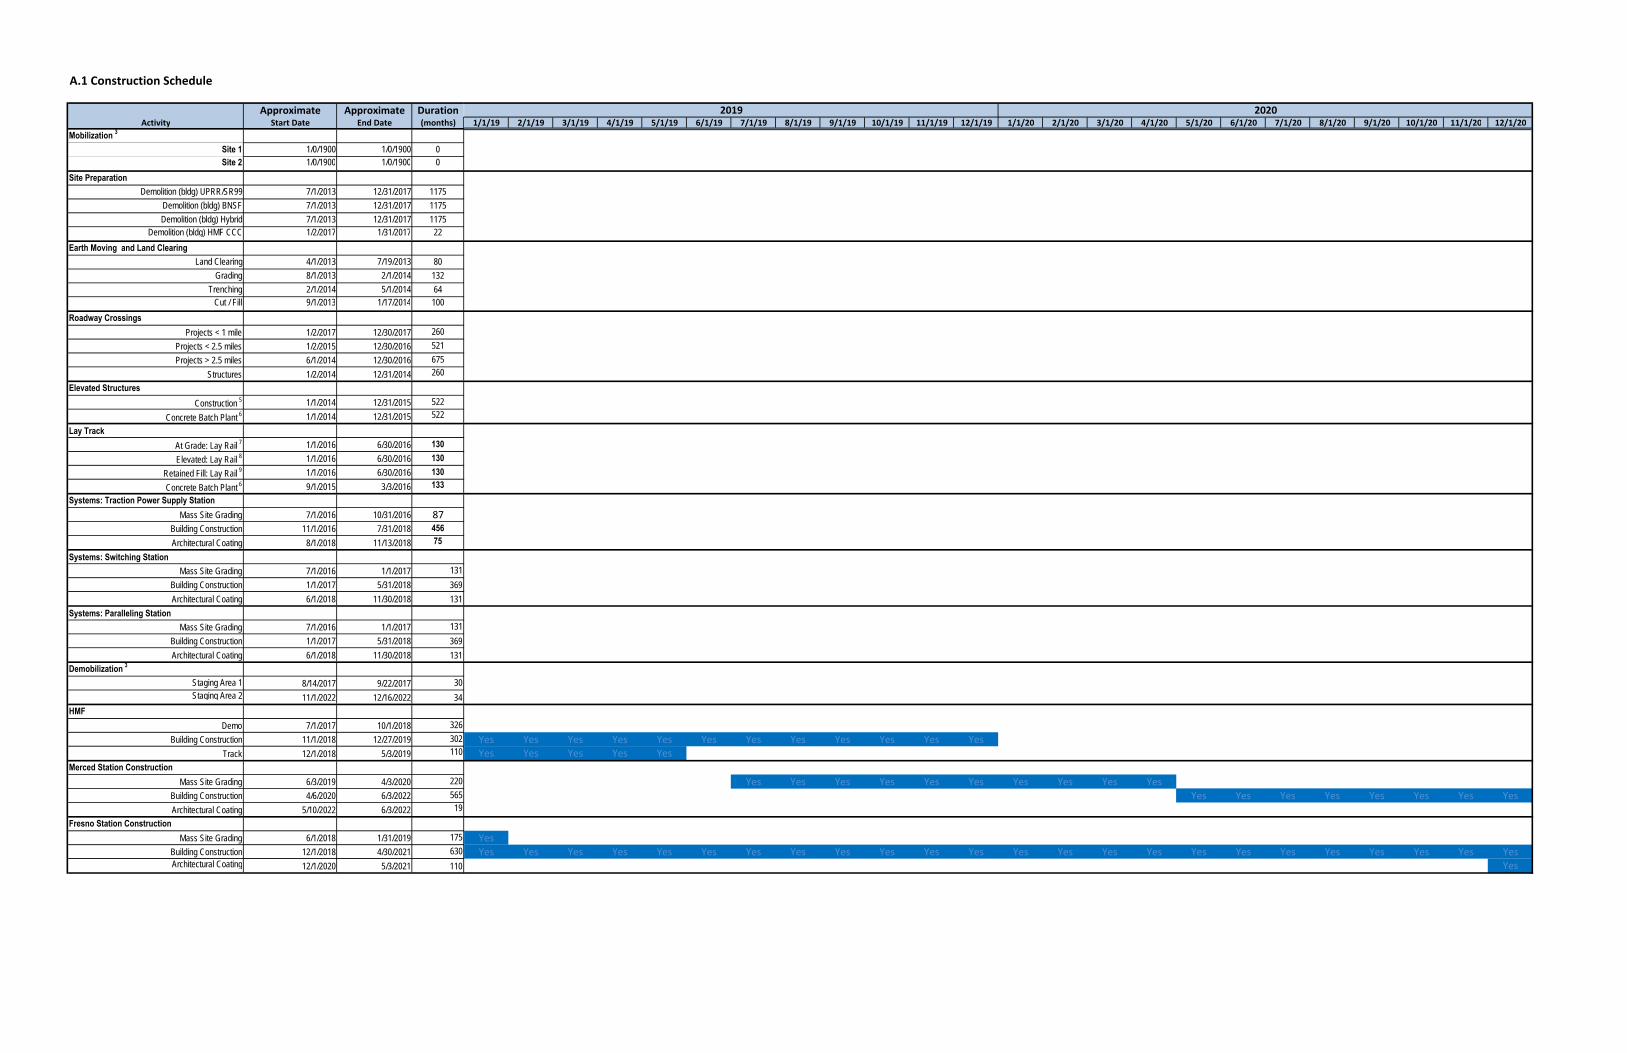
A.1 Construction Schedule
Approximate Approximate DurationActivity Start Date End Date (months)
Mobilization 3 Site 1 1/0/1900 1/0/1900 0Site 2 1/0/1900 1/0/1900 0
Site Preparation Demolition (bldg) UPRR/SR99 7/1/2013 12/31/2017 1175
Demolition (bldg) BNSF 7/1/2013 12/31/2017 1175Demolition (bldg) Hybrid 7/1/2013 12/31/2017 1175
Demolition (bldg) HMF CCC 1/2/2017 1/31/2017 22Earth Moving and Land Clearing
Land Clearing 4/1/2013 7/19/2013 80Grading 8/1/2013 2/1/2014 132
Trenching 2/1/2014 5/1/2014 64Cut / Fill 9/1/2013 1/17/2014 100
Roadway Crossings Projects < 1 mile 1/2/2017 12/30/2017 260
Projects < 2.5 miles 1/2/2015 12/30/2016 521Projects > 2.5 miles 6/1/2014 12/30/2016 675
Structures 1/2/2014 12/31/2014 260Elevated Structures
Construction 5 1/1/2014 12/31/2015 522Concrete Batch Plant 6 1/1/2014 12/31/2015 522
Lay TrackAt Grade: Lay Rail 7 1/1/2016 6/30/2016 130Elevated: Lay Rail 8 1/1/2016 6/30/2016 130
Retained Fill: Lay Rail 9 1/1/2016 6/30/2016 130Concrete Batch Plant 6 9/1/2015 3/3/2016 133
Systems: Traction Power Supply Station Mass Site Grading 7/1/2016 10/31/2016 87
Building Construction 11/1/2016 7/31/2018 456Architectural Coating 8/1/2018 11/13/2018 75
Systems: Switching Station Mass Site Grading 7/1/2016 1/1/2017 131
Building Construction 1/1/2017 5/31/2018 369Architectural Coating 6/1/2018 11/30/2018 131
Systems: Paralleling Station Mass Site Grading 7/1/2016 1/1/2017 131
Building Construction 1/1/2017 5/31/2018 369Architectural Coating 6/1/2018 11/30/2018 131
Demobilization 3 Staging Area 1 8/14/2017 9/22/2017 30Staging Area 2 11/1/2022 12/16/2022 34
HMFDemo 7/1/2017 10/1/2018 326
Building Construction 11/1/2018 12/27/2019 302Track 12/1/2018 5/3/2019 110
Merced Station ConstructionMass Site Grading 6/3/2019 4/3/2020 220
Building Construction 4/6/2020 6/3/2022 565Architectural Coating 5/10/2022 6/3/2022 19
Fresno Station Construction Mass Site Grading 6/1/2018 1/31/2019 175
Building Construction 12/1/2018 4/30/2021 630Architectural Coating 12/1/2020 5/3/2021 110
1/1/15 2/1/15 3/1/15 4/1/15 5/1/15 6/1/15 7/1/15 8/1/15 9/1/15 10/1/15 11/1/15 12/1/15 1/1/16 2/1/16 3/1/16 4/1/16 5/1/16 6/1/16 7/1/16 8/1/16 9/1/16 10/1/16 11/1/16 12/1/16
No No No No No No No No No No No No No No No No No No No No No No No No
No No No No No No No No No No No No No No No No No No No No No No No NoYes Yes Yes Yes Yes Yes Yes Yes Yes Yes Yes Yes Yes Yes Yes Yes Yes Yes Yes Yes Yes Yes Yes YesYes Yes Yes Yes Yes Yes Yes Yes Yes Yes Yes Yes Yes Yes Yes Yes Yes Yes Yes Yes Yes Yes Yes YesYes Yes Yes Yes Yes Yes Yes Yes Yes Yes Yes Yes Yes Yes Yes Yes Yes Yes Yes Yes Yes Yes Yes YesNo No No No No No No No No No No No No No No No No No No No No No No NoNo No No No No No No No No No No No No No No No No No No No No No No NoNo No No No No No No No No No No No No No No No No No No No No No No NoNo No No No No No No No No No No No No No No No No No No No No No No NoNo No No No No No No No No No No No No No No No No No No No No No No NoNo No No No No No No No No No No No No No No No No No No No No No No NoNo No No No No No No No No No No No No No No No No No No No No No No NoNo No No No No No No No No No No No No No No No No No No No No No No NoNo Yes Yes Yes Yes Yes Yes Yes Yes Yes Yes Yes Yes Yes Yes Yes Yes Yes Yes Yes Yes Yes Yes YesYes Yes Yes Yes Yes Yes Yes Yes Yes Yes Yes Yes Yes Yes Yes Yes Yes Yes Yes Yes Yes Yes Yes YesNo No No No No No No No No No No No No No No No No No No No No No No NoNo No No No No No No No No No No No No No No No No No No No No No No NoYes Yes Yes Yes Yes Yes Yes Yes Yes Yes Yes Yes No No No No No No No No No No No NoYes Yes Yes Yes Yes Yes Yes Yes Yes Yes Yes Yes No No No No No No No No No No No No
No No No No No No No No No No No No Yes Yes Yes Yes Yes Yes No No No No No NoNo No No No No No No No No No No No Yes Yes Yes Yes Yes Yes No No No No No NoNo No No No No No No No No No No No Yes Yes Yes Yes Yes Yes No No No No No NoNo No No No No No No No Yes Yes Yes Yes Yes Yes Yes No No No No No No No No No
No No No No No NoNo No No No No No No No No No No No No No No No No No Yes Yes Yes Yes No NoNo No No No No No No No No No No No No No No No No No No No No No Yes YesNo No No No No No No No No No No No No No No No No No No No No No No NoNo No No No No No No No No No No No No No No No No No No No No No No NoNo No No No No No No No No No No No No No No No No No Yes Yes Yes Yes Yes YesNo No No No No No No No No No No No No No No No No No No No No No No NoNo No No No No No No No No No No No No No No No No No No No No No No NoNo No No No No No No No No No No No No No No No No No No No No No No NoNo No No No No No No No No No No No No No No No No No Yes Yes Yes Yes Yes YesNo No No No No No No No No No No No No No No No No No No No No No No NoNo No No No No No No No No No No No No No No No No No No No No No No NoNo No No No No No No No No No No No No No No No No No No No No No No NoNo No No No No No No No No No No No No No No No No No No No No No No NoNo No No No No No No No No No No No No No No No No No No No No No No NoNo No No No No No No No No No No No No No No No No No No No No No No NoNo No No No No No No No No No No No No No No No No No No No No No No NoNo No No No No No No No No No No No No No No No No No No No No No No NoNo No No No No No No No No No No No No No No No No No No No No No No NoNo No No No No No No No No No No No No No No No No No No No No No No NoNo No No No No No No No No No No No No No No No No No No No No No No NoNo No No No No No No No No No No No No No No No No No No No No No No NoNo No No No No No No No No No No No No No No No No No No No No No No NoNo No No No No No No No No No No No No No No No No No No No No No No NoNo No No No No No No No No No No No No No No No No No No No No No No NoNo No No No No No No No No No No No No No No No No No No No No No No NoNo No No No No No No No No No No No No No No No No No No No No No No No
2015 2016
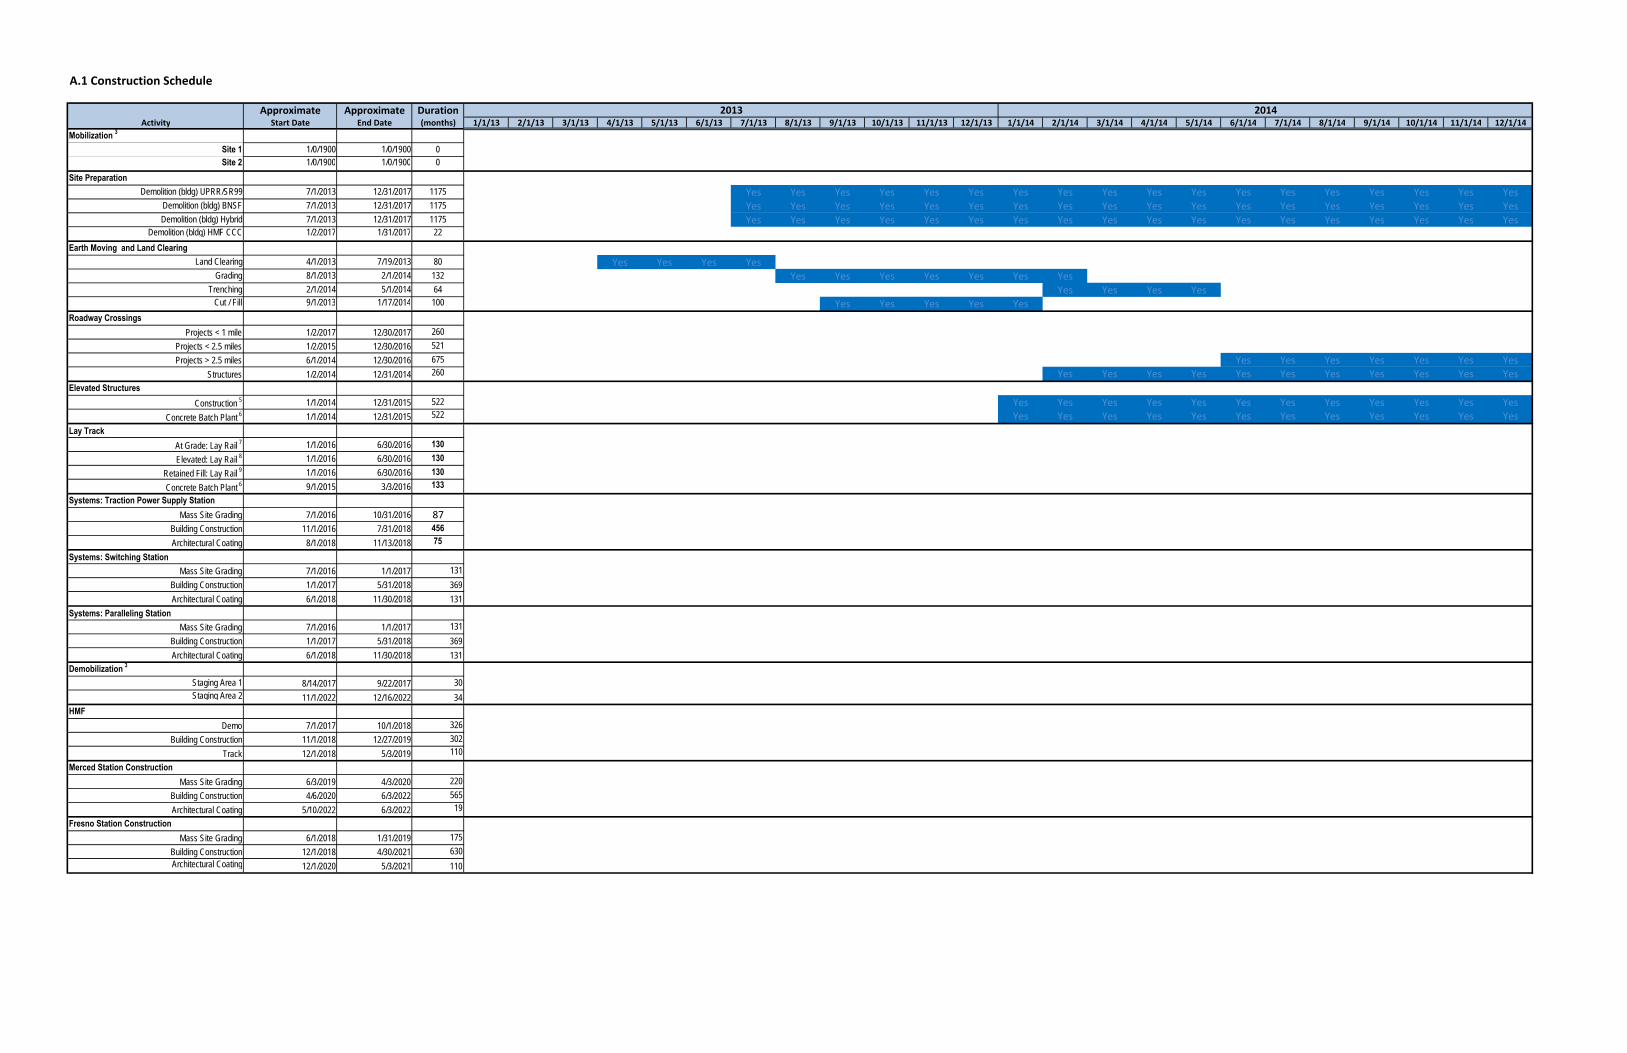
A.1 Construction Schedule
Approximate Approximate DurationActivity Start Date End Date (months)
Mobilization 3 Site 1 1/0/1900 1/0/1900 0Site 2 1/0/1900 1/0/1900 0
Site Preparation Demolition (bldg) UPRR/SR99 7/1/2013 12/31/2017 1175
Demolition (bldg) BNSF 7/1/2013 12/31/2017 1175Demolition (bldg) Hybrid 7/1/2013 12/31/2017 1175
Demolition (bldg) HMF CCC 1/2/2017 1/31/2017 22Earth Moving and Land Clearing
Land Clearing 4/1/2013 7/19/2013 80Grading 8/1/2013 2/1/2014 132
Trenching 2/1/2014 5/1/2014 64Cut / Fill 9/1/2013 1/17/2014 100
Roadway Crossings Projects < 1 mile 1/2/2017 12/30/2017 260
Projects < 2.5 miles 1/2/2015 12/30/2016 521Projects > 2.5 miles 6/1/2014 12/30/2016 675
Structures 1/2/2014 12/31/2014 260Elevated Structures
Construction 5 1/1/2014 12/31/2015 522Concrete Batch Plant 6 1/1/2014 12/31/2015 522
Lay TrackAt Grade: Lay Rail 7 1/1/2016 6/30/2016 130Elevated: Lay Rail 8 1/1/2016 6/30/2016 130
Retained Fill: Lay Rail 9 1/1/2016 6/30/2016 130Concrete Batch Plant 6 9/1/2015 3/3/2016 133
Systems: Traction Power Supply Station Mass Site Grading 7/1/2016 10/31/2016 87
Building Construction 11/1/2016 7/31/2018 456Architectural Coating 8/1/2018 11/13/2018 75
Systems: Switching Station Mass Site Grading 7/1/2016 1/1/2017 131
Building Construction 1/1/2017 5/31/2018 369Architectural Coating 6/1/2018 11/30/2018 131
Systems: Paralleling Station Mass Site Grading 7/1/2016 1/1/2017 131
Building Construction 1/1/2017 5/31/2018 369Architectural Coating 6/1/2018 11/30/2018 131
Demobilization 3 Staging Area 1 8/14/2017 9/22/2017 30Staging Area 2 11/1/2022 12/16/2022 34
HMFDemo 7/1/2017 10/1/2018 326
Building Construction 11/1/2018 12/27/2019 302Track 12/1/2018 5/3/2019 110
Merced Station ConstructionMass Site Grading 6/3/2019 4/3/2020 220
Building Construction 4/6/2020 6/3/2022 565Architectural Coating 5/10/2022 6/3/2022 19
Fresno Station Construction Mass Site Grading 6/1/2018 1/31/2019 175
Building Construction 12/1/2018 4/30/2021 630Architectural Coating 12/1/2020 5/3/2021 110
1/1/17 2/1/17 3/1/17 4/1/17 5/1/17 6/1/17 7/1/17 8/1/17 9/1/17 10/1/17 11/1/17 12/1/17 1/1/18 2/1/18 3/1/18 4/1/18 5/1/18 6/1/18 7/1/18 8/1/18 9/1/18 10/1/18 11/1/18 12/1/18
No No No No No No No No No No No No No No No No No No No No No No No No
No No No No No No No No No No No No No No No No No No No No No No No NoYes Yes Yes Yes Yes Yes Yes Yes Yes Yes Yes Yes No No No No No No No No No No No NoYes Yes Yes Yes Yes Yes Yes Yes Yes Yes Yes Yes No No No No No No No No No No No NoYes Yes Yes Yes Yes Yes Yes Yes Yes Yes Yes Yes No No No No No No No No No No No NoNo No No No No No No No No No No No No No No No No No No No No No No NoNo No No No No No No No No No No No No No No No No No No No No No No NoNo No No No No No No No No No No No No No No No No No No No No No No NoNo No No No No No No No No No No No No No No No No No No No No No No NoNo No No No No No No No No No No No No No No No No No No No No No No NoNo No No No No No No No No No No No No No No No No No No No No No No NoNo No No No No No No No No No No No No No No No No No No No No No No NoNo Yes Yes Yes Yes Yes Yes Yes Yes Yes Yes Yes No No No No No No No No No No No NoNo No No No No No No No No No No No No No No No No No No No No No No NoNo No No No No No No No No No No No No No No No No No No No No No No NoNo No No No No No No No No No No No No No No No No No No No No No No NoNo No No No No No No No No No No No No No No No No No No No No No No NoNo No No No No No No No No No No No No No No No No No No No No No No NoNo No No No No No No No No No No No No No No No No No No No No No No No
No No No No No No No No No No No No No No No No No No No No No No No NoNo No No No No No No No No No No No No No No No No No No No No No No NoNo No No No No No No No No No No No No No No No No No No No No No No NoNo No No No No No No No No No No No No No No No No No No No No No No NoNo No No No No No No No No No No No No No No No No No No No No No No NoNo No No No No No No No No No No No No No No No No No No No No No No NoYes Yes Yes Yes Yes Yes Yes Yes Yes Yes Yes Yes Yes Yes Yes Yes Yes Yes Yes No No No No NoNo No No No No No No No No No No No No No No No No No No Yes Yes Yes Yes NoNo No No No No No No No No No No No No No No No No No No No No No No NoYes No No No No No No No No No No No No No No No No No No No No No No NoYes Yes Yes Yes Yes Yes Yes Yes Yes Yes Yes Yes Yes Yes Yes Yes Yes No No No No No No NoNo No No No No No No No No No No No No No No No No Yes Yes Yes Yes Yes Yes NoNo No No No No No No No No No No No No No No No No No No No No No No NoYes No No No No No No No No No No No No No No No No No No No No No No NoYes Yes Yes Yes Yes Yes Yes Yes Yes Yes Yes Yes Yes Yes Yes Yes Yes No No No No No No NoNo No No No No No No No No No No No No No No No No Yes Yes Yes Yes Yes Yes NoNo No No No No No No No No No No No No No No No No No No No No No No NoNo No No No No No No No Yes No No No No No No No No No No No No No No NoNo No No No No No No No No No No No No No No No No No No No No No No NoNo No No No No No No No No No No No No No No No No No No No No No No NoNo No No No No No Yes Yes Yes Yes Yes Yes Yes Yes Yes Yes Yes Yes Yes Yes Yes Yes No NoNo No No No No No No No No No No No No No No No No No No No No No Yes YesNo No No No No No No No No No No No No No No No No No No No No No No YesNo No No No No No No No No No No No No No No No No No No No No No No NoNo No No No No No No No No No No No No No No No No No No No No No No NoNo No No No No No No No No No No No No No No No No No No No No No No NoNo No No No No No No No No No No No No No No No No No No No No No No NoNo No No No No No No No No No No No No No No No No No No No No No No NoNo No No No No No No No No No No No No No No No No Yes Yes Yes Yes Yes Yes YesNo No No No No No No No No No No No No No No No No No No No No No No YesNo No No No No No No No No No No No No No No No No No No No No No No No
2017 2018
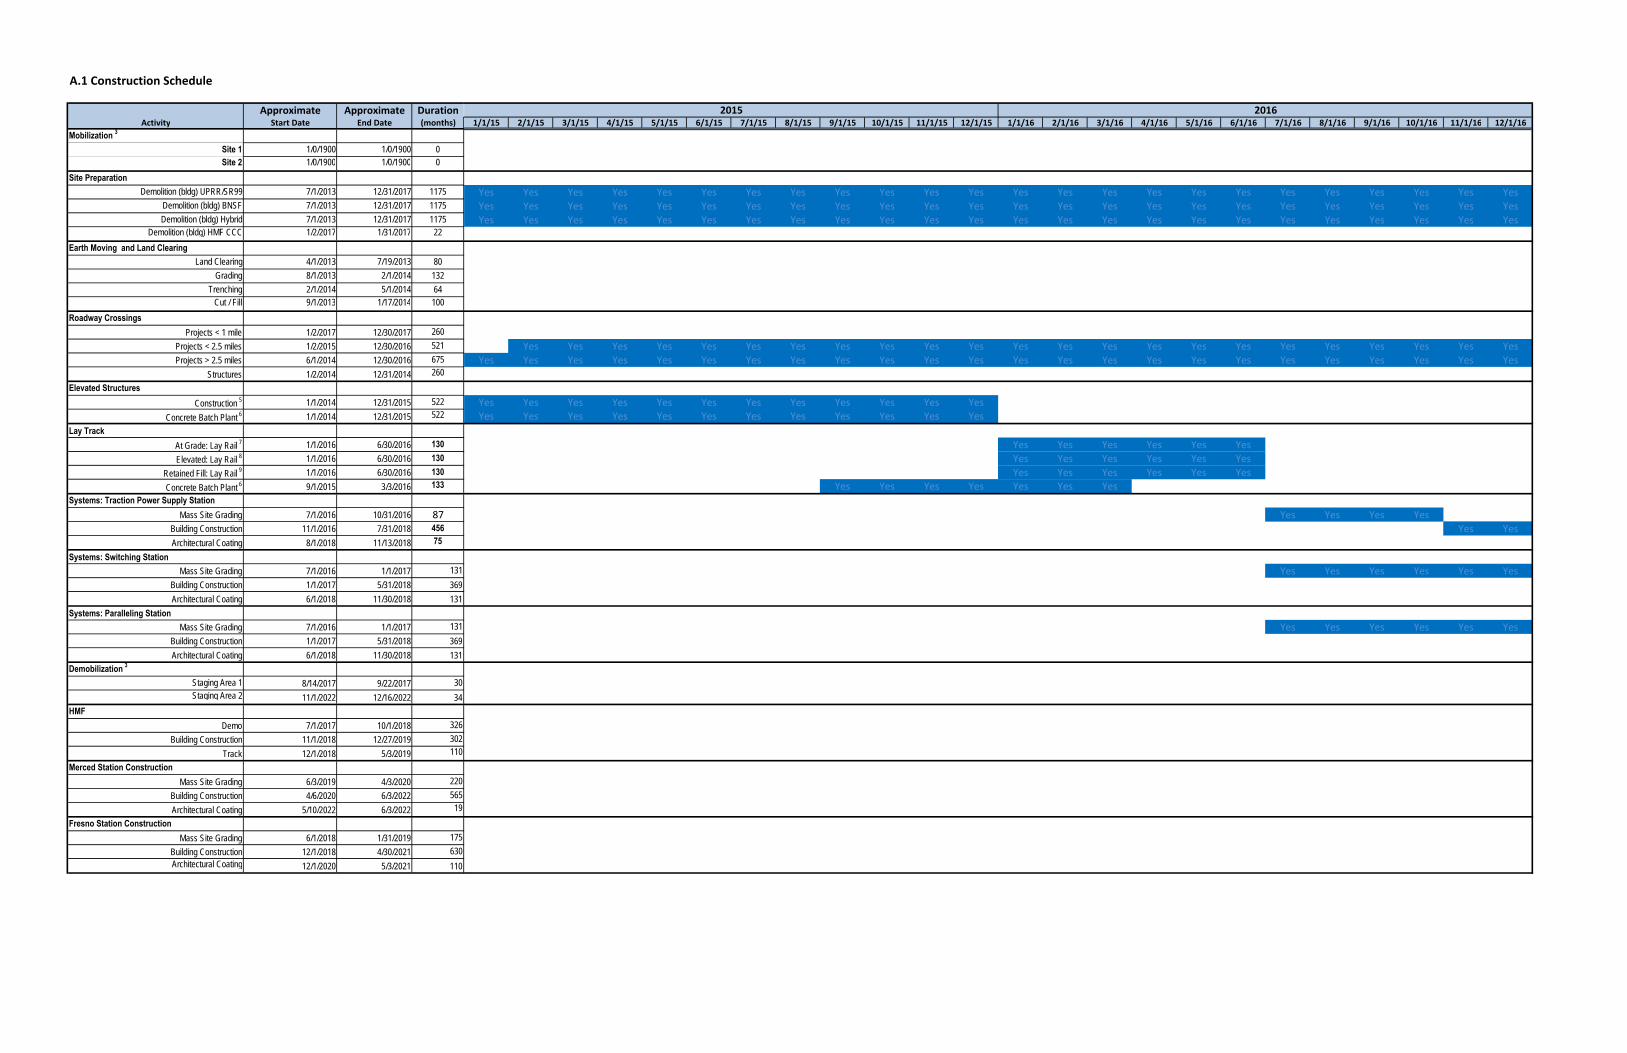
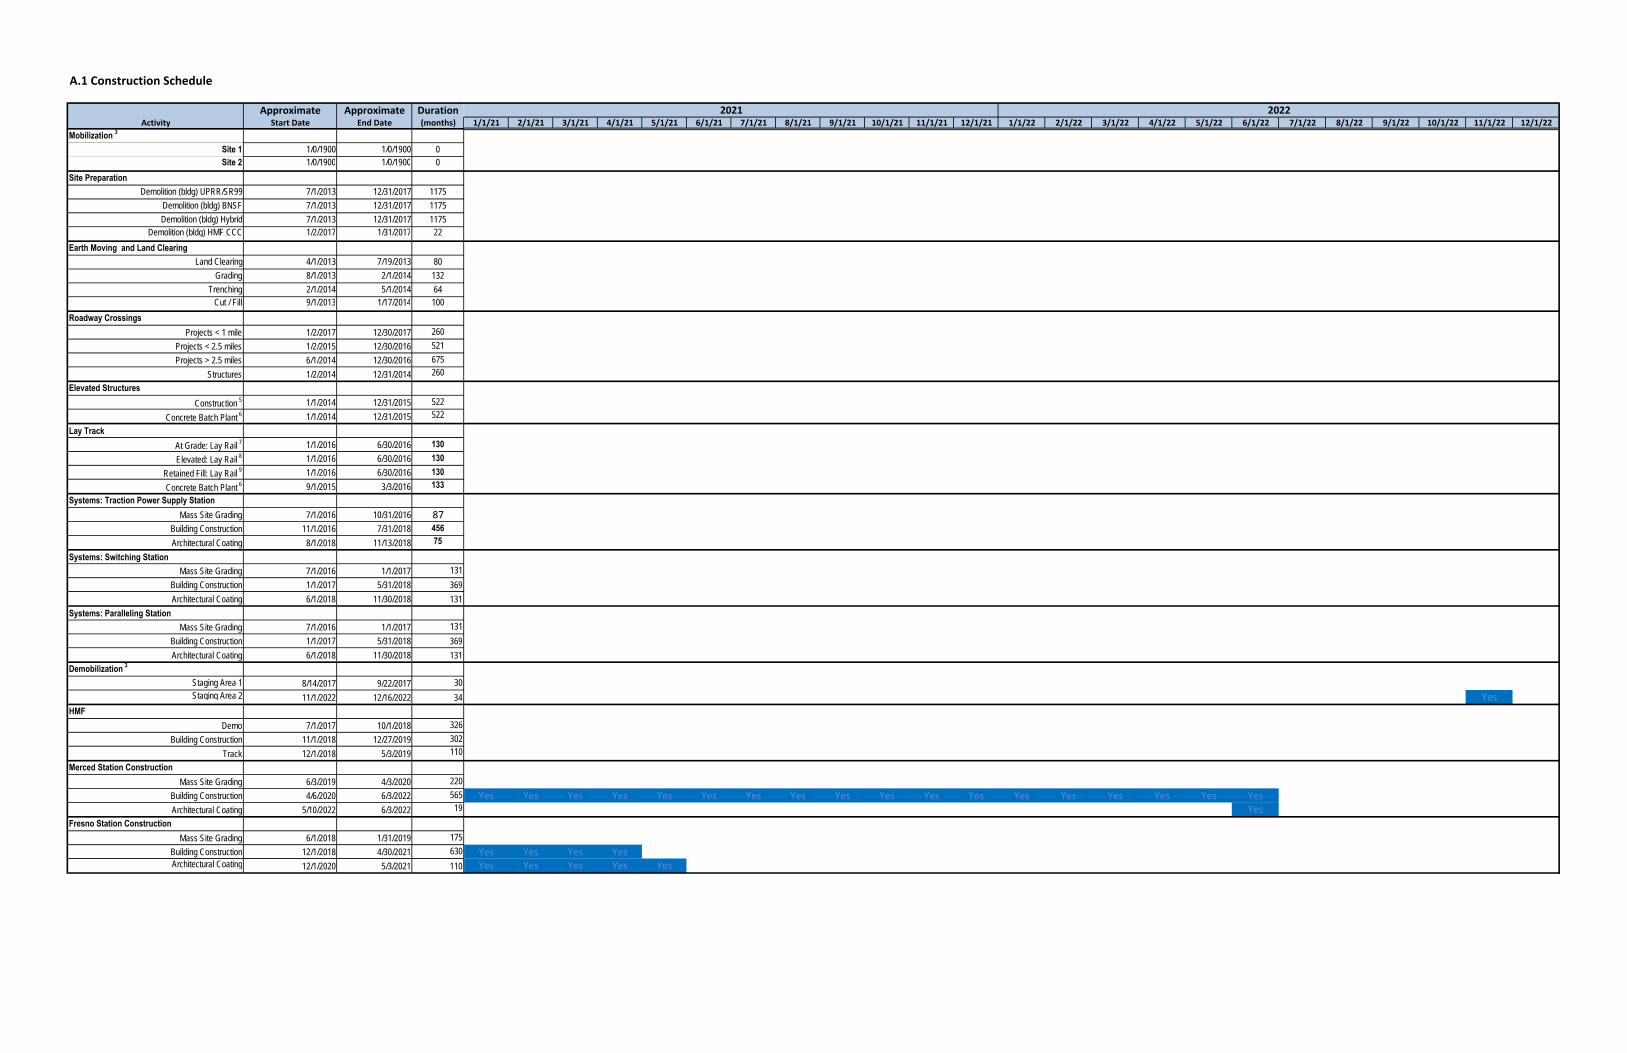
A.1 Construction Schedule
Approximate Approximate DurationActivity Start Date End Date (months)
Mobilization 3 Site 1 1/0/1900 1/0/1900 0Site 2 1/0/1900 1/0/1900 0
Site Preparation Demolition (bldg) UPRR/SR99 7/1/2013 12/31/2017 1175
Demolition (bldg) BNSF 7/1/2013 12/31/2017 1175Demolition (bldg) Hybrid 7/1/2013 12/31/2017 1175
Demolition (bldg) HMF CCC 1/2/2017 1/31/2017 22Earth Moving and Land Clearing
Land Clearing 4/1/2013 7/19/2013 80Grading 8/1/2013 2/1/2014 132
Trenching 2/1/2014 5/1/2014 64Cut / Fill 9/1/2013 1/17/2014 100
Roadway Crossings Projects < 1 mile 1/2/2017 12/30/2017 260
Projects < 2.5 miles 1/2/2015 12/30/2016 521Projects > 2.5 miles 6/1/2014 12/30/2016 675
Structures 1/2/2014 12/31/2014 260Elevated Structures
Construction 5 1/1/2014 12/31/2015 522Concrete Batch Plant 6 1/1/2014 12/31/2015 522
Lay TrackAt Grade: Lay Rail 7 1/1/2016 6/30/2016 130Elevated: Lay Rail 8 1/1/2016 6/30/2016 130
Retained Fill: Lay Rail 9 1/1/2016 6/30/2016 130Concrete Batch Plant 6 9/1/2015 3/3/2016 133
Systems: Traction Power Supply Station Mass Site Grading 7/1/2016 10/31/2016 87
Building Construction 11/1/2016 7/31/2018 456Architectural Coating 8/1/2018 11/13/2018 75
Systems: Switching Station Mass Site Grading 7/1/2016 1/1/2017 131
Building Construction 1/1/2017 5/31/2018 369Architectural Coating 6/1/2018 11/30/2018 131
Systems: Paralleling Station Mass Site Grading 7/1/2016 1/1/2017 131
Building Construction 1/1/2017 5/31/2018 369Architectural Coating 6/1/2018 11/30/2018 131
Demobilization 3 Staging Area 1 8/14/2017 9/22/2017 30Staging Area 2 11/1/2022 12/16/2022 34
HMFDemo 7/1/2017 10/1/2018 326
Building Construction 11/1/2018 12/27/2019 302Track 12/1/2018 5/3/2019 110
Merced Station ConstructionMass Site Grading 6/3/2019 4/3/2020 220
Building Construction 4/6/2020 6/3/2022 565Architectural Coating 5/10/2022 6/3/2022 19
Fresno Station Construction Mass Site Grading 6/1/2018 1/31/2019 175
Building Construction 12/1/2018 4/30/2021 630Architectural Coating 12/1/2020 5/3/2021 110
1/1/19 2/1/19 3/1/19 4/1/19 5/1/19 6/1/19 7/1/19 8/1/19 9/1/19 10/1/19 11/1/19 12/1/19 1/1/20 2/1/20 3/1/20 4/1/20 5/1/20 6/1/20 7/1/20 8/1/20 9/1/20 10/1/20 11/1/20 12/1/20
No No No No No No No No No No No No No No No No No No No No No No No No
No No No No No No No No No No No No No No No No No No No No No No No NoNo No No No No No No No No No No No No No No No No No No No No No No NoNo No No No No No No No No No No No No No No No No No No No No No No NoNo No No No No No No No No No No No No No No No No No No No No No No NoNo No No No No No No No No No No No No No No No No No No No No No No NoNo No No No No No No No No No No No No No No No No No No No No No No NoNo No No No No No No No No No No No No No No No No No No No No No No NoNo No No No No No No No No No No No No No No No No No No No No No No NoNo No No No No No No No No No No No No No No No No No No No No No No NoNo No No No No No No No No No No No No No No No No No No No No No No NoNo No No No No No No No No No No No No No No No No No No No No No No NoNo No No No No No No No No No No No No No No No No No No No No No No NoNo No No No No No No No No No No No No No No No No No No No No No No NoNo No No No No No No No No No No No No No No No No No No No No No No NoNo No No No No No No No No No No No No No No No No No No No No No No NoNo No No No No No No No No No No No No No No No No No No No No No No NoNo No No No No No No No No No No No No No No No No No No No No No No NoNo No No No No No No No No No No No No No No No No No No No No No No No
No No No No No No No No No No No No No No No No No No No No No No No NoNo No No No No No No No No No No No No No No No No No No No No No No NoNo No No No No No No No No No No No No No No No No No No No No No No NoNo No No No No No No No No No No No No No No No No No No No No No No NoNo No No No No No No No No No No No No No No No No No No No No No No NoNo No No No No No No No No No No No No No No No No No No No No No No NoNo No No No No No No No No No No No No No No No No No No No No No No NoNo No No No No No No No No No No No No No No No No No No No No No No NoNo No No No No No No No No No No No No No No No No No No No No No No NoNo No No No No No No No No No No No No No No No No No No No No No No NoNo No No No No No No No No No No No No No No No No No No No No No No NoNo No No No No No No No No No No No No No No No No No No No No No No NoNo No No No No No No No No No No No No No No No No No No No No No No NoNo No No No No No No No No No No No No No No No No No No No No No No NoNo No No No No No No No No No No No No No No No No No No No No No No NoNo No No No No No No No No No No No No No No No No No No No No No No NoNo No No No No No No No No No No No No No No No No No No No No No No NoNo No No No No No No No No No No No No No No No No No No No No No No NoNo No No No No No No No No No No No No No No No No No No No No No No NoNo No No No No No No No No No No No No No No No No No No No No No No NoNo No No No No No No No No No No No No No No No No No No No No No No NoYes Yes Yes Yes Yes Yes Yes Yes Yes Yes Yes Yes No No No No No No No No No No No NoYes Yes Yes Yes Yes No No No No No No No No No No No No No No No No No No NoNo No No No No No No No No No No No No No No No No No No No No No No NoNo No No No No No Yes Yes Yes Yes Yes Yes Yes Yes Yes Yes No No No No No No No NoNo No No No No No No No No No No No No No No No Yes Yes Yes Yes Yes Yes Yes YesNo No No No No No No No No No No No No No No No No No No No No No No NoNo No No No No No No No No No No No No No No No No No No No No No No NoYes No No No No No No No No No No No No No No No No No No No No No No NoYes Yes Yes Yes Yes Yes Yes Yes Yes Yes Yes Yes Yes Yes Yes Yes Yes Yes Yes Yes Yes Yes Yes YesNo No No No No No No No No No No No No No No No No No No No No No No Yes
2019 2020
A.1 Construction Schedule
Approximate Approximate DurationActivity Start Date End Date (months)
Mobilization 3 Site 1 1/0/1900 1/0/1900 0Site 2 1/0/1900 1/0/1900 0
Site Preparation Demolition (bldg) UPRR/SR99 7/1/2013 12/31/2017 1175
Demolition (bldg) BNSF 7/1/2013 12/31/2017 1175Demolition (bldg) Hybrid 7/1/2013 12/31/2017 1175
Demolition (bldg) HMF CCC 1/2/2017 1/31/2017 22Earth Moving and Land Clearing
Land Clearing 4/1/2013 7/19/2013 80Grading 8/1/2013 2/1/2014 132
Trenching 2/1/2014 5/1/2014 64Cut / Fill 9/1/2013 1/17/2014 100
Roadway Crossings Projects < 1 mile 1/2/2017 12/30/2017 260
Projects < 2.5 miles 1/2/2015 12/30/2016 521Projects > 2.5 miles 6/1/2014 12/30/2016 675
Structures 1/2/2014 12/31/2014 260Elevated Structures
Construction 5 1/1/2014 12/31/2015 522Concrete Batch Plant 6 1/1/2014 12/31/2015 522
Lay TrackAt Grade: Lay Rail 7 1/1/2016 6/30/2016 130Elevated: Lay Rail 8 1/1/2016 6/30/2016 130
Retained Fill: Lay Rail 9 1/1/2016 6/30/2016 130Concrete Batch Plant 6 9/1/2015 3/3/2016 133
Systems: Traction Power Supply Station Mass Site Grading 7/1/2016 10/31/2016 87
Building Construction 11/1/2016 7/31/2018 456Architectural Coating 8/1/2018 11/13/2018 75
Systems: Switching Station Mass Site Grading 7/1/2016 1/1/2017 131
Building Construction 1/1/2017 5/31/2018 369Architectural Coating 6/1/2018 11/30/2018 131
Systems: Paralleling Station Mass Site Grading 7/1/2016 1/1/2017 131
Building Construction 1/1/2017 5/31/2018 369Architectural Coating 6/1/2018 11/30/2018 131
Demobilization 3 Staging Area 1 8/14/2017 9/22/2017 30Staging Area 2 11/1/2022 12/16/2022 34
HMFDemo 7/1/2017 10/1/2018 326
Building Construction 11/1/2018 12/27/2019 302Track 12/1/2018 5/3/2019 110
Merced Station ConstructionMass Site Grading 6/3/2019 4/3/2020 220
Building Construction 4/6/2020 6/3/2022 565Architectural Coating 5/10/2022 6/3/2022 19
Fresno Station Construction Mass Site Grading 6/1/2018 1/31/2019 175
Building Construction 12/1/2018 4/30/2021 630Architectural Coating 12/1/2020 5/3/2021 110
1/1/21 2/1/21 3/1/21 4/1/21 5/1/21 6/1/21 7/1/21 8/1/21 9/1/21 10/1/21 11/1/21 12/1/21 1/1/22 2/1/22 3/1/22 4/1/22 5/1/22 6/1/22 7/1/22 8/1/22 9/1/22 10/1/22 11/1/22 12/1/22
No No No No No No No No No No No No No No No No No No No No No No No No
No No No No No No No No No No No No No No No No No No No No No No No NoNo No No No No No No No No No No No No No No No No No No No No No No NoNo No No No No No No No No No No No No No No No No No No No No No No NoNo No No No No No No No No No No No No No No No No No No No No No No NoNo No No No No No No No No No No No No No No No No No No No No No No NoNo No No No No No No No No No No No No No No No No No No No No No No NoNo No No No No No No No No No No No No No No No No No No No No No NoNo No No No No No No No No No No No No No No No No No No No No No No NoNo No No No No No No No No No No No No No No No No No No No No No No NoNo No No No No No No No No No No No No No No No No No No No No No No NoNo No No No No No No No No No No No No No No No No No No No No No NoNo No No No No No No No No No No No No No No No No No No No No No NoNo No No No No No No No No No No No No No No No No No No No No No NoNo No No No No No No No No No No No No No No No No No No No No No NoNo No No No No No No No No No No No No No No No No No No No No No NoNo No No No No No No No No No No No No No No No No No No No No No NoNo No No No No No No No No No No No No No No No No No No No No No NoNo No No No No No No No No No No No No No No No No No No No No No No
No No No No No No No No No No No No No No No No No No No No No No NoNo No No No No No No No No No No No No No No No No No No No No No NoNo No No No No No No No No No No No No No No No No No No No No No NoNo No No No No No No No No No No No No No No No No No No No No No NoNo No No No No No No No No No No No No No No No No No No No No No NoNo No No No No No No No No No No No No No No No No No No No No No NoNo No No No No No No No No No No No No No No No No No No No No No NoNo No No No No No No No No No No No No No No No No No No No No No NoNo No No No No No No No No No No No No No No No No No No No No No NoNo No No No No No No No No No No No No No No No No No No No No No NoNo No No No No No No No No No No No No No No No No No No No No No NoNo No No No No No No No No No No No No No No No No No No No No No NoNo No No No No No No No No No No No No No No No No No No No No No NoNo No No No No No No No No No No No No No No No No No No No No No NoNo No No No No No No No No No No No No No No No No No No No No No NoNo No No No No No No No No No No No No No No No No No No No No No NoNo No No No No No No No No No No No No No No No No No No No No No NoNo No No No No No No No No No No No No No No No No No No No No No NoNo No No No No No No No No No No No No No No No No No No No No No YesNo No No No No No No No No No No No No No No No No No No No No No NoNo No No No No No No No No No No No No No No No No No No No No No NoNo No No No No No No No No No No No No No No No No No No No No No NoNo No No No No No No No No No No No No No No No No No No No No No NoNo No No No No No No No No No No No No No No No No No No No No No NoNo No No No No No No No No No No No No No No No No No No No No No NoYes Yes Yes Yes Yes Yes Yes Yes Yes Yes Yes Yes Yes Yes Yes Yes Yes Yes No No No No NoNo No No No No No No No No No No No No No No No No Yes No No No No NoNo No No No No No No No No No No No No No No No No No No No No No NoNo No No No No No No No No No No No No No No No No No No No No No NoYes Yes Yes Yes No No No No No No No No No No No No No No No No No No NoYes Yes Yes Yes Yes No No No No No No No No No No No No No No No No No No
2021 2022

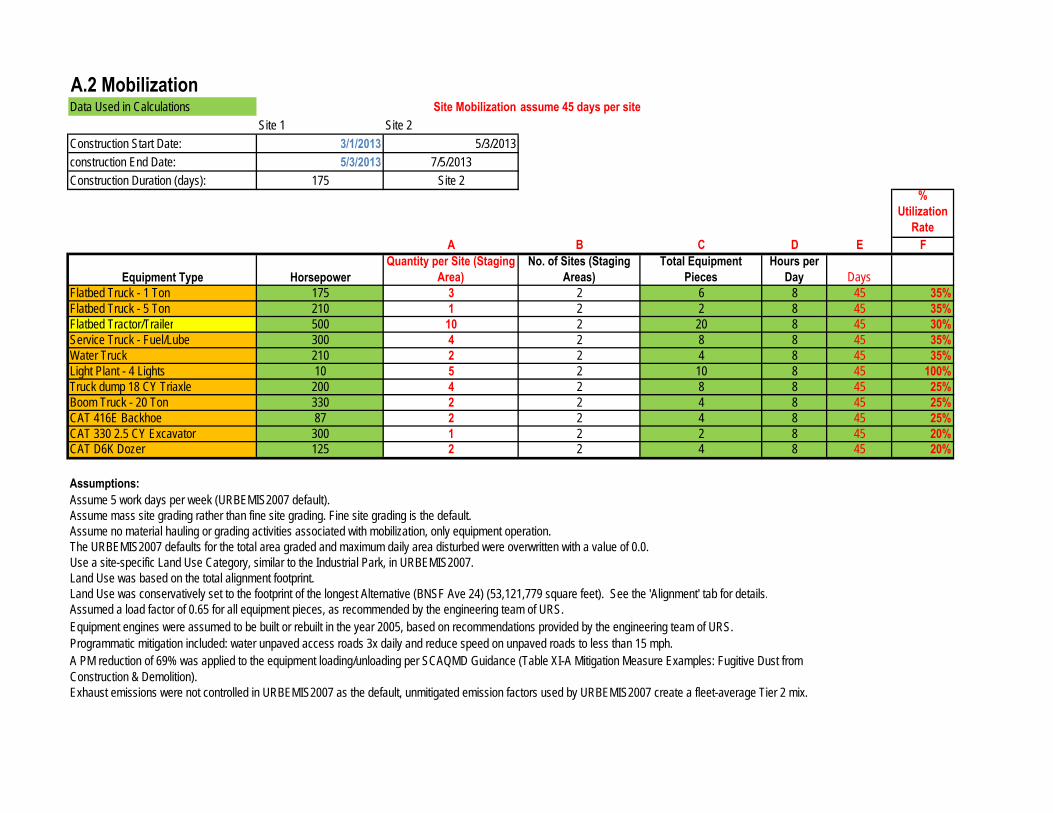
A.2 MobilizationData Used in Calculations Site Mobilization assume 45 days per site
Site 1 Site 2Construction Start Date: 3/1/2013 5/3/2013construction End Date: 5/3/2013 7/5/2013Construction Duration (days): 175 Site 2
% Utilization
RateA B C D E F
Equipment Type HorsepowerQuantity per Site (Staging
Area)No. of Sites (Staging
Areas)Total Equipment
PiecesHours per
Day DaysFlatbed Truck - 1 Ton 175 3 2 6 8 45 35%Flatbed Truck - 5 Ton 210 1 2 2 8 45 35%Flatbed Tractor/Trailer 500 10 2 20 8 45 30%Service Truck - Fuel/Lube 300 4 2 8 8 45 35%Water Truck 210 2 2 4 8 45 35%Light Plant - 4 Lights 10 5 2 10 8 45 100%Truck dump 18 CY Triaxle 200 4 2 8 8 45 25%Boom Truck - 20 Ton 330 2 2 4 8 45 25%CAT 416E Backhoe 87 2 2 4 8 45 25%CAT 330 2.5 CY Excavator 300 1 2 2 8 45 20%CAT D6K Dozer 125 2 2 4 8 45 20%
Assumptions: Assume 5 work days per week (URBEMIS2007 default).Assume mass site grading rather than fine site grading. Fine site grading is the default.Assume no material hauling or grading activities associated with mobilization, only equipment operation.The URBEMIS2007 defaults for the total area graded and maximum daily area disturbed were overwritten with a value of 0.0.Use a site-specific Land Use Category, similar to the Industrial Park, in URBEMIS2007.Land Use was based on the total alignment footprint.Land Use was conservatively set to the footprint of the longest Alternative (BNSF Ave 24) (53,121,779 square feet). See the 'Alignment' tab for details.Assumed a load factor of 0.65 for all equipment pieces, as recommended by the engineering team of URS.Equipment engines were assumed to be built or rebuilt in the year 2005, based on recommendations provided by the engineering team of URS.
Exhaust emissions were not controlled in URBEMIS2007 as the default, unmitigated emission factors used by URBEMIS2007 create a fleet-average Tier 2 mix.
Programmatic mitigation included: water unpaved access roads 3x daily and reduce speed on unpaved roads to less than 15 mph.A PM reduction of 69% was applied to the equipment loading/unloading per SCAQMD Guidance (Table XI-A Mitigation Measure Examples: Fugitive Dust from Construction & Demolition).

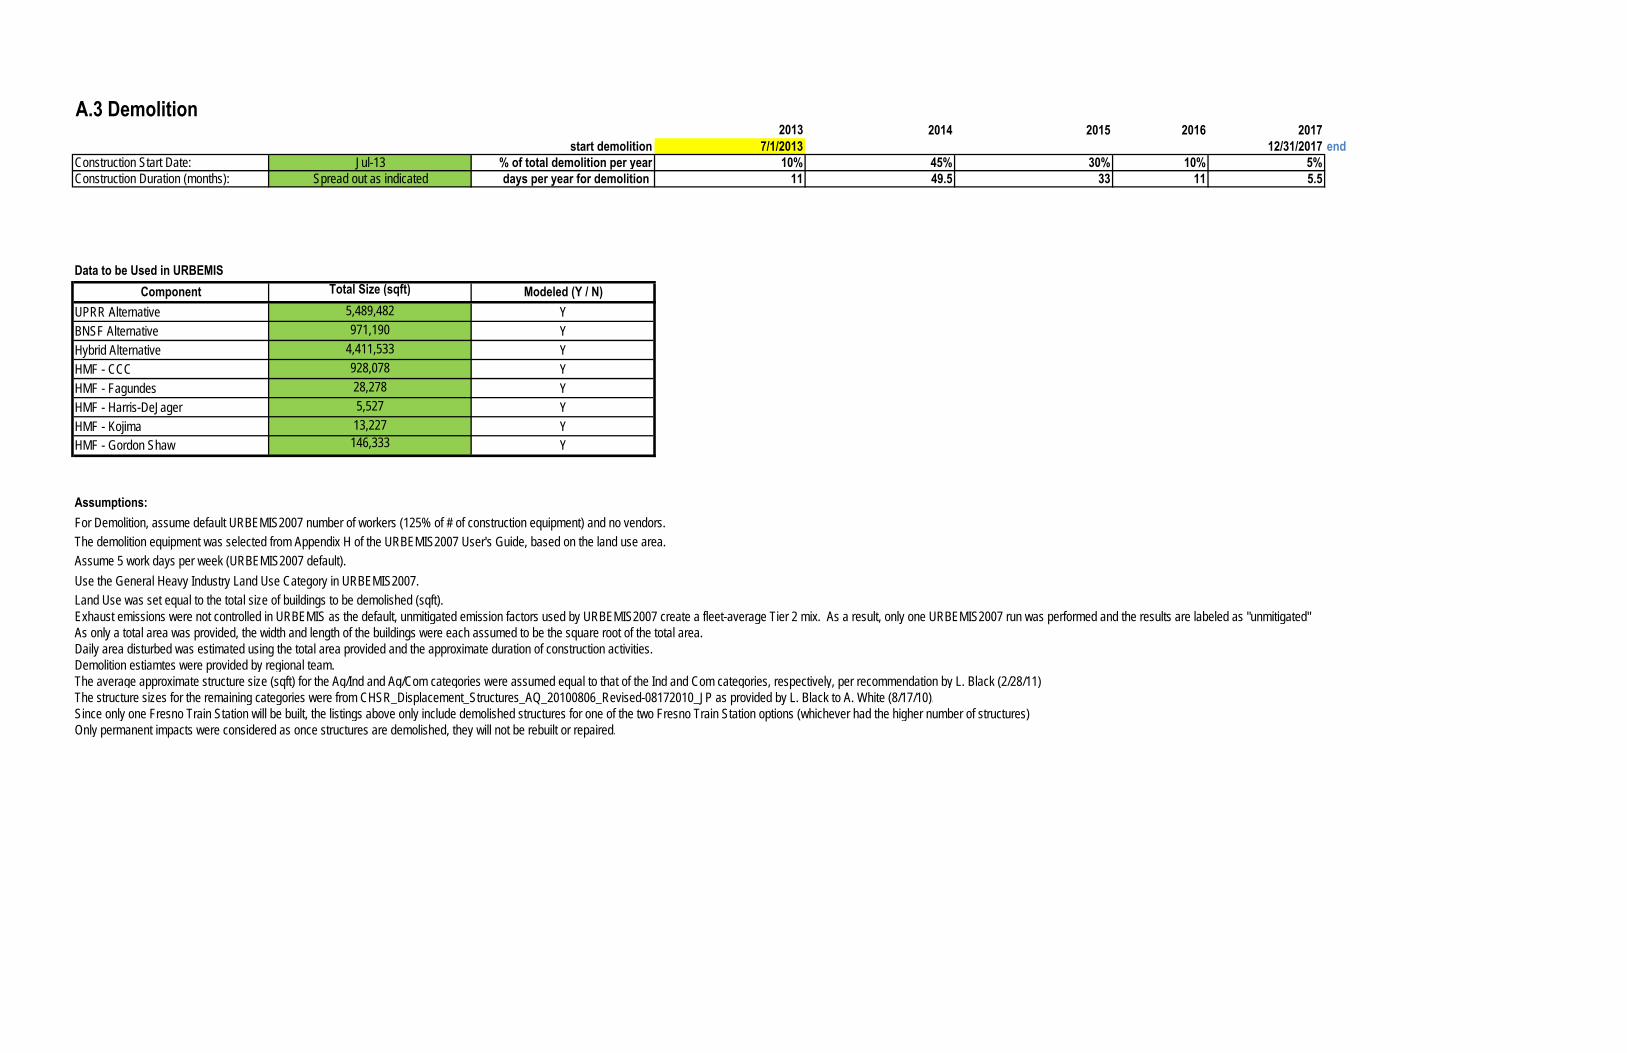
A.3 Demolition 2013 2014 2015 2016 2017
start demolition 7/1/2013 12/31/2017 endConstruction Start Date: Jul-13 % of total demolition per year 10% 45% 30% 10% 5%Construction Duration (months): Spread out as indicated days per year for demolition 11 49.5 33 11 5.5
Component Total Size (sqft) Modeled (Y / N)UPRR Alternative 5,489,482 YBNSF Alternative 971,190 YHybrid Alternative 4,411,533 YHMF - CCC 928,078 YHMF - Fagundes 28,278 YHMF - Harris-DeJager 5,527 YHMF - Kojima 13,227 YHMF - Gordon Shaw 146,333 Y
Assumptions:
Exhaust emissions were not controlled in URBEMIS as the default, unmitigated emission factors used by URBEMIS2007 create a fleet-average Tier 2 mix. As a result, only one URBEMIS2007 run was performed and the results are labeled as "unmitigated"
Demolition estiamtes were provided by regional team.The average approximate structure size (sqft) for the Ag/Ind and Ag/Com categories were assumed equal to that of the Ind and Com categories, respectively, per recommendation by L. Black (2/28/11)The structure sizes for the remaining categories were from CHSR_Displacement_Structures_AQ_20100806_Revised-08172010_JP as provided by L. Black to A. White (8/17/10).Since only one Fresno Train Station will be built, the listings above only include demolished structures for one of the two Fresno Train Station options (whichever had the higher number of structures)Only permanent impacts were considered as once structures are demolished, they will not be rebuilt or repaired.
Daily area disturbed was estimated using the total area provided and the approximate duration of construction activities.
Use the General Heavy Industry Land Use Category in URBEMIS2007.Land Use was set equal to the total size of buildings to be demolished (sqft).
Data to be Used in URBEMIS
For Demolition, assume default URBEMIS2007 number of workers (125% of # of construction equipment) and no vendors.
Assume 5 work days per week (URBEMIS2007 default).The demolition equipment was selected from Appendix H of the URBEMIS2007 User's Guide, based on the land use area.
As only a total area was provided, the width and length of the buildings were each assumed to be the square root of the total area.
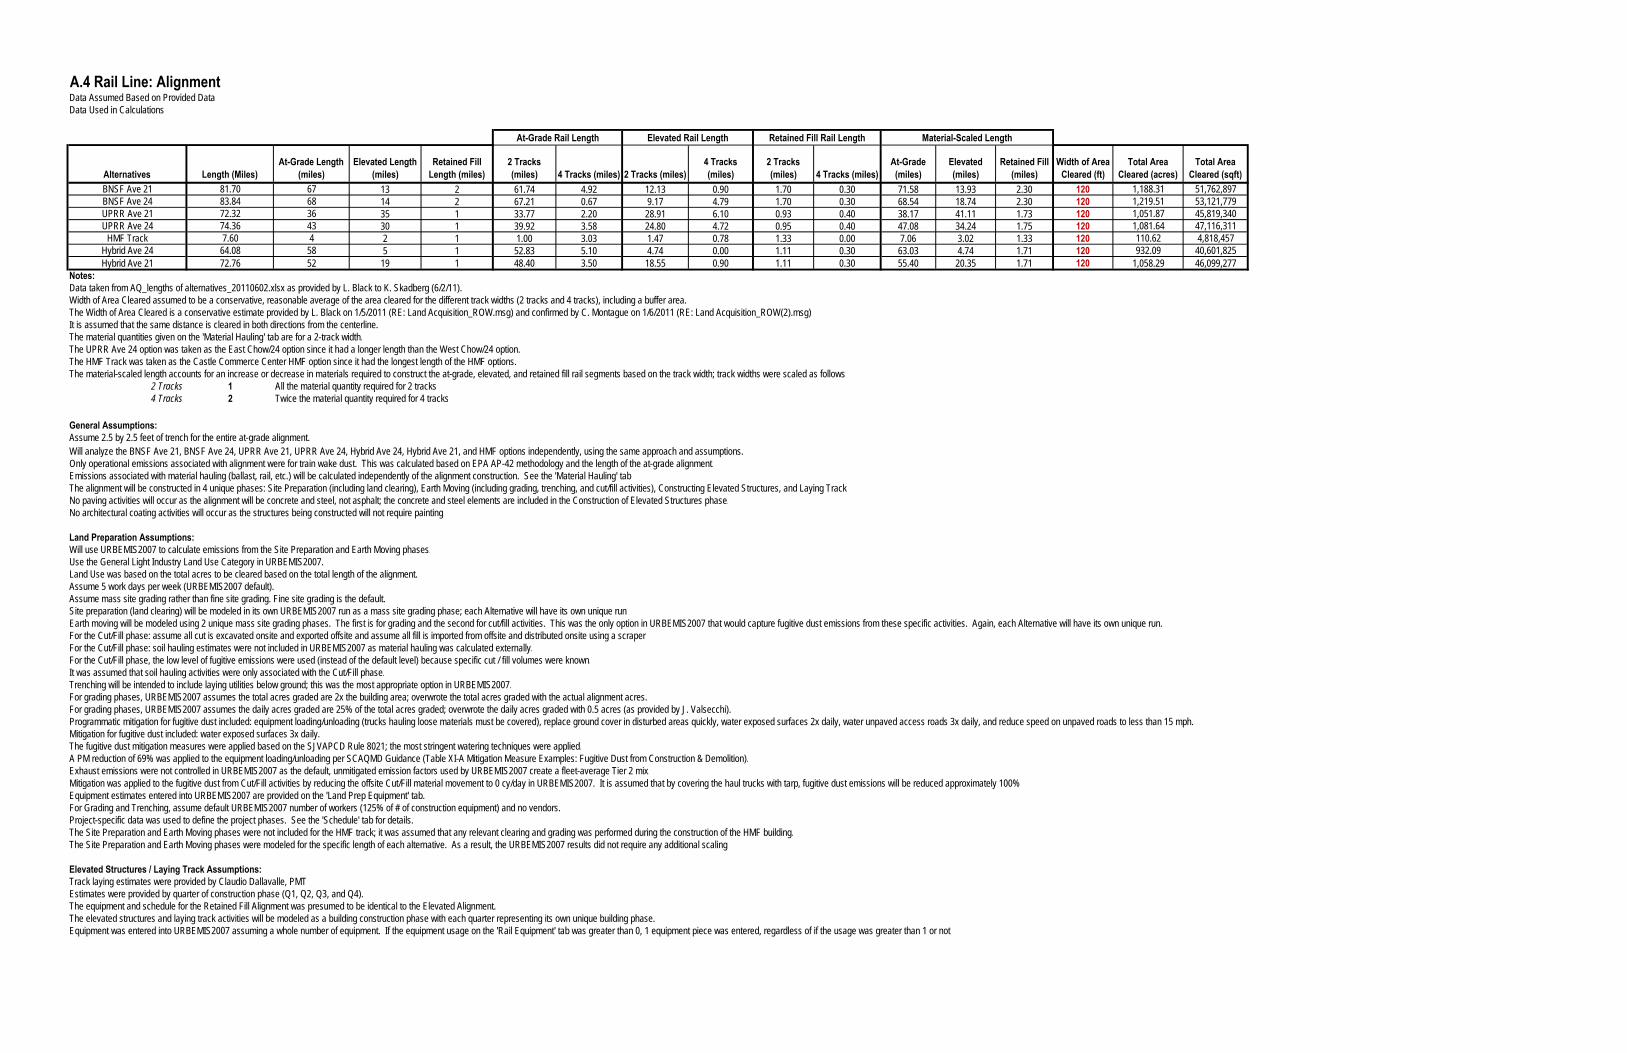
A.4 Rail Line: AlignmentData Assumed Based on Provided DataData Used in Calculations
Alternatives Length (Miles)At-Grade Length
(miles)Elevated Length
(miles)Retained Fill
Length (miles)2 Tracks (miles) 4 Tracks (miles) 2 Tracks (miles)
4 Tracks (miles)
2 Tracks (miles) 4 Tracks (miles)
At-Grade (miles)
Elevated (miles)
Retained Fill (miles)
Width of Area Cleared (ft)
Total Area Cleared (acres)
Total Area Cleared (sqft)
BNSF Ave 21 81.70 67 13 2 61.74 4.92 12.13 0.90 1.70 0.30 71.58 13.93 2.30 120 1,188.31 51,762,897BNSF Ave 24 83.84 68 14 2 67.21 0.67 9.17 4.79 1.70 0.30 68.54 18.74 2.30 120 1,219.51 53,121,779UPRR Ave 21 72.32 36 35 1 33.77 2.20 28.91 6.10 0.93 0.40 38.17 41.11 1.73 120 1,051.87 45,819,340UPRR Ave 24 74.36 43 30 1 39.92 3.58 24.80 4.72 0.95 0.40 47.08 34.24 1.75 120 1,081.64 47,116,311
HMF Track 7.60 4 2 1 1.00 3.03 1.47 0.78 1.33 0.00 7.06 3.02 1.33 120 110.62 4,818,457Hybrid Ave 24 64.08 58 5 1 52.83 5.10 4.74 0.00 1.11 0.30 63.03 4.74 1.71 120 932.09 40,601,825Hybrid Ave 21 72.76 52 19 1 48.40 3.50 18.55 0.90 1.11 0.30 55.40 20.35 1.71 120 1,058.29 46,099,277
Notes:Data taken from AQ_lengths of alternatives_20110602.xlsx as provided by L. Black to K. Skadberg (6/2/11).Width of Area Cleared assumed to be a conservative, reasonable average of the area cleared for the different track widths (2 tracks and 4 tracks), including a buffer area. The Width of Area Cleared is a conservative estimate provided by L. Black on 1/5/2011 (RE: Land Acquisition_ROW.msg) and confirmed by C. Montague on 1/6/2011 (RE: Land Acquisition_ROW(2).msg).It is assumed that the same distance is cleared in both directions from the centerline.The material quantities given on the 'Material Hauling' tab are for a 2-track width.The UPRR Ave 24 option was taken as the East Chow/24 option since it had a longer length than the West Chow/24 option.The HMF Track was taken as the Castle Commerce Center HMF option since it had the longest length of the HMF options.The material-scaled length accounts for an increase or decrease in materials required to construct the at-grade, elevated, and retained fill rail segments based on the track width; track widths were scaled as follows:
2 Tracks 1 All the material quantity required for 2 tracks4 Tracks 2 Twice the material quantity required for 4 tracks
General Assumptions:Assume 2.5 by 2.5 feet of trench for the entire at-grade alignment.Will analyze the BNSF Ave 21, BNSF Ave 24, UPRR Ave 21, UPRR Ave 24, Hybrid Ave 24, Hybrid Ave 21, and HMF options independently, using the same approach and assumptions.Only operational emissions associated with alignment were for train wake dust. This was calculated based on EPA AP-42 methodology and the length of the at-grade alignment.Emissions associated with material hauling (ballast, rail, etc.) will be calculated independently of the alignment construction. See the 'Material Hauling' tabThe alignment will be constructed in 4 unique phases: Site Preparation (including land clearing), Earth Moving (including grading, trenching, and cut/fill activities), Constructing Elevated Structures, and Laying TrackNo paving activities will occur as the alignment will be concrete and steel, not asphalt; the concrete and steel elements are included in the Construction of Elevated Structures phase.No architectural coating activities will occur as the structures being constructed will not require painting.
Land Preparation Assumptions:Will use URBEMIS2007 to calculate emissions from the Site Preparation and Earth Moving phases.Use the General Light Industry Land Use Category in URBEMIS2007.Land Use was based on the total acres to be cleared based on the total length of the alignment.Assume 5 work days per week (URBEMIS2007 default).Assume mass site grading rather than fine site grading. Fine site grading is the default.Site preparation (land clearing) will be modeled in its own URBEMIS2007 run as a mass site grading phase; each Alternative will have its own unique run.
For the Cut/Fill phase: assume all cut is excavated onsite and exported offsite and assume all fill is imported from offsite and distributed onsite using a scraper.For the Cut/Fill phase: soil hauling estimates were not included in URBEMIS2007 as material hauling was calculated externally.For the Cut/Fill phase, the low level of fugitive emissions were used (instead of the default level) because specific cut / fill volumes were known.It was assumed that soil hauling activities were only associated with the Cut/Fill phase.Trenching will be intended to include laying utilities below ground; this was the most appropriate option in URBEMIS2007.For grading phases, URBEMIS2007 assumes the total acres graded are 2x the building area; overwrote the total acres graded with the actual alignment acres.For grading phases, URBEMIS2007 assumes the daily acres graded are 25% of the total acres graded; overwrote the daily acres graded with 0.5 acres (as provided by J. Valsecchi).
Mitigation for fugitive dust included: water exposed surfaces 3x daily.The fugitive dust mitigation measures were applied based on the SJVAPCD Rule 8021; the most stringent watering techniques were applied.A PM reduction of 69% was applied to the equipment loading/unloading per SCAQMD Guidance (Table XI-A Mitigation Measure Examples: Fugitive Dust from Construction & Demolition).Exhaust emissions were not controlled in URBEMIS2007 as the default, unmitigated emission factors used by URBEMIS2007 create a fleet-average Tier 2 mix.Mitigation was applied to the fugitive dust from Cut/Fill activities by reducing the offsite Cut/Fill material movement to 0 cy/day in URBEMIS2007. It is assumed that by covering the haul trucks with tarp, fugitive dust emissions will be reduced approximately 100%Equipment estimates entered into URBEMIS2007 are provided on the 'Land Prep Equipment' tab.For Grading and Trenching, assume default URBEMIS2007 number of workers (125% of # of construction equipment) and no vendors.Project-specific data was used to define the project phases. See the 'Schedule' tab for details.The Site Preparation and Earth Moving phases were not included for the HMF track; it was assumed that any relevant clearing and grading was performed during the construction of the HMF building.The Site Preparation and Earth Moving phases were modeled for the specific length of each alternative. As a result, the URBEMIS2007 results did not require any additional scaling.
Elevated Structures / Laying Track Assumptions:Track laying estimates were provided by Claudio Dallavalle, PMTEstimates were provided by quarter of construction phase (Q1, Q2, Q3, and Q4).The equipment and schedule for the Retained Fill Alignment was presumed to be identical to the Elevated Alignment.The elevated structures and laying track activities will be modeled as a building construction phase with each quarter representing its own unique building phase.Equipment was entered into URBEMIS2007 assuming a whole number of equipment. If the equipment usage on the 'Rail Equipment' tab was greater than 0, 1 equipment piece was entered, regardless of if the usage was greater than 1 or not.
At-Grade Rail Length Elevated Rail Length Retained Fill Rail Length Material-Scaled Length
Programmatic mitigation for fugitive dust included: equipment loading/unloading (trucks hauling loose materials must be covered), replace ground cover in disturbed areas quickly, water exposed surfaces 2x daily, water unpaved access roads 3x daily, and reduce speed on unpaved roads to less than 15 mph.
Earth moving will be modeled using 2 unique mass site grading phases. The first is for grading and the second for cut/fill activities. This was the only option in URBEMIS2007 that would capture fugitive dust emissions from these specific activities. Again, each Alternative will have its own unique run.
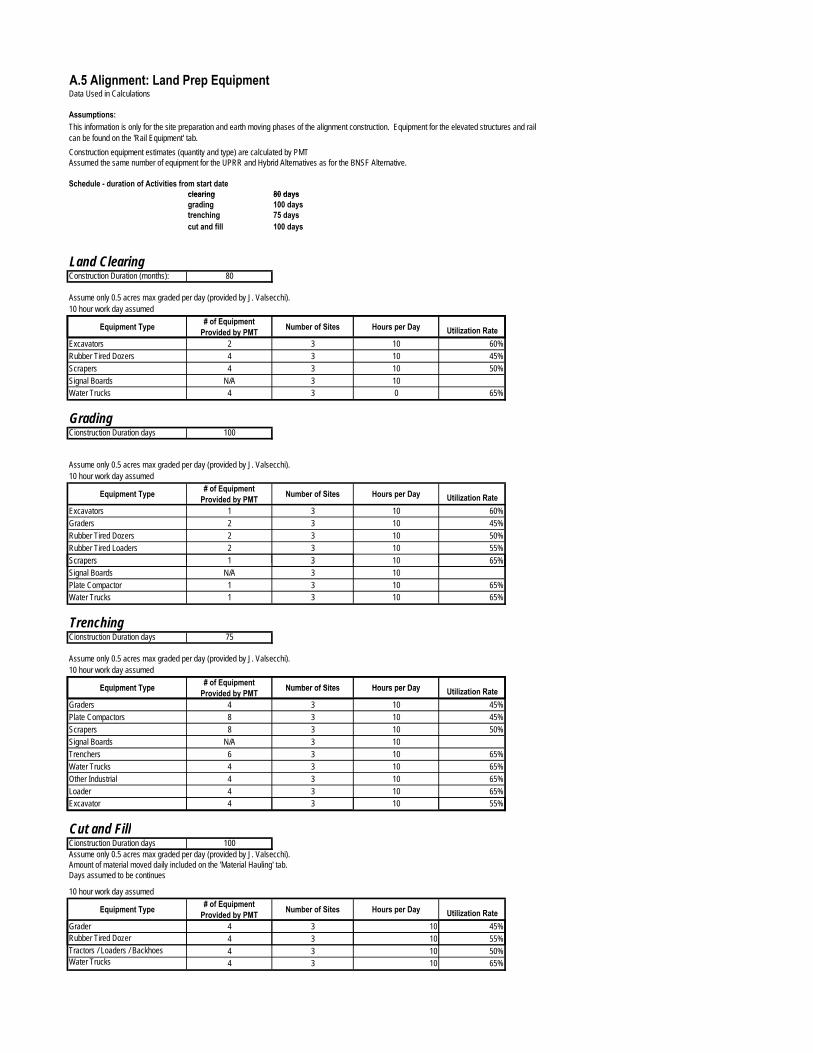
A.5 Alignment: Land Prep EquipmentData Used in Calculations
Assumptions:
Assumed the same number of equipment for the UPRR and Hybrid Alternatives as for the BNSF Alternative.
Schedule - duration of Activities from start dateclearing 80 days
This information is only for the site preparation and earth moving phases of the alignment construction. Equipment for the elevated structures and rail can be found on the 'Rail Equipment' tab.Construction equipment estimates (quantity and type) are calculated by PMT
clearing 80 daysgrading 100 daystrenching 75 dayscut and fill 100 days
Land ClearingConstruction Duration (months): 80
Assume only 0.5 acres max graded per day (provided by J. Valsecchi).10 hour work day assumed
# f E i t Equipment Type # of Equipment Provided by PMT Number of Sites Hours per Day Utilization Rate
Excavators 2 3 10 60%Rubber Tired Dozers 4 3 10 45%Scrapers 4 3 10 50%Signal Boards N/A 3 10Water Trucks 4 3 0 65%
GradingCionstruction Duration days 100
Assume only 0.5 acres max graded per day (provided by J. Valsecchi).10 hour work day assumed
Equipment Type # of Equipment Provided by PMT Number of Sites Hours per Day Utilization Rate
Excavators 1 3 10 60%Graders 2 3 10 45%Rubber Tired Dozers 2 3 10 50%Rubber Tired Loaders 2 3 10 55%Scrapers 1 3 10 65%Scrapers 1 3 10 65%Signal Boards N/A 3 10Plate Compactor 1 3 10 65%Water Trucks 1 3 10 65%
TrenchingCionstruction Duration days 75
Assume only 0.5 acres max graded per day (provided by J. Valsecchi).10 hour work day assumed
Equipment Type # of Equipment Number of Sites Hours per DayEquipment Type q pProvided by PMT Number of Sites Hours per Day Utilization Rate
Graders 4 3 10 45%Plate Compactors 8 3 10 45%Scrapers 8 3 10 50%Signal Boards N/A 3 10Trenchers 6 3 10 65%Water Trucks 4 3 10 65%Other Industrial 4 3 10 65%Loader 4 3 10 65%Excavator 4 3 10 55%
Cut and FillCionstruction Duration days 100Assume only 0.5 acres max graded per day (provided by J. Valsecchi).Amount of material moved daily included on the 'Material Hauling' tab.Days assumed to be continues
10 hour work day assumed
Equipment Type # of Equipment Provided by PMT Number of Sites Hours per Day Utilization Rate
Grader 4 3 10 45%Rubber Tired Dozer 4 3 10 55%Tractors / Loaders / Backhoes 4 3 10 50%Water Trucks 4 3 10 65%

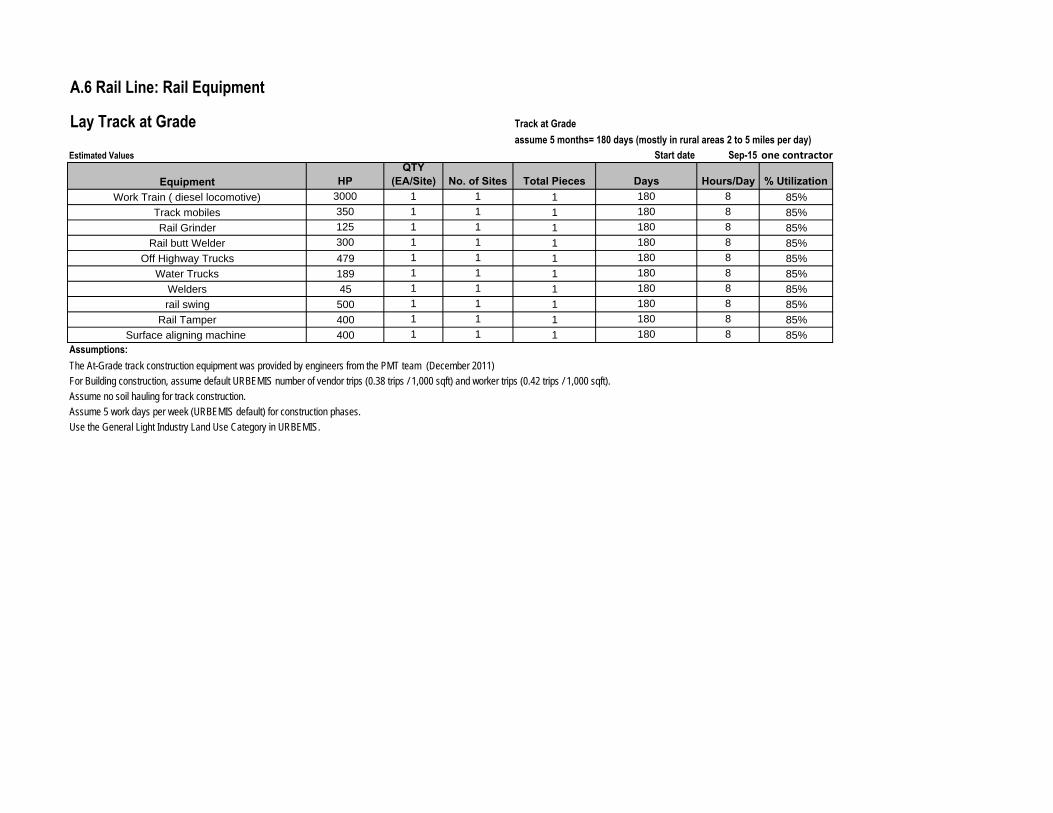
A.6 Rail Line: Rail Equipment Lay Track at Grade Track at Grade
assume 5 months= 180 days (mostly in rural areas 2 to 5 miles per day)Estimated Values Start date Sep-15 one contractor
Equipment HPQTY
(EA/Site) No. of Sites Total Pieces Days Hours/Day % UtilizationWork Train ( diesel locomotive) 3000 1 1 1 180 8 85%
Track mobiles 350 1 1 1 180 8 85%
Rail Grinder 125 1 1 1 180 8 85%
Rail butt Welder 300 1 1 1 180 8 85%
Off Highway Trucks 479 1 1 1 180 8 85%
Water Trucks 189 1 1 1 180 8 85%
Welders 45 1 1 1 180 8 85%
rail swing 500 1 1 1 180 8 85%
Rail Tamper 400 1 1 1 180 8 85%
Surface aligning machine 400 1 1 1 180 8 85%Assumptions:
For Building construction, assume default URBEMIS number of vendor trips (0.38 trips / 1,000 sqft) and worker trips (0.42 trips / 1,000 sqft).Assume no soil hauling for track construction.Assume 5 work days per week (URBEMIS default) for construction phases.Use the General Light Industry Land Use Category in URBEMIS.
The At-Grade track construction equipment was provided by engineers from the PMT team (December 2011)
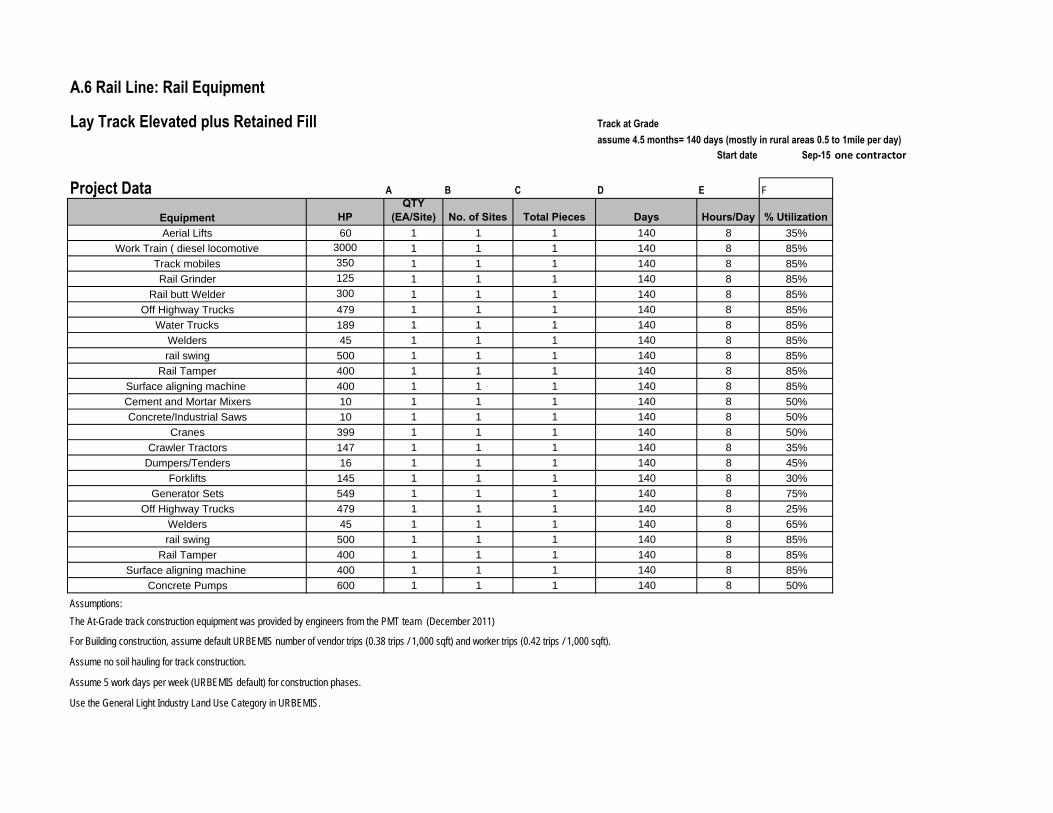
A.6 Rail Line: Rail Equipment Lay Track Elevated plus Retained Fill Track at Grade
assume 4.5 months= 140 days (mostly in rural areas 0.5 to 1mile per day)Start date Sep-15 one contractor
Project Data A B C D E F
Equipment HPQTY
(EA/Site) No. of Sites Total Pieces Days Hours/Day % UtilizationAerial Lifts 60 1 1 1 140 8 35%
Work Train ( diesel locomotive 3000 1 1 1 140 8 85%
Track mobiles 350 1 1 1 140 8 85%
Rail Grinder 125 1 1 1 140 8 85%
Rail butt Welder 300 1 1 1 140 8 85%
Off Highway Trucks 479 1 1 1 140 8 85%
Water Trucks 189 1 1 1 140 8 85%
Welders 45 1 1 1 140 8 85%
rail swing 500 1 1 1 140 8 85%
Rail Tamper 400 1 1 1 140 8 85%
Surface aligning machine 400 1 1 1 140 8 85%
Cement and Mortar Mixers 10 1 1 1 140 8 50%
Concrete/Industrial Saws 10 1 1 1 140 8 50%
Cranes 399 1 1 1 140 8 50%
Crawler Tractors 147 1 1 1 140 8 35%
Dumpers/Tenders 16 1 1 1 140 8 45%
Forklifts 145 1 1 1 140 8 30%
Generator Sets 549 1 1 1 140 8 75%
Off Highway Trucks 479 1 1 1 140 8 25%
Welders 45 1 1 1 140 8 65%
rail swing 500 1 1 1 140 8 85%
Rail Tamper 400 1 1 1 140 8 85%
Surface aligning machine 400 1 1 1 140 8 85%
Concrete Pumps 600 1 1 1 140 8 50%
Assumptions:
For Building construction, assume default URBEMIS number of vendor trips (0.38 trips / 1,000 sqft) and worker trips (0.42 trips / 1,000 sqft).
Assume no soil hauling for track construction.
Assume 5 work days per week (URBEMIS default) for construction phases.
Use the General Light Industry Land Use Category in URBEMIS.
The At-Grade track construction equipment was provided by engineers from the PMT team (December 2011)
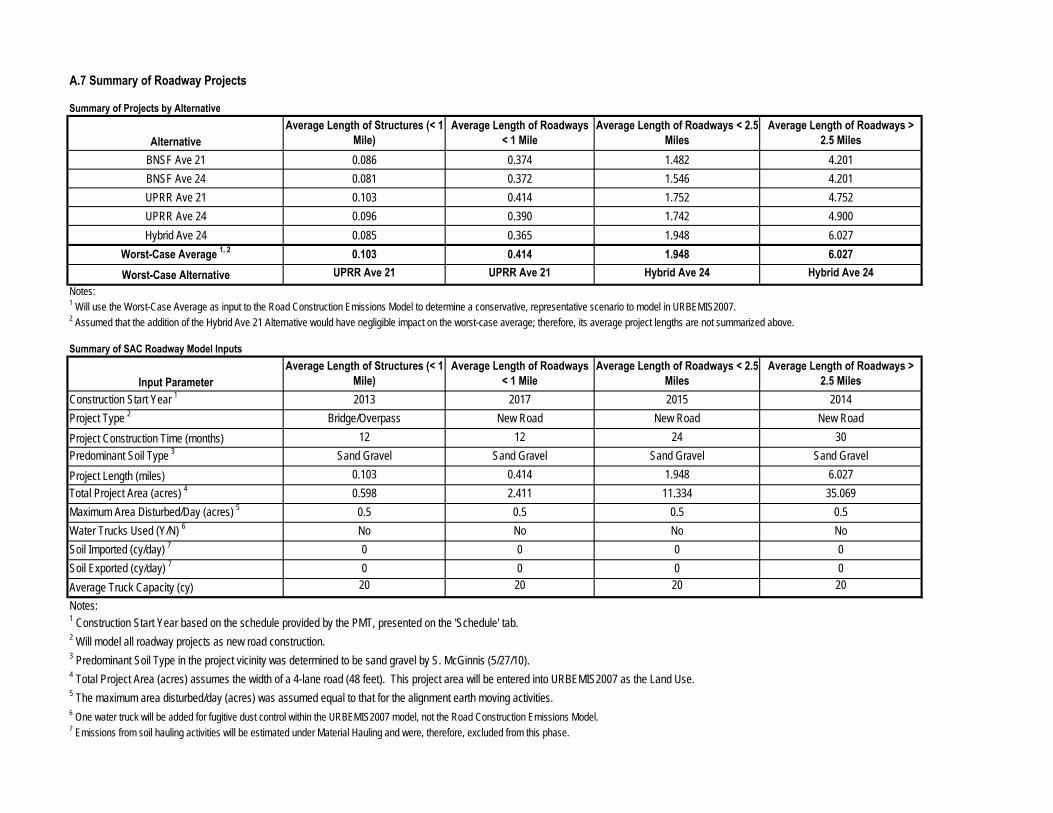
A.7 Summary of Roadway Projects
Summary of Projects by Alternative
AlternativeAverage Length of Structures (< 1
Mile)Average Length of Roadways
< 1 MileAverage Length of Roadways < 2.5
MilesAverage Length of Roadways >
2.5 MilesBNSF Ave 21 0.086 0.374 1.482 4.201BNSF Ave 24 0.081 0.372 1.546 4.201UPRR Ave 21 0.103 0.414 1.752 4.752UPRR Ave 24 0.096 0.390 1.742 4.900Hybrid Ave 24 0.085 0.365 1.948 6.027
Worst-Case Average 1, 2 0.103 0.414 1.948 6.027Worst-Case Alternative UPRR Ave 21 UPRR Ave 21 Hybrid Ave 24 Hybrid Ave 24
Notes:1 Will use the Worst-Case Average as input to the Road Construction Emissions Model to determine a conservative, representative scenario to model in URBEMIS2007.2 Assumed that the addition of the Hybrid Ave 21 Alternative would have negligible impact on the worst-case average; therefore, its average project lengths are not summarized above.
Summary of SAC Roadway Model Inputs
Input ParameterAverage Length of Structures (< 1
Mile)Average Length of Roadways
< 1 MileAverage Length of Roadways < 2.5
MilesAverage Length of Roadways >
2.5 MilesConstruction Start Year 1 2013 2017 2015 2014Project Type 2 Bridge/Overpass New Road New Road New RoadProject Construction Time (months) 12 12 24 30Predominant Soil Type 3 Sand Gravel Sand Gravel Sand Gravel Sand GravelProject Length (miles) 0.103 0.414 1.948 6.027Total Project Area (acres) 4 0.598 2.411 11.334 35.069Maximum Area Disturbed/Day (acres) 5 0.5 0.5 0.5 0.5Water Trucks Used (Y/N) 6 No No No NoSoil Imported (cy/day) 7 0 0 0 0Soil Exported (cy/day) 7 0 0 0 0Average Truck Capacity (cy) 20 20 20 20Notes:1 Construction Start Year based on the schedule provided by the PMT, presented on the 'Schedule' tab.2 Will model all roadway projects as new road construction.3 Predominant Soil Type in the project vicinity was determined to be sand gravel by S. McGinnis (5/27/10).4 Total Project Area (acres) assumes the width of a 4-lane road (48 feet). This project area will be entered into URBEMIS2007 as the Land Use.5 The maximum area disturbed/day (acres) was assumed equal to that for the alignment earth moving activities.6 One water truck will be added for fugitive dust control within the URBEMIS2007 model, not the Road Construction Emissions Model.7 Emissions from soil hauling activities will be estimated under Material Hauling and were, therefore, excluded from this phase.

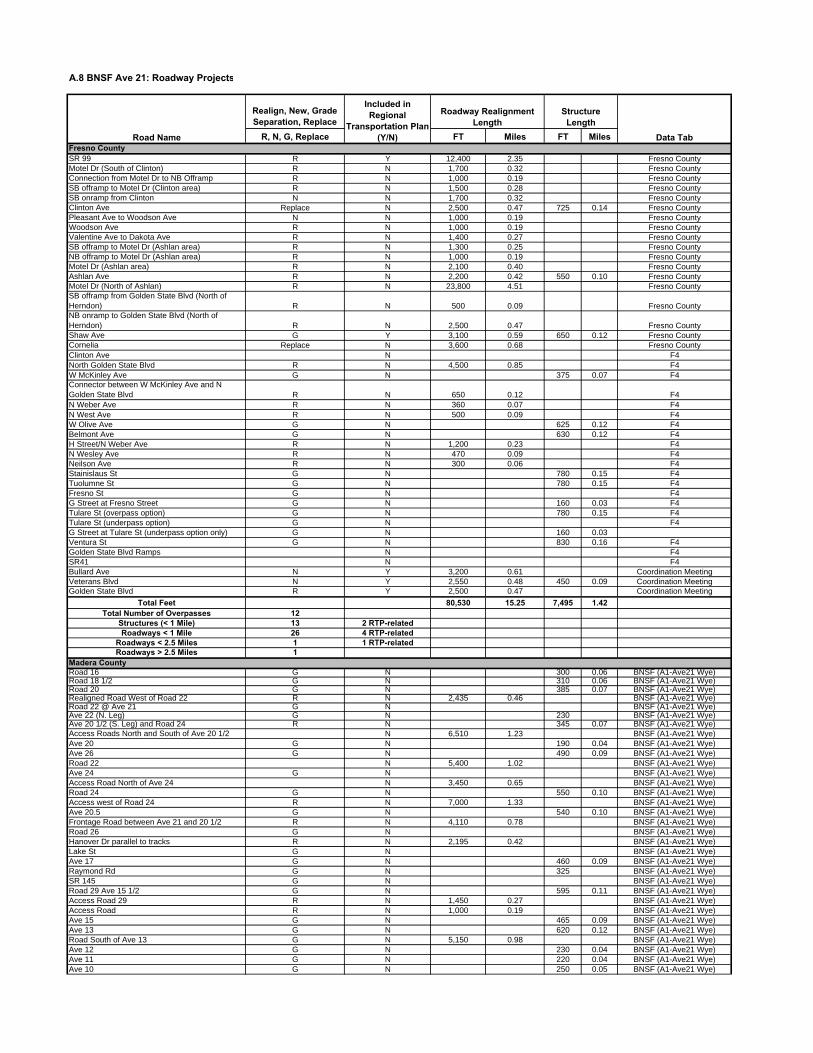
A.8 BNSF Ave 21: Roadway Projects
Realign, New, Grade Separation, Replace
R, N, G, Replace FT Miles FT MilesFresno CountySR 99 R Y 12,400 2.35 Fresno CountyMotel Dr (South of Clinton) R N 1,700 0.32 Fresno CountyConnection from Motel Dr to NB Offramp R N 1,000 0.19 Fresno CountySB offramp to Motel Dr (Clinton area) R N 1,500 0.28 Fresno CountySB onramp from Clinton N N 1,700 0.32 Fresno CountyClinton Ave Replace N 2,500 0.47 725 0.14 Fresno CountyPleasant Ave to Woodson Ave N N 1,000 0.19 Fresno CountyWoodson Ave R N 1,000 0.19 Fresno CountyValentine Ave to Dakota Ave R N 1,400 0.27 Fresno CountySB offramp to Motel Dr (Ashlan area) R N 1,300 0.25 Fresno CountyNB offramp to Motel Dr (Ashlan area) R N 1,000 0.19 Fresno CountyMotel Dr (Ashlan area) R N 2,100 0.40 Fresno CountyAshlan Ave R N 2,200 0.42 550 0.10 Fresno CountyMotel Dr (North of Ashlan) R N 23,800 4.51 Fresno CountySB offramp from Golden State Blvd (North of Herndon) R N 500 0.09 Fresno CountyNB onramp to Golden State Blvd (North of Herndon) R N 2,500 0.47 Fresno CountyShaw Ave G Y 3,100 0.59 650 0.12 Fresno CountyCornelia Replace N 3,600 0.68 Fresno CountyClinton Ave N F4North Golden State Blvd R N 4,500 0.85 F4W McKinley Ave G N 375 0.07 F4Connector between W McKinley Ave and N Golden State Blvd R N 650 0.12 F4N Weber Ave R N 360 0.07 F4N West Ave R N 500 0.09 F4W Olive Ave G N 625 0.12 F4Belmont Ave G N 630 0.12 F4H Street/N Weber Ave R N 1,200 0.23 F4N Wesley Ave R N 470 0.09 F4Neilson Ave R N 300 0.06 F4Stainislaus St G N 780 0.15 F4Tuolumne St G N 780 0.15 F4Fresno St G N F4G Street at Fresno Street G N 160 0.03 F4Tulare St (overpass option) G N 780 0.15 F4Tulare St (underpass option) G N F4G Street at Tulare St (underpass option only) G N 160 0.03Ventura St G N 830 0.16 F4Golden State Blvd Ramps N F4SR41 N F4Bullard Ave N Y 3,200 0.61 Coordination MeetingVeterans Blvd N Y 2,550 0.48 450 0.09 Coordination MeetingGolden State Blvd R Y 2,500 0.47 Coordination Meeting
Total Feet 80,530 15.25 7,495 1.42Total Number of Overpasses 12
Structures (< 1 Mile) 13 2 RTP-relatedRoadways < 1 Mile 26 4 RTP-related
Roadways < 2.5 Miles 1 1 RTP-relatedRoadways > 2.5 Miles 1
Madera CountyRoad 16 G N 300 0.06 BNSF (A1-Ave21 Wye)Road 18 1/2 G N 310 0.06 BNSF (A1-Ave21 Wye)Road 20 G N 385 0.07 BNSF (A1-Ave21 Wye)Realigned Road West of Road 22 R N 2,435 0.46 BNSF (A1-Ave21 Wye)Road 22 @ Ave 21 G N BNSF (A1-Ave21 Wye)Ave 22 (N. Leg) G N 230 BNSF (A1-Ave21 Wye)Ave 20 1/2 (S. Leg) and Road 24 R N 345 0.07 BNSF (A1-Ave21 Wye)Access Roads North and South of Ave 20 1/2 N 6,510 1.23 BNSF (A1-Ave21 Wye)Ave 20 G N 190 0.04 BNSF (A1-Ave21 Wye)Ave 26 G N 490 0.09 BNSF (A1-Ave21 Wye)Road 22 N 5,400 1.02 BNSF (A1-Ave21 Wye)Ave 24 G N BNSF (A1-Ave21 Wye)Access Road North of Ave 24 N 3,450 0.65 BNSF (A1-Ave21 Wye)Road 24 G N 550 0.10 BNSF (A1-Ave21 Wye)Access west of Road 24 R N 7,000 1.33 BNSF (A1-Ave21 Wye)Ave 20.5 G N 540 0.10 BNSF (A1-Ave21 Wye)Frontage Road between Ave 21 and 20 1/2 R N 4,110 0.78 BNSF (A1-Ave21 Wye)Road 26 G N BNSF (A1-Ave21 Wye)Hanover Dr parallel to tracks R N 2,195 0.42 BNSF (A1-Ave21 Wye)Lake St G N BNSF (A1-Ave21 Wye)Ave 17 G N 460 0.09 BNSF (A1-Ave21 Wye)Raymond Rd G N 325 BNSF (A1-Ave21 Wye)SR 145 G N BNSF (A1-Ave21 Wye)Road 29 Ave 15 1/2 G N 595 0.11 BNSF (A1-Ave21 Wye)Access Road 29 R N 1,450 0.27 BNSF (A1-Ave21 Wye)Access Road R N 1,000 0.19 BNSF (A1-Ave21 Wye)Ave 15 G N 465 0.09 BNSF (A1-Ave21 Wye)Ave 13 G N 620 0.12 BNSF (A1-Ave21 Wye)Road South of Ave 13 G N 5,150 0.98 BNSF (A1-Ave21 Wye)Ave 12 G N 230 0.04 BNSF (A1-Ave21 Wye)Ave 11 G N 220 0.04 BNSF (A1-Ave21 Wye)Ave 10 G N 250 0.05 BNSF (A1-Ave21 Wye)
Road Name
Roadway Realignment Length
Structure Length
Data Tab
Included in Regional
Transportation Plan (Y/N)
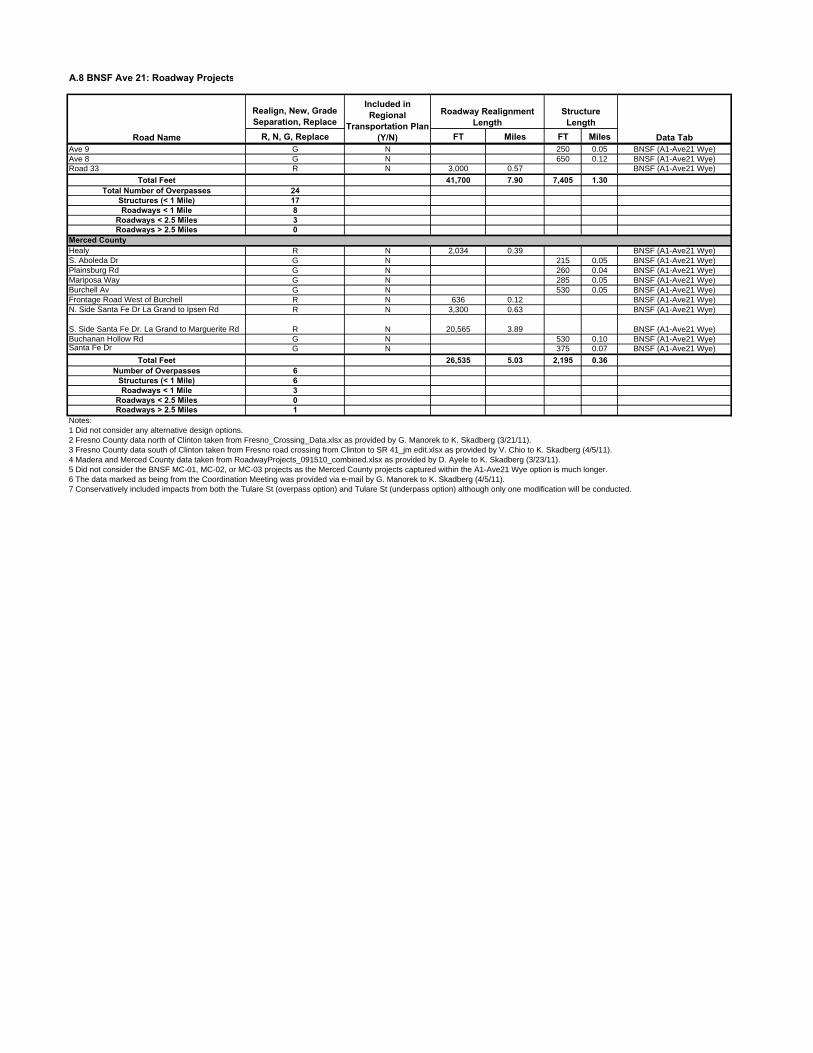
A.8 BNSF Ave 21: Roadway Projects
Realign, New, Grade Separation, Replace
R, N, G, Replace FT Miles FT MilesRoad Name
Roadway Realignment Length
Structure Length
Data Tab
Included in Regional
Transportation Plan (Y/N)
Ave 9 G N 250 0.05 BNSF (A1-Ave21 Wye)Ave 8 G N 650 0.12 BNSF (A1-Ave21 Wye)Road 33 R N 3,000 0.57 BNSF (A1-Ave21 Wye)
Total Feet 41,700 7.90 7,405 1.30Total Number of Overpasses 24
Structures (< 1 Mile) 17Roadways < 1 Mile 8
Roadways < 2.5 Miles 3Roadways > 2.5 Miles 0
Merced CountyHealy R N 2,034 0.39 BNSF (A1-Ave21 Wye)S. Aboleda Dr G N 215 0.05 BNSF (A1-Ave21 Wye)Plainsburg Rd G N 260 0.04 BNSF (A1-Ave21 Wye)Mariposa Way G N 285 0.05 BNSF (A1-Ave21 Wye)Burchell Av G N 530 0.05 BNSF (A1-Ave21 Wye)Frontage Road West of Burchell R N 636 0.12 BNSF (A1-Ave21 Wye)N. Side Santa Fe Dr La Grand to Ipsen Rd R N 3,300 0.63 BNSF (A1-Ave21 Wye)
S. Side Santa Fe Dr. La Grand to Marguerite Rd R N 20,565 3.89 BNSF (A1-Ave21 Wye)Buchanan Hollow Rd G N 530 0.10 BNSF (A1-Ave21 Wye)Santa Fe Dr G N 375 0.07 BNSF (A1-Ave21 Wye)
Total Feet 26,535 5.03 2,195 0.36Number of Overpasses 6
Structures (< 1 Mile) 6Roadways < 1 Mile 3
Roadways < 2.5 Miles 0Roadways > 2.5 Miles 1
Notes:1 Did not consider any alternative design options.2 Fresno County data north of Clinton taken from Fresno_Crossing_Data.xlsx as provided by G. Manorek to K. Skadberg (3/21/11).3 Fresno County data south of Clinton taken from Fresno road crossing from Clinton to SR 41_jm edit.xlsx as provided by V. Chio to K. Skadberg (4/5/11).4 Madera and Merced County data taken from RoadwayProjects_091510_combined.xlsx as provided by D. Ayele to K. Skadberg (3/23/11).5 Did not consider the BNSF MC-01, MC-02, or MC-03 projects as the Merced County projects captured within the A1-Ave21 Wye option is much longer.6 The data marked as being from the Coordination Meeting was provided via e-mail by G. Manorek to K. Skadberg (4/5/11).7 Conservatively included impacts from both the Tulare St (overpass option) and Tulare St (underpass option) although only one modification will be conducted.
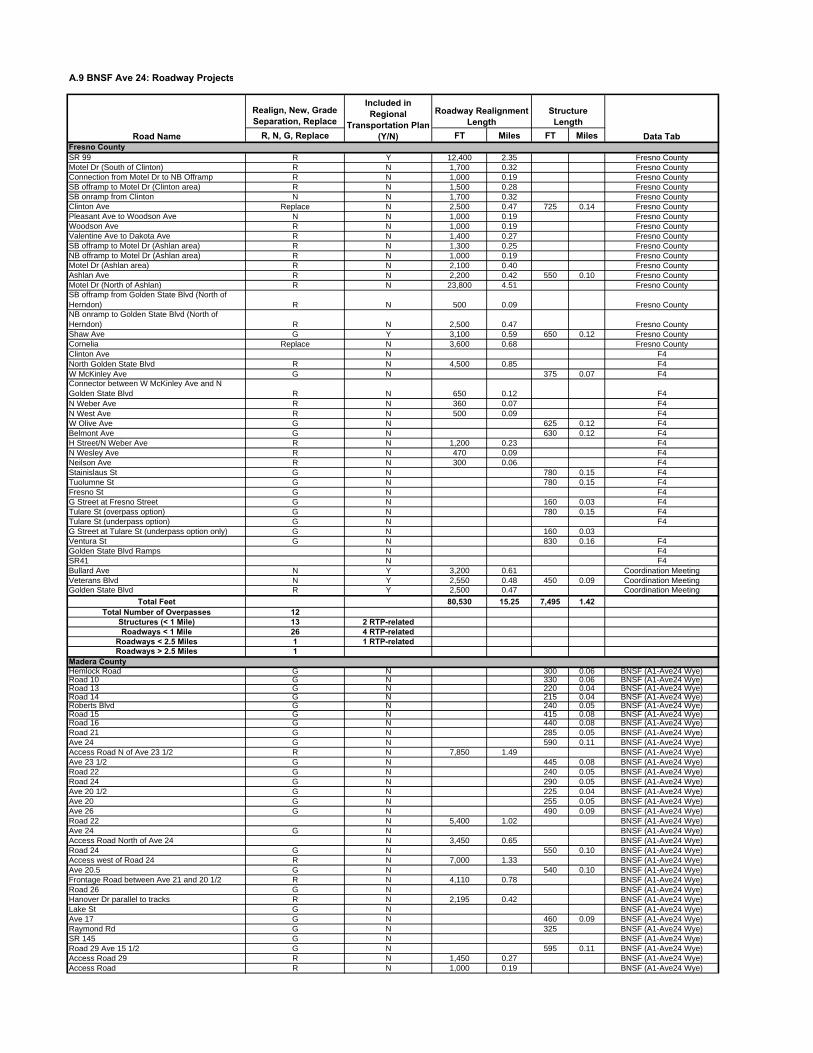
A.9 BNSF Ave 24: Roadway Projects
Realign, New, Grade Separation, Replace
R, N, G, Replace FT Miles FT MilesFresno CountySR 99 R Y 12,400 2.35 Fresno CountyMotel Dr (South of Clinton) R N 1,700 0.32 Fresno CountyConnection from Motel Dr to NB Offramp R N 1,000 0.19 Fresno CountySB offramp to Motel Dr (Clinton area) R N 1,500 0.28 Fresno CountySB onramp from Clinton N N 1,700 0.32 Fresno CountyClinton Ave Replace N 2,500 0.47 725 0.14 Fresno CountyPleasant Ave to Woodson Ave N N 1,000 0.19 Fresno CountyWoodson Ave R N 1,000 0.19 Fresno CountyValentine Ave to Dakota Ave R N 1,400 0.27 Fresno CountySB offramp to Motel Dr (Ashlan area) R N 1,300 0.25 Fresno CountyNB offramp to Motel Dr (Ashlan area) R N 1,000 0.19 Fresno CountyMotel Dr (Ashlan area) R N 2,100 0.40 Fresno CountyAshlan Ave R N 2,200 0.42 550 0.10 Fresno CountyMotel Dr (North of Ashlan) R N 23,800 4.51 Fresno CountySB offramp from Golden State Blvd (North of Herndon) R N 500 0.09 Fresno CountyNB onramp to Golden State Blvd (North of Herndon) R N 2,500 0.47 Fresno CountyShaw Ave G Y 3,100 0.59 650 0.12 Fresno CountyCornelia Replace N 3,600 0.68 Fresno CountyClinton Ave N F4North Golden State Blvd R N 4,500 0.85 F4W McKinley Ave G N 375 0.07 F4Connector between W McKinley Ave and N Golden State Blvd R N 650 0.12 F4N Weber Ave R N 360 0.07 F4N West Ave R N 500 0.09 F4W Olive Ave G N 625 0.12 F4Belmont Ave G N 630 0.12 F4H Street/N Weber Ave R N 1,200 0.23 F4N Wesley Ave R N 470 0.09 F4Neilson Ave R N 300 0.06 F4Stainislaus St G N 780 0.15 F4Tuolumne St G N 780 0.15 F4Fresno St G N F4G Street at Fresno Street G N 160 0.03 F4Tulare St (overpass option) G N 780 0.15 F4Tulare St (underpass option) G N F4G Street at Tulare St (underpass option only) G N 160 0.03Ventura St G N 830 0.16 F4Golden State Blvd Ramps N F4SR41 N F4Bullard Ave N Y 3,200 0.61 Coordination MeetingVeterans Blvd N Y 2,550 0.48 450 0.09 Coordination MeetingGolden State Blvd R Y 2,500 0.47 Coordination Meeting
Total Feet 80,530 15.25 7,495 1.42Total Number of Overpasses 12
Structures (< 1 Mile) 13 2 RTP-relatedRoadways < 1 Mile 26 4 RTP-related
Roadways < 2.5 Miles 1 1 RTP-relatedRoadways > 2.5 Miles 1
Madera CountyHemlock Road G N 300 0.06 BNSF (A1-Ave24 Wye)Road 10 G N 330 0.06 BNSF (A1-Ave24 Wye)Road 13 G N 220 0.04 BNSF (A1-Ave24 Wye)Road 14 G N 215 0.04 BNSF (A1-Ave24 Wye)Roberts Blvd G N 240 0.05 BNSF (A1-Ave24 Wye)Road 15 G N 415 0.08 BNSF (A1-Ave24 Wye)Road 16 G N 440 0.08 BNSF (A1-Ave24 Wye)Road 21 G N 285 0.05 BNSF (A1-Ave24 Wye)Ave 24 G N 590 0.11 BNSF (A1-Ave24 Wye)Access Road N of Ave 23 1/2 R N 7,850 1.49 BNSF (A1-Ave24 Wye)Ave 23 1/2 G N 445 0.08 BNSF (A1-Ave24 Wye)Road 22 G N 240 0.05 BNSF (A1-Ave24 Wye)Road 24 G N 290 0.05 BNSF (A1-Ave24 Wye)Ave 20 1/2 G N 225 0.04 BNSF (A1-Ave24 Wye)Ave 20 G N 255 0.05 BNSF (A1-Ave24 Wye)Ave 26 G N 490 0.09 BNSF (A1-Ave24 Wye)Road 22 N 5,400 1.02 BNSF (A1-Ave24 Wye)Ave 24 G N BNSF (A1-Ave24 Wye)Access Road North of Ave 24 N 3,450 0.65 BNSF (A1-Ave24 Wye)Road 24 G N 550 0.10 BNSF (A1-Ave24 Wye)Access west of Road 24 R N 7,000 1.33 BNSF (A1-Ave24 Wye)Ave 20.5 G N 540 0.10 BNSF (A1-Ave24 Wye)Frontage Road between Ave 21 and 20 1/2 R N 4,110 0.78 BNSF (A1-Ave24 Wye)Road 26 G N BNSF (A1-Ave24 Wye)Hanover Dr parallel to tracks R N 2,195 0.42 BNSF (A1-Ave24 Wye)Lake St G N BNSF (A1-Ave24 Wye)Ave 17 G N 460 0.09 BNSF (A1-Ave24 Wye)Raymond Rd G N 325 BNSF (A1-Ave24 Wye)SR 145 G N BNSF (A1-Ave24 Wye)Road 29 Ave 15 1/2 G N 595 0.11 BNSF (A1-Ave24 Wye)Access Road 29 R N 1,450 0.27 BNSF (A1-Ave24 Wye)Access Road R N 1,000 0.19 BNSF (A1-Ave24 Wye)
Road Name
Roadway Realignment Length
Structure Length
Data Tab
Included in Regional
Transportation Plan (Y/N)
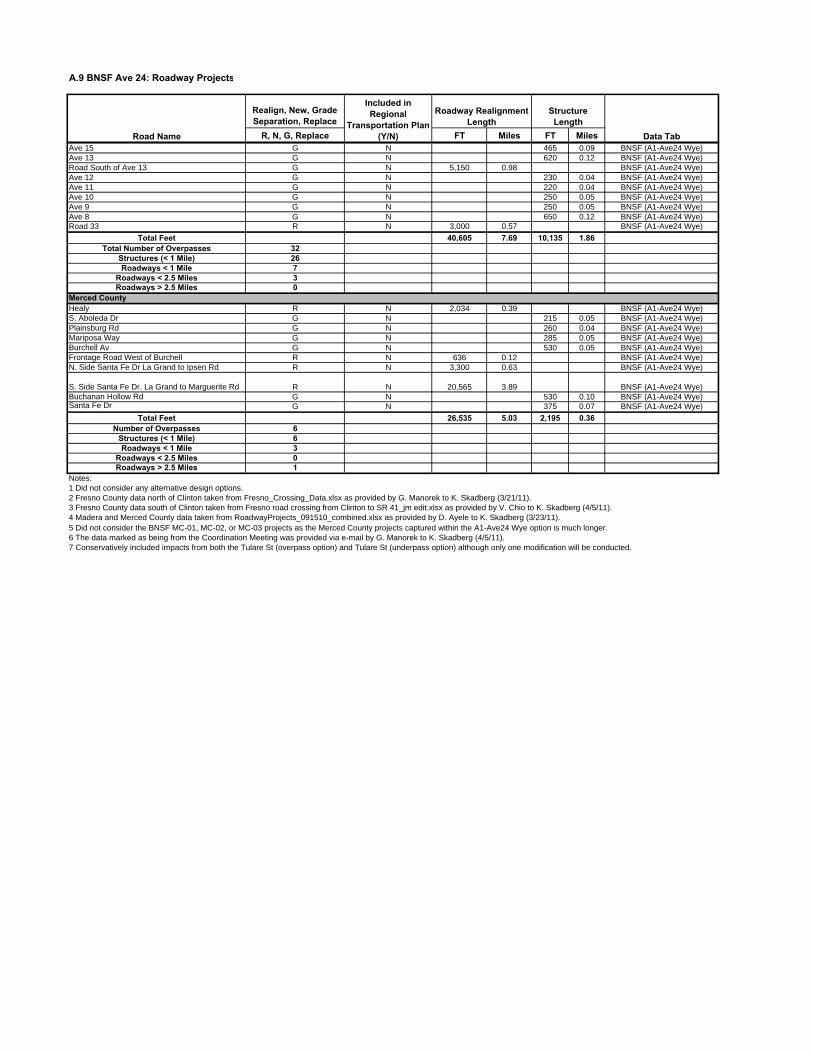
A.9 BNSF Ave 24: Roadway Projects
Realign, New, Grade Separation, Replace
R, N, G, Replace FT Miles FT MilesRoad Name
Roadway Realignment Length
Structure Length
Data Tab
Included in Regional
Transportation Plan (Y/N)
Ave 15 G N 465 0.09 BNSF (A1-Ave24 Wye)Ave 13 G N 620 0.12 BNSF (A1-Ave24 Wye)Road South of Ave 13 G N 5,150 0.98 BNSF (A1-Ave24 Wye)Ave 12 G N 230 0.04 BNSF (A1-Ave24 Wye)Ave 11 G N 220 0.04 BNSF (A1-Ave24 Wye)Ave 10 G N 250 0.05 BNSF (A1-Ave24 Wye)Ave 9 G N 250 0.05 BNSF (A1-Ave24 Wye)Ave 8 G N 650 0.12 BNSF (A1-Ave24 Wye)Road 33 R N 3,000 0.57 BNSF (A1-Ave24 Wye)
Total Feet 40,605 7.69 10,135 1.86Total Number of Overpasses 32
Structures (< 1 Mile) 26Roadways < 1 Mile 7
Roadways < 2.5 Miles 3Roadways > 2.5 Miles 0
Merced CountyHealy R N 2,034 0.39 BNSF (A1-Ave24 Wye)S. Aboleda Dr G N 215 0.05 BNSF (A1-Ave24 Wye)Plainsburg Rd G N 260 0.04 BNSF (A1-Ave24 Wye)Mariposa Way G N 285 0.05 BNSF (A1-Ave24 Wye)Burchell Av G N 530 0.05 BNSF (A1-Ave24 Wye)Frontage Road West of Burchell R N 636 0.12 BNSF (A1-Ave24 Wye)N. Side Santa Fe Dr La Grand to Ipsen Rd R N 3,300 0.63 BNSF (A1-Ave24 Wye)
S. Side Santa Fe Dr. La Grand to Marguerite Rd R N 20,565 3.89 BNSF (A1-Ave24 Wye)Buchanan Hollow Rd G N 530 0.10 BNSF (A1-Ave24 Wye)Santa Fe Dr G N 375 0.07 BNSF (A1-Ave24 Wye)
Total Feet 26,535 5.03 2,195 0.36Number of Overpasses 6
Structures (< 1 Mile) 6Roadways < 1 Mile 3
Roadways < 2.5 Miles 0Roadways > 2.5 Miles 1
Notes:1 Did not consider any alternative design options.2 Fresno County data north of Clinton taken from Fresno_Crossing_Data.xlsx as provided by G. Manorek to K. Skadberg (3/21/11).3 Fresno County data south of Clinton taken from Fresno road crossing from Clinton to SR 41_jm edit.xlsx as provided by V. Chio to K. Skadberg (4/5/11).4 Madera and Merced County data taken from RoadwayProjects_091510_combined.xlsx as provided by D. Ayele to K. Skadberg (3/23/11).5 Did not consider the BNSF MC-01, MC-02, or MC-03 projects as the Merced County projects captured within the A1-Ave24 Wye option is much longer.6 The data marked as being from the Coordination Meeting was provided via e-mail by G. Manorek to K. Skadberg (4/5/11).7 Conservatively included impacts from both the Tulare St (overpass option) and Tulare St (underpass option) although only one modification will be conducted.
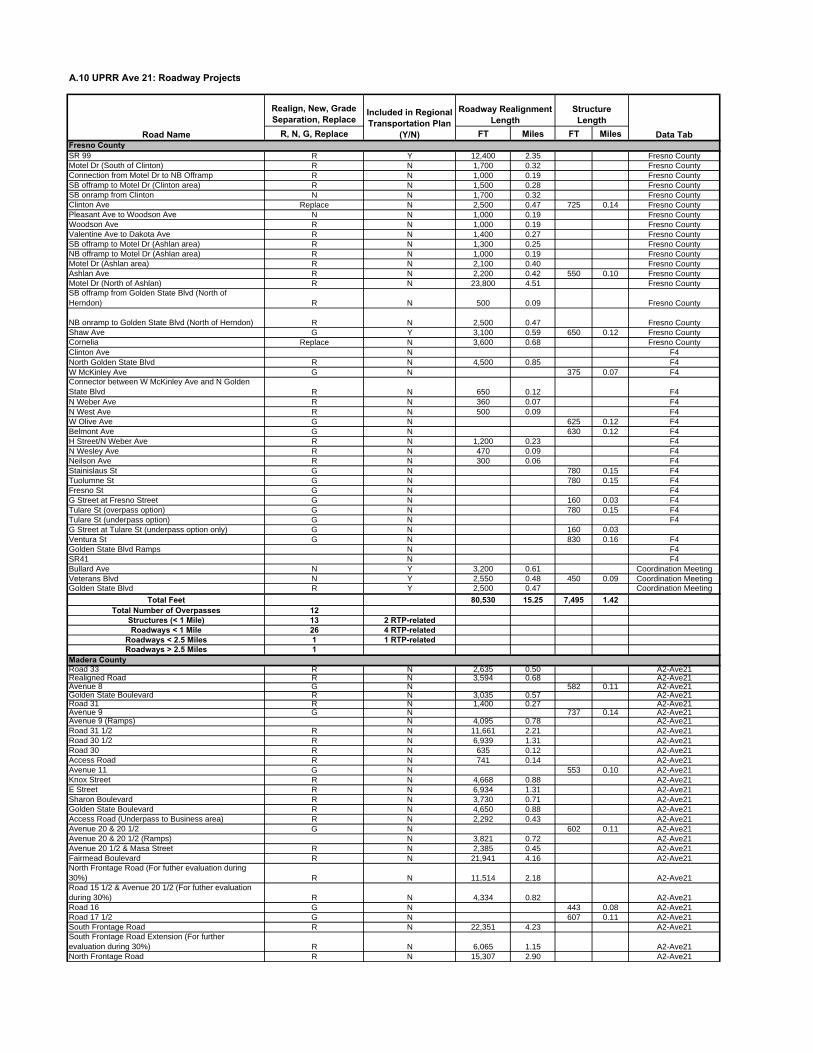
A.10 UPRR Ave 21: Roadway Projects
Realign, New, Grade Separation, Replace
R, N, G, Replace FT Miles FT MilesFresno CountySR 99 R Y 12,400 2.35 Fresno CountyMotel Dr (South of Clinton) R N 1,700 0.32 Fresno CountyConnection from Motel Dr to NB Offramp R N 1,000 0.19 Fresno CountySB offramp to Motel Dr (Clinton area) R N 1,500 0.28 Fresno CountySB onramp from Clinton N N 1,700 0.32 Fresno CountyClinton Ave Replace N 2,500 0.47 725 0.14 Fresno CountyPleasant Ave to Woodson Ave N N 1,000 0.19 Fresno CountyWoodson Ave R N 1,000 0.19 Fresno CountyValentine Ave to Dakota Ave R N 1,400 0.27 Fresno CountySB offramp to Motel Dr (Ashlan area) R N 1,300 0.25 Fresno CountyNB offramp to Motel Dr (Ashlan area) R N 1,000 0.19 Fresno CountyMotel Dr (Ashlan area) R N 2,100 0.40 Fresno CountyAshlan Ave R N 2,200 0.42 550 0.10 Fresno CountyMotel Dr (North of Ashlan) R N 23,800 4.51 Fresno CountySB offramp from Golden State Blvd (North of Herndon) R N 500 0.09 Fresno County
NB onramp to Golden State Blvd (North of Herndon) R N 2,500 0.47 Fresno CountyShaw Ave G Y 3,100 0.59 650 0.12 Fresno CountyCornelia Replace N 3,600 0.68 Fresno CountyClinton Ave N F4North Golden State Blvd R N 4,500 0.85 F4W McKinley Ave G N 375 0.07 F4Connector between W McKinley Ave and N Golden State Blvd R N 650 0.12 F4N Weber Ave R N 360 0.07 F4N West Ave R N 500 0.09 F4W Olive Ave G N 625 0.12 F4Belmont Ave G N 630 0.12 F4H Street/N Weber Ave R N 1,200 0.23 F4N Wesley Ave R N 470 0.09 F4Neilson Ave R N 300 0.06 F4Stainislaus St G N 780 0.15 F4Tuolumne St G N 780 0.15 F4Fresno St G N F4G Street at Fresno Street G N 160 0.03 F4Tulare St (overpass option) G N 780 0.15 F4Tulare St (underpass option) G N F4G Street at Tulare St (underpass option only) G N 160 0.03Ventura St G N 830 0.16 F4Golden State Blvd Ramps N F4SR41 N F4Bullard Ave N Y 3,200 0.61 Coordination MeetingVeterans Blvd N Y 2,550 0.48 450 0.09 Coordination MeetingGolden State Blvd R Y 2,500 0.47 Coordination Meeting
Total Feet 80,530 15.25 7,495 1.42Total Number of Overpasses 12
Structures (< 1 Mile) 13 2 RTP-relatedRoadways < 1 Mile 26 4 RTP-related
Roadways < 2.5 Miles 1 1 RTP-relatedRoadways > 2.5 Miles 1
Madera CountyRoad 33 R N 2,635 0.50 A2-Ave21Realigned Road R N 3,594 0.68 A2-Ave21Avenue 8 G N 582 0.11 A2-Ave21Golden State Boulevard R N 3,035 0.57 A2-Ave21Road 31 R N 1,400 0.27 A2-Ave21Avenue 9 G N 737 0.14 A2-Ave21Avenue 9 (Ramps) N 4,095 0.78 A2-Ave21Road 31 1/2 R N 11,661 2.21 A2-Ave21Road 30 1/2 R N 6,939 1.31 A2-Ave21Road 30 R N 635 0.12 A2-Ave21Access Road R N 741 0.14 A2-Ave21Avenue 11 G N 553 0.10 A2-Ave21Knox Street R N 4,668 0.88 A2-Ave21E Street R N 6,934 1.31 A2-Ave21Sharon Boulevard R N 3,730 0.71 A2-Ave21Golden State Boulevard R N 4,650 0.88 A2-Ave21Access Road (Underpass to Business area) R N 2,292 0.43 A2-Ave21Avenue 20 & 20 1/2 G N 602 0.11 A2-Ave21Avenue 20 & 20 1/2 (Ramps) N 3,821 0.72 A2-Ave21Avenue 20 1/2 & Masa Street R N 2,385 0.45 A2-Ave21Fairmead Boulevard R N 21,941 4.16 A2-Ave21North Frontage Road (For futher evaluation during 30%) R N 11,514 2.18 A2-Ave21Road 15 1/2 & Avenue 20 1/2 (For futher evaluation during 30%) R N 4,334 0.82 A2-Ave21Road 16 G N 443 0.08 A2-Ave21Road 17 1/2 G N 607 0.11 A2-Ave21South Frontage Road R N 22,351 4.23 A2-Ave21South Frontage Road Extension (For further evaluation during 30%) R N 6,065 1.15 A2-Ave21North Frontage Road R N 15,307 2.90 A2-Ave21
Road Name
Roadway Realignment Length
Structure Length
Data Tab
Included in Regional Transportation Plan
(Y/N)
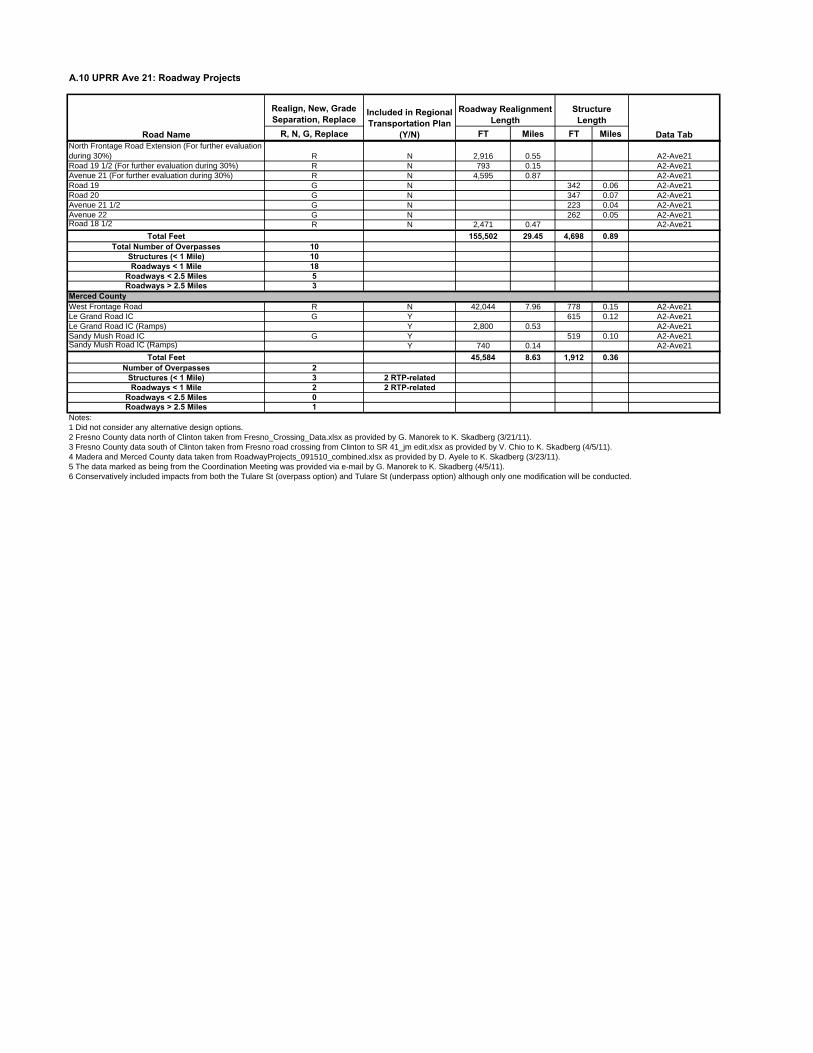
A.10 UPRR Ave 21: Roadway Projects
Realign, New, Grade Separation, Replace
R, N, G, Replace FT Miles FT MilesRoad Name
Roadway Realignment Length
Structure Length
Data Tab
Included in Regional Transportation Plan
(Y/N)North Frontage Road Extension (For further evaluation during 30%) R N 2,916 0.55 A2-Ave21Road 19 1/2 (For further evaluation during 30%) R N 793 0.15 A2-Ave21Avenue 21 (For further evaluation during 30%) R N 4,595 0.87 A2-Ave21Road 19 G N 342 0.06 A2-Ave21Road 20 G N 347 0.07 A2-Ave21Avenue 21 1/2 G N 223 0.04 A2-Ave21Avenue 22 G N 262 0.05 A2-Ave21Road 18 1/2 R N 2,471 0.47 A2-Ave21
Total Feet 155,502 29.45 4,698 0.89Total Number of Overpasses 10
Structures (< 1 Mile) 10Roadways < 1 Mile 18
Roadways < 2.5 Miles 5Roadways > 2.5 Miles 3
Merced CountyWest Frontage Road R N 42,044 7.96 778 0.15 A2-Ave21Le Grand Road IC G Y 615 0.12 A2-Ave21Le Grand Road IC (Ramps) Y 2,800 0.53 A2-Ave21Sandy Mush Road IC G Y 519 0.10 A2-Ave21Sandy Mush Road IC (Ramps) Y 740 0.14 A2-Ave21
Total Feet 45,584 8.63 1,912 0.36Number of Overpasses 2
Structures (< 1 Mile) 3 2 RTP-relatedRoadways < 1 Mile 2 2 RTP-related
Roadways < 2.5 Miles 0Roadways > 2.5 Miles 1
Notes:1 Did not consider any alternative design options.2 Fresno County data north of Clinton taken from Fresno_Crossing_Data.xlsx as provided by G. Manorek to K. Skadberg (3/21/11).3 Fresno County data south of Clinton taken from Fresno road crossing from Clinton to SR 41_jm edit.xlsx as provided by V. Chio to K. Skadberg (4/5/11).4 Madera and Merced County data taken from RoadwayProjects_091510_combined.xlsx as provided by D. Ayele to K. Skadberg (3/23/11).5 The data marked as being from the Coordination Meeting was provided via e-mail by G. Manorek to K. Skadberg (4/5/11).6 Conservatively included impacts from both the Tulare St (overpass option) and Tulare St (underpass option) although only one modification will be conducted.
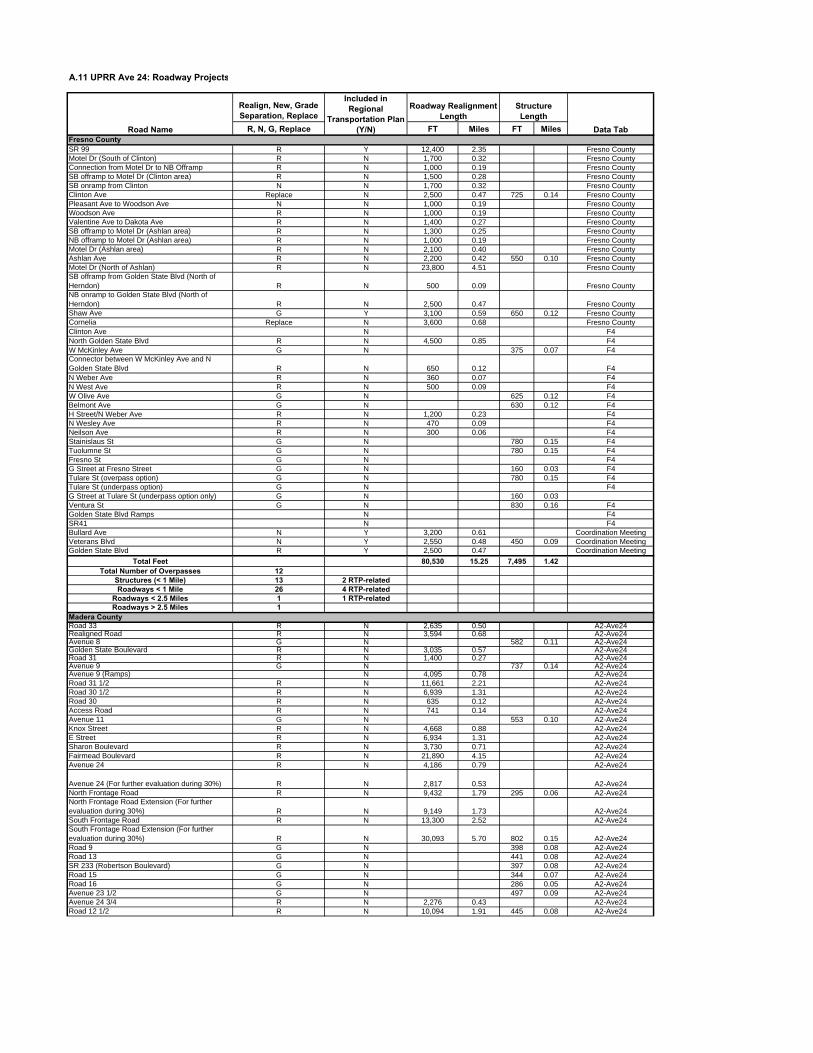
A.11 UPRR Ave 24: Roadway Projects
Realign, New, Grade Separation, Replace
R, N, G, Replace FT Miles FT MilesFresno CountySR 99 R Y 12,400 2.35 Fresno CountyMotel Dr (South of Clinton) R N 1,700 0.32 Fresno CountyConnection from Motel Dr to NB Offramp R N 1,000 0.19 Fresno CountySB offramp to Motel Dr (Clinton area) R N 1,500 0.28 Fresno CountySB onramp from Clinton N N 1,700 0.32 Fresno CountyClinton Ave Replace N 2,500 0.47 725 0.14 Fresno CountyPleasant Ave to Woodson Ave N N 1,000 0.19 Fresno CountyWoodson Ave R N 1,000 0.19 Fresno CountyValentine Ave to Dakota Ave R N 1,400 0.27 Fresno CountySB offramp to Motel Dr (Ashlan area) R N 1,300 0.25 Fresno CountyNB offramp to Motel Dr (Ashlan area) R N 1,000 0.19 Fresno CountyMotel Dr (Ashlan area) R N 2,100 0.40 Fresno CountyAshlan Ave R N 2,200 0.42 550 0.10 Fresno CountyMotel Dr (North of Ashlan) R N 23,800 4.51 Fresno CountySB offramp from Golden State Blvd (North of Herndon) R N 500 0.09 Fresno CountyNB onramp to Golden State Blvd (North of Herndon) R N 2,500 0.47 Fresno CountyShaw Ave G Y 3,100 0.59 650 0.12 Fresno CountyCornelia Replace N 3,600 0.68 Fresno CountyClinton Ave N F4North Golden State Blvd R N 4,500 0.85 F4W McKinley Ave G N 375 0.07 F4Connector between W McKinley Ave and N Golden State Blvd R N 650 0.12 F4N Weber Ave R N 360 0.07 F4N West Ave R N 500 0.09 F4W Olive Ave G N 625 0.12 F4Belmont Ave G N 630 0.12 F4H Street/N Weber Ave R N 1,200 0.23 F4N Wesley Ave R N 470 0.09 F4Neilson Ave R N 300 0.06 F4Stainislaus St G N 780 0.15 F4Tuolumne St G N 780 0.15 F4Fresno St G N F4G Street at Fresno Street G N 160 0.03 F4Tulare St (overpass option) G N 780 0.15 F4Tulare St (underpass option) G N F4G Street at Tulare St (underpass option only) G N 160 0.03Ventura St G N 830 0.16 F4Golden State Blvd Ramps N F4SR41 N F4Bullard Ave N Y 3,200 0.61 Coordination MeetingVeterans Blvd N Y 2,550 0.48 450 0.09 Coordination MeetingGolden State Blvd R Y 2,500 0.47 Coordination Meeting
Total Feet 80,530 15.25 7,495 1.42Total Number of Overpasses 12
Structures (< 1 Mile) 13 2 RTP-relatedRoadways < 1 Mile 26 4 RTP-related
Roadways < 2.5 Miles 1 1 RTP-relatedRoadways > 2.5 Miles 1
Madera CountyRoad 33 R N 2,635 0.50 A2-Ave24Realigned Road R N 3,594 0.68 A2-Ave24Avenue 8 G N 582 0.11 A2-Ave24Golden State Boulevard R N 3,035 0.57 A2-Ave24Road 31 R N 1,400 0.27 A2-Ave24Avenue 9 G N 737 0.14 A2-Ave24Avenue 9 (Ramps) N 4,095 0.78 A2-Ave24Road 31 1/2 R N 11,661 2.21 A2-Ave24Road 30 1/2 R N 6,939 1.31 A2-Ave24Road 30 R N 635 0.12 A2-Ave24Access Road R N 741 0.14 A2-Ave24Avenue 11 G N 553 0.10 A2-Ave24Knox Street R N 4,668 0.88 A2-Ave24E Street R N 6,934 1.31 A2-Ave24Sharon Boulevard R N 3,730 0.71 A2-Ave24Fairmead Boulevard R N 21,890 4.15 A2-Ave24Avenue 24 R N 4,186 0.79 A2-Ave24
Avenue 24 (For further evaluation during 30%) R N 2,817 0.53 A2-Ave24North Frontage Road R N 9,432 1.79 295 0.06 A2-Ave24North Frontage Road Extension (For further evaluation during 30%) R N 9,149 1.73 A2-Ave24South Frontage Road R N 13,300 2.52 A2-Ave24South Frontage Road Extension (For further evaluation during 30%) R N 30,093 5.70 802 0.15 A2-Ave24Road 9 G N 398 0.08 A2-Ave24Road 13 G N 441 0.08 A2-Ave24SR 233 (Robertson Boulevard) G N 397 0.08 A2-Ave24Road 15 G N 344 0.07 A2-Ave24Road 16 G N 286 0.05 A2-Ave24Avenue 23 1/2 G N 497 0.09 A2-Ave24Avenue 24 3/4 R N 2,276 0.43 A2-Ave24Road 12 1/2 R N 10,094 1.91 445 0.08 A2-Ave24
Road Name
Roadway Realignment Length
Structure Length
Data Tab
Included in Regional
Transportation Plan (Y/N)
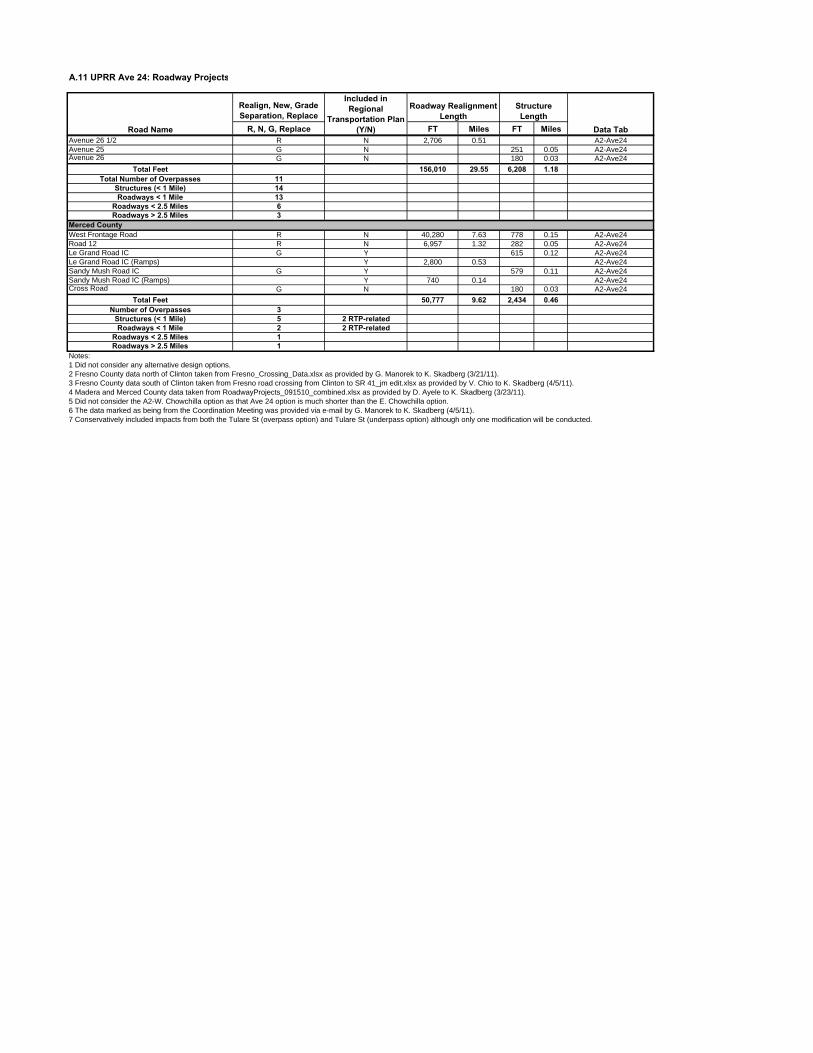
A.11 UPRR Ave 24: Roadway Projects
Realign, New, Grade Separation, Replace
R, N, G, Replace FT Miles FT MilesRoad Name
Roadway Realignment Length
Structure Length
Data Tab
Included in Regional
Transportation Plan (Y/N)
Avenue 26 1/2 R N 2,706 0.51 A2-Ave24Avenue 25 G N 251 0.05 A2-Ave24Avenue 26 G N 180 0.03 A2-Ave24
Total Feet 156,010 29.55 6,208 1.18Total Number of Overpasses 11
Structures (< 1 Mile) 14Roadways < 1 Mile 13
Roadways < 2.5 Miles 6Roadways > 2.5 Miles 3
Merced CountyWest Frontage Road R N 40,280 7.63 778 0.15 A2-Ave24Road 12 R N 6,957 1.32 282 0.05 A2-Ave24Le Grand Road IC G Y 615 0.12 A2-Ave24Le Grand Road IC (Ramps) Y 2,800 0.53 A2-Ave24Sandy Mush Road IC G Y 579 0.11 A2-Ave24Sandy Mush Road IC (Ramps) Y 740 0.14 A2-Ave24Cross Road G N 180 0.03 A2-Ave24
Total Feet 50,777 9.62 2,434 0.46Number of Overpasses 3
Structures (< 1 Mile) 5 2 RTP-relatedRoadways < 1 Mile 2 2 RTP-related
Roadways < 2.5 Miles 1Roadways > 2.5 Miles 1
Notes:1 Did not consider any alternative design options.2 Fresno County data north of Clinton taken from Fresno_Crossing_Data.xlsx as provided by G. Manorek to K. Skadberg (3/21/11).3 Fresno County data south of Clinton taken from Fresno road crossing from Clinton to SR 41_jm edit.xlsx as provided by V. Chio to K. Skadberg (4/5/11).4 Madera and Merced County data taken from RoadwayProjects_091510_combined.xlsx as provided by D. Ayele to K. Skadberg (3/23/11).5 Did not consider the A2-W. Chowchilla option as that Ave 24 option is much shorter than the E. Chowchilla option.6 The data marked as being from the Coordination Meeting was provided via e-mail by G. Manorek to K. Skadberg (4/5/11).7 Conservatively included impacts from both the Tulare St (overpass option) and Tulare St (underpass option) although only one modification will be conducted.
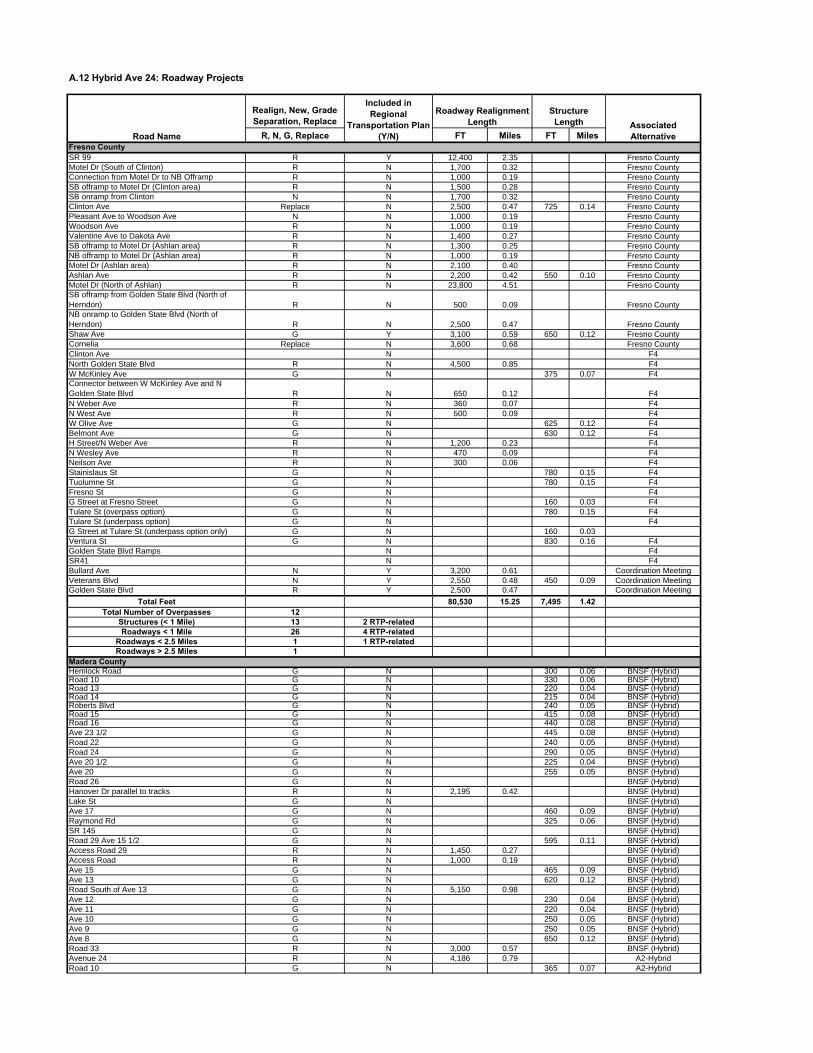
A.12 Hybrid Ave 24: Roadway Projects
Realign, New, Grade Separation, Replace
R, N, G, Replace FT Miles FT MilesFresno CountySR 99 R Y 12,400 2.35 Fresno CountyMotel Dr (South of Clinton) R N 1,700 0.32 Fresno CountyConnection from Motel Dr to NB Offramp R N 1,000 0.19 Fresno CountySB offramp to Motel Dr (Clinton area) R N 1,500 0.28 Fresno CountySB onramp from Clinton N N 1,700 0.32 Fresno CountyClinton Ave Replace N 2,500 0.47 725 0.14 Fresno CountyPleasant Ave to Woodson Ave N N 1,000 0.19 Fresno CountyWoodson Ave R N 1,000 0.19 Fresno CountyValentine Ave to Dakota Ave R N 1,400 0.27 Fresno CountySB offramp to Motel Dr (Ashlan area) R N 1,300 0.25 Fresno CountyNB offramp to Motel Dr (Ashlan area) R N 1,000 0.19 Fresno CountyMotel Dr (Ashlan area) R N 2,100 0.40 Fresno CountyAshlan Ave R N 2,200 0.42 550 0.10 Fresno CountyMotel Dr (North of Ashlan) R N 23,800 4.51 Fresno CountySB offramp from Golden State Blvd (North of Herndon) R N 500 0.09 Fresno CountyNB onramp to Golden State Blvd (North of Herndon) R N 2,500 0.47 Fresno CountyShaw Ave G Y 3,100 0.59 650 0.12 Fresno CountyCornelia Replace N 3,600 0.68 Fresno CountyClinton Ave N F4North Golden State Blvd R N 4,500 0.85 F4W McKinley Ave G N 375 0.07 F4Connector between W McKinley Ave and N Golden State Blvd R N 650 0.12 F4N Weber Ave R N 360 0.07 F4N West Ave R N 500 0.09 F4W Olive Ave G N 625 0.12 F4Belmont Ave G N 630 0.12 F4H Street/N Weber Ave R N 1,200 0.23 F4N Wesley Ave R N 470 0.09 F4Neilson Ave R N 300 0.06 F4Stainislaus St G N 780 0.15 F4Tuolumne St G N 780 0.15 F4Fresno St G N F4G Street at Fresno Street G N 160 0.03 F4Tulare St (overpass option) G N 780 0.15 F4Tulare St (underpass option) G N F4G Street at Tulare St (underpass option only) G N 160 0.03Ventura St G N 830 0.16 F4Golden State Blvd Ramps N F4SR41 N F4Bullard Ave N Y 3,200 0.61 Coordination MeetingVeterans Blvd N Y 2,550 0.48 450 0.09 Coordination MeetingGolden State Blvd R Y 2,500 0.47 Coordination Meeting
Total Feet 80,530 15.25 7,495 1.42Total Number of Overpasses 12
Structures (< 1 Mile) 13 2 RTP-relatedRoadways < 1 Mile 26 4 RTP-related
Roadways < 2.5 Miles 1 1 RTP-relatedRoadways > 2.5 Miles 1
Madera CountyHemlock Road G N 300 0.06 BNSF (Hybrid)Road 10 G N 330 0.06 BNSF (Hybrid)Road 13 G N 220 0.04 BNSF (Hybrid)Road 14 G N 215 0.04 BNSF (Hybrid)Roberts Blvd G N 240 0.05 BNSF (Hybrid)Road 15 G N 415 0.08 BNSF (Hybrid)Road 16 G N 440 0.08 BNSF (Hybrid)Ave 23 1/2 G N 445 0.08 BNSF (Hybrid)Road 22 G N 240 0.05 BNSF (Hybrid)Road 24 G N 290 0.05 BNSF (Hybrid)Ave 20 1/2 G N 225 0.04 BNSF (Hybrid)Ave 20 G N 255 0.05 BNSF (Hybrid)Road 26 G N BNSF (Hybrid)Hanover Dr parallel to tracks R N 2,195 0.42 BNSF (Hybrid)Lake St G N BNSF (Hybrid)Ave 17 G N 460 0.09 BNSF (Hybrid)Raymond Rd G N 325 0.06 BNSF (Hybrid)SR 145 G N BNSF (Hybrid)Road 29 Ave 15 1/2 G N 595 0.11 BNSF (Hybrid)Access Road 29 R N 1,450 0.27 BNSF (Hybrid)Access Road R N 1,000 0.19 BNSF (Hybrid)Ave 15 G N 465 0.09 BNSF (Hybrid)Ave 13 G N 620 0.12 BNSF (Hybrid)Road South of Ave 13 G N 5,150 0.98 BNSF (Hybrid)Ave 12 G N 230 0.04 BNSF (Hybrid)Ave 11 G N 220 0.04 BNSF (Hybrid)Ave 10 G N 250 0.05 BNSF (Hybrid)Ave 9 G N 250 0.05 BNSF (Hybrid)Ave 8 G N 650 0.12 BNSF (Hybrid)Road 33 R N 3,000 0.57 BNSF (Hybrid)Avenue 24 R N 4,186 0.79 A2-HybridRoad 10 G N 365 0.07 A2-Hybrid
Road Name
Roadway Realignment Length
Structure Length Associated
Alternative
Included in Regional
Transportation Plan (Y/N)
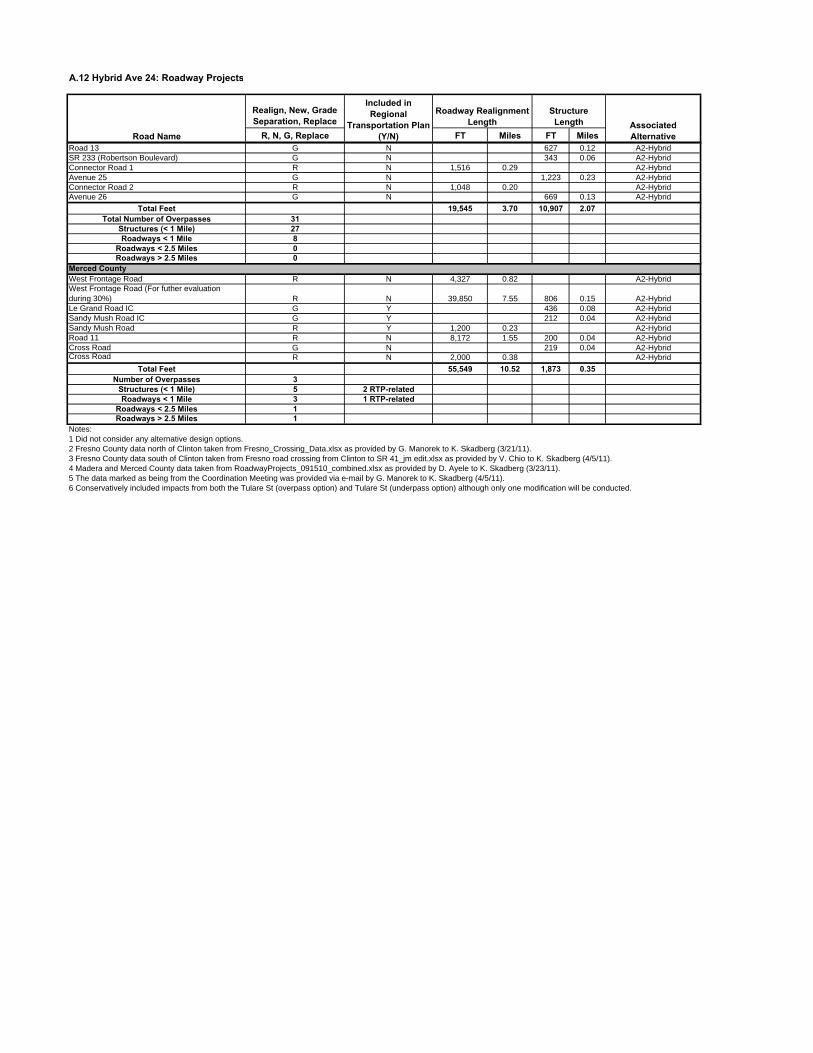
A.12 Hybrid Ave 24: Roadway Projects
Realign, New, Grade Separation, Replace
R, N, G, Replace FT Miles FT MilesRoad Name
Roadway Realignment Length
Structure Length Associated
Alternative
Included in Regional
Transportation Plan (Y/N)
Road 13 G N 627 0.12 A2-HybridSR 233 (Robertson Boulevard) G N 343 0.06 A2-HybridConnector Road 1 R N 1,516 0.29 A2-HybridAvenue 25 G N 1,223 0.23 A2-HybridConnector Road 2 R N 1,048 0.20 A2-HybridAvenue 26 G N 669 0.13 A2-Hybrid
Total Feet 19,545 3.70 10,907 2.07Total Number of Overpasses 31
Structures (< 1 Mile) 27Roadways < 1 Mile 8
Roadways < 2.5 Miles 0Roadways > 2.5 Miles 0
Merced CountyWest Frontage Road R N 4,327 0.82 A2-HybridWest Frontage Road (For futher evaluation during 30%) R N 39,850 7.55 806 0.15 A2-HybridLe Grand Road IC G Y 436 0.08 A2-HybridSandy Mush Road IC G Y 212 0.04 A2-HybridSandy Mush Road R Y 1,200 0.23 A2-HybridRoad 11 R N 8,172 1.55 200 0.04 A2-HybridCross Road G N 219 0.04 A2-HybridCross Road R N 2,000 0.38 A2-Hybrid
Total Feet 55,549 10.52 1,873 0.35Number of Overpasses 3
Structures (< 1 Mile) 5 2 RTP-relatedRoadways < 1 Mile 3 1 RTP-related
Roadways < 2.5 Miles 1Roadways > 2.5 Miles 1
Notes:1 Did not consider any alternative design options.2 Fresno County data north of Clinton taken from Fresno_Crossing_Data.xlsx as provided by G. Manorek to K. Skadberg (3/21/11).3 Fresno County data south of Clinton taken from Fresno road crossing from Clinton to SR 41_jm edit.xlsx as provided by V. Chio to K. Skadberg (4/5/11).4 Madera and Merced County data taken from RoadwayProjects_091510_combined.xlsx as provided by D. Ayele to K. Skadberg (3/23/11).5 The data marked as being from the Coordination Meeting was provided via e-mail by G. Manorek to K. Skadberg (4/5/11).6 Conservatively included impacts from both the Tulare St (overpass option) and Tulare St (underpass option) although only one modification will be conducted.
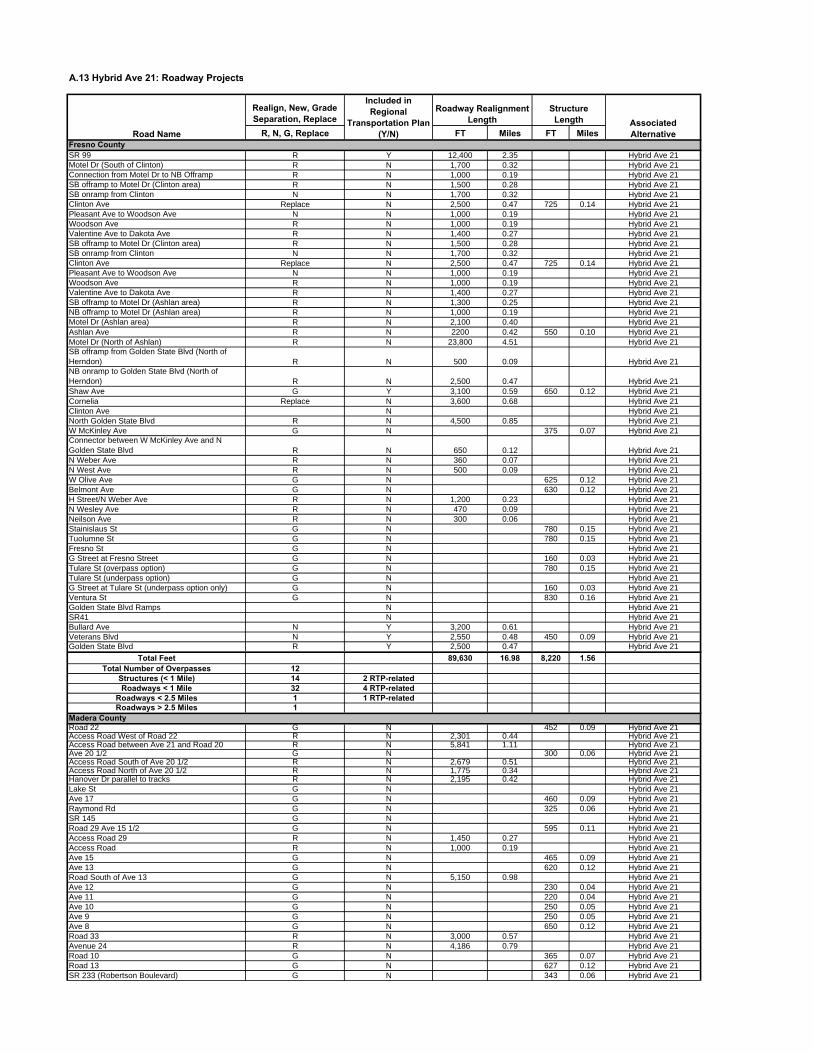
A.13 Hybrid Ave 21: Roadway Projects
Realign, New, Grade Separation, Replace
R, N, G, Replace FT Miles FT MilesFresno CountySR 99 R Y 12,400 2.35 Hybrid Ave 21Motel Dr (South of Clinton) R N 1,700 0.32 Hybrid Ave 21Connection from Motel Dr to NB Offramp R N 1,000 0.19 Hybrid Ave 21SB offramp to Motel Dr (Clinton area) R N 1,500 0.28 Hybrid Ave 21SB onramp from Clinton N N 1,700 0.32 Hybrid Ave 21Clinton Ave Replace N 2,500 0.47 725 0.14 Hybrid Ave 21Pleasant Ave to Woodson Ave N N 1,000 0.19 Hybrid Ave 21Woodson Ave R N 1,000 0.19 Hybrid Ave 21Valentine Ave to Dakota Ave R N 1,400 0.27 Hybrid Ave 21SB offramp to Motel Dr (Clinton area) R N 1,500 0.28 Hybrid Ave 21SB onramp from Clinton N N 1,700 0.32 Hybrid Ave 21Clinton Ave Replace N 2,500 0.47 725 0.14 Hybrid Ave 21Pleasant Ave to Woodson Ave N N 1,000 0.19 Hybrid Ave 21Woodson Ave R N 1,000 0.19 Hybrid Ave 21Valentine Ave to Dakota Ave R N 1,400 0.27 Hybrid Ave 21SB offramp to Motel Dr (Ashlan area) R N 1,300 0.25 Hybrid Ave 21NB offramp to Motel Dr (Ashlan area) R N 1,000 0.19 Hybrid Ave 21Motel Dr (Ashlan area) R N 2,100 0.40 Hybrid Ave 21Ashlan Ave R N 2200 0.42 550 0.10 Hybrid Ave 21Motel Dr (North of Ashlan) R N 23,800 4.51 Hybrid Ave 21SB offramp from Golden State Blvd (North of Herndon) R N 500 0.09 Hybrid Ave 21NB onramp to Golden State Blvd (North of Herndon) R N 2,500 0.47 Hybrid Ave 21Shaw Ave G Y 3,100 0.59 650 0.12 Hybrid Ave 21Cornelia Replace N 3,600 0.68 Hybrid Ave 21Clinton Ave N Hybrid Ave 21North Golden State Blvd R N 4,500 0.85 Hybrid Ave 21W McKinley Ave G N 375 0.07 Hybrid Ave 21Connector between W McKinley Ave and N Golden State Blvd R N 650 0.12 Hybrid Ave 21N Weber Ave R N 360 0.07 Hybrid Ave 21N West Ave R N 500 0.09 Hybrid Ave 21W Olive Ave G N 625 0.12 Hybrid Ave 21Belmont Ave G N 630 0.12 Hybrid Ave 21H Street/N Weber Ave R N 1,200 0.23 Hybrid Ave 21N Wesley Ave R N 470 0.09 Hybrid Ave 21Neilson Ave R N 300 0.06 Hybrid Ave 21Stainislaus St G N 780 0.15 Hybrid Ave 21Tuolumne St G N 780 0.15 Hybrid Ave 21Fresno St G N Hybrid Ave 21G Street at Fresno Street G N 160 0.03 Hybrid Ave 21Tulare St (overpass option) G N 780 0.15 Hybrid Ave 21Tulare St (underpass option) G N Hybrid Ave 21G Street at Tulare St (underpass option only) G N 160 0.03 Hybrid Ave 21Ventura St G N 830 0.16 Hybrid Ave 21Golden State Blvd Ramps N Hybrid Ave 21SR41 N Hybrid Ave 21Bullard Ave N Y 3,200 0.61 Hybrid Ave 21Veterans Blvd N Y 2,550 0.48 450 0.09 Hybrid Ave 21Golden State Blvd R Y 2,500 0.47 Hybrid Ave 21
Total Feet 89,630 16.98 8,220 1.56Total Number of Overpasses 12
Structures (< 1 Mile) 14 2 RTP-relatedRoadways < 1 Mile 32 4 RTP-related
Roadways < 2.5 Miles 1 1 RTP-relatedRoadways > 2.5 Miles 1
Madera CountyRoad 22 G N 452 0.09 Hybrid Ave 21Access Road West of Road 22 R N 2,301 0.44 Hybrid Ave 21Access Road between Ave 21 and Road 20 R N 5,841 1.11 Hybrid Ave 21Ave 20 1/2 G N 300 0.06 Hybrid Ave 21Access Road South of Ave 20 1/2 R N 2,679 0.51 Hybrid Ave 21Access Road North of Ave 20 1/2 R N 1,775 0.34 Hybrid Ave 21Hanover Dr parallel to tracks R N 2,195 0.42 Hybrid Ave 21Lake St G N Hybrid Ave 21Ave 17 G N 460 0.09 Hybrid Ave 21Raymond Rd G N 325 0.06 Hybrid Ave 21SR 145 G N Hybrid Ave 21Road 29 Ave 15 1/2 G N 595 0.11 Hybrid Ave 21Access Road 29 R N 1,450 0.27 Hybrid Ave 21Access Road R N 1,000 0.19 Hybrid Ave 21Ave 15 G N 465 0.09 Hybrid Ave 21Ave 13 G N 620 0.12 Hybrid Ave 21Road South of Ave 13 G N 5,150 0.98 Hybrid Ave 21Ave 12 G N 230 0.04 Hybrid Ave 21Ave 11 G N 220 0.04 Hybrid Ave 21Ave 10 G N 250 0.05 Hybrid Ave 21Ave 9 G N 250 0.05 Hybrid Ave 21Ave 8 G N 650 0.12 Hybrid Ave 21Road 33 R N 3,000 0.57 Hybrid Ave 21Avenue 24 R N 4,186 0.79 Hybrid Ave 21Road 10 G N 365 0.07 Hybrid Ave 21Road 13 G N 627 0.12 Hybrid Ave 21SR 233 (Robertson Boulevard) G N 343 0.06 Hybrid Ave 21
Road Name
Included in Regional
Transportation Plan (Y/N)
Roadway Realignment Length
Structure Length Associated
Alternative
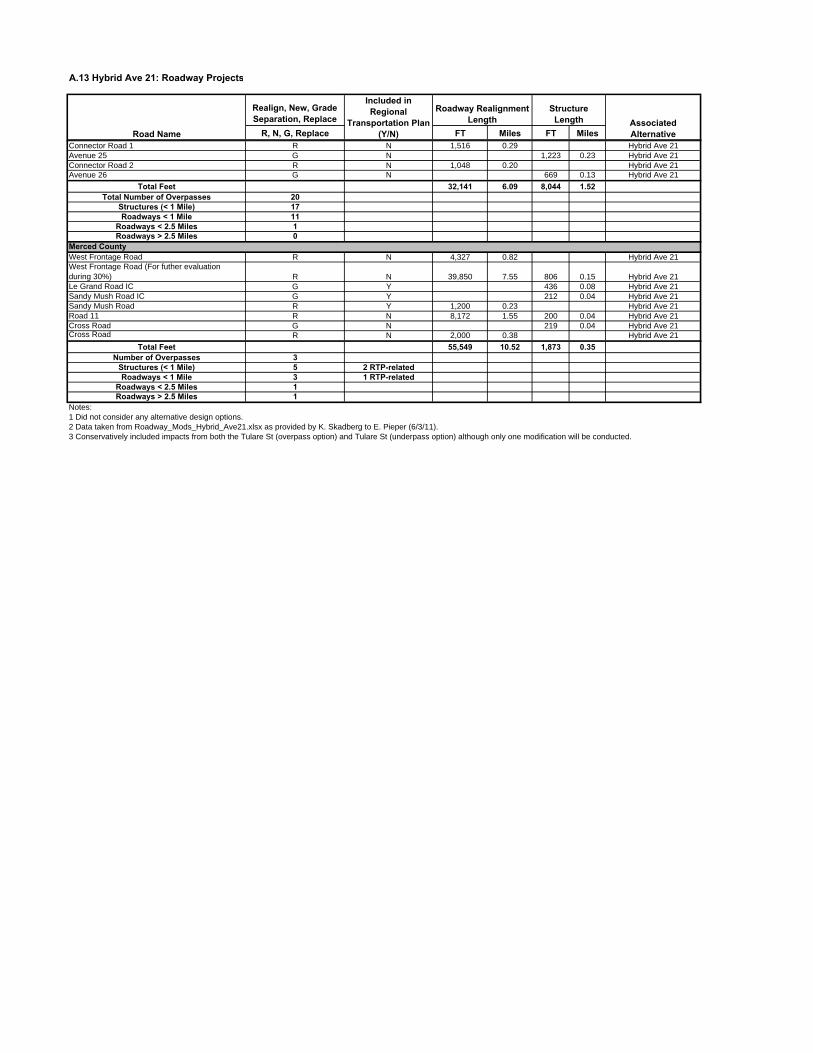
A.13 Hybrid Ave 21: Roadway Projects
Realign, New, Grade Separation, Replace
R, N, G, Replace FT Miles FT MilesRoad Name
Included in Regional
Transportation Plan (Y/N)
Roadway Realignment Length
Structure Length Associated
AlternativeConnector Road 1 R N 1,516 0.29 Hybrid Ave 21Avenue 25 G N 1,223 0.23 Hybrid Ave 21Connector Road 2 R N 1,048 0.20 Hybrid Ave 21Avenue 26 G N 669 0.13 Hybrid Ave 21
Total Feet 32,141 6.09 8,044 1.52Total Number of Overpasses 20
Structures (< 1 Mile) 17Roadways < 1 Mile 11
Roadways < 2.5 Miles 1Roadways > 2.5 Miles 0
Merced CountyWest Frontage Road R N 4,327 0.82 Hybrid Ave 21West Frontage Road (For futher evaluation during 30%) R N 39,850 7.55 806 0.15 Hybrid Ave 21Le Grand Road IC G Y 436 0.08 Hybrid Ave 21Sandy Mush Road IC G Y 212 0.04 Hybrid Ave 21Sandy Mush Road R Y 1,200 0.23 Hybrid Ave 21Road 11 R N 8,172 1.55 200 0.04 Hybrid Ave 21Cross Road G N 219 0.04 Hybrid Ave 21Cross Road R N 2,000 0.38 Hybrid Ave 21
Total Feet 55,549 10.52 1,873 0.35Number of Overpasses 3
Structures (< 1 Mile) 5 2 RTP-relatedRoadways < 1 Mile 3 1 RTP-related
Roadways < 2.5 Miles 1Roadways > 2.5 Miles 1
Notes:1 Did not consider any alternative design options.2 Data taken from Roadway_Mods_Hybrid_Ave21.xlsx as provided by K. Skadberg to E. Pieper (6/3/11).3 Conservatively included impacts from both the Tulare St (overpass option) and Tulare St (underpass option) although only one modification will be conducted.
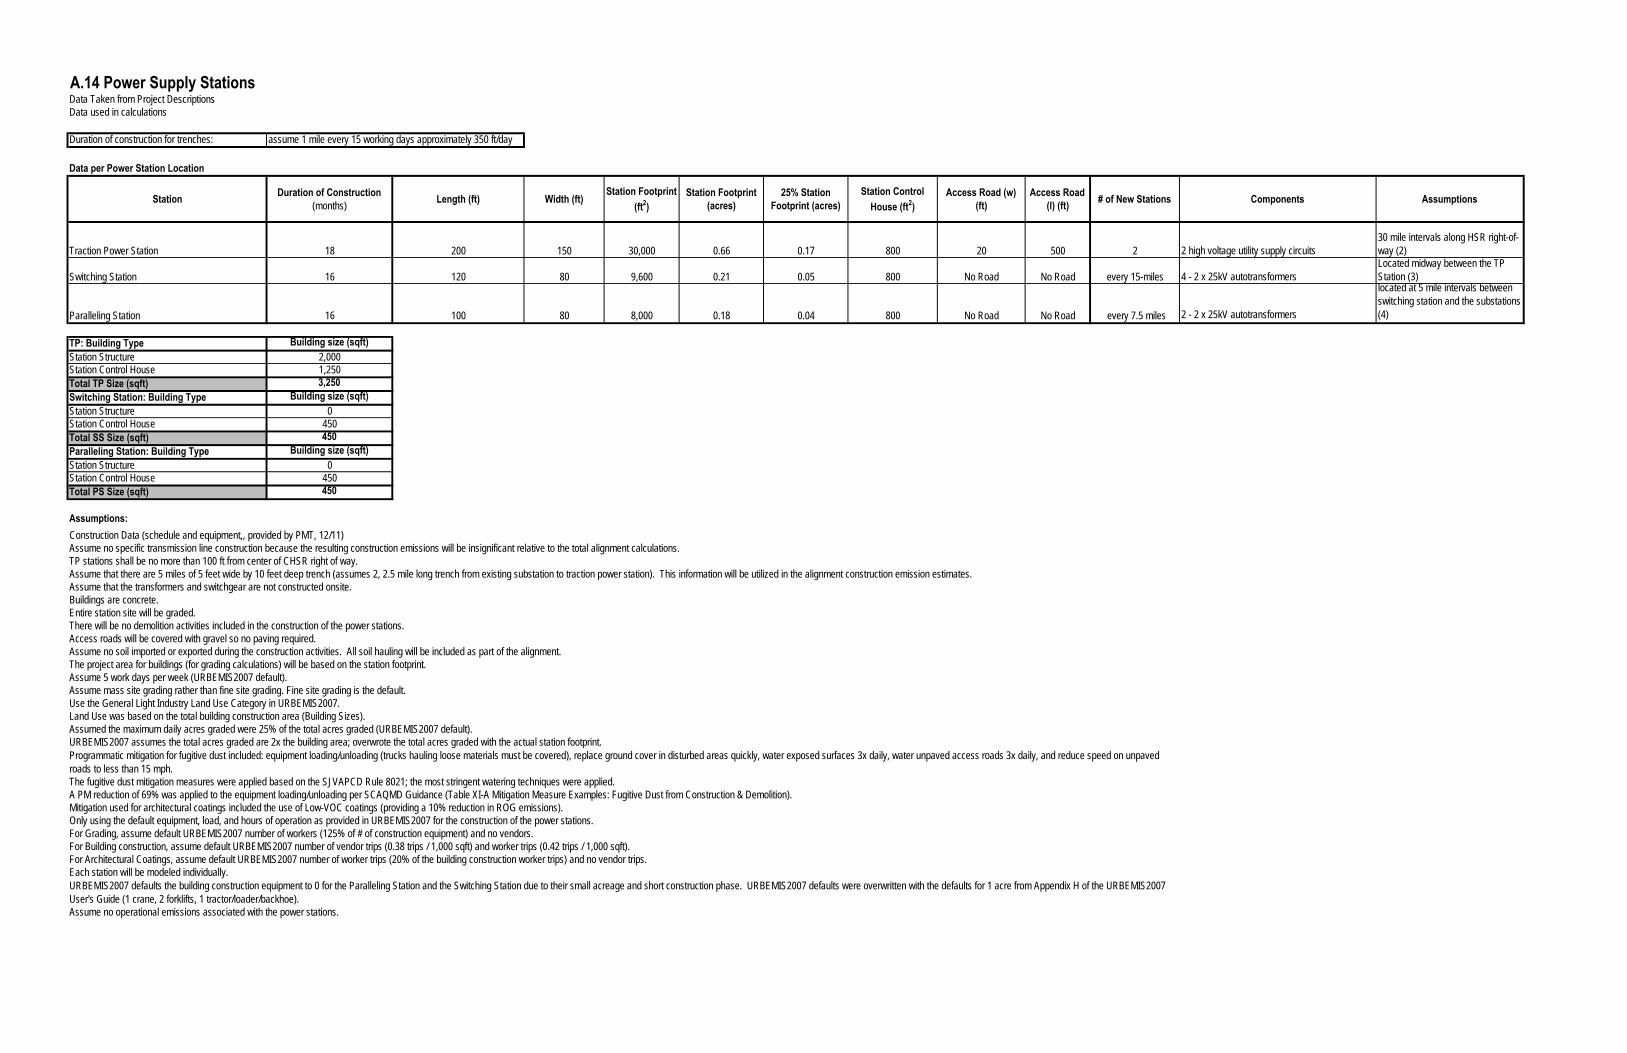
A.14 Power Supply StationsData Taken from Project DescriptionsData used in calculations
Duration of construction for trenches: assume 1 mile every 15 working days approximately 350 ft/day
Station Duration of Construction (months) Length (ft) Width (ft)
Station Footprint (ft2)
Station Footprint (acres)
25% Station Footprint (acres)
Station Control House (ft2)
Access Road (w) (ft)
Access Road (l) (ft) # of New Stations Components Assumptions
Traction Power Station 18 200 150 30,000 0.66 0.17 800 20 500 2 2 high voltage utility supply circuits30 mile intervals along HSR right-of-way (2)
Switching Station 16 120 80 9,600 0.21 0.05 800 No Road No Road every 15-miles 4 - 2 x 25kV autotransformersLocated midway between the TP Station (3)
Paralleling Station 16 100 80 8,000 0.18 0.04 800 No Road No Road every 7.5 miles 2 - 2 x 25kV autotransformers
located at 5 mile intervals between switching station and the substations (4)
TP: Building Type Building size (sqft)Station Structure 2,000Station Control House 1,250Total TP Size (sqft) 3,250Switching Station: Building Type Building size (sqft)Station Structure 0Station Control House 450Total SS Size (sqft) 450Paralleling Station: Building Type Building size (sqft)Station Structure 0Station Control House 450Total PS Size (sqft) 450
Assumptions:
Assume no specific transmission line construction because the resulting construction emissions will be insignificant relative to the total alignment calculations.TP stations shall be no more than 100 ft from center of CHSR right of way.Assume that there are 5 miles of 5 feet wide by 10 feet deep trench (assumes 2, 2.5 mile long trench from existing substation to traction power station). This information will be utilized in the alignment construction emission estimates.Assume that the transformers and switchgear are not constructed onsite.Buildings are concrete.Entire station site will be graded.There will be no demolition activities included in the construction of the power stations.Access roads will be covered with gravel so no paving required.Assume no soil imported or exported during the construction activities. All soil hauling will be included as part of the alignment.The project area for buildings (for grading calculations) will be based on the station footprint.Assume 5 work days per week (URBEMIS2007 default).Assume mass site grading rather than fine site grading. Fine site grading is the default.Use the General Light Industry Land Use Category in URBEMIS2007.Land Use was based on the total building construction area (Building Sizes).Assumed the maximum daily acres graded were 25% of the total acres graded (URBEMIS2007 default).URBEMIS2007 assumes the total acres graded are 2x the building area; overwrote the total acres graded with the actual station footprint.
The fugitive dust mitigation measures were applied based on the SJVAPCD Rule 8021; the most stringent watering techniques were applied.A PM reduction of 69% was applied to the equipment loading/unloading per SCAQMD Guidance (Table XI-A Mitigation Measure Examples: Fugitive Dust from Construction & Demolition).Mitigation used for architectural coatings included the use of Low-VOC coatings (providing a 10% reduction in ROG emissions).Only using the default equipment, load, and hours of operation as provided in URBEMIS2007 for the construction of the power stations.For Grading, assume default URBEMIS2007 number of workers (125% of # of construction equipment) and no vendors.For Building construction, assume default URBEMIS2007 number of vendor trips (0.38 trips / 1,000 sqft) and worker trips (0.42 trips / 1,000 sqft).For Architectural Coatings, assume default URBEMIS2007 number of worker trips (20% of the building construction worker trips) and no vendor trips.Each station will be modeled individually.
Assume no operational emissions associated with the power stations.
Data per Power Station Location
Programmatic mitigation for fugitive dust included: equipment loading/unloading (trucks hauling loose materials must be covered), replace ground cover in disturbed areas quickly, water exposed surfaces 3x daily, water unpaved access roads 3x daily, and reduce speed on unpaved roads to less than 15 mph.
URBEMIS2007 defaults the building construction equipment to 0 for the Paralleling Station and the Switching Station due to their small acreage and short construction phase. URBEMIS2007 defaults were overwritten with the defaults for 1 acre from Appendix H of the URBEMIS2007 User's Guide (1 crane, 2 forklifts, 1 tractor/loader/backhoe).
Construction Data (schedule and equipment,, provided by PMT, 12/11)

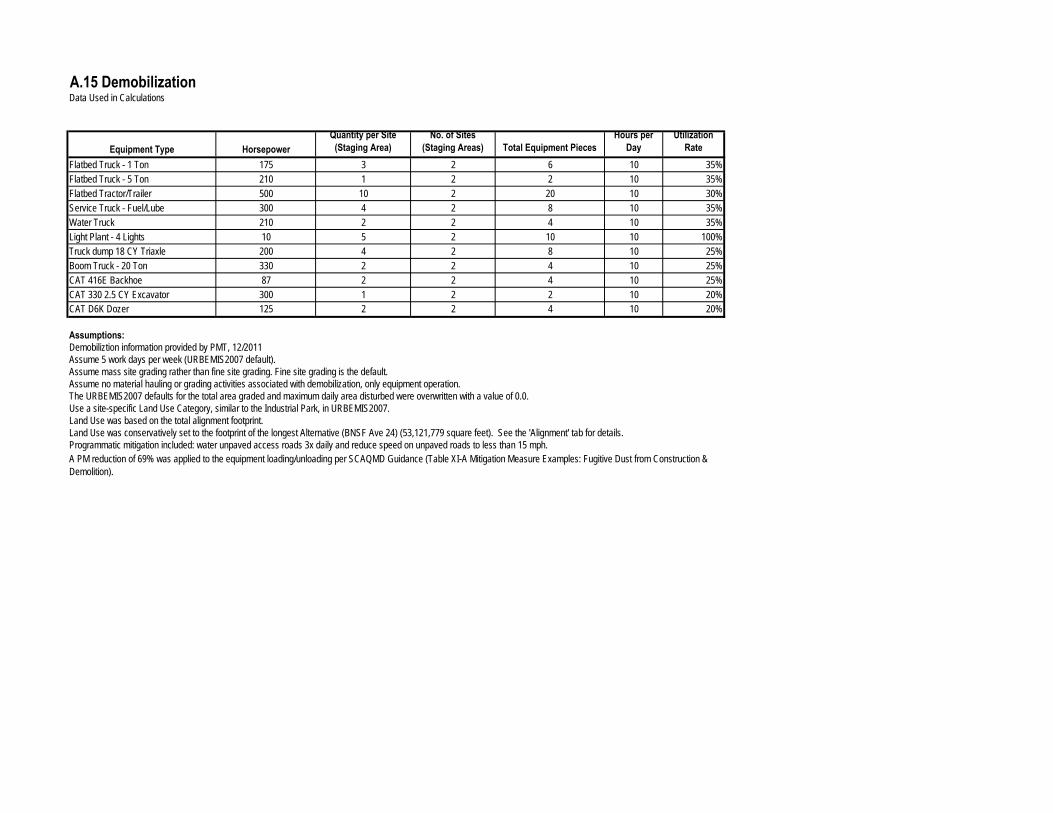
A.15 DemobilizationData Used in Calculations
Equipment Type HorsepowerQuantity per Site
(Staging Area)No. of Sites
(Staging Areas) Total Equipment PiecesHours per
DayUtilization
RateFlatbed Truck - 1 Ton 175 3 2 6 10 35%Flatbed Truck - 5 Ton 210 1 2 2 10 35%Flatbed Tractor/Trailer 500 10 2 20 10 30%Service Truck - Fuel/Lube 300 4 2 8 10 35%Water Truck 210 2 2 4 10 35%Light Plant - 4 Lights 10 5 2 10 10 100%Truck dump 18 CY Triaxle 200 4 2 8 10 25%Boom Truck - 20 Ton 330 2 2 4 10 25%CAT 416E Backhoe 87 2 2 4 10 25%CAT 330 2.5 CY Excavator 300 1 2 2 10 20%CAT D6K Dozer 125 2 2 4 10 20%
Assumptions:Demobiliztion information provided by PMT, 12/2011Assume 5 work days per week (URBEMIS2007 default).Assume mass site grading rather than fine site grading. Fine site grading is the default.Assume no material hauling or grading activities associated with demobilization, only equipment operation.The URBEMIS2007 defaults for the total area graded and maximum daily area disturbed were overwritten with a value of 0.0.Use a site-specific Land Use Category, similar to the Industrial Park, in URBEMIS2007.Land Use was based on the total alignment footprint.Land Use was conservatively set to the footprint of the longest Alternative (BNSF Ave 24) (53,121,779 square feet). See the 'Alignment' tab for details.Programmatic mitigation included: water unpaved access roads 3x daily and reduce speed on unpaved roads to less than 15 mph.A PM reduction of 69% was applied to the equipment loading/unloading per SCAQMD Guidance (Table XI-A Mitigation Measure Examples: Fugitive Dust from Construction & Demolition).

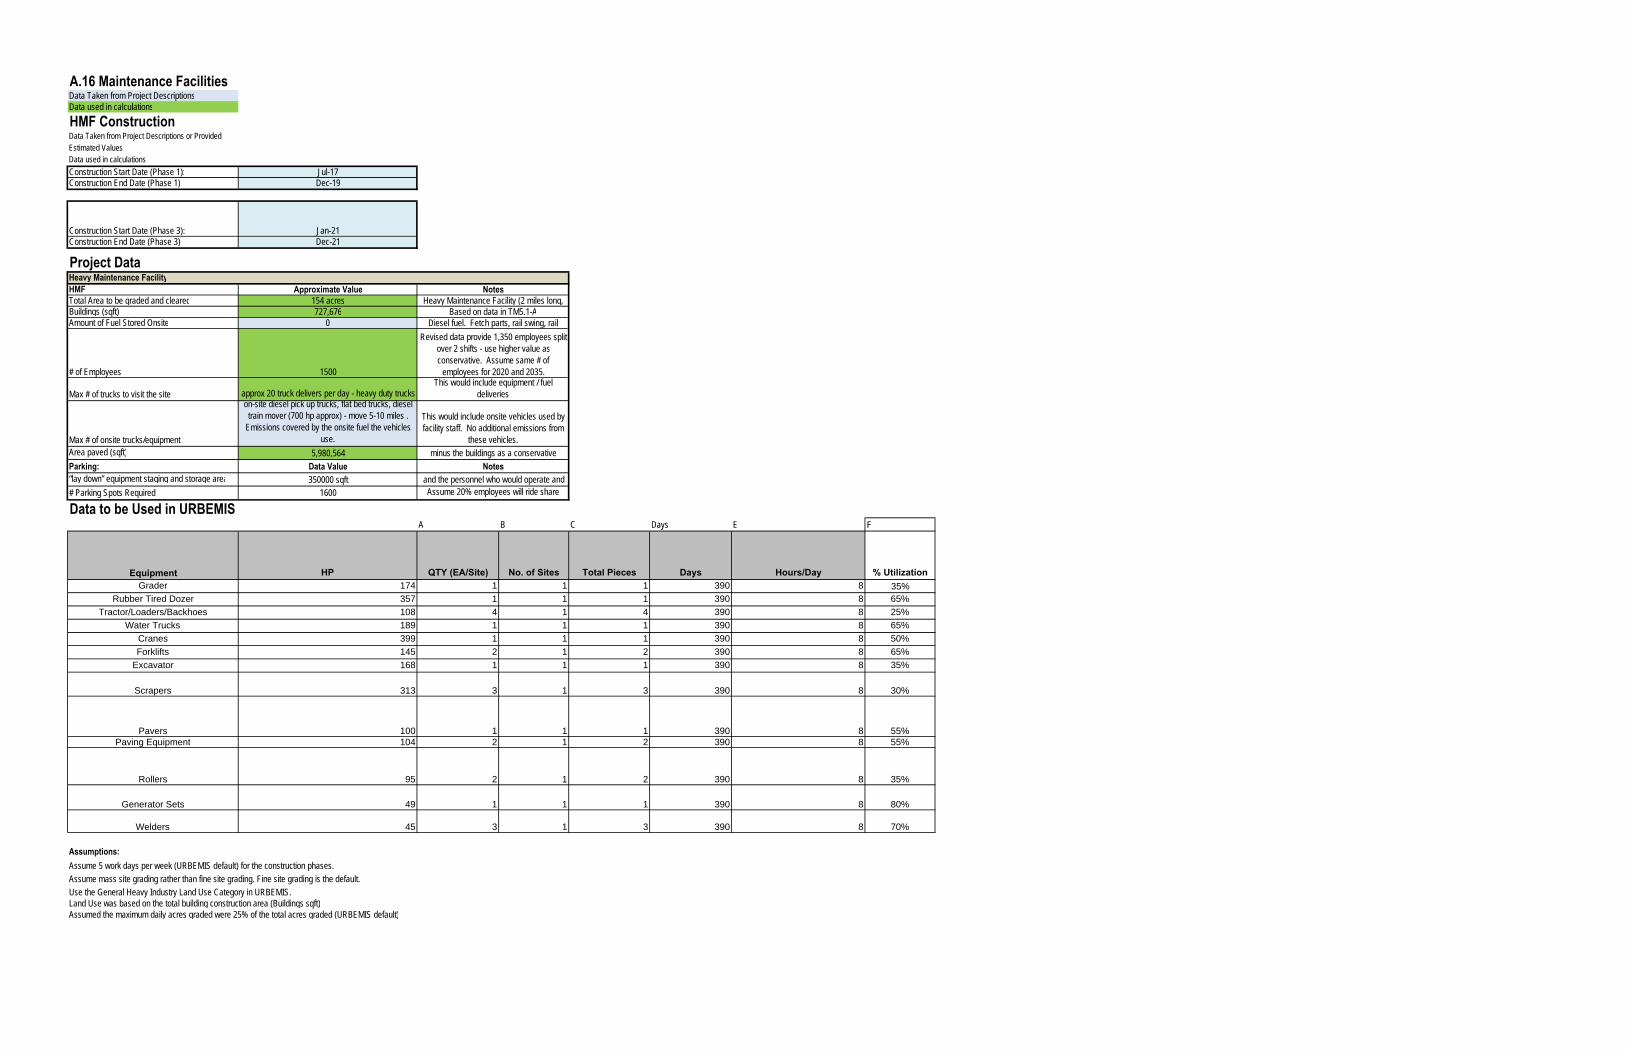
A.16 Maintenance FacilitiesData Taken from Project DescriptionsData used in calculations
HMF ConstructionData Taken from Project Descriptions or ProvidedEstimated ValuesData used in calculationsConstruction Start Date (Phase 1): Jul-17Construction End Date (Phase 1): Dec-19
Construction Start Date (Phase 3): Jan-21Construction End Date (Phase 3): Dec-21
Project DataHeavy Maintenance FacilityHMF Approximate ValueTotal Area to be graded and cleared 154 acresBuildings (sqft) 727,676Amount of Fuel Stored Onsite 0
# of Employees 1500
Max # of trucks to visit the site approx 20 truck delivers per day - heavy duty trucks
Max # of onsite trucks/equipment
on-site diesel pick up trucks, flat bed trucks, diesel train mover (700 hp approx) - move 5-10 miles .
Emissions covered by the onsite fuel the vehicles use.
Area paved (sqft) 5,980,564Parking: Data Value“lay down” equipment staging and storage area 350000 sqft# Parking Spots Required 1600
Data to be Used in URBEMISA B C Days E F
Equipment HP QTY (EA/Site) No. of Sites Total Pieces Days Hours/Day % UtilizationGrader 174 1 1 1 390 8 35%
Rubber Tired Dozer 357 1 1 1 390 8 65%
Tractor/Loaders/Backhoes 108 4 1 4 390 8 25%
Water Trucks 189 1 1 1 390 8 65%
Cranes 399 1 1 1 390 8 50%
Forklifts 145 2 1 2 390 8 65%
Excavator 168 1 1 1 390 8 35%
Scrapers 313 3 1 3 390 8 30%
Pavers 100 1 1 1 390 8 55%Paving Equipment 104 2 1 2 390 8 55%
Rollers 95 2 1 2 390 8 35%
Generator Sets 49 1 1 1 390 8 80%
Welders 45 3 1 3 390 8 70%
Assumptions:Assume 5 work days per week (URBEMIS default) for the construction phases.Assume mass site grading rather than fine site grading. Fine site grading is the default.Use the General Heavy Industry Land Use Category in URBEMIS.Land Use was based on the total building construction area (Buildings sqft)Assumed the maximum daily acres graded were 25% of the total acres graded (URBEMIS default)
Assume 20% employees will ride share
This would include onsite vehicles used by facility staff. No additional emissions from
these vehicles.minus the buildings as a conservative
Notes
Notesand the personnel who would operate and
Heavy Maintenance Facility (2 miles long, Based on data in TM5.1-A
Diesel fuel. Fetch parts, rail swing, rail Revised data provide 1,350 employees split
over 2 shifts - use higher value as conservative. Assume same # of
employees for 2020 and 2035.This would include equipment / fuel
deliveries
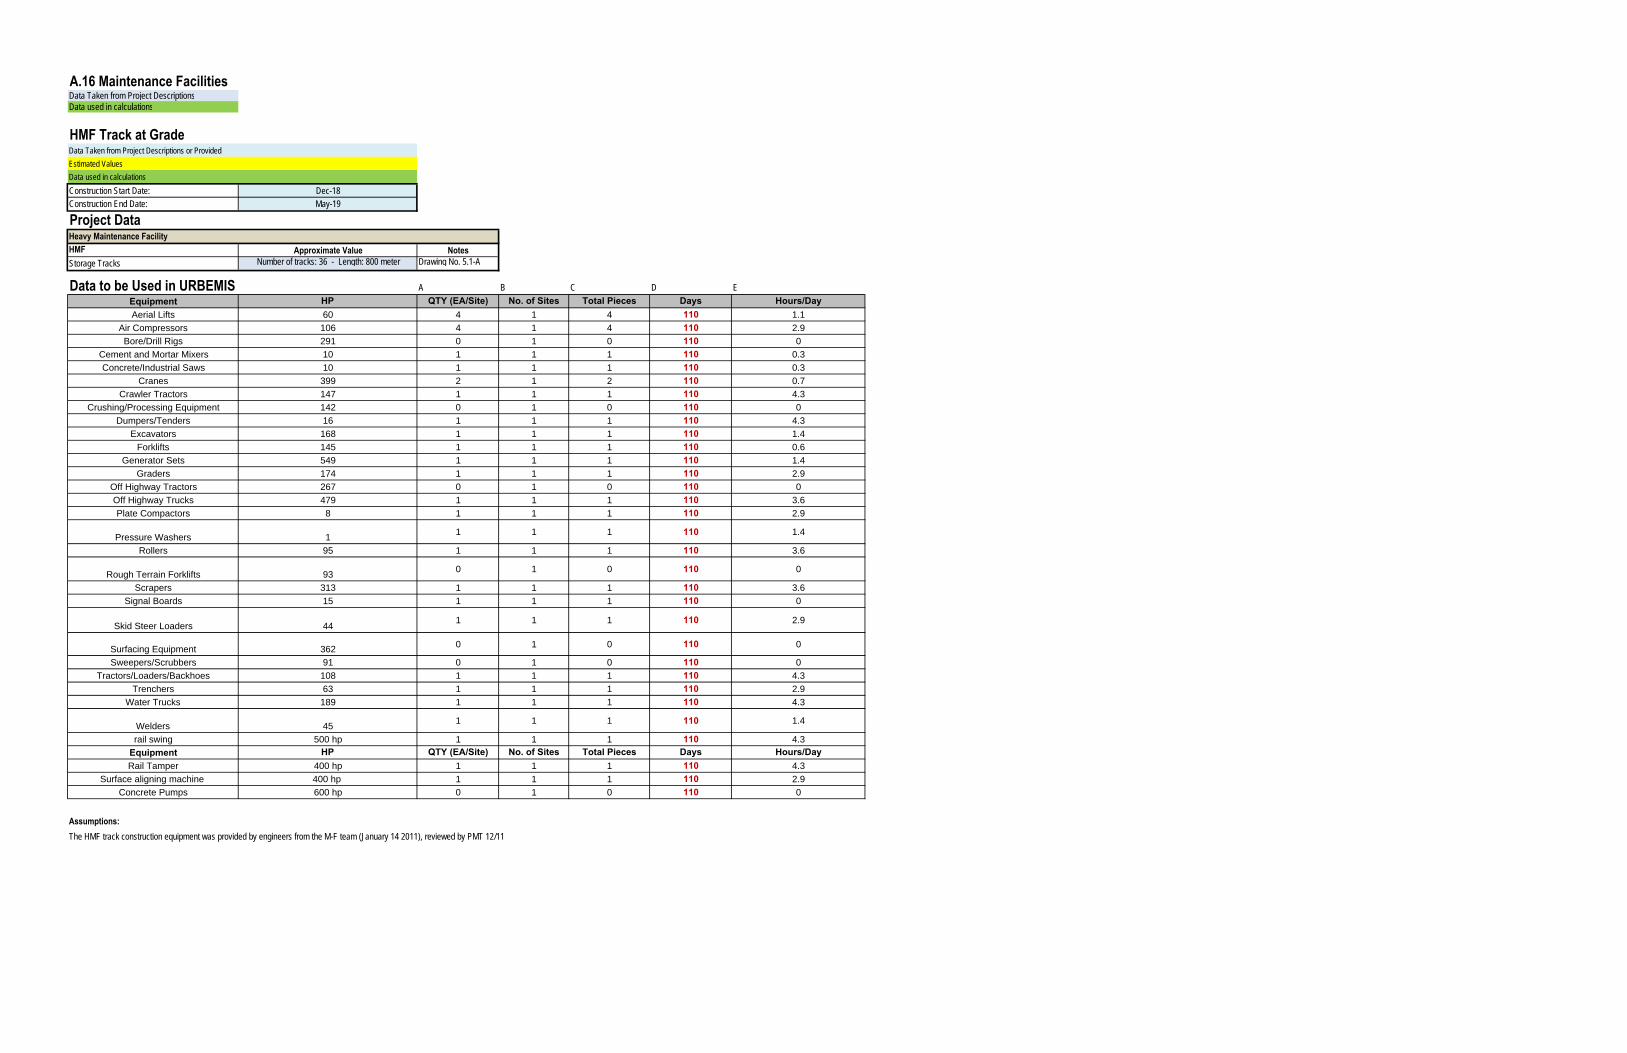
A.16 Maintenance FacilitiesData Taken from Project DescriptionsData used in calculations
HMF Track at GradeData Taken from Project Descriptions or ProvidedEstimated ValuesData used in calculationsConstruction Start Date: Dec-18Construction End Date: May-19
Project DataHeavy Maintenance FacilityHMF Approximate Value NotesStorage Tracks Number of tracks: 36 - Length: 800 meter Drawing No. 5.1-A
Data to be Used in URBEMIS A B C D EEquipment HP QTY (EA/Site) No. of Sites Total Pieces Days Hours/DayAerial Lifts 60 4 1 4 110 1.1
Air Compressors 106 4 1 4 110 2.9
Bore/Drill Rigs 291 0 1 0 110 0
Cement and Mortar Mixers 10 1 1 1 110 0.3
Concrete/Industrial Saws 10 1 1 1 110 0.3
Cranes 399 2 1 2 110 0.7
Crawler Tractors 147 1 1 1 110 4.3
Crushing/Processing Equipment 142 0 1 0 110 0
Dumpers/Tenders 16 1 1 1 110 4.3
Excavators 168 1 1 1 110 1.4
Forklifts 145 1 1 1 110 0.6
Generator Sets 549 1 1 1 110 1.4
Graders 174 1 1 1 110 2.9
Off Highway Tractors 267 0 1 0 110 0
Off Highway Trucks 479 1 1 1 110 3.6
Plate Compactors 8 1 1 1 110 2.9
Pressure Washers 11 1 1 110 1.4
Rollers 95 1 1 1 110 3.6
Rough Terrain Forklifts 930 1 0 110 0
Scrapers 313 1 1 1 110 3.6
Signal Boards 15 1 1 1 110 0
Skid Steer Loaders 441 1 1 110 2.9
Surfacing Equipment 362 0 1 0 110 0
Sweepers/Scrubbers 91 0 1 0 110 0
Tractors/Loaders/Backhoes 108 1 1 1 110 4.3
Trenchers 63 1 1 1 110 2.9
Water Trucks 189 1 1 1 110 4.3
Welders 451 1 1 110 1.4
rail swing 500 hp 1 1 1 110 4.3
Equipment HP QTY (EA/Site) No. of Sites Total Pieces Days Hours/DayRail Tamper 400 hp 1 1 1 110 4.3
Surface aligning machine 400 hp 1 1 1 110 2.9
Concrete Pumps 600 hp 0 1 0 110 0
Assumptions:The HMF track construction equipment was provided by engineers from the M-F team (January 14 2011), reviewed by PMT 12/11
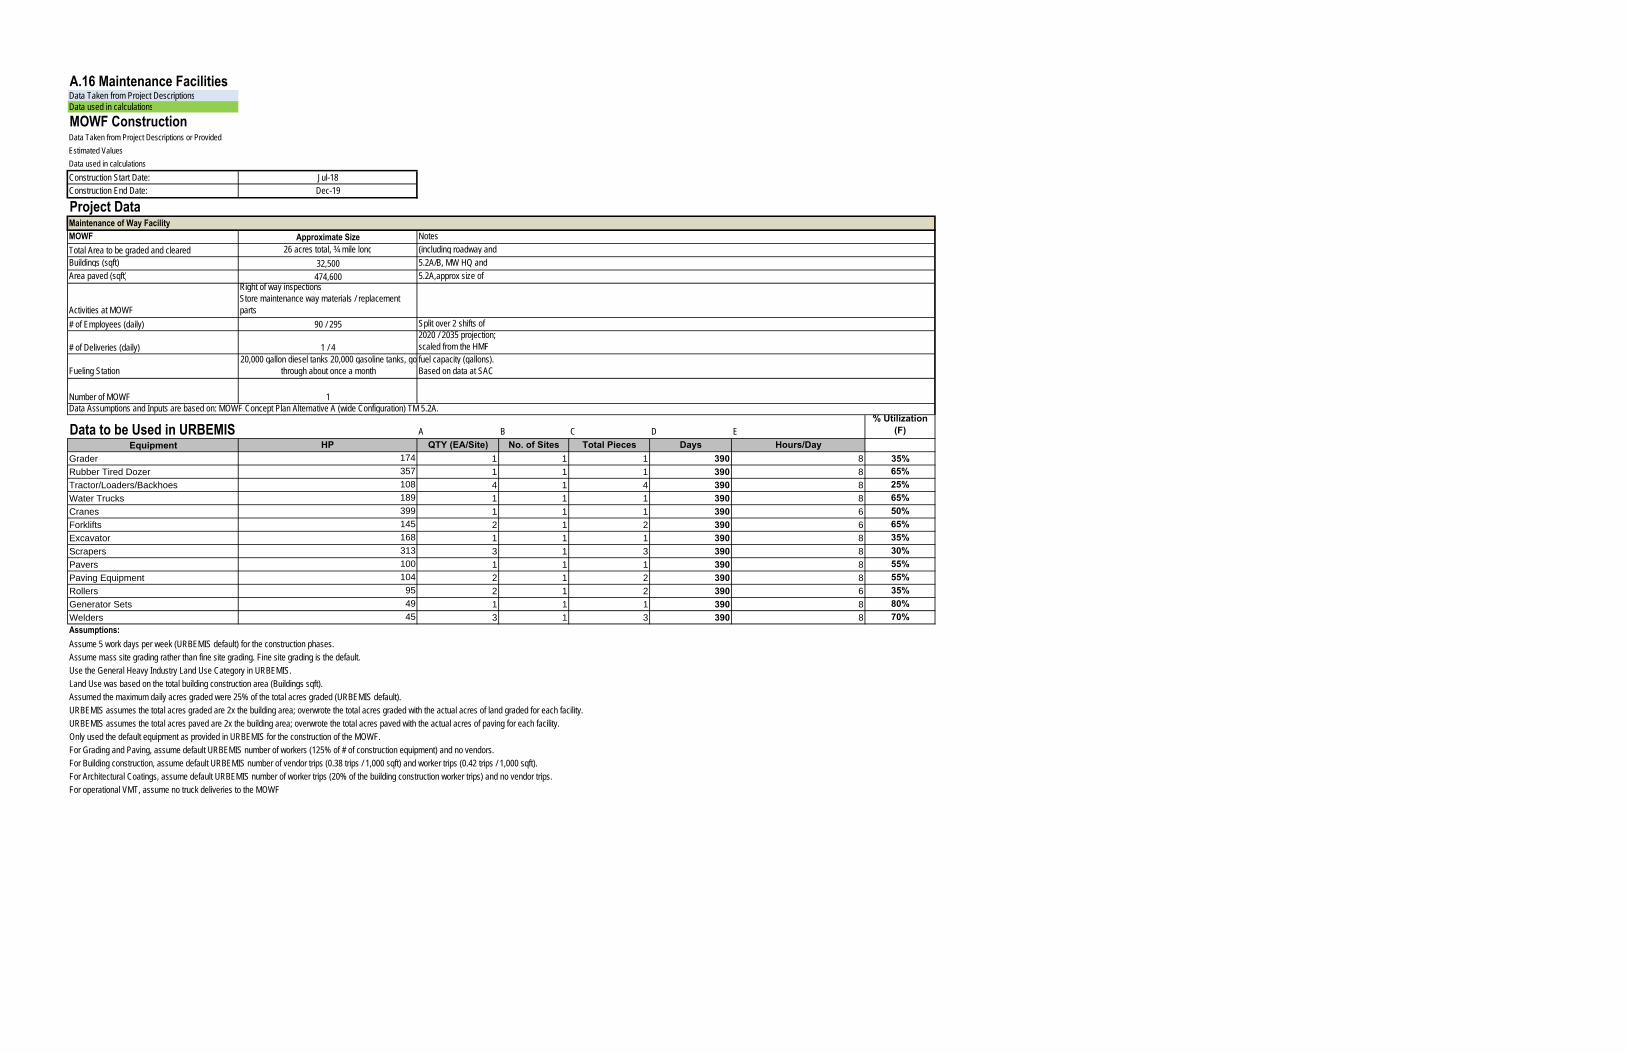
A.16 Maintenance FacilitiesData Taken from Project DescriptionsData used in calculations
MOWF ConstructionData Taken from Project Descriptions or ProvidedEstimated ValuesData used in calculationsConstruction Start Date: Jul-18Construction End Date: Dec-19
Project DataMaintenance of Way FacilityMOWF Approximate Size NotesTotal Area to be graded and cleared 26 acres total, ¾ mile long (including roadway and Buildings (sqft) 32,500 5.2A/B, MW HQ and Area paved (sqft) 474,600 5.2A,approx size of
Activities at MOWF
Right of way inspectionsStore maintenance way materials / replacement parts
# of Employees (daily) 90 / 295 Split over 2 shifts of
# of Deliveries (daily) 1 / 42020 / 2035 projection; scaled from the HMF
Fueling Station20,000 gallon diesel tanks 20,000 gasoline tanks, go
through about once a monthfuel capacity (gallons). Based on data at SAC
Number of MOWF 1Data Assumptions and Inputs are based on: MOWF Concept Plan Alternative A (wide Configuration) TM 5.2A.
Data to be Used in URBEMIS A B C D E% Utilization
(F)Equipment HP QTY (EA/Site) No. of Sites Total Pieces Days Hours/Day
Grader 174 1 1 1 390 8 35%Rubber Tired Dozer 357 1 1 1 390 8 65%Tractor/Loaders/Backhoes 108 4 1 4 390 8 25%Water Trucks 189 1 1 1 390 8 65%Cranes 399 1 1 1 390 6 50%Forklifts 145 2 1 2 390 6 65%Excavator 168 1 1 1 390 8 35%Scrapers 313 3 1 3 390 8 30%Pavers 100 1 1 1 390 8 55%Paving Equipment 104 2 1 2 390 8 55%Rollers 95 2 1 2 390 6 35%Generator Sets 49 1 1 1 390 8 80%Welders 45 3 1 3 390 8 70%Assumptions:Assume 5 work days per week (URBEMIS default) for the construction phases.Assume mass site grading rather than fine site grading. Fine site grading is the default.Use the General Heavy Industry Land Use Category in URBEMIS.Land Use was based on the total building construction area (Buildings sqft).Assumed the maximum daily acres graded were 25% of the total acres graded (URBEMIS default).URBEMIS assumes the total acres graded are 2x the building area; overwrote the total acres graded with the actual acres of land graded for each facility.URBEMIS assumes the total acres paved are 2x the building area; overwrote the total acres paved with the actual acres of paving for each facility.Only used the default equipment as provided in URBEMIS for the construction of the MOWF.For Grading and Paving, assume default URBEMIS number of workers (125% of # of construction equipment) and no vendors.For Building construction, assume default URBEMIS number of vendor trips (0.38 trips / 1,000 sqft) and worker trips (0.42 trips / 1,000 sqft).For Architectural Coatings, assume default URBEMIS number of worker trips (20% of the building construction worker trips) and no vendor trips.For operational VMT, assume no truck deliveries to the MOWF
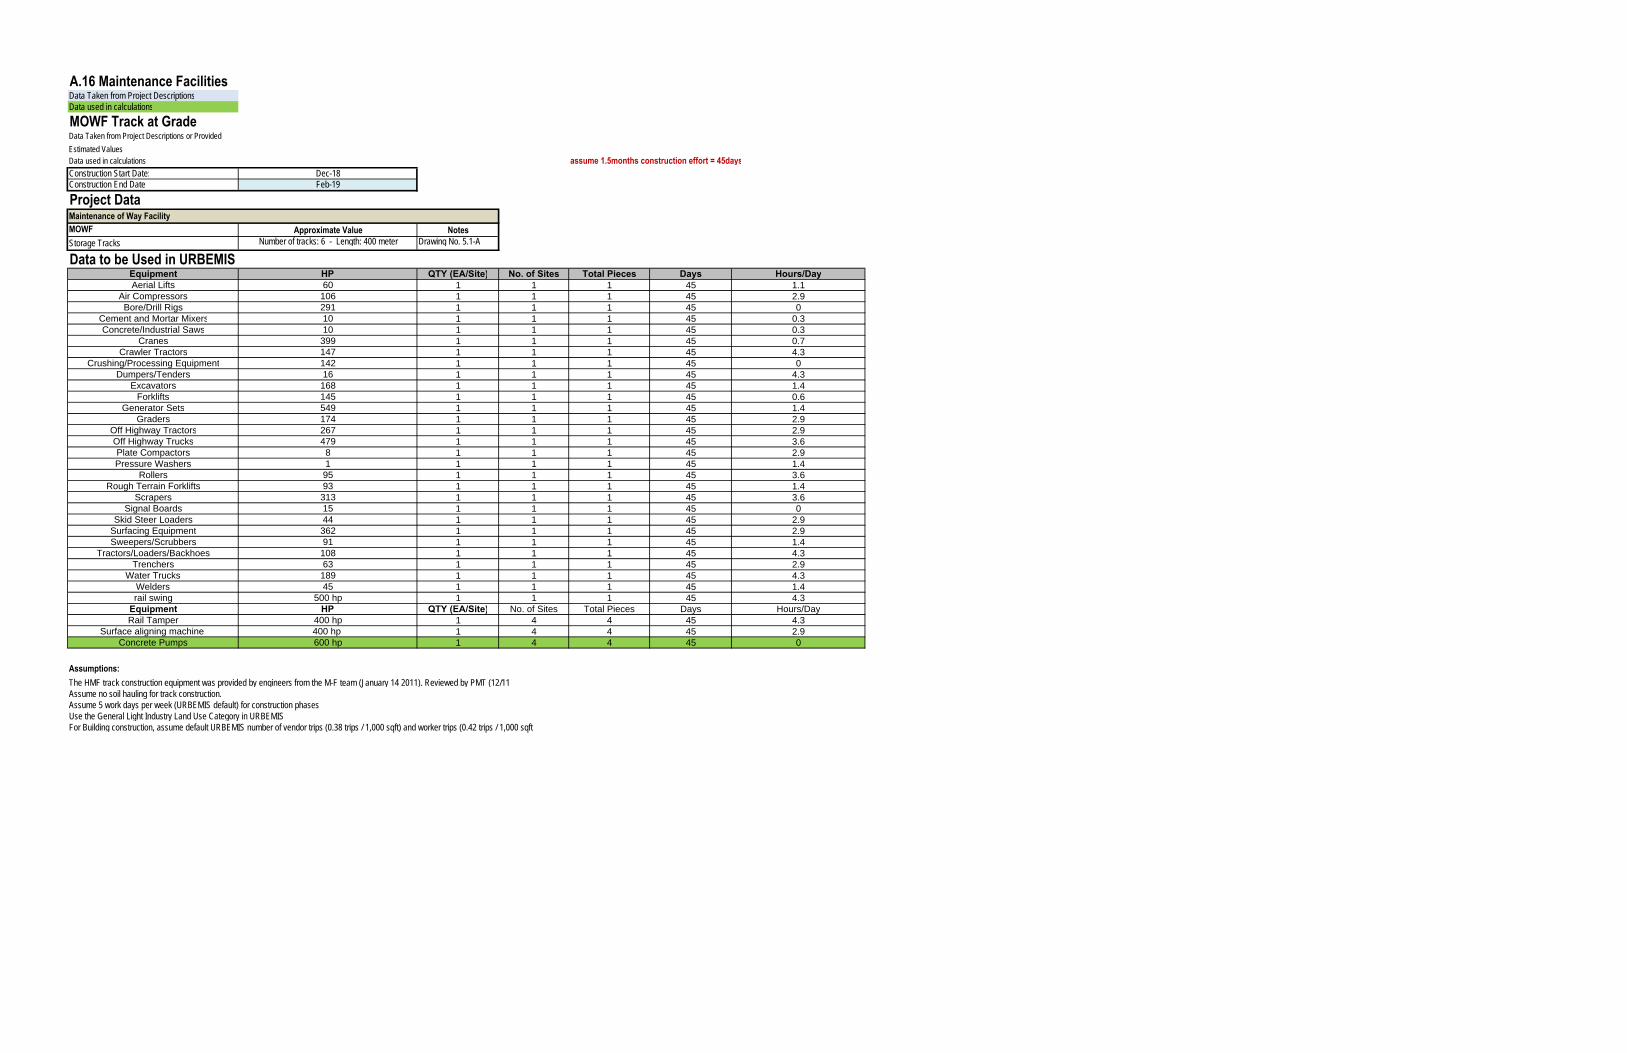
A.16 Maintenance FacilitiesData Taken from Project DescriptionsData used in calculations
MOWF Track at GradeData Taken from Project Descriptions or ProvidedEstimated ValuesData used in calculations assume 1.5months construction effort = 45daysConstruction Start Date: Dec-18Construction End Date: Feb-19
Project DataMaintenance of Way FacilityMOWF Approximate Value NotesStorage Tracks Number of tracks: 6 - Length: 400 meter Drawing No. 5.1-A
Data to be Used in URBEMISEquipment HP QTY (EA/Site) No. of Sites Total Pieces Days Hours/DayAerial Lifts 60 1 1 1 45 1.1
Air Compressors 106 1 1 1 45 2.9Bore/Drill Rigs 291 1 1 1 45 0
Cement and Mortar Mixers 10 1 1 1 45 0.3Concrete/Industrial Saws 10 1 1 1 45 0.3
Cranes 399 1 1 1 45 0.7Crawler Tractors 147 1 1 1 45 4.3
Crushing/Processing Equipment 142 1 1 1 45 0Dumpers/Tenders 16 1 1 1 45 4.3
Excavators 168 1 1 1 45 1.4Forklifts 145 1 1 1 45 0.6
Generator Sets 549 1 1 1 45 1.4Graders 174 1 1 1 45 2.9
Off Highway Tractors 267 1 1 1 45 2.9Off Highway Trucks 479 1 1 1 45 3.6Plate Compactors 8 1 1 1 45 2.9Pressure Washers 1 1 1 1 45 1.4
Rollers 95 1 1 1 45 3.6Rough Terrain Forklifts 93 1 1 1 45 1.4
Scrapers 313 1 1 1 45 3.6Signal Boards 15 1 1 1 45 0
Skid Steer Loaders 44 1 1 1 45 2.9Surfacing Equipment 362 1 1 1 45 2.9Sweepers/Scrubbers 91 1 1 1 45 1.4
Tractors/Loaders/Backhoes 108 1 1 1 45 4.3Trenchers 63 1 1 1 45 2.9
Water Trucks 189 1 1 1 45 4.3Welders 45 1 1 1 45 1.4rail swing 500 hp 1 1 1 45 4.3
Equipment HP QTY (EA/Site) No. of Sites Total Pieces Days Hours/DayRail Tamper 400 hp 1 4 4 45 4.3
Surface aligning machine 400 hp 1 4 4 45 2.9Concrete Pumps 600 hp 1 4 4 45 0
Assumptions:
Assume no soil hauling for track construction.Assume 5 work days per week (URBEMIS default) for construction phasesUse the General Light Industry Land Use Category in URBEMISFor Building construction, assume default URBEMIS number of vendor trips (0.38 trips / 1,000 sqft) and worker trips (0.42 trips / 1,000 sqft)
The HMF track construction equipment was provided by engineers from the M-F team (January 14 2011). Reviewed by PMT (12/11
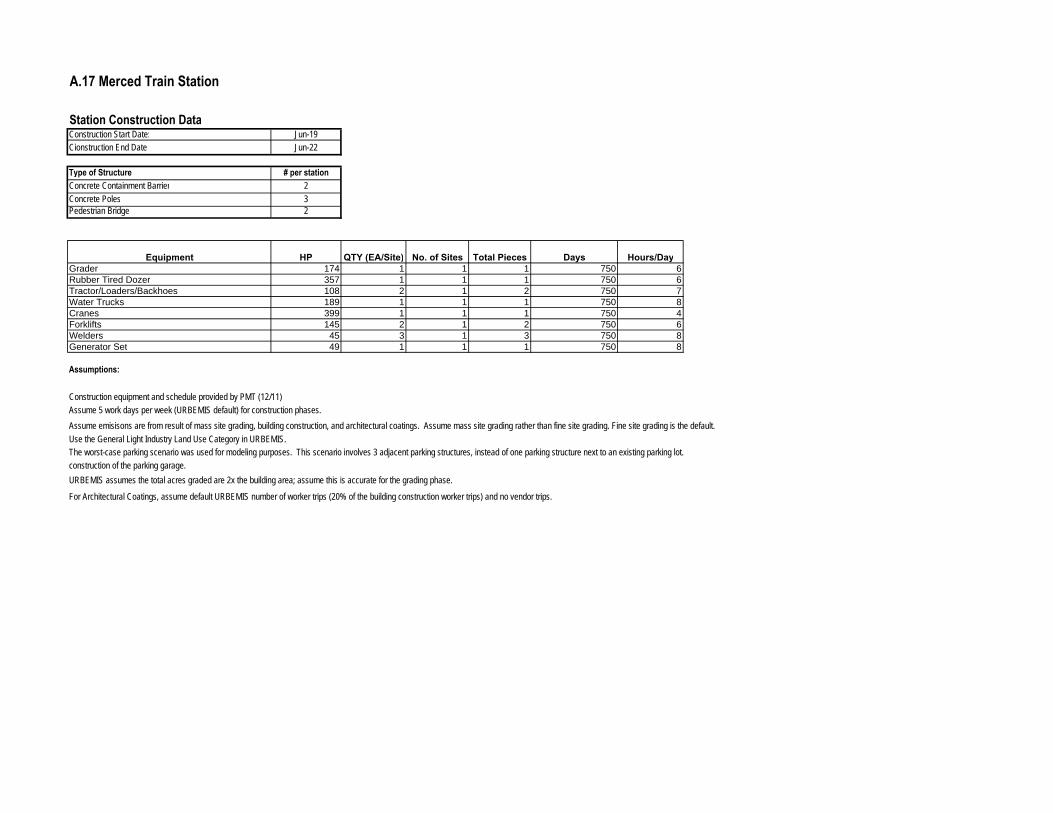
A.17 Merced Train Station
Station Construction DataConstruction Start Date: Jun-19Cionstruction End Date Jun-22
Type of Structure # per stationConcrete Containment Barrier 2Concrete Poles 3Pedestrian Bridge 2
Equipment HP QTY (EA/Site) No. of Sites Total Pieces Days Hours/DayGrader 174 1 1 1 750 6Rubber Tired Dozer 357 1 1 1 750 6Tractor/Loaders/Backhoes 108 2 1 2 750 7Water Trucks 189 1 1 1 750 8Cranes 399 1 1 1 750 4Forklifts 145 2 1 2 750 6Welders 45 3 1 3 750 8Generator Set 49 1 1 1 750 8
Assumptions:
Construction equipment and schedule provided by PMT (12/11)Assume 5 work days per week (URBEMIS default) for construction phases.
Use the General Light Industry Land Use Category in URBEMIS.
URBEMIS assumes the total acres graded are 2x the building area; assume this is accurate for the grading phase.
For Architectural Coatings, assume default URBEMIS number of worker trips (20% of the building construction worker trips) and no vendor trips.
Assume emisisons are from result of mass site grading, building construction, and architectural coatings. Assume mass site grading rather than fine site grading. Fine site grading is the default.
The worst-case parking scenario was used for modeling purposes. This scenario involves 3 adjacent parking structures, instead of one parking structure next to an existing parking lot.construction of the parking garage.
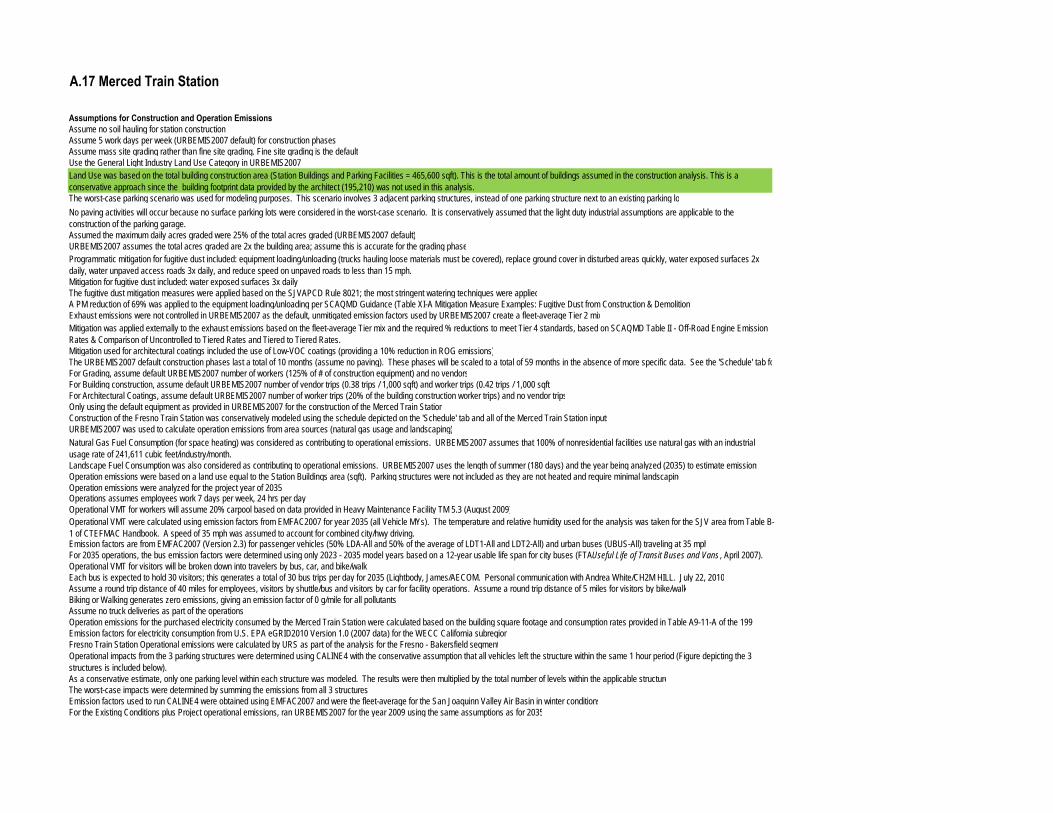
A.17 Merced Train Station
Assumptions for Construction and Operation Emissions:Assume no soil hauling for station construction.Assume 5 work days per week (URBEMIS2007 default) for construction phasesAssume mass site grading rather than fine site grading. Fine site grading is the defaultUse the General Light Industry Land Use Category in URBEMIS2007
Assumed the maximum daily acres graded were 25% of the total acres graded (URBEMIS2007 default)URBEMIS2007 assumes the total acres graded are 2x the building area; assume this is accurate for the grading phase
Mitigation for fugitive dust included: water exposed surfaces 3x dailyThe fugitive dust mitigation measures were applied based on the SJVAPCD Rule 8021; the most stringent watering techniques were applied
Exhaust emissions were not controlled in URBEMIS2007 as the default, unmitigated emission factors used by URBEMIS2007 create a fleet-average Tier 2 mix
Mitigation used for architectural coatings included the use of Low-VOC coatings (providing a 10% reduction in ROG emissions)
For Grading, assume default URBEMIS2007 number of workers (125% of # of construction equipment) and no vendorsFor Building construction, assume default URBEMIS2007 number of vendor trips (0.38 trips / 1,000 sqft) and worker trips (0.42 trips / 1,000 sqft)For Architectural Coatings, assume default URBEMIS2007 number of worker trips (20% of the building construction worker trips) and no vendor tripsOnly using the default equipment as provided in URBEMIS2007 for the construction of the Merced Train StationConstruction of the Fresno Train Station was conservatively modeled using the schedule depicted on the 'Schedule' tab and all of the Merced Train Station inputsURBEMIS2007 was used to calculate operation emissions from area sources (natural gas usage and landscaping)
Operation emissions were analyzed for the project year of 2035Operations assumes employees work 7 days per week, 24 hrs per dayOperational VMT for workers will assume 20% carpool based on data provided in Heavy Maintenance Facility TM 5.3 (August 2009)
Emission factors are from EMFAC2007 (Version 2.3) for passenger vehicles (50% LDA-All and 50% of the average of LDT1-All and LDT2-All) and urban buses (UBUS-All) traveling at 35 mph
Operational VMT for visitors will be broken down into travelers by bus, car, and bike/walk
Biking or Walking generates zero emissions, giving an emission factor of 0 g/mile for all pollutantsAssume no truck deliveries as part of the operations.
Emission factors for electricity consumption from U.S. EPA eGRID2010 Version 1.0 (2007 data) for the WECC California subregionFresno Train Station Operational emissions were calculated by URS as part of the analysis for the Fresno - Bakersfield segment
The worst-case impacts were determined by summing the emissions from all 3 structuresEmission factors used to run CALINE4 were obtained using EMFAC2007 and were the fleet-average for the San Joaquinn Valley Air Basin in winter conditionsFor the Existing Conditions plus Project operational emissions, ran URBEMIS2007 for the year 2009 using the same assumptions as for 2035
Each bus is expected to hold 30 visitors; this generates a total of 30 bus trips per day for 2035 (Lightbody, James/AECOM. Personal communication with Andrea White/CH2M HILL. July 22, 2010Assume a round trip distance of 40 miles for employees, visitors by shuttle/bus and visitors by car for facility operations. Assume a round trip distance of 5 miles for visitors by bike/walk
Operation emissions for the purchased electricity consumed by the Merced Train Station were calculated based on the building square footage and consumption rates provided in Table A9-11-A of the 1993
Operational impacts from the 3 parking structures were determined using CALINE4 with the conservative assumption that all vehicles left the structure within the same 1 hour period (Figure depicting the 3 structures is included below).As a conservative estimate, only one parking level within each structure was modeled. The results were then multiplied by the total number of levels within the applicable structure
Programmatic mitigation for fugitive dust included: equipment loading/unloading (trucks hauling loose materials must be covered), replace ground cover in disturbed areas quickly, water exposed surfaces 2x daily, water unpaved access roads 3x daily, and reduce speed on unpaved roads to less than 15 mph.
Operation emissions were based on a land use equal to the Station Buildings area (sqft). Parking structures were not included as they are not heated and require minimal landscaping
Operational VMT were calculated using emission factors from EMFAC2007 for year 2035 (all Vehicle MYs). The temperature and relative humidity used for the analysis was taken for the SJV area from Table B-1 of CTEFMAC Handbook. A speed of 35 mph was assumed to account for combined city/hwy driving.
For 2035 operations, the bus emission factors were determined using only 2023 - 2035 model years based on a 12-year usable life span for city buses (FTAUseful Life of Transit Buses and Vans , April 2007).
A PM reduction of 69% was applied to the equipment loading/unloading per SCAQMD Guidance (Table XI-A Mitigation Measure Examples: Fugitive Dust from Construction & Demolition)
Mitigation was applied externally to the exhaust emissions based on the fleet-average Tier mix and the required % reductions to meet Tier 4 standards, based on SCAQMD Table II - Off-Road Engine Emission Rates & Comparison of Uncontrolled to Tiered Rates and Tiered to Tiered Rates.
The URBEMIS2007 default construction phases last a total of 10 months (assume no paving). These phases will be scaled to a total of 59 months in the absence of more specific data. See the 'Schedule' tab fo
Natural Gas Fuel Consumption (for space heating) was considered as contributing to operational emissions. URBEMIS2007 assumes that 100% of nonresidential facilities use natural gas with an industrial usage rate of 241,611 cubic feet/industry/month.Landscape Fuel Consumption was also considered as contributing to operational emissions. URBEMIS2007 uses the length of summer (180 days) and the year being analyzed (2035) to estimate emissions
Land Use was based on the total building construction area (Station Buildings and Parking Facilities = 465,600 sqft). This is the total amount of buildings assumed in the construction analysis. This is a conservative approach since the building footprint data provided by the architect (195,210) was not used in this analysis.The worst-case parking scenario was used for modeling purposes. This scenario involves 3 adjacent parking structures, instead of one parking structure next to an existing parking loNo paving activities will occur because no surface parking lots were considered in the worst-case scenario. It is conservatively assumed that the light duty industrial assumptions are applicable to the construction of the parking garage.
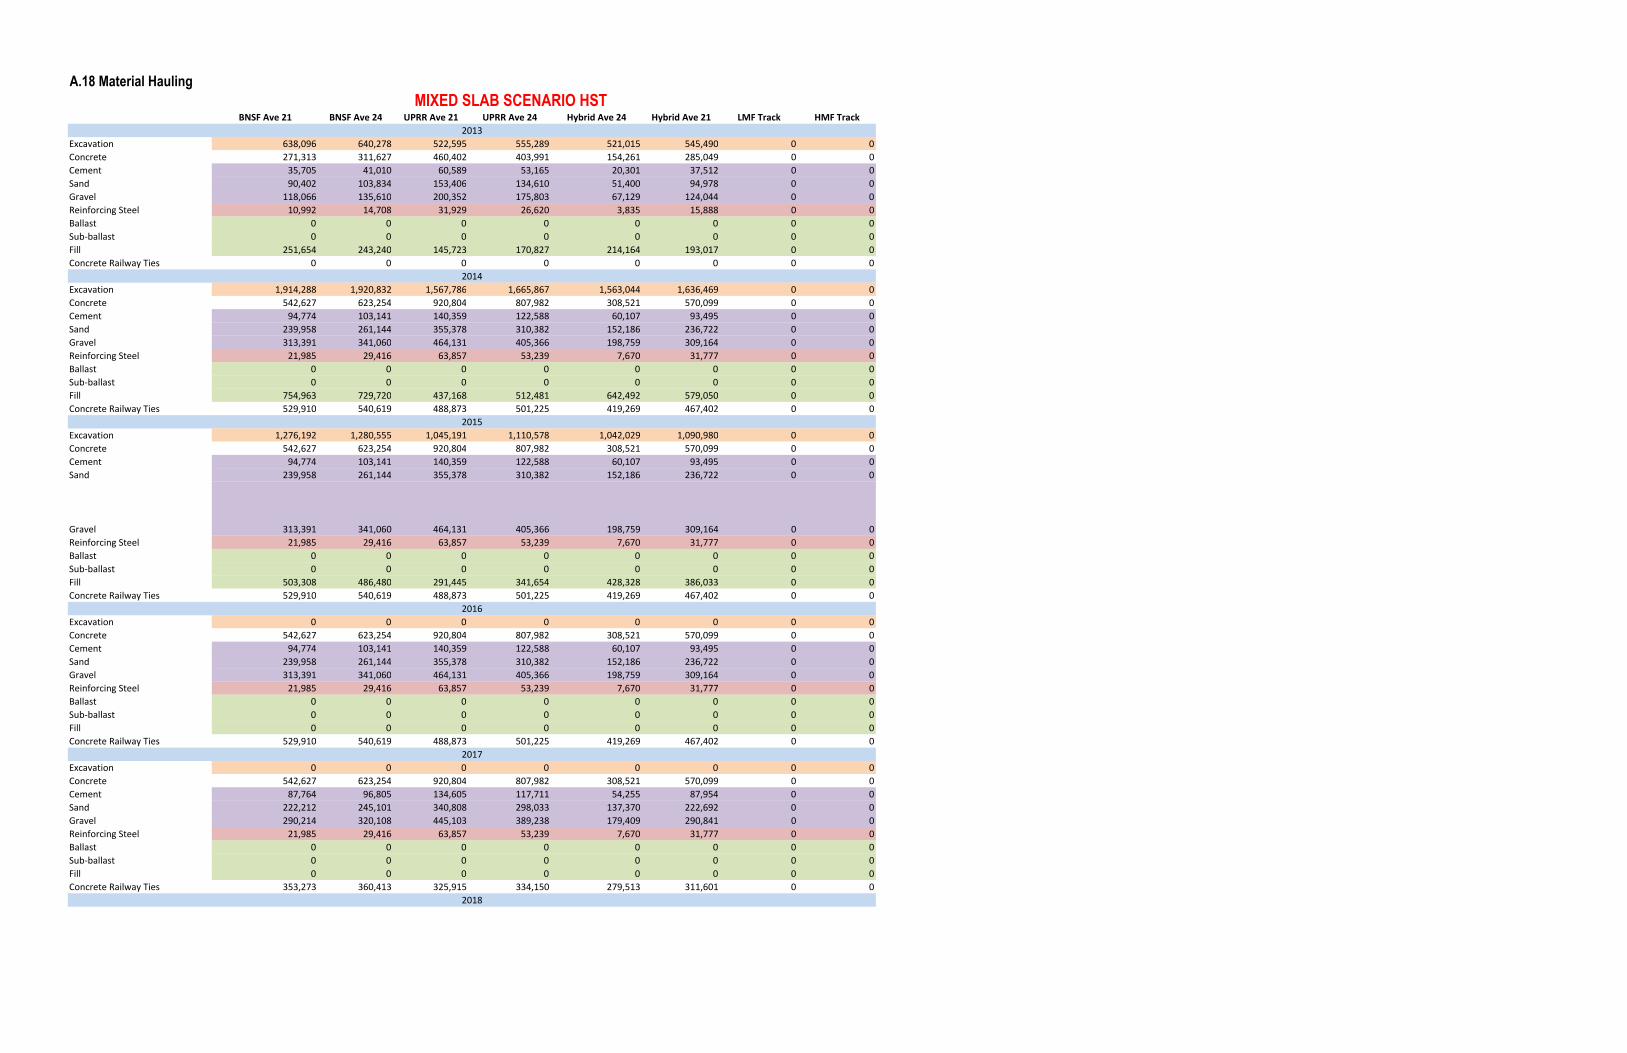
A.18 Material Hauling
BNSF Ave 21 BNSF Ave 24 UPRR Ave 21 UPRR Ave 24 Hybrid Ave 24 Hybrid Ave 21 LMF Track HMF Track
Excavation 638,096 640,278 522,595 555,289 521,015 545,490 0 0Concrete 271,313 311,627 460,402 403,991 154,261 285,049 0 0Cement 35,705 41,010 60,589 53,165 20,301 37,512 0 0Sand 90,402 103,834 153,406 134,610 51,400 94,978 0 0Gravel 118,066 135,610 200,352 175,803 67,129 124,044 0 0Reinforcing Steel 10,992 14,708 31,929 26,620 3,835 15,888 0 0Ballast 0 0 0 0 0 0 0 0Sub‐ballast 0 0 0 0 0 0 0 0Fill 251,654 243,240 145,723 170,827 214,164 193,017 0 0Concrete Railway Ties 0 0 0 0 0 0 0 0
Excavation 1,914,288 1,920,832 1,567,786 1,665,867 1,563,044 1,636,469 0 0Concrete 542,627 623,254 920,804 807,982 308,521 570,099 0 0Cement 94,774 103,141 140,359 122,588 60,107 93,495 0 0Sand 239,958 261,144 355,378 310,382 152,186 236,722 0 0Gravel 313,391 341,060 464,131 405,366 198,759 309,164 0 0Reinforcing Steel 21,985 29,416 63,857 53,239 7,670 31,777 0 0Ballast 0 0 0 0 0 0 0 0Sub‐ballast 0 0 0 0 0 0 0 0Fill 754,963 729,720 437,168 512,481 642,492 579,050 0 0Concrete Railway Ties 529,910 540,619 488,873 501,225 419,269 467,402 0 0
Excavation 1,276,192 1,280,555 1,045,191 1,110,578 1,042,029 1,090,980 0 0Concrete 542,627 623,254 920,804 807,982 308,521 570,099 0 0Cement 94,774 103,141 140,359 122,588 60,107 93,495 0 0Sand 239,958 261,144 355,378 310,382 152,186 236,722 0 0
Gravel 313,391 341,060 464,131 405,366 198,759 309,164 0 0Reinforcing Steel 21,985 29,416 63,857 53,239 7,670 31,777 0 0Ballast 0 0 0 0 0 0 0 0Sub‐ballast 0 0 0 0 0 0 0 0Fill 503,308 486,480 291,445 341,654 428,328 386,033 0 0Concrete Railway Ties 529,910 540,619 488,873 501,225 419,269 467,402 0 0
Excavation 0 0 0 0 0 0 0 0Concrete 542,627 623,254 920,804 807,982 308,521 570,099 0 0Cement 94,774 103,141 140,359 122,588 60,107 93,495 0 0Sand 239,958 261,144 355,378 310,382 152,186 236,722 0 0Gravel 313,391 341,060 464,131 405,366 198,759 309,164 0 0Reinforcing Steel 21,985 29,416 63,857 53,239 7,670 31,777 0 0Ballast 0 0 0 0 0 0 0 0Sub‐ballast 0 0 0 0 0 0 0 0Fill 0 0 0 0 0 0 0 0Concrete Railway Ties 529,910 540,619 488,873 501,225 419,269 467,402 0 0
Excavation 0 0 0 0 0 0 0 0Concrete 542,627 623,254 920,804 807,982 308,521 570,099 0 0Cement 87,764 96,805 134,605 117,711 54,255 87,954 0 0Sand 222,212 245,101 340,808 298,033 137,370 222,692 0 0Gravel 290,214 320,108 445,103 389,238 179,409 290,841 0 0Reinforcing Steel 21,985 29,416 63,857 53,239 7,670 31,777 0 0Ballast 0 0 0 0 0 0 0 0Sub‐ballast 0 0 0 0 0 0 0 0Fill 0 0 0 0 0 0 0 0Concrete Railway Ties 353,273 360,413 325,915 334,150 279,513 311,601 0 0
2016
2017
2018
MIXED SLAB SCENARIO HST2013
2014
2015
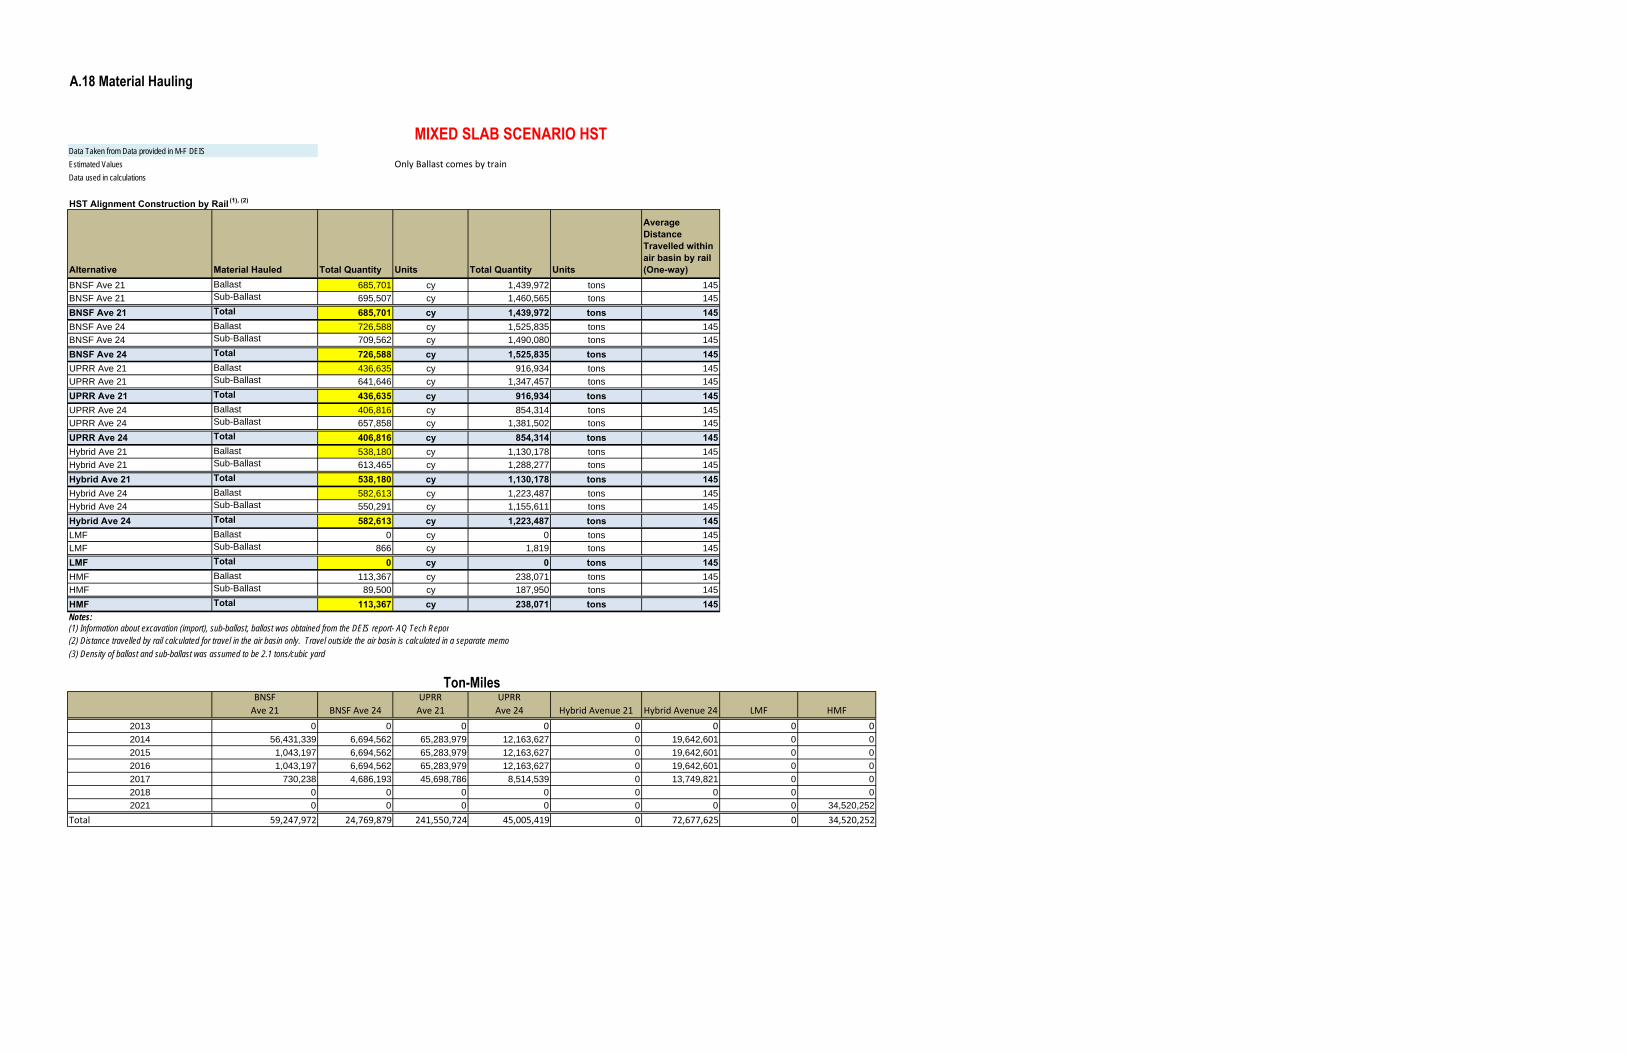
A.18 Material Hauling
Data Taken from Data provided in M-F DEISEstimated Values Only Ballast comes by trainData used in calculations
HST Alignment Construction by Rail (1), (2)
Alternative Material Hauled Total Quantity Units Total Quantity Units
Average Distance Travelled within air basin by rail (One-way)
BNSF Ave 21 Ballast 685,701 cy 1,439,972 tons 145
BNSF Ave 21 Sub-Ballast 695,507 cy 1,460,565 tons 145
BNSF Ave 21 Total 685,701 cy 1,439,972 tons 145BNSF Ave 24 Ballast 726,588 cy 1,525,835 tons 145
BNSF Ave 24 Sub-Ballast 709,562 cy 1,490,080 tons 145
BNSF Ave 24 Total 726,588 cy 1,525,835 tons 145UPRR Ave 21 Ballast 436,635 cy 916,934 tons 145
UPRR Ave 21 Sub-Ballast 641,646 cy 1,347,457 tons 145
UPRR Ave 21 Total 436,635 cy 916,934 tons 145UPRR Ave 24 Ballast 406,816 cy 854,314 tons 145
UPRR Ave 24 Sub-Ballast 657,858 cy 1,381,502 tons 145
UPRR Ave 24 Total 406,816 cy 854,314 tons 145Hybrid Ave 21 Ballast 538,180 cy 1,130,178 tons 145
Hybrid Ave 21 Sub-Ballast 613,465 cy 1,288,277 tons 145
Hybrid Ave 21 Total 538,180 cy 1,130,178 tons 145Hybrid Ave 24 Ballast 582,613 cy 1,223,487 tons 145
Hybrid Ave 24 Sub-Ballast 550,291 cy 1,155,611 tons 145
Hybrid Ave 24 Total 582,613 cy 1,223,487 tons 145LMF Ballast 0 cy 0 tons 145
LMF Sub-Ballast 866 cy 1,819 tons 145
LMF Total 0 cy 0 tons 145HMF Ballast 113,367 cy 238,071 tons 145
HMF Sub-Ballast 89,500 cy 187,950 tons 145
HMF Total 113,367 cy 238,071 tons 145Notes:(1) Information about excavation (import), sub-ballast, ballast was obtained from the DEIS report- AQ Tech Repor(2) Distance travelled by rail calculated for travel in the air basin only. Travel outside the air basin is calculated in a separate memo
(3) Density of ballast and sub-ballast was assumed to be 2.1 tons/cubic yard
BNSF Ave 21 BNSF Ave 24
UPRR Ave 21
UPRR Ave 24 Hybrid Avenue 21 Hybrid Avenue 24 LMF HMF
2013 0 0 0 0 0 0 0 02014 56,431,339 6,694,562 65,283,979 12,163,627 0 19,642,601 0 0
2015 1,043,197 6,694,562 65,283,979 12,163,627 0 19,642,601 0 0
2016 1,043,197 6,694,562 65,283,979 12,163,627 0 19,642,601 0 0
2017 730,238 4,686,193 45,698,786 8,514,539 0 13,749,821 0 0
2018 0 0 0 0 0 0 0 0
2021 0 0 0 0 0 0 0 34,520,252
Total 59,247,972 24,769,879 241,550,724 45,005,419 0 72,677,625 0 34,520,252
MIXED SLAB SCENARIO HST
Ton-Miles
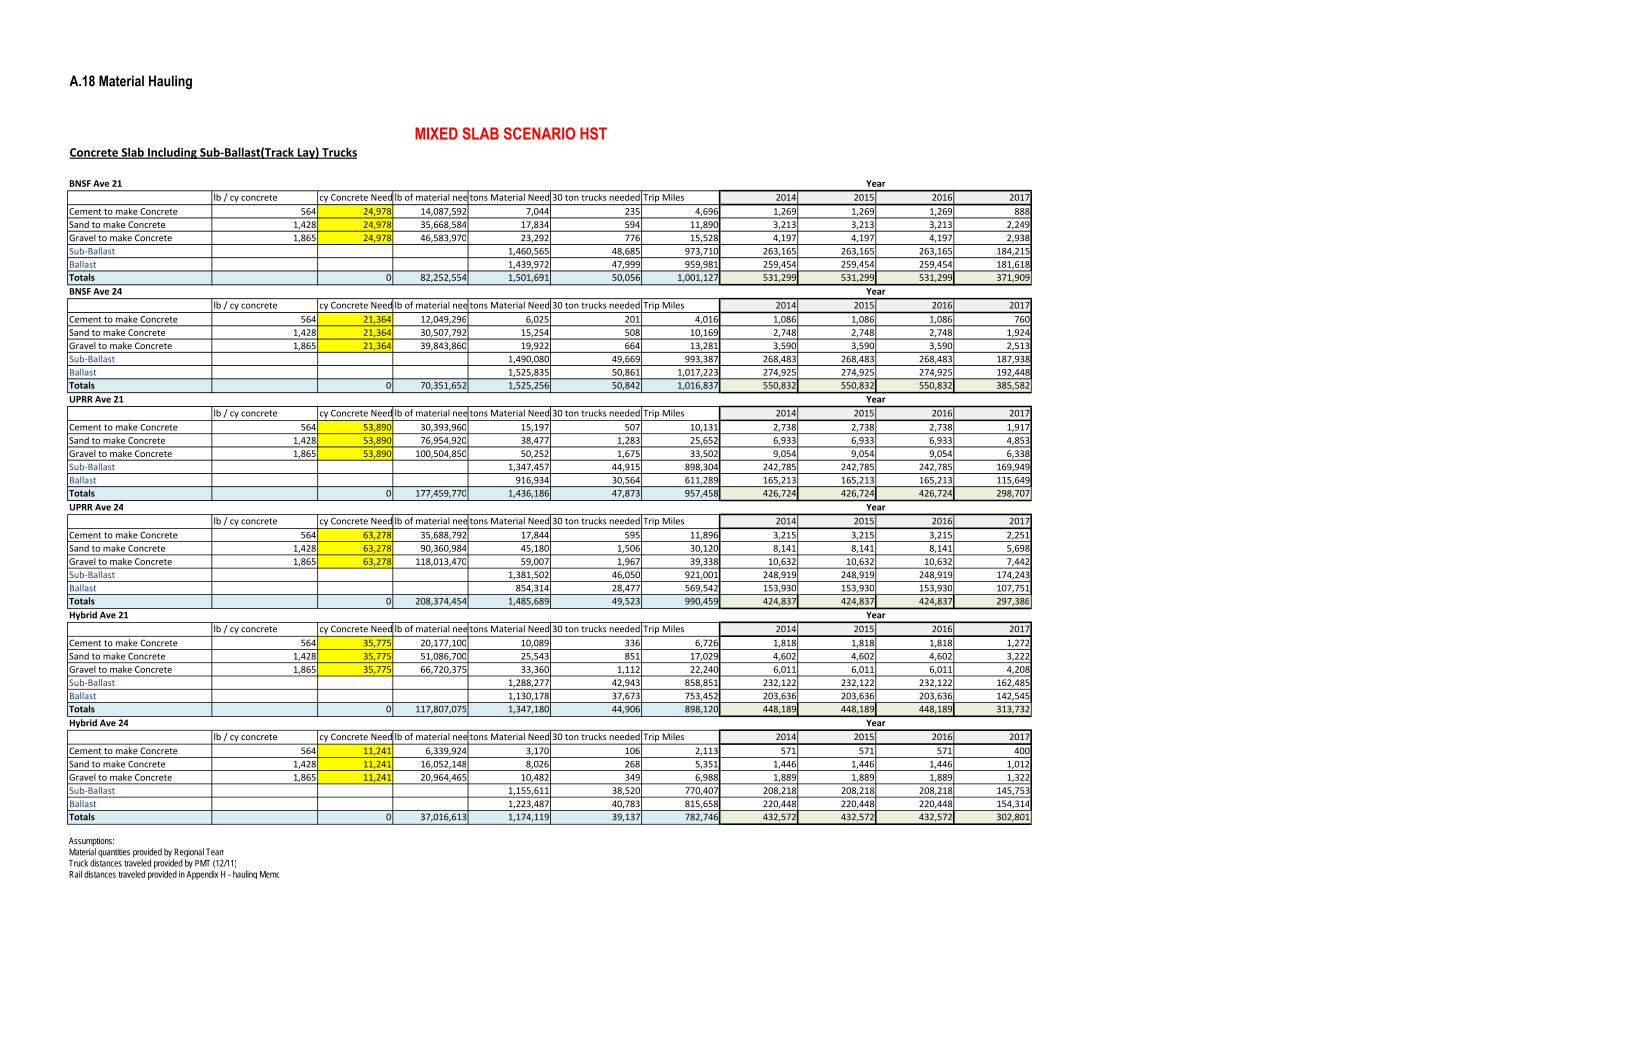
A.18 Material Hauling
Concrete Slab Including Sub‐Ballast(Track Lay) Trucks
BNSF Ave 21 Yearlb / cy concrete cy Concrete Need lb of material nee tons Material Need 30 ton trucks needed Trip Miles 2014 2015 2016 2017
Cement to make Concrete 564 24,978 14,087,592 7,044 235 4,696 1,269 1,269 1,269 888Sand to make Concrete 1,428 24,978 35,668,584 17,834 594 11,890 3,213 3,213 3,213 2,249Gravel to make Concrete 1,865 24,978 46,583,970 23,292 776 15,528 4,197 4,197 4,197 2,938Sub‐Ballast 1,460,565 48,685 973,710 263,165 263,165 263,165 184,215Ballast 1,439,972 47,999 959,981 259,454 259,454 259,454 181,618Totals 0 82,252,554 1,501,691 50,056 1,001,127 531,299 531,299 531,299 371,909BNSF Ave 24 Year
lb / cy concrete cy Concrete Need lb of material nee tons Material Need 30 ton trucks needed Trip Miles 2014 2015 2016 2017Cement to make Concrete 564 21,364 12,049,296 6,025 201 4,016 1,086 1,086 1,086 760Sand to make Concrete 1,428 21,364 30,507,792 15,254 508 10,169 2,748 2,748 2,748 1,924Gravel to make Concrete 1,865 21,364 39,843,860 19,922 664 13,281 3,590 3,590 3,590 2,513Sub‐Ballast 1,490,080 49,669 993,387 268,483 268,483 268,483 187,938Ballast 1,525,835 50,861 1,017,223 274,925 274,925 274,925 192,448Totals 0 70,351,652 1,525,256 50,842 1,016,837 550,832 550,832 550,832 385,582UPRR Ave 21 Year
lb / cy concrete cy Concrete Need lb of material nee tons Material Need 30 ton trucks needed Trip Miles 2014 2015 2016 2017Cement to make Concrete 564 53,890 30,393,960 15,197 507 10,131 2,738 2,738 2,738 1,917Sand to make Concrete 1,428 53,890 76,954,920 38,477 1,283 25,652 6,933 6,933 6,933 4,853Gravel to make Concrete 1,865 53,890 100,504,850 50,252 1,675 33,502 9,054 9,054 9,054 6,338Sub‐Ballast 1,347,457 44,915 898,304 242,785 242,785 242,785 169,949Ballast 916,934 30,564 611,289 165,213 165,213 165,213 115,649Totals 0 177,459,770 1,436,186 47,873 957,458 426,724 426,724 426,724 298,707UPRR Ave 24 Year
lb / cy concrete cy Concrete Need lb of material nee tons Material Need 30 ton trucks needed Trip Miles 2014 2015 2016 2017Cement to make Concrete 564 63,278 35,688,792 17,844 595 11,896 3,215 3,215 3,215 2,251Sand to make Concrete 1,428 63,278 90,360,984 45,180 1,506 30,120 8,141 8,141 8,141 5,698Gravel to make Concrete 1,865 63,278 118,013,470 59,007 1,967 39,338 10,632 10,632 10,632 7,442Sub‐Ballast 1,381,502 46,050 921,001 248,919 248,919 248,919 174,243Ballast 854,314 28,477 569,542 153,930 153,930 153,930 107,751Totals 0 208,374,454 1,485,689 49,523 990,459 424,837 424,837 424,837 297,386Hybrid Ave 21 Year
lb / cy concrete cy Concrete Need lb of material nee tons Material Need 30 ton trucks needed Trip Miles 2014 2015 2016 2017Cement to make Concrete 564 35,775 20,177,100 10,089 336 6,726 1,818 1,818 1,818 1,272Sand to make Concrete 1,428 35,775 51,086,700 25,543 851 17,029 4,602 4,602 4,602 3,222Gravel to make Concrete 1,865 35,775 66,720,375 33,360 1,112 22,240 6,011 6,011 6,011 4,208Sub‐Ballast 1,288,277 42,943 858,851 232,122 232,122 232,122 162,485Ballast 1,130,178 37,673 753,452 203,636 203,636 203,636 142,545Totals 0 117,807,075 1,347,180 44,906 898,120 448,189 448,189 448,189 313,732Hybrid Ave 24 Year
lb / cy concrete cy Concrete Need lb of material nee tons Material Need 30 ton trucks needed Trip Miles 2014 2015 2016 2017Cement to make Concrete 564 11,241 6,339,924 3,170 106 2,113 571 571 571 400Sand to make Concrete 1,428 11,241 16,052,148 8,026 268 5,351 1,446 1,446 1,446 1,012Gravel to make Concrete 1,865 11,241 20,964,465 10,482 349 6,988 1,889 1,889 1,889 1,322Sub‐Ballast 1,155,611 38,520 770,407 208,218 208,218 208,218 145,753Ballast 1,223,487 40,783 815,658 220,448 220,448 220,448 154,314Totals 0 37,016,613 1,174,119 39,137 782,746 432,572 432,572 432,572 302,801
Assumptions:Material quantities provided by Regional TeamTruck distances traveled provided by PMT (12/11)Rail distances traveled provided in Appendix H - hauling Memo
MIXED SLAB SCENARIO HST

APPENDIX B
Construction Emissions

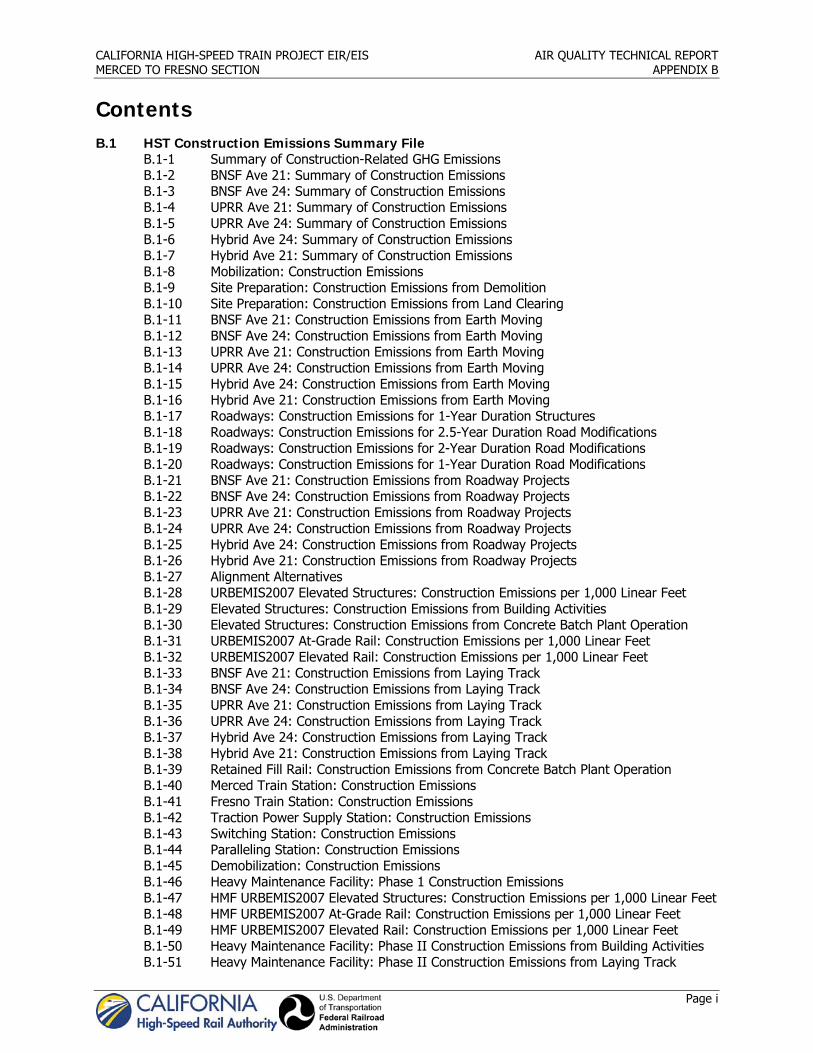
CALIFORNIA HIGH-SPEED TRAIN PROJECT EIR/EIS AIR QUALITY TECHNICAL REPORT MERCED TO FRESNO SECTION APPENDIX B
Page i
Contents B.1 HST Construction Emissions Summary File
B.1-1 Summary of Construction-Related GHG Emissions B.1-2 BNSF Ave 21: Summary of Construction Emissions B.1-3 BNSF Ave 24: Summary of Construction Emissions B.1-4 UPRR Ave 21: Summary of Construction Emissions B.1-5 UPRR Ave 24: Summary of Construction Emissions B.1-6 Hybrid Ave 24: Summary of Construction Emissions B.1-7 Hybrid Ave 21: Summary of Construction Emissions B.1-8 Mobilization: Construction Emissions B.1-9 Site Preparation: Construction Emissions from Demolition B.1-10 Site Preparation: Construction Emissions from Land Clearing B.1-11 BNSF Ave 21: Construction Emissions from Earth Moving B.1-12 BNSF Ave 24: Construction Emissions from Earth Moving B.1-13 UPRR Ave 21: Construction Emissions from Earth Moving B.1-14 UPRR Ave 24: Construction Emissions from Earth Moving B.1-15 Hybrid Ave 24: Construction Emissions from Earth Moving B.1-16 Hybrid Ave 21: Construction Emissions from Earth Moving B.1-17 Roadways: Construction Emissions for 1-Year Duration Structures B.1-18 Roadways: Construction Emissions for 2.5-Year Duration Road Modifications B.1-19 Roadways: Construction Emissions for 2-Year Duration Road Modifications B.1-20 Roadways: Construction Emissions for 1-Year Duration Road Modifications B.1-21 BNSF Ave 21: Construction Emissions from Roadway Projects B.1-22 BNSF Ave 24: Construction Emissions from Roadway Projects B.1-23 UPRR Ave 21: Construction Emissions from Roadway Projects B.1-24 UPRR Ave 24: Construction Emissions from Roadway Projects B.1-25 Hybrid Ave 24: Construction Emissions from Roadway Projects B.1-26 Hybrid Ave 21: Construction Emissions from Roadway Projects B.1-27 Alignment Alternatives B.1-28 URBEMIS2007 Elevated Structures: Construction Emissions per 1,000 Linear Feet B.1-29 Elevated Structures: Construction Emissions from Building Activities B.1-30 Elevated Structures: Construction Emissions from Concrete Batch Plant Operation B.1-31 URBEMIS2007 At-Grade Rail: Construction Emissions per 1,000 Linear Feet B.1-32 URBEMIS2007 Elevated Rail: Construction Emissions per 1,000 Linear Feet B.1-33 BNSF Ave 21: Construction Emissions from Laying Track B.1-34 BNSF Ave 24: Construction Emissions from Laying Track B.1-35 UPRR Ave 21: Construction Emissions from Laying Track B.1-36 UPRR Ave 24: Construction Emissions from Laying Track B.1-37 Hybrid Ave 24: Construction Emissions from Laying Track B.1-38 Hybrid Ave 21: Construction Emissions from Laying Track B.1-39 Retained Fill Rail: Construction Emissions from Concrete Batch Plant Operation B.1-40 Merced Train Station: Construction Emissions B.1-41 Fresno Train Station: Construction Emissions B.1-42 Traction Power Supply Station: Construction Emissions B.1-43 Switching Station: Construction Emissions B.1-44 Paralleling Station: Construction Emissions B.1-45 Demobilization: Construction Emissions B.1-46 Heavy Maintenance Facility: Phase 1 Construction Emissions B.1-47 HMF URBEMIS2007 Elevated Structures: Construction Emissions per 1,000 Linear Feet B.1-48 HMF URBEMIS2007 At-Grade Rail: Construction Emissions per 1,000 Linear Feet B.1-49 HMF URBEMIS2007 Elevated Rail: Construction Emissions per 1,000 Linear Feet B.1-50 Heavy Maintenance Facility: Phase II Construction Emissions from Building Activities B.1-51 Heavy Maintenance Facility: Phase II Construction Emissions from Laying Track
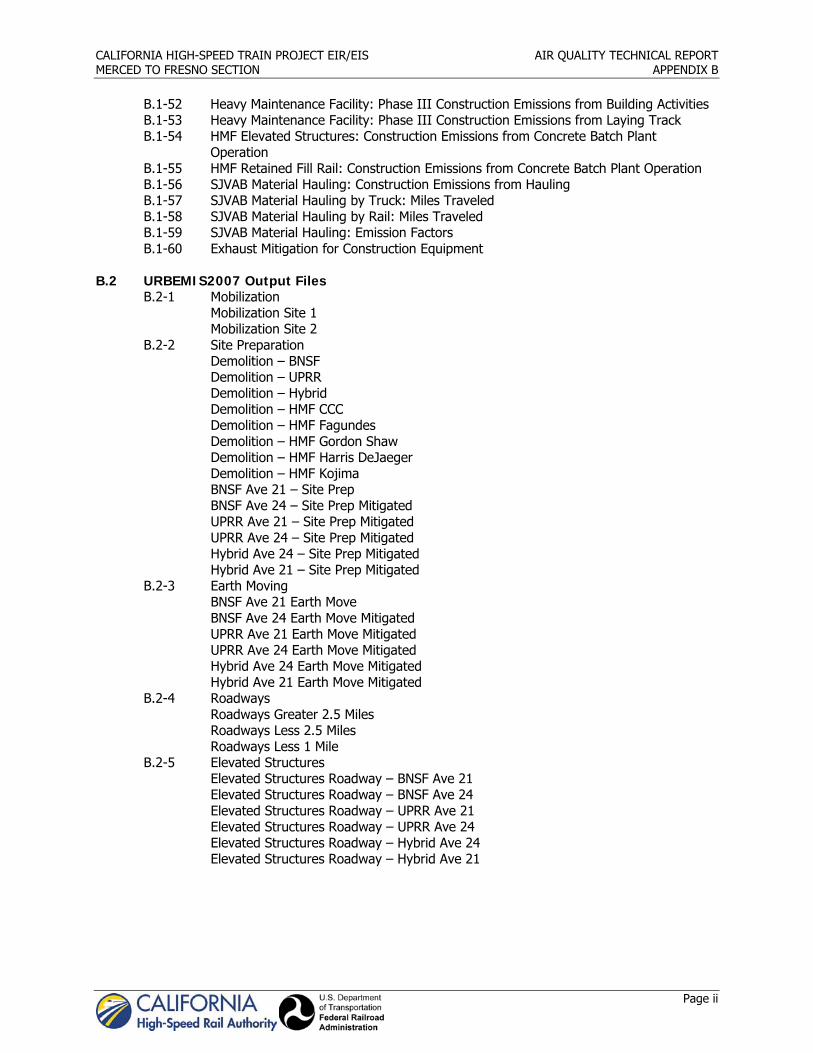
CALIFORNIA HIGH-SPEED TRAIN PROJECT EIR/EIS AIR QUALITY TECHNICAL REPORT MERCED TO FRESNO SECTION APPENDIX B
Page ii
B.1-52 Heavy Maintenance Facility: Phase III Construction Emissions from Building Activities B.1-53 Heavy Maintenance Facility: Phase III Construction Emissions from Laying Track B.1-54 HMF Elevated Structures: Construction Emissions from Concrete Batch Plant
Operation B.1-55 HMF Retained Fill Rail: Construction Emissions from Concrete Batch Plant Operation B.1-56 SJVAB Material Hauling: Construction Emissions from Hauling B.1-57 SJVAB Material Hauling by Truck: Miles Traveled B.1-58 SJVAB Material Hauling by Rail: Miles Traveled B.1-59 SJVAB Material Hauling: Emission Factors B.1-60 Exhaust Mitigation for Construction Equipment
B.2 URBEMIS2007 Output Files
B.2-1 Mobilization Mobilization Site 1 Mobilization Site 2 B.2-2 Site Preparation Demolition – BNSF Demolition – UPRR Demolition – Hybrid Demolition – HMF CCC Demolition – HMF Fagundes Demolition – HMF Gordon Shaw Demolition – HMF Harris DeJaeger Demolition – HMF Kojima BNSF Ave 21 – Site Prep BNSF Ave 24 – Site Prep Mitigated UPRR Ave 21 – Site Prep Mitigated UPRR Ave 24 – Site Prep Mitigated Hybrid Ave 24 – Site Prep Mitigated Hybrid Ave 21 – Site Prep Mitigated B.2-3 Earth Moving BNSF Ave 21 Earth Move BNSF Ave 24 Earth Move Mitigated UPRR Ave 21 Earth Move Mitigated UPRR Ave 24 Earth Move Mitigated Hybrid Ave 24 Earth Move Mitigated Hybrid Ave 21 Earth Move Mitigated B.2-4 Roadways Roadways Greater 2.5 Miles Roadways Less 2.5 Miles Roadways Less 1 Mile B.2-5 Elevated Structures Elevated Structures Roadway – BNSF Ave 21 Elevated Structures Roadway – BNSF Ave 24 Elevated Structures Roadway – UPRR Ave 21 Elevated Structures Roadway – UPRR Ave 24 Elevated Structures Roadway – Hybrid Ave 24 Elevated Structures Roadway – Hybrid Ave 21
CALIFORNIA HIGH-SPEED TRAIN PROJECT EIR/EIS AIR QUALITY TECHNICAL REPORT MERCED TO FRESNO SECTION APPENDIX B
Page iii
B.2-6 Laying Track At Grade Track Lay Elevated Track Lay Retained Fill B.2-7 Merced Train Station B.2-8 Power Stations Traction Power Supply – Construction Switching Station – Construction Paralleling Station – Construction B.2-9 Demobilization B.2-10 HMF MF HMF MF HMF Track B.2-11 Fresno Train Station
B.3 Road Construction Emissions Model Output Files
B.3-1 Roads Greater Than 2.5 Miles B.3-2 Roads Less Than 2.5 Miles B.3-3 Roads Less Than 1 Mile B.3-4 Structures
B.4 EMFAC Output Files
B.4-1 Emission Factors for Programmatic Material Hauling Construction Emissions B.4-2 Emission Factors for Mitigated Material Hauling Construction Emissions

B.1 HST Construction Emissions Summary

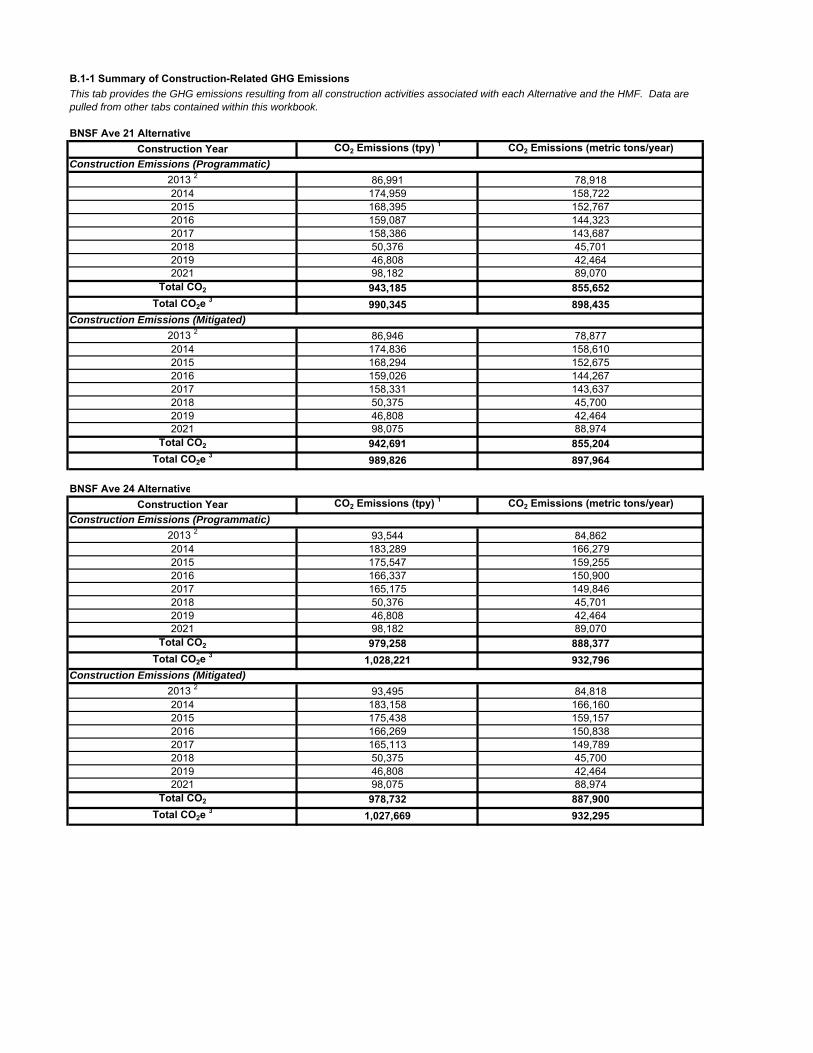
B.1-1 Summary of Construction-Related GHG Emissions
BNSF Ave 21 AlternativeConstruction Year CO2 Emissions (tpy) 1 CO2 Emissions (metric tons/year)
Construction Emissions (Programmatic)
2013 2 86,991 78,9182014 174,959 158,7222015 168,395 152,7672016 159,087 144,3232017 158,386 143,6872018 50,376 45,7012019 46,808 42,4642021 98,182 89,070
Total CO2 943,185 855,652Total CO2e 3 990,345 898,435
Construction Emissions (Mitigated)
2013 2 86,946 78,8772014 174,836 158,6102015 168,294 152,6752016 159,026 144,2672017 158,331 143,6372018 50,375 45,7002019 46,808 42,4642021 98,075 88,974
Total CO2 942,691 855,204Total CO2e 3 989,826 897,964
BNSF Ave 24 AlternativeConstruction Year CO2 Emissions (tpy) 1 CO2 Emissions (metric tons/year)
Construction Emissions (Programmatic)
2013 2 93,544 84,8622014 183,289 166,2792015 175,547 159,2552016 166,337 150,9002017 165,175 149,8462018 50,376 45,7012019 46,808 42,4642021 98,182 89,070
Total CO2 979,258 888,377Total CO2e 3 1,028,221 932,796
Construction Emissions (Mitigated)
2013 2 93,495 84,8182014 183,158 166,1602015 175,438 159,1572016 166,269 150,8382017 165,113 149,7892018 50,375 45,7002019 46,808 42,4642021 98,075 88,974
Total CO2 978,732 887,900Total CO2e 3 1,027,669 932,295
This tab provides the GHG emissions resulting from all construction activities associated with each Alternative and the HMF. Data are pulled from other tabs contained within this workbook.

B.1-1 Summary of Construction-Related GHG EmissionsThis tab provides the GHG emissions resulting from all construction activities associated with each Alternative and the HMF. Data are pulled from other tabs contained within this workbook.
UPRR Ave 21 AlternativeConstruction Year CO2 Emissions (tpy) 1 CO2 Emissions (metric tons/year)
Construction Emissions (Programmatic)
2013 2 109,428 99,2732014 184,169 167,0772015 182,625 165,6772016 175,224 158,9622017 181,809 164,9362018 50,376 45,7012019 46,808 42,4642021 98,182 89,070
Total CO2 1,028,623 933,161Total CO2e 3 1,080,054 979,819
Construction Emissions (Mitigated)
2013 2 109,372 99,2212014 184,029 166,9502015 182,502 165,5652016 175,132 158,8782017 181,723 164,8582018 50,375 45,7002019 46,808 42,4642021 98,075 88,974
Total CO2 1,028,016 932,610Total CO2e 3 1,079,416 979,240
UPRR Ave 24 AlternativeConstruction Year CO2 Emissions (tpy) 1 CO2 Emissions (metric tons/year)
Construction Emissions (Programmatic)
2013 2 106,569 96,6782014 182,755 165,7952015 181,169 164,3562016 172,737 156,7062017 174,500 158,3052018 50,376 45,7012019 46,808 42,4642021 98,182 89,070
Total CO2 1,013,096 919,075Total CO2e 3 1,063,751 965,028
Construction Emissions (Mitigated)
2013 2 106,516 96,6302014 182,621 165,6722015 181,053 164,2502016 172,653 156,6302017 174,422 158,2352018 50,375 45,7002019 46,808 42,4642021 98,075 88,974
Total CO2 1,012,524 918,555Total CO2e 3 1,063,150 964,483
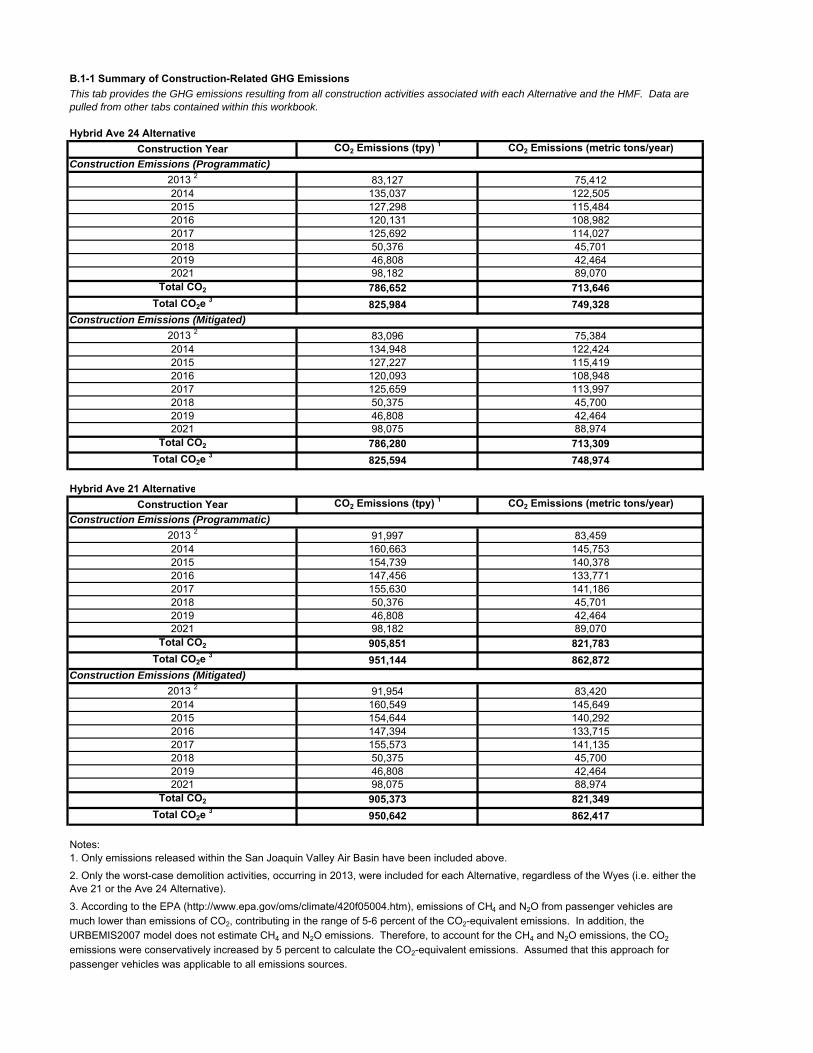
B.1-1 Summary of Construction-Related GHG EmissionsThis tab provides the GHG emissions resulting from all construction activities associated with each Alternative and the HMF. Data are pulled from other tabs contained within this workbook.
Hybrid Ave 24 AlternativeConstruction Year CO2 Emissions (tpy) 1 CO2 Emissions (metric tons/year)
Construction Emissions (Programmatic)
2013 2 83,127 75,4122014 135,037 122,5052015 127,298 115,4842016 120,131 108,9822017 125,692 114,0272018 50,376 45,7012019 46,808 42,4642021 98,182 89,070
Total CO2 786,652 713,646Total CO2e 3 825,984 749,328
Construction Emissions (Mitigated)
2013 2 83,096 75,3842014 134,948 122,4242015 127,227 115,4192016 120,093 108,9482017 125,659 113,9972018 50,375 45,7002019 46,808 42,4642021 98,075 88,974
Total CO2 786,280 713,309Total CO2e 3 825,594 748,974
Hybrid Ave 21 AlternativeConstruction Year CO2 Emissions (tpy) 1 CO2 Emissions (metric tons/year)
Construction Emissions (Programmatic)
2013 2 91,997 83,4592014 160,663 145,7532015 154,739 140,3782016 147,456 133,7712017 155,630 141,1862018 50,376 45,7012019 46,808 42,4642021 98,182 89,070
Total CO2 905,851 821,783Total CO2e 3 951,144 862,872
Construction Emissions (Mitigated)
2013 2 91,954 83,4202014 160,549 145,6492015 154,644 140,2922016 147,394 133,7152017 155,573 141,1352018 50,375 45,7002019 46,808 42,4642021 98,075 88,974
Total CO2 905,373 821,349Total CO2e 3 950,642 862,417
Notes:
3. According to the EPA (http://www.epa.gov/oms/climate/420f05004.htm), emissions of CH4 and N2O from passenger vehicles are much lower than emissions of CO2, contributing in the range of 5-6 percent of the CO2-equivalent emissions. In addition, the URBEMIS2007 model does not estimate CH4 and N2O emissions. Therefore, to account for the CH4 and N2O emissions, the CO2
emissions were conservatively increased by 5 percent to calculate the CO2-equivalent emissions. Assumed that this approach for passenger vehicles was applicable to all emissions sources.
2. Only the worst-case demolition activities, occurring in 2013, were included for each Alternative, regardless of the Wyes (i.e. either the Ave 21 or the Ave 24 Alternative).
1. Only emissions released within the San Joaquin Valley Air Basin have been included above.


B.1-2 BNSF Ave 21: Summary of Construction Emissions This tab provides the emissions resulting from all construction activities associated with the BNSF Ave 21 Alternative. Data are pulled from other tabs contained within this workbook.
Construction Emissions (Programmatic)
ROG CO NOx SOx PM10 Dust PM10 Exhaust PM10 PM2.5 Dust PM2.5 Exhaust PM2.5 CO2
2013 ConstructionMobilization 21 80 243 0 0 8 8 0 8 8 30,952Site Preparation - Demolition 1 10 48 134 0 183 5 188 38 5 43 24,711Site Preparation - Land Clearing 0 1 3 0 0 0 0 0 0 0 293Earth Moving 1 3 5 0 19 0 20 4 0 4 524Roadway Crossings 2 11 49 93 0 4 4 8 1 4 5 11,152Elevated Structures - Construction 6 33 49 0 0 2 2 0 2 2 7,851Elevated Structures - Concrete Batch Plant - - - - 7 - 7 7 - 7 -Material Hauling 3 4 21 73 0 - 4 4 - 3 3 11,5072014 ConstructionEarth Moving 1 2 4 0 58 0 58 12 0 12 503Roadway Crossings 2 6 26 44 0 2 2 4 0 2 3 5,435Elevated Structures - Construction 12 64 96 0 0 4 4 0 4 4 15,491Elevated Structures - Concrete Batch Plant - - - - 7 - 7 7 - 7 -Lay Track 90 465 716 0 1 32 33 0 30 30 113,434Lay Track - Fugitive Dust - - - - 2 - 2 0 - 0 -Lay Track - Concrete Batch Plant - - - - 11 - 11 11 - 11 -Merced Station Construction 0 1 1 0 1 0 1 0 0 0 103Fresno Station Construction 0 0 0 0 - - 0 - - 0 27Material Hauling 3 15 76 278 0 - 12 12 - 10 10 39,9662015 ConstructionEarth Moving 0 1 2 0 38 0 38 8 0 8 203Roadway Crossings 2 3 14 21 0 1 1 2 0 1 1 3,067Elevated Structures - Construction 12 64 96 0 0 4 4 0 4 4 15,491Elevated Structures - Concrete Batch Plant - - - - 7 - 7 7 - 7 -Lay Track 90 465 716 0 1 32 33 0 30 30 113,434Lay Track - Fugitive Dust - - - - 2 - 2 0 - 0 -Lay Track - Concrete Batch Plant - - - - 11 - 11 11 - 11 -Merced Station Construction 1 5 4 0 1 0 1 0 0 0 994Fresno Station Construction 0 3 3 0 - - 1 - - 0 584Material Hauling 3 12 63 225 0 - 9 9 - 8 8 34,6212016 Construction
Roadway Crossings 2 2 11 15 0 1 1 1 0 1 1 2,209Elevated Structures - Construction 12 64 96 0 0 4 4 0 4 4 15,491Elevated Structures - Concrete Batch Plant - - - - 7 - 7 7 - 7 -Lay Track 90 465 716 0 1 32 33 0 30 30 113,434Lay Track - Fugitive Dust - - - - 2 - 2 0 - 0 -Lay Track - Concrete Batch Plant - - - - 11 - 11 11 - 11 -Merced Station Construction 1 7 4 0 0 0 0 0 0 0 1,566Fresno Station Construction 0 5 3 0 - - 0 - - 0 1,127Material Hauling 3 8 44 157 0 - 6 6 - 5 5 23,936Systems - Traction Power Supply Station 0 1 2 0 0 0 0 0 0 0 247Systems - Switching Station 0 2 3 0 0 0 0 0 0 0 462Systems - Paralleling Station 1 3 4 0 0 0 0 0 0 0 6162017 Construction
Roadway Crossings 2 13 61 88 0 6 4 10 1 4 5 14,561Elevated Structures - Construction 12 64 96 0 0 4 4 0 4 4 15,491Elevated Structures - Concrete Batch Plant - - - - 7 - 7 7 - 7 -Lay Track 67 347 536 0 1 24 25 0 22 22 84,833Lay Track - Fugitive Dust - - - - 2 - 2 0 - 0 -Lay Track - Concrete Batch Plant - - - - 11 - 11 11 - 11 -Merced Station Construction 1 6 4 0 0 0 0 0 0 0 1,560Fresno Station Construction 0 5 3 0 - - 0 - - 0 1,122Material Hauling 3 6 34 110 0 - 5 5 - 4 4 20,065Systems - Traction Power Supply Station 0 1 1 0 0 0 0 0 0 0 251Systems - Switching Station 0 2 2 0 0 0 0 0 0 0 352Systems - Paralleling Station 0 2 3 0 0 0 0 0 0 0 470Demobilization 21 57 167 0 0 7 7 0 7 7 19,279HMF (Phase I) 0 2 2 0 5 0 5 1 0 1 4002018 ConstructionMerced Station Construction 0 6 3 0 0 0 0 0 0 0 1,566Fresno Station Construction 0 4 3 0 - - 0 - - 0 1,127Material Hauling 3 0 0 1 0 - 0 0 - 0 0 318Systems - Traction Power Supply Station 0 1 1 0 0 0 0 0 0 0 147Systems - Switching Station 0 1 1 0 0 0 0 0 0 0 148Systems - Paralleling Station 0 1 1 0 0 0 0 0 0 0 197Demobilization 53 138 407 0 0 17 17 0 16 16 46,164HMF (Phase 2) - Facility Construction 0 0 0 0 0 0 0 0 0 0 85HMF (Phase 2) - Elevated Structures and Lay Track 0 2 3 0 0 0 0 0 0 0 624HMF (Phase 2) - Lay Track Fugitive Dust - - - - 0 - 0 0 - 0 -HMF (Phase 2) - Elevated Structures Concrete Batch Plant - - - - 0 - 0 0 - 0 -HMF (Phase 2) - Lay Track Concrete Batch Plant - - - - 0 - 0 0 - 0 -2019 ConstructionMerced Station Construction 5 1 0 0 0 0 0 0 0 0 264Fresno Station Construction 3 1 1 0 - - 0 - - 0 380Demobilization 56 142 414 0 0 18 18 0 17 17 46,1642021 Construction
Material Hauling 3 6 42 97 0 - 5 5 - 4 4 32,850HMF (Phase 3) - Facility Construction 8 3 2 0 0 0 0 0 0 0 1,256HMF (Phase 3) - Elevated Structures and Lay Track 33 198 217 0 0 9 10 0 8 9 64,076HMF (Phase 3) - Lay Track Fugitive Dust - - - - 1 - 1 0 - 0 -HMF (Phase 3) - Elevated Structures Concrete Batch Plant - - - - 7 - 7 7 - 7 -HMF (Phase 3) - Lay Track Concrete Batch Plant - - - - 24 - 24 24 - 24 -
2013 Total 53 235 598 0 213 24 237 50 22 72 86,9912014 Total 124 634 1,140 1 81 51 132 32 46 78 174,9592015 Total 118 615 1,066 1 61 47 109 27 43 71 168,3952016 Total 115 602 1,000 0 22 44 66 19 40 60 159,0872017 Total 120 580 1,013 0 31 45 76 21 41 62 158,3862018 Total 55 154 420 0 0 17 18 0 17 17 50,3762019 Total 65 144 416 0 0 18 18 0 17 17 46,8082021 Total 47 243 315 0 32 15 47 31 13 44 98,182
Notes:
2. Only the Roadway Projects not included in the Regional Transportation Plan are summed in the emissions above, as they are only occurring due to HST construction.3. Material Hauling PM Exhaust emissions include emissions from running exhaust, tire wear, and brake wear. Emissions occuring outside of the SJVAB are not included.
Construction Phase
Emissions (tpy)
1. Only the worst-case demolition activities were included for each Alternative, regardless of the Wyes (i.e. the BNSF Demolition is the worst-case emissions from either the BNSF Ave 21 or the BNSF Ave 24 Alternative). The totals also include the HMF demolition emissions.

B.1-2 BNSF Ave 21: Summary of Construction Emissions This tab provides the emissions resulting from all construction activities associated with the BNSF Ave 21 Alternative. Data are pulled from other tabs contained within this workbook.
Construction Emissions (Mitigated)
ROG CO NOx SOx PM10 Dust PM10 Exhaust PM10 PM2.5 Dust PM2.5 Exhaust PM2.5 CO2
2013 ConstructionMobilization 8 80 27 0 0 1 1 0 1 1 30,952Site Preparation - Demolition 1 9 48 130 0 183 5 188 38 4 43 24,711Site Preparation - Land Clearing 0 1 0 0 0 0 0 0 0 0 293Earth Moving 0 3 1 0 4 0 4 1 0 1 524Roadway Crossings 2 4 49 10 0 4 0 4 1 0 1 11,152Elevated Structures - Construction 2 33 6 0 0 0 0 0 0 0 7,851Elevated Structures - Concrete Batch Plant - - - - 0 - 0 0 - 0 -Material Hauling 3 1 7 7 0 - 1 1 - 1 1 11,4632014 ConstructionEarth Moving 0 2 0 0 11 0 11 2 0 2 503Roadway Crossings 2 2 26 5 0 2 0 2 0 0 1 5,435Elevated Structures - Construction 5 64 11 0 0 0 1 0 0 0 15,491Elevated Structures - Concrete Batch Plant - - - - 0 - 0 0 - 0 -Lay Track 35 465 85 0 1 4 5 0 3 4 113,434Lay Track - Fugitive Dust - - - - 2 - 2 0 - 0 -Lay Track - Concrete Batch Plant - - - - 0 - 0 0 - 0 -Merced Station Construction 0 1 0 0 0 0 0 0 0 0 103Fresno Station Construction 0 0 0 0 - - 0 - - 0 27Material Hauling 3 7 38 116 0 - 5 5 - 4 4 39,8422015 ConstructionEarth Moving 0 1 0 0 7 0 7 2 0 2 203Roadway Crossings 2 1 14 2 0 1 0 1 0 0 0 3,067Elevated Structures - Construction 5 64 11 0 0 0 1 0 0 0 15,491Elevated Structures - Concrete Batch Plant - - - - 0 - 0 0 - 0 -Lay Track 35 465 85 0 1 4 5 0 3 4 113,434Lay Track - Fugitive Dust - - - - 2 - 2 0 - 0 -Lay Track - Concrete Batch Plant - - - - 0 - 0 0 - 0 -Merced Station Construction 0 5 2 0 1 0 1 0 0 0 994Fresno Station Construction 0 3 0 0 - - 1 - - 0 584Material Hauling 3 6 35 109 0 - 4 4 - 4 4 34,5202016 Construction
Roadway Crossings 2 1 11 2 0 1 0 1 0 0 0 2,209Elevated Structures - Construction 5 64 11 0 0 0 1 0 0 0 15,491Elevated Structures - Concrete Batch Plant - - - - 0 - 0 0 - 0 -Lay Track 35 465 85 0 1 4 5 0 3 4 113,434Lay Track - Fugitive Dust - - - - 2 - 2 0 - 0 -Lay Track - Concrete Batch Plant - - - - 0 - 0 0 - 0 -Merced Station Construction 0 7 3 0 0 0 0 0 0 0 1,566Fresno Station Construction 0 5 0 0 - - 0 - - 0 1,127Material Hauling 3 5 29 97 0 - 3 3 - 3 3 23,875Systems - Traction Power Supply Station 0 1 0 0 0 0 0 0 0 0 247Systems - Switching Station 0 2 0 0 0 0 0 0 0 0 462Systems - Paralleling Station 0 3 0 0 0 0 0 0 0 0 6162017 Construction
Roadway Crossings 2 5 61 10 0 5 0 5 1 0 1 14,561Elevated Structures - Construction 5 64 11 0 0 0 1 0 0 0 15,491Elevated Structures - Concrete Batch Plant - - - - 0 - 0 0 - 0 -Lay Track 26 347 64 0 1 3 3 0 3 3 84,833Lay Track - Fugitive Dust - - - - 2 - 2 0 - 0 -Lay Track - Concrete Batch Plant - - - - 0 - 0 0 - 0 -Merced Station Construction 0 6 2 0 0 0 0 0 0 0 1,560Fresno Station Construction 0 5 0 0 - - 0 - - 0 1,122Material Hauling 3 3 21 64 0 - 3 3 - 2 2 20,010Systems - Traction Power Supply Station 0 1 0 0 0 0 0 0 0 0 251Systems - Switching Station 0 2 0 0 0 0 0 0 0 0 352Systems - Paralleling Station 0 2 0 0 0 0 0 0 0 0 470Demobilization 7 57 19 0 0 1 1 0 1 1 19,279HMF (Phase I) 0 2 0 0 5 0 5 1 0 1 4002018 ConstructionMerced Station Construction 0 6 2 0 0 0 0 0 0 0 1,566Fresno Station Construction 0 4 0 0 - - 0 - - 0 1,127Material Hauling 3 0 0 1 0 - 0 0 - 0 0 317Systems - Traction Power Supply Station 0 1 0 0 0 0 0 0 0 0 147Systems - Switching Station 0 1 0 0 0 0 0 0 0 0 148Systems - Paralleling Station 0 1 0 0 0 0 0 0 0 0 197Demobilization 19 138 45 0 0 2 2 0 2 2 46,164HMF (Phase 2) - Facility Construction 0 0 0 0 0 0 0 0 0 0 85HMF (Phase 2) - Elevated Structures and Lay Track 0 2 0 0 0 0 0 0 0 0 624HMF (Phase 2) - Lay Track Fugitive Dust - - - - 0 - 0 0 - 0 -HMF (Phase 2) - Elevated Structures Concrete Batch Plant - - - - 0 - 0 0 - 0 -HMF (Phase 2) - Lay Track Concrete Batch Plant - - - - 0 - 0 0 - 0 -2019 ConstructionMerced Station Construction 5 1 0 0 0 0 0 0 0 0 264Fresno Station Construction 1 1 0 0 - - 0 - - 0 380Demobilization 20 142 46 0 0 2 2 0 2 2 46,1642021 Construction
Material Hauling 3 3 26 49 0 - 3 3 - 2 2 32,743HMF (Phase 3) - Facility Construction 7 3 1 0 0 0 0 0 0 0 1,256HMF (Phase 3) - Elevated Structures and Lay Track 13 198 25 0 0 1 2 0 1 1 64,076HMF (Phase 3) - Lay Track Fugitive Dust - - - - 1 - 1 0 - 0 -HMF (Phase 3) - Elevated Structures Concrete Batch Plant - - - - 0 - 0 0 - 0 -HMF (Phase 3) - Lay Track Concrete Batch Plant - - - - 0 - 0 0 - 0 -
2013 Total 25 220 181 0 191 7 198 40 6 46 86,9462014 Total 49 596 219 1 16 9 26 4 8 12 174,8362015 Total 47 586 210 1 12 9 22 3 8 11 168,2942016 Total 47 586 200 0 4 8 12 1 7 8 159,0262017 Total 47 568 171 0 12 7 20 3 6 9 158,3312018 Total 20 154 49 0 0 2 2 0 2 2 50,3752019 Total 26 144 47 0 0 2 2 0 2 2 46,8082021 Total 23 226 75 0 2 4 6 1 3 4 98,075
Notes:
2. Only the Roadway Projects not included in the Regional Transportation Plan are summed in the emissions above, as they are only occurring due to HST construction.3. Material Hauling PM Exhaust emissions include emissions from running exhaust, tire wear, and brake wear. Emissions occuring outside of the SJVAB are not included.
Construction Phase
Emissions (tpy)
1. Only the worst-case demolition activities were included for each Alternative, regardless of the Wyes (i.e. the BNSF Demolition is the worst-case emissions from either the BNSF Ave 21 or the BNSF Ave 24 Alternative). The totals also include the HMF demolition emissions.
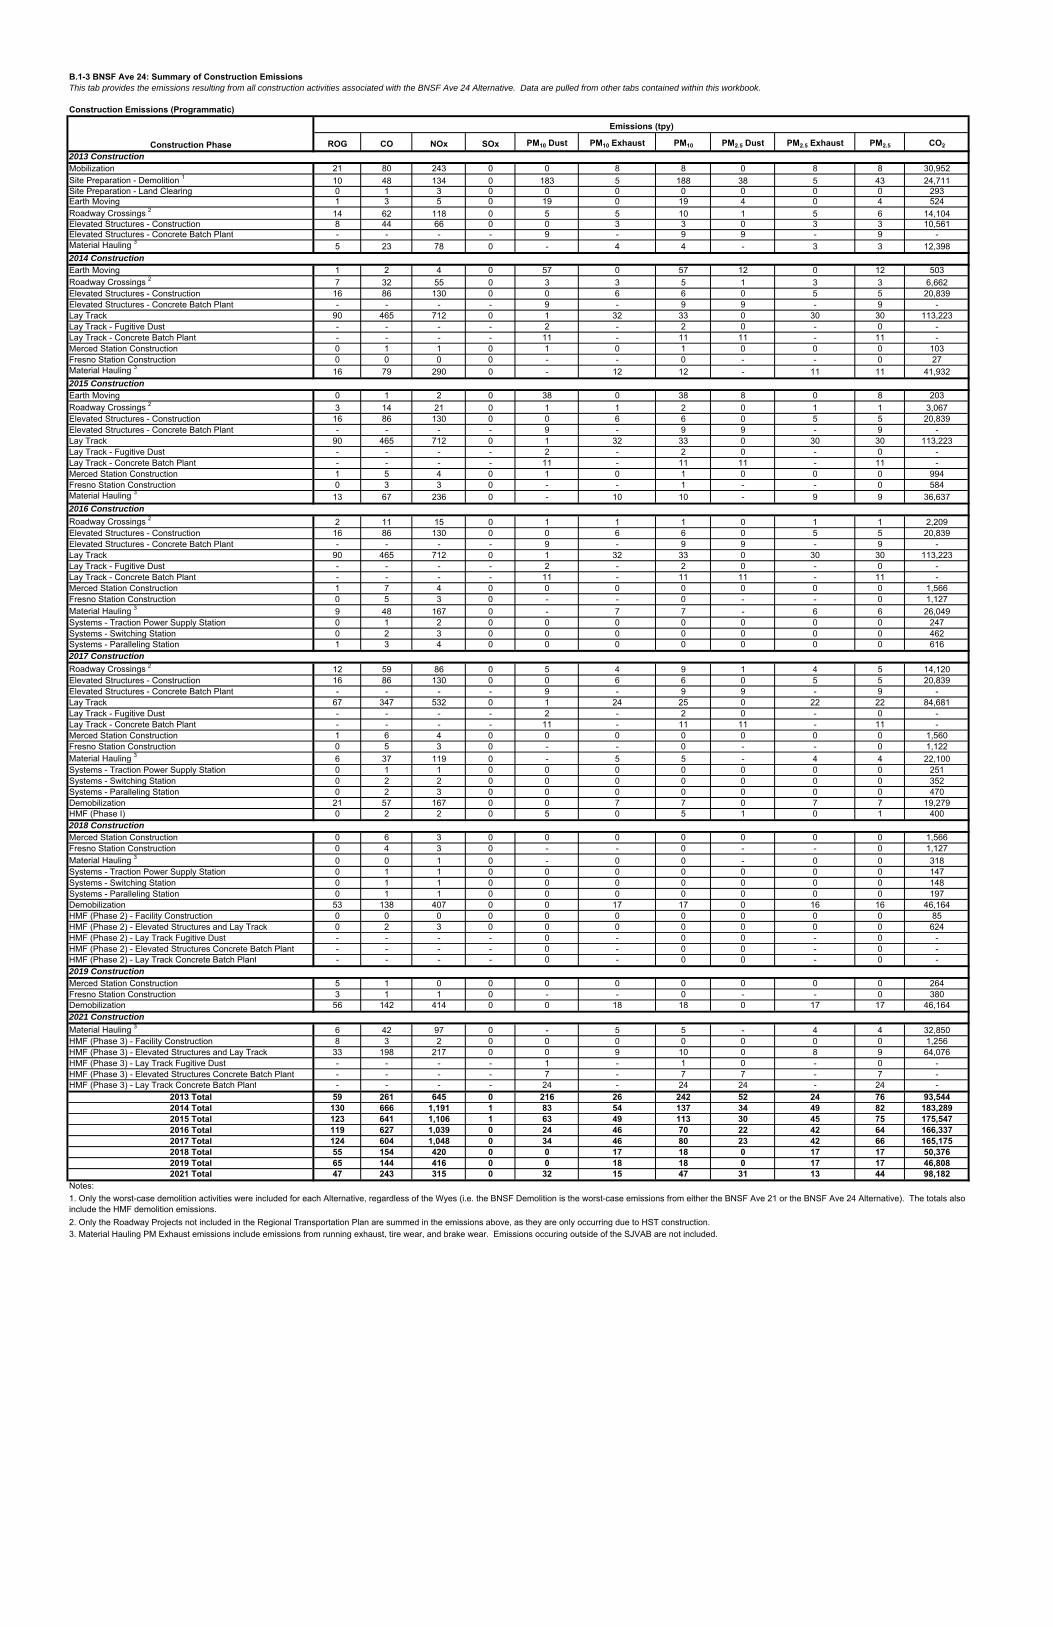
B.1-3 BNSF Ave 24: Summary of Construction Emissions This tab provides the emissions resulting from all construction activities associated with the BNSF Ave 24 Alternative. Data are pulled from other tabs contained within this workbook.
Construction Emissions (Programmatic)
ROG CO NOx SOx PM10 Dust PM10 Exhaust PM10 PM2.5 Dust PM2.5 Exhaust PM2.5 CO2
2013 ConstructionMobilization 21 80 243 0 0 8 8 0 8 8 30,952Site Preparation - Demolition 1 10 48 134 0 183 5 188 38 5 43 24,711Site Preparation - Land Clearing 0 1 3 0 0 0 0 0 0 0 293Earth Moving 1 3 5 0 19 0 19 4 0 4 524Roadway Crossings 2 14 62 118 0 5 5 10 1 5 6 14,104Elevated Structures - Construction 8 44 66 0 0 3 3 0 3 3 10,561Elevated Structures - Concrete Batch Plant - - - - 9 - 9 9 - 9 -Material Hauling 3 5 23 78 0 - 4 4 - 3 3 12,3982014 ConstructionEarth Moving 1 2 4 0 57 0 57 12 0 12 503Roadway Crossings 2 7 32 55 0 3 3 5 1 3 3 6,662Elevated Structures - Construction 16 86 130 0 0 6 6 0 5 5 20,839Elevated Structures - Concrete Batch Plant - - - - 9 - 9 9 - 9 -Lay Track 90 465 712 0 1 32 33 0 30 30 113,223Lay Track - Fugitive Dust - - - - 2 - 2 0 - 0 -Lay Track - Concrete Batch Plant - - - - 11 - 11 11 - 11 -Merced Station Construction 0 1 1 0 1 0 1 0 0 0 103Fresno Station Construction 0 0 0 0 - - 0 - - 0 27Material Hauling 3 16 79 290 0 - 12 12 - 11 11 41,9322015 ConstructionEarth Moving 0 1 2 0 38 0 38 8 0 8 203Roadway Crossings 2 3 14 21 0 1 1 2 0 1 1 3,067Elevated Structures - Construction 16 86 130 0 0 6 6 0 5 5 20,839Elevated Structures - Concrete Batch Plant - - - - 9 - 9 9 - 9 -Lay Track 90 465 712 0 1 32 33 0 30 30 113,223Lay Track - Fugitive Dust - - - - 2 - 2 0 - 0 -Lay Track - Concrete Batch Plant - - - - 11 - 11 11 - 11 -Merced Station Construction 1 5 4 0 1 0 1 0 0 0 994Fresno Station Construction 0 3 3 0 - - 1 - - 0 584Material Hauling 3 13 67 236 0 - 10 10 - 9 9 36,6372016 Construction
Roadway Crossings 2 2 11 15 0 1 1 1 0 1 1 2,209Elevated Structures - Construction 16 86 130 0 0 6 6 0 5 5 20,839Elevated Structures - Concrete Batch Plant - - - - 9 - 9 9 - 9 -Lay Track 90 465 712 0 1 32 33 0 30 30 113,223Lay Track - Fugitive Dust - - - - 2 - 2 0 - 0 -Lay Track - Concrete Batch Plant - - - - 11 - 11 11 - 11 -Merced Station Construction 1 7 4 0 0 0 0 0 0 0 1,566Fresno Station Construction 0 5 3 0 - - 0 - - 0 1,127Material Hauling 3 9 48 167 0 - 7 7 - 6 6 26,049Systems - Traction Power Supply Station 0 1 2 0 0 0 0 0 0 0 247Systems - Switching Station 0 2 3 0 0 0 0 0 0 0 462Systems - Paralleling Station 1 3 4 0 0 0 0 0 0 0 6162017 Construction
Roadway Crossings 2 12 59 86 0 5 4 9 1 4 5 14,120Elevated Structures - Construction 16 86 130 0 0 6 6 0 5 5 20,839Elevated Structures - Concrete Batch Plant - - - - 9 - 9 9 - 9 -Lay Track 67 347 532 0 1 24 25 0 22 22 84,681Lay Track - Fugitive Dust - - - - 2 - 2 0 - 0 -Lay Track - Concrete Batch Plant - - - - 11 - 11 11 - 11 -Merced Station Construction 1 6 4 0 0 0 0 0 0 0 1,560Fresno Station Construction 0 5 3 0 - - 0 - - 0 1,122Material Hauling 3 6 37 119 0 - 5 5 - 4 4 22,100Systems - Traction Power Supply Station 0 1 1 0 0 0 0 0 0 0 251Systems - Switching Station 0 2 2 0 0 0 0 0 0 0 352Systems - Paralleling Station 0 2 3 0 0 0 0 0 0 0 470Demobilization 21 57 167 0 0 7 7 0 7 7 19,279HMF (Phase I) 0 2 2 0 5 0 5 1 0 1 4002018 ConstructionMerced Station Construction 0 6 3 0 0 0 0 0 0 0 1,566Fresno Station Construction 0 4 3 0 - - 0 - - 0 1,127Material Hauling 3 0 0 1 0 - 0 0 - 0 0 318Systems - Traction Power Supply Station 0 1 1 0 0 0 0 0 0 0 147Systems - Switching Station 0 1 1 0 0 0 0 0 0 0 148Systems - Paralleling Station 0 1 1 0 0 0 0 0 0 0 197Demobilization 53 138 407 0 0 17 17 0 16 16 46,164HMF (Phase 2) - Facility Construction 0 0 0 0 0 0 0 0 0 0 85HMF (Phase 2) - Elevated Structures and Lay Track 0 2 3 0 0 0 0 0 0 0 624HMF (Phase 2) - Lay Track Fugitive Dust - - - - 0 - 0 0 - 0 -HMF (Phase 2) - Elevated Structures Concrete Batch Plant - - - - 0 - 0 0 - 0 -HMF (Phase 2) - Lay Track Concrete Batch Plant - - - - 0 - 0 0 - 0 -2019 ConstructionMerced Station Construction 5 1 0 0 0 0 0 0 0 0 264Fresno Station Construction 3 1 1 0 - - 0 - - 0 380Demobilization 56 142 414 0 0 18 18 0 17 17 46,1642021 Construction
Material Hauling 3 6 42 97 0 - 5 5 - 4 4 32,850HMF (Phase 3) - Facility Construction 8 3 2 0 0 0 0 0 0 0 1,256HMF (Phase 3) - Elevated Structures and Lay Track 33 198 217 0 0 9 10 0 8 9 64,076HMF (Phase 3) - Lay Track Fugitive Dust - - - - 1 - 1 0 - 0 -HMF (Phase 3) - Elevated Structures Concrete Batch Plant - - - - 7 - 7 7 - 7 -HMF (Phase 3) - Lay Track Concrete Batch Plant - - - - 24 - 24 24 - 24 -
2013 Total 59 261 645 0 216 26 242 52 24 76 93,5442014 Total 130 666 1,191 1 83 54 137 34 49 82 183,2892015 Total 123 641 1,106 1 63 49 113 30 45 75 175,5472016 Total 119 627 1,039 0 24 46 70 22 42 64 166,3372017 Total 124 604 1,048 0 34 46 80 23 42 66 165,1752018 Total 55 154 420 0 0 17 18 0 17 17 50,3762019 Total 65 144 416 0 0 18 18 0 17 17 46,8082021 Total 47 243 315 0 32 15 47 31 13 44 98,182
Notes:
2. Only the Roadway Projects not included in the Regional Transportation Plan are summed in the emissions above, as they are only occurring due to HST construction.3. Material Hauling PM Exhaust emissions include emissions from running exhaust, tire wear, and brake wear. Emissions occuring outside of the SJVAB are not included.
Construction Phase
Emissions (tpy)
1. Only the worst-case demolition activities were included for each Alternative, regardless of the Wyes (i.e. the BNSF Demolition is the worst-case emissions from either the BNSF Ave 21 or the BNSF Ave 24 Alternative). The totals also include the HMF demolition emissions.

B.1-3 BNSF Ave 24: Summary of Construction Emissions This tab provides the emissions resulting from all construction activities associated with the BNSF Ave 24 Alternative. Data are pulled from other tabs contained within this workbook.
Construction Emissions (Mitigated)
ROG CO NOx SOx PM10 Dust PM10 Exhaust PM10 PM2.5 Dust PM2.5 Exhaust PM2.5 CO2
2013 ConstructionMobilization 8 80 27 0 0 1 1 0 1 1 30,952Site Preparation - Demolition 1 9 48 130 0 183 5 188 38 4 43 24,711Site Preparation - Land Clearing 0 1 0 0 0 0 0 0 0 0 293Earth Moving 0 3 1 0 4 0 4 1 0 1 524Roadway Crossings 2 5 62 13 0 4 1 5 1 0 1 14,104Elevated Structures - Construction 3 44 8 0 0 0 0 0 0 0 10,561Elevated Structures - Concrete Batch Plant - - - - 0 - 0 0 - 0 -Material Hauling 3 1 7 7 0 - 1 1 - 1 1 12,3502014 ConstructionEarth Moving 0 2 0 0 11 0 11 2 0 2 503Roadway Crossings 2 3 32 6 0 2 0 3 0 0 1 6,662Elevated Structures - Construction 6 86 15 0 0 1 1 0 1 1 20,839Elevated Structures - Concrete Batch Plant - - - - 0 - 0 0 - 0 -Lay Track 35 465 85 0 1 4 5 0 3 4 113,223Lay Track - Fugitive Dust - - - - 2 - 2 0 - 0 -Lay Track - Concrete Batch Plant - - - - 0 - 0 0 - 0 -Merced Station Construction 0 1 0 0 0 0 0 0 0 0 103Fresno Station Construction 0 0 0 0 - - 0 - - 0 27Material Hauling 3 7 39 119 0 - 5 5 - 4 4 41,8012015 ConstructionEarth Moving 0 1 0 0 7 0 7 2 0 2 203Roadway Crossings 2 1 14 2 0 1 0 1 0 0 0 3,067Elevated Structures - Construction 6 86 15 0 0 1 1 0 1 1 20,839Elevated Structures - Concrete Batch Plant - - - - 0 - 0 0 - 0 -Lay Track 35 465 85 0 1 4 5 0 3 4 113,223Lay Track - Fugitive Dust - - - - 2 - 2 0 - 0 -Lay Track - Concrete Batch Plant - - - - 0 - 0 0 - 0 -Merced Station Construction 0 5 2 0 1 0 1 0 0 0 994Fresno Station Construction 0 3 0 0 - - 1 - - 0 584Material Hauling 3 6 36 112 0 - 5 5 - 4 4 36,5282016 Construction
Roadway Crossings 2 1 11 2 0 1 0 1 0 0 0 2,209Elevated Structures - Construction 6 86 15 0 0 1 1 0 1 1 20,839Elevated Structures - Concrete Batch Plant - - - - 0 - 0 0 - 0 -Lay Track 35 465 85 0 1 4 5 0 3 4 113,223Lay Track - Fugitive Dust - - - - 2 - 2 0 - 0 -Lay Track - Concrete Batch Plant - - - - 0 - 0 0 - 0 -Merced Station Construction 0 7 3 0 0 0 0 0 0 0 1,566Fresno Station Construction 0 5 0 0 - - 0 - - 0 1,127Material Hauling 3 5 30 100 0 - 4 4 - 3 3 25,981Systems - Traction Power Supply Station 0 1 0 0 0 0 0 0 0 0 247Systems - Switching Station 0 2 0 0 0 0 0 0 0 0 462Systems - Paralleling Station 0 3 0 0 0 0 0 0 0 0 6162017 Construction
Roadway Crossings 2 5 59 10 0 5 0 5 1 0 1 14,120Elevated Structures - Construction 6 86 15 0 0 1 1 0 1 1 20,839Elevated Structures - Concrete Batch Plant - - - - 0 - 0 0 - 0 -Lay Track 26 347 64 0 1 3 3 0 2 3 84,681Lay Track - Fugitive Dust - - - - 2 - 2 0 - 0 -Lay Track - Concrete Batch Plant - - - - 0 - 0 0 - 0 -Merced Station Construction 0 6 2 0 0 0 0 0 0 0 1,560Fresno Station Construction 0 5 0 0 - - 0 - - 0 1,122Material Hauling 3 3 23 66 0 - 3 3 - 2 2 22,038Systems - Traction Power Supply Station 0 1 0 0 0 0 0 0 0 0 251Systems - Switching Station 0 2 0 0 0 0 0 0 0 0 352Systems - Paralleling Station 0 2 0 0 0 0 0 0 0 0 470Demobilization 7 57 19 0 0 1 1 0 1 1 19,279HMF (Phase I) 0 2 0 0 5 0 5 1 0 1 4002018 ConstructionMerced Station Construction 0 6 2 0 0 0 0 0 0 0 1,566Fresno Station Construction 0 4 0 0 - - 0 - - 0 1,127Material Hauling 3 0 0 1 0 - 0 0 - 0 0 317Systems - Traction Power Supply Station 0 1 0 0 0 0 0 0 0 0 147Systems - Switching Station 0 1 0 0 0 0 0 0 0 0 148Systems - Paralleling Station 0 1 0 0 0 0 0 0 0 0 197Demobilization 19 138 45 0 0 2 2 0 2 2 46,164HMF (Phase 2) - Facility Construction 0 0 0 0 0 0 0 0 0 0 85HMF (Phase 2) - Elevated Structures and Lay Track 0 2 0 0 0 0 0 0 0 0 624HMF (Phase 2) - Lay Track Fugitive Dust - - - - 0 - 0 0 - 0 -HMF (Phase 2) - Elevated Structures Concrete Batch Plant - - - - 0 - 0 0 - 0 -HMF (Phase 2) - Lay Track Concrete Batch Plant - - - - 0 - 0 0 - 0 -2019 ConstructionMerced Station Construction 5 1 0 0 0 0 0 0 0 0 264Fresno Station Construction 1 1 0 0 - - 0 - - 0 380Demobilization 20 142 46 0 0 2 2 0 2 2 46,1642021 Construction
Material Hauling 3 3 26 49 0 - 3 3 - 2 2 32,743HMF (Phase 3) - Facility Construction 7 3 1 0 0 0 0 0 0 0 1,256HMF (Phase 3) - Elevated Structures and Lay Track 13 198 25 0 0 1 2 0 1 1 64,076HMF (Phase 3) - Lay Track Fugitive Dust - - - - 1 - 1 0 - 0 -HMF (Phase 3) - Elevated Structures Concrete Batch Plant - - - - 0 - 0 0 - 0 -HMF (Phase 3) - Lay Track Concrete Batch Plant - - - - 0 - 0 0 - 0 -
2013 Total 27 245 186 0 192 8 199 40 7 47 93,4952014 Total 51 626 226 1 17 10 27 4 8 12 183,1582015 Total 49 610 217 1 12 9 22 3 8 11 175,4382016 Total 48 610 206 0 4 8 12 1 7 8 166,2692017 Total 49 589 177 0 12 7 20 3 6 9 165,1132018 Total 20 154 49 0 0 2 2 0 2 2 50,3752019 Total 26 144 47 0 0 2 2 0 2 2 46,8082021 Total 23 226 75 0 2 4 6 1 3 4 98,075
Notes:
2. Only the Roadway Projects not included in the Regional Transportation Plan are summed in the emissions above, as they are only occurring due to HST construction.3. Material Hauling PM Exhaust emissions include emissions from running exhaust, tire wear, and brake wear. Emissions occuring outside of the SJVAB are not included.
Construction Phase
Emissions (tpy)
1. Only the worst-case demolition activities were included for each Alternative, regardless of the Wyes (i.e. the BNSF Demolition is the worst-case emissions from either the BNSF Ave 21 or the BNSF Ave 24 Alternative). The totals also include the HMF demolition emissions.

B.1-4 UPRR Ave 21: Summary of Construction Emissions This tab provides the emissions resulting from all construction activities associated with the UPRR Ave 21 Alternative. Data are pulled from other tabs contained within this workbook.
Construction Emissions (Programmatic)
ROG CO NOx SOx PM10 Dust PM10 Exhaust PM10 PM2.5 Dust PM2.5 Exhaust PM2.5 CO2
2013 ConstructionMobilization 21 80 243 0 0 8 8 0 8 8 30,952Site Preparation - Demolition 1 13 63 176 0 243 7 250 51 6 57 32,729Site Preparation - Land Clearing 0 1 3 0 0 0 0 0 0 0 293Earth Moving 1 3 5 0 14 0 14 3 0 3 524Roadway Crossings 2 7 32 60 0 3 3 5 1 2 3 7,216Elevated Structures - Construction 18 96 144 0 0 6 7 0 6 6 23,165Elevated Structures - Concrete Batch Plant - - - - 20 - 20 20 - 20 -Material Hauling 3 5 27 92 0 - 5 5 - 4 4 14,5482014 ConstructionEarth Moving 1 2 4 0 43 0 43 9 0 9 503Roadway Crossings 2 5 24 40 0 2 2 4 0 2 2 4,999Elevated Structures - Construction 35 189 284 0 0 13 13 0 12 12 45,709Elevated Structures - Concrete Batch Plant - - - - 20 - 20 20 - 20 -Lay Track 69 373 543 0 1 25 26 0 23 23 89,087Lay Track - Fugitive Dust - - - - 1 - 1 0 - 0 -Lay Track - Concrete Batch Plant - - - - 9 - 9 9 - 9 -Merced Station Construction 0 1 1 0 1 0 1 0 0 0 103Fresno Station Construction 0 0 0 0 - - 0 - - 0 27Material Hauling 3 16 82 295 0 - 13 13 - 11 11 43,7422015 ConstructionEarth Moving 0 1 2 0 28 0 28 6 0 6 203Roadway Crossings 2 6 29 43 0 2 2 4 0 2 2 6,245Elevated Structures - Construction 35 189 284 0 0 13 13 0 12 12 45,709Elevated Structures - Concrete Batch Plant - - - - 20 - 20 20 - 20 -Lay Track 69 373 543 0 1 25 26 0 23 23 89,087Lay Track - Fugitive Dust - - - - 1 - 1 0 - 0 -Lay Track - Concrete Batch Plant - - - - 9 - 9 9 - 9 -Merced Station Construction 1 5 4 0 1 0 1 0 0 0 994Fresno Station Construction 0 3 3 0 - - 1 - - 0 584Material Hauling 3 14 71 245 0 - 11 11 - 9 9 39,8032016 Construction
Roadway Crossings 2 5 22 30 0 1 2 3 0 1 2 4,483Elevated Structures - Construction 35 189 284 0 0 13 13 0 12 12 45,709Elevated Structures - Concrete Batch Plant - - - - 20 - 20 20 - 20 -Lay Track 69 373 543 0 1 25 26 0 23 23 89,087Lay Track - Fugitive Dust - - - - 1 - 1 0 - 0 -Lay Track - Concrete Batch Plant - - - - 9 - 9 9 - 9 -Merced Station Construction 1 7 4 0 0 0 0 0 0 0 1,566Fresno Station Construction 0 5 3 0 - - 0 - - 0 1,127Material Hauling 3 10 56 186 0 - 8 8 - 7 7 31,929Systems - Traction Power Supply Station 0 1 2 0 0 0 0 0 0 0 247Systems - Switching Station 0 2 3 0 0 0 0 0 0 0 462Systems - Paralleling Station 1 3 4 0 0 0 0 0 0 0 6162017 Construction
Roadway Crossings 2 15 74 107 0 7 5 12 1 5 6 17,650Elevated Structures - Construction 35 189 284 0 0 13 13 0 12 12 45,709Elevated Structures - Concrete Batch Plant - - - - 20 - 20 20 - 20 -Lay Track 52 277 406 0 1 18 19 0 17 17 66,658Lay Track - Fugitive Dust - - - - 1 - 1 0 - 0 -Lay Track - Concrete Batch Plant - - - - 9 - 9 9 - 9 -Merced Station Construction 1 6 4 0 0 0 0 0 0 0 1,560Fresno Station Construction 0 5 3 0 - - 0 - - 0 1,122Material Hauling 3 8 45 138 0 - 6 6 - 5 5 28,358Systems - Traction Power Supply Station 0 1 1 0 0 0 0 0 0 0 251Systems - Switching Station 0 2 2 0 0 0 0 0 0 0 352Systems - Paralleling Station 0 2 3 0 0 0 0 0 0 0 470Demobilization 21 57 167 0 0 7 7 0 7 7 19,279HMF (Phase I) 0 2 2 0 5 0 5 1 0 1 4002018 ConstructionMerced Station Construction 0 6 3 0 0 0 0 0 0 0 1,566Fresno Station Construction 0 4 3 0 - - 0 - - 0 1,127Material Hauling 3 0 0 1 0 - 0 0 - 0 0 318Systems - Traction Power Supply Station 0 1 1 0 0 0 0 0 0 0 147Systems - Switching Station 0 1 1 0 0 0 0 0 0 0 148Systems - Paralleling Station 0 1 1 0 0 0 0 0 0 0 197Demobilization 53 138 407 0 0 17 17 0 16 16 46,164HMF (Phase 2) - Facility Construction 0 0 0 0 0 0 0 0 0 0 85HMF (Phase 2) - Elevated Structures and Lay Track 0 2 3 0 0 0 0 0 0 0 624HMF (Phase 2) - Lay Track Fugitive Dust - - - - 0 - 0 0 - 0 -HMF (Phase 2) - Elevated Structures Concrete Batch Plant - - - - 0 - 0 0 - 0 -HMF (Phase 2) - Lay Track Concrete Batch Plant - - - - 0 - 0 0 - 0 -2019 ConstructionMerced Station Construction 5 1 0 0 0 0 0 0 0 0 264Fresno Station Construction 3 1 1 0 - - 0 - - 0 380Demobilization 56 142 414 0 0 18 18 0 17 17 46,1642021 Construction
Material Hauling 3 6 42 97 0 - 5 5 - 4 4 32,850HMF (Phase 3) - Facility Construction 8 3 2 0 0 0 0 0 0 0 1,256HMF (Phase 3) - Elevated Structures and Lay Track 33 198 217 0 0 9 10 0 8 9 64,076HMF (Phase 3) - Lay Track Fugitive Dust - - - - 1 - 1 0 - 0 -HMF (Phase 3) - Elevated Structures Concrete Batch Plant - - - - 7 - 7 7 - 7 -HMF (Phase 3) - Lay Track Concrete Batch Plant - - - - 24 - 24 24 - 24 -
2013 Total 65 302 722 0 281 29 310 75 26 101 109,4282014 Total 127 671 1,167 1 76 53 129 39 48 87 184,1692015 Total 125 671 1,123 1 63 50 114 36 46 82 182,6252016 Total 122 657 1,060 1 33 48 81 30 43 73 175,2242017 Total 133 659 1,117 0 43 50 93 32 46 78 181,8092018 Total 55 154 420 0 0 17 18 0 17 17 50,3762019 Total 65 144 416 0 0 18 18 0 17 17 46,8082021 Total 47 243 315 0 32 15 47 31 13 44 98,182
Notes:
2. Only the Roadway Projects not included in the Regional Transportation Plan are summed in the emissions above, as they are only occurring due to HST construction.3. Material Hauling PM Exhaust emissions include emissions from running exhaust, tire wear, and brake wear. Emissions occuring outside of the SJVAB are not included.
Construction Phase
Emissions (tpy)
1. Only the worst-case demolition activities were included for each Alternative, regardless of the Wyes (i.e. the UPRR Demolition is the worst-case emissions from either the UPRR Ave 21 or the UPRR Ave 24 Alternative). The totals also include the HMF demolition emissions.

B.1-4 UPRR Ave 21: Summary of Construction Emissions This tab provides the emissions resulting from all construction activities associated with the UPRR Ave 21 Alternative. Data are pulled from other tabs contained within this workbook.
Construction Emissions (Mitigated)
ROG CO NOx SOx PM10 Dust PM10 Exhaust PM10 PM2.5 Dust PM2.5 Exhaust PM2.5 CO2
2013 ConstructionMobilization 8 80 27 0 0 1 1 0 1 1 30,952Site Preparation - Demolition 1 12 63 173 0 243 6 250 51 6 57 32,729Site Preparation - Land Clearing 0 1 0 0 0 0 0 0 0 0 293Earth Moving 0 3 1 0 3 0 3 1 0 1 524Roadway Crossings 2 3 32 7 0 2 0 3 0 0 1 7,216Elevated Structures - Construction 7 96 17 0 0 1 1 0 1 1 23,165Elevated Structures - Concrete Batch Plant - - - - 0 - 0 0 - 0 -Material Hauling 3 1 8 8 0 - 1 1 - 1 1 14,4922014 ConstructionEarth Moving 0 2 0 0 8 0 8 2 0 2 503Roadway Crossings 2 2 24 5 0 2 0 2 0 0 1 4,999Elevated Structures - Construction 14 189 34 0 0 1 2 0 1 1 45,709Elevated Structures - Concrete Batch Plant - - - - 0 - 0 0 - 0 -Lay Track 27 373 66 0 1 3 4 0 3 3 89,087Lay Track - Fugitive Dust - - - - 1 - 1 0 - 0 -Lay Track - Concrete Batch Plant - - - - 0 - 0 0 - 0 -Merced Station Construction 0 1 0 0 0 0 0 0 0 0 103Fresno Station Construction 0 0 0 0 - - 0 - - 0 27Material Hauling 3 6 39 111 0 - 5 5 - 4 4 43,6022015 ConstructionEarth Moving 0 1 0 0 5 0 5 1 0 1 203Roadway Crossings 2 2 29 5 0 2 0 2 0 0 1 6,245Elevated Structures - Construction 14 189 34 0 0 1 2 0 1 1 45,709Elevated Structures - Concrete Batch Plant - - - - 0 - 0 0 - 0 -Lay Track 27 373 66 0 1 3 4 0 3 3 89,087Lay Track - Fugitive Dust - - - - 1 - 1 0 - 0 -Lay Track - Concrete Batch Plant - - - - 0 - 0 0 - 0 -Merced Station Construction 0 5 2 0 1 0 1 0 0 0 994Fresno Station Construction 0 3 0 0 - - 1 - - 0 584Material Hauling 3 6 37 105 0 - 5 5 - 4 4 39,6802016 Construction
Roadway Crossings 2 2 22 4 0 1 0 1 0 0 0 4,483Elevated Structures - Construction 14 189 34 0 0 1 2 0 1 1 45,709Elevated Structures - Concrete Batch Plant - - - - 0 - 0 0 - 0 -Lay Track 27 373 66 0 1 3 4 0 3 3 89,087Lay Track - Fugitive Dust - - - - 1 - 1 0 - 0 -Lay Track - Concrete Batch Plant - - - - 0 - 0 0 - 0 -Merced Station Construction 0 7 3 0 0 0 0 0 0 0 1,566Fresno Station Construction 0 5 0 0 - - 0 - - 0 1,127Material Hauling 3 5 32 95 0 - 4 4 - 3 3 31,836Systems - Traction Power Supply Station 0 1 0 0 0 0 0 0 0 0 247Systems - Switching Station 0 2 0 0 0 0 0 0 0 0 462Systems - Paralleling Station 0 3 0 0 0 0 0 0 0 0 6162017 Construction
Roadway Crossings 2 6 74 12 0 6 1 7 1 0 2 17,650Elevated Structures - Construction 14 189 34 0 0 1 2 0 1 1 45,709Elevated Structures - Concrete Batch Plant - - - - 0 - 0 0 - 0 -Lay Track 20 277 49 0 1 2 3 0 2 2 66,658Lay Track - Fugitive Dust - - - - 1 - 1 0 - 0 -Lay Track - Concrete Batch Plant - - - - 0 - 0 0 - 0 -Merced Station Construction 0 6 2 0 0 0 0 0 0 0 1,560Fresno Station Construction 0 5 0 0 - - 0 - - 0 1,122Material Hauling 3 4 25 64 0 - 3 3 - 2 2 28,271Systems - Traction Power Supply Station 0 1 0 0 0 0 0 0 0 0 251Systems - Switching Station 0 2 0 0 0 0 0 0 0 0 352Systems - Paralleling Station 0 2 0 0 0 0 0 0 0 0 470Demobilization 7 57 19 0 0 1 1 0 1 1 19,279HMF (Phase I) 0 2 0 0 5 0 5 1 0 1 4002018 ConstructionMerced Station Construction 0 6 2 0 0 0 0 0 0 0 1,566Fresno Station Construction 0 4 0 0 - - 0 - - 0 1,127Material Hauling 3 0 0 1 0 - 0 0 - 0 0 317Systems - Traction Power Supply Station 0 1 0 0 0 0 0 0 0 0 147Systems - Switching Station 0 1 0 0 0 0 0 0 0 0 148Systems - Paralleling Station 0 1 0 0 0 0 0 0 0 0 197Demobilization 19 138 45 0 0 2 2 0 2 2 46,164HMF (Phase 2) - Facility Construction 0 0 0 0 0 0 0 0 0 0 85HMF (Phase 2) - Elevated Structures and Lay Track 0 2 0 0 0 0 0 0 0 0 624HMF (Phase 2) - Lay Track Fugitive Dust - - - - 0 - 0 0 - 0 -HMF (Phase 2) - Elevated Structures Concrete Batch Plant - - - - 0 - 0 0 - 0 -HMF (Phase 2) - Lay Track Concrete Batch Plant - - - - 0 - 0 0 - 0 -2019 ConstructionMerced Station Construction 5 1 0 0 0 0 0 0 0 0 264Fresno Station Construction 1 1 0 0 - - 0 - - 0 380Demobilization 20 142 46 0 0 2 2 0 2 2 46,1642021 Construction
Material Hauling 3 3 26 49 0 - 3 3 - 2 2 32,743HMF (Phase 3) - Facility Construction 7 3 1 0 0 0 0 0 0 0 1,256HMF (Phase 3) - Elevated Structures and Lay Track 13 198 25 0 0 1 2 0 1 1 64,076HMF (Phase 3) - Lay Track Fugitive Dust - - - - 1 - 1 0 - 0 -HMF (Phase 3) - Elevated Structures Concrete Batch Plant - - - - 0 - 0 0 - 0 -HMF (Phase 3) - Lay Track Concrete Batch Plant - - - - 0 - 0 0 - 0 -
2013 Total 31 283 233 0 249 9 259 52 8 61 109,3722014 Total 50 628 216 1 13 10 23 3 8 12 184,0292015 Total 50 636 211 1 11 9 22 3 8 11 182,5022016 Total 49 633 203 1 4 9 13 1 7 9 175,1322017 Total 52 639 182 0 14 8 22 3 7 10 181,7232018 Total 20 154 49 0 0 2 2 0 2 2 50,3752019 Total 26 144 47 0 0 2 2 0 2 2 46,8082021 Total 23 226 75 0 2 4 6 1 3 4 98,075
Notes:
2. Only the Roadway Projects not included in the Regional Transportation Plan are summed in the emissions above, as they are only occurring due to HST construction.3. Material Hauling PM Exhaust emissions include emissions from running exhaust, tire wear, and brake wear. Emissions occuring outside of the SJVAB are not included.
Construction Phase
Emissions (tpy)
1. Only the worst-case demolition activities were included for each Alternative, regardless of the Wyes (i.e. the UPRR Demolition is the worst-case emissions from either the UPRR Ave 21 or the UPRR Ave 24 Alternative). The totals also include the HMF demolition emissions.
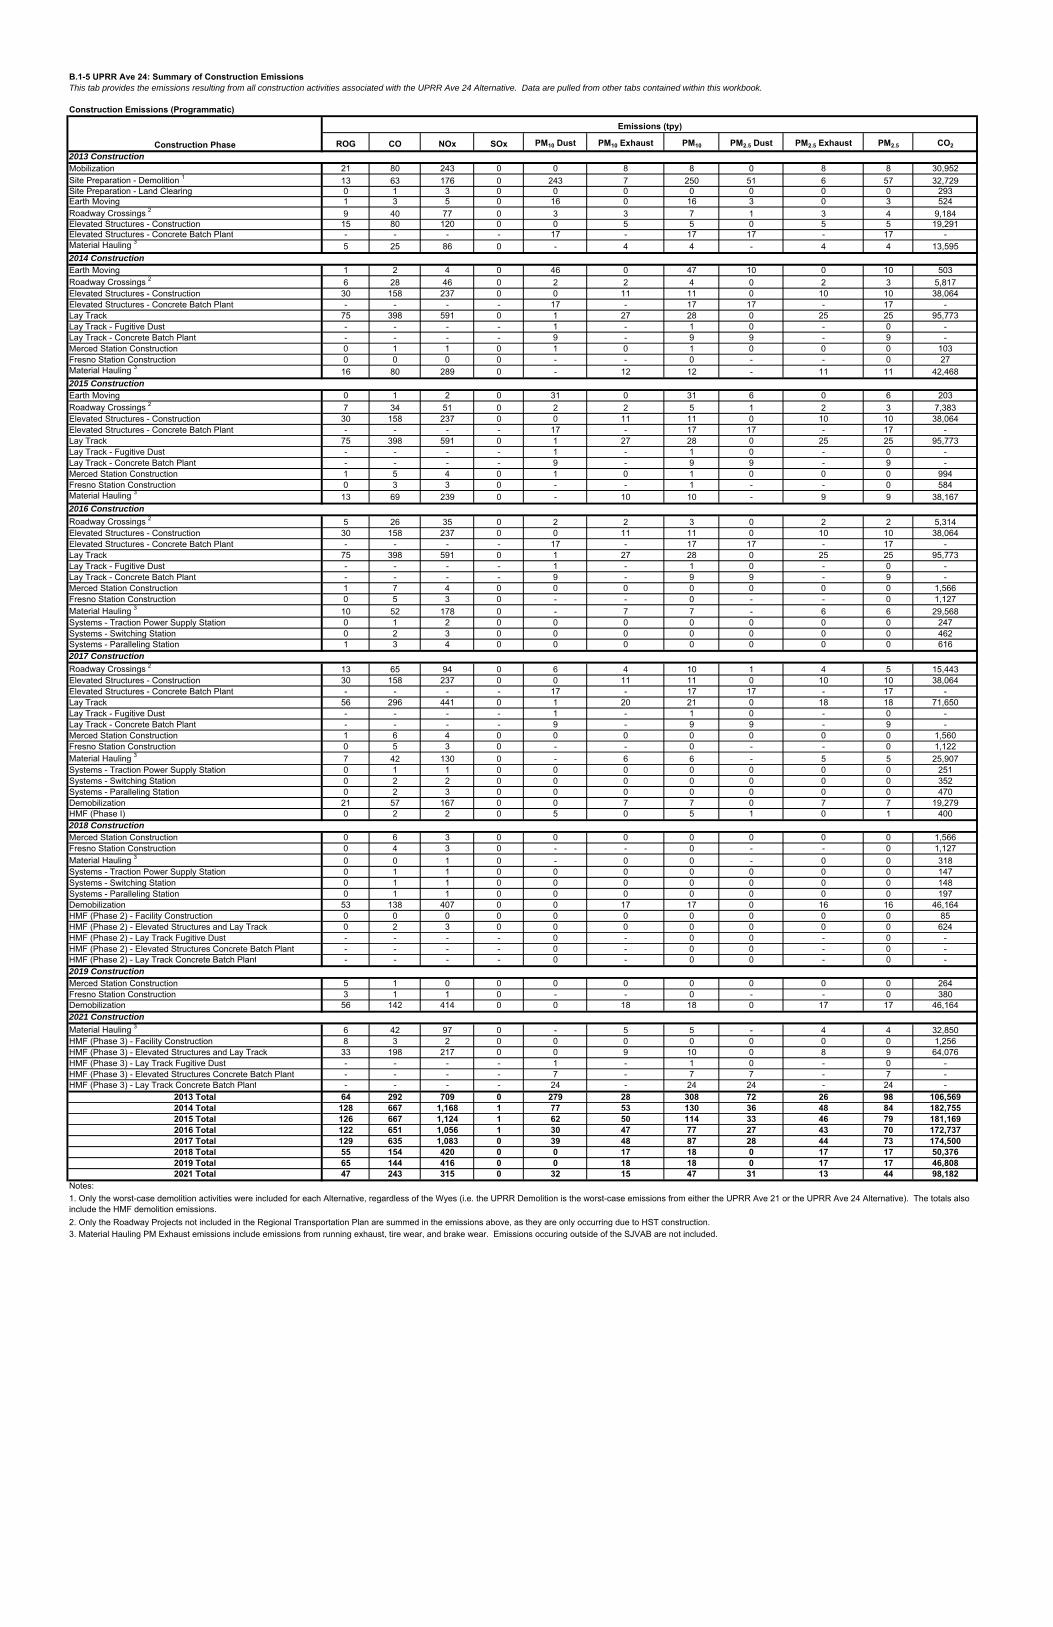
B.1-5 UPRR Ave 24: Summary of Construction Emissions This tab provides the emissions resulting from all construction activities associated with the UPRR Ave 24 Alternative. Data are pulled from other tabs contained within this workbook.
Construction Emissions (Programmatic)
ROG CO NOx SOx PM10 Dust PM10 Exhaust PM10 PM2.5 Dust PM2.5 Exhaust PM2.5 CO2
2013 ConstructionMobilization 21 80 243 0 0 8 8 0 8 8 30,952Site Preparation - Demolition 1 13 63 176 0 243 7 250 51 6 57 32,729Site Preparation - Land Clearing 0 1 3 0 0 0 0 0 0 0 293Earth Moving 1 3 5 0 16 0 16 3 0 3 524Roadway Crossings 2 9 40 77 0 3 3 7 1 3 4 9,184Elevated Structures - Construction 15 80 120 0 0 5 5 0 5 5 19,291Elevated Structures - Concrete Batch Plant - - - - 17 - 17 17 - 17 -Material Hauling 3 5 25 86 0 - 4 4 - 4 4 13,5952014 ConstructionEarth Moving 1 2 4 0 46 0 47 10 0 10 503Roadway Crossings 2 6 28 46 0 2 2 4 0 2 3 5,817Elevated Structures - Construction 30 158 237 0 0 11 11 0 10 10 38,064Elevated Structures - Concrete Batch Plant - - - - 17 - 17 17 - 17 -Lay Track 75 398 591 0 1 27 28 0 25 25 95,773Lay Track - Fugitive Dust - - - - 1 - 1 0 - 0 -Lay Track - Concrete Batch Plant - - - - 9 - 9 9 - 9 -Merced Station Construction 0 1 1 0 1 0 1 0 0 0 103Fresno Station Construction 0 0 0 0 - - 0 - - 0 27Material Hauling 3 16 80 289 0 - 12 12 - 11 11 42,4682015 ConstructionEarth Moving 0 1 2 0 31 0 31 6 0 6 203Roadway Crossings 2 7 34 51 0 2 2 5 1 2 3 7,383Elevated Structures - Construction 30 158 237 0 0 11 11 0 10 10 38,064Elevated Structures - Concrete Batch Plant - - - - 17 - 17 17 - 17 -Lay Track 75 398 591 0 1 27 28 0 25 25 95,773Lay Track - Fugitive Dust - - - - 1 - 1 0 - 0 -Lay Track - Concrete Batch Plant - - - - 9 - 9 9 - 9 -Merced Station Construction 1 5 4 0 1 0 1 0 0 0 994Fresno Station Construction 0 3 3 0 - - 1 - - 0 584Material Hauling 3 13 69 239 0 - 10 10 - 9 9 38,1672016 Construction
Roadway Crossings 2 5 26 35 0 2 2 3 0 2 2 5,314Elevated Structures - Construction 30 158 237 0 0 11 11 0 10 10 38,064Elevated Structures - Concrete Batch Plant - - - - 17 - 17 17 - 17 -Lay Track 75 398 591 0 1 27 28 0 25 25 95,773Lay Track - Fugitive Dust - - - - 1 - 1 0 - 0 -Lay Track - Concrete Batch Plant - - - - 9 - 9 9 - 9 -Merced Station Construction 1 7 4 0 0 0 0 0 0 0 1,566Fresno Station Construction 0 5 3 0 - - 0 - - 0 1,127Material Hauling 3 10 52 178 0 - 7 7 - 6 6 29,568Systems - Traction Power Supply Station 0 1 2 0 0 0 0 0 0 0 247Systems - Switching Station 0 2 3 0 0 0 0 0 0 0 462Systems - Paralleling Station 1 3 4 0 0 0 0 0 0 0 6162017 Construction
Roadway Crossings 2 13 65 94 0 6 4 10 1 4 5 15,443Elevated Structures - Construction 30 158 237 0 0 11 11 0 10 10 38,064Elevated Structures - Concrete Batch Plant - - - - 17 - 17 17 - 17 -Lay Track 56 296 441 0 1 20 21 0 18 18 71,650Lay Track - Fugitive Dust - - - - 1 - 1 0 - 0 -Lay Track - Concrete Batch Plant - - - - 9 - 9 9 - 9 -Merced Station Construction 1 6 4 0 0 0 0 0 0 0 1,560Fresno Station Construction 0 5 3 0 - - 0 - - 0 1,122Material Hauling 3 7 42 130 0 - 6 6 - 5 5 25,907Systems - Traction Power Supply Station 0 1 1 0 0 0 0 0 0 0 251Systems - Switching Station 0 2 2 0 0 0 0 0 0 0 352Systems - Paralleling Station 0 2 3 0 0 0 0 0 0 0 470Demobilization 21 57 167 0 0 7 7 0 7 7 19,279HMF (Phase I) 0 2 2 0 5 0 5 1 0 1 4002018 ConstructionMerced Station Construction 0 6 3 0 0 0 0 0 0 0 1,566Fresno Station Construction 0 4 3 0 - - 0 - - 0 1,127Material Hauling 3 0 0 1 0 - 0 0 - 0 0 318Systems - Traction Power Supply Station 0 1 1 0 0 0 0 0 0 0 147Systems - Switching Station 0 1 1 0 0 0 0 0 0 0 148Systems - Paralleling Station 0 1 1 0 0 0 0 0 0 0 197Demobilization 53 138 407 0 0 17 17 0 16 16 46,164HMF (Phase 2) - Facility Construction 0 0 0 0 0 0 0 0 0 0 85HMF (Phase 2) - Elevated Structures and Lay Track 0 2 3 0 0 0 0 0 0 0 624HMF (Phase 2) - Lay Track Fugitive Dust - - - - 0 - 0 0 - 0 -HMF (Phase 2) - Elevated Structures Concrete Batch Plant - - - - 0 - 0 0 - 0 -HMF (Phase 2) - Lay Track Concrete Batch Plant - - - - 0 - 0 0 - 0 -2019 ConstructionMerced Station Construction 5 1 0 0 0 0 0 0 0 0 264Fresno Station Construction 3 1 1 0 - - 0 - - 0 380Demobilization 56 142 414 0 0 18 18 0 17 17 46,1642021 Construction
Material Hauling 3 6 42 97 0 - 5 5 - 4 4 32,850HMF (Phase 3) - Facility Construction 8 3 2 0 0 0 0 0 0 0 1,256HMF (Phase 3) - Elevated Structures and Lay Track 33 198 217 0 0 9 10 0 8 9 64,076HMF (Phase 3) - Lay Track Fugitive Dust - - - - 1 - 1 0 - 0 -HMF (Phase 3) - Elevated Structures Concrete Batch Plant - - - - 7 - 7 7 - 7 -HMF (Phase 3) - Lay Track Concrete Batch Plant - - - - 24 - 24 24 - 24 -
2013 Total 64 292 709 0 279 28 308 72 26 98 106,5692014 Total 128 667 1,168 1 77 53 130 36 48 84 182,7552015 Total 126 667 1,124 1 62 50 114 33 46 79 181,1692016 Total 122 651 1,056 1 30 47 77 27 43 70 172,7372017 Total 129 635 1,083 0 39 48 87 28 44 73 174,5002018 Total 55 154 420 0 0 17 18 0 17 17 50,3762019 Total 65 144 416 0 0 18 18 0 17 17 46,8082021 Total 47 243 315 0 32 15 47 31 13 44 98,182
Notes:
2. Only the Roadway Projects not included in the Regional Transportation Plan are summed in the emissions above, as they are only occurring due to HST construction.3. Material Hauling PM Exhaust emissions include emissions from running exhaust, tire wear, and brake wear. Emissions occuring outside of the SJVAB are not included.
Construction Phase
Emissions (tpy)
1. Only the worst-case demolition activities were included for each Alternative, regardless of the Wyes (i.e. the UPRR Demolition is the worst-case emissions from either the UPRR Ave 21 or the UPRR Ave 24 Alternative). The totals also include the HMF demolition emissions.

B.1-5 UPRR Ave 24: Summary of Construction Emissions This tab provides the emissions resulting from all construction activities associated with the UPRR Ave 24 Alternative. Data are pulled from other tabs contained within this workbook.
Construction Emissions (Mitigated)
ROG CO NOx SOx PM10 Dust PM10 Exhaust PM10 PM2.5 Dust PM2.5 Exhaust PM2.5 CO2
2013 ConstructionMobilization 8 80 27 0 0 1 1 0 1 1 30,952Site Preparation - Demolition 1 12 63 173 0 243 6 250 51 6 57 32,729Site Preparation - Land Clearing 0 1 0 0 0 0 0 0 0 0 293Earth Moving 0 3 1 0 3 0 3 1 0 1 524Roadway Crossings 2 3 40 9 0 3 0 3 1 0 1 9,184Elevated Structures - Construction 6 80 14 0 0 1 1 0 1 1 19,291Elevated Structures - Concrete Batch Plant - - - - 0 - 0 0 - 0 -Material Hauling 3 1 8 8 0 - 1 1 - 1 1 13,5422014 ConstructionEarth Moving 0 2 0 0 9 0 9 2 0 2 503Roadway Crossings 2 2 28 5 0 2 0 2 0 0 1 5,817Elevated Structures - Construction 11 158 28 0 0 1 1 0 1 1 38,064Elevated Structures - Concrete Batch Plant - - - - 0 - 0 0 - 0 -Lay Track 30 398 71 0 1 3 4 0 3 3 95,773Lay Track - Fugitive Dust - - - - 1 - 1 0 - 0 -Lay Track - Concrete Batch Plant - - - - 0 - 0 0 - 0 -Merced Station Construction 0 1 0 0 0 0 0 0 0 0 103Fresno Station Construction 0 0 0 0 - - 0 - - 0 27Material Hauling 3 6 38 112 0 - 5 5 - 4 4 42,3332015 ConstructionEarth Moving 0 1 0 0 6 0 6 1 0 1 203Roadway Crossings 2 3 34 6 0 2 0 2 0 0 1 7,383Elevated Structures - Construction 11 158 28 0 0 1 1 0 1 1 38,064Elevated Structures - Concrete Batch Plant - - - - 0 - 0 0 - 0 -Lay Track 30 398 71 0 1 3 4 0 3 3 95,773Lay Track - Fugitive Dust - - - - 1 - 1 0 - 0 -Lay Track - Concrete Batch Plant - - - - 0 - 0 0 - 0 -Merced Station Construction 0 5 2 0 1 0 1 0 0 0 994Fresno Station Construction 0 3 0 0 - - 1 - - 0 584Material Hauling 3 6 36 106 0 - 5 5 - 4 4 38,0512016 Construction
Roadway Crossings 2 2 26 5 0 1 0 2 0 0 0 5,314Elevated Structures - Construction 11 158 28 0 0 1 1 0 1 1 38,064Elevated Structures - Concrete Batch Plant - - - - 0 - 0 0 - 0 -Lay Track 30 398 71 0 1 3 4 0 3 3 95,773Lay Track - Fugitive Dust - - - - 1 - 1 0 - 0 -Lay Track - Concrete Batch Plant - - - - 0 - 0 0 - 0 -Merced Station Construction 0 7 3 0 0 0 0 0 0 0 1,566Fresno Station Construction 0 5 0 0 - - 0 - - 0 1,127Material Hauling 3 5 31 96 0 - 4 4 - 3 3 29,485Systems - Traction Power Supply Station 0 1 0 0 0 0 0 0 0 0 247Systems - Switching Station 0 2 0 0 0 0 0 0 0 0 462Systems - Paralleling Station 0 3 0 0 0 0 0 0 0 0 6162017 Construction
Roadway Crossings 2 5 65 11 0 5 0 6 1 0 2 15,443Elevated Structures - Construction 11 158 28 0 0 1 1 0 1 1 38,064Elevated Structures - Concrete Batch Plant - - - - 0 - 0 0 - 0 -Lay Track 22 296 53 0 1 2 3 0 2 2 71,650Lay Track - Fugitive Dust - - - - 1 - 1 0 - 0 -Lay Track - Concrete Batch Plant - - - - 0 - 0 0 - 0 -Merced Station Construction 0 6 2 0 0 0 0 0 0 0 1,560Fresno Station Construction 0 5 0 0 - - 0 - - 0 1,122Material Hauling 3 3 24 64 0 - 3 3 - 2 2 25,829Systems - Traction Power Supply Station 0 1 0 0 0 0 0 0 0 0 251Systems - Switching Station 0 2 0 0 0 0 0 0 0 0 352Systems - Paralleling Station 0 2 0 0 0 0 0 0 0 0 470Demobilization 7 57 19 0 0 1 1 0 1 1 19,279HMF (Phase I) 0 2 0 0 5 0 5 1 0 1 4002018 ConstructionMerced Station Construction 0 6 2 0 0 0 0 0 0 0 1,566Fresno Station Construction 0 4 0 0 - - 0 - - 0 1,127Material Hauling 3 0 0 1 0 - 0 0 - 0 0 317Systems - Traction Power Supply Station 0 1 0 0 0 0 0 0 0 0 147Systems - Switching Station 0 1 0 0 0 0 0 0 0 0 148Systems - Paralleling Station 0 1 0 0 0 0 0 0 0 0 197Demobilization 19 138 45 0 0 2 2 0 2 2 46,164HMF (Phase 2) - Facility Construction 0 0 0 0 0 0 0 0 0 0 85HMF (Phase 2) - Elevated Structures and Lay Track 0 2 0 0 0 0 0 0 0 0 624HMF (Phase 2) - Lay Track Fugitive Dust - - - - 0 - 0 0 - 0 -HMF (Phase 2) - Elevated Structures Concrete Batch Plant - - - - 0 - 0 0 - 0 -HMF (Phase 2) - Lay Track Concrete Batch Plant - - - - 0 - 0 0 - 0 -2019 ConstructionMerced Station Construction 5 1 0 0 0 0 0 0 0 0 264Fresno Station Construction 1 1 0 0 - - 0 - - 0 380Demobilization 20 142 46 0 0 2 2 0 2 2 46,1642021 Construction
Material Hauling 3 3 26 49 0 - 3 3 - 2 2 32,743HMF (Phase 3) - Facility Construction 7 3 1 0 0 0 0 0 0 0 1,256HMF (Phase 3) - Elevated Structures and Lay Track 13 198 25 0 0 1 2 0 1 1 64,076HMF (Phase 3) - Lay Track Fugitive Dust - - - - 1 - 1 0 - 0 -HMF (Phase 3) - Elevated Structures Concrete Batch Plant - - - - 0 - 0 0 - 0 -HMF (Phase 3) - Lay Track Concrete Batch Plant - - - - 0 - 0 0 - 0 -
2013 Total 31 275 231 0 250 9 259 52 8 61 106,5162014 Total 50 625 218 1 14 10 24 4 8 12 182,6212015 Total 50 635 213 1 12 9 22 3 8 11 181,0532016 Total 49 630 204 1 5 9 13 1 7 9 172,6532017 Total 50 617 178 0 13 8 21 3 7 10 174,4222018 Total 20 154 49 0 0 2 2 0 2 2 50,3752019 Total 26 144 47 0 0 2 2 0 2 2 46,8082021 Total 23 226 75 0 2 4 6 1 3 4 98,075
Notes:
2. Only the Roadway Projects not included in the Regional Transportation Plan are summed in the emissions above, as they are only occurring due to HST construction.3. Material Hauling PM Exhaust emissions include emissions from running exhaust, tire wear, and brake wear. Emissions occuring outside of the SJVAB are not included.
Construction Phase
Emissions (tpy)
1. Only the worst-case demolition activities were included for each Alternative, regardless of the Wyes (i.e. the UPRR Demolition is the worst-case emissions from either the UPRR Ave 21 or the UPRR Ave 24 Alternative). The totals also include the HMF demolition emissions.
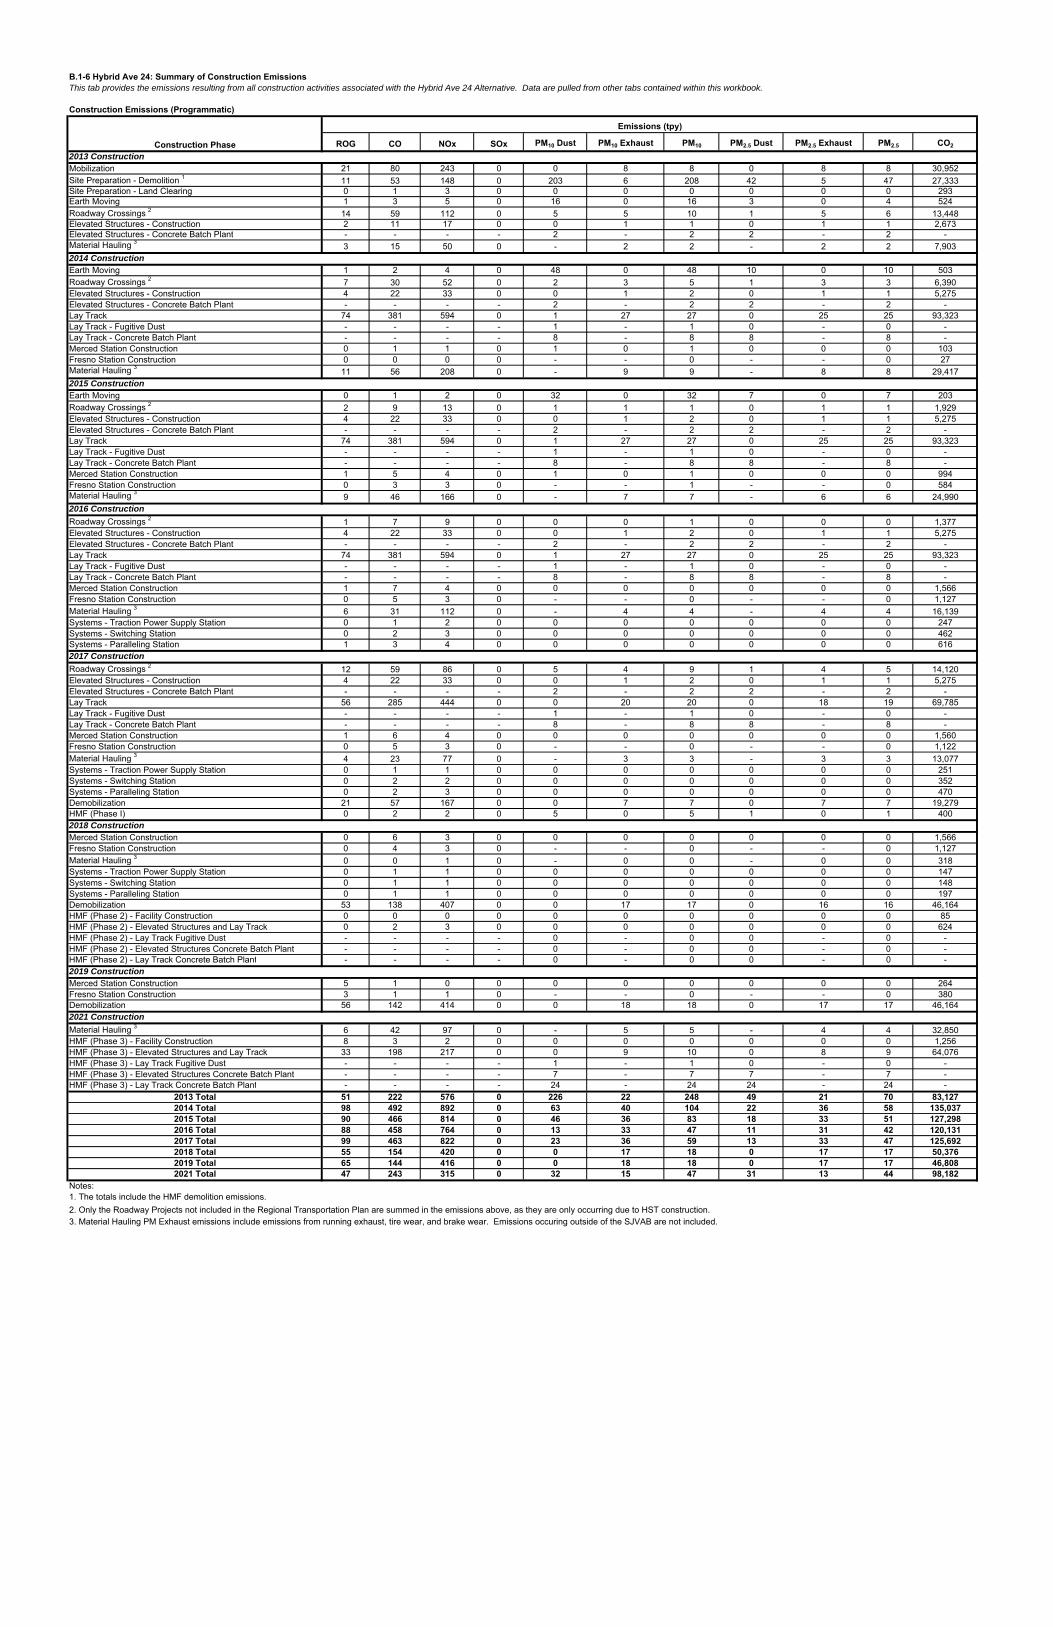
B.1-6 Hybrid Ave 24: Summary of Construction Emissions This tab provides the emissions resulting from all construction activities associated with the Hybrid Ave 24 Alternative. Data are pulled from other tabs contained within this workbook.
Construction Emissions (Programmatic)
ROG CO NOx SOx PM10 Dust PM10 Exhaust PM10 PM2.5 Dust PM2.5 Exhaust PM2.5 CO2
2013 ConstructionMobilization 21 80 243 0 0 8 8 0 8 8 30,952Site Preparation - Demolition 1 11 53 148 0 203 6 208 42 5 47 27,333Site Preparation - Land Clearing 0 1 3 0 0 0 0 0 0 0 293Earth Moving 1 3 5 0 16 0 16 3 0 4 524Roadway Crossings 2 14 59 112 0 5 5 10 1 5 6 13,448Elevated Structures - Construction 2 11 17 0 0 1 1 0 1 1 2,673Elevated Structures - Concrete Batch Plant - - - - 2 - 2 2 - 2 -Material Hauling 3 3 15 50 0 - 2 2 - 2 2 7,9032014 ConstructionEarth Moving 1 2 4 0 48 0 48 10 0 10 503Roadway Crossings 2 7 30 52 0 2 3 5 1 3 3 6,390Elevated Structures - Construction 4 22 33 0 0 1 2 0 1 1 5,275Elevated Structures - Concrete Batch Plant - - - - 2 - 2 2 - 2 -Lay Track 74 381 594 0 1 27 27 0 25 25 93,323Lay Track - Fugitive Dust - - - - 1 - 1 0 - 0 -Lay Track - Concrete Batch Plant - - - - 8 - 8 8 - 8 -Merced Station Construction 0 1 1 0 1 0 1 0 0 0 103Fresno Station Construction 0 0 0 0 - - 0 - - 0 27Material Hauling 3 11 56 208 0 - 9 9 - 8 8 29,4172015 ConstructionEarth Moving 0 1 2 0 32 0 32 7 0 7 203Roadway Crossings 2 2 9 13 0 1 1 1 0 1 1 1,929Elevated Structures - Construction 4 22 33 0 0 1 2 0 1 1 5,275Elevated Structures - Concrete Batch Plant - - - - 2 - 2 2 - 2 -Lay Track 74 381 594 0 1 27 27 0 25 25 93,323Lay Track - Fugitive Dust - - - - 1 - 1 0 - 0 -Lay Track - Concrete Batch Plant - - - - 8 - 8 8 - 8 -Merced Station Construction 1 5 4 0 1 0 1 0 0 0 994Fresno Station Construction 0 3 3 0 - - 1 - - 0 584Material Hauling 3 9 46 166 0 - 7 7 - 6 6 24,9902016 Construction
Roadway Crossings 2 1 7 9 0 0 0 1 0 0 0 1,377Elevated Structures - Construction 4 22 33 0 0 1 2 0 1 1 5,275Elevated Structures - Concrete Batch Plant - - - - 2 - 2 2 - 2 -Lay Track 74 381 594 0 1 27 27 0 25 25 93,323Lay Track - Fugitive Dust - - - - 1 - 1 0 - 0 -Lay Track - Concrete Batch Plant - - - - 8 - 8 8 - 8 -Merced Station Construction 1 7 4 0 0 0 0 0 0 0 1,566Fresno Station Construction 0 5 3 0 - - 0 - - 0 1,127Material Hauling 3 6 31 112 0 - 4 4 - 4 4 16,139Systems - Traction Power Supply Station 0 1 2 0 0 0 0 0 0 0 247Systems - Switching Station 0 2 3 0 0 0 0 0 0 0 462Systems - Paralleling Station 1 3 4 0 0 0 0 0 0 0 6162017 Construction
Roadway Crossings 2 12 59 86 0 5 4 9 1 4 5 14,120Elevated Structures - Construction 4 22 33 0 0 1 2 0 1 1 5,275Elevated Structures - Concrete Batch Plant - - - - 2 - 2 2 - 2 -Lay Track 56 285 444 0 0 20 20 0 18 19 69,785Lay Track - Fugitive Dust - - - - 1 - 1 0 - 0 -Lay Track - Concrete Batch Plant - - - - 8 - 8 8 - 8 -Merced Station Construction 1 6 4 0 0 0 0 0 0 0 1,560Fresno Station Construction 0 5 3 0 - - 0 - - 0 1,122Material Hauling 3 4 23 77 0 - 3 3 - 3 3 13,077Systems - Traction Power Supply Station 0 1 1 0 0 0 0 0 0 0 251Systems - Switching Station 0 2 2 0 0 0 0 0 0 0 352Systems - Paralleling Station 0 2 3 0 0 0 0 0 0 0 470Demobilization 21 57 167 0 0 7 7 0 7 7 19,279HMF (Phase I) 0 2 2 0 5 0 5 1 0 1 4002018 ConstructionMerced Station Construction 0 6 3 0 0 0 0 0 0 0 1,566Fresno Station Construction 0 4 3 0 - - 0 - - 0 1,127Material Hauling 3 0 0 1 0 - 0 0 - 0 0 318Systems - Traction Power Supply Station 0 1 1 0 0 0 0 0 0 0 147Systems - Switching Station 0 1 1 0 0 0 0 0 0 0 148Systems - Paralleling Station 0 1 1 0 0 0 0 0 0 0 197Demobilization 53 138 407 0 0 17 17 0 16 16 46,164HMF (Phase 2) - Facility Construction 0 0 0 0 0 0 0 0 0 0 85HMF (Phase 2) - Elevated Structures and Lay Track 0 2 3 0 0 0 0 0 0 0 624HMF (Phase 2) - Lay Track Fugitive Dust - - - - 0 - 0 0 - 0 -HMF (Phase 2) - Elevated Structures Concrete Batch Plant - - - - 0 - 0 0 - 0 -HMF (Phase 2) - Lay Track Concrete Batch Plant - - - - 0 - 0 0 - 0 -2019 ConstructionMerced Station Construction 5 1 0 0 0 0 0 0 0 0 264Fresno Station Construction 3 1 1 0 - - 0 - - 0 380Demobilization 56 142 414 0 0 18 18 0 17 17 46,1642021 Construction
Material Hauling 3 6 42 97 0 - 5 5 - 4 4 32,850HMF (Phase 3) - Facility Construction 8 3 2 0 0 0 0 0 0 0 1,256HMF (Phase 3) - Elevated Structures and Lay Track 33 198 217 0 0 9 10 0 8 9 64,076HMF (Phase 3) - Lay Track Fugitive Dust - - - - 1 - 1 0 - 0 -HMF (Phase 3) - Elevated Structures Concrete Batch Plant - - - - 7 - 7 7 - 7 -HMF (Phase 3) - Lay Track Concrete Batch Plant - - - - 24 - 24 24 - 24 -
2013 Total 51 222 576 0 226 22 248 49 21 70 83,1272014 Total 98 492 892 0 63 40 104 22 36 58 135,0372015 Total 90 466 814 0 46 36 83 18 33 51 127,2982016 Total 88 458 764 0 13 33 47 11 31 42 120,1312017 Total 99 463 822 0 23 36 59 13 33 47 125,6922018 Total 55 154 420 0 0 17 18 0 17 17 50,3762019 Total 65 144 416 0 0 18 18 0 17 17 46,8082021 Total 47 243 315 0 32 15 47 31 13 44 98,182
Notes:
2. Only the Roadway Projects not included in the Regional Transportation Plan are summed in the emissions above, as they are only occurring due to HST construction.3. Material Hauling PM Exhaust emissions include emissions from running exhaust, tire wear, and brake wear. Emissions occuring outside of the SJVAB are not included.
Construction Phase
Emissions (tpy)
1. The totals include the HMF demolition emissions.

B.1-6 Hybrid Ave 24: Summary of Construction Emissions This tab provides the emissions resulting from all construction activities associated with the Hybrid Ave 24 Alternative. Data are pulled from other tabs contained within this workbook.
Construction Emissions (Mitigated)
ROG CO NOx SOx PM10 Dust PM10 Exhaust PM10 PM2.5 Dust PM2.5 Exhaust PM2.5 CO2
2013 ConstructionMobilization 8 80 27 0 0 1 1 0 1 1 30,952Site Preparation - Demolition 1 10 53 144 0 203 5 208 42 5 47 27,333Site Preparation - Land Clearing 0 1 0 0 0 0 0 0 0 0 293Earth Moving 0 3 1 0 3 0 3 1 0 1 524Roadway Crossings 2 5 59 13 0 4 1 5 1 0 1 13,448Elevated Structures - Construction 1 11 2 0 0 0 0 0 0 0 2,673Elevated Structures - Concrete Batch Plant - - - - 0 - 0 0 - 0 -Material Hauling 3 0 5 5 0 - 1 1 - 0 0 7,8732014 ConstructionEarth Moving 0 2 0 0 9 0 9 2 0 2 503Roadway Crossings 2 3 30 6 0 2 0 2 0 0 1 6,390Elevated Structures - Construction 2 22 4 0 0 0 0 0 0 0 5,275Elevated Structures - Concrete Batch Plant - - - - 0 - 0 0 - 0 -Lay Track 29 381 71 0 1 3 4 0 3 3 93,323Lay Track - Fugitive Dust - - - - 1 - 1 0 - 0 -Lay Track - Concrete Batch Plant - - - - 0 - 0 0 - 0 -Merced Station Construction 0 1 0 0 0 0 0 0 0 0 103Fresno Station Construction 0 0 0 0 - - 0 - - 0 27Material Hauling 3 5 29 91 0 - 4 4 - 3 3 29,3272015 ConstructionEarth Moving 0 1 0 0 6 0 6 1 0 1 203Roadway Crossings 2 1 9 1 0 1 0 1 0 0 0 1,929Elevated Structures - Construction 2 22 4 0 0 0 0 0 0 0 5,275Elevated Structures - Concrete Batch Plant - - - - 0 - 0 0 - 0 -Lay Track 29 381 71 0 1 3 4 0 3 3 93,323Lay Track - Fugitive Dust - - - - 1 - 1 0 - 0 -Lay Track - Concrete Batch Plant - - - - 0 - 0 0 - 0 -Merced Station Construction 0 5 2 0 1 0 1 0 0 0 994Fresno Station Construction 0 3 0 0 - - 1 - - 0 584Material Hauling 3 5 26 85 0 - 3 3 - 3 3 24,9192016 Construction
Roadway Crossings 2 1 7 1 0 0 0 0 0 0 0 1,377Elevated Structures - Construction 2 22 4 0 0 0 0 0 0 0 5,275Elevated Structures - Concrete Batch Plant - - - - 0 - 0 0 - 0 -Lay Track 29 381 71 0 1 3 4 0 3 3 93,323Lay Track - Fugitive Dust - - - - 1 - 1 0 - 0 -Lay Track - Concrete Batch Plant - - - - 0 - 0 0 - 0 -Merced Station Construction 0 7 3 0 0 0 0 0 0 0 1,566Fresno Station Construction 0 5 0 0 - - 0 - - 0 1,127Material Hauling 3 4 21 75 0 - 3 3 - 2 2 16,101Systems - Traction Power Supply Station 0 1 0 0 0 0 0 0 0 0 247Systems - Switching Station 0 2 0 0 0 0 0 0 0 0 462Systems - Paralleling Station 0 3 0 0 0 0 0 0 0 0 6162017 Construction
Roadway Crossings 2 5 59 10 0 5 0 5 1 0 1 14,120Elevated Structures - Construction 2 22 4 0 0 0 0 0 0 0 5,275Elevated Structures - Concrete Batch Plant - - - - 0 - 0 0 - 0 -Lay Track 22 285 53 0 0 2 3 0 2 2 69,785Lay Track - Fugitive Dust - - - - 1 - 1 0 - 0 -Lay Track - Concrete Batch Plant - - - - 0 - 0 0 - 0 -Merced Station Construction 0 6 2 0 0 0 0 0 0 0 1,560Fresno Station Construction 0 5 0 0 - - 0 - - 0 1,122Material Hauling 3 2 15 49 0 - 2 2 - 1 1 13,043Systems - Traction Power Supply Station 0 1 0 0 0 0 0 0 0 0 251Systems - Switching Station 0 2 0 0 0 0 0 0 0 0 352Systems - Paralleling Station 0 2 0 0 0 0 0 0 0 0 470Demobilization 7 57 19 0 0 1 1 0 1 1 19,279HMF (Phase I) 0 2 0 0 5 0 5 1 0 1 4002018 ConstructionMerced Station Construction 0 6 2 0 0 0 0 0 0 0 1,566Fresno Station Construction 0 4 0 0 - - 0 - - 0 1,127Material Hauling 3 0 0 1 0 - 0 0 - 0 0 317Systems - Traction Power Supply Station 0 1 0 0 0 0 0 0 0 0 147Systems - Switching Station 0 1 0 0 0 0 0 0 0 0 148Systems - Paralleling Station 0 1 0 0 0 0 0 0 0 0 197Demobilization 19 138 45 0 0 2 2 0 2 2 46,164HMF (Phase 2) - Facility Construction 0 0 0 0 0 0 0 0 0 0 85HMF (Phase 2) - Elevated Structures and Lay Track 0 2 0 0 0 0 0 0 0 0 624HMF (Phase 2) - Lay Track Fugitive Dust - - - - 0 - 0 0 - 0 -HMF (Phase 2) - Elevated Structures Concrete Batch Plant - - - - 0 - 0 0 - 0 -HMF (Phase 2) - Lay Track Concrete Batch Plant - - - - 0 - 0 0 - 0 -2019 ConstructionMerced Station Construction 5 1 0 0 0 0 0 0 0 0 264Fresno Station Construction 1 1 0 0 - - 0 - - 0 380Demobilization 20 142 46 0 0 2 2 0 2 2 46,1642021 Construction
Material Hauling 3 3 26 49 0 - 3 3 - 2 2 32,743HMF (Phase 3) - Facility Construction 7 3 1 0 0 0 0 0 0 0 1,256HMF (Phase 3) - Elevated Structures and Lay Track 13 198 25 0 0 1 2 0 1 1 64,076HMF (Phase 3) - Lay Track Fugitive Dust - - - - 1 - 1 0 - 0 -HMF (Phase 3) - Elevated Structures Concrete Batch Plant - - - - 0 - 0 0 - 0 -HMF (Phase 3) - Lay Track Concrete Batch Plant - - - - 0 - 0 0 - 0 -
2013 Total 25 211 191 0 210 7 218 44 7 51 83,0962014 Total 38 465 172 0 14 7 22 3 6 9 134,9482015 Total 36 446 163 0 10 7 17 2 6 8 127,2272016 Total 36 448 155 0 3 6 9 1 5 6 120,0932017 Total 39 455 138 0 12 6 17 3 5 8 125,6592018 Total 20 154 49 0 0 2 2 0 2 2 50,3752019 Total 26 144 47 0 0 2 2 0 2 2 46,8082021 Total 23 226 75 0 2 4 6 1 3 4 98,075
Notes:
2. Only the Roadway Projects not included in the Regional Transportation Plan are summed in the emissions above, as they are only occurring due to HST construction.3. Material Hauling PM Exhaust emissions include emissions from running exhaust, tire wear, and brake wear. Emissions occuring outside of the SJVAB are not included.
Construction Phase
Emissions (tpy)
1. The totals include the HMF demolition emissions.

B.1-7 Hybrid Ave 21: Summary of Construction Emissions This tab provides the emissions resulting from all construction activities associated with the Hybrid Ave 21 Alternative. Data are pulled from other tabs contained within this workbook.
Construction Emissions (Programmatic)
ROG CO NOx SOx PM10 Dust PM10 Exhaust PM10 PM2.5 Dust PM2.5 Exhaust PM2.5 CO2
2013 ConstructionMobilization 21 80 243 0 0 8 8 0 8 8 30,952Site Preparation - Demolition 1 11 53 148 0 203 6 208 42 5 47 27,333Site Preparation - Land Clearing 0 1 3 0 0 0 0 0 0 0 293Earth Moving 1 3 5 0 16 0 16 3 0 4 524Roadway Crossings 2 11 46 87 0 4 4 8 1 4 4 10,496Elevated Structures - Construction 9 47 71 0 0 3 3 0 3 3 11,466Elevated Structures - Concrete Batch Plant - - - - 10 - 10 10 - 10 -Material Hauling 3 4 20 69 0 - 3 3 - 3 3 10,9332014 ConstructionEarth Moving 1 2 4 0 48 0 48 10 0 10 503Roadway Crossings 2 6 25 42 0 2 2 4 0 2 2 5,163Elevated Structures - Construction 18 94 141 0 0 6 6 0 6 6 22,624Elevated Structures - Concrete Batch Plant - - - - 10 - 10 10 - 10 -Lay Track 76 394 599 0 1 27 28 0 25 25 95,733Lay Track - Fugitive Dust - - - - 1 - 1 0 - 0 -Lay Track - Concrete Batch Plant - - - - 8 - 8 8 - 8 -Merced Station Construction 0 1 1 0 1 0 1 0 0 0 103Fresno Station Construction 0 0 0 0 - - 0 - - 0 27Material Hauling 3 14 69 252 0 - 11 11 - 9 9 36,5102015 ConstructionEarth Moving 0 1 2 0 32 0 32 7 0 7 203Roadway Crossings 2 2 12 17 0 1 1 2 0 1 1 2,498Elevated Structures - Construction 18 94 141 0 0 6 6 0 6 6 22,624Elevated Structures - Concrete Batch Plant - - - - 10 - 10 10 - 10 -Lay Track 76 394 599 0 1 27 28 0 25 25 95,733Lay Track - Fugitive Dust - - - - 1 - 1 0 - 0 -Lay Track - Concrete Batch Plant - - - - 8 - 8 8 - 8 -Merced Station Construction 1 5 4 0 1 0 1 0 0 0 994Fresno Station Construction 0 3 3 0 - - 1 - - 0 584Material Hauling 3 11 58 206 0 - 9 9 - 8 8 32,1022016 Construction
Roadway Crossings 2 2 9 12 0 0 1 1 0 1 1 1,793Elevated Structures - Construction 18 94 141 0 0 6 6 0 6 6 22,624Elevated Structures - Concrete Batch Plant - - - - 10 - 10 10 - 10 -Lay Track 76 394 599 0 1 27 28 0 25 25 95,733Lay Track - Fugitive Dust - - - - 1 - 1 0 - 0 -Lay Track - Concrete Batch Plant - - - - 8 - 8 8 - 8 -Merced Station Construction 1 7 4 0 0 0 0 0 0 0 1,566Fresno Station Construction 0 5 3 0 - - 0 - - 0 1,127Material Hauling 3 8 42 148 0 - 6 6 - 5 5 23,289Systems - Traction Power Supply Station 0 1 2 0 0 0 0 0 0 0 247Systems - Switching Station 0 2 3 0 0 0 0 0 0 0 462Systems - Paralleling Station 1 3 4 0 0 0 0 0 0 0 6162017 Construction
Roadway Crossings 2 16 76 110 0 7 5 12 1 5 6 18,091Elevated Structures - Construction 18 94 141 0 0 6 6 0 6 6 22,624Elevated Structures - Concrete Batch Plant - - - - 10 - 10 10 - 10 -Lay Track 56 294 448 0 1 20 21 0 19 19 71,605Lay Track - Fugitive Dust - - - - 1 - 1 0 - 0 -Lay Track - Concrete Batch Plant - - - - 8 - 8 8 - 8 -Merced Station Construction 1 6 4 0 0 0 0 0 0 0 1,560Fresno Station Construction 0 5 3 0 - - 0 - - 0 1,122Material Hauling 3 6 33 105 0 - 5 5 - 4 4 19,875Systems - Traction Power Supply Station 0 1 1 0 0 0 0 0 0 0 251Systems - Switching Station 0 2 2 0 0 0 0 0 0 0 352Systems - Paralleling Station 0 2 3 0 0 0 0 0 0 0 470Demobilization 21 57 167 0 0 7 7 0 7 7 19,279HMF (Phase I) 0 2 2 0 5 0 5 1 0 1 4002018 ConstructionMerced Station Construction 0 6 3 0 0 0 0 0 0 0 1,566Fresno Station Construction 0 4 3 0 - - 0 - - 0 1,127Material Hauling 3 0 0 1 0 - 0 0 - 0 0 318Systems - Traction Power Supply Station 0 1 1 0 0 0 0 0 0 0 147Systems - Switching Station 0 1 1 0 0 0 0 0 0 0 148Systems - Paralleling Station 0 1 1 0 0 0 0 0 0 0 197Demobilization 53 138 407 0 0 17 17 0 16 16 46,164HMF (Phase 2) - Facility Construction 0 0 0 0 0 0 0 0 0 0 85HMF (Phase 2) - Elevated Structures and Lay Track 0 2 3 0 0 0 0 0 0 0 624HMF (Phase 2) - Lay Track Fugitive Dust - - - - 0 - 0 0 - 0 -HMF (Phase 2) - Elevated Structures Concrete Batch Plant - - - - 0 - 0 0 - 0 -HMF (Phase 2) - Lay Track Concrete Batch Plant - - - - 0 - 0 0 - 0 -2019 ConstructionMerced Station Construction 5 1 0 0 0 0 0 0 0 0 264Fresno Station Construction 3 1 1 0 - - 0 - - 0 380Demobilization 56 142 414 0 0 18 18 0 17 17 46,1642021 Construction
Material Hauling 3 6 42 97 0 - 5 5 - 4 4 32,850HMF (Phase 3) - Facility Construction 8 3 2 0 0 0 0 0 0 0 1,256HMF (Phase 3) - Elevated Structures and Lay Track 33 198 217 0 0 9 10 0 8 9 64,076HMF (Phase 3) - Lay Track Fugitive Dust - - - - 1 - 1 0 - 0 -HMF (Phase 3) - Elevated Structures Concrete Batch Plant - - - - 7 - 7 7 - 7 -HMF (Phase 3) - Lay Track Concrete Batch Plant - - - - 24 - 24 24 - 24 -
2013 Total 56 251 625 0 233 25 257 56 23 79 91,9972014 Total 114 585 1,039 1 71 47 118 30 42 72 160,6632015 Total 108 567 971 0 54 43 98 26 39 66 154,7392016 Total 105 557 915 0 21 41 62 19 37 56 147,4562017 Total 118 571 986 0 33 44 76 22 40 62 155,6302018 Total 55 154 420 0 0 17 18 0 17 17 50,3762019 Total 65 144 416 0 0 18 18 0 17 17 46,8082021 Total 47 243 315 0 32 15 47 31 13 44 98,182
Notes:
2. Only the Roadway Projects not included in the Regional Transportation Plan are summed in the emissions above, as they are only occurring due to HST construction.3. Material Hauling PM Exhaust emissions include emissions from running exhaust, tire wear, and brake wear. Emissions occuring outside of the SJVAB are not included.
Construction Phase
Emissions (tpy)
1. The totals include the HMF demolition emissions.
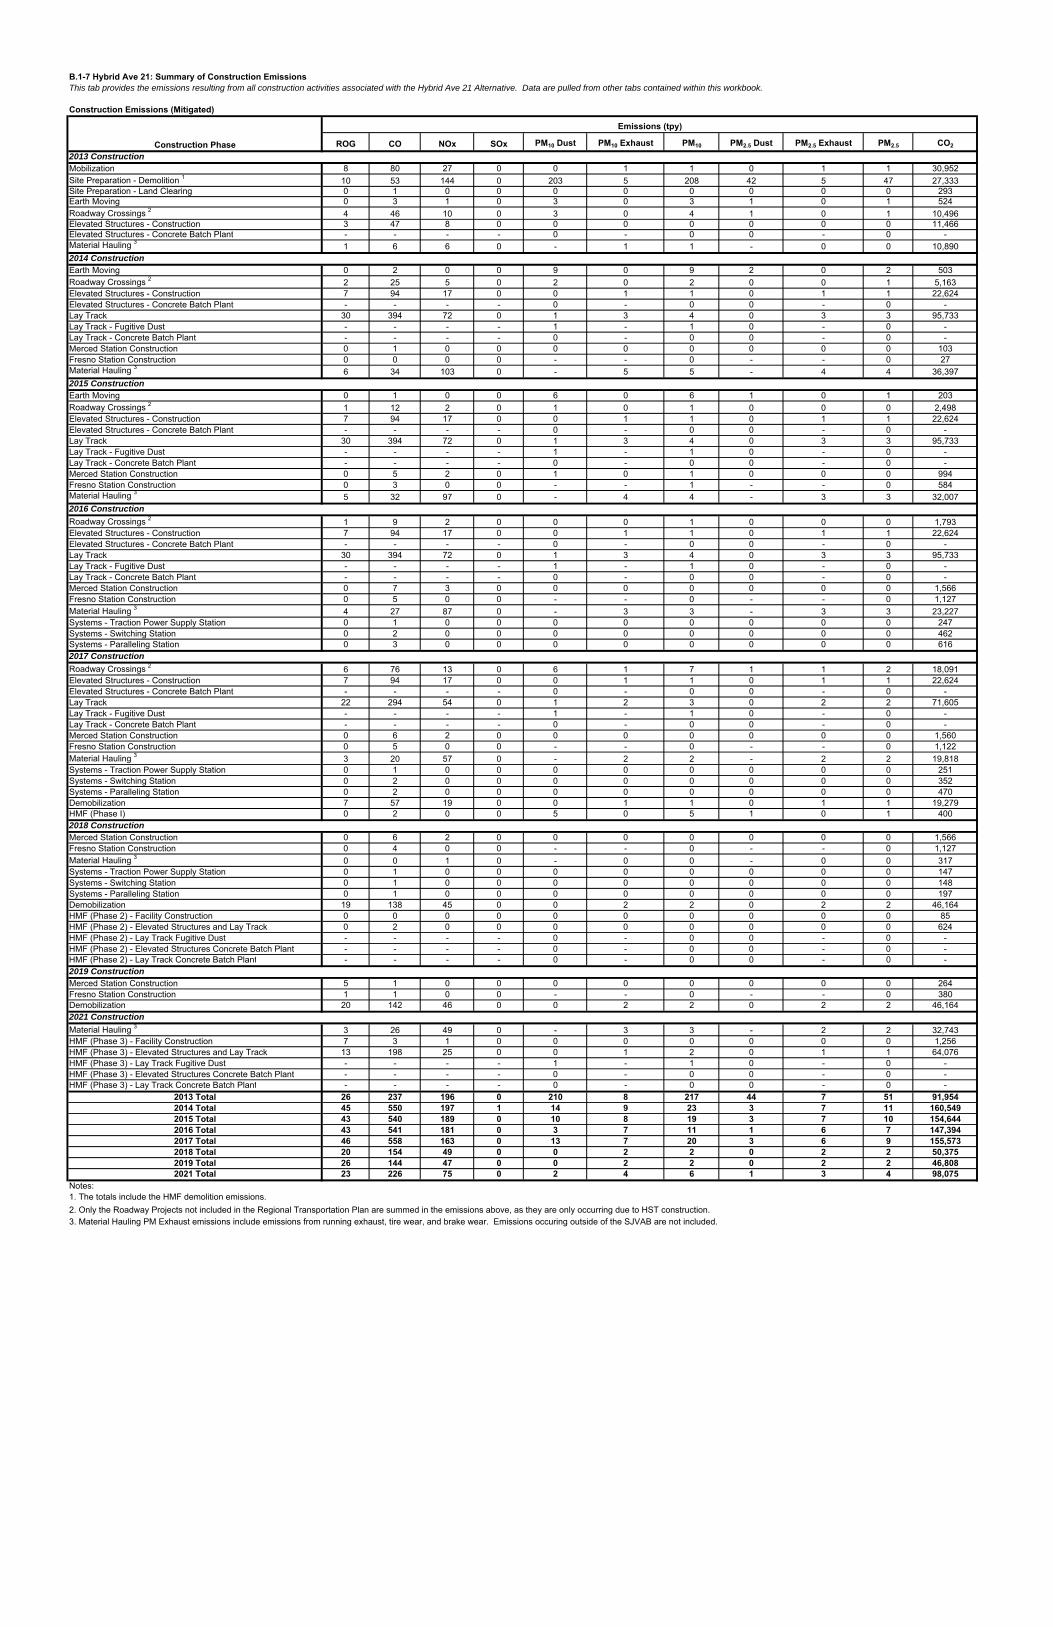
B.1-7 Hybrid Ave 21: Summary of Construction Emissions This tab provides the emissions resulting from all construction activities associated with the Hybrid Ave 21 Alternative. Data are pulled from other tabs contained within this workbook.
Construction Emissions (Mitigated)
ROG CO NOx SOx PM10 Dust PM10 Exhaust PM10 PM2.5 Dust PM2.5 Exhaust PM2.5 CO2
2013 ConstructionMobilization 8 80 27 0 0 1 1 0 1 1 30,952Site Preparation - Demolition 1 10 53 144 0 203 5 208 42 5 47 27,333Site Preparation - Land Clearing 0 1 0 0 0 0 0 0 0 0 293Earth Moving 0 3 1 0 3 0 3 1 0 1 524Roadway Crossings 2 4 46 10 0 3 0 4 1 0 1 10,496Elevated Structures - Construction 3 47 8 0 0 0 0 0 0 0 11,466Elevated Structures - Concrete Batch Plant - - - - 0 - 0 0 - 0 -Material Hauling 3 1 6 6 0 - 1 1 - 0 0 10,8902014 ConstructionEarth Moving 0 2 0 0 9 0 9 2 0 2 503Roadway Crossings 2 2 25 5 0 2 0 2 0 0 1 5,163Elevated Structures - Construction 7 94 17 0 0 1 1 0 1 1 22,624Elevated Structures - Concrete Batch Plant - - - - 0 - 0 0 - 0 -Lay Track 30 394 72 0 1 3 4 0 3 3 95,733Lay Track - Fugitive Dust - - - - 1 - 1 0 - 0 -Lay Track - Concrete Batch Plant - - - - 0 - 0 0 - 0 -Merced Station Construction 0 1 0 0 0 0 0 0 0 0 103Fresno Station Construction 0 0 0 0 - - 0 - - 0 27Material Hauling 3 6 34 103 0 - 5 5 - 4 4 36,3972015 ConstructionEarth Moving 0 1 0 0 6 0 6 1 0 1 203Roadway Crossings 2 1 12 2 0 1 0 1 0 0 0 2,498Elevated Structures - Construction 7 94 17 0 0 1 1 0 1 1 22,624Elevated Structures - Concrete Batch Plant - - - - 0 - 0 0 - 0 -Lay Track 30 394 72 0 1 3 4 0 3 3 95,733Lay Track - Fugitive Dust - - - - 1 - 1 0 - 0 -Lay Track - Concrete Batch Plant - - - - 0 - 0 0 - 0 -Merced Station Construction 0 5 2 0 1 0 1 0 0 0 994Fresno Station Construction 0 3 0 0 - - 1 - - 0 584Material Hauling 3 5 32 97 0 - 4 4 - 3 3 32,0072016 Construction
Roadway Crossings 2 1 9 2 0 0 0 1 0 0 0 1,793Elevated Structures - Construction 7 94 17 0 0 1 1 0 1 1 22,624Elevated Structures - Concrete Batch Plant - - - - 0 - 0 0 - 0 -Lay Track 30 394 72 0 1 3 4 0 3 3 95,733Lay Track - Fugitive Dust - - - - 1 - 1 0 - 0 -Lay Track - Concrete Batch Plant - - - - 0 - 0 0 - 0 -Merced Station Construction 0 7 3 0 0 0 0 0 0 0 1,566Fresno Station Construction 0 5 0 0 - - 0 - - 0 1,127Material Hauling 3 4 27 87 0 - 3 3 - 3 3 23,227Systems - Traction Power Supply Station 0 1 0 0 0 0 0 0 0 0 247Systems - Switching Station 0 2 0 0 0 0 0 0 0 0 462Systems - Paralleling Station 0 3 0 0 0 0 0 0 0 0 6162017 Construction
Roadway Crossings 2 6 76 13 0 6 1 7 1 1 2 18,091Elevated Structures - Construction 7 94 17 0 0 1 1 0 1 1 22,624Elevated Structures - Concrete Batch Plant - - - - 0 - 0 0 - 0 -Lay Track 22 294 54 0 1 2 3 0 2 2 71,605Lay Track - Fugitive Dust - - - - 1 - 1 0 - 0 -Lay Track - Concrete Batch Plant - - - - 0 - 0 0 - 0 -Merced Station Construction 0 6 2 0 0 0 0 0 0 0 1,560Fresno Station Construction 0 5 0 0 - - 0 - - 0 1,122Material Hauling 3 3 20 57 0 - 2 2 - 2 2 19,818Systems - Traction Power Supply Station 0 1 0 0 0 0 0 0 0 0 251Systems - Switching Station 0 2 0 0 0 0 0 0 0 0 352Systems - Paralleling Station 0 2 0 0 0 0 0 0 0 0 470Demobilization 7 57 19 0 0 1 1 0 1 1 19,279HMF (Phase I) 0 2 0 0 5 0 5 1 0 1 4002018 ConstructionMerced Station Construction 0 6 2 0 0 0 0 0 0 0 1,566Fresno Station Construction 0 4 0 0 - - 0 - - 0 1,127Material Hauling 3 0 0 1 0 - 0 0 - 0 0 317Systems - Traction Power Supply Station 0 1 0 0 0 0 0 0 0 0 147Systems - Switching Station 0 1 0 0 0 0 0 0 0 0 148Systems - Paralleling Station 0 1 0 0 0 0 0 0 0 0 197Demobilization 19 138 45 0 0 2 2 0 2 2 46,164HMF (Phase 2) - Facility Construction 0 0 0 0 0 0 0 0 0 0 85HMF (Phase 2) - Elevated Structures and Lay Track 0 2 0 0 0 0 0 0 0 0 624HMF (Phase 2) - Lay Track Fugitive Dust - - - - 0 - 0 0 - 0 -HMF (Phase 2) - Elevated Structures Concrete Batch Plant - - - - 0 - 0 0 - 0 -HMF (Phase 2) - Lay Track Concrete Batch Plant - - - - 0 - 0 0 - 0 -2019 ConstructionMerced Station Construction 5 1 0 0 0 0 0 0 0 0 264Fresno Station Construction 1 1 0 0 - - 0 - - 0 380Demobilization 20 142 46 0 0 2 2 0 2 2 46,1642021 Construction
Material Hauling 3 3 26 49 0 - 3 3 - 2 2 32,743HMF (Phase 3) - Facility Construction 7 3 1 0 0 0 0 0 0 0 1,256HMF (Phase 3) - Elevated Structures and Lay Track 13 198 25 0 0 1 2 0 1 1 64,076HMF (Phase 3) - Lay Track Fugitive Dust - - - - 1 - 1 0 - 0 -HMF (Phase 3) - Elevated Structures Concrete Batch Plant - - - - 0 - 0 0 - 0 -HMF (Phase 3) - Lay Track Concrete Batch Plant - - - - 0 - 0 0 - 0 -
2013 Total 26 237 196 0 210 8 217 44 7 51 91,9542014 Total 45 550 197 1 14 9 23 3 7 11 160,5492015 Total 43 540 189 0 10 8 19 3 7 10 154,6442016 Total 43 541 181 0 3 7 11 1 6 7 147,3942017 Total 46 558 163 0 13 7 20 3 6 9 155,5732018 Total 20 154 49 0 0 2 2 0 2 2 50,3752019 Total 26 144 47 0 0 2 2 0 2 2 46,8082021 Total 23 226 75 0 2 4 6 1 3 4 98,075
Notes:
2. Only the Roadway Projects not included in the Regional Transportation Plan are summed in the emissions above, as they are only occurring due to HST construction.3. Material Hauling PM Exhaust emissions include emissions from running exhaust, tire wear, and brake wear. Emissions occuring outside of the SJVAB are not included.
Construction Phase
Emissions (tpy)
1. The totals include the HMF demolition emissions.
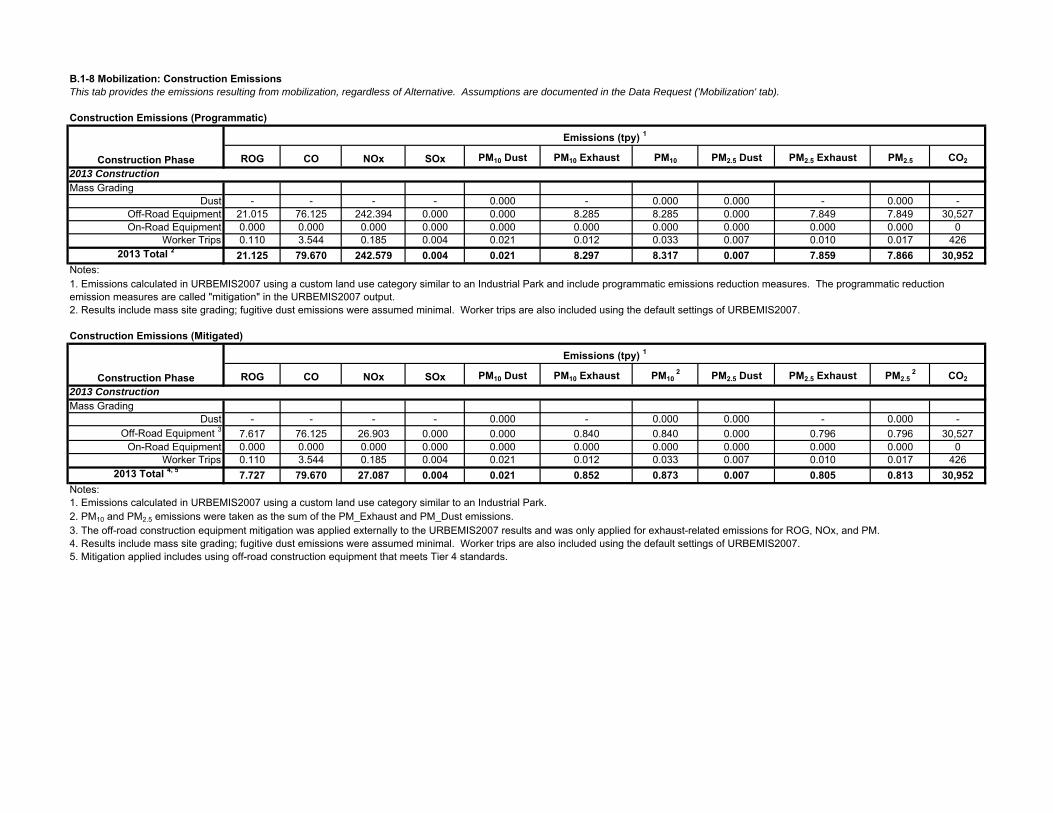
B.1-8 Mobilization: Construction EmissionsThis tab provides the emissions resulting from mobilization, regardless of Alternative. Assumptions are documented in the Data Request ('Mobilization' tab).
Construction Emissions (Programmatic)
ROG CO NOx SOx PM10 Dust PM10 Exhaust PM10 PM2.5 Dust PM2.5 Exhaust PM2.5 CO2
2013 ConstructionMass Grading
Dust - - - - 0.000 - 0.000 0.000 - 0.000 -Off-Road Equipment 21.015 76.125 242.394 0.000 0.000 8.285 8.285 0.000 7.849 7.849 30,527On-Road Equipment 0.000 0.000 0.000 0.000 0.000 0.000 0.000 0.000 0.000 0.000 0
Worker Trips 0.110 3.544 0.185 0.004 0.021 0.012 0.033 0.007 0.010 0.017 4262013 Total 2 21.125 79.670 242.579 0.004 0.021 8.297 8.317 0.007 7.859 7.866 30,952
Notes:
2. Results include mass site grading; fugitive dust emissions were assumed minimal. Worker trips are also included using the default settings of URBEMIS2007.
Construction Emissions (Mitigated)
ROG CO NOx SOx PM10 Dust PM10 Exhaust PM10 2 PM2.5 Dust PM2.5 Exhaust PM2.5
2 CO2
2013 ConstructionMass Grading
Dust - - - - 0.000 - 0.000 0.000 - 0.000 -Off-Road Equipment 3 7.617 76.125 26.903 0.000 0.000 0.840 0.840 0.000 0.796 0.796 30,527
On-Road Equipment 0.000 0.000 0.000 0.000 0.000 0.000 0.000 0.000 0.000 0.000 0Worker Trips 0.110 3.544 0.185 0.004 0.021 0.012 0.033 0.007 0.010 0.017 426
2013 Total 4, 5 7.727 79.670 27.087 0.004 0.021 0.852 0.873 0.007 0.805 0.813 30,952Notes:1. Emissions calculated in URBEMIS2007 using a custom land use category similar to an Industrial Park.2. PM10 and PM2.5 emissions were taken as the sum of the PM_Exhaust and PM_Dust emissions.3. The off-road construction equipment mitigation was applied externally to the URBEMIS2007 results and was only applied for exhaust-related emissions for ROG, NOx, and PM.4. Results include mass site grading; fugitive dust emissions were assumed minimal. Worker trips are also included using the default settings of URBEMIS2007.5. Mitigation applied includes using off-road construction equipment that meets Tier 4 standards.
Construction Phase
Emissions (tpy) 1
Construction Phase
Emissions (tpy) 1
1. Emissions calculated in URBEMIS2007 using a custom land use category similar to an Industrial Park and include programmatic emissions reduction measures. The programmatic reduction emission measures are called "mitigation" in the URBEMIS2007 output.
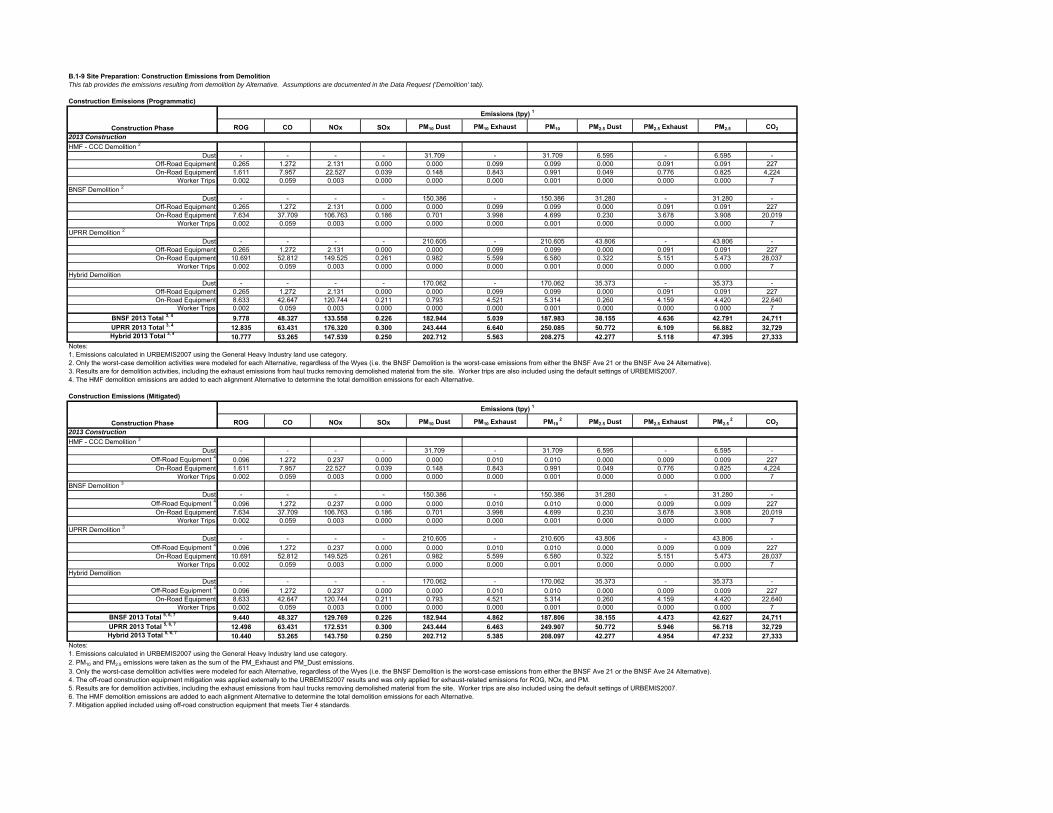
B.1-9 Site Preparation: Construction Emissions from DemolitionThis tab provides the emissions resulting from demolition by Alternative. Assumptions are documented in the Data Request ('Demolition' tab).
Construction Emissions (Programmatic)
ROG CO NOx SOx PM10 Dust PM10 Exhaust PM10 PM2.5 Dust PM2.5 Exhaust PM2.5 CO2
2013 Construction
HMF - CCC Demolition 2
Dust - - - - 31.709 - 31.709 6.595 - 6.595 -Off-Road Equipment 0.265 1.272 2.131 0.000 0.000 0.099 0.099 0.000 0.091 0.091 227On-Road Equipment 1.611 7.957 22.527 0.039 0.148 0.843 0.991 0.049 0.776 0.825 4,224
Worker Trips 0.002 0.059 0.003 0.000 0.000 0.000 0.001 0.000 0.000 0.000 7BNSF Demolition 2
Dust - - - - 150.386 - 150.386 31.280 - 31.280 -Off-Road Equipment 0.265 1.272 2.131 0.000 0.000 0.099 0.099 0.000 0.091 0.091 227On-Road Equipment 7.634 37.709 106.763 0.186 0.701 3.998 4.699 0.230 3.678 3.908 20,019
Worker Trips 0.002 0.059 0.003 0.000 0.000 0.000 0.001 0.000 0.000 0.000 7UPRR Demolition 2
Dust - - - - 210.605 - 210.605 43.806 - 43.806 -Off-Road Equipment 0.265 1.272 2.131 0.000 0.000 0.099 0.099 0.000 0.091 0.091 227On-Road Equipment 10.691 52.812 149.525 0.261 0.982 5.599 6.580 0.322 5.151 5.473 28,037
Worker Trips 0.002 0.059 0.003 0.000 0.000 0.000 0.001 0.000 0.000 0.000 7Hybrid Demolition
Dust - - - - 170.062 - 170.062 35.373 - 35.373 -Off-Road Equipment 0.265 1.272 2.131 0.000 0.000 0.099 0.099 0.000 0.091 0.091 227On-Road Equipment 8.633 42.647 120.744 0.211 0.793 4.521 5.314 0.260 4.159 4.420 22,640
Worker Trips 0.002 0.059 0.003 0.000 0.000 0.000 0.001 0.000 0.000 0.000 7BNSF 2013 Total 3, 4 9.778 48.327 133.558 0.226 182.944 5.039 187.983 38.155 4.636 42.791 24,711UPRR 2013 Total 3, 4 12.835 63.431 176.320 0.300 243.444 6.640 250.085 50.772 6.109 56.882 32,729Hybrid 2013 Total 3, 4 10.777 53.265 147.539 0.250 202.712 5.563 208.275 42.277 5.118 47.395 27,333
Notes:1. Emissions calculated in URBEMIS2007 using the General Heavy Industry land use category. 2. Only the worst-case demolition activities were modeled for each Alternative, regardless of the Wyes (i.e. the BNSF Demolition is the worst-case emissions from either the BNSF Ave 21 or the BNSF Ave 24 Alternative).3. Results are for demolition activities, including the exhaust emissions from haul trucks removing demolished material from the site. Worker trips are also included using the default settings of URBEMIS2007.4. The HMF demolition emissions are added to each alignment Alternative to determine the total demolition emissions for each Alternative.
Construction Emissions (Mitigated)
ROG CO NOx SOx PM10 Dust PM10 Exhaust PM10 2 PM2.5 Dust PM2.5 Exhaust PM2.5
2 CO2
2013 Construction
HMF - CCC Demolition 3
Dust - - - - 31.709 - 31.709 6.595 - 6.595 -Off-Road Equipment 4 0.096 1.272 0.237 0.000 0.000 0.010 0.010 0.000 0.009 0.009 227
On-Road Equipment 1.611 7.957 22.527 0.039 0.148 0.843 0.991 0.049 0.776 0.825 4,224Worker Trips 0.002 0.059 0.003 0.000 0.000 0.000 0.001 0.000 0.000 0.000 7
BNSF Demolition 3
Dust - - - - 150.386 - 150.386 31.280 - 31.280 -Off-Road Equipment 4 0.096 1.272 0.237 0.000 0.000 0.010 0.010 0.000 0.009 0.009 227
On-Road Equipment 7.634 37.709 106.763 0.186 0.701 3.998 4.699 0.230 3.678 3.908 20,019Worker Trips 0.002 0.059 0.003 0.000 0.000 0.000 0.001 0.000 0.000 0.000 7
UPRR Demolition 3
Dust - - - - 210.605 - 210.605 43.806 - 43.806 -Off-Road Equipment 4 0.096 1.272 0.237 0.000 0.000 0.010 0.010 0.000 0.009 0.009 227
On-Road Equipment 10.691 52.812 149.525 0.261 0.982 5.599 6.580 0.322 5.151 5.473 28,037Worker Trips 0.002 0.059 0.003 0.000 0.000 0.000 0.001 0.000 0.000 0.000 7
Hybrid DemolitionDust - - - - 170.062 - 170.062 35.373 - 35.373 -
Off-Road Equipment 4 0.096 1.272 0.237 0.000 0.000 0.010 0.010 0.000 0.009 0.009 227On-Road Equipment 8.633 42.647 120.744 0.211 0.793 4.521 5.314 0.260 4.159 4.420 22,640
Worker Trips 0.002 0.059 0.003 0.000 0.000 0.000 0.001 0.000 0.000 0.000 7BNSF 2013 Total 5, 6, 7 9.440 48.327 129.769 0.226 182.944 4.862 187.806 38.155 4.473 42.627 24,711UPRR 2013 Total 5, 6, 7 12.498 63.431 172.531 0.300 243.444 6.463 249.907 50.772 5.946 56.718 32,729Hybrid 2013 Total 5, 6, 7 10.440 53.265 143.750 0.250 202.712 5.385 208.097 42.277 4.954 47.232 27,333
Notes:1. Emissions calculated in URBEMIS2007 using the General Heavy Industry land use category.2. PM10 and PM2.5 emissions were taken as the sum of the PM_Exhaust and PM_Dust emissions.3. Only the worst-case demolition activities were modeled for each Alternative, regardless of the Wyes (i.e. the BNSF Demolition is the worst-case emissions from either the BNSF Ave 21 or the BNSF Ave 24 Alternative).4. The off-road construction equipment mitigation was applied externally to the URBEMIS2007 results and was only applied for exhaust-related emissions for ROG, NOx, and PM.5. Results are for demolition activities, including the exhaust emissions from haul trucks removing demolished material from the site. Worker trips are also included using the default settings of URBEMIS2007.6. The HMF demolition emissions are added to each alignment Alternative to determine the total demolition emissions for each Alternative.7. Mitigation applied included using off-road construction equipment that meets Tier 4 standards.
Emissions (tpy) 1
Construction Phase
Emissions (tpy) 1
Construction Phase
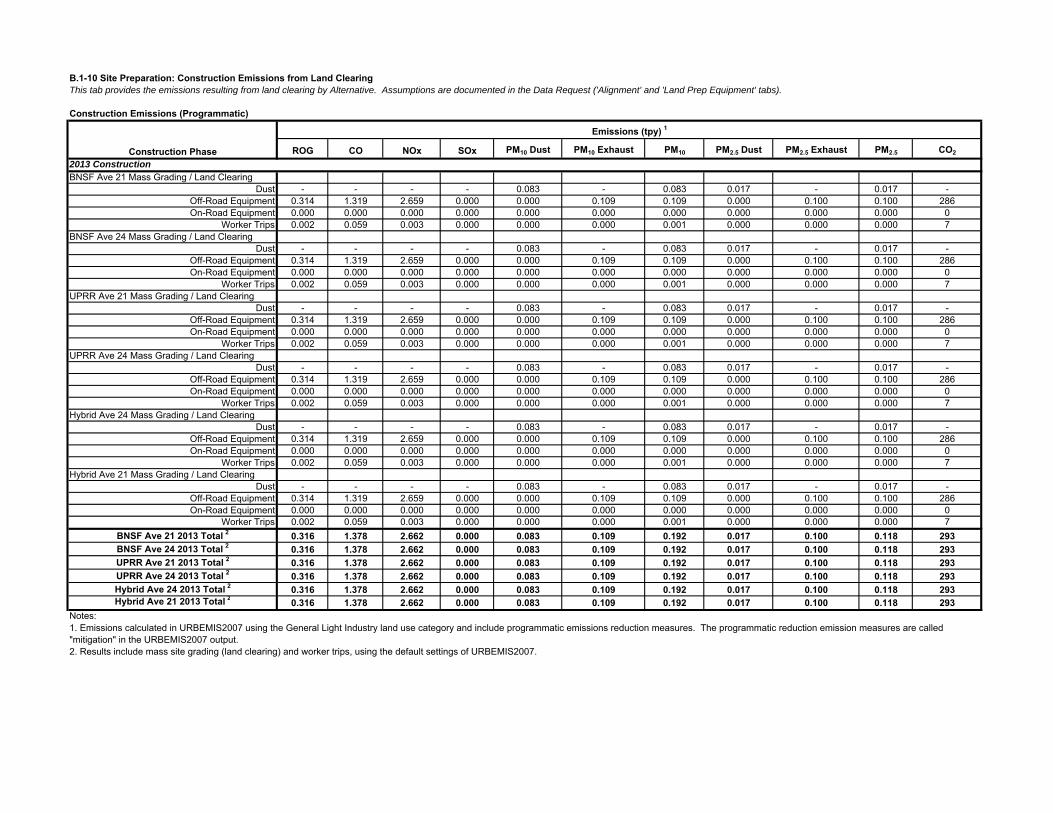
B.1-10 Site Preparation: Construction Emissions from Land ClearingThis tab provides the emissions resulting from land clearing by Alternative. Assumptions are documented in the Data Request ('Alignment' and 'Land Prep Equipment' tabs).
Construction Emissions (Programmatic)
ROG CO NOx SOx PM10 Dust PM10 Exhaust PM10 PM2.5 Dust PM2.5 Exhaust PM2.5 CO2
2013 ConstructionBNSF Ave 21 Mass Grading / Land Clearing
Dust - - - - 0.083 - 0.083 0.017 - 0.017 -Off-Road Equipment 0.314 1.319 2.659 0.000 0.000 0.109 0.109 0.000 0.100 0.100 286On-Road Equipment 0.000 0.000 0.000 0.000 0.000 0.000 0.000 0.000 0.000 0.000 0
Worker Trips 0.002 0.059 0.003 0.000 0.000 0.000 0.001 0.000 0.000 0.000 7BNSF Ave 24 Mass Grading / Land Clearing
Dust - - - - 0.083 - 0.083 0.017 - 0.017 -Off-Road Equipment 0.314 1.319 2.659 0.000 0.000 0.109 0.109 0.000 0.100 0.100 286On-Road Equipment 0.000 0.000 0.000 0.000 0.000 0.000 0.000 0.000 0.000 0.000 0
Worker Trips 0.002 0.059 0.003 0.000 0.000 0.000 0.001 0.000 0.000 0.000 7UPRR Ave 21 Mass Grading / Land Clearing
Dust - - - - 0.083 - 0.083 0.017 - 0.017 -Off-Road Equipment 0.314 1.319 2.659 0.000 0.000 0.109 0.109 0.000 0.100 0.100 286On-Road Equipment 0.000 0.000 0.000 0.000 0.000 0.000 0.000 0.000 0.000 0.000 0
Worker Trips 0.002 0.059 0.003 0.000 0.000 0.000 0.001 0.000 0.000 0.000 7UPRR Ave 24 Mass Grading / Land Clearing
Dust - - - - 0.083 - 0.083 0.017 - 0.017 -Off-Road Equipment 0.314 1.319 2.659 0.000 0.000 0.109 0.109 0.000 0.100 0.100 286On-Road Equipment 0.000 0.000 0.000 0.000 0.000 0.000 0.000 0.000 0.000 0.000 0
Worker Trips 0.002 0.059 0.003 0.000 0.000 0.000 0.001 0.000 0.000 0.000 7Hybrid Ave 24 Mass Grading / Land Clearing
Dust - - - - 0.083 - 0.083 0.017 - 0.017 -Off-Road Equipment 0.314 1.319 2.659 0.000 0.000 0.109 0.109 0.000 0.100 0.100 286On-Road Equipment 0.000 0.000 0.000 0.000 0.000 0.000 0.000 0.000 0.000 0.000 0
Worker Trips 0.002 0.059 0.003 0.000 0.000 0.000 0.001 0.000 0.000 0.000 7Hybrid Ave 21 Mass Grading / Land Clearing
Dust - - - - 0.083 - 0.083 0.017 - 0.017 -Off-Road Equipment 0.314 1.319 2.659 0.000 0.000 0.109 0.109 0.000 0.100 0.100 286On-Road Equipment 0.000 0.000 0.000 0.000 0.000 0.000 0.000 0.000 0.000 0.000 0
Worker Trips 0.002 0.059 0.003 0.000 0.000 0.000 0.001 0.000 0.000 0.000 7BNSF Ave 21 2013 Total 2 0.316 1.378 2.662 0.000 0.083 0.109 0.192 0.017 0.100 0.118 293BNSF Ave 24 2013 Total 2 0.316 1.378 2.662 0.000 0.083 0.109 0.192 0.017 0.100 0.118 293UPRR Ave 21 2013 Total 2 0.316 1.378 2.662 0.000 0.083 0.109 0.192 0.017 0.100 0.118 293UPRR Ave 24 2013 Total 2 0.316 1.378 2.662 0.000 0.083 0.109 0.192 0.017 0.100 0.118 293Hybrid Ave 24 2013 Total 2 0.316 1.378 2.662 0.000 0.083 0.109 0.192 0.017 0.100 0.118 293Hybrid Ave 21 2013 Total 2 0.316 1.378 2.662 0.000 0.083 0.109 0.192 0.017 0.100 0.118 293
Notes:
2. Results include mass site grading (land clearing) and worker trips, using the default settings of URBEMIS2007.
1. Emissions calculated in URBEMIS2007 using the General Light Industry land use category and include programmatic emissions reduction measures. The programmatic reduction emission measures are called "mitigation" in the URBEMIS2007 output.
Construction Phase
Emissions (tpy) 1
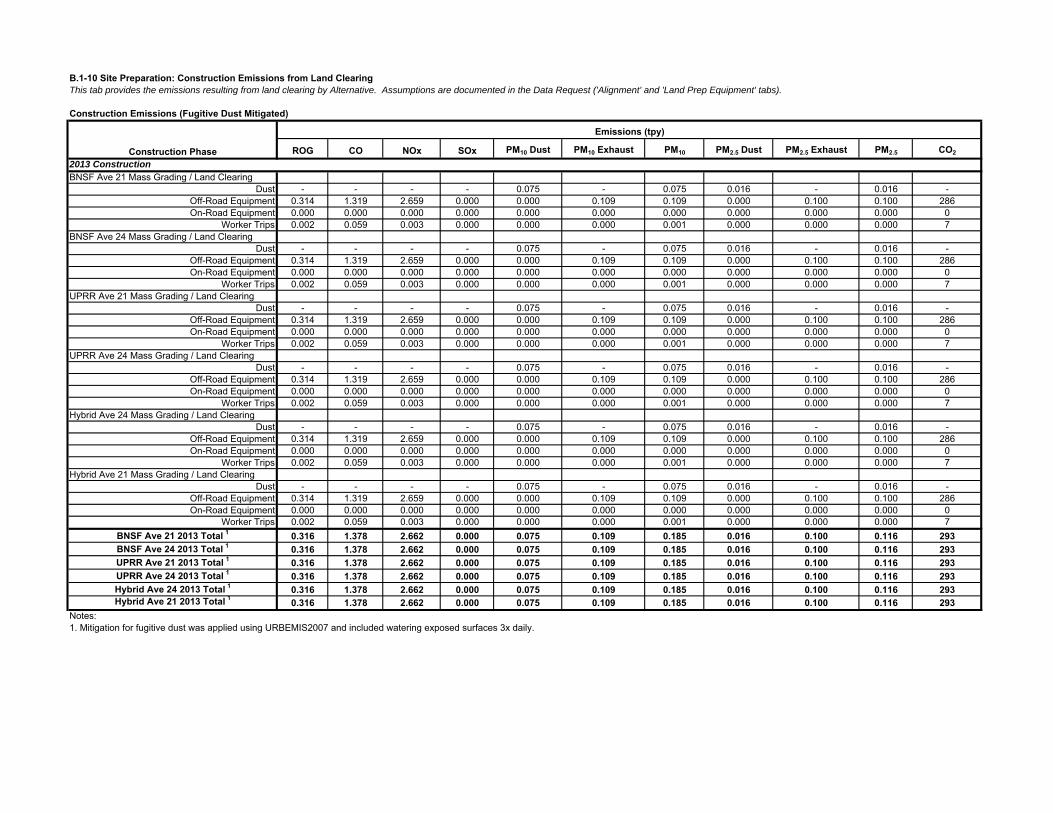
B.1-10 Site Preparation: Construction Emissions from Land ClearingThis tab provides the emissions resulting from land clearing by Alternative. Assumptions are documented in the Data Request ('Alignment' and 'Land Prep Equipment' tabs).
Construction Emissions (Fugitive Dust Mitigated)
ROG CO NOx SOx PM10 Dust PM10 Exhaust PM10 PM2.5 Dust PM2.5 Exhaust PM2.5 CO2
2013 ConstructionBNSF Ave 21 Mass Grading / Land Clearing
Dust - - - - 0.075 - 0.075 0.016 - 0.016 -Off-Road Equipment 0.314 1.319 2.659 0.000 0.000 0.109 0.109 0.000 0.100 0.100 286On-Road Equipment 0.000 0.000 0.000 0.000 0.000 0.000 0.000 0.000 0.000 0.000 0
Worker Trips 0.002 0.059 0.003 0.000 0.000 0.000 0.001 0.000 0.000 0.000 7BNSF Ave 24 Mass Grading / Land Clearing
Dust - - - - 0.075 - 0.075 0.016 - 0.016 -Off-Road Equipment 0.314 1.319 2.659 0.000 0.000 0.109 0.109 0.000 0.100 0.100 286On-Road Equipment 0.000 0.000 0.000 0.000 0.000 0.000 0.000 0.000 0.000 0.000 0
Worker Trips 0.002 0.059 0.003 0.000 0.000 0.000 0.001 0.000 0.000 0.000 7UPRR Ave 21 Mass Grading / Land Clearing
Dust - - - - 0.075 - 0.075 0.016 - 0.016 -Off-Road Equipment 0.314 1.319 2.659 0.000 0.000 0.109 0.109 0.000 0.100 0.100 286On-Road Equipment 0.000 0.000 0.000 0.000 0.000 0.000 0.000 0.000 0.000 0.000 0
Worker Trips 0.002 0.059 0.003 0.000 0.000 0.000 0.001 0.000 0.000 0.000 7UPRR Ave 24 Mass Grading / Land Clearing
Dust - - - - 0.075 - 0.075 0.016 - 0.016 -Off-Road Equipment 0.314 1.319 2.659 0.000 0.000 0.109 0.109 0.000 0.100 0.100 286On-Road Equipment 0.000 0.000 0.000 0.000 0.000 0.000 0.000 0.000 0.000 0.000 0
Worker Trips 0.002 0.059 0.003 0.000 0.000 0.000 0.001 0.000 0.000 0.000 7Hybrid Ave 24 Mass Grading / Land Clearing
Dust - - - - 0.075 - 0.075 0.016 - 0.016 -Off-Road Equipment 0.314 1.319 2.659 0.000 0.000 0.109 0.109 0.000 0.100 0.100 286On-Road Equipment 0.000 0.000 0.000 0.000 0.000 0.000 0.000 0.000 0.000 0.000 0
Worker Trips 0.002 0.059 0.003 0.000 0.000 0.000 0.001 0.000 0.000 0.000 7Hybrid Ave 21 Mass Grading / Land Clearing
Dust - - - - 0.075 - 0.075 0.016 - 0.016 -Off-Road Equipment 0.314 1.319 2.659 0.000 0.000 0.109 0.109 0.000 0.100 0.100 286On-Road Equipment 0.000 0.000 0.000 0.000 0.000 0.000 0.000 0.000 0.000 0.000 0
Worker Trips 0.002 0.059 0.003 0.000 0.000 0.000 0.001 0.000 0.000 0.000 7BNSF Ave 21 2013 Total 1 0.316 1.378 2.662 0.000 0.075 0.109 0.185 0.016 0.100 0.116 293BNSF Ave 24 2013 Total 1 0.316 1.378 2.662 0.000 0.075 0.109 0.185 0.016 0.100 0.116 293UPRR Ave 21 2013 Total 1 0.316 1.378 2.662 0.000 0.075 0.109 0.185 0.016 0.100 0.116 293UPRR Ave 24 2013 Total 1 0.316 1.378 2.662 0.000 0.075 0.109 0.185 0.016 0.100 0.116 293Hybrid Ave 24 2013 Total 1 0.316 1.378 2.662 0.000 0.075 0.109 0.185 0.016 0.100 0.116 293Hybrid Ave 21 2013 Total 1 0.316 1.378 2.662 0.000 0.075 0.109 0.185 0.016 0.100 0.116 293
Notes:1. Mitigation for fugitive dust was applied using URBEMIS2007 and included watering exposed surfaces 3x daily.
Construction Phase
Emissions (tpy)
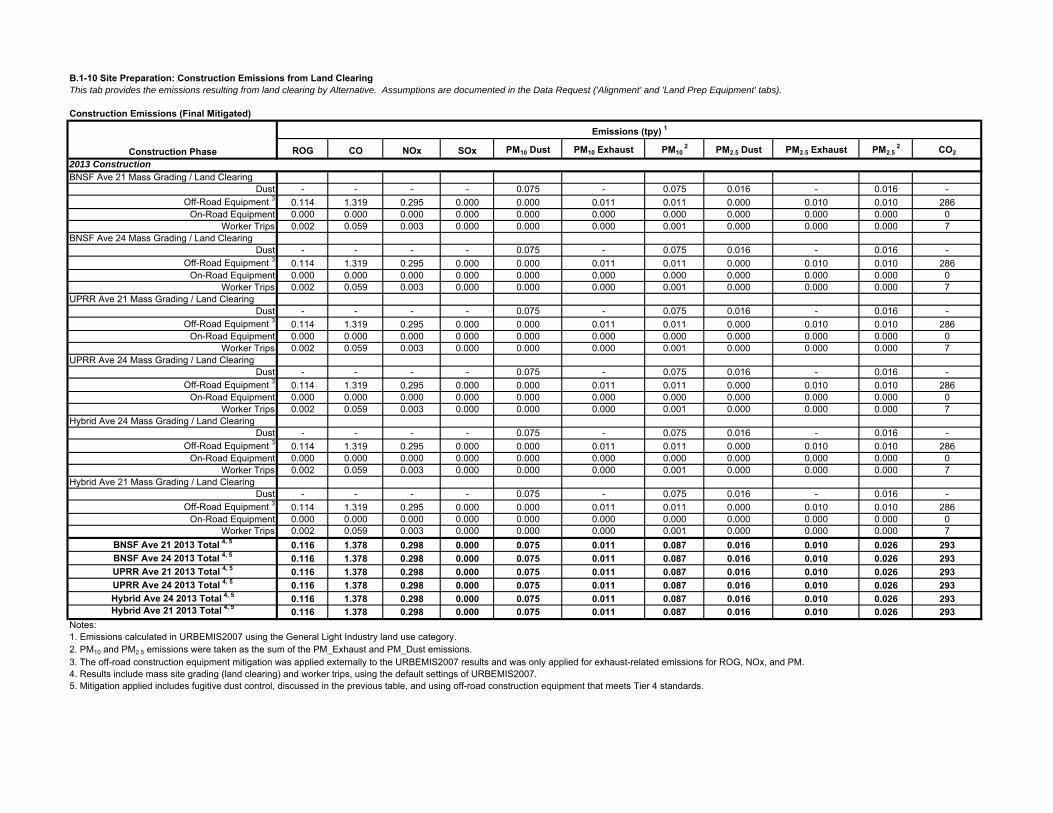
B.1-10 Site Preparation: Construction Emissions from Land ClearingThis tab provides the emissions resulting from land clearing by Alternative. Assumptions are documented in the Data Request ('Alignment' and 'Land Prep Equipment' tabs).
Construction Emissions (Final Mitigated)
ROG CO NOx SOx PM10 Dust PM10 Exhaust PM10 2 PM2.5 Dust PM2.5 Exhaust PM2.5
2 CO2
2013 ConstructionBNSF Ave 21 Mass Grading / Land Clearing
Dust - - - - 0.075 - 0.075 0.016 - 0.016 -Off-Road Equipment 3 0.114 1.319 0.295 0.000 0.000 0.011 0.011 0.000 0.010 0.010 286
On-Road Equipment 0.000 0.000 0.000 0.000 0.000 0.000 0.000 0.000 0.000 0.000 0Worker Trips 0.002 0.059 0.003 0.000 0.000 0.000 0.001 0.000 0.000 0.000 7
BNSF Ave 24 Mass Grading / Land ClearingDust - - - - 0.075 - 0.075 0.016 - 0.016 -
Off-Road Equipment 3 0.114 1.319 0.295 0.000 0.000 0.011 0.011 0.000 0.010 0.010 286On-Road Equipment 0.000 0.000 0.000 0.000 0.000 0.000 0.000 0.000 0.000 0.000 0
Worker Trips 0.002 0.059 0.003 0.000 0.000 0.000 0.001 0.000 0.000 0.000 7UPRR Ave 21 Mass Grading / Land Clearing
Dust - - - - 0.075 - 0.075 0.016 - 0.016 -Off-Road Equipment 3 0.114 1.319 0.295 0.000 0.000 0.011 0.011 0.000 0.010 0.010 286
On-Road Equipment 0.000 0.000 0.000 0.000 0.000 0.000 0.000 0.000 0.000 0.000 0Worker Trips 0.002 0.059 0.003 0.000 0.000 0.000 0.001 0.000 0.000 0.000 7
UPRR Ave 24 Mass Grading / Land ClearingDust - - - - 0.075 - 0.075 0.016 - 0.016 -
Off-Road Equipment 3 0.114 1.319 0.295 0.000 0.000 0.011 0.011 0.000 0.010 0.010 286On-Road Equipment 0.000 0.000 0.000 0.000 0.000 0.000 0.000 0.000 0.000 0.000 0
Worker Trips 0.002 0.059 0.003 0.000 0.000 0.000 0.001 0.000 0.000 0.000 7Hybrid Ave 24 Mass Grading / Land Clearing
Dust - - - - 0.075 - 0.075 0.016 - 0.016 -Off-Road Equipment 3 0.114 1.319 0.295 0.000 0.000 0.011 0.011 0.000 0.010 0.010 286
On-Road Equipment 0.000 0.000 0.000 0.000 0.000 0.000 0.000 0.000 0.000 0.000 0Worker Trips 0.002 0.059 0.003 0.000 0.000 0.000 0.001 0.000 0.000 0.000 7
Hybrid Ave 21 Mass Grading / Land ClearingDust - - - - 0.075 - 0.075 0.016 - 0.016 -
Off-Road Equipment 3 0.114 1.319 0.295 0.000 0.000 0.011 0.011 0.000 0.010 0.010 286On-Road Equipment 0.000 0.000 0.000 0.000 0.000 0.000 0.000 0.000 0.000 0.000 0
Worker Trips 0.002 0.059 0.003 0.000 0.000 0.000 0.001 0.000 0.000 0.000 7BNSF Ave 21 2013 Total 4, 5 0.116 1.378 0.298 0.000 0.075 0.011 0.087 0.016 0.010 0.026 293BNSF Ave 24 2013 Total 4, 5 0.116 1.378 0.298 0.000 0.075 0.011 0.087 0.016 0.010 0.026 293UPRR Ave 21 2013 Total 4, 5 0.116 1.378 0.298 0.000 0.075 0.011 0.087 0.016 0.010 0.026 293UPRR Ave 24 2013 Total 4, 5 0.116 1.378 0.298 0.000 0.075 0.011 0.087 0.016 0.010 0.026 293Hybrid Ave 24 2013 Total 4, 5 0.116 1.378 0.298 0.000 0.075 0.011 0.087 0.016 0.010 0.026 293Hybrid Ave 21 2013 Total 4, 5 0.116 1.378 0.298 0.000 0.075 0.011 0.087 0.016 0.010 0.026 293
Notes:
2. PM10 and PM2.5 emissions were taken as the sum of the PM_Exhaust and PM_Dust emissions.3. The off-road construction equipment mitigation was applied externally to the URBEMIS2007 results and was only applied for exhaust-related emissions for ROG, NOx, and PM.4. Results include mass site grading (land clearing) and worker trips, using the default settings of URBEMIS2007.5. Mitigation applied includes fugitive dust control, discussed in the previous table, and using off-road construction equipment that meets Tier 4 standards.
Construction Phase
Emissions (tpy) 1
1. Emissions calculated in URBEMIS2007 using the General Light Industry land use category.

B.1-11 BNSF Ave 21: Construction Emissions from Earth MovingThis tab provides the emissions resulting from earth moving for the BNSF Ave 21 Alternative. Assumptions are documented in the Data Request ('Alignment' and 'Land Prep Equipment' tabs).
Construction Emissions (Programmatic)
ROG CO NOx SOx PM10 Dust PM10 Exhaust PM10 PM2.5 Dust PM2.5 Exhaust PM2.5 CO2
2013 ConstructionMass Grading / Grading
Dust - - - - 0.082 - 0.082 0.017 - 0.017 -Off-Road Equipment 0.457 2.040 3.747 0.000 0.000 0.170 0.170 0.000 0.157 0.157 407On-Road Equipment 0.000 0.000 0.000 0.000 0.000 0.000 0.000 0.000 0.000 0.000 0
Worker Trips 0.004 0.116 0.006 0.000 0.001 0.000 0.001 0.000 0.000 0.001 14Mass Grading / Cut & Fill
Dust - - - - 19.219 - 19.219 4.014 - 4.014 -Off-Road Equipment 0.111 0.483 0.894 0.000 0.000 0.043 0.043 0.000 0.039 0.039 98On-Road Equipment 0.000 0.000 0.000 0.000 0.000 0.000 0.000 0.000 0.000 0.000 0
Worker Trips 0.001 0.037 0.002 0.000 0.000 0.000 0.000 0.000 0.000 0.000 42014 ConstructionMass Grading / Grading
Dust - - - - 0.017 - 0.017 0.004 - 0.004 -Off-Road Equipment 0.092 0.416 0.737 0.000 0.000 0.033 0.033 0.000 0.030 0.030 86On-Road Equipment 0.000 0.000 0.000 0.000 0.000 0.000 0.000 0.000 0.000 0.000 0
Worker Trips 0.001 0.022 0.001 0.000 0.000 0.000 0.000 0.000 0.000 0.000 3Mass Grading / Cut & Fill
Dust - - - - 57.657 - 57.657 12.041 - 12.041 -Off-Road Equipment 0.315 1.401 2.490 0.000 0.000 0.116 0.116 0.000 0.106 0.106 293On-Road Equipment 0.000 0.000 0.000 0.000 0.000 0.000 0.000 0.000 0.000 0.000 0
Worker Trips 0.003 0.101 0.005 0.000 0.001 0.000 0.001 0.000 0.000 0.001 13Trenching
Off-Road Equipment 0.119 0.495 0.857 0.000 0.000 0.049 0.049 0.000 0.045 0.045 101Worker Trips 0.002 0.050 0.003 0.000 0.000 0.000 0.001 0.000 0.000 0.000 7
2015 ConstructionMass Grading / Cut & Fill
Dust - - - - 38.217 - 38.217 7.981 - 7.981 -Off-Road Equipment 0.195 0.899 1.514 0.000 0.000 0.070 0.070 0.000 0.064 0.064 194On-Road Equipment 0.000 0.000 0.000 0.000 0.000 0.000 0.000 0.000 0.000 0.000 0
Worker Trips 0.002 0.061 0.003 0.000 0.000 0.000 0.001 0.000 0.000 0.000 92013 Total 2 0.573 2.676 4.649 0.000 19.302 0.214 19.516 4.031 0.197 4.228 5242014 Total 2 0.531 2.486 4.092 0.000 57.675 0.198 57.873 12.045 0.182 12.227 5032015 Total 2 0.197 0.960 1.517 0.000 38.217 0.070 38.288 7.981 0.065 8.046 203
Notes:
Construction Phase
Emissions (tpy) 1
1. Emissions calculated in URBEMIS2007 using the General Light Industry land use category and include programmatic emissions reduction measures. The programmatic reduction emission measures are called "mitigation" in the URBEMIS2007 output. 2. Results include mass site grading (Grading), mass site grading (Cut & Fill), and trenching. Worker trips are also included using the default settings of URBEMIS2007. Material hauling emissions during this phase are presented separately.
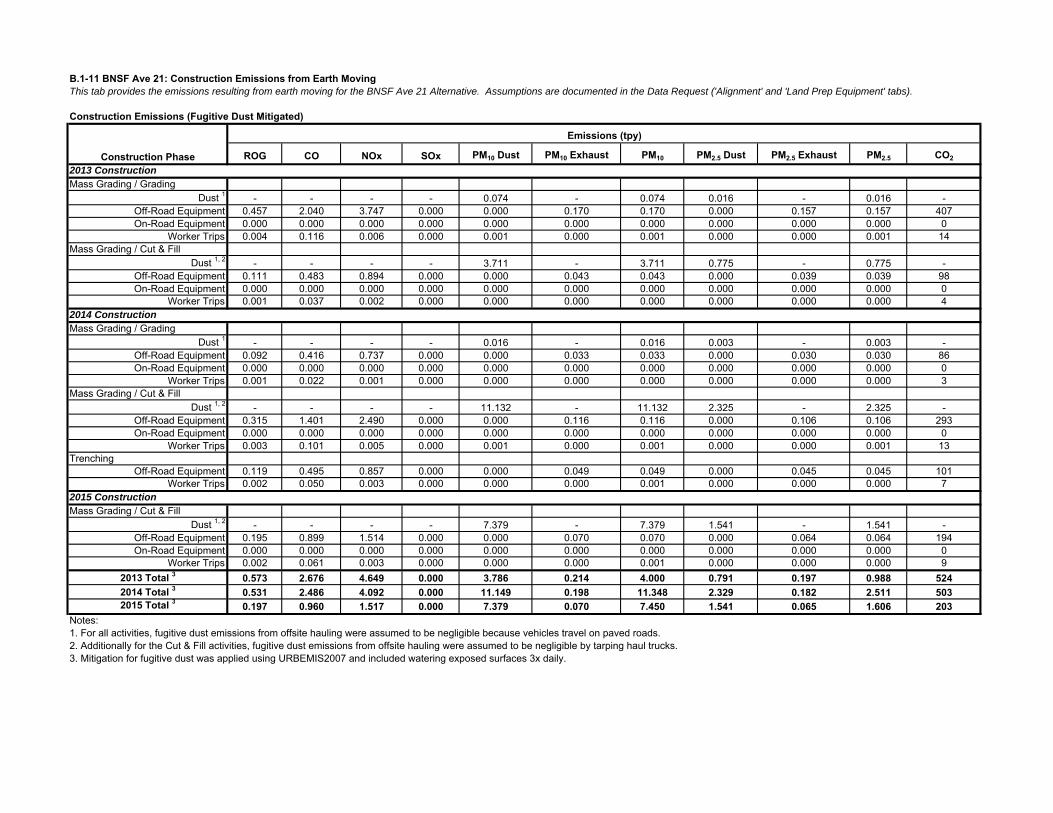
B.1-11 BNSF Ave 21: Construction Emissions from Earth MovingThis tab provides the emissions resulting from earth moving for the BNSF Ave 21 Alternative. Assumptions are documented in the Data Request ('Alignment' and 'Land Prep Equipment' tabs).
Construction Emissions (Fugitive Dust Mitigated)
ROG CO NOx SOx PM10 Dust PM10 Exhaust PM10 PM2.5 Dust PM2.5 Exhaust PM2.5 CO2
2013 ConstructionMass Grading / Grading
Dust 1 - - - - 0.074 - 0.074 0.016 - 0.016 -Off-Road Equipment 0.457 2.040 3.747 0.000 0.000 0.170 0.170 0.000 0.157 0.157 407On-Road Equipment 0.000 0.000 0.000 0.000 0.000 0.000 0.000 0.000 0.000 0.000 0
Worker Trips 0.004 0.116 0.006 0.000 0.001 0.000 0.001 0.000 0.000 0.001 14Mass Grading / Cut & Fill
Dust 1, 2 - - - - 3.711 - 3.711 0.775 - 0.775 -Off-Road Equipment 0.111 0.483 0.894 0.000 0.000 0.043 0.043 0.000 0.039 0.039 98On-Road Equipment 0.000 0.000 0.000 0.000 0.000 0.000 0.000 0.000 0.000 0.000 0
Worker Trips 0.001 0.037 0.002 0.000 0.000 0.000 0.000 0.000 0.000 0.000 42014 ConstructionMass Grading / Grading
Dust 1 - - - - 0.016 - 0.016 0.003 - 0.003 -Off-Road Equipment 0.092 0.416 0.737 0.000 0.000 0.033 0.033 0.000 0.030 0.030 86On-Road Equipment 0.000 0.000 0.000 0.000 0.000 0.000 0.000 0.000 0.000 0.000 0
Worker Trips 0.001 0.022 0.001 0.000 0.000 0.000 0.000 0.000 0.000 0.000 3Mass Grading / Cut & Fill
Dust 1, 2 - - - - 11.132 - 11.132 2.325 - 2.325 -Off-Road Equipment 0.315 1.401 2.490 0.000 0.000 0.116 0.116 0.000 0.106 0.106 293On-Road Equipment 0.000 0.000 0.000 0.000 0.000 0.000 0.000 0.000 0.000 0.000 0
Worker Trips 0.003 0.101 0.005 0.000 0.001 0.000 0.001 0.000 0.000 0.001 13Trenching
Off-Road Equipment 0.119 0.495 0.857 0.000 0.000 0.049 0.049 0.000 0.045 0.045 101Worker Trips 0.002 0.050 0.003 0.000 0.000 0.000 0.001 0.000 0.000 0.000 7
2015 ConstructionMass Grading / Cut & Fill
Dust 1, 2 - - - - 7.379 - 7.379 1.541 - 1.541 -Off-Road Equipment 0.195 0.899 1.514 0.000 0.000 0.070 0.070 0.000 0.064 0.064 194On-Road Equipment 0.000 0.000 0.000 0.000 0.000 0.000 0.000 0.000 0.000 0.000 0
Worker Trips 0.002 0.061 0.003 0.000 0.000 0.000 0.001 0.000 0.000 0.000 92013 Total 3 0.573 2.676 4.649 0.000 3.786 0.214 4.000 0.791 0.197 0.988 5242014 Total 3 0.531 2.486 4.092 0.000 11.149 0.198 11.348 2.329 0.182 2.511 5032015 Total 3 0.197 0.960 1.517 0.000 7.379 0.070 7.450 1.541 0.065 1.606 203
Notes:1. For all activities, fugitive dust emissions from offsite hauling were assumed to be negligible because vehicles travel on paved roads.2. Additionally for the Cut & Fill activities, fugitive dust emissions from offsite hauling were assumed to be negligible by tarping haul trucks.3. Mitigation for fugitive dust was applied using URBEMIS2007 and included watering exposed surfaces 3x daily.
Construction Phase
Emissions (tpy)

B.1-11 BNSF Ave 21: Construction Emissions from Earth MovingThis tab provides the emissions resulting from earth moving for the BNSF Ave 21 Alternative. Assumptions are documented in the Data Request ('Alignment' and 'Land Prep Equipment' tabs).
Construction Emissions (Final Mitigated)
ROG CO NOx SOx PM10 Dust PM10 Exhaust PM10 2 PM2.5 Dust PM2.5 Exhaust PM2.5
2 CO2
2013 ConstructionMass Grading / Grading
Dust - - - - 0.074 - 0.074 0.016 - 0.016 -Off-Road Equipment 3 0.166 2.040 0.416 0.000 0.000 0.017 0.017 0.000 0.016 0.016 407
On-Road Equipment 0.000 0.000 0.000 0.000 0.000 0.000 0.000 0.000 0.000 0.000 0Worker Trips 0.004 0.116 0.006 0.000 0.001 0.000 0.001 0.000 0.000 0.001 14
Mass Grading / Cut & FillDust - - - - 3.711 - 3.711 0.775 - 0.775 -
Off-Road Equipment 3 0.040 0.483 0.099 0.000 0.000 0.004 0.004 0.000 0.004 0.004 98On-Road Equipment 0.000 0.000 0.000 0.000 0.000 0.000 0.000 0.000 0.000 0.000 0
Worker Trips 0.001 0.037 0.002 0.000 0.000 0.000 0.000 0.000 0.000 0.000 42014 ConstructionMass Grading / Grading
Dust - - - - 0.016 - 0.016 0.003 - 0.003 -Off-Road Equipment 3 0.033 0.416 0.082 0.000 0.000 0.003 0.003 0.000 0.003 0.003 86
On-Road Equipment 0.000 0.000 0.000 0.000 0.000 0.000 0.000 0.000 0.000 0.000 0Worker Trips 0.001 0.022 0.001 0.000 0.000 0.000 0.000 0.000 0.000 0.000 3
Mass Grading / Cut & FillDust - - - - 11.132 - 11.132 2.325 - 2.325 -
Off-Road Equipment 3 0.114 1.401 0.276 0.000 0.000 0.012 0.012 0.000 0.011 0.011 293On-Road Equipment 0.000 0.000 0.000 0.000 0.000 0.000 0.000 0.000 0.000 0.000 0
Worker Trips 0.003 0.101 0.005 0.000 0.001 0.000 0.001 0.000 0.000 0.001 13Trenching (Utilities)
Off-Road Equipment 3 0.043 0.495 0.095 0.000 0.000 0.005 0.005 0.000 0.005 0.005 101Worker Trips 0.002 0.050 0.003 0.000 0.000 0.000 0.001 0.000 0.000 0.000 7
2015 ConstructionMass Grading / Cut & Fill
Dust - - - - 7.379 - 7.379 1.541 - 1.541 -Off-Road Equipment 3 0.071 0.899 0.168 0.000 0.000 0.007 0.007 0.000 0.007 0.007 194
On-Road Equipment 0.000 0.000 0.000 0.000 0.000 0.000 0.000 0.000 0.000 0.000 0Worker Trips 0.002 0.061 0.003 0.000 0.000 0.000 0.001 0.000 0.000 0.000 9
2013 Total 4, 5 0.211 2.676 0.523 0.000 3.786 0.022 3.808 0.791 0.020 0.811 5242014 Total 4, 5 0.196 2.486 0.462 0.000 11.149 0.021 11.170 2.329 0.019 2.348 5032015 Total 4, 5 0.073 0.960 0.171 0.000 7.379 0.007 7.387 1.541 0.007 1.548 203
Notes:
2. PM10 and PM2.5 emissions were taken as the sum of the PM_Exhaust and PM_Dust emissions.3. The off-road construction equipment mitigation was applied externally to the URBEMIS2007 results and was only applied for exhaust-related emissions for ROG, NOx, and PM.4. Results include mass site grading (Grading), mass site grading (Cut & Fill), and trenching. Worker trips are also included using the default settings of URBEMIS2007.5. Mitigation applied includes fugitive dust control, discussed in the previous table, and using off-road construction equipment that meets Tier 4 standards.
Construction Phase
Emissions (tpy) 1
1. Emissions calculated in URBEMIS2007 using the General Light Industry land use category.

B.1-12 BNSF Ave 24: Construction Emissions from Earth MovingThis tab provides the emissions resulting from earth moving for the BNSF Ave 24 Alternative. Assumptions are documented in the Data Request ('Alignment' and 'Land Prep Equipment' tabs).
Construction Emissions (Programmatic)
ROG CO NOx SOx PM10 Dust PM10 Exhaust PM10 PM2.5 Dust PM2.5 Exhaust PM2.5 CO2
2013 ConstructionMass Grading / Grading
Dust - - - - 0.082 - 0.082 0.017 - 0.017 -Off-Road Equipment 0.457 2.040 3.747 0.000 0.000 0.170 0.170 0.000 0.157 0.157 407On-Road Equipment 0.000 0.000 0.000 0.000 0.000 0.000 0.000 0.000 0.000 0.000 0
Worker Trips 0.004 0.116 0.006 0.000 0.001 0.000 0.001 0.000 0.000 0.001 14Mass Grading / Cut & Fill
Dust - - - - 19.044 - 19.044 3.977 - 3.977 -Off-Road Equipment 0.111 0.483 0.894 0.000 0.000 0.043 0.043 0.000 0.039 0.039 98On-Road Equipment 0.000 0.000 0.000 0.000 0.000 0.000 0.000 0.000 0.000 0.000 0
Worker Trips 0.001 0.037 0.002 0.000 0.000 0.000 0.000 0.000 0.000 0.000 42014 ConstructionMass Grading / Grading
Dust - - - - 0.017 - 0.017 0.004 - 0.004 -Off-Road Equipment 0.092 0.416 0.737 0.000 0.000 0.033 0.033 0.000 0.030 0.030 86On-Road Equipment 0.000 0.000 0.000 0.000 0.000 0.000 0.000 0.000 0.000 0.000 0
Worker Trips 0.001 0.022 0.001 0.000 0.000 0.000 0.000 0.000 0.000 0.000 3Mass Grading / Cut & Fill
Dust - - - - 57.131 - 57.131 11.931 - 11.931 -Off-Road Equipment 0.315 1.401 2.490 0.000 0.000 0.116 0.116 0.000 0.106 0.106 293On-Road Equipment 0.000 0.000 0.000 0.000 0.000 0.000 0.000 0.000 0.000 0.000 0
Worker Trips 0.003 0.101 0.005 0.000 0.001 0.000 0.001 0.000 0.000 0.001 13Trenching
Off-Road Equipment 0.119 0.495 0.857 0.000 0.000 0.049 0.049 0.000 0.045 0.045 101Worker Trips 0.002 0.050 0.003 0.000 0.000 0.000 0.001 0.000 0.000 0.000 7
2015 ConstructionMass Grading / Cut & Fill
Dust - - - - 37.868 - 37.868 7.908 - 7.908 -Off-Road Equipment 0.195 0.899 1.514 0.000 0.000 0.070 0.070 0.000 0.064 0.064 194On-Road Equipment 0.000 0.000 0.000 0.000 0.000 0.000 0.000 0.000 0.000 0.000 0
Worker Trips 0.002 0.061 0.003 0.000 0.000 0.000 0.001 0.000 0.000 0.000 92013 Total 2 0.573 2.676 4.649 0.000 19.126 0.214 19.340 3.995 0.197 4.191 5242014 Total 2 0.531 2.486 4.092 0.000 57.149 0.198 57.347 11.935 0.182 12.117 5032015 Total 2 0.197 0.960 1.517 0.000 37.869 0.070 37.939 7.909 0.065 7.973 203
Notes:
Construction Phase
Emissions (tpy) 1
1. Emissions calculated in URBEMIS2007 using the General Light Industry land use category and include programmatic emissions reduction measures. The programmatic reduction emission measures are called "mitigation" in the URBEMIS2007 output. 2. Results include mass site grading (Grading), mass site grading (Cut & Fill), and trenching. Worker trips are also included using the default settings of URBEMIS2007. Material hauling emissions during this phase are presented separately.

B.1-12 BNSF Ave 24: Construction Emissions from Earth MovingThis tab provides the emissions resulting from earth moving for the BNSF Ave 24 Alternative. Assumptions are documented in the Data Request ('Alignment' and 'Land Prep Equipment' tabs).
Construction Emissions (Fugitive Dust Mitigated)
ROG CO NOx SOx PM10 Dust PM10 Exhaust PM10 PM2.5 Dust PM2.5 Exhaust PM2.5 CO2
2013 ConstructionMass Grading / Grading
Dust 1 - - - - 0.074 - 0.074 0.016 - 0.016 -Off-Road Equipment 0.457 2.040 3.747 0.000 0.000 0.170 0.170 0.000 0.157 0.157 407On-Road Equipment 0.000 0.000 0.000 0.000 0.000 0.000 0.000 0.000 0.000 0.000 0
Worker Trips 0.004 0.116 0.006 0.000 0.001 0.000 0.001 0.000 0.000 0.001 14Mass Grading / Cut & Fill
Dust 1, 2 - - - - 3.677 - 3.677 0.768 - 0.768 -Off-Road Equipment 0.111 0.483 0.894 0.000 0.000 0.043 0.043 0.000 0.039 0.039 98On-Road Equipment 0.000 0.000 0.000 0.000 0.000 0.000 0.000 0.000 0.000 0.000 0
Worker Trips 0.001 0.037 0.002 0.000 0.000 0.000 0.000 0.000 0.000 0.000 42014 ConstructionMass Grading / Grading
Dust 1 - - - - 0.016 - 0.016 0.003 - 0.003 -Off-Road Equipment 0.092 0.416 0.737 0.000 0.000 0.033 0.033 0.000 0.030 0.030 86On-Road Equipment 0.000 0.000 0.000 0.000 0.000 0.000 0.000 0.000 0.000 0.000 0
Worker Trips 0.001 0.022 0.001 0.000 0.000 0.000 0.000 0.000 0.000 0.000 3Mass Grading / Cut & Fill
Dust 1, 2 - - - - 11.032 - 11.032 2.304 - 2.304 -Off-Road Equipment 0.315 1.401 2.490 0.000 0.000 0.116 0.116 0.000 0.106 0.106 293On-Road Equipment 0.000 0.000 0.000 0.000 0.000 0.000 0.000 0.000 0.000 0.000 0
Worker Trips 0.003 0.101 0.005 0.000 0.001 0.000 0.001 0.000 0.000 0.001 13Trenching
Off-Road Equipment 0.119 0.495 0.857 0.000 0.000 0.049 0.049 0.000 0.045 0.045 101Worker Trips 0.002 0.050 0.003 0.000 0.000 0.000 0.001 0.000 0.000 0.000 7
2015 ConstructionMass Grading / Cut & Fill
Dust 1, 2 - - - - 7.312 - 7.312 1.527 - 1.527 -Off-Road Equipment 0.195 0.899 1.514 0.000 0.000 0.070 0.070 0.000 0.064 0.064 194On-Road Equipment 0.000 0.000 0.000 0.000 0.000 0.000 0.000 0.000 0.000 0.000 0
Worker Trips 0.002 0.061 0.003 0.000 0.000 0.000 0.001 0.000 0.000 0.000 92013 Total 3 0.573 2.676 4.649 0.000 3.753 0.214 3.966 0.784 0.197 0.980 5242014 Total 3 0.531 2.486 4.092 0.000 11.048 0.198 11.247 2.308 0.182 2.490 5032015 Total 3 0.197 0.960 1.517 0.000 7.313 0.070 7.383 1.527 0.065 1.592 203
Notes:1. For all activities, fugitive dust emissions from offsite hauling were assumed to be negligible because vehicles travel on paved roads.2. For the Cut & Fill activities, fugitive dust emissions from offsite hauling were assumed to be negligible by tarping haul trucks.3. Mitigation for fugitive dust was applied using URBEMIS2007 and included watering exposed surfaces 3x daily.
Construction Phase
Emissions (tpy)

B.1-12 BNSF Ave 24: Construction Emissions from Earth MovingThis tab provides the emissions resulting from earth moving for the BNSF Ave 24 Alternative. Assumptions are documented in the Data Request ('Alignment' and 'Land Prep Equipment' tabs).
Construction Emissions (Final Mitigated)
ROG CO NOx SOx PM10 Dust PM10 Exhaust PM10 2 PM2.5 Dust PM2.5 Exhaust PM2.5
2 CO2
2013 ConstructionMass Grading / Grading
Dust - - - - 0.074 - 0.074 0.016 - 0.016 -Off-Road Equipment 3 0.166 2.040 0.416 0.000 0.000 0.017 0.017 0.000 0.016 0.016 407
On-Road Equipment 0.000 0.000 0.000 0.000 0.000 0.000 0.000 0.000 0.000 0.000 0Worker Trips 0.004 0.116 0.006 0.000 0.001 0.000 0.001 0.000 0.000 0.001 14
Mass Grading / Cut & FillDust - - - - 3.677 - 3.677 0.768 - 0.768 -
Off-Road Equipment 3 0.040 0.483 0.099 0.000 0.000 0.004 0.004 0.000 0.004 0.004 98On-Road Equipment 0.000 0.000 0.000 0.000 0.000 0.000 0.000 0.000 0.000 0.000 0
Worker Trips 0.001 0.037 0.002 0.000 0.000 0.000 0.000 0.000 0.000 0.000 42014 ConstructionMass Grading / Grading
Dust - - - - 0.016 - 0.016 0.003 - 0.003 -Off-Road Equipment 3 0.033 0.416 0.082 0.000 0.000 0.003 0.003 0.000 0.003 0.003 86
On-Road Equipment 0.000 0.000 0.000 0.000 0.000 0.000 0.000 0.000 0.000 0.000 0Worker Trips 0.001 0.022 0.001 0.000 0.000 0.000 0.000 0.000 0.000 0.000 3
Mass Grading / Cut & FillDust - - - - 11.032 - 11.032 2.304 - 2.304 -
Off-Road Equipment 3 0.114 1.401 0.276 0.000 0.000 0.012 0.012 0.000 0.011 0.011 293On-Road Equipment 0.000 0.000 0.000 0.000 0.000 0.000 0.000 0.000 0.000 0.000 0
Worker Trips 0.003 0.101 0.005 0.000 0.001 0.000 0.001 0.000 0.000 0.001 13Trenching (Utilities)
Off-Road Equipment 3 0.043 0.495 0.095 0.000 0.000 0.005 0.005 0.000 0.005 0.005 101Worker Trips 0.002 0.050 0.003 0.000 0.000 0.000 0.001 0.000 0.000 0.000 7
2015 ConstructionMass Grading / Cut & Fill
Dust - - - - 7.312 - 7.312 1.527 - 1.527 -Off-Road Equipment 3 0.071 0.899 0.168 0.000 0.000 0.007 0.007 0.000 0.007 0.007 194
On-Road Equipment 0.000 0.000 0.000 0.000 0.000 0.000 0.000 0.000 0.000 0.000 0Worker Trips 0.002 0.061 0.003 0.000 0.000 0.000 0.001 0.000 0.000 0.000 9
2013 Total 4, 5 0.211 2.676 0.523 0.000 3.753 0.022 3.775 0.784 0.020 0.804 5242014 Total 4, 5 0.196 2.486 0.462 0.000 11.048 0.021 11.069 2.308 0.019 2.326 5032015 Total 4, 5 0.073 0.960 0.171 0.000 7.313 0.007 7.320 1.527 0.007 1.534 203
Notes:
2. PM10 and PM2.5 emissions were taken as the sum of the PM_Exhaust and PM_Dust emissions.3. The off-road construction equipment mitigation was applied externally to the URBEMIS2007 results and was only applied for exhaust-related emissions for ROG, NOx, and PM.4. Results include mass site grading (Grading), mass site grading (Cut & Fill), and trenching. Worker trips are also included using the default settings of URBEMIS2007.5. Mitigation applied includes fugitive dust control, discussed in the previous table, and using off-road construction equipment that meets Tier 4 standards.
Construction Phase
Emissions (tpy) 1
1. Emissions calculated in URBEMIS2007 using the General Light Industry land use category.
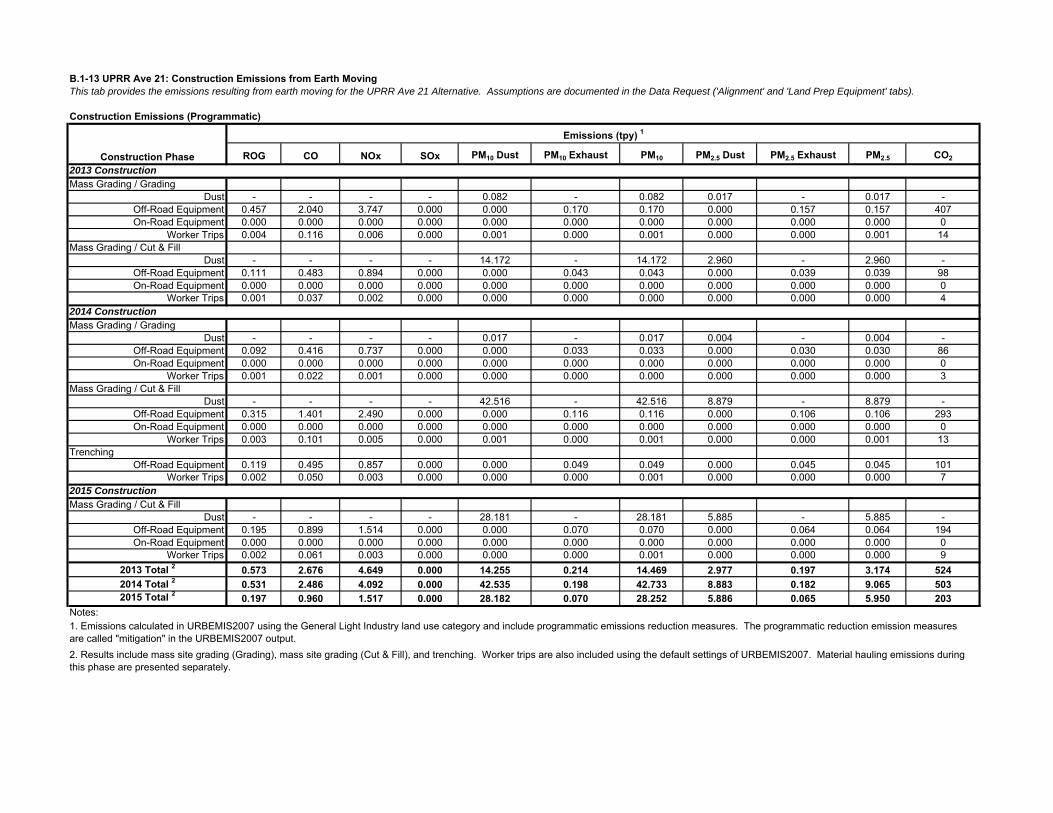
B.1-13 UPRR Ave 21: Construction Emissions from Earth MovingThis tab provides the emissions resulting from earth moving for the UPRR Ave 21 Alternative. Assumptions are documented in the Data Request ('Alignment' and 'Land Prep Equipment' tabs).
Construction Emissions (Programmatic)
ROG CO NOx SOx PM10 Dust PM10 Exhaust PM10 PM2.5 Dust PM2.5 Exhaust PM2.5 CO2
2013 ConstructionMass Grading / Grading
Dust - - - - 0.082 - 0.082 0.017 - 0.017 -Off-Road Equipment 0.457 2.040 3.747 0.000 0.000 0.170 0.170 0.000 0.157 0.157 407On-Road Equipment 0.000 0.000 0.000 0.000 0.000 0.000 0.000 0.000 0.000 0.000 0
Worker Trips 0.004 0.116 0.006 0.000 0.001 0.000 0.001 0.000 0.000 0.001 14Mass Grading / Cut & Fill
Dust - - - - 14.172 - 14.172 2.960 - 2.960 -Off-Road Equipment 0.111 0.483 0.894 0.000 0.000 0.043 0.043 0.000 0.039 0.039 98On-Road Equipment 0.000 0.000 0.000 0.000 0.000 0.000 0.000 0.000 0.000 0.000 0
Worker Trips 0.001 0.037 0.002 0.000 0.000 0.000 0.000 0.000 0.000 0.000 42014 ConstructionMass Grading / Grading
Dust - - - - 0.017 - 0.017 0.004 - 0.004 -Off-Road Equipment 0.092 0.416 0.737 0.000 0.000 0.033 0.033 0.000 0.030 0.030 86On-Road Equipment 0.000 0.000 0.000 0.000 0.000 0.000 0.000 0.000 0.000 0.000 0
Worker Trips 0.001 0.022 0.001 0.000 0.000 0.000 0.000 0.000 0.000 0.000 3Mass Grading / Cut & Fill
Dust - - - - 42.516 - 42.516 8.879 - 8.879 -Off-Road Equipment 0.315 1.401 2.490 0.000 0.000 0.116 0.116 0.000 0.106 0.106 293On-Road Equipment 0.000 0.000 0.000 0.000 0.000 0.000 0.000 0.000 0.000 0.000 0
Worker Trips 0.003 0.101 0.005 0.000 0.001 0.000 0.001 0.000 0.000 0.001 13Trenching
Off-Road Equipment 0.119 0.495 0.857 0.000 0.000 0.049 0.049 0.000 0.045 0.045 101Worker Trips 0.002 0.050 0.003 0.000 0.000 0.000 0.001 0.000 0.000 0.000 7
2015 ConstructionMass Grading / Cut & Fill
Dust - - - - 28.181 - 28.181 5.885 - 5.885 -Off-Road Equipment 0.195 0.899 1.514 0.000 0.000 0.070 0.070 0.000 0.064 0.064 194On-Road Equipment 0.000 0.000 0.000 0.000 0.000 0.000 0.000 0.000 0.000 0.000 0
Worker Trips 0.002 0.061 0.003 0.000 0.000 0.000 0.001 0.000 0.000 0.000 92013 Total 2 0.573 2.676 4.649 0.000 14.255 0.214 14.469 2.977 0.197 3.174 5242014 Total 2 0.531 2.486 4.092 0.000 42.535 0.198 42.733 8.883 0.182 9.065 5032015 Total 2 0.197 0.960 1.517 0.000 28.182 0.070 28.252 5.886 0.065 5.950 203
Notes:
Construction Phase
Emissions (tpy) 1
1. Emissions calculated in URBEMIS2007 using the General Light Industry land use category and include programmatic emissions reduction measures. The programmatic reduction emission measures are called "mitigation" in the URBEMIS2007 output. 2. Results include mass site grading (Grading), mass site grading (Cut & Fill), and trenching. Worker trips are also included using the default settings of URBEMIS2007. Material hauling emissions during this phase are presented separately.
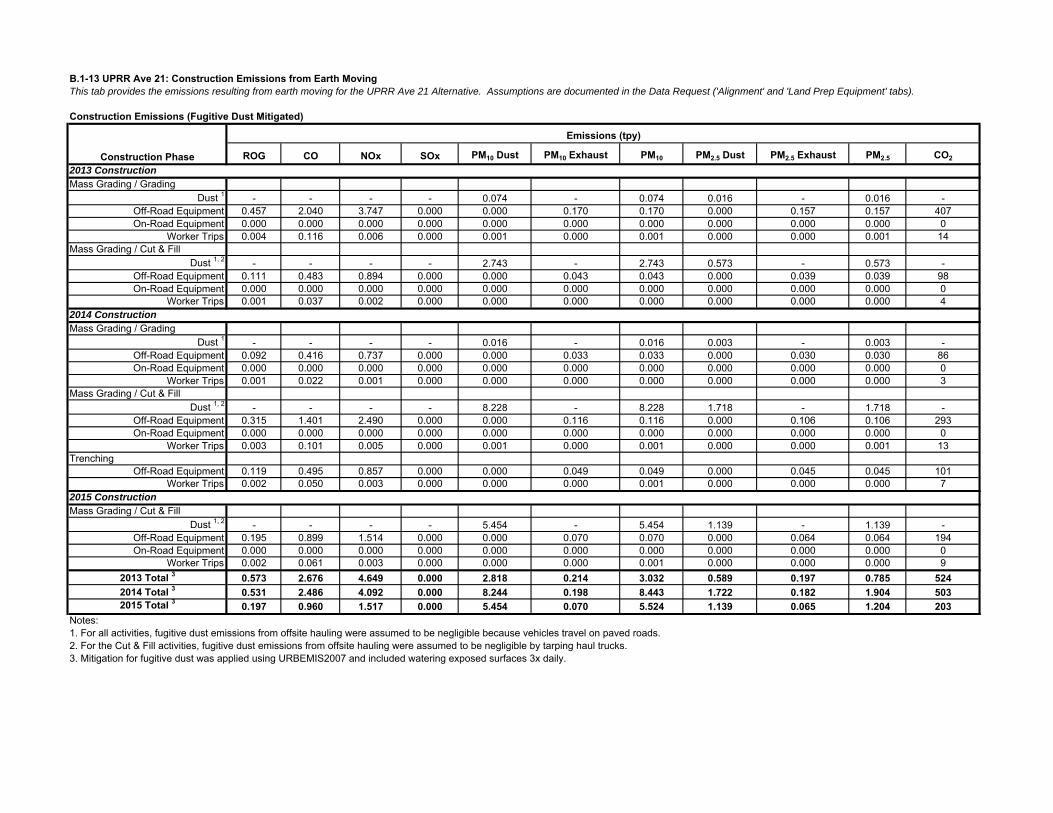
B.1-13 UPRR Ave 21: Construction Emissions from Earth MovingThis tab provides the emissions resulting from earth moving for the UPRR Ave 21 Alternative. Assumptions are documented in the Data Request ('Alignment' and 'Land Prep Equipment' tabs).
Construction Emissions (Fugitive Dust Mitigated)
ROG CO NOx SOx PM10 Dust PM10 Exhaust PM10 PM2.5 Dust PM2.5 Exhaust PM2.5 CO2
2013 ConstructionMass Grading / Grading
Dust 1 - - - - 0.074 - 0.074 0.016 - 0.016 -Off-Road Equipment 0.457 2.040 3.747 0.000 0.000 0.170 0.170 0.000 0.157 0.157 407On-Road Equipment 0.000 0.000 0.000 0.000 0.000 0.000 0.000 0.000 0.000 0.000 0
Worker Trips 0.004 0.116 0.006 0.000 0.001 0.000 0.001 0.000 0.000 0.001 14Mass Grading / Cut & Fill
Dust 1, 2 - - - - 2.743 - 2.743 0.573 - 0.573 -Off-Road Equipment 0.111 0.483 0.894 0.000 0.000 0.043 0.043 0.000 0.039 0.039 98On-Road Equipment 0.000 0.000 0.000 0.000 0.000 0.000 0.000 0.000 0.000 0.000 0
Worker Trips 0.001 0.037 0.002 0.000 0.000 0.000 0.000 0.000 0.000 0.000 42014 ConstructionMass Grading / Grading
Dust 1 - - - - 0.016 - 0.016 0.003 - 0.003 -Off-Road Equipment 0.092 0.416 0.737 0.000 0.000 0.033 0.033 0.000 0.030 0.030 86On-Road Equipment 0.000 0.000 0.000 0.000 0.000 0.000 0.000 0.000 0.000 0.000 0
Worker Trips 0.001 0.022 0.001 0.000 0.000 0.000 0.000 0.000 0.000 0.000 3Mass Grading / Cut & Fill
Dust 1, 2 - - - - 8.228 - 8.228 1.718 - 1.718 -Off-Road Equipment 0.315 1.401 2.490 0.000 0.000 0.116 0.116 0.000 0.106 0.106 293On-Road Equipment 0.000 0.000 0.000 0.000 0.000 0.000 0.000 0.000 0.000 0.000 0
Worker Trips 0.003 0.101 0.005 0.000 0.001 0.000 0.001 0.000 0.000 0.001 13Trenching
Off-Road Equipment 0.119 0.495 0.857 0.000 0.000 0.049 0.049 0.000 0.045 0.045 101Worker Trips 0.002 0.050 0.003 0.000 0.000 0.000 0.001 0.000 0.000 0.000 7
2015 ConstructionMass Grading / Cut & Fill
Dust 1, 2 - - - - 5.454 - 5.454 1.139 - 1.139 -Off-Road Equipment 0.195 0.899 1.514 0.000 0.000 0.070 0.070 0.000 0.064 0.064 194On-Road Equipment 0.000 0.000 0.000 0.000 0.000 0.000 0.000 0.000 0.000 0.000 0
Worker Trips 0.002 0.061 0.003 0.000 0.000 0.000 0.001 0.000 0.000 0.000 92013 Total 3 0.573 2.676 4.649 0.000 2.818 0.214 3.032 0.589 0.197 0.785 5242014 Total 3 0.531 2.486 4.092 0.000 8.244 0.198 8.443 1.722 0.182 1.904 5032015 Total 3 0.197 0.960 1.517 0.000 5.454 0.070 5.524 1.139 0.065 1.204 203
Notes:1. For all activities, fugitive dust emissions from offsite hauling were assumed to be negligible because vehicles travel on paved roads.2. For the Cut & Fill activities, fugitive dust emissions from offsite hauling were assumed to be negligible by tarping haul trucks.3. Mitigation for fugitive dust was applied using URBEMIS2007 and included watering exposed surfaces 3x daily.
Construction Phase
Emissions (tpy)
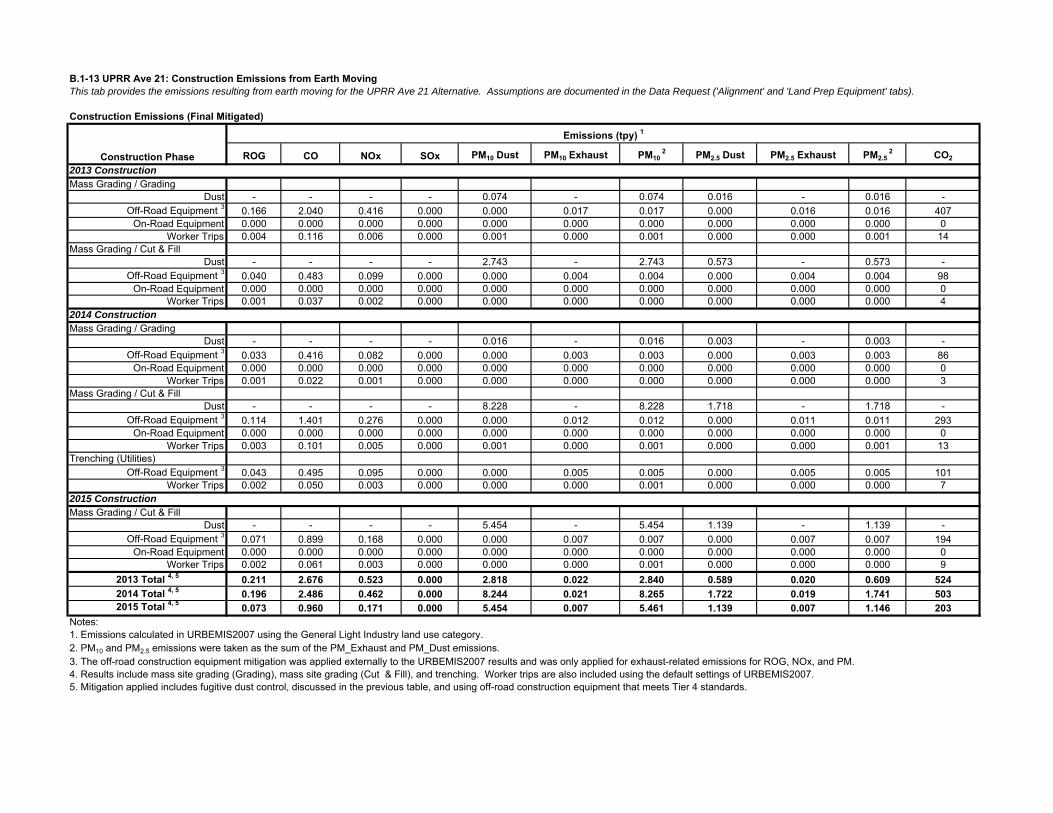
B.1-13 UPRR Ave 21: Construction Emissions from Earth MovingThis tab provides the emissions resulting from earth moving for the UPRR Ave 21 Alternative. Assumptions are documented in the Data Request ('Alignment' and 'Land Prep Equipment' tabs).
Construction Emissions (Final Mitigated)
ROG CO NOx SOx PM10 Dust PM10 Exhaust PM10 2 PM2.5 Dust PM2.5 Exhaust PM2.5
2 CO2
2013 ConstructionMass Grading / Grading
Dust - - - - 0.074 - 0.074 0.016 - 0.016 -Off-Road Equipment 3 0.166 2.040 0.416 0.000 0.000 0.017 0.017 0.000 0.016 0.016 407
On-Road Equipment 0.000 0.000 0.000 0.000 0.000 0.000 0.000 0.000 0.000 0.000 0Worker Trips 0.004 0.116 0.006 0.000 0.001 0.000 0.001 0.000 0.000 0.001 14
Mass Grading / Cut & FillDust - - - - 2.743 - 2.743 0.573 - 0.573 -
Off-Road Equipment 3 0.040 0.483 0.099 0.000 0.000 0.004 0.004 0.000 0.004 0.004 98On-Road Equipment 0.000 0.000 0.000 0.000 0.000 0.000 0.000 0.000 0.000 0.000 0
Worker Trips 0.001 0.037 0.002 0.000 0.000 0.000 0.000 0.000 0.000 0.000 42014 ConstructionMass Grading / Grading
Dust - - - - 0.016 - 0.016 0.003 - 0.003 -Off-Road Equipment 3 0.033 0.416 0.082 0.000 0.000 0.003 0.003 0.000 0.003 0.003 86
On-Road Equipment 0.000 0.000 0.000 0.000 0.000 0.000 0.000 0.000 0.000 0.000 0Worker Trips 0.001 0.022 0.001 0.000 0.000 0.000 0.000 0.000 0.000 0.000 3
Mass Grading / Cut & FillDust - - - - 8.228 - 8.228 1.718 - 1.718 -
Off-Road Equipment 3 0.114 1.401 0.276 0.000 0.000 0.012 0.012 0.000 0.011 0.011 293On-Road Equipment 0.000 0.000 0.000 0.000 0.000 0.000 0.000 0.000 0.000 0.000 0
Worker Trips 0.003 0.101 0.005 0.000 0.001 0.000 0.001 0.000 0.000 0.001 13Trenching (Utilities)
Off-Road Equipment 3 0.043 0.495 0.095 0.000 0.000 0.005 0.005 0.000 0.005 0.005 101Worker Trips 0.002 0.050 0.003 0.000 0.000 0.000 0.001 0.000 0.000 0.000 7
2015 ConstructionMass Grading / Cut & Fill
Dust - - - - 5.454 - 5.454 1.139 - 1.139 -Off-Road Equipment 3 0.071 0.899 0.168 0.000 0.000 0.007 0.007 0.000 0.007 0.007 194
On-Road Equipment 0.000 0.000 0.000 0.000 0.000 0.000 0.000 0.000 0.000 0.000 0Worker Trips 0.002 0.061 0.003 0.000 0.000 0.000 0.001 0.000 0.000 0.000 9
2013 Total 4, 5 0.211 2.676 0.523 0.000 2.818 0.022 2.840 0.589 0.020 0.609 5242014 Total 4, 5 0.196 2.486 0.462 0.000 8.244 0.021 8.265 1.722 0.019 1.741 5032015 Total 4, 5 0.073 0.960 0.171 0.000 5.454 0.007 5.461 1.139 0.007 1.146 203
Notes:
2. PM10 and PM2.5 emissions were taken as the sum of the PM_Exhaust and PM_Dust emissions.3. The off-road construction equipment mitigation was applied externally to the URBEMIS2007 results and was only applied for exhaust-related emissions for ROG, NOx, and PM.4. Results include mass site grading (Grading), mass site grading (Cut & Fill), and trenching. Worker trips are also included using the default settings of URBEMIS2007.5. Mitigation applied includes fugitive dust control, discussed in the previous table, and using off-road construction equipment that meets Tier 4 standards.
Construction Phase
Emissions (tpy) 1
1. Emissions calculated in URBEMIS2007 using the General Light Industry land use category.

B.1-14 UPRR Ave 24: Construction Emissions from Earth MovingThis tab provides the emissions resulting from earth moving for the UPRR Ave 24 Alternative. Assumptions are documented in the Data Request ('Alignment' and 'Land Prep Equipment' tabs).
Construction Emissions (Programmatic)
ROG CO NOx SOx PM10 Dust PM10 Exhaust PM10 PM2.5 Dust PM2.5 Exhaust PM2.5 CO2
2013 ConstructionMass Grading / Grading
Dust - - - - 0.082 - 0.082 0.017 - 0.017 -Off-Road Equipment 0.457 2.040 3.747 0.000 0.000 0.170 0.170 0.000 0.157 0.157 407On-Road Equipment 0.000 0.000 0.000 0.000 0.000 0.000 0.000 0.000 0.000 0.000 0
Worker Trips 0.004 0.116 0.006 0.000 0.001 0.000 0.001 0.000 0.000 0.001 14Mass Grading / Cut & Fill
Dust - - - - 15.473 - 15.473 3.231 - 3.231 -Off-Road Equipment 0.111 0.483 0.894 0.000 0.000 0.043 0.043 0.000 0.039 0.039 98On-Road Equipment 0.000 0.000 0.000 0.000 0.000 0.000 0.000 0.000 0.000 0.000 0
Worker Trips 0.001 0.037 0.002 0.000 0.000 0.000 0.000 0.000 0.000 0.000 42014 ConstructionMass Grading / Grading
Dust - - - - 0.017 - 0.017 0.004 - 0.004 -Off-Road Equipment 0.092 0.416 0.737 0.000 0.000 0.033 0.033 0.000 0.030 0.030 86On-Road Equipment 0.000 0.000 0.000 0.000 0.000 0.000 0.000 0.000 0.000 0.000 0
Worker Trips 0.001 0.022 0.001 0.000 0.000 0.000 0.000 0.000 0.000 0.000 3Mass Grading / Cut & Fill
Dust - - - - 46.419 - 46.419 9.694 - 9.694 -Off-Road Equipment 0.315 1.401 2.490 0.000 0.000 0.116 0.116 0.000 0.106 0.106 293On-Road Equipment 0.000 0.000 0.000 0.000 0.000 0.000 0.000 0.000 0.000 0.000 0
Worker Trips 0.003 0.101 0.005 0.000 0.001 0.000 0.001 0.000 0.000 0.001 13Trenching
Off-Road Equipment 0.119 0.495 0.857 0.000 0.000 0.049 0.049 0.000 0.045 0.045 101Worker Trips 0.002 0.050 0.003 0.000 0.000 0.000 0.001 0.000 0.000 0.000 7
2015 ConstructionMass Grading / Cut & Fill
Dust - - - - 30.768 - 30.768 6.426 - 6.426 -Off-Road Equipment 0.195 0.899 1.514 0.000 0.000 0.070 0.070 0.000 0.064 0.064 194On-Road Equipment 0.000 0.000 0.000 0.000 0.000 0.000 0.000 0.000 0.000 0.000 0
Worker Trips 0.002 0.061 0.003 0.000 0.000 0.000 0.001 0.000 0.000 0.000 92013 Total 2 0.573 2.676 4.649 0.000 15.556 0.214 15.770 3.249 0.197 3.446 5242014 Total 2 0.531 2.486 4.092 0.000 46.438 0.198 46.636 9.698 0.182 9.881 5032015 Total 2 0.197 0.960 1.517 0.000 30.769 0.070 30.839 6.426 0.065 6.490 203
Notes:
Construction Phase
Emissions (tpy) 1
1. Emissions calculated in URBEMIS2007 using the General Light Industry land use category and include programmatic emissions reduction measures. The programmatic reduction emission measures are called "mitigation" in the URBEMIS2007 output. 2. Results include mass site grading (Grading), mass site grading (Cut & Fill), and trenching. Worker trips are also included using the default settings of URBEMIS2007. Material hauling emissions during this phase are presented separately.

B.1-14 UPRR Ave 24: Construction Emissions from Earth MovingThis tab provides the emissions resulting from earth moving for the UPRR Ave 24 Alternative. Assumptions are documented in the Data Request ('Alignment' and 'Land Prep Equipment' tabs).
Construction Emissions (Fugitive Dust Mitigated)
ROG CO NOx SOx PM10 Dust PM10 Exhaust PM10 PM2.5 Dust PM2.5 Exhaust PM2.5 CO2
2013 ConstructionMass Grading / Grading
Dust 1 - - - - 0.074 - 0.074 0.016 - 0.016 -Off-Road Equipment 0.457 2.040 3.747 0.000 0.000 0.170 0.170 0.000 0.157 0.157 407On-Road Equipment 0.000 0.000 0.000 0.000 0.000 0.000 0.000 0.000 0.000 0.000 0
Worker Trips 0.004 0.116 0.006 0.000 0.001 0.000 0.001 0.000 0.000 0.001 14Mass Grading / Cut & Fill
Dust 1, 2 - - - - 2.992 - 2.992 0.625 - 0.625 -Off-Road Equipment 0.111 0.483 0.894 0.000 0.000 0.043 0.043 0.000 0.039 0.039 98On-Road Equipment 0.000 0.000 0.000 0.000 0.000 0.000 0.000 0.000 0.000 0.000 0
Worker Trips 0.001 0.037 0.002 0.000 0.000 0.000 0.000 0.000 0.000 0.000 42014 ConstructionMass Grading / Grading
Dust 1 - - - - 0.016 - 0.016 0.003 - 0.003 -Off-Road Equipment 0.092 0.416 0.737 0.000 0.000 0.033 0.033 0.000 0.030 0.030 86On-Road Equipment 0.000 0.000 0.000 0.000 0.000 0.000 0.000 0.000 0.000 0.000 0
Worker Trips 0.001 0.022 0.001 0.000 0.000 0.000 0.000 0.000 0.000 0.000 3Mass Grading / Cut & Fill
Dust 1, 2 - - - - 8.976 - 8.976 1.875 - 1.875 -Off-Road Equipment 0.315 1.401 2.490 0.000 0.000 0.116 0.116 0.000 0.106 0.106 293On-Road Equipment 0.000 0.000 0.000 0.000 0.000 0.000 0.000 0.000 0.000 0.000 0
Worker Trips 0.003 0.101 0.005 0.000 0.001 0.000 0.001 0.000 0.000 0.001 13Trenching
Off-Road Equipment 0.119 0.495 0.857 0.000 0.000 0.049 0.049 0.000 0.045 0.045 101Worker Trips 0.002 0.050 0.003 0.000 0.000 0.000 0.001 0.000 0.000 0.000 7
2015 ConstructionMass Grading / Cut & Fill
Dust 1, 2 - - - - 5.950 - 5.950 1.243 - 1.243 -Off-Road Equipment 0.195 0.899 1.514 0.000 0.000 0.070 0.070 0.000 0.064 0.064 194On-Road Equipment 0.000 0.000 0.000 0.000 0.000 0.000 0.000 0.000 0.000 0.000 0
Worker Trips 0.002 0.061 0.003 0.000 0.000 0.000 0.001 0.000 0.000 0.000 92013 Total 3 0.573 2.676 4.649 0.000 3.067 0.214 3.281 0.641 0.197 0.837 5242014 Total 3 0.531 2.486 4.092 0.000 8.993 0.198 9.191 1.878 0.182 2.061 5032015 Total 3 0.197 0.960 1.517 0.000 5.950 0.070 6.021 1.243 0.065 1.307 203
Notes:1. For all activities, fugitive dust emissions from offsite hauling were assumed to be negligible because vehicles travel on paved roads.2. For the Cut & Fill activities, fugitive dust emissions from offsite hauling were assumed to be negligible by tarping haul trucks.3. Mitigation for fugitive dust was applied using URBEMIS2007 and included watering exposed surfaces 3x daily.
Construction Phase
Emissions (tpy)
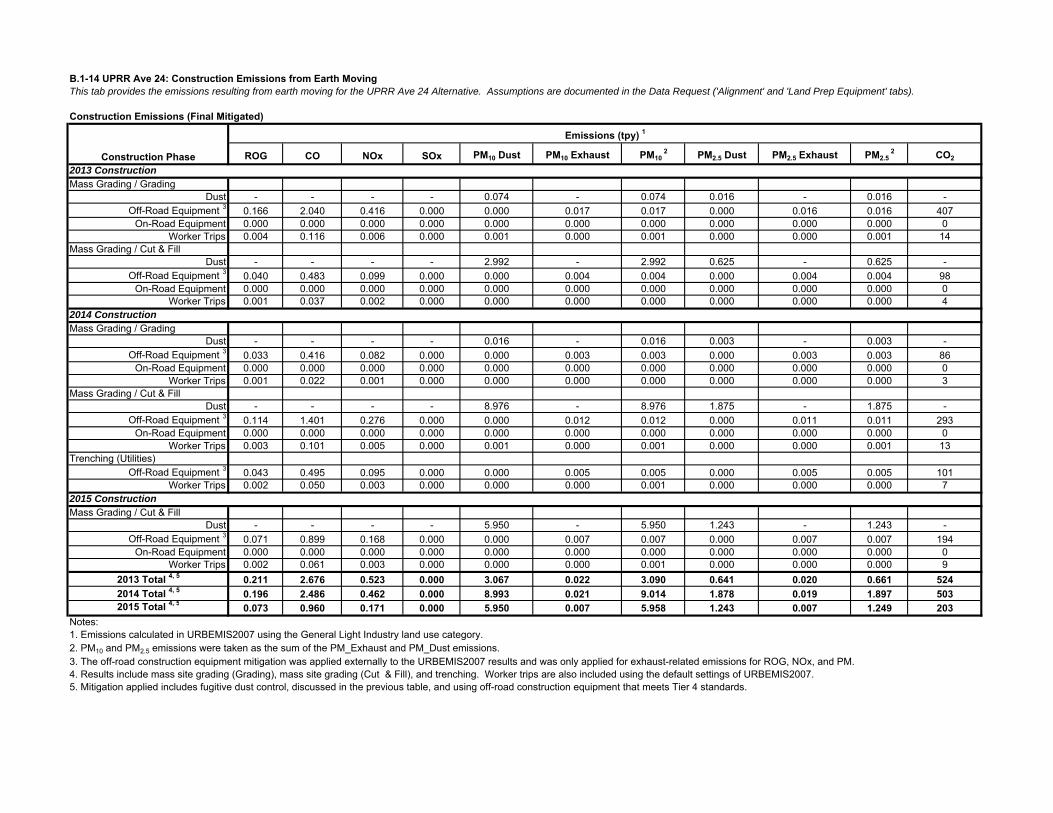
B.1-14 UPRR Ave 24: Construction Emissions from Earth MovingThis tab provides the emissions resulting from earth moving for the UPRR Ave 24 Alternative. Assumptions are documented in the Data Request ('Alignment' and 'Land Prep Equipment' tabs).
Construction Emissions (Final Mitigated)
ROG CO NOx SOx PM10 Dust PM10 Exhaust PM10 2 PM2.5 Dust PM2.5 Exhaust PM2.5
2 CO2
2013 ConstructionMass Grading / Grading
Dust - - - - 0.074 - 0.074 0.016 - 0.016 -Off-Road Equipment 3 0.166 2.040 0.416 0.000 0.000 0.017 0.017 0.000 0.016 0.016 407
On-Road Equipment 0.000 0.000 0.000 0.000 0.000 0.000 0.000 0.000 0.000 0.000 0Worker Trips 0.004 0.116 0.006 0.000 0.001 0.000 0.001 0.000 0.000 0.001 14
Mass Grading / Cut & FillDust - - - - 2.992 - 2.992 0.625 - 0.625 -
Off-Road Equipment 3 0.040 0.483 0.099 0.000 0.000 0.004 0.004 0.000 0.004 0.004 98On-Road Equipment 0.000 0.000 0.000 0.000 0.000 0.000 0.000 0.000 0.000 0.000 0
Worker Trips 0.001 0.037 0.002 0.000 0.000 0.000 0.000 0.000 0.000 0.000 42014 ConstructionMass Grading / Grading
Dust - - - - 0.016 - 0.016 0.003 - 0.003 -Off-Road Equipment 3 0.033 0.416 0.082 0.000 0.000 0.003 0.003 0.000 0.003 0.003 86
On-Road Equipment 0.000 0.000 0.000 0.000 0.000 0.000 0.000 0.000 0.000 0.000 0Worker Trips 0.001 0.022 0.001 0.000 0.000 0.000 0.000 0.000 0.000 0.000 3
Mass Grading / Cut & FillDust - - - - 8.976 - 8.976 1.875 - 1.875 -
Off-Road Equipment 3 0.114 1.401 0.276 0.000 0.000 0.012 0.012 0.000 0.011 0.011 293On-Road Equipment 0.000 0.000 0.000 0.000 0.000 0.000 0.000 0.000 0.000 0.000 0
Worker Trips 0.003 0.101 0.005 0.000 0.001 0.000 0.001 0.000 0.000 0.001 13Trenching (Utilities)
Off-Road Equipment 3 0.043 0.495 0.095 0.000 0.000 0.005 0.005 0.000 0.005 0.005 101Worker Trips 0.002 0.050 0.003 0.000 0.000 0.000 0.001 0.000 0.000 0.000 7
2015 ConstructionMass Grading / Cut & Fill
Dust - - - - 5.950 - 5.950 1.243 - 1.243 -Off-Road Equipment 3 0.071 0.899 0.168 0.000 0.000 0.007 0.007 0.000 0.007 0.007 194
On-Road Equipment 0.000 0.000 0.000 0.000 0.000 0.000 0.000 0.000 0.000 0.000 0Worker Trips 0.002 0.061 0.003 0.000 0.000 0.000 0.001 0.000 0.000 0.000 9
2013 Total 4, 5 0.211 2.676 0.523 0.000 3.067 0.022 3.090 0.641 0.020 0.661 5242014 Total 4, 5 0.196 2.486 0.462 0.000 8.993 0.021 9.014 1.878 0.019 1.897 5032015 Total 4, 5 0.073 0.960 0.171 0.000 5.950 0.007 5.958 1.243 0.007 1.249 203
Notes:
2. PM10 and PM2.5 emissions were taken as the sum of the PM_Exhaust and PM_Dust emissions.3. The off-road construction equipment mitigation was applied externally to the URBEMIS2007 results and was only applied for exhaust-related emissions for ROG, NOx, and PM.4. Results include mass site grading (Grading), mass site grading (Cut & Fill), and trenching. Worker trips are also included using the default settings of URBEMIS2007.5. Mitigation applied includes fugitive dust control, discussed in the previous table, and using off-road construction equipment that meets Tier 4 standards.
Construction Phase
Emissions (tpy) 1
1. Emissions calculated in URBEMIS2007 using the General Light Industry land use category.

B.1-15 Hybrid Ave 24: Construction Emissions from Earth MovingThis tab provides the emissions resulting from earth moving for the Hybrid Ave 24 Alternative. Assumptions are documented in the Data Request ('Alignment' and 'Land Prep Equipment' tabs).
Construction Emissions (Programmatic)
ROG CO NOx SOx PM10 Dust PM10 Exhaust PM10 PM2.5 Dust PM2.5 Exhaust PM2.5 CO2
2013 ConstructionMass Grading / Grading
Dust - - - - 0.082 - 0.082 0.017 - 0.017 -Off-Road Equipment 0.457 2.040 3.747 0.000 0.000 0.170 0.170 0.000 0.157 0.157 407On-Road Equipment 0.000 0.000 0.000 0.000 0.000 0.000 0.000 0.000 0.000 0.000 0
Worker Trips 0.004 0.116 0.006 0.000 0.001 0.000 0.001 0.000 0.000 0.001 14Mass Grading / Cut & Fill
Dust - - - - 15.926 - 15.926 3.326 - 3.326 -Off-Road Equipment 0.111 0.483 0.894 0.000 0.000 0.043 0.043 0.000 0.039 0.039 98On-Road Equipment 0.000 0.000 0.000 0.000 0.000 0.000 0.000 0.000 0.000 0.000 0
Worker Trips 0.001 0.037 0.002 0.000 0.000 0.000 0.000 0.000 0.000 0.000 42014 ConstructionMass Grading / Grading
Dust - - - - 0.017 - 0.017 0.004 - 0.004 -Off-Road Equipment 0.092 0.416 0.737 0.000 0.000 0.033 0.033 0.000 0.030 0.030 86On-Road Equipment 0.000 0.000 0.000 0.000 0.000 0.000 0.000 0.000 0.000 0.000 0
Worker Trips 0.001 0.022 0.001 0.000 0.000 0.000 0.000 0.000 0.000 0.000 3Mass Grading / Cut & Fill
Dust - - - - 47.779 - 47.779 9.978 - 9.978 -Off-Road Equipment 0.315 1.401 2.490 0.000 0.000 0.116 0.116 0.000 0.106 0.106 293On-Road Equipment 0.000 0.000 0.000 0.000 0.000 0.000 0.000 0.000 0.000 0.000 0
Worker Trips 0.003 0.101 0.005 0.000 0.001 0.000 0.001 0.000 0.000 0.001 13Trenching
Off-Road Equipment 0.119 0.495 0.857 0.000 0.000 0.049 0.049 0.000 0.045 0.045 101Worker Trips 0.002 0.050 0.003 0.000 0.000 0.000 0.001 0.000 0.000 0.000 7
2015 ConstructionMass Grading / Cut & Fill
Dust - - - - 31.669 - 31.669 6.614 - 6.614 -Off-Road Equipment 0.195 0.899 1.514 0.000 0.000 0.070 0.070 0.000 0.064 0.064 194On-Road Equipment 0.000 0.000 0.000 0.000 0.000 0.000 0.000 0.000 0.000 0.000 0
Worker Trips 0.002 0.061 0.003 0.000 0.000 0.000 0.001 0.000 0.000 0.000 92013 Total 2 0.573 2.676 4.649 0.000 16.009 0.214 16.223 3.343 0.197 3.540 5242014 Total 2 0.531 2.486 4.092 0.000 47.797 0.198 47.995 9.982 0.182 10.164 5032015 Total 2 0.197 0.960 1.517 0.000 31.670 0.070 31.740 6.614 0.065 6.679 203
Notes:
Construction Phase
Emissions (tpy) 1
1. Emissions calculated in URBEMIS2007 using the General Light Industry land use category and include programmatic emissions reduction measures. The programmatic reduction emission measures are called "mitigation" in the URBEMIS2007 output. 2. Results include mass site grading (Grading), mass site grading (Cut & Fill), and trenching. Worker trips are also included using the default settings of URBEMIS2007. Material hauling emissions during this phase are presented separately.

B.1-15 Hybrid Ave 24: Construction Emissions from Earth MovingThis tab provides the emissions resulting from earth moving for the Hybrid Ave 24 Alternative. Assumptions are documented in the Data Request ('Alignment' and 'Land Prep Equipment' tabs).
Construction Emissions (Fugitive Dust Mitigated)
ROG CO NOx SOx PM10 Dust PM10 Exhaust PM10 PM2.5 Dust PM2.5 Exhaust PM2.5 CO2
2013 ConstructionMass Grading / Grading
Dust 1 - - - - 0.074 - 0.074 0.016 - 0.016 -Off-Road Equipment 0.457 2.040 3.747 0.000 0.000 0.170 0.170 0.000 0.157 0.157 407On-Road Equipment 0.000 0.000 0.000 0.000 0.000 0.000 0.000 0.000 0.000 0.000 0
Worker Trips 0.004 0.116 0.006 0.000 0.001 0.000 0.001 0.000 0.000 0.001 14Mass Grading / Cut & Fill
Dust 1, 2 - - - - 3.079 - 3.079 0.643 - 0.643 -Off-Road Equipment 0.111 0.483 0.894 0.000 0.000 0.043 0.043 0.000 0.039 0.039 98On-Road Equipment 0.000 0.000 0.000 0.000 0.000 0.000 0.000 0.000 0.000 0.000 0
Worker Trips 0.001 0.037 0.002 0.000 0.000 0.000 0.000 0.000 0.000 0.000 42014 ConstructionMass Grading / Grading
Dust 1 - - - - 0.016 - 0.016 0.003 - 0.003 -Off-Road Equipment 0.092 0.416 0.737 0.000 0.000 0.033 0.033 0.000 0.030 0.030 86On-Road Equipment 0.000 0.000 0.000 0.000 0.000 0.000 0.000 0.000 0.000 0.000 0
Worker Trips 0.001 0.022 0.001 0.000 0.000 0.000 0.000 0.000 0.000 0.000 3Mass Grading / Cut & Fill
Dust 1, 2 - - - - 9.237 - 9.237 1.929 - 1.929 -Off-Road Equipment 0.315 1.401 2.490 0.000 0.000 0.116 0.116 0.000 0.106 0.106 293On-Road Equipment 0.000 0.000 0.000 0.000 0.000 0.000 0.000 0.000 0.000 0.000 0
Worker Trips 0.003 0.101 0.005 0.000 0.001 0.000 0.001 0.000 0.000 0.001 13Trenching
Off-Road Equipment 0.119 0.495 0.857 0.000 0.000 0.049 0.049 0.000 0.045 0.045 101Worker Trips 0.002 0.050 0.003 0.000 0.000 0.000 0.001 0.000 0.000 0.000 7
2015 ConstructionMass Grading / Cut & Fill
Dust 1, 2 - - - - 6.123 - 6.123 1.279 - 1.279 -Off-Road Equipment 0.195 0.899 1.514 0.000 0.000 0.070 0.070 0.000 0.064 0.064 194On-Road Equipment 0.000 0.000 0.000 0.000 0.000 0.000 0.000 0.000 0.000 0.000 0
Worker Trips 0.002 0.061 0.003 0.000 0.000 0.000 0.001 0.000 0.000 0.000 92013 Total 3 0.573 2.676 4.649 0.000 3.154 0.214 3.368 0.659 0.197 0.856 5242014 Total 3 0.531 2.486 4.092 0.000 9.254 0.198 9.452 1.933 0.182 2.115 5032015 Total 3 0.197 0.960 1.517 0.000 6.123 0.070 6.193 1.279 0.065 1.343 203
Notes:1. For all activities, fugitive dust emissions from offsite hauling were assumed to be negligible because vehicles travel on paved roads.2. For the Cut & Fill activities, fugitive dust emissions from offsite hauling were assumed to be negligible by tarping haul trucks.3. Mitigation for fugitive dust was applied using URBEMIS2007 and included watering exposed surfaces 3x daily.
Construction Phase
Emissions (tpy)

B.1-15 Hybrid Ave 24: Construction Emissions from Earth MovingThis tab provides the emissions resulting from earth moving for the Hybrid Ave 24 Alternative. Assumptions are documented in the Data Request ('Alignment' and 'Land Prep Equipment' tabs).
Construction Emissions (Final Mitigated)
ROG CO NOx SOx PM10 Dust PM10 Exhaust PM10 2 PM2.5 Dust PM2.5 Exhaust PM2.5
2 CO2
2013 ConstructionMass Grading / Grading
Dust - - - - 0.074 - 0.074 0.016 - 0.016 -Off-Road Equipment 3 0.166 2.040 0.416 0.000 0.000 0.017 0.017 0.000 0.016 0.016 407
On-Road Equipment 0.000 0.000 0.000 0.000 0.000 0.000 0.000 0.000 0.000 0.000 0Worker Trips 0.004 0.116 0.006 0.000 0.001 0.000 0.001 0.000 0.000 0.001 14
Mass Grading / Cut & FillDust - - - - 3.079 - 3.079 0.643 - 0.643 -
Off-Road Equipment 3 0.040 0.483 0.099 0.000 0.000 0.004 0.004 0.000 0.004 0.004 98On-Road Equipment 0.000 0.000 0.000 0.000 0.000 0.000 0.000 0.000 0.000 0.000 0
Worker Trips 0.001 0.037 0.002 0.000 0.000 0.000 0.000 0.000 0.000 0.000 42014 ConstructionMass Grading / Grading
Dust - - - - 0.016 - 0.016 0.003 - 0.003 -Off-Road Equipment 3 0.033 0.416 0.082 0.000 0.000 0.003 0.003 0.000 0.003 0.003 86
On-Road Equipment 0.000 0.000 0.000 0.000 0.000 0.000 0.000 0.000 0.000 0.000 0Worker Trips 0.001 0.022 0.001 0.000 0.000 0.000 0.000 0.000 0.000 0.000 3
Mass Grading / Cut & FillDust - - - - 9.237 - 9.237 1.929 - 1.929 -
Off-Road Equipment 3 0.114 1.401 0.276 0.000 0.000 0.012 0.012 0.000 0.011 0.011 293On-Road Equipment 0.000 0.000 0.000 0.000 0.000 0.000 0.000 0.000 0.000 0.000 0
Worker Trips 0.003 0.101 0.005 0.000 0.001 0.000 0.001 0.000 0.000 0.001 13Trenching (Utilities)
Off-Road Equipment 3 0.043 0.495 0.095 0.000 0.000 0.005 0.005 0.000 0.005 0.005 101Worker Trips 0.002 0.050 0.003 0.000 0.000 0.000 0.001 0.000 0.000 0.000 7
2015 ConstructionMass Grading / Cut & Fill
Dust - - - - 6.123 - 6.123 1.279 - 1.279 -Off-Road Equipment 3 0.071 0.899 0.168 0.000 0.000 0.007 0.007 0.000 0.007 0.007 194
On-Road Equipment 0.000 0.000 0.000 0.000 0.000 0.000 0.000 0.000 0.000 0.000 0Worker Trips 0.002 0.061 0.003 0.000 0.000 0.000 0.001 0.000 0.000 0.000 9
2013 Total 4, 5 0.211 2.676 0.523 0.000 3.154 0.022 3.177 0.659 0.020 0.679 5242014 Total 4, 5 0.196 2.486 0.462 0.000 9.254 0.021 9.275 1.933 0.019 1.952 5032015 Total 4, 5 0.073 0.960 0.171 0.000 6.123 0.007 6.131 1.279 0.007 1.286 203
Notes:
2. PM10 and PM2.5 emissions were taken as the sum of the PM_Exhaust and PM_Dust emissions.3. The off-road construction equipment mitigation was applied externally to the URBEMIS2007 results and was only applied for exhaust-related emissions for ROG, NOx, and PM.4. Results include mass site grading (Grading), mass site grading (Cut & Fill), and trenching. Worker trips are also included using the default settings of URBEMIS2007.5. Mitigation applied includes fugitive dust control, discussed in the previous table, and using off-road construction equipment that meets Tier 4 standards.
Construction Phase
Emissions (tpy) 1
1. Emissions calculated in URBEMIS2007 using the General Light Industry land use category.
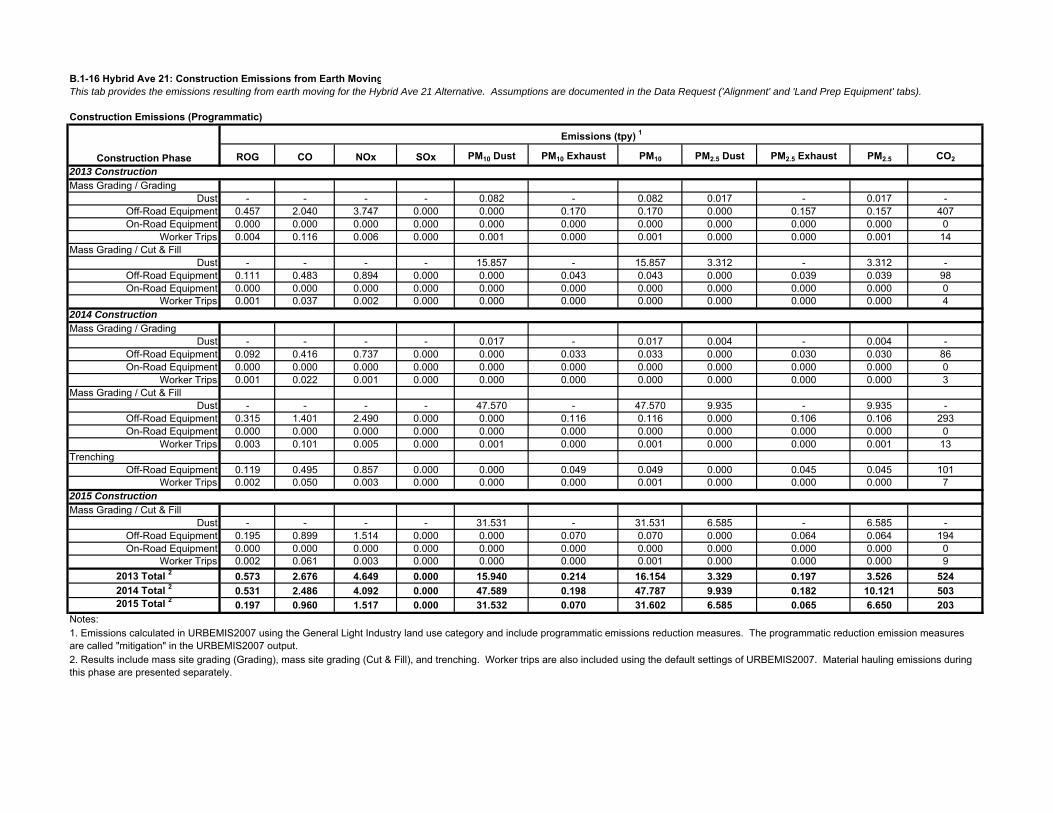
B.1-16 Hybrid Ave 21: Construction Emissions from Earth MovingThis tab provides the emissions resulting from earth moving for the Hybrid Ave 21 Alternative. Assumptions are documented in the Data Request ('Alignment' and 'Land Prep Equipment' tabs).
Construction Emissions (Programmatic)
ROG CO NOx SOx PM10 Dust PM10 Exhaust PM10 PM2.5 Dust PM2.5 Exhaust PM2.5 CO2
2013 ConstructionMass Grading / Grading
Dust - - - - 0.082 - 0.082 0.017 - 0.017 -Off-Road Equipment 0.457 2.040 3.747 0.000 0.000 0.170 0.170 0.000 0.157 0.157 407On-Road Equipment 0.000 0.000 0.000 0.000 0.000 0.000 0.000 0.000 0.000 0.000 0
Worker Trips 0.004 0.116 0.006 0.000 0.001 0.000 0.001 0.000 0.000 0.001 14Mass Grading / Cut & Fill
Dust - - - - 15.857 - 15.857 3.312 - 3.312 -Off-Road Equipment 0.111 0.483 0.894 0.000 0.000 0.043 0.043 0.000 0.039 0.039 98On-Road Equipment 0.000 0.000 0.000 0.000 0.000 0.000 0.000 0.000 0.000 0.000 0
Worker Trips 0.001 0.037 0.002 0.000 0.000 0.000 0.000 0.000 0.000 0.000 42014 ConstructionMass Grading / Grading
Dust - - - - 0.017 - 0.017 0.004 - 0.004 -Off-Road Equipment 0.092 0.416 0.737 0.000 0.000 0.033 0.033 0.000 0.030 0.030 86On-Road Equipment 0.000 0.000 0.000 0.000 0.000 0.000 0.000 0.000 0.000 0.000 0
Worker Trips 0.001 0.022 0.001 0.000 0.000 0.000 0.000 0.000 0.000 0.000 3Mass Grading / Cut & Fill
Dust - - - - 47.570 - 47.570 9.935 - 9.935 -Off-Road Equipment 0.315 1.401 2.490 0.000 0.000 0.116 0.116 0.000 0.106 0.106 293On-Road Equipment 0.000 0.000 0.000 0.000 0.000 0.000 0.000 0.000 0.000 0.000 0
Worker Trips 0.003 0.101 0.005 0.000 0.001 0.000 0.001 0.000 0.000 0.001 13Trenching
Off-Road Equipment 0.119 0.495 0.857 0.000 0.000 0.049 0.049 0.000 0.045 0.045 101Worker Trips 0.002 0.050 0.003 0.000 0.000 0.000 0.001 0.000 0.000 0.000 7
2015 ConstructionMass Grading / Cut & Fill
Dust - - - - 31.531 - 31.531 6.585 - 6.585 -Off-Road Equipment 0.195 0.899 1.514 0.000 0.000 0.070 0.070 0.000 0.064 0.064 194On-Road Equipment 0.000 0.000 0.000 0.000 0.000 0.000 0.000 0.000 0.000 0.000 0
Worker Trips 0.002 0.061 0.003 0.000 0.000 0.000 0.001 0.000 0.000 0.000 92013 Total 2 0.573 2.676 4.649 0.000 15.940 0.214 16.154 3.329 0.197 3.526 5242014 Total 2 0.531 2.486 4.092 0.000 47.589 0.198 47.787 9.939 0.182 10.121 5032015 Total 2 0.197 0.960 1.517 0.000 31.532 0.070 31.602 6.585 0.065 6.650 203
Notes:
Construction Phase
Emissions (tpy) 1
1. Emissions calculated in URBEMIS2007 using the General Light Industry land use category and include programmatic emissions reduction measures. The programmatic reduction emission measures are called "mitigation" in the URBEMIS2007 output. 2. Results include mass site grading (Grading), mass site grading (Cut & Fill), and trenching. Worker trips are also included using the default settings of URBEMIS2007. Material hauling emissions during this phase are presented separately.

B.1-16 Hybrid Ave 21: Construction Emissions from Earth MovingThis tab provides the emissions resulting from earth moving for the Hybrid Ave 21 Alternative. Assumptions are documented in the Data Request ('Alignment' and 'Land Prep Equipment' tabs).
Construction Emissions (Fugitive Dust Mitigated)
ROG CO NOx SOx PM10 Dust PM10 Exhaust PM10 PM2.5 Dust PM2.5 Exhaust PM2.5 CO2
2013 ConstructionMass Grading / Grading
Dust 1 - - - - 0.074 - 0.074 0.016 - 0.016 -Off-Road Equipment 0.457 2.040 3.747 0.000 0.000 0.170 0.170 0.000 0.157 0.157 407On-Road Equipment 0.000 0.000 0.000 0.000 0.000 0.000 0.000 0.000 0.000 0.000 0
Worker Trips 0.004 0.116 0.006 0.000 0.001 0.000 0.001 0.000 0.000 0.001 14Mass Grading / Cut & Fill
Dust 1, 2 - - - - 3.066 - 3.066 0.640 - 0.640 -Off-Road Equipment 0.111 0.483 0.894 0.000 0.000 0.043 0.043 0.000 0.039 0.039 98On-Road Equipment 0.000 0.000 0.000 0.000 0.000 0.000 0.000 0.000 0.000 0.000 0
Worker Trips 0.001 0.037 0.002 0.000 0.000 0.000 0.000 0.000 0.000 0.000 42014 ConstructionMass Grading / Grading
Dust 1 - - - - 0.016 - 0.016 0.003 - 0.003 -Off-Road Equipment 0.092 0.416 0.737 0.000 0.000 0.033 0.033 0.000 0.030 0.030 86On-Road Equipment 0.000 0.000 0.000 0.000 0.000 0.000 0.000 0.000 0.000 0.000 0
Worker Trips 0.001 0.022 0.001 0.000 0.000 0.000 0.000 0.000 0.000 0.000 3Mass Grading / Cut & Fill
Dust 1, 2 - - - - 9.197 - 9.197 1.921 - 1.921 -Off-Road Equipment 0.315 1.401 2.490 0.000 0.000 0.116 0.116 0.000 0.106 0.106 293On-Road Equipment 0.000 0.000 0.000 0.000 0.000 0.000 0.000 0.000 0.000 0.000 0
Worker Trips 0.003 0.101 0.005 0.000 0.001 0.000 0.001 0.000 0.000 0.001 13Trenching
Off-Road Equipment 0.119 0.495 0.857 0.000 0.000 0.049 0.049 0.000 0.045 0.045 101Worker Trips 0.002 0.050 0.003 0.000 0.000 0.000 0.001 0.000 0.000 0.000 7
2015 ConstructionMass Grading / Cut & Fill
Dust 1, 2 - - - - 6.096 - 6.096 1.273 - 1.273 -Off-Road Equipment 0.195 0.899 1.514 0.000 0.000 0.070 0.070 0.000 0.064 0.064 194On-Road Equipment 0.000 0.000 0.000 0.000 0.000 0.000 0.000 0.000 0.000 0.000 0
Worker Trips 0.002 0.061 0.003 0.000 0.000 0.000 0.001 0.000 0.000 0.000 92013 Total 3 0.573 2.676 4.649 0.000 3.141 0.214 3.355 0.656 0.197 0.853 5242014 Total 3 0.531 2.486 4.092 0.000 9.214 0.198 9.412 1.924 0.182 2.107 5032015 Total 3 0.197 0.960 1.517 0.000 6.097 0.070 6.167 1.273 0.065 1.338 203
Notes:1. For all activities, fugitive dust emissions from offsite hauling were assumed to be negligible because vehicles travel on paved roads.2. For the Cut & Fill activities, fugitive dust emissions from offsite hauling were assumed to be negligible by tarping haul trucks.3. Mitigation for fugitive dust was applied using URBEMIS2007 and included watering exposed surfaces 3x daily.
Construction Phase
Emissions (tpy)
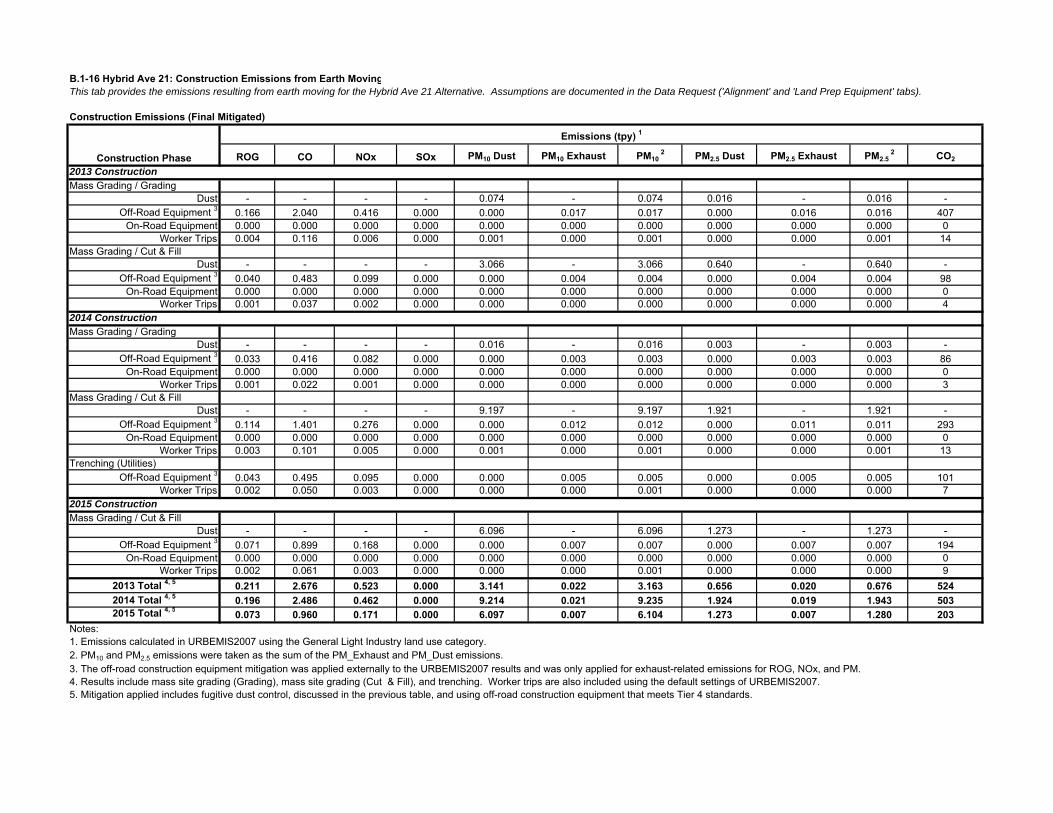
B.1-16 Hybrid Ave 21: Construction Emissions from Earth MovingThis tab provides the emissions resulting from earth moving for the Hybrid Ave 21 Alternative. Assumptions are documented in the Data Request ('Alignment' and 'Land Prep Equipment' tabs).
Construction Emissions (Final Mitigated)
ROG CO NOx SOx PM10 Dust PM10 Exhaust PM10 2 PM2.5 Dust PM2.5 Exhaust PM2.5
2 CO2
2013 ConstructionMass Grading / Grading
Dust - - - - 0.074 - 0.074 0.016 - 0.016 -Off-Road Equipment 3 0.166 2.040 0.416 0.000 0.000 0.017 0.017 0.000 0.016 0.016 407
On-Road Equipment 0.000 0.000 0.000 0.000 0.000 0.000 0.000 0.000 0.000 0.000 0Worker Trips 0.004 0.116 0.006 0.000 0.001 0.000 0.001 0.000 0.000 0.001 14
Mass Grading / Cut & FillDust - - - - 3.066 - 3.066 0.640 - 0.640 -
Off-Road Equipment 3 0.040 0.483 0.099 0.000 0.000 0.004 0.004 0.000 0.004 0.004 98On-Road Equipment 0.000 0.000 0.000 0.000 0.000 0.000 0.000 0.000 0.000 0.000 0
Worker Trips 0.001 0.037 0.002 0.000 0.000 0.000 0.000 0.000 0.000 0.000 42014 ConstructionMass Grading / Grading
Dust - - - - 0.016 - 0.016 0.003 - 0.003 -Off-Road Equipment 3 0.033 0.416 0.082 0.000 0.000 0.003 0.003 0.000 0.003 0.003 86
On-Road Equipment 0.000 0.000 0.000 0.000 0.000 0.000 0.000 0.000 0.000 0.000 0Worker Trips 0.001 0.022 0.001 0.000 0.000 0.000 0.000 0.000 0.000 0.000 3
Mass Grading / Cut & FillDust - - - - 9.197 - 9.197 1.921 - 1.921 -
Off-Road Equipment 3 0.114 1.401 0.276 0.000 0.000 0.012 0.012 0.000 0.011 0.011 293On-Road Equipment 0.000 0.000 0.000 0.000 0.000 0.000 0.000 0.000 0.000 0.000 0
Worker Trips 0.003 0.101 0.005 0.000 0.001 0.000 0.001 0.000 0.000 0.001 13Trenching (Utilities)
Off-Road Equipment 3 0.043 0.495 0.095 0.000 0.000 0.005 0.005 0.000 0.005 0.005 101Worker Trips 0.002 0.050 0.003 0.000 0.000 0.000 0.001 0.000 0.000 0.000 7
2015 ConstructionMass Grading / Cut & Fill
Dust - - - - 6.096 - 6.096 1.273 - 1.273 -Off-Road Equipment 3 0.071 0.899 0.168 0.000 0.000 0.007 0.007 0.000 0.007 0.007 194
On-Road Equipment 0.000 0.000 0.000 0.000 0.000 0.000 0.000 0.000 0.000 0.000 0Worker Trips 0.002 0.061 0.003 0.000 0.000 0.000 0.001 0.000 0.000 0.000 9
2013 Total 4, 5 0.211 2.676 0.523 0.000 3.141 0.022 3.163 0.656 0.020 0.676 5242014 Total 4, 5 0.196 2.486 0.462 0.000 9.214 0.021 9.235 1.924 0.019 1.943 5032015 Total 4, 5 0.073 0.960 0.171 0.000 6.097 0.007 6.104 1.273 0.007 1.280 203
Notes:
2. PM10 and PM2.5 emissions were taken as the sum of the PM_Exhaust and PM_Dust emissions.3. The off-road construction equipment mitigation was applied externally to the URBEMIS2007 results and was only applied for exhaust-related emissions for ROG, NOx, and PM.4. Results include mass site grading (Grading), mass site grading (Cut & Fill), and trenching. Worker trips are also included using the default settings of URBEMIS2007.5. Mitigation applied includes fugitive dust control, discussed in the previous table, and using off-road construction equipment that meets Tier 4 standards.
Construction Phase
Emissions (tpy) 1
1. Emissions calculated in URBEMIS2007 using the General Light Industry land use category.
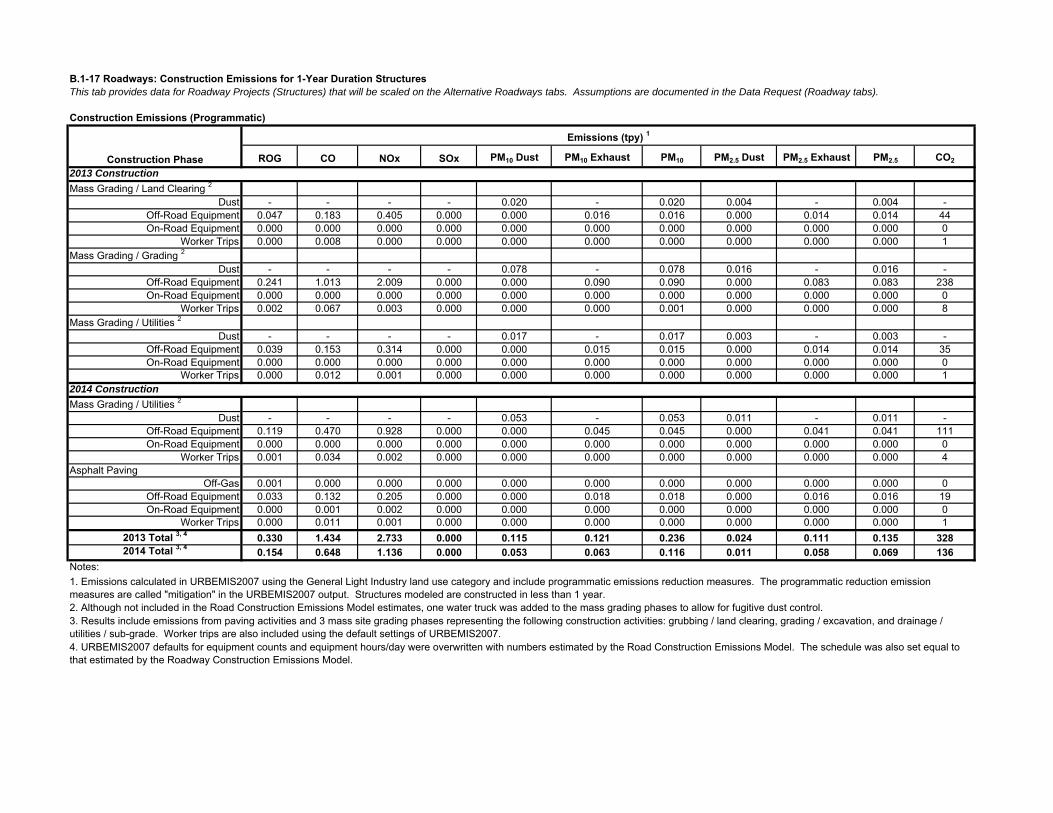
B.1-17 Roadways: Construction Emissions for 1-Year Duration StructuresThis tab provides data for Roadway Projects (Structures) that will be scaled on the Alternative Roadways tabs. Assumptions are documented in the Data Request (Roadway tabs).
Construction Emissions (Programmatic)
ROG CO NOx SOx PM10 Dust PM10 Exhaust PM10 PM2.5 Dust PM2.5 Exhaust PM2.5 CO2
2013 Construction
Mass Grading / Land Clearing 2
Dust - - - - 0.020 - 0.020 0.004 - 0.004 -Off-Road Equipment 0.047 0.183 0.405 0.000 0.000 0.016 0.016 0.000 0.014 0.014 44On-Road Equipment 0.000 0.000 0.000 0.000 0.000 0.000 0.000 0.000 0.000 0.000 0
Worker Trips 0.000 0.008 0.000 0.000 0.000 0.000 0.000 0.000 0.000 0.000 1Mass Grading / Grading 2
Dust - - - - 0.078 - 0.078 0.016 - 0.016 -Off-Road Equipment 0.241 1.013 2.009 0.000 0.000 0.090 0.090 0.000 0.083 0.083 238On-Road Equipment 0.000 0.000 0.000 0.000 0.000 0.000 0.000 0.000 0.000 0.000 0
Worker Trips 0.002 0.067 0.003 0.000 0.000 0.000 0.001 0.000 0.000 0.000 8Mass Grading / Utilities 2
Dust - - - - 0.017 - 0.017 0.003 - 0.003 -Off-Road Equipment 0.039 0.153 0.314 0.000 0.000 0.015 0.015 0.000 0.014 0.014 35On-Road Equipment 0.000 0.000 0.000 0.000 0.000 0.000 0.000 0.000 0.000 0.000 0
Worker Trips 0.000 0.012 0.001 0.000 0.000 0.000 0.000 0.000 0.000 0.000 12014 Construction
Mass Grading / Utilities 2
Dust - - - - 0.053 - 0.053 0.011 - 0.011 -Off-Road Equipment 0.119 0.470 0.928 0.000 0.000 0.045 0.045 0.000 0.041 0.041 111On-Road Equipment 0.000 0.000 0.000 0.000 0.000 0.000 0.000 0.000 0.000 0.000 0
Worker Trips 0.001 0.034 0.002 0.000 0.000 0.000 0.000 0.000 0.000 0.000 4Asphalt Paving
Off-Gas 0.001 0.000 0.000 0.000 0.000 0.000 0.000 0.000 0.000 0.000 0Off-Road Equipment 0.033 0.132 0.205 0.000 0.000 0.018 0.018 0.000 0.016 0.016 19On-Road Equipment 0.000 0.001 0.002 0.000 0.000 0.000 0.000 0.000 0.000 0.000 0
Worker Trips 0.000 0.011 0.001 0.000 0.000 0.000 0.000 0.000 0.000 0.000 12013 Total 3, 4 0.330 1.434 2.733 0.000 0.115 0.121 0.236 0.024 0.111 0.135 3282014 Total 3, 4 0.154 0.648 1.136 0.000 0.053 0.063 0.116 0.011 0.058 0.069 136
Notes:
2. Although not included in the Road Construction Emissions Model estimates, one water truck was added to the mass grading phases to allow for fugitive dust control.
Construction Phase
Emissions (tpy) 1
1. Emissions calculated in URBEMIS2007 using the General Light Industry land use category and include programmatic emissions reduction measures. The programmatic reduction emission measures are called "mitigation" in the URBEMIS2007 output. Structures modeled are constructed in less than 1 year.
3. Results include emissions from paving activities and 3 mass site grading phases representing the following construction activities: grubbing / land clearing, grading / excavation, and drainage / utilities / sub-grade. Worker trips are also included using the default settings of URBEMIS2007.4. URBEMIS2007 defaults for equipment counts and equipment hours/day were overwritten with numbers estimated by the Road Construction Emissions Model. The schedule was also set equal to that estimated by the Roadway Construction Emissions Model.
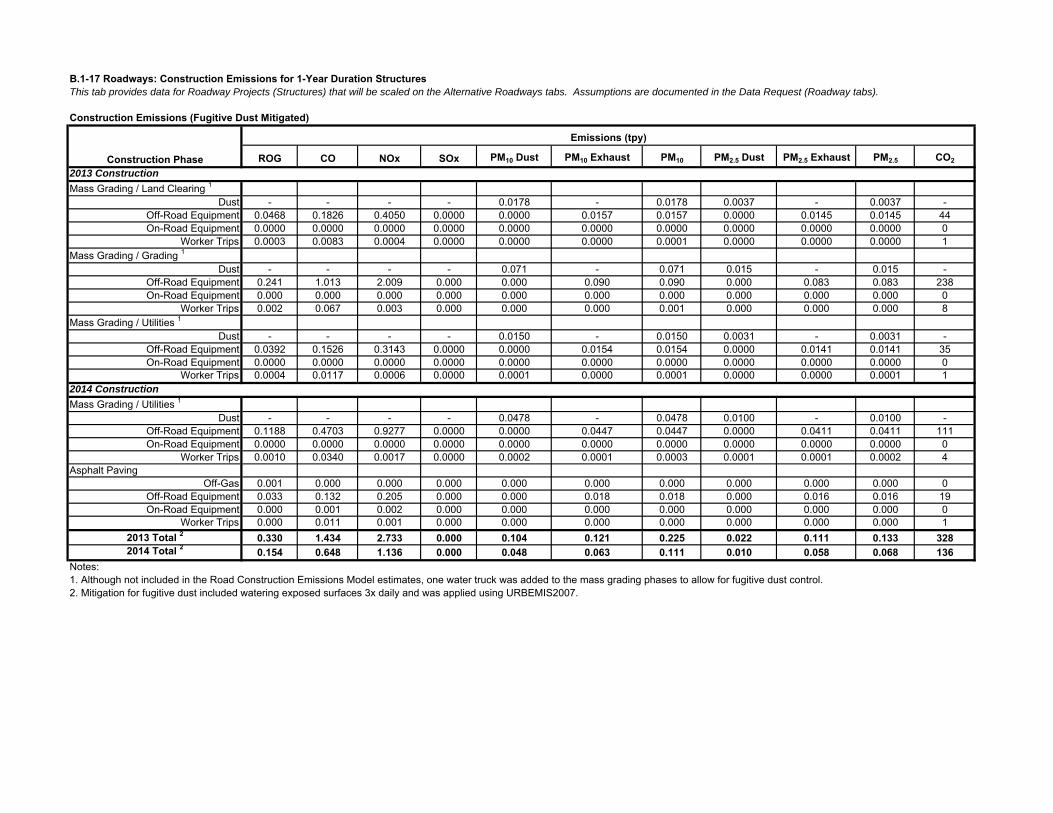
B.1-17 Roadways: Construction Emissions for 1-Year Duration StructuresThis tab provides data for Roadway Projects (Structures) that will be scaled on the Alternative Roadways tabs. Assumptions are documented in the Data Request (Roadway tabs).
Construction Emissions (Fugitive Dust Mitigated)
ROG CO NOx SOx PM10 Dust PM10 Exhaust PM10 PM2.5 Dust PM2.5 Exhaust PM2.5 CO2
2013 Construction
Mass Grading / Land Clearing 1
Dust - - - - 0.0178 - 0.0178 0.0037 - 0.0037 -Off-Road Equipment 0.0468 0.1826 0.4050 0.0000 0.0000 0.0157 0.0157 0.0000 0.0145 0.0145 44On-Road Equipment 0.0000 0.0000 0.0000 0.0000 0.0000 0.0000 0.0000 0.0000 0.0000 0.0000 0
Worker Trips 0.0003 0.0083 0.0004 0.0000 0.0000 0.0000 0.0001 0.0000 0.0000 0.0000 1Mass Grading / Grading 1
Dust - - - - 0.071 - 0.071 0.015 - 0.015 -Off-Road Equipment 0.241 1.013 2.009 0.000 0.000 0.090 0.090 0.000 0.083 0.083 238On-Road Equipment 0.000 0.000 0.000 0.000 0.000 0.000 0.000 0.000 0.000 0.000 0
Worker Trips 0.002 0.067 0.003 0.000 0.000 0.000 0.001 0.000 0.000 0.000 8Mass Grading / Utilities 1
Dust - - - - 0.0150 - 0.0150 0.0031 - 0.0031 -Off-Road Equipment 0.0392 0.1526 0.3143 0.0000 0.0000 0.0154 0.0154 0.0000 0.0141 0.0141 35On-Road Equipment 0.0000 0.0000 0.0000 0.0000 0.0000 0.0000 0.0000 0.0000 0.0000 0.0000 0
Worker Trips 0.0004 0.0117 0.0006 0.0000 0.0001 0.0000 0.0001 0.0000 0.0000 0.0001 12014 Construction
Mass Grading / Utilities 1
Dust - - - - 0.0478 - 0.0478 0.0100 - 0.0100 -Off-Road Equipment 0.1188 0.4703 0.9277 0.0000 0.0000 0.0447 0.0447 0.0000 0.0411 0.0411 111On-Road Equipment 0.0000 0.0000 0.0000 0.0000 0.0000 0.0000 0.0000 0.0000 0.0000 0.0000 0
Worker Trips 0.0010 0.0340 0.0017 0.0000 0.0002 0.0001 0.0003 0.0001 0.0001 0.0002 4Asphalt Paving
Off-Gas 0.001 0.000 0.000 0.000 0.000 0.000 0.000 0.000 0.000 0.000 0Off-Road Equipment 0.033 0.132 0.205 0.000 0.000 0.018 0.018 0.000 0.016 0.016 19On-Road Equipment 0.000 0.001 0.002 0.000 0.000 0.000 0.000 0.000 0.000 0.000 0
Worker Trips 0.000 0.011 0.001 0.000 0.000 0.000 0.000 0.000 0.000 0.000 12013 Total 2 0.330 1.434 2.733 0.000 0.104 0.121 0.225 0.022 0.111 0.133 3282014 Total 2 0.154 0.648 1.136 0.000 0.048 0.063 0.111 0.010 0.058 0.068 136
Notes:1. Although not included in the Road Construction Emissions Model estimates, one water truck was added to the mass grading phases to allow for fugitive dust control.2. Mitigation for fugitive dust included watering exposed surfaces 3x daily and was applied using URBEMIS2007.
Construction Phase
Emissions (tpy)
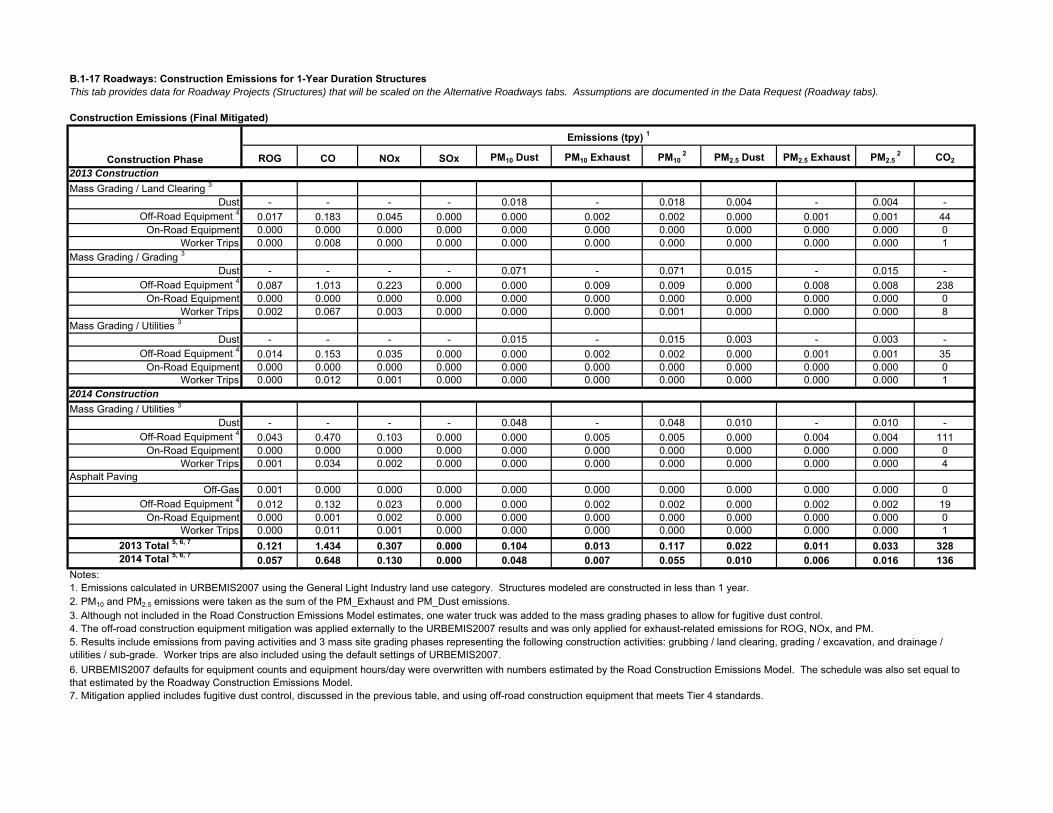
B.1-17 Roadways: Construction Emissions for 1-Year Duration StructuresThis tab provides data for Roadway Projects (Structures) that will be scaled on the Alternative Roadways tabs. Assumptions are documented in the Data Request (Roadway tabs).
Construction Emissions (Final Mitigated)
ROG CO NOx SOx PM10 Dust PM10 Exhaust PM10 2 PM2.5 Dust PM2.5 Exhaust PM2.5
2 CO2
2013 Construction
Mass Grading / Land Clearing 3
Dust - - - - 0.018 - 0.018 0.004 - 0.004 -Off-Road Equipment 4 0.017 0.183 0.045 0.000 0.000 0.002 0.002 0.000 0.001 0.001 44
On-Road Equipment 0.000 0.000 0.000 0.000 0.000 0.000 0.000 0.000 0.000 0.000 0Worker Trips 0.000 0.008 0.000 0.000 0.000 0.000 0.000 0.000 0.000 0.000 1
Mass Grading / Grading 3
Dust - - - - 0.071 - 0.071 0.015 - 0.015 -Off-Road Equipment 4 0.087 1.013 0.223 0.000 0.000 0.009 0.009 0.000 0.008 0.008 238
On-Road Equipment 0.000 0.000 0.000 0.000 0.000 0.000 0.000 0.000 0.000 0.000 0Worker Trips 0.002 0.067 0.003 0.000 0.000 0.000 0.001 0.000 0.000 0.000 8
Mass Grading / Utilities 3
Dust - - - - 0.015 - 0.015 0.003 - 0.003 -Off-Road Equipment 4 0.014 0.153 0.035 0.000 0.000 0.002 0.002 0.000 0.001 0.001 35
On-Road Equipment 0.000 0.000 0.000 0.000 0.000 0.000 0.000 0.000 0.000 0.000 0Worker Trips 0.000 0.012 0.001 0.000 0.000 0.000 0.000 0.000 0.000 0.000 1
2014 Construction
Mass Grading / Utilities 3
Dust - - - - 0.048 - 0.048 0.010 - 0.010 -Off-Road Equipment 4 0.043 0.470 0.103 0.000 0.000 0.005 0.005 0.000 0.004 0.004 111
On-Road Equipment 0.000 0.000 0.000 0.000 0.000 0.000 0.000 0.000 0.000 0.000 0Worker Trips 0.001 0.034 0.002 0.000 0.000 0.000 0.000 0.000 0.000 0.000 4
Asphalt PavingOff-Gas 0.001 0.000 0.000 0.000 0.000 0.000 0.000 0.000 0.000 0.000 0
Off-Road Equipment 4 0.012 0.132 0.023 0.000 0.000 0.002 0.002 0.000 0.002 0.002 19On-Road Equipment 0.000 0.001 0.002 0.000 0.000 0.000 0.000 0.000 0.000 0.000 0
Worker Trips 0.000 0.011 0.001 0.000 0.000 0.000 0.000 0.000 0.000 0.000 12013 Total 5, 6, 7 0.121 1.434 0.307 0.000 0.104 0.013 0.117 0.022 0.011 0.033 3282014 Total 5, 6, 7 0.057 0.648 0.130 0.000 0.048 0.007 0.055 0.010 0.006 0.016 136
Notes:1. Emissions calculated in URBEMIS2007 using the General Light Industry land use category. Structures modeled are constructed in less than 1 year.2. PM10 and PM2.5 emissions were taken as the sum of the PM_Exhaust and PM_Dust emissions.3. Although not included in the Road Construction Emissions Model estimates, one water truck was added to the mass grading phases to allow for fugitive dust control.4. The off-road construction equipment mitigation was applied externally to the URBEMIS2007 results and was only applied for exhaust-related emissions for ROG, NOx, and PM.
7. Mitigation applied includes fugitive dust control, discussed in the previous table, and using off-road construction equipment that meets Tier 4 standards.
5. Results include emissions from paving activities and 3 mass site grading phases representing the following construction activities: grubbing / land clearing, grading / excavation, and drainage / utilities / sub-grade. Worker trips are also included using the default settings of URBEMIS2007.6. URBEMIS2007 defaults for equipment counts and equipment hours/day were overwritten with numbers estimated by the Road Construction Emissions Model. The schedule was also set equal to that estimated by the Roadway Construction Emissions Model.
Construction Phase
Emissions (tpy) 1
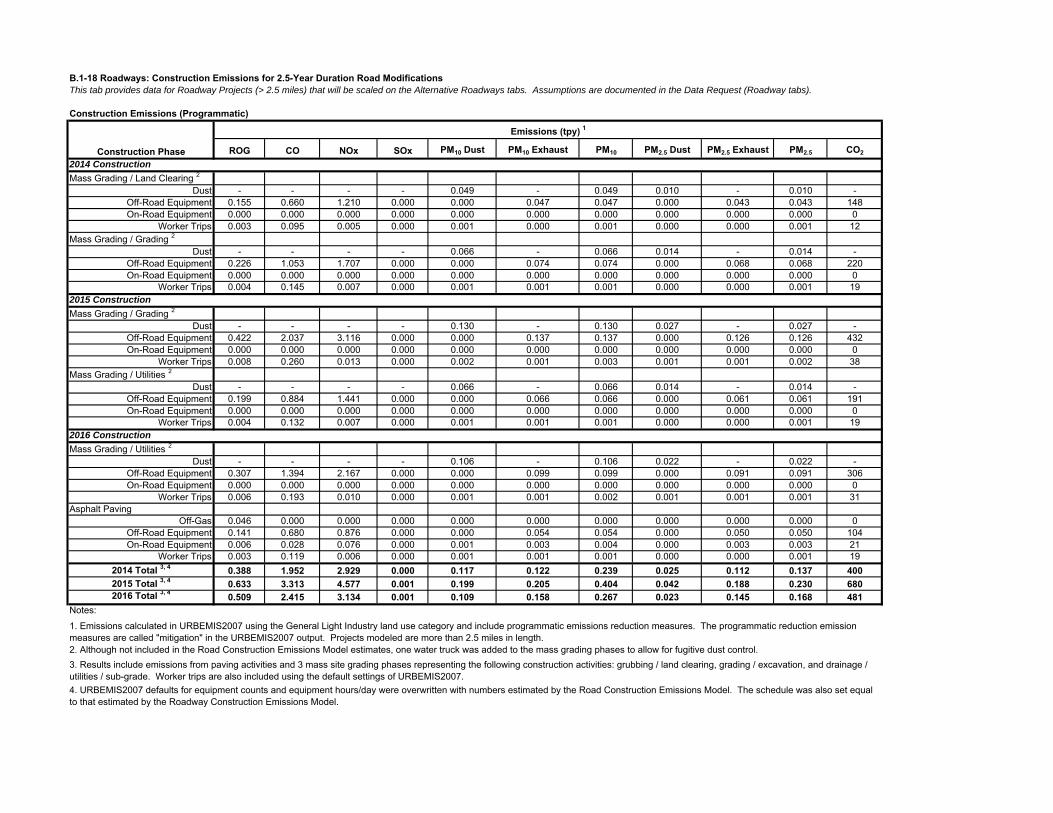
B.1-18 Roadways: Construction Emissions for 2.5-Year Duration Road ModificationsThis tab provides data for Roadway Projects (> 2.5 miles) that will be scaled on the Alternative Roadways tabs. Assumptions are documented in the Data Request (Roadway tabs).
Construction Emissions (Programmatic)
ROG CO NOx SOx PM10 Dust PM10 Exhaust PM10 PM2.5 Dust PM2.5 Exhaust PM2.5 CO2
2014 Construction
Mass Grading / Land Clearing 2
Dust - - - - 0.049 - 0.049 0.010 - 0.010 -Off-Road Equipment 0.155 0.660 1.210 0.000 0.000 0.047 0.047 0.000 0.043 0.043 148On-Road Equipment 0.000 0.000 0.000 0.000 0.000 0.000 0.000 0.000 0.000 0.000 0
Worker Trips 0.003 0.095 0.005 0.000 0.001 0.000 0.001 0.000 0.000 0.001 12Mass Grading / Grading 2
Dust - - - - 0.066 - 0.066 0.014 - 0.014 -Off-Road Equipment 0.226 1.053 1.707 0.000 0.000 0.074 0.074 0.000 0.068 0.068 220On-Road Equipment 0.000 0.000 0.000 0.000 0.000 0.000 0.000 0.000 0.000 0.000 0
Worker Trips 0.004 0.145 0.007 0.000 0.001 0.001 0.001 0.000 0.000 0.001 192015 Construction
Mass Grading / Grading 2
Dust - - - - 0.130 - 0.130 0.027 - 0.027 -Off-Road Equipment 0.422 2.037 3.116 0.000 0.000 0.137 0.137 0.000 0.126 0.126 432On-Road Equipment 0.000 0.000 0.000 0.000 0.000 0.000 0.000 0.000 0.000 0.000 0
Worker Trips 0.008 0.260 0.013 0.000 0.002 0.001 0.003 0.001 0.001 0.002 38Mass Grading / Utilities 2
Dust - - - - 0.066 - 0.066 0.014 - 0.014 -Off-Road Equipment 0.199 0.884 1.441 0.000 0.000 0.066 0.066 0.000 0.061 0.061 191On-Road Equipment 0.000 0.000 0.000 0.000 0.000 0.000 0.000 0.000 0.000 0.000 0
Worker Trips 0.004 0.132 0.007 0.000 0.001 0.001 0.001 0.000 0.000 0.001 192016 Construction
Mass Grading / Utilities 2
Dust - - - - 0.106 - 0.106 0.022 - 0.022 -Off-Road Equipment 0.307 1.394 2.167 0.000 0.000 0.099 0.099 0.000 0.091 0.091 306On-Road Equipment 0.000 0.000 0.000 0.000 0.000 0.000 0.000 0.000 0.000 0.000 0
Worker Trips 0.006 0.193 0.010 0.000 0.001 0.001 0.002 0.001 0.001 0.001 31Asphalt Paving
Off-Gas 0.046 0.000 0.000 0.000 0.000 0.000 0.000 0.000 0.000 0.000 0Off-Road Equipment 0.141 0.680 0.876 0.000 0.000 0.054 0.054 0.000 0.050 0.050 104On-Road Equipment 0.006 0.028 0.076 0.000 0.001 0.003 0.004 0.000 0.003 0.003 21
Worker Trips 0.003 0.119 0.006 0.000 0.001 0.001 0.001 0.000 0.000 0.001 192014 Total 3, 4 0.388 1.952 2.929 0.000 0.117 0.122 0.239 0.025 0.112 0.137 4002015 Total 3, 4 0.633 3.313 4.577 0.001 0.199 0.205 0.404 0.042 0.188 0.230 6802016 Total 3, 4 0.509 2.415 3.134 0.001 0.109 0.158 0.267 0.023 0.145 0.168 481
Notes:
2. Although not included in the Road Construction Emissions Model estimates, one water truck was added to the mass grading phases to allow for fugitive dust control.
Construction Phase
Emissions (tpy) 1
1. Emissions calculated in URBEMIS2007 using the General Light Industry land use category and include programmatic emissions reduction measures. The programmatic reduction emission measures are called "mitigation" in the URBEMIS2007 output. Projects modeled are more than 2.5 miles in length.
3. Results include emissions from paving activities and 3 mass site grading phases representing the following construction activities: grubbing / land clearing, grading / excavation, and drainage / utilities / sub-grade. Worker trips are also included using the default settings of URBEMIS2007.4. URBEMIS2007 defaults for equipment counts and equipment hours/day were overwritten with numbers estimated by the Road Construction Emissions Model. The schedule was also set equal to that estimated by the Roadway Construction Emissions Model.
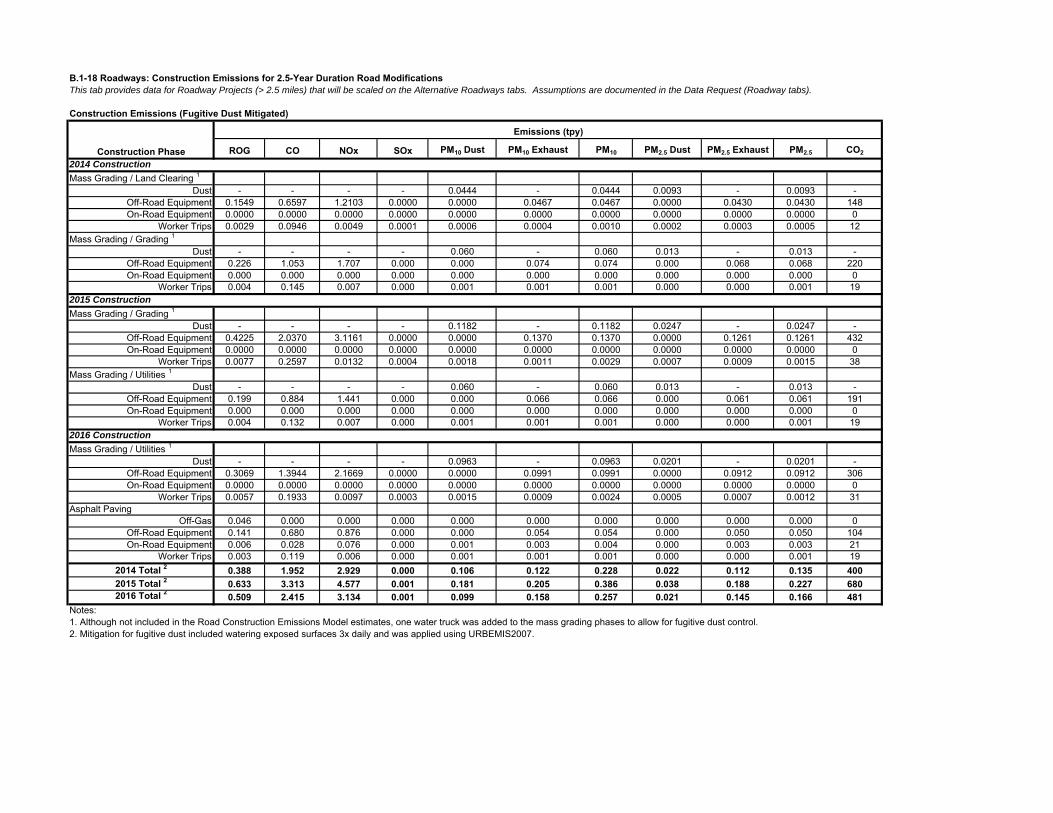
B.1-18 Roadways: Construction Emissions for 2.5-Year Duration Road ModificationsThis tab provides data for Roadway Projects (> 2.5 miles) that will be scaled on the Alternative Roadways tabs. Assumptions are documented in the Data Request (Roadway tabs).
Construction Emissions (Fugitive Dust Mitigated)
ROG CO NOx SOx PM10 Dust PM10 Exhaust PM10 PM2.5 Dust PM2.5 Exhaust PM2.5 CO2
2014 Construction
Mass Grading / Land Clearing 1
Dust - - - - 0.0444 - 0.0444 0.0093 - 0.0093 -Off-Road Equipment 0.1549 0.6597 1.2103 0.0000 0.0000 0.0467 0.0467 0.0000 0.0430 0.0430 148On-Road Equipment 0.0000 0.0000 0.0000 0.0000 0.0000 0.0000 0.0000 0.0000 0.0000 0.0000 0
Worker Trips 0.0029 0.0946 0.0049 0.0001 0.0006 0.0004 0.0010 0.0002 0.0003 0.0005 12Mass Grading / Grading 1
Dust - - - - 0.060 - 0.060 0.013 - 0.013 -Off-Road Equipment 0.226 1.053 1.707 0.000 0.000 0.074 0.074 0.000 0.068 0.068 220On-Road Equipment 0.000 0.000 0.000 0.000 0.000 0.000 0.000 0.000 0.000 0.000 0
Worker Trips 0.004 0.145 0.007 0.000 0.001 0.001 0.001 0.000 0.000 0.001 192015 Construction
Mass Grading / Grading 1
Dust - - - - 0.1182 - 0.1182 0.0247 - 0.0247 -Off-Road Equipment 0.4225 2.0370 3.1161 0.0000 0.0000 0.1370 0.1370 0.0000 0.1261 0.1261 432On-Road Equipment 0.0000 0.0000 0.0000 0.0000 0.0000 0.0000 0.0000 0.0000 0.0000 0.0000 0
Worker Trips 0.0077 0.2597 0.0132 0.0004 0.0018 0.0011 0.0029 0.0007 0.0009 0.0015 38Mass Grading / Utilities 1
Dust - - - - 0.060 - 0.060 0.013 - 0.013 -Off-Road Equipment 0.199 0.884 1.441 0.000 0.000 0.066 0.066 0.000 0.061 0.061 191On-Road Equipment 0.000 0.000 0.000 0.000 0.000 0.000 0.000 0.000 0.000 0.000 0
Worker Trips 0.004 0.132 0.007 0.000 0.001 0.001 0.001 0.000 0.000 0.001 192016 Construction
Mass Grading / Utilities 1
Dust - - - - 0.0963 - 0.0963 0.0201 - 0.0201 -Off-Road Equipment 0.3069 1.3944 2.1669 0.0000 0.0000 0.0991 0.0991 0.0000 0.0912 0.0912 306On-Road Equipment 0.0000 0.0000 0.0000 0.0000 0.0000 0.0000 0.0000 0.0000 0.0000 0.0000 0
Worker Trips 0.0057 0.1933 0.0097 0.0003 0.0015 0.0009 0.0024 0.0005 0.0007 0.0012 31Asphalt Paving
Off-Gas 0.046 0.000 0.000 0.000 0.000 0.000 0.000 0.000 0.000 0.000 0Off-Road Equipment 0.141 0.680 0.876 0.000 0.000 0.054 0.054 0.000 0.050 0.050 104On-Road Equipment 0.006 0.028 0.076 0.000 0.001 0.003 0.004 0.000 0.003 0.003 21
Worker Trips 0.003 0.119 0.006 0.000 0.001 0.001 0.001 0.000 0.000 0.001 192014 Total 2 0.388 1.952 2.929 0.000 0.106 0.122 0.228 0.022 0.112 0.135 4002015 Total 2 0.633 3.313 4.577 0.001 0.181 0.205 0.386 0.038 0.188 0.227 6802016 Total 2 0.509 2.415 3.134 0.001 0.099 0.158 0.257 0.021 0.145 0.166 481
Notes:1. Although not included in the Road Construction Emissions Model estimates, one water truck was added to the mass grading phases to allow for fugitive dust control.2. Mitigation for fugitive dust included watering exposed surfaces 3x daily and was applied using URBEMIS2007.
Construction Phase
Emissions (tpy)
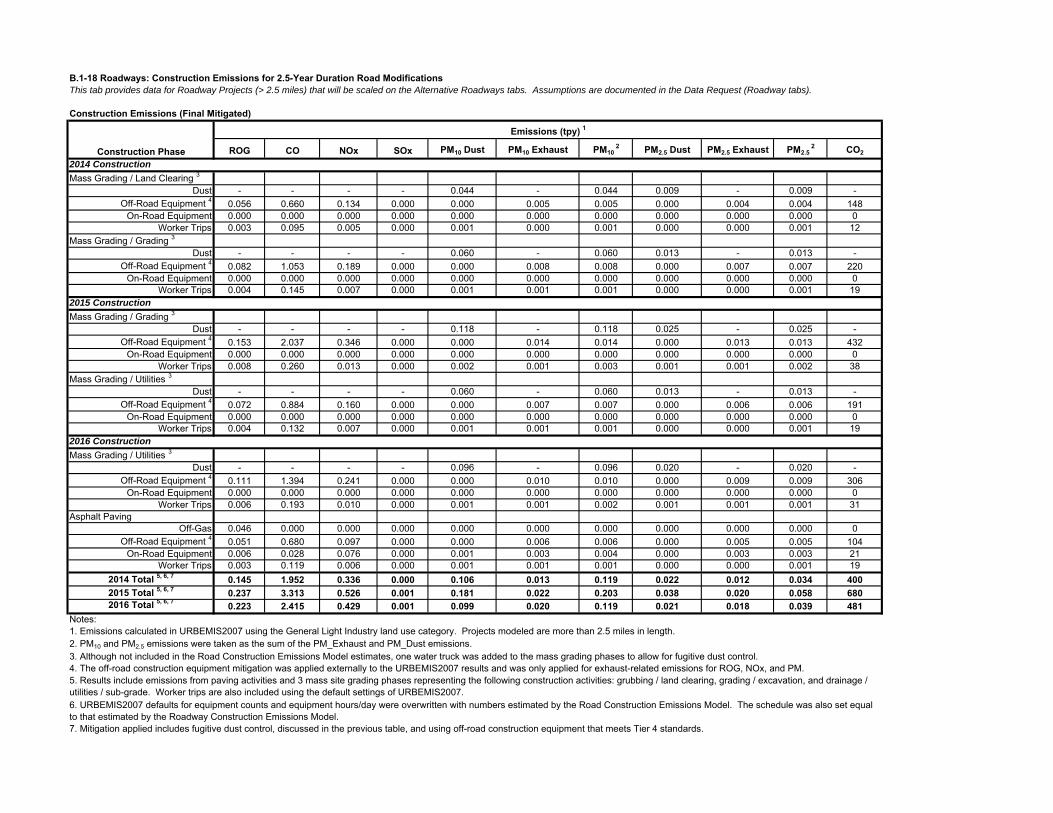
B.1-18 Roadways: Construction Emissions for 2.5-Year Duration Road ModificationsThis tab provides data for Roadway Projects (> 2.5 miles) that will be scaled on the Alternative Roadways tabs. Assumptions are documented in the Data Request (Roadway tabs).
Construction Emissions (Final Mitigated)
ROG CO NOx SOx PM10 Dust PM10 Exhaust PM10 2 PM2.5 Dust PM2.5 Exhaust PM2.5
2 CO2
2014 Construction
Mass Grading / Land Clearing 3
Dust - - - - 0.044 - 0.044 0.009 - 0.009 -Off-Road Equipment 4 0.056 0.660 0.134 0.000 0.000 0.005 0.005 0.000 0.004 0.004 148
On-Road Equipment 0.000 0.000 0.000 0.000 0.000 0.000 0.000 0.000 0.000 0.000 0Worker Trips 0.003 0.095 0.005 0.000 0.001 0.000 0.001 0.000 0.000 0.001 12
Mass Grading / Grading 3
Dust - - - - 0.060 - 0.060 0.013 - 0.013 -Off-Road Equipment 4 0.082 1.053 0.189 0.000 0.000 0.008 0.008 0.000 0.007 0.007 220
On-Road Equipment 0.000 0.000 0.000 0.000 0.000 0.000 0.000 0.000 0.000 0.000 0Worker Trips 0.004 0.145 0.007 0.000 0.001 0.001 0.001 0.000 0.000 0.001 19
2015 Construction
Mass Grading / Grading 3
Dust - - - - 0.118 - 0.118 0.025 - 0.025 -Off-Road Equipment 4 0.153 2.037 0.346 0.000 0.000 0.014 0.014 0.000 0.013 0.013 432
On-Road Equipment 0.000 0.000 0.000 0.000 0.000 0.000 0.000 0.000 0.000 0.000 0Worker Trips 0.008 0.260 0.013 0.000 0.002 0.001 0.003 0.001 0.001 0.002 38
Mass Grading / Utilities 3
Dust - - - - 0.060 - 0.060 0.013 - 0.013 -Off-Road Equipment 4 0.072 0.884 0.160 0.000 0.000 0.007 0.007 0.000 0.006 0.006 191
On-Road Equipment 0.000 0.000 0.000 0.000 0.000 0.000 0.000 0.000 0.000 0.000 0Worker Trips 0.004 0.132 0.007 0.000 0.001 0.001 0.001 0.000 0.000 0.001 19
2016 Construction
Mass Grading / Utilities 3
Dust - - - - 0.096 - 0.096 0.020 - 0.020 -Off-Road Equipment 4 0.111 1.394 0.241 0.000 0.000 0.010 0.010 0.000 0.009 0.009 306
On-Road Equipment 0.000 0.000 0.000 0.000 0.000 0.000 0.000 0.000 0.000 0.000 0Worker Trips 0.006 0.193 0.010 0.000 0.001 0.001 0.002 0.001 0.001 0.001 31
Asphalt PavingOff-Gas 0.046 0.000 0.000 0.000 0.000 0.000 0.000 0.000 0.000 0.000 0
Off-Road Equipment 4 0.051 0.680 0.097 0.000 0.000 0.006 0.006 0.000 0.005 0.005 104On-Road Equipment 0.006 0.028 0.076 0.000 0.001 0.003 0.004 0.000 0.003 0.003 21
Worker Trips 0.003 0.119 0.006 0.000 0.001 0.001 0.001 0.000 0.000 0.001 192014 Total 5, 6, 7 0.145 1.952 0.336 0.000 0.106 0.013 0.119 0.022 0.012 0.034 4002015 Total 5, 6, 7 0.237 3.313 0.526 0.001 0.181 0.022 0.203 0.038 0.020 0.058 6802016 Total 5, 6, 7 0.223 2.415 0.429 0.001 0.099 0.020 0.119 0.021 0.018 0.039 481
Notes:1. Emissions calculated in URBEMIS2007 using the General Light Industry land use category. Projects modeled are more than 2.5 miles in length.2. PM10 and PM2.5 emissions were taken as the sum of the PM_Exhaust and PM_Dust emissions.3. Although not included in the Road Construction Emissions Model estimates, one water truck was added to the mass grading phases to allow for fugitive dust control.4. The off-road construction equipment mitigation was applied externally to the URBEMIS2007 results and was only applied for exhaust-related emissions for ROG, NOx, and PM.
7. Mitigation applied includes fugitive dust control, discussed in the previous table, and using off-road construction equipment that meets Tier 4 standards.
5. Results include emissions from paving activities and 3 mass site grading phases representing the following construction activities: grubbing / land clearing, grading / excavation, and drainage / utilities / sub-grade. Worker trips are also included using the default settings of URBEMIS2007.6. URBEMIS2007 defaults for equipment counts and equipment hours/day were overwritten with numbers estimated by the Road Construction Emissions Model. The schedule was also set equal to that estimated by the Roadway Construction Emissions Model.
Construction Phase
Emissions (tpy) 1
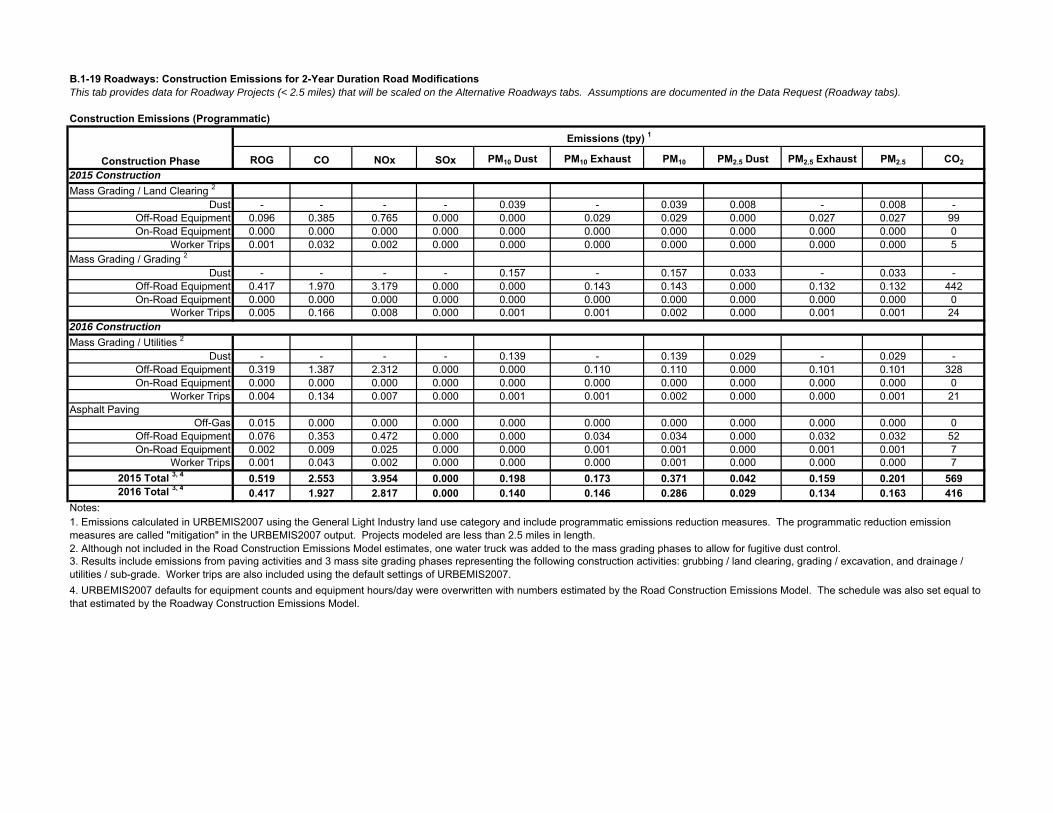
B.1-19 Roadways: Construction Emissions for 2-Year Duration Road ModificationsThis tab provides data for Roadway Projects (< 2.5 miles) that will be scaled on the Alternative Roadways tabs. Assumptions are documented in the Data Request (Roadway tabs).
Construction Emissions (Programmatic)
ROG CO NOx SOx PM10 Dust PM10 Exhaust PM10 PM2.5 Dust PM2.5 Exhaust PM2.5 CO2
2015 Construction
Mass Grading / Land Clearing 2
Dust - - - - 0.039 - 0.039 0.008 - 0.008 -Off-Road Equipment 0.096 0.385 0.765 0.000 0.000 0.029 0.029 0.000 0.027 0.027 99On-Road Equipment 0.000 0.000 0.000 0.000 0.000 0.000 0.000 0.000 0.000 0.000 0
Worker Trips 0.001 0.032 0.002 0.000 0.000 0.000 0.000 0.000 0.000 0.000 5Mass Grading / Grading 2
Dust - - - - 0.157 - 0.157 0.033 - 0.033 -Off-Road Equipment 0.417 1.970 3.179 0.000 0.000 0.143 0.143 0.000 0.132 0.132 442On-Road Equipment 0.000 0.000 0.000 0.000 0.000 0.000 0.000 0.000 0.000 0.000 0
Worker Trips 0.005 0.166 0.008 0.000 0.001 0.001 0.002 0.000 0.001 0.001 242016 Construction
Mass Grading / Utilities 2
Dust - - - - 0.139 - 0.139 0.029 - 0.029 -Off-Road Equipment 0.319 1.387 2.312 0.000 0.000 0.110 0.110 0.000 0.101 0.101 328On-Road Equipment 0.000 0.000 0.000 0.000 0.000 0.000 0.000 0.000 0.000 0.000 0
Worker Trips 0.004 0.134 0.007 0.000 0.001 0.001 0.002 0.000 0.000 0.001 21Asphalt Paving
Off-Gas 0.015 0.000 0.000 0.000 0.000 0.000 0.000 0.000 0.000 0.000 0Off-Road Equipment 0.076 0.353 0.472 0.000 0.000 0.034 0.034 0.000 0.032 0.032 52On-Road Equipment 0.002 0.009 0.025 0.000 0.000 0.001 0.001 0.000 0.001 0.001 7
Worker Trips 0.001 0.043 0.002 0.000 0.000 0.000 0.001 0.000 0.000 0.000 72015 Total 3, 4 0.519 2.553 3.954 0.000 0.198 0.173 0.371 0.042 0.159 0.201 5692016 Total 3, 4 0.417 1.927 2.817 0.000 0.140 0.146 0.286 0.029 0.134 0.163 416
Notes:
2. Although not included in the Road Construction Emissions Model estimates, one water truck was added to the mass grading phases to allow for fugitive dust control.
Construction Phase
Emissions (tpy) 1
1. Emissions calculated in URBEMIS2007 using the General Light Industry land use category and include programmatic emissions reduction measures. The programmatic reduction emission measures are called "mitigation" in the URBEMIS2007 output. Projects modeled are less than 2.5 miles in length.
3. Results include emissions from paving activities and 3 mass site grading phases representing the following construction activities: grubbing / land clearing, grading / excavation, and drainage / utilities / sub-grade. Worker trips are also included using the default settings of URBEMIS2007.4. URBEMIS2007 defaults for equipment counts and equipment hours/day were overwritten with numbers estimated by the Road Construction Emissions Model. The schedule was also set equal to that estimated by the Roadway Construction Emissions Model.
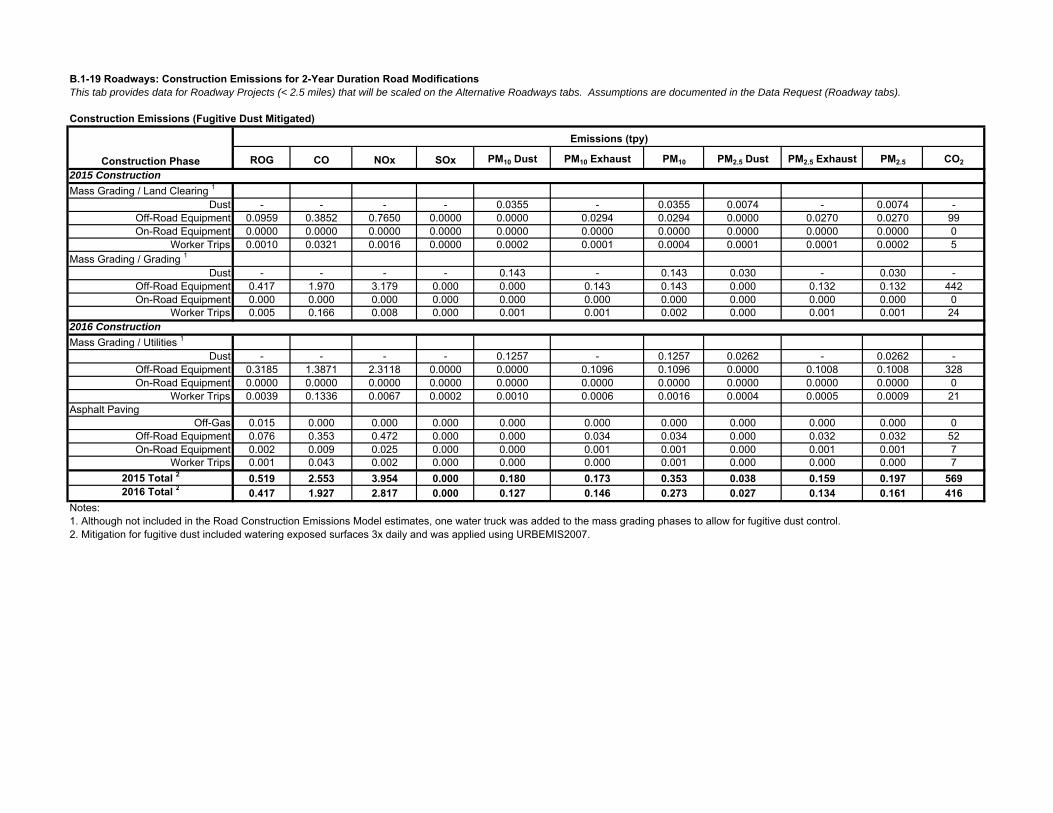
B.1-19 Roadways: Construction Emissions for 2-Year Duration Road ModificationsThis tab provides data for Roadway Projects (< 2.5 miles) that will be scaled on the Alternative Roadways tabs. Assumptions are documented in the Data Request (Roadway tabs).
Construction Emissions (Fugitive Dust Mitigated)
ROG CO NOx SOx PM10 Dust PM10 Exhaust PM10 PM2.5 Dust PM2.5 Exhaust PM2.5 CO2
2015 Construction
Mass Grading / Land Clearing 1
Dust - - - - 0.0355 - 0.0355 0.0074 - 0.0074 -Off-Road Equipment 0.0959 0.3852 0.7650 0.0000 0.0000 0.0294 0.0294 0.0000 0.0270 0.0270 99On-Road Equipment 0.0000 0.0000 0.0000 0.0000 0.0000 0.0000 0.0000 0.0000 0.0000 0.0000 0
Worker Trips 0.0010 0.0321 0.0016 0.0000 0.0002 0.0001 0.0004 0.0001 0.0001 0.0002 5Mass Grading / Grading 1
Dust - - - - 0.143 - 0.143 0.030 - 0.030 -Off-Road Equipment 0.417 1.970 3.179 0.000 0.000 0.143 0.143 0.000 0.132 0.132 442On-Road Equipment 0.000 0.000 0.000 0.000 0.000 0.000 0.000 0.000 0.000 0.000 0
Worker Trips 0.005 0.166 0.008 0.000 0.001 0.001 0.002 0.000 0.001 0.001 242016 Construction
Mass Grading / Utilities 1
Dust - - - - 0.1257 - 0.1257 0.0262 - 0.0262 -Off-Road Equipment 0.3185 1.3871 2.3118 0.0000 0.0000 0.1096 0.1096 0.0000 0.1008 0.1008 328On-Road Equipment 0.0000 0.0000 0.0000 0.0000 0.0000 0.0000 0.0000 0.0000 0.0000 0.0000 0
Worker Trips 0.0039 0.1336 0.0067 0.0002 0.0010 0.0006 0.0016 0.0004 0.0005 0.0009 21Asphalt Paving
Off-Gas 0.015 0.000 0.000 0.000 0.000 0.000 0.000 0.000 0.000 0.000 0Off-Road Equipment 0.076 0.353 0.472 0.000 0.000 0.034 0.034 0.000 0.032 0.032 52On-Road Equipment 0.002 0.009 0.025 0.000 0.000 0.001 0.001 0.000 0.001 0.001 7
Worker Trips 0.001 0.043 0.002 0.000 0.000 0.000 0.001 0.000 0.000 0.000 72015 Total 2 0.519 2.553 3.954 0.000 0.180 0.173 0.353 0.038 0.159 0.197 5692016 Total 2 0.417 1.927 2.817 0.000 0.127 0.146 0.273 0.027 0.134 0.161 416
Notes:1. Although not included in the Road Construction Emissions Model estimates, one water truck was added to the mass grading phases to allow for fugitive dust control.2. Mitigation for fugitive dust included watering exposed surfaces 3x daily and was applied using URBEMIS2007.
Construction Phase
Emissions (tpy)
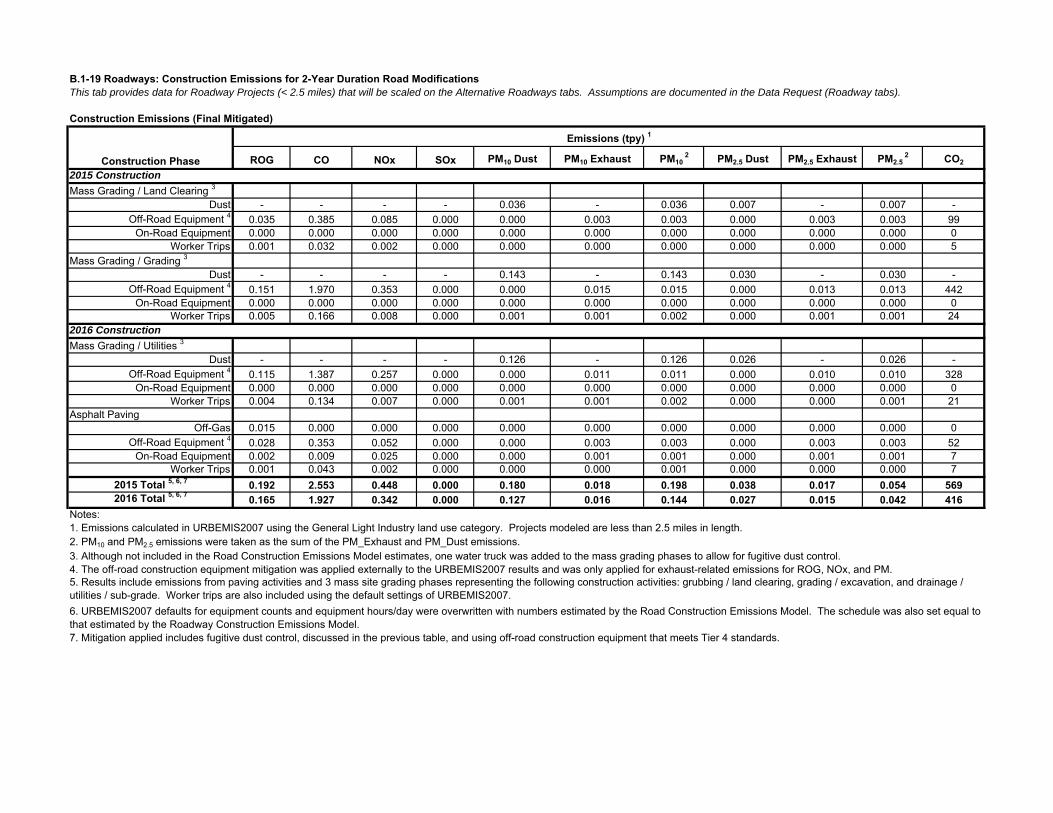
B.1-19 Roadways: Construction Emissions for 2-Year Duration Road ModificationsThis tab provides data for Roadway Projects (< 2.5 miles) that will be scaled on the Alternative Roadways tabs. Assumptions are documented in the Data Request (Roadway tabs).
Construction Emissions (Final Mitigated)
ROG CO NOx SOx PM10 Dust PM10 Exhaust PM10 2 PM2.5 Dust PM2.5 Exhaust PM2.5
2 CO2
2015 Construction
Mass Grading / Land Clearing 3
Dust - - - - 0.036 - 0.036 0.007 - 0.007 -Off-Road Equipment 4 0.035 0.385 0.085 0.000 0.000 0.003 0.003 0.000 0.003 0.003 99
On-Road Equipment 0.000 0.000 0.000 0.000 0.000 0.000 0.000 0.000 0.000 0.000 0Worker Trips 0.001 0.032 0.002 0.000 0.000 0.000 0.000 0.000 0.000 0.000 5
Mass Grading / Grading 3
Dust - - - - 0.143 - 0.143 0.030 - 0.030 -Off-Road Equipment 4 0.151 1.970 0.353 0.000 0.000 0.015 0.015 0.000 0.013 0.013 442
On-Road Equipment 0.000 0.000 0.000 0.000 0.000 0.000 0.000 0.000 0.000 0.000 0Worker Trips 0.005 0.166 0.008 0.000 0.001 0.001 0.002 0.000 0.001 0.001 24
2016 Construction
Mass Grading / Utilities 3
Dust - - - - 0.126 - 0.126 0.026 - 0.026 -Off-Road Equipment 4 0.115 1.387 0.257 0.000 0.000 0.011 0.011 0.000 0.010 0.010 328
On-Road Equipment 0.000 0.000 0.000 0.000 0.000 0.000 0.000 0.000 0.000 0.000 0Worker Trips 0.004 0.134 0.007 0.000 0.001 0.001 0.002 0.000 0.000 0.001 21
Asphalt PavingOff-Gas 0.015 0.000 0.000 0.000 0.000 0.000 0.000 0.000 0.000 0.000 0
Off-Road Equipment 4 0.028 0.353 0.052 0.000 0.000 0.003 0.003 0.000 0.003 0.003 52On-Road Equipment 0.002 0.009 0.025 0.000 0.000 0.001 0.001 0.000 0.001 0.001 7
Worker Trips 0.001 0.043 0.002 0.000 0.000 0.000 0.001 0.000 0.000 0.000 72015 Total 5, 6, 7 0.192 2.553 0.448 0.000 0.180 0.018 0.198 0.038 0.017 0.054 5692016 Total 5, 6, 7 0.165 1.927 0.342 0.000 0.127 0.016 0.144 0.027 0.015 0.042 416
Notes:1. Emissions calculated in URBEMIS2007 using the General Light Industry land use category. Projects modeled are less than 2.5 miles in length.2. PM10 and PM2.5 emissions were taken as the sum of the PM_Exhaust and PM_Dust emissions.3. Although not included in the Road Construction Emissions Model estimates, one water truck was added to the mass grading phases to allow for fugitive dust control.4. The off-road construction equipment mitigation was applied externally to the URBEMIS2007 results and was only applied for exhaust-related emissions for ROG, NOx, and PM.
7. Mitigation applied includes fugitive dust control, discussed in the previous table, and using off-road construction equipment that meets Tier 4 standards.
5. Results include emissions from paving activities and 3 mass site grading phases representing the following construction activities: grubbing / land clearing, grading / excavation, and drainage / utilities / sub-grade. Worker trips are also included using the default settings of URBEMIS2007.6. URBEMIS2007 defaults for equipment counts and equipment hours/day were overwritten with numbers estimated by the Road Construction Emissions Model. The schedule was also set equal to that estimated by the Roadway Construction Emissions Model.
Construction Phase
Emissions (tpy) 1
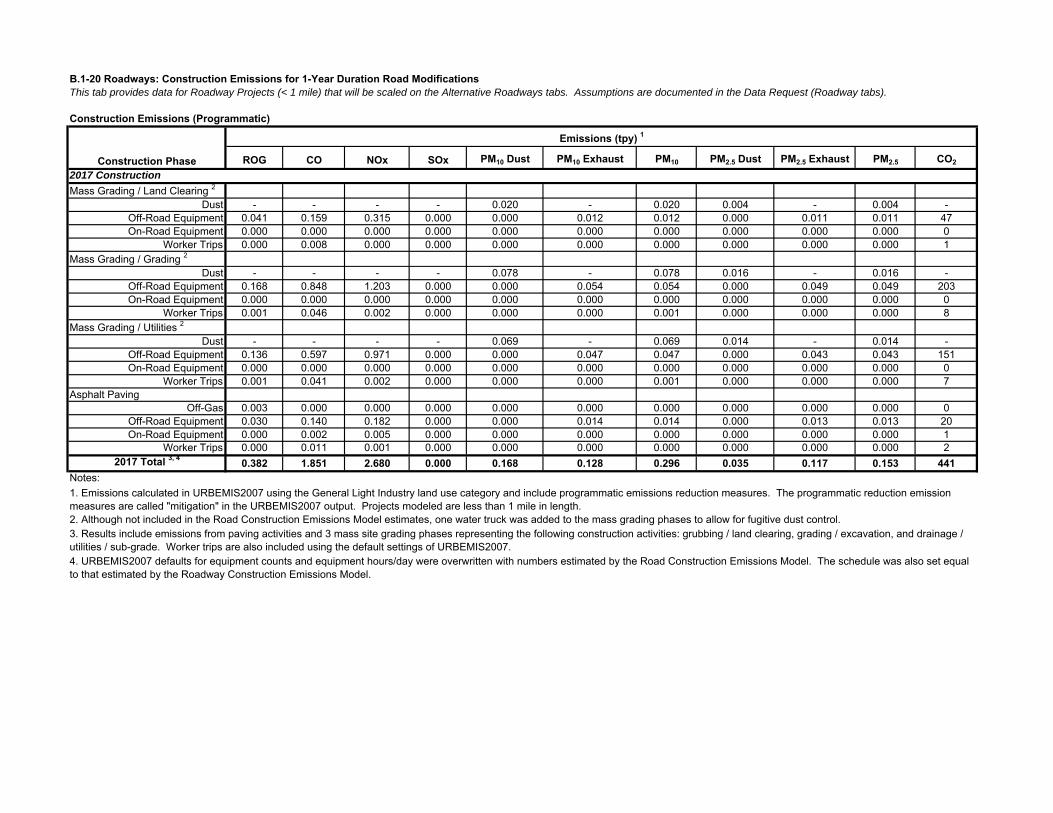
B.1-20 Roadways: Construction Emissions for 1-Year Duration Road ModificationsThis tab provides data for Roadway Projects (< 1 mile) that will be scaled on the Alternative Roadways tabs. Assumptions are documented in the Data Request (Roadway tabs).
Construction Emissions (Programmatic)
ROG CO NOx SOx PM10 Dust PM10 Exhaust PM10 PM2.5 Dust PM2.5 Exhaust PM2.5 CO2
2017 Construction
Mass Grading / Land Clearing 2
Dust - - - - 0.020 - 0.020 0.004 - 0.004 -Off-Road Equipment 0.041 0.159 0.315 0.000 0.000 0.012 0.012 0.000 0.011 0.011 47On-Road Equipment 0.000 0.000 0.000 0.000 0.000 0.000 0.000 0.000 0.000 0.000 0
Worker Trips 0.000 0.008 0.000 0.000 0.000 0.000 0.000 0.000 0.000 0.000 1Mass Grading / Grading 2
Dust - - - - 0.078 - 0.078 0.016 - 0.016 -Off-Road Equipment 0.168 0.848 1.203 0.000 0.000 0.054 0.054 0.000 0.049 0.049 203On-Road Equipment 0.000 0.000 0.000 0.000 0.000 0.000 0.000 0.000 0.000 0.000 0
Worker Trips 0.001 0.046 0.002 0.000 0.000 0.000 0.001 0.000 0.000 0.000 8Mass Grading / Utilities 2
Dust - - - - 0.069 - 0.069 0.014 - 0.014 -Off-Road Equipment 0.136 0.597 0.971 0.000 0.000 0.047 0.047 0.000 0.043 0.043 151On-Road Equipment 0.000 0.000 0.000 0.000 0.000 0.000 0.000 0.000 0.000 0.000 0
Worker Trips 0.001 0.041 0.002 0.000 0.000 0.000 0.001 0.000 0.000 0.000 7Asphalt Paving
Off-Gas 0.003 0.000 0.000 0.000 0.000 0.000 0.000 0.000 0.000 0.000 0Off-Road Equipment 0.030 0.140 0.182 0.000 0.000 0.014 0.014 0.000 0.013 0.013 20On-Road Equipment 0.000 0.002 0.005 0.000 0.000 0.000 0.000 0.000 0.000 0.000 1
Worker Trips 0.000 0.011 0.001 0.000 0.000 0.000 0.000 0.000 0.000 0.000 22017 Total 3, 4 0.382 1.851 2.680 0.000 0.168 0.128 0.296 0.035 0.117 0.153 441
Notes:
2. Although not included in the Road Construction Emissions Model estimates, one water truck was added to the mass grading phases to allow for fugitive dust control.
Construction Phase
Emissions (tpy) 1
1. Emissions calculated in URBEMIS2007 using the General Light Industry land use category and include programmatic emissions reduction measures. The programmatic reduction emission measures are called "mitigation" in the URBEMIS2007 output. Projects modeled are less than 1 mile in length.
3. Results include emissions from paving activities and 3 mass site grading phases representing the following construction activities: grubbing / land clearing, grading / excavation, and drainage / utilities / sub-grade. Worker trips are also included using the default settings of URBEMIS2007.4. URBEMIS2007 defaults for equipment counts and equipment hours/day were overwritten with numbers estimated by the Road Construction Emissions Model. The schedule was also set equal to that estimated by the Roadway Construction Emissions Model.
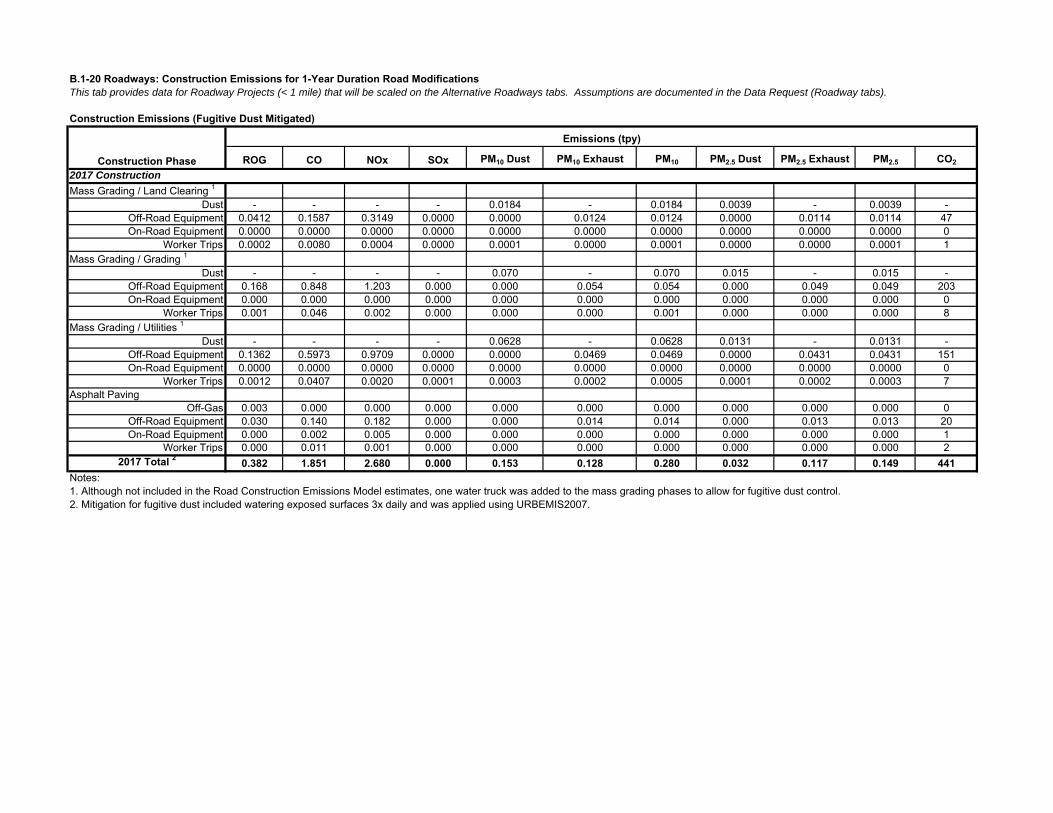
B.1-20 Roadways: Construction Emissions for 1-Year Duration Road ModificationsThis tab provides data for Roadway Projects (< 1 mile) that will be scaled on the Alternative Roadways tabs. Assumptions are documented in the Data Request (Roadway tabs).
Construction Emissions (Fugitive Dust Mitigated)
ROG CO NOx SOx PM10 Dust PM10 Exhaust PM10 PM2.5 Dust PM2.5 Exhaust PM2.5 CO2
2017 Construction
Mass Grading / Land Clearing 1
Dust - - - - 0.0184 - 0.0184 0.0039 - 0.0039 -Off-Road Equipment 0.0412 0.1587 0.3149 0.0000 0.0000 0.0124 0.0124 0.0000 0.0114 0.0114 47On-Road Equipment 0.0000 0.0000 0.0000 0.0000 0.0000 0.0000 0.0000 0.0000 0.0000 0.0000 0
Worker Trips 0.0002 0.0080 0.0004 0.0000 0.0001 0.0000 0.0001 0.0000 0.0000 0.0001 1Mass Grading / Grading 1
Dust - - - - 0.070 - 0.070 0.015 - 0.015 -Off-Road Equipment 0.168 0.848 1.203 0.000 0.000 0.054 0.054 0.000 0.049 0.049 203On-Road Equipment 0.000 0.000 0.000 0.000 0.000 0.000 0.000 0.000 0.000 0.000 0
Worker Trips 0.001 0.046 0.002 0.000 0.000 0.000 0.001 0.000 0.000 0.000 8Mass Grading / Utilities 1
Dust - - - - 0.0628 - 0.0628 0.0131 - 0.0131 -Off-Road Equipment 0.1362 0.5973 0.9709 0.0000 0.0000 0.0469 0.0469 0.0000 0.0431 0.0431 151On-Road Equipment 0.0000 0.0000 0.0000 0.0000 0.0000 0.0000 0.0000 0.0000 0.0000 0.0000 0
Worker Trips 0.0012 0.0407 0.0020 0.0001 0.0003 0.0002 0.0005 0.0001 0.0002 0.0003 7Asphalt Paving
Off-Gas 0.003 0.000 0.000 0.000 0.000 0.000 0.000 0.000 0.000 0.000 0Off-Road Equipment 0.030 0.140 0.182 0.000 0.000 0.014 0.014 0.000 0.013 0.013 20On-Road Equipment 0.000 0.002 0.005 0.000 0.000 0.000 0.000 0.000 0.000 0.000 1
Worker Trips 0.000 0.011 0.001 0.000 0.000 0.000 0.000 0.000 0.000 0.000 22017 Total 2 0.382 1.851 2.680 0.000 0.153 0.128 0.280 0.032 0.117 0.149 441
Notes:1. Although not included in the Road Construction Emissions Model estimates, one water truck was added to the mass grading phases to allow for fugitive dust control.2. Mitigation for fugitive dust included watering exposed surfaces 3x daily and was applied using URBEMIS2007.
Construction Phase
Emissions (tpy)
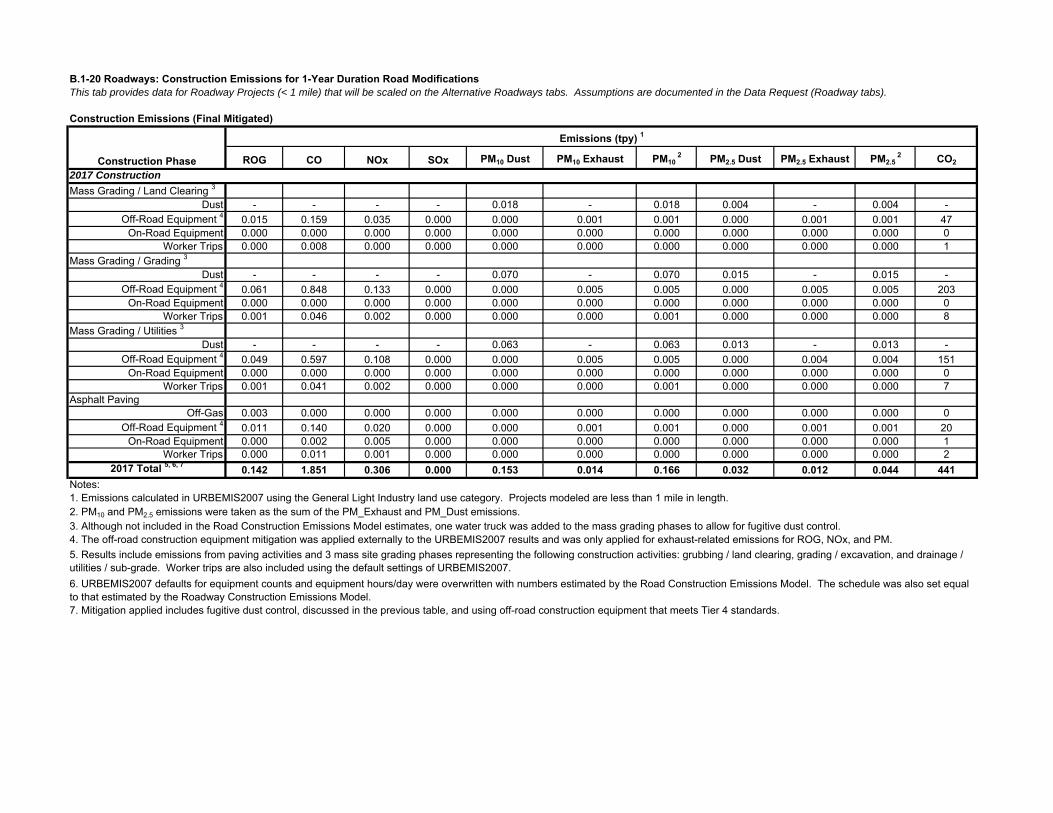
B.1-20 Roadways: Construction Emissions for 1-Year Duration Road ModificationsThis tab provides data for Roadway Projects (< 1 mile) that will be scaled on the Alternative Roadways tabs. Assumptions are documented in the Data Request (Roadway tabs).
Construction Emissions (Final Mitigated)
ROG CO NOx SOx PM10 Dust PM10 Exhaust PM10 2 PM2.5 Dust PM2.5 Exhaust PM2.5
2 CO2
2017 Construction
Mass Grading / Land Clearing 3
Dust - - - - 0.018 - 0.018 0.004 - 0.004 -Off-Road Equipment 4 0.015 0.159 0.035 0.000 0.000 0.001 0.001 0.000 0.001 0.001 47
On-Road Equipment 0.000 0.000 0.000 0.000 0.000 0.000 0.000 0.000 0.000 0.000 0Worker Trips 0.000 0.008 0.000 0.000 0.000 0.000 0.000 0.000 0.000 0.000 1
Mass Grading / Grading 3
Dust - - - - 0.070 - 0.070 0.015 - 0.015 -Off-Road Equipment 4 0.061 0.848 0.133 0.000 0.000 0.005 0.005 0.000 0.005 0.005 203
On-Road Equipment 0.000 0.000 0.000 0.000 0.000 0.000 0.000 0.000 0.000 0.000 0Worker Trips 0.001 0.046 0.002 0.000 0.000 0.000 0.001 0.000 0.000 0.000 8
Mass Grading / Utilities 3
Dust - - - - 0.063 - 0.063 0.013 - 0.013 -Off-Road Equipment 4 0.049 0.597 0.108 0.000 0.000 0.005 0.005 0.000 0.004 0.004 151
On-Road Equipment 0.000 0.000 0.000 0.000 0.000 0.000 0.000 0.000 0.000 0.000 0Worker Trips 0.001 0.041 0.002 0.000 0.000 0.000 0.001 0.000 0.000 0.000 7
Asphalt PavingOff-Gas 0.003 0.000 0.000 0.000 0.000 0.000 0.000 0.000 0.000 0.000 0
Off-Road Equipment 4 0.011 0.140 0.020 0.000 0.000 0.001 0.001 0.000 0.001 0.001 20On-Road Equipment 0.000 0.002 0.005 0.000 0.000 0.000 0.000 0.000 0.000 0.000 1
Worker Trips 0.000 0.011 0.001 0.000 0.000 0.000 0.000 0.000 0.000 0.000 22017 Total 5, 6, 7 0.142 1.851 0.306 0.000 0.153 0.014 0.166 0.032 0.012 0.044 441
Notes:1. Emissions calculated in URBEMIS2007 using the General Light Industry land use category. Projects modeled are less than 1 mile in length.2. PM10 and PM2.5 emissions were taken as the sum of the PM_Exhaust and PM_Dust emissions.3. Although not included in the Road Construction Emissions Model estimates, one water truck was added to the mass grading phases to allow for fugitive dust control.4. The off-road construction equipment mitigation was applied externally to the URBEMIS2007 results and was only applied for exhaust-related emissions for ROG, NOx, and PM.
7. Mitigation applied includes fugitive dust control, discussed in the previous table, and using off-road construction equipment that meets Tier 4 standards.
5. Results include emissions from paving activities and 3 mass site grading phases representing the following construction activities: grubbing / land clearing, grading / excavation, and drainage / utilities / sub-grade. Worker trips are also included using the default settings of URBEMIS2007.6. URBEMIS2007 defaults for equipment counts and equipment hours/day were overwritten with numbers estimated by the Road Construction Emissions Model. The schedule was also set equal to that estimated by the Roadway Construction Emissions Model.
Construction Phase
Emissions (tpy) 1


B.1-21 BNSF Ave 21: Construction Emissions from Roadway ProjectsThis tab provides data for Roadway Projects occuring as a result of the BNSF Ave 21 Alternative. Assumptions are documented in the Data Request (Roadway tabs).
Construction Emissions (Programmatic)
ROG CO NOx SOx PM10 Dust PM10 Exhaust PM10 PM2.5 Dust PM2.5 Exhaust PM2.5 CO2 ROG CO NOx SOx PM10 Dust PM10 Exhaust PM10 PM2.5 Dust PM2.5 Exhaust PM2.5 CO2
Fresno CountyStructures
2013 Total 0.659 2.869 5.466 0.000 0.230 0.242 0.472 0.048 0.223 0.271 656 3.625 15.779 30.066 0.001 1.264 1.332 2.596 0.265 1.225 1.490 3,6082014 Total 0.309 1.295 2.273 0.000 0.106 0.125 0.231 0.022 0.115 0.137 273 1.698 7.125 12.499 0.001 0.583 0.688 1.271 0.122 0.633 0.755 1,500
Projects > 2.5 miles
2014 Total 0.000 0.000 0.000 0.000 0.000 0.000 0.000 0.000 0.000 0.000 0 0.388 1.952 2.929 0.000 0.117 0.122 0.239 0.025 0.112 0.137 4002015 Total 0.000 0.000 0.000 0.000 0.000 0.000 0.000 0.000 0.000 0.000 0 0.633 3.313 4.577 0.001 0.199 0.205 0.404 0.042 0.188 0.230 6802016 Total 0.000 0.000 0.000 0.000 0.000 0.000 0.000 0.000 0.000 0.000 0 0.509 2.415 3.134 0.001 0.109 0.158 0.267 0.023 0.145 0.168 481
Projects < 2.5 miles
2015 Total 0.519 2.553 3.954 0.000 0.198 0.173 0.371 0.042 0.159 0.201 569 0.000 0.000 0.000 0.000 0.000 0.000 0.000 0.000 0.000 0.000 02016 Total 0.417 1.927 2.817 0.000 0.140 0.146 0.286 0.029 0.134 0.163 416 0.000 0.000 0.000 0.000 0.000 0.000 0.000 0.000 0.000 0.000 0
Projects < 1 mile
2017 Total 1.526 7.404 10.720 0.001 0.672 0.511 1.183 0.141 0.470 0.611 1,765 8.393 40.721 58.959 0.004 3.697 2.810 6.508 0.775 2.584 3.359 9,707
Madera CountyStructures
2013 Total 0.000 0.000 0.000 0.000 0.000 0.000 0.000 0.000 0.000 0.000 0 5.602 24.385 46.465 0.002 1.954 2.058 4.012 0.409 1.893 2.302 5,5762014 Total 0.000 0.000 0.000 0.000 0.000 0.000 0.000 0.000 0.000 0.000 0 2.625 11.012 19.317 0.001 0.901 1.063 1.964 0.189 0.978 1.167 2,318
Projects > 2.5 miles
2014 Total 0.000 0.000 0.000 0.000 0.000 0.000 0.000 0.000 0.000 0.000 0 0.000 0.000 0.000 0.000 0.000 0.000 0.000 0.000 0.000 0.000 02015 Total 0.000 0.000 0.000 0.000 0.000 0.000 0.000 0.000 0.000 0.000 0 0.000 0.000 0.000 0.000 0.000 0.000 0.000 0.000 0.000 0.000 02016 Total 0.000 0.000 0.000 0.000 0.000 0.000 0.000 0.000 0.000 0.000 0 0.000 0.000 0.000 0.000 0.000 0.000 0.000 0.000 0.000 0.000 0
Projects < 2.5 miles
2015 Total 0.000 0.000 0.000 0.000 0.000 0.000 0.000 0.000 0.000 0.000 0 1.557 7.659 11.861 0.001 0.594 0.520 1.113 0.125 0.478 0.603 1,7072016 Total 0.000 0.000 0.000 0.000 0.000 0.000 0.000 0.000 0.000 0.000 0 1.250 5.780 8.452 0.001 0.420 0.437 0.857 0.088 0.402 0.490 1,247
Projects < 1 mile
2017 Total 0.000 0.000 0.000 0.000 0.000 0.000 0.000 0.000 0.000 0.000 0 3.052 14.807 21.440 0.002 1.345 1.022 2.366 0.282 0.940 1.222 3,530
Merced CountyStructures
2013 Total 0.000 0.000 0.000 0.000 0.000 0.000 0.000 0.000 0.000 0.000 0 1.977 8.607 16.399 0.001 0.690 0.726 1.416 0.144 0.668 0.812 1,9682014 Total 0.000 0.000 0.000 0.000 0.000 0.000 0.000 0.000 0.000 0.000 0 0.926 3.886 6.818 0.000 0.318 0.375 0.693 0.067 0.345 0.412 818
Projects > 2.5 miles
2014 Total 0.000 0.000 0.000 0.000 0.000 0.000 0.000 0.000 0.000 0.000 0 0.388 1.952 2.929 0.000 0.117 0.122 0.239 0.025 0.112 0.137 4002015 Total 0.000 0.000 0.000 0.000 0.000 0.000 0.000 0.000 0.000 0.000 0 0.633 3.313 4.577 0.001 0.199 0.205 0.404 0.042 0.188 0.230 6802016 Total 0.000 0.000 0.000 0.000 0.000 0.000 0.000 0.000 0.000 0.000 0 0.509 2.415 3.134 0.001 0.109 0.158 0.267 0.023 0.145 0.168 481
Projects < 2.5 miles
2015 Total 0.000 0.000 0.000 0.000 0.000 0.000 0.000 0.000 0.000 0.000 0 0.000 0.000 0.000 0.000 0.000 0.000 0.000 0.000 0.000 0.000 02016 Total 0.000 0.000 0.000 0.000 0.000 0.000 0.000 0.000 0.000 0.000 0 0.000 0.000 0.000 0.000 0.000 0.000 0.000 0.000 0.000 0.000 0
Projects < 1 mile
2017 Total 0.000 0.000 0.000 0.000 0.000 0.000 0.000 0.000 0.000 0.000 0 1.145 5.553 8.040 0.001 0.504 0.383 0.887 0.106 0.352 0.458 1,324
Sum of All Projects2013 Total 0.659 2.869 5.466 0.000 0.230 0.242 0.472 0.048 0.223 0.271 656 11.203 48.771 92.930 0.003 3.908 4.116 8.023 0.819 3.785 4.604 11,1522014 Total 0.309 1.295 2.273 0.000 0.106 0.125 0.231 0.022 0.115 0.137 273 6.026 25.927 44.493 0.003 2.035 2.371 4.406 0.427 2.180 2.608 5,4352015 Total 0.519 2.553 3.954 0.000 0.198 0.173 0.371 0.042 0.159 0.201 569 2.823 14.285 21.015 0.002 0.992 0.930 1.922 0.209 0.855 1.063 3,0672016 Total 0.417 1.927 2.817 0.000 0.140 0.146 0.286 0.029 0.134 0.163 416 2.267 10.609 14.721 0.002 0.639 0.752 1.391 0.135 0.691 0.826 2,2092017 Total 1.526 7.404 10.720 0.001 0.672 0.511 1.183 0.141 0.470 0.611 1,765 12.590 61.081 88.439 0.006 5.546 4.215 9.761 1.163 3.876 5.039 14,561
Notes:1. Roadway projects included in the RTP will not be summed into the project's total emissions as they would happen with or without construction of the HST.2. Roadway projects not included in the RTP will be summed into the project's total emissions as they are only occurring due to HST construction.3. URBEMIS2007 results were multiplied by the number of roadway projects, meeting the length designation, within each county. The number of roadway projects are tabulated on the Roadway tabs in the Data Request.
Project TypeCounty Structures > 2.5 miles < 2.5 miles < 1 mile Structures > 2.5 miles < 2.5 miles < 1 mileFresno 2 0 1 4 11 1 0 22Madera 0 0 0 0 17 0 3 8Merced 0 0 0 0 6 1 0 3
Construction Phase 3
RTP Included Emissions (tpy) 1
Included in the RTP Not Included in the RTP
Non-RTP Included Emissions (tpy) 2

B.1-21 BNSF Ave 21: Construction Emissions from Roadway ProjectsThis tab provides data for Roadway Projects occuring as a result of the BNSF Ave 21 Alternative. Assumptions are documented in the Data Request (Roadway tabs).
Construction Emissions (Mitigated)
ROG CO NOx SOx PM10 Dust PM10 Exhaust PM10 PM2.5 Dust PM2.5 Exhaust PM2.5 CO2 ROG CO NOx SOx PM10 Dust PM10 Exhaust PM10 PM2.5 Dust PM2.5 Exhaust PM2.5 CO2
Fresno CountyStructures
2013 Total 0.242 2.869 0.615 0.000 0.209 0.025 0.234 0.044 0.023 0.067 656 1.333 15.779 3.381 0.001 1.148 0.138 1.285 0.241 0.126 0.367 3,6082014 Total 0.115 1.295 0.259 0.000 0.096 0.013 0.109 0.020 0.012 0.032 273 0.632 7.125 1.426 0.001 0.529 0.072 0.601 0.111 0.066 0.177 1,500
Projects > 2.5 miles
2014 Total 0.000 0.000 0.000 0.000 0.000 0.000 0.000 0.000 0.000 0.000 0 0.145 1.952 0.336 0.000 0.106 0.013 0.119 0.022 0.012 0.034 4002015 Total 0.000 0.000 0.000 0.000 0.000 0.000 0.000 0.000 0.000 0.000 0 0.237 3.313 0.526 0.001 0.181 0.022 0.203 0.038 0.020 0.058 6802016 Total 0.000 0.000 0.000 0.000 0.000 0.000 0.000 0.000 0.000 0.000 0 0.223 2.415 0.429 0.001 0.099 0.020 0.119 0.021 0.018 0.039 481
Projects < 2.5 miles
2015 Total 0.192 2.553 0.448 0.000 0.180 0.018 0.198 0.038 0.017 0.054 569 0.000 0.000 0.000 0.000 0.000 0.000 0.000 0.000 0.000 0.000 02016 Total 0.165 1.927 0.342 0.000 0.127 0.016 0.144 0.027 0.015 0.042 416 0.000 0.000 0.000 0.000 0.000 0.000 0.000 0.000 0.000 0.000 0
Projects < 1 mile
2017 Total 0.570 7.404 1.225 0.001 0.610 0.054 0.664 0.128 0.050 0.178 1,765 3.134 40.721 6.735 0.004 3.357 0.298 3.654 0.704 0.273 0.977 9,707
Madera CountyStructures
2013 Total 0.000 0.000 0.000 0.000 0.000 0.000 0.000 0.000 0.000 0.000 0 2.059 24.385 5.225 0.002 1.773 0.213 1.987 0.372 0.195 0.567 5,5762014 Total 0.000 0.000 0.000 0.000 0.000 0.000 0.000 0.000 0.000 0.000 0 0.976 11.012 2.204 0.001 0.818 0.111 0.929 0.172 0.102 0.274 2,318
Projects > 2.5 miles
2014 Total 0.000 0.000 0.000 0.000 0.000 0.000 0.000 0.000 0.000 0.000 0 0.000 0.000 0.000 0.000 0.000 0.000 0.000 0.000 0.000 0.000 02015 Total 0.000 0.000 0.000 0.000 0.000 0.000 0.000 0.000 0.000 0.000 0 0.000 0.000 0.000 0.000 0.000 0.000 0.000 0.000 0.000 0.000 02016 Total 0.000 0.000 0.000 0.000 0.000 0.000 0.000 0.000 0.000 0.000 0 0.000 0.000 0.000 0.000 0.000 0.000 0.000 0.000 0.000 0.000 0
Projects < 2.5 miles
2015 Total 0.000 0.000 0.000 0.000 0.000 0.000 0.000 0.000 0.000 0.000 0 0.576 7.659 1.343 0.001 0.539 0.055 0.594 0.113 0.050 0.163 1,7072016 Total 0.000 0.000 0.000 0.000 0.000 0.000 0.000 0.000 0.000 0.000 0 0.495 5.780 1.027 0.001 0.382 0.049 0.431 0.080 0.045 0.125 1,247
Projects < 1 mile
2017 Total 0.000 0.000 0.000 0.000 0.000 0.000 0.000 0.000 0.000 0.000 0 1.140 14.807 2.449 0.002 1.221 0.108 1.329 0.256 0.099 0.355 3,530
Merced CountyStructures
2013 Total 0.000 0.000 0.000 0.000 0.000 0.000 0.000 0.000 0.000 0.000 0 0.727 8.607 1.844 0.001 0.626 0.075 0.701 0.131 0.069 0.200 1,9682014 Total 0.000 0.000 0.000 0.000 0.000 0.000 0.000 0.000 0.000 0.000 0 0.345 3.886 0.778 0.000 0.289 0.039 0.328 0.061 0.036 0.097 818
Projects > 2.5 miles
2014 Total 0.000 0.000 0.000 0.000 0.000 0.000 0.000 0.000 0.000 0.000 0 0.145 1.952 0.336 0.000 0.106 0.013 0.119 0.022 0.012 0.034 4002015 Total 0.000 0.000 0.000 0.000 0.000 0.000 0.000 0.000 0.000 0.000 0 0.237 3.313 0.526 0.001 0.181 0.022 0.203 0.038 0.020 0.058 6802016 Total 0.000 0.000 0.000 0.000 0.000 0.000 0.000 0.000 0.000 0.000 0 0.223 2.415 0.429 0.001 0.099 0.020 0.119 0.021 0.018 0.039 481
Projects < 2.5 miles
2015 Total 0.000 0.000 0.000 0.000 0.000 0.000 0.000 0.000 0.000 0.000 0 0.000 0.000 0.000 0.000 0.000 0.000 0.000 0.000 0.000 0.000 02016 Total 0.000 0.000 0.000 0.000 0.000 0.000 0.000 0.000 0.000 0.000 0 0.000 0.000 0.000 0.000 0.000 0.000 0.000 0.000 0.000 0.000 0
Projects < 1 mile
2017 Total 0.000 0.000 0.000 0.000 0.000 0.000 0.000 0.000 0.000 0.000 0 0.427 5.553 0.918 0.001 0.458 0.041 0.498 0.096 0.037 0.133 1,324
Sum of All Projects2013 Total 0.242 2.869 0.615 0.000 0.209 0.025 0.234 0.044 0.023 0.067 656 4.119 48.771 10.450 0.003 3.547 0.426 3.973 0.743 0.391 1.134 11,1522014 Total 0.115 1.295 0.259 0.000 0.096 0.013 0.109 0.020 0.012 0.032 273 2.243 25.927 5.081 0.003 1.848 0.249 2.097 0.388 0.228 0.616 5,4352015 Total 0.192 2.553 0.448 0.000 0.180 0.018 0.198 0.038 0.017 0.054 569 1.049 14.285 2.395 0.002 0.901 0.099 1.000 0.190 0.091 0.280 3,0672016 Total 0.165 1.927 0.342 0.000 0.127 0.016 0.144 0.027 0.015 0.042 416 0.942 10.609 1.885 0.002 0.581 0.088 0.669 0.123 0.081 0.204 2,2092017 Total 0.570 7.404 1.225 0.001 0.610 0.054 0.664 0.128 0.050 0.178 1,765 4.701 61.081 10.103 0.006 5.035 0.447 5.482 1.056 0.409 1.465 14,561
Notes:1. Roadway projects included in the RTP will not be summed into the project's total emissions as they would happen with or without construction of the HST.2. Roadway projects not included in the RTP will be summed into the project's total emissions as they are only occurring due to HST construction.3. URBEMIS2007 results were multiplied by the number of roadway projects, meeting the length designation, within each county. The number of roadway projects are tabulated on the Roadway tabs in the Data Request.
Project TypeCounty Structures > 2.5 miles < 2.5 miles < 1 mile Structures > 2.5 miles < 2.5 miles < 1 mileFresno 2 0 1 4 11 1 0 22Madera 0 0 0 0 17 0 3 8Merced 0 0 0 0 6 1 0 3
Construction Phase 3
RTP Included Emissions (tpy) 1 Non-RTP Included Emissions (tpy) 2
Included in the RTP Not Included in the RTP

B.1-22 BNSF Ave 24: Construction Emissions from Roadway ProjectsThis tab provides data for Roadway Projects occuring as a result of the BNSF Ave 24 Alternative. Assumptions are documented in the Data Request (Roadway tabs).
Construction Emissions (Programmatic)
ROG CO NOx SOx PM10 Dust PM10 Exhaust PM10 PM2.5 Dust PM2.5 Exhaust PM2.5 CO2 ROG CO NOx SOx PM10 Dust PM10 Exhaust PM10 PM2.5 Dust PM2.5 Exhaust PM2.5 CO2
Fresno CountyStructures
2013 Total 0.659 2.869 5.466 0.000 0.230 0.242 0.472 0.048 0.223 0.271 656 3.625 15.779 30.066 0.001 1.264 1.332 2.596 0.265 1.225 1.490 3,6082014 Total 0.309 1.295 2.273 0.000 0.106 0.125 0.231 0.022 0.115 0.137 273 1.698 7.125 12.499 0.001 0.583 0.688 1.271 0.122 0.633 0.755 1,500
Projects > 2.5 miles
2014 Total 0.000 0.000 0.000 0.000 0.000 0.000 0.000 0.000 0.000 0.000 0 0.388 1.952 2.929 0.000 0.117 0.122 0.239 0.025 0.112 0.137 4002015 Total 0.000 0.000 0.000 0.000 0.000 0.000 0.000 0.000 0.000 0.000 0 0.633 3.313 4.577 0.001 0.199 0.205 0.404 0.042 0.188 0.230 6802016 Total 0.000 0.000 0.000 0.000 0.000 0.000 0.000 0.000 0.000 0.000 0 0.509 2.415 3.134 0.001 0.109 0.158 0.267 0.023 0.145 0.168 481
Projects < 2.5 miles
2015 Total 0.519 2.553 3.954 0.000 0.198 0.173 0.371 0.042 0.159 0.201 569 0.000 0.000 0.000 0.000 0.000 0.000 0.000 0.000 0.000 0.000 02016 Total 0.417 1.927 2.817 0.000 0.140 0.146 0.286 0.029 0.134 0.163 416 0.000 0.000 0.000 0.000 0.000 0.000 0.000 0.000 0.000 0.000 0
Projects < 1 mile
2017 Total 1.526 7.404 10.720 0.001 0.672 0.511 1.183 0.141 0.470 0.611 1,765 8.393 40.721 58.959 0.004 3.697 2.810 6.508 0.775 2.584 3.359 9,707
Madera CountyStructures
2013 Total 0.000 0.000 0.000 0.000 0.000 0.000 0.000 0.000 0.000 0.000 0 8.567 37.295 71.064 0.003 2.988 3.147 6.135 0.626 2.895 3.521 8,5282014 Total 0.000 0.000 0.000 0.000 0.000 0.000 0.000 0.000 0.000 0.000 0 4.015 16.841 29.544 0.002 1.378 1.627 3.004 0.289 1.496 1.785 3,545
Projects > 2.5 miles
2014 Total 0.000 0.000 0.000 0.000 0.000 0.000 0.000 0.000 0.000 0.000 0 0.000 0.000 0.000 0.000 0.000 0.000 0.000 0.000 0.000 0.000 02015 Total 0.000 0.000 0.000 0.000 0.000 0.000 0.000 0.000 0.000 0.000 0 0.000 0.000 0.000 0.000 0.000 0.000 0.000 0.000 0.000 0.000 02016 Total 0.000 0.000 0.000 0.000 0.000 0.000 0.000 0.000 0.000 0.000 0 0.000 0.000 0.000 0.000 0.000 0.000 0.000 0.000 0.000 0.000 0
Projects < 2.5 miles
2015 Total 0.000 0.000 0.000 0.000 0.000 0.000 0.000 0.000 0.000 0.000 0 1.557 7.659 11.861 0.001 0.594 0.520 1.113 0.125 0.478 0.603 1,7072016 Total 0.000 0.000 0.000 0.000 0.000 0.000 0.000 0.000 0.000 0.000 0 1.250 5.780 8.452 0.001 0.420 0.437 0.857 0.088 0.402 0.490 1,247
Projects < 1 mile
2017 Total 0.000 0.000 0.000 0.000 0.000 0.000 0.000 0.000 0.000 0.000 0 2.671 12.957 18.760 0.001 1.176 0.894 2.071 0.247 0.822 1.069 3,089
Merced CountyStructures
2013 Total 0.000 0.000 0.000 0.000 0.000 0.000 0.000 0.000 0.000 0.000 0 1.977 8.607 16.399 0.001 0.690 0.726 1.416 0.144 0.668 0.812 1,9682014 Total 0.000 0.000 0.000 0.000 0.000 0.000 0.000 0.000 0.000 0.000 0 0.926 3.886 6.818 0.000 0.318 0.375 0.693 0.067 0.345 0.412 818
Projects > 2.5 miles
2014 Total 0.000 0.000 0.000 0.000 0.000 0.000 0.000 0.000 0.000 0.000 0 0.388 1.952 2.929 0.000 0.117 0.122 0.239 0.025 0.112 0.137 4002015 Total 0.000 0.000 0.000 0.000 0.000 0.000 0.000 0.000 0.000 0.000 0 0.633 3.313 4.577 0.001 0.199 0.205 0.404 0.042 0.188 0.230 6802016 Total 0.000 0.000 0.000 0.000 0.000 0.000 0.000 0.000 0.000 0.000 0 0.509 2.415 3.134 0.001 0.109 0.158 0.267 0.023 0.145 0.168 481
Projects < 2.5 miles
2015 Total 0.000 0.000 0.000 0.000 0.000 0.000 0.000 0.000 0.000 0.000 0 0.000 0.000 0.000 0.000 0.000 0.000 0.000 0.000 0.000 0.000 02016 Total 0.000 0.000 0.000 0.000 0.000 0.000 0.000 0.000 0.000 0.000 0 0.000 0.000 0.000 0.000 0.000 0.000 0.000 0.000 0.000 0.000 0
Projects < 1 mile
2017 Total 0.000 0.000 0.000 0.000 0.000 0.000 0.000 0.000 0.000 0.000 0 1.145 5.553 8.040 0.001 0.504 0.383 0.887 0.106 0.352 0.458 1,324
Sum of All Projects2013 Total 0.659 2.869 5.466 0.000 0.230 0.242 0.472 0.048 0.223 0.271 656 14.169 61.681 117.529 0.004 4.942 5.205 10.147 1.035 4.787 5.823 14,1042014 Total 0.309 1.295 2.273 0.000 0.106 0.125 0.231 0.022 0.115 0.137 273 7.416 31.757 54.720 0.003 2.512 2.934 5.446 0.527 2.698 3.225 6,6622015 Total 0.519 2.553 3.954 0.000 0.198 0.173 0.371 0.042 0.159 0.201 569 2.823 14.285 21.015 0.002 0.992 0.930 1.922 0.209 0.855 1.063 3,0672016 Total 0.417 1.927 2.817 0.000 0.140 0.146 0.286 0.029 0.134 0.163 416 2.267 10.609 14.721 0.002 0.639 0.752 1.391 0.135 0.691 0.826 2,2092017 Total 1.526 7.404 10.720 0.001 0.672 0.511 1.183 0.141 0.470 0.611 1,765 12.208 59.230 85.759 0.006 5.378 4.087 9.466 1.128 3.759 4.886 14,120
Notes:1. Roadway projects included in the RTP will not be summed into the project's total emissions as they would happen with or without construction of the HST.2. Roadway projects not included in the RTP will be summed into the project's total emissions as they are only occurring due to HST construction.3. URBEMIS2007 results were multiplied by the number of roadway projects, meeting the length designation, within each county. The number of roadway projects are tabulated on the Roadway tabs in the Data Request.
Project TypeCounty Structures > 2.5 miles < 2.5 miles < 1 mile Structures > 2.5 miles < 2.5 miles < 1 mileFresno 2 0 1 4 11 1 0 22Madera 0 0 0 0 26 0 3 7Merced 0 0 0 0 6 1 0 3
Construction Phase 3
RTP Included Emissions (tpy) 1 Non-RTP Included Emissions (tpy) 2
Included in the RTP Not Included in the RTP

B.1-22 BNSF Ave 24: Construction Emissions from Roadway ProjectsThis tab provides data for Roadway Projects occuring as a result of the BNSF Ave 24 Alternative. Assumptions are documented in the Data Request (Roadway tabs).
Construction Emissions (Mitigated)
ROG CO NOx SOx PM10 Dust PM10 Exhaust PM10 PM2.5 Dust PM2.5 Exhaust PM2.5 CO2 ROG CO NOx SOx PM10 Dust PM10 Exhaust PM10 PM2.5 Dust PM2.5 Exhaust PM2.5 CO2
Fresno CountyStructures
2013 Total 0.242 2.869 0.615 0.000 0.209 0.025 0.234 0.044 0.023 0.067 656 1.333 15.779 3.381 0.001 1.148 0.138 1.285 0.241 0.126 0.367 3,6082014 Total 0.115 1.295 0.259 0.000 0.096 0.013 0.109 0.020 0.012 0.032 273 0.632 7.125 1.426 0.001 0.529 0.072 0.601 0.111 0.066 0.177 1,500
Projects > 2.5 miles
2014 Total 0.000 0.000 0.000 0.000 0.000 0.000 0.000 0.000 0.000 0.000 0 0.145 1.952 0.336 0.000 0.106 0.013 0.119 0.022 0.012 0.034 4002015 Total 0.000 0.000 0.000 0.000 0.000 0.000 0.000 0.000 0.000 0.000 0 0.237 3.313 0.526 0.001 0.181 0.022 0.203 0.038 0.020 0.058 6802016 Total 0.000 0.000 0.000 0.000 0.000 0.000 0.000 0.000 0.000 0.000 0 0.223 2.415 0.429 0.001 0.099 0.020 0.119 0.021 0.018 0.039 481
Projects < 2.5 miles
2015 Total 0.192 2.553 0.448 0.000 0.180 0.018 0.198 0.038 0.017 0.054 569 0.000 0.000 0.000 0.000 0.000 0.000 0.000 0.000 0.000 0.000 02016 Total 0.165 1.927 0.342 0.000 0.127 0.016 0.144 0.027 0.015 0.042 416 0.000 0.000 0.000 0.000 0.000 0.000 0.000 0.000 0.000 0.000 0
Projects < 1 mile
2017 Total 0.570 7.404 1.225 0.001 0.610 0.054 0.664 0.128 0.050 0.178 1,765 3.134 40.721 6.735 0.004 3.357 0.298 3.654 0.704 0.273 0.977 9,707
Madera CountyStructures
2013 Total 0.000 0.000 0.000 0.000 0.000 0.000 0.000 0.000 0.000 0.000 0 3.150 37.295 7.991 0.003 2.712 0.326 3.038 0.568 0.299 0.867 8,5282014 Total 0.000 0.000 0.000 0.000 0.000 0.000 0.000 0.000 0.000 0.000 0 1.493 16.841 3.371 0.002 1.251 0.170 1.421 0.262 0.156 0.419 3,545
Projects > 2.5 miles
2014 Total 0.000 0.000 0.000 0.000 0.000 0.000 0.000 0.000 0.000 0.000 0 0.000 0.000 0.000 0.000 0.000 0.000 0.000 0.000 0.000 0.000 02015 Total 0.000 0.000 0.000 0.000 0.000 0.000 0.000 0.000 0.000 0.000 0 0.000 0.000 0.000 0.000 0.000 0.000 0.000 0.000 0.000 0.000 02016 Total 0.000 0.000 0.000 0.000 0.000 0.000 0.000 0.000 0.000 0.000 0 0.000 0.000 0.000 0.000 0.000 0.000 0.000 0.000 0.000 0.000 0
Projects < 2.5 miles
2015 Total 0.000 0.000 0.000 0.000 0.000 0.000 0.000 0.000 0.000 0.000 0 0.576 7.659 1.343 0.001 0.539 0.055 0.594 0.113 0.050 0.163 1,7072016 Total 0.000 0.000 0.000 0.000 0.000 0.000 0.000 0.000 0.000 0.000 0 0.495 5.780 1.027 0.001 0.382 0.049 0.431 0.080 0.045 0.125 1,247
Projects < 1 mile
2017 Total 0.000 0.000 0.000 0.000 0.000 0.000 0.000 0.000 0.000 0.000 0 0.997 12.957 2.143 0.001 1.068 0.095 1.163 0.224 0.087 0.311 3,089
Merced CountyStructures
2013 Total 0.000 0.000 0.000 0.000 0.000 0.000 0.000 0.000 0.000 0.000 0 0.727 8.607 1.844 0.001 0.626 0.075 0.701 0.131 0.069 0.200 1,9682014 Total 0.000 0.000 0.000 0.000 0.000 0.000 0.000 0.000 0.000 0.000 0 0.345 3.886 0.778 0.000 0.289 0.039 0.328 0.061 0.036 0.097 818
Projects > 2.5 miles
2014 Total 0.000 0.000 0.000 0.000 0.000 0.000 0.000 0.000 0.000 0.000 0 0.145 1.952 0.336 0.000 0.106 0.013 0.119 0.022 0.012 0.034 4002015 Total 0.000 0.000 0.000 0.000 0.000 0.000 0.000 0.000 0.000 0.000 0 0.237 3.313 0.526 0.001 0.181 0.022 0.203 0.038 0.020 0.058 6802016 Total 0.000 0.000 0.000 0.000 0.000 0.000 0.000 0.000 0.000 0.000 0 0.223 2.415 0.429 0.001 0.099 0.020 0.119 0.021 0.018 0.039 481
Projects < 2.5 miles
2015 Total 0.000 0.000 0.000 0.000 0.000 0.000 0.000 0.000 0.000 0.000 0 0.000 0.000 0.000 0.000 0.000 0.000 0.000 0.000 0.000 0.000 02016 Total 0.000 0.000 0.000 0.000 0.000 0.000 0.000 0.000 0.000 0.000 0 0.000 0.000 0.000 0.000 0.000 0.000 0.000 0.000 0.000 0.000 0
Projects < 1 mile
2017 Total 0.000 0.000 0.000 0.000 0.000 0.000 0.000 0.000 0.000 0.000 0 0.427 5.553 0.918 0.001 0.458 0.041 0.498 0.096 0.037 0.133 1,324
Sum of All Projects2013 Total 0.242 2.869 0.615 0.000 0.209 0.025 0.234 0.044 0.023 0.067 656 5.209 61.681 13.216 0.004 4.486 0.539 5.025 0.940 0.494 1.435 14,1042014 Total 0.115 1.295 0.259 0.000 0.096 0.013 0.109 0.020 0.012 0.032 273 2.760 31.757 6.248 0.003 2.281 0.308 2.589 0.479 0.282 0.761 6,6622015 Total 0.192 2.553 0.448 0.000 0.180 0.018 0.198 0.038 0.017 0.054 569 1.049 14.285 2.395 0.002 0.901 0.099 1.000 0.190 0.091 0.280 3,0672016 Total 0.165 1.927 0.342 0.000 0.127 0.016 0.144 0.027 0.015 0.042 416 0.942 10.609 1.885 0.002 0.581 0.088 0.669 0.123 0.081 0.204 2,2092017 Total 0.570 7.404 1.225 0.001 0.610 0.054 0.664 0.128 0.050 0.178 1,765 4.559 59.230 9.797 0.006 4.882 0.433 5.315 1.024 0.397 1.421 14,120
Notes:1. Roadway projects included in the RTP will not be summed into the project's total emissions as they would happen with or without construction of the HST.2. Roadway projects not included in the RTP will be summed into the project's total emissions as they are only occurring due to HST construction.3. URBEMIS2007 results were multiplied by the number of roadway projects, meeting the length designation, within each county. The number of roadway projects are tabulated on the Roadway tabs in the Data Request.
Project TypeCounty Structures > 2.5 miles < 2.5 miles < 1 mile Structures > 2.5 miles < 2.5 miles < 1 mileFresno 2 0 1 4 11 1 0 22Madera 0 0 0 0 26 0 3 7Merced 0 0 0 0 6 1 0 3
Included in the RTP Not Included in the RTP
Construction Phase 3
RTP Included Emissions (tpy) 1 Non-RTP Included Emissions (tpy) 2

B.1-23 UPRR Ave 21: Construction Emissions from Roadway ProjectsThis tab provides data for Roadway Projects occuring as a result of the UPRR Ave 21 Alternative. Assumptions are documented in the Data Request (Roadway tabs).
Construction Emissions (Programmatic)
ROG CO NOx SOx PM10 Dust PM10 Exhaust PM10 PM2.5 Dust PM2.5 Exhaust PM2.5 CO2 ROG CO NOx SOx PM10 Dust PM10 Exhaust PM10 PM2.5 Dust PM2.5 Exhaust PM2.5 CO2
Fresno CountyStructures
2013 Total 0.659 2.869 5.466 0.000 0.230 0.242 0.472 0.048 0.223 0.271 656 3.625 15.779 30.066 0.001 1.264 1.332 2.596 0.265 1.225 1.490 3,6082014 Total 0.309 1.295 2.273 0.000 0.106 0.125 0.231 0.022 0.115 0.137 273 1.698 7.125 12.499 0.001 0.583 0.688 1.271 0.122 0.633 0.755 1,500
Projects > 2.5 miles
2014 Total 0.000 0.000 0.000 0.000 0.000 0.000 0.000 0.000 0.000 0.000 0 0.388 1.952 2.929 0.000 0.117 0.122 0.239 0.025 0.112 0.137 4002015 Total 0.000 0.000 0.000 0.000 0.000 0.000 0.000 0.000 0.000 0.000 0 0.633 3.313 4.577 0.001 0.199 0.205 0.404 0.042 0.188 0.230 6802016 Total 0.000 0.000 0.000 0.000 0.000 0.000 0.000 0.000 0.000 0.000 0 0.509 2.415 3.134 0.001 0.109 0.158 0.267 0.023 0.145 0.168 481
Projects < 2.5 miles
2015 Total 0.519 2.553 3.954 0.000 0.198 0.173 0.371 0.042 0.159 0.201 569 0.000 0.000 0.000 0.000 0.000 0.000 0.000 0.000 0.000 0.000 02016 Total 0.417 1.927 2.817 0.000 0.140 0.146 0.286 0.029 0.134 0.163 416 0.000 0.000 0.000 0.000 0.000 0.000 0.000 0.000 0.000 0.000 0
Projects < 1 mile
2017 Total 1.526 7.404 10.720 0.001 0.672 0.511 1.183 0.141 0.470 0.611 1,765 8.393 40.721 58.959 0.004 3.697 2.810 6.508 0.775 2.584 3.359 9,707
Madera CountyStructures
2013 Total 0.000 0.000 0.000 0.000 0.000 0.000 0.000 0.000 0.000 0.000 0 3.295 14.344 27.332 0.001 1.149 1.210 2.360 0.241 1.113 1.354 3,2802014 Total 0.000 0.000 0.000 0.000 0.000 0.000 0.000 0.000 0.000 0.000 0 1.544 6.477 11.363 0.001 0.530 0.626 1.156 0.111 0.575 0.686 1,363
Projects > 2.5 miles
2014 Total 0.000 0.000 0.000 0.000 0.000 0.000 0.000 0.000 0.000 0.000 0 1.164 5.856 8.788 0.001 0.350 0.366 0.716 0.074 0.336 0.410 1,2002015 Total 0.000 0.000 0.000 0.000 0.000 0.000 0.000 0.000 0.000 0.000 0 1.899 9.938 13.731 0.002 0.598 0.615 1.213 0.126 0.565 0.691 2,0402016 Total 0.000 0.000 0.000 0.000 0.000 0.000 0.000 0.000 0.000 0.000 0 1.526 7.244 9.403 0.002 0.328 0.473 0.801 0.070 0.434 0.504 1,442
Projects < 2.5 miles
2015 Total 0.000 0.000 0.000 0.000 0.000 0.000 0.000 0.000 0.000 0.000 0 2.595 12.765 19.768 0.001 0.989 0.866 1.856 0.208 0.797 1.004 2,8462016 Total 0.000 0.000 0.000 0.000 0.000 0.000 0.000 0.000 0.000 0.000 0 2.084 9.633 14.087 0.002 0.701 0.728 1.429 0.147 0.670 0.817 2,079
Projects < 1 mile
2017 Total 0.000 0.000 0.000 0.000 0.000 0.000 0.000 0.000 0.000 0.000 0 6.867 33.317 48.239 0.003 3.025 2.299 5.324 0.634 2.114 2.749 7,942
Merced CountyStructures
2013 Total 0.659 2.869 5.466 0.000 0.230 0.242 0.472 0.048 0.223 0.271 656 0.330 1.434 2.733 0.000 0.115 0.121 0.236 0.024 0.111 0.135 3282014 Total 0.309 1.295 2.273 0.000 0.106 0.125 0.231 0.022 0.115 0.137 273 0.154 0.648 1.136 0.000 0.053 0.063 0.116 0.011 0.058 0.069 136
Projects > 2.5 miles
2014 Total 0.000 0.000 0.000 0.000 0.000 0.000 0.000 0.000 0.000 0.000 0 0.388 1.952 2.929 0.000 0.117 0.122 0.239 0.025 0.112 0.137 4002015 Total 0.000 0.000 0.000 0.000 0.000 0.000 0.000 0.000 0.000 0.000 0 0.633 3.313 4.577 0.001 0.199 0.205 0.404 0.042 0.188 0.230 6802016 Total 0.000 0.000 0.000 0.000 0.000 0.000 0.000 0.000 0.000 0.000 0 0.509 2.415 3.134 0.001 0.109 0.158 0.267 0.023 0.145 0.168 481
Projects < 2.5 miles
2015 Total 0.000 0.000 0.000 0.000 0.000 0.000 0.000 0.000 0.000 0.000 0 0.000 0.000 0.000 0.000 0.000 0.000 0.000 0.000 0.000 0.000 02016 Total 0.000 0.000 0.000 0.000 0.000 0.000 0.000 0.000 0.000 0.000 0 0.000 0.000 0.000 0.000 0.000 0.000 0.000 0.000 0.000 0.000 0
Projects < 1 mile
2017 Total 0.763 3.702 5.360 0.000 0.336 0.255 0.592 0.070 0.235 0.305 882 0.000 0.000 0.000 0.000 0.000 0.000 0.000 0.000 0.000 0.000 0
Sum of All Projects2013 Total 1.318 5.738 10.933 0.000 0.460 0.484 0.944 0.096 0.445 0.542 1,312 7.249 31.558 60.131 0.002 2.528 2.663 5.192 0.530 2.449 2.979 7,2162014 Total 0.618 2.591 4.545 0.000 0.212 0.250 0.462 0.044 0.230 0.275 545 5.337 24.010 39.646 0.003 1.750 1.986 3.736 0.368 1.827 2.194 4,9992015 Total 0.519 2.553 3.954 0.000 0.198 0.173 0.371 0.042 0.159 0.201 569 5.760 29.329 42.652 0.004 1.986 1.891 3.877 0.418 1.738 2.156 6,2452016 Total 0.417 1.927 2.817 0.000 0.140 0.146 0.286 0.029 0.134 0.163 416 4.627 21.707 29.758 0.005 1.247 1.516 2.763 0.264 1.394 1.658 4,4832017 Total 2.289 11.106 16.080 0.001 1.008 0.766 1.775 0.211 0.705 0.916 2,647 15.260 74.037 107.198 0.008 6.723 5.109 11.832 1.410 4.698 6.108 17,650
Notes:1. Roadway projects included in the RTP will not be summed into the project's total emissions as they would happen with or without construction of the HST.2. Roadway projects not included in the RTP will be summed into the project's total emissions as they are only occurring due to HST construction.3. URBEMIS2007 results were multiplied by the number of roadway projects, meeting the length designation, within each county. The number of roadway projects are tabulated on the Roadway tabs in the Data Request.
Project TypeCounty Structures > 2.5 miles < 2.5 miles < 1 mile Structures > 2.5 miles < 2.5 miles < 1 mileFresno 2 0 1 4 11 1 0 22Madera 0 0 0 0 10 3 5 18Merced 2 0 0 2 1 1 0 0
Construction Phase 3
RTP Included Emissions (tpy) 1 Non-RTP Included Emissions (tpy) 2
Included in the RTP Not Included in the RTP

B.1-23 UPRR Ave 21: Construction Emissions from Roadway ProjectsThis tab provides data for Roadway Projects occuring as a result of the UPRR Ave 21 Alternative. Assumptions are documented in the Data Request (Roadway tabs).
Construction Emissions (Mitigated)
ROG CO NOx SOx PM10 Dust PM10 Exhaust PM10 PM2.5 Dust PM2.5 Exhaust PM2.5 CO2 ROG CO NOx SOx PM10 Dust PM10 Exhaust PM10 PM2.5 Dust PM2.5 Exhaust PM2.5 CO2
Fresno CountyStructures
2013 Total 0.242 2.869 0.615 0.000 0.209 0.025 0.234 0.044 0.023 0.067 656 1.333 15.779 3.381 0.001 1.148 0.138 1.285 0.241 0.126 0.367 3,6082014 Total 0.115 1.295 0.259 0.000 0.096 0.013 0.109 0.020 0.012 0.032 273 0.632 7.125 1.426 0.001 0.529 0.072 0.601 0.111 0.066 0.177 1,500
Projects > 2.5 miles
2014 Total 0.000 0.000 0.000 0.000 0.000 0.000 0.000 0.000 0.000 0.000 0 0.145 1.952 0.336 0.000 0.106 0.013 0.119 0.022 0.012 0.034 4002015 Total 0.000 0.000 0.000 0.000 0.000 0.000 0.000 0.000 0.000 0.000 0 0.237 3.313 0.526 0.001 0.181 0.022 0.203 0.038 0.020 0.058 6802016 Total 0.000 0.000 0.000 0.000 0.000 0.000 0.000 0.000 0.000 0.000 0 0.223 2.415 0.429 0.001 0.099 0.020 0.119 0.021 0.018 0.039 481
Projects < 2.5 miles
2015 Total 0.192 2.553 0.448 0.000 0.180 0.018 0.198 0.038 0.017 0.054 569 0.000 0.000 0.000 0.000 0.000 0.000 0.000 0.000 0.000 0.000 02016 Total 0.165 1.927 0.342 0.000 0.127 0.016 0.144 0.027 0.015 0.042 416 0.000 0.000 0.000 0.000 0.000 0.000 0.000 0.000 0.000 0.000 0
Projects < 1 mile
2017 Total 0.570 7.404 1.225 0.001 0.610 0.054 0.664 0.128 0.050 0.178 1,765 3.134 40.721 6.735 0.004 3.357 0.298 3.654 0.704 0.273 0.977 9,707
Madera CountyStructures
2013 Total 0.000 0.000 0.000 0.000 0.000 0.000 0.000 0.000 0.000 0.000 0 1.211 14.344 3.074 0.001 1.043 0.125 1.169 0.219 0.115 0.334 3,2802014 Total 0.000 0.000 0.000 0.000 0.000 0.000 0.000 0.000 0.000 0.000 0 0.574 6.477 1.297 0.001 0.481 0.065 0.547 0.101 0.060 0.161 1,363
Projects > 2.5 miles
2014 Total 0.000 0.000 0.000 0.000 0.000 0.000 0.000 0.000 0.000 0.000 0 0.436 5.856 1.008 0.001 0.318 0.040 0.358 0.067 0.036 0.103 1,2002015 Total 0.000 0.000 0.000 0.000 0.000 0.000 0.000 0.000 0.000 0.000 0 0.711 9.938 1.577 0.002 0.543 0.067 0.610 0.115 0.061 0.175 2,0402016 Total 0.000 0.000 0.000 0.000 0.000 0.000 0.000 0.000 0.000 0.000 0 0.670 7.244 1.288 0.002 0.298 0.059 0.358 0.064 0.054 0.118 1,442
Projects < 2.5 miles
2015 Total 0.000 0.000 0.000 0.000 0.000 0.000 0.000 0.000 0.000 0.000 0 0.960 12.765 2.239 0.001 0.898 0.091 0.990 0.189 0.084 0.272 2,8462016 Total 0.000 0.000 0.000 0.000 0.000 0.000 0.000 0.000 0.000 0.000 0 0.825 9.633 1.712 0.002 0.636 0.081 0.718 0.134 0.074 0.209 2,079
Projects < 1 mile
2017 Total 0.000 0.000 0.000 0.000 0.000 0.000 0.000 0.000 0.000 0.000 0 2.564 33.317 5.511 0.003 2.746 0.244 2.990 0.576 0.223 0.799 7,942
Merced CountyStructures
2013 Total 0.242 2.869 0.615 0.000 0.209 0.025 0.234 0.044 0.023 0.067 656 0.121 1.434 0.307 0.000 0.104 0.013 0.117 0.022 0.011 0.033 3282014 Total 0.115 1.295 0.259 0.000 0.096 0.013 0.109 0.020 0.012 0.032 273 0.057 0.648 0.130 0.000 0.048 0.007 0.055 0.010 0.006 0.016 136
Projects > 2.5 miles
2014 Total 0.000 0.000 0.000 0.000 0.000 0.000 0.000 0.000 0.000 0.000 0 0.145 1.952 0.336 0.000 0.106 0.013 0.119 0.022 0.012 0.034 4002015 Total 0.000 0.000 0.000 0.000 0.000 0.000 0.000 0.000 0.000 0.000 0 0.237 3.313 0.526 0.001 0.181 0.022 0.203 0.038 0.020 0.058 6802016 Total 0.000 0.000 0.000 0.000 0.000 0.000 0.000 0.000 0.000 0.000 0 0.223 2.415 0.429 0.001 0.099 0.020 0.119 0.021 0.018 0.039 481
Projects < 2.5 miles
2015 Total 0.000 0.000 0.000 0.000 0.000 0.000 0.000 0.000 0.000 0.000 0 0.000 0.000 0.000 0.000 0.000 0.000 0.000 0.000 0.000 0.000 02016 Total 0.000 0.000 0.000 0.000 0.000 0.000 0.000 0.000 0.000 0.000 0 0.000 0.000 0.000 0.000 0.000 0.000 0.000 0.000 0.000 0.000 0
Projects < 1 mile
2017 Total 0.285 3.702 0.612 0.000 0.305 0.027 0.332 0.064 0.025 0.089 882 0.000 0.000 0.000 0.000 0.000 0.000 0.000 0.000 0.000 0.000 0
Sum of All Projects2013 Total 0.485 5.738 1.229 0.000 0.417 0.050 0.467 0.087 0.046 0.133 1,312 2.665 31.558 6.762 0.002 2.295 0.276 2.571 0.481 0.253 0.734 7,2162014 Total 0.230 2.591 0.519 0.000 0.192 0.026 0.219 0.040 0.024 0.064 545 1.990 24.010 4.533 0.003 1.589 0.210 1.799 0.334 0.192 0.526 4,9992015 Total 0.192 2.553 0.448 0.000 0.180 0.018 0.198 0.038 0.017 0.054 569 2.144 29.329 4.867 0.004 1.803 0.203 2.006 0.380 0.185 0.565 6,2452016 Total 0.165 1.927 0.342 0.000 0.127 0.016 0.144 0.027 0.015 0.042 416 1.942 21.707 3.858 0.005 1.134 0.180 1.314 0.240 0.164 0.405 4,4832017 Total 0.855 11.106 1.837 0.001 0.915 0.081 0.997 0.192 0.074 0.266 2,647 5.698 74.037 12.246 0.008 6.103 0.542 6.644 1.280 0.496 1.776 17,650
Notes:1. Roadway projects included in the RTP will not be summed into the project's total emissions as they would happen with or without construction of the HST.2. Roadway projects not included in the RTP will be summed into the project's total emissions as they are only occurring due to HST construction.3. URBEMIS2007 results were multiplied by the number of roadway projects, meeting the length designation, within each county. The number of roadway projects are tabulated on the Roadway tabs in the Data Request.
Project TypeCounty Structures > 2.5 miles < 2.5 miles < 1 mile Structures > 2.5 miles < 2.5 miles < 1 mileFresno 2 0 1 4 11 1 0 22Madera 0 0 0 0 10 3 5 18Merced 2 0 0 2 1 1 0 0
Included in the RTP Not Included in the RTP
Construction Phase 3
RTP Included Emissions (tpy) 1 Non-RTP Included Emissions (tpy) 2

B.1-24 UPRR Ave 24: Construction Emissions from Roadway ProjectsThis tab provides data for Roadway Projects occuring as a result of the UPRR Ave 24 Alternative. Assumptions are documented in the Data Request (Roadway tabs).
Construction Emissions (Programmatic)
ROG CO NOx SOx PM10 Dust PM10 Exhaust PM10 PM2.5 Dust PM2.5 Exhaust PM2.5 CO2 ROG CO NOx SOx PM10 Dust PM10 Exhaust PM10 PM2.5 Dust PM2.5 Exhaust PM2.5 CO2
Fresno CountyStructures
2013 Total 0.659 2.869 5.466 0.000 0.230 0.242 0.472 0.048 0.223 0.271 656 3.625 15.779 30.066 0.001 1.264 1.332 2.596 0.265 1.225 1.490 3,6082014 Total 0.309 1.295 2.273 0.000 0.106 0.125 0.231 0.022 0.115 0.137 273 1.698 7.125 12.499 0.001 0.583 0.688 1.271 0.122 0.633 0.755 1,500
Projects > 2.5 miles
2014 Total 0.000 0.000 0.000 0.000 0.000 0.000 0.000 0.000 0.000 0.000 0 0.388 1.952 2.929 0.000 0.117 0.122 0.239 0.025 0.112 0.137 4002015 Total 0.000 0.000 0.000 0.000 0.000 0.000 0.000 0.000 0.000 0.000 0 0.633 3.313 4.577 0.001 0.199 0.205 0.404 0.042 0.188 0.230 6802016 Total 0.000 0.000 0.000 0.000 0.000 0.000 0.000 0.000 0.000 0.000 0 0.509 2.415 3.134 0.001 0.109 0.158 0.267 0.023 0.145 0.168 481
Projects < 2.5 miles
2015 Total 0.519 2.553 3.954 0.000 0.198 0.173 0.371 0.042 0.159 0.201 569 0.000 0.000 0.000 0.000 0.000 0.000 0.000 0.000 0.000 0.000 02016 Total 0.417 1.927 2.817 0.000 0.140 0.146 0.286 0.029 0.134 0.163 416 0.000 0.000 0.000 0.000 0.000 0.000 0.000 0.000 0.000 0.000 0
Projects < 1 mile
2017 Total 1.526 7.404 10.720 0.001 0.672 0.511 1.183 0.141 0.470 0.611 1,765 8.393 40.721 58.959 0.004 3.697 2.810 6.508 0.775 2.584 3.359 9,707
Madera CountyStructures
2013 Total 0.000 0.000 0.000 0.000 0.000 0.000 0.000 0.000 0.000 0.000 0 4.613 20.082 38.265 0.001 1.609 1.695 3.304 0.337 1.559 1.896 4,5922014 Total 0.000 0.000 0.000 0.000 0.000 0.000 0.000 0.000 0.000 0.000 0 2.162 9.068 15.908 0.001 0.742 0.876 1.618 0.156 0.805 0.961 1,909
Projects > 2.5 miles
2014 Total 0.000 0.000 0.000 0.000 0.000 0.000 0.000 0.000 0.000 0.000 0 1.164 5.856 8.788 0.001 0.350 0.366 0.716 0.074 0.336 0.410 1,2002015 Total 0.000 0.000 0.000 0.000 0.000 0.000 0.000 0.000 0.000 0.000 0 1.899 9.938 13.731 0.002 0.598 0.615 1.213 0.126 0.565 0.691 2,0402016 Total 0.000 0.000 0.000 0.000 0.000 0.000 0.000 0.000 0.000 0.000 0 1.526 7.244 9.403 0.002 0.328 0.473 0.801 0.070 0.434 0.504 1,442
Projects < 2.5 miles
2015 Total 0.000 0.000 0.000 0.000 0.000 0.000 0.000 0.000 0.000 0.000 0 3.114 15.319 23.721 0.002 1.187 1.040 2.227 0.249 0.956 1.205 3,4152016 Total 0.000 0.000 0.000 0.000 0.000 0.000 0.000 0.000 0.000 0.000 0 2.500 11.560 16.905 0.002 0.841 0.874 1.715 0.177 0.804 0.981 2,494
Projects < 1 mile
2017 Total 0.000 0.000 0.000 0.000 0.000 0.000 0.000 0.000 0.000 0.000 0 4.960 24.062 34.839 0.002 2.185 1.661 3.845 0.458 1.527 1.985 5,736
Merced CountyStructures
2013 Total 0.659 2.869 5.466 0.000 0.230 0.242 0.472 0.048 0.223 0.271 656 0.989 4.303 8.200 0.000 0.345 0.363 0.708 0.072 0.334 0.406 9842014 Total 0.309 1.295 2.273 0.000 0.106 0.125 0.231 0.022 0.115 0.137 273 0.463 1.943 3.409 0.000 0.159 0.188 0.347 0.033 0.173 0.206 409
Projects > 2.5 miles
2014 Total 0.000 0.000 0.000 0.000 0.000 0.000 0.000 0.000 0.000 0.000 0 0.388 1.952 2.929 0.000 0.117 0.122 0.239 0.025 0.112 0.137 4002015 Total 0.000 0.000 0.000 0.000 0.000 0.000 0.000 0.000 0.000 0.000 0 0.633 3.313 4.577 0.001 0.199 0.205 0.404 0.042 0.188 0.230 6802016 Total 0.000 0.000 0.000 0.000 0.000 0.000 0.000 0.000 0.000 0.000 0 0.509 2.415 3.134 0.001 0.109 0.158 0.267 0.023 0.145 0.168 481
Projects < 2.5 miles
2015 Total 0.000 0.000 0.000 0.000 0.000 0.000 0.000 0.000 0.000 0.000 0 0.519 2.553 3.954 0.000 0.198 0.173 0.371 0.042 0.159 0.201 5692016 Total 0.000 0.000 0.000 0.000 0.000 0.000 0.000 0.000 0.000 0.000 0 0.417 1.927 2.817 0.000 0.140 0.146 0.286 0.029 0.134 0.163 416
Projects < 1 mile
2017 Total 0.763 3.702 5.360 0.000 0.336 0.255 0.592 0.070 0.235 0.305 882 0.000 0.000 0.000 0.000 0.000 0.000 0.000 0.000 0.000 0.000 0
Sum of All Projects2013 Total 1.318 5.738 10.933 0.000 0.460 0.484 0.944 0.096 0.445 0.542 1,312 9.226 40.164 76.531 0.003 3.218 3.389 6.607 0.674 3.117 3.791 9,1842014 Total 0.618 2.591 4.545 0.000 0.212 0.250 0.462 0.044 0.230 0.275 545 6.264 27.897 46.463 0.003 2.068 2.362 4.429 0.434 2.172 2.606 5,8172015 Total 0.519 2.553 3.954 0.000 0.198 0.173 0.371 0.042 0.159 0.201 569 6.799 34.436 50.560 0.005 2.381 2.238 4.619 0.501 2.057 2.558 7,3832016 Total 0.417 1.927 2.817 0.000 0.140 0.146 0.286 0.029 0.134 0.163 416 5.460 25.560 35.393 0.006 1.527 1.808 3.335 0.323 1.662 1.984 5,3142017 Total 2.289 11.106 16.080 0.001 1.008 0.766 1.775 0.211 0.705 0.916 2,647 13.353 64.783 93.799 0.007 5.882 4.471 10.353 1.233 4.111 5.345 15,443
Notes:1. Roadway projects included in the RTP will not be summed into the project's total emissions as they would happen with or without construction of the HST.2. Roadway projects not included in the RTP will be summed into the project's total emissions as they are only occurring due to HST construction.3. URBEMIS2007 results were multiplied by the number of roadway projects, meeting the length designation, within each county. The number of roadway projects are tabulated on the Roadway tabs in the Data Request.
Project TypeCounty Structures > 2.5 miles < 2.5 miles < 1 mile Structures > 2.5 miles < 2.5 miles < 1 mileFresno 2 0 1 4 11 1 0 22Madera 0 0 0 0 14 3 6 13Merced 2 0 0 2 3 1 1 0
Construction Phase 3
RTP Included Emissions (tpy) 1 Non-RTP Included Emissions (tpy) 2
Included in the RTP Not Included in the RTP
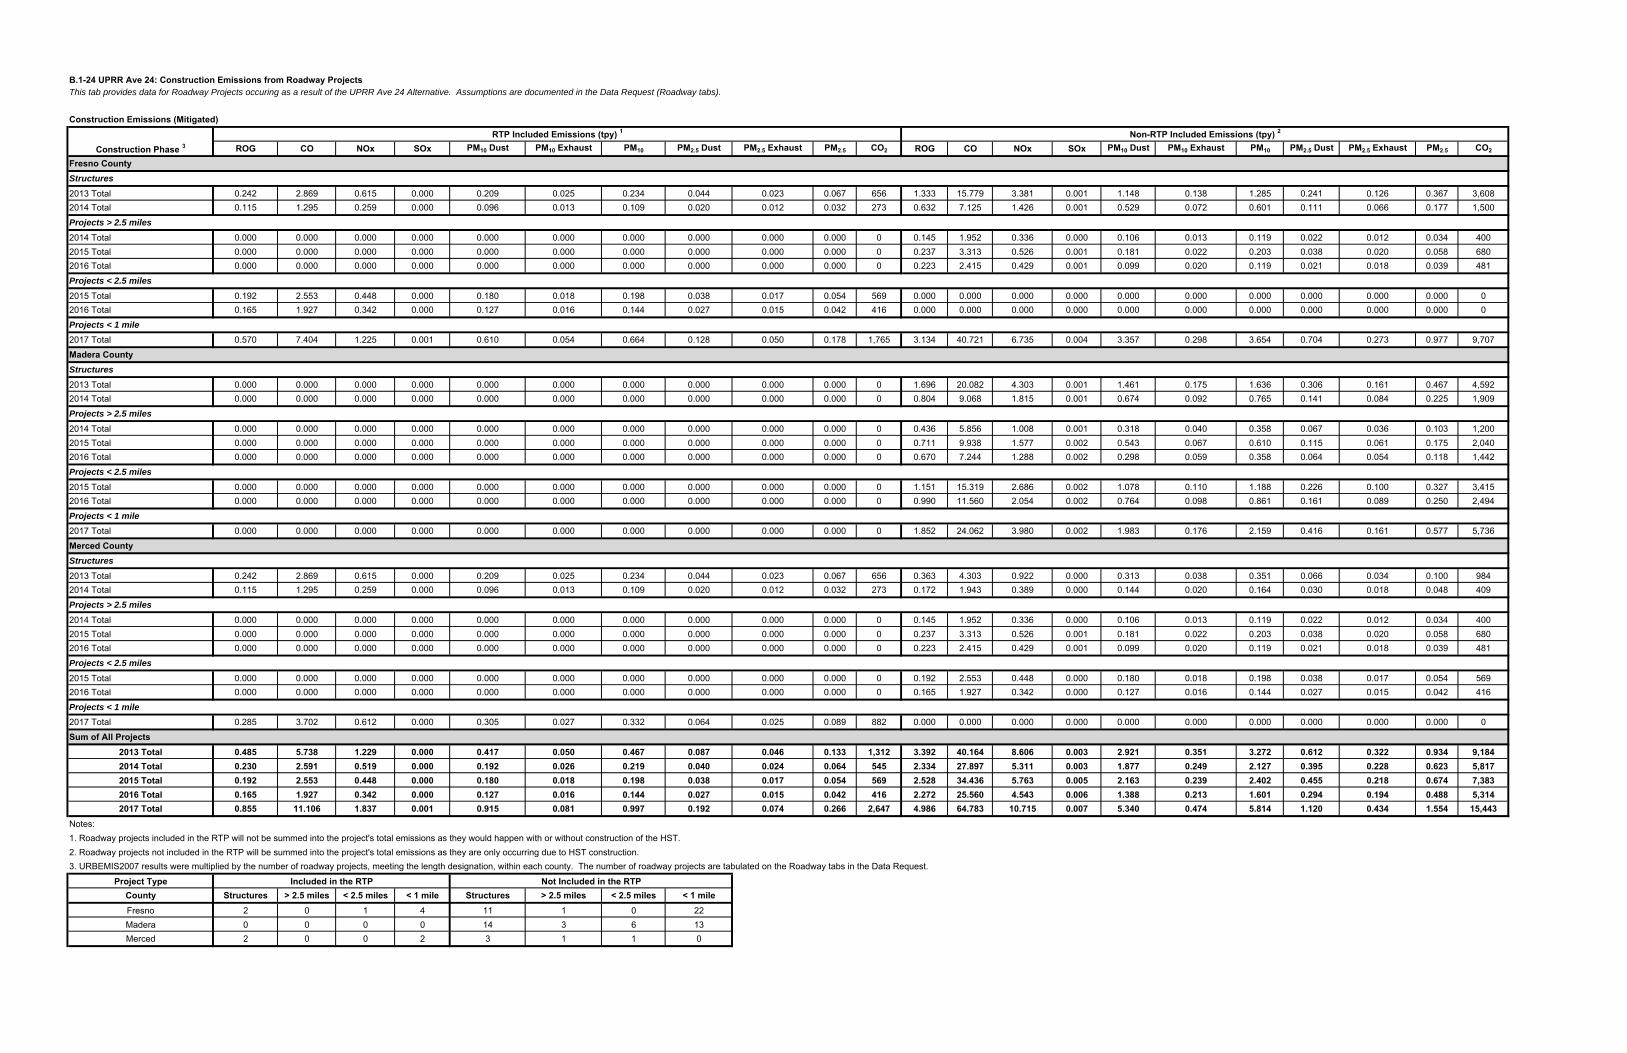
B.1-24 UPRR Ave 24: Construction Emissions from Roadway ProjectsThis tab provides data for Roadway Projects occuring as a result of the UPRR Ave 24 Alternative. Assumptions are documented in the Data Request (Roadway tabs).
Construction Emissions (Mitigated)
ROG CO NOx SOx PM10 Dust PM10 Exhaust PM10 PM2.5 Dust PM2.5 Exhaust PM2.5 CO2 ROG CO NOx SOx PM10 Dust PM10 Exhaust PM10 PM2.5 Dust PM2.5 Exhaust PM2.5 CO2
Fresno CountyStructures
2013 Total 0.242 2.869 0.615 0.000 0.209 0.025 0.234 0.044 0.023 0.067 656 1.333 15.779 3.381 0.001 1.148 0.138 1.285 0.241 0.126 0.367 3,6082014 Total 0.115 1.295 0.259 0.000 0.096 0.013 0.109 0.020 0.012 0.032 273 0.632 7.125 1.426 0.001 0.529 0.072 0.601 0.111 0.066 0.177 1,500
Projects > 2.5 miles
2014 Total 0.000 0.000 0.000 0.000 0.000 0.000 0.000 0.000 0.000 0.000 0 0.145 1.952 0.336 0.000 0.106 0.013 0.119 0.022 0.012 0.034 4002015 Total 0.000 0.000 0.000 0.000 0.000 0.000 0.000 0.000 0.000 0.000 0 0.237 3.313 0.526 0.001 0.181 0.022 0.203 0.038 0.020 0.058 6802016 Total 0.000 0.000 0.000 0.000 0.000 0.000 0.000 0.000 0.000 0.000 0 0.223 2.415 0.429 0.001 0.099 0.020 0.119 0.021 0.018 0.039 481
Projects < 2.5 miles
2015 Total 0.192 2.553 0.448 0.000 0.180 0.018 0.198 0.038 0.017 0.054 569 0.000 0.000 0.000 0.000 0.000 0.000 0.000 0.000 0.000 0.000 02016 Total 0.165 1.927 0.342 0.000 0.127 0.016 0.144 0.027 0.015 0.042 416 0.000 0.000 0.000 0.000 0.000 0.000 0.000 0.000 0.000 0.000 0
Projects < 1 mile
2017 Total 0.570 7.404 1.225 0.001 0.610 0.054 0.664 0.128 0.050 0.178 1,765 3.134 40.721 6.735 0.004 3.357 0.298 3.654 0.704 0.273 0.977 9,707
Madera CountyStructures
2013 Total 0.000 0.000 0.000 0.000 0.000 0.000 0.000 0.000 0.000 0.000 0 1.696 20.082 4.303 0.001 1.461 0.175 1.636 0.306 0.161 0.467 4,5922014 Total 0.000 0.000 0.000 0.000 0.000 0.000 0.000 0.000 0.000 0.000 0 0.804 9.068 1.815 0.001 0.674 0.092 0.765 0.141 0.084 0.225 1,909
Projects > 2.5 miles
2014 Total 0.000 0.000 0.000 0.000 0.000 0.000 0.000 0.000 0.000 0.000 0 0.436 5.856 1.008 0.001 0.318 0.040 0.358 0.067 0.036 0.103 1,2002015 Total 0.000 0.000 0.000 0.000 0.000 0.000 0.000 0.000 0.000 0.000 0 0.711 9.938 1.577 0.002 0.543 0.067 0.610 0.115 0.061 0.175 2,0402016 Total 0.000 0.000 0.000 0.000 0.000 0.000 0.000 0.000 0.000 0.000 0 0.670 7.244 1.288 0.002 0.298 0.059 0.358 0.064 0.054 0.118 1,442
Projects < 2.5 miles
2015 Total 0.000 0.000 0.000 0.000 0.000 0.000 0.000 0.000 0.000 0.000 0 1.151 15.319 2.686 0.002 1.078 0.110 1.188 0.226 0.100 0.327 3,4152016 Total 0.000 0.000 0.000 0.000 0.000 0.000 0.000 0.000 0.000 0.000 0 0.990 11.560 2.054 0.002 0.764 0.098 0.861 0.161 0.089 0.250 2,494
Projects < 1 mile
2017 Total 0.000 0.000 0.000 0.000 0.000 0.000 0.000 0.000 0.000 0.000 0 1.852 24.062 3.980 0.002 1.983 0.176 2.159 0.416 0.161 0.577 5,736
Merced CountyStructures
2013 Total 0.242 2.869 0.615 0.000 0.209 0.025 0.234 0.044 0.023 0.067 656 0.363 4.303 0.922 0.000 0.313 0.038 0.351 0.066 0.034 0.100 9842014 Total 0.115 1.295 0.259 0.000 0.096 0.013 0.109 0.020 0.012 0.032 273 0.172 1.943 0.389 0.000 0.144 0.020 0.164 0.030 0.018 0.048 409
Projects > 2.5 miles
2014 Total 0.000 0.000 0.000 0.000 0.000 0.000 0.000 0.000 0.000 0.000 0 0.145 1.952 0.336 0.000 0.106 0.013 0.119 0.022 0.012 0.034 4002015 Total 0.000 0.000 0.000 0.000 0.000 0.000 0.000 0.000 0.000 0.000 0 0.237 3.313 0.526 0.001 0.181 0.022 0.203 0.038 0.020 0.058 6802016 Total 0.000 0.000 0.000 0.000 0.000 0.000 0.000 0.000 0.000 0.000 0 0.223 2.415 0.429 0.001 0.099 0.020 0.119 0.021 0.018 0.039 481
Projects < 2.5 miles
2015 Total 0.000 0.000 0.000 0.000 0.000 0.000 0.000 0.000 0.000 0.000 0 0.192 2.553 0.448 0.000 0.180 0.018 0.198 0.038 0.017 0.054 5692016 Total 0.000 0.000 0.000 0.000 0.000 0.000 0.000 0.000 0.000 0.000 0 0.165 1.927 0.342 0.000 0.127 0.016 0.144 0.027 0.015 0.042 416
Projects < 1 mile
2017 Total 0.285 3.702 0.612 0.000 0.305 0.027 0.332 0.064 0.025 0.089 882 0.000 0.000 0.000 0.000 0.000 0.000 0.000 0.000 0.000 0.000 0
Sum of All Projects2013 Total 0.485 5.738 1.229 0.000 0.417 0.050 0.467 0.087 0.046 0.133 1,312 3.392 40.164 8.606 0.003 2.921 0.351 3.272 0.612 0.322 0.934 9,1842014 Total 0.230 2.591 0.519 0.000 0.192 0.026 0.219 0.040 0.024 0.064 545 2.334 27.897 5.311 0.003 1.877 0.249 2.127 0.395 0.228 0.623 5,8172015 Total 0.192 2.553 0.448 0.000 0.180 0.018 0.198 0.038 0.017 0.054 569 2.528 34.436 5.763 0.005 2.163 0.239 2.402 0.455 0.218 0.674 7,3832016 Total 0.165 1.927 0.342 0.000 0.127 0.016 0.144 0.027 0.015 0.042 416 2.272 25.560 4.543 0.006 1.388 0.213 1.601 0.294 0.194 0.488 5,3142017 Total 0.855 11.106 1.837 0.001 0.915 0.081 0.997 0.192 0.074 0.266 2,647 4.986 64.783 10.715 0.007 5.340 0.474 5.814 1.120 0.434 1.554 15,443
Notes:1. Roadway projects included in the RTP will not be summed into the project's total emissions as they would happen with or without construction of the HST.2. Roadway projects not included in the RTP will be summed into the project's total emissions as they are only occurring due to HST construction.3. URBEMIS2007 results were multiplied by the number of roadway projects, meeting the length designation, within each county. The number of roadway projects are tabulated on the Roadway tabs in the Data Request.
Project TypeCounty Structures > 2.5 miles < 2.5 miles < 1 mile Structures > 2.5 miles < 2.5 miles < 1 mileFresno 2 0 1 4 11 1 0 22Madera 0 0 0 0 14 3 6 13Merced 2 0 0 2 3 1 1 0
Included in the RTP Not Included in the RTP
Construction Phase 3
RTP Included Emissions (tpy) 1 Non-RTP Included Emissions (tpy) 2

B.1-25 Hybrid Ave 24: Construction Emissions from Roadway ProjectsThis tab provides data for Roadway Projects occuring as a result of the Hybrid Ave 24 Alternative. Assumptions are documented in the Data Request (Roadway tabs).
Construction Emissions (Programmatic)
ROG CO NOx SOx PM10 Dust PM10 Exhaust PM10 PM2.5 Dust PM2.5 Exhaust PM2.5 CO2 ROG CO NOx SOx PM10 Dust PM10 Exhaust PM10 PM2.5 Dust PM2.5 Exhaust PM2.5 CO2
Fresno CountyStructures
2013 Total 0.659 2.869 5.466 0.000 0.230 0.242 0.472 0.048 0.223 0.271 656 3.625 15.779 30.066 0.001 1.264 1.332 2.596 0.265 1.225 1.490 3,6082014 Total 0.309 1.295 2.273 0.000 0.106 0.125 0.231 0.022 0.115 0.137 273 1.698 7.125 12.499 0.001 0.583 0.688 1.271 0.122 0.633 0.755 1,500
Projects > 2.5 miles
2014 Total 0.000 0.000 0.000 0.000 0.000 0.000 0.000 0.000 0.000 0.000 0 0.388 1.952 2.929 0.000 0.117 0.122 0.239 0.025 0.112 0.137 4002015 Total 0.000 0.000 0.000 0.000 0.000 0.000 0.000 0.000 0.000 0.000 0 0.633 3.313 4.577 0.001 0.199 0.205 0.404 0.042 0.188 0.230 6802016 Total 0.000 0.000 0.000 0.000 0.000 0.000 0.000 0.000 0.000 0.000 0 0.509 2.415 3.134 0.001 0.109 0.158 0.267 0.023 0.145 0.168 481
Projects < 2.5 miles
2015 Total 0.519 2.553 3.954 0.000 0.198 0.173 0.371 0.042 0.159 0.201 569 0.000 0.000 0.000 0.000 0.000 0.000 0.000 0.000 0.000 0.000 02016 Total 0.417 1.927 2.817 0.000 0.140 0.146 0.286 0.029 0.134 0.163 416 0.000 0.000 0.000 0.000 0.000 0.000 0.000 0.000 0.000 0.000 0
Projects < 1 mile
2017 Total 1.526 7.404 10.720 0.001 0.672 0.511 1.183 0.141 0.470 0.611 1,765 8.393 40.721 58.959 0.004 3.697 2.810 6.508 0.775 2.584 3.359 9,707
Madera CountyStructures
2013 Total 0.000 0.000 0.000 0.000 0.000 0.000 0.000 0.000 0.000 0.000 0 8.897 38.730 73.797 0.003 3.103 3.268 6.371 0.650 3.006 3.656 8,8562014 Total 0.000 0.000 0.000 0.000 0.000 0.000 0.000 0.000 0.000 0.000 0 4.169 17.489 30.680 0.002 1.431 1.689 3.120 0.300 1.553 1.854 3,681
Projects > 2.5 miles
2014 Total 0.000 0.000 0.000 0.000 0.000 0.000 0.000 0.000 0.000 0.000 0 0.000 0.000 0.000 0.000 0.000 0.000 0.000 0.000 0.000 0.000 02015 Total 0.000 0.000 0.000 0.000 0.000 0.000 0.000 0.000 0.000 0.000 0 0.000 0.000 0.000 0.000 0.000 0.000 0.000 0.000 0.000 0.000 02016 Total 0.000 0.000 0.000 0.000 0.000 0.000 0.000 0.000 0.000 0.000 0 0.000 0.000 0.000 0.000 0.000 0.000 0.000 0.000 0.000 0.000 0
Projects < 2.5 miles
2015 Total 0.000 0.000 0.000 0.000 0.000 0.000 0.000 0.000 0.000 0.000 0 0.000 0.000 0.000 0.000 0.000 0.000 0.000 0.000 0.000 0.000 02016 Total 0.000 0.000 0.000 0.000 0.000 0.000 0.000 0.000 0.000 0.000 0 0.000 0.000 0.000 0.000 0.000 0.000 0.000 0.000 0.000 0.000 0
Projects < 1 mile
2017 Total 0.000 0.000 0.000 0.000 0.000 0.000 0.000 0.000 0.000 0.000 0 3.052 14.807 21.440 0.002 1.345 1.022 2.366 0.282 0.940 1.222 3,530
Merced CountyStructures
2013 Total 0.659 2.869 5.466 0.000 0.230 0.242 0.472 0.048 0.223 0.271 656 0.989 4.303 8.200 0.000 0.345 0.363 0.708 0.072 0.334 0.406 9842014 Total 0.309 1.295 2.273 0.000 0.106 0.125 0.231 0.022 0.115 0.137 273 0.463 1.943 3.409 0.000 0.159 0.188 0.347 0.033 0.173 0.206 409
Projects > 2.5 miles
2014 Total 0.000 0.000 0.000 0.000 0.000 0.000 0.000 0.000 0.000 0.000 0 0.388 1.952 2.929 0.000 0.117 0.122 0.239 0.025 0.112 0.137 4002015 Total 0.000 0.000 0.000 0.000 0.000 0.000 0.000 0.000 0.000 0.000 0 0.633 3.313 4.577 0.001 0.199 0.205 0.404 0.042 0.188 0.230 6802016 Total 0.000 0.000 0.000 0.000 0.000 0.000 0.000 0.000 0.000 0.000 0 0.509 2.415 3.134 0.001 0.109 0.158 0.267 0.023 0.145 0.168 481
Projects < 2.5 miles
2015 Total 0.000 0.000 0.000 0.000 0.000 0.000 0.000 0.000 0.000 0.000 0 0.519 2.553 3.954 0.000 0.198 0.173 0.371 0.042 0.159 0.201 5692016 Total 0.000 0.000 0.000 0.000 0.000 0.000 0.000 0.000 0.000 0.000 0 0.417 1.927 2.817 0.000 0.140 0.146 0.286 0.029 0.134 0.163 416
Projects < 1 mile
2017 Total 0.382 1.851 2.680 0.000 0.168 0.128 0.296 0.035 0.117 0.153 441 0.763 3.702 5.360 0.000 0.336 0.255 0.592 0.070 0.235 0.305 882
Sum of All Projects2013 Total 1.318 5.738 10.933 0.000 0.460 0.484 0.944 0.096 0.445 0.542 1,312 13.510 58.812 112.063 0.004 4.712 4.963 9.675 0.987 4.565 5.552 13,4482014 Total 0.618 2.591 4.545 0.000 0.212 0.250 0.462 0.044 0.230 0.275 545 7.107 30.461 52.447 0.003 2.406 2.809 5.215 0.505 2.583 3.088 6,3902015 Total 0.519 2.553 3.954 0.000 0.198 0.173 0.371 0.042 0.159 0.201 569 1.785 9.179 13.107 0.001 0.596 0.583 1.180 0.126 0.536 0.662 1,9292016 Total 0.417 1.927 2.817 0.000 0.140 0.146 0.286 0.029 0.134 0.163 416 1.434 6.756 9.086 0.002 0.359 0.461 0.820 0.076 0.424 0.500 1,3772017 Total 1.908 9.255 13.400 0.001 0.840 0.639 1.479 0.176 0.587 0.764 2,206 12.208 59.230 85.759 0.006 5.378 4.087 9.466 1.128 3.759 4.886 14,120
Notes:1. Roadway projects included in the RTP will not be summed into the project's total emissions as they would happen with or without construction of the HST.2. Roadway projects not included in the RTP will be summed into the project's total emissions as they are only occurring due to HST construction.3. URBEMIS2007 results were multiplied by the number of roadway projects, meeting the length designation, within each county. The number of roadway projects are tabulated on the Roadway tabs in the Data Request.
Project TypeCounty Structures > 2.5 miles < 2.5 miles < 1 mile Structures > 2.5 miles < 2.5 miles < 1 mileFresno 2 0 1 4 11 1 0 22Madera 0 0 0 0 27 0 0 8Merced 2 0 0 1 3 1 1 2
Construction Phase 3
RTP Included Emissions (tpy) 1 Non-RTP Included Emissions (tpy) 2
Included in the RTP Not Included in the RTP

B.1-25 Hybrid Ave 24: Construction Emissions from Roadway ProjectsThis tab provides data for Roadway Projects occuring as a result of the Hybrid Ave 24 Alternative. Assumptions are documented in the Data Request (Roadway tabs).
Construction Emissions (Mitigated)
ROG CO NOx SOx PM10 Dust PM10 Exhaust PM10 PM2.5 Dust PM2.5 Exhaust PM2.5 CO2 ROG CO NOx SOx PM10 Dust PM10 Exhaust PM10 PM2.5 Dust PM2.5 Exhaust PM2.5 CO2
Fresno CountyStructures
2013 Total 0.242 2.869 0.615 0.000 0.209 0.025 0.234 0.044 0.023 0.067 656 1.333 15.779 3.381 0.001 1.148 0.138 1.285 0.241 0.126 0.367 3,6082014 Total 0.115 1.295 0.259 0.000 0.096 0.013 0.109 0.020 0.012 0.032 273 0.632 7.125 1.426 0.001 0.529 0.072 0.601 0.111 0.066 0.177 1,500
Projects > 2.5 miles
2014 Total 0.000 0.000 0.000 0.000 0.000 0.000 0.000 0.000 0.000 0.000 0 0.145 1.952 0.336 0.000 0.106 0.013 0.119 0.022 0.012 0.034 4002015 Total 0.000 0.000 0.000 0.000 0.000 0.000 0.000 0.000 0.000 0.000 0 0.237 3.313 0.526 0.001 0.181 0.022 0.203 0.038 0.020 0.058 6802016 Total 0.000 0.000 0.000 0.000 0.000 0.000 0.000 0.000 0.000 0.000 0 0.223 2.415 0.429 0.001 0.099 0.020 0.119 0.021 0.018 0.039 481
Projects < 2.5 miles
2015 Total 0.192 2.553 0.448 0.000 0.180 0.018 0.198 0.038 0.017 0.054 569 0.000 0.000 0.000 0.000 0.000 0.000 0.000 0.000 0.000 0.000 02016 Total 0.165 1.927 0.342 0.000 0.127 0.016 0.144 0.027 0.015 0.042 416 0.000 0.000 0.000 0.000 0.000 0.000 0.000 0.000 0.000 0.000 0
Projects < 1 mile
2017 Total 0.570 7.404 1.225 0.001 0.610 0.054 0.664 0.128 0.050 0.178 1,765 3.134 40.721 6.735 0.004 3.357 0.298 3.654 0.704 0.273 0.977 9,707
Madera CountyStructures
2013 Total 0.000 0.000 0.000 0.000 0.000 0.000 0.000 0.000 0.000 0.000 0 3.271 38.730 8.299 0.003 2.817 0.338 3.155 0.590 0.310 0.901 8,8562014 Total 0.000 0.000 0.000 0.000 0.000 0.000 0.000 0.000 0.000 0.000 0 1.550 17.489 3.501 0.002 1.299 0.177 1.476 0.273 0.162 0.435 3,681
Projects > 2.5 miles
2014 Total 0.000 0.000 0.000 0.000 0.000 0.000 0.000 0.000 0.000 0.000 0 0.000 0.000 0.000 0.000 0.000 0.000 0.000 0.000 0.000 0.000 02015 Total 0.000 0.000 0.000 0.000 0.000 0.000 0.000 0.000 0.000 0.000 0 0.000 0.000 0.000 0.000 0.000 0.000 0.000 0.000 0.000 0.000 02016 Total 0.000 0.000 0.000 0.000 0.000 0.000 0.000 0.000 0.000 0.000 0 0.000 0.000 0.000 0.000 0.000 0.000 0.000 0.000 0.000 0.000 0
Projects < 2.5 miles
2015 Total 0.000 0.000 0.000 0.000 0.000 0.000 0.000 0.000 0.000 0.000 0 0.000 0.000 0.000 0.000 0.000 0.000 0.000 0.000 0.000 0.000 02016 Total 0.000 0.000 0.000 0.000 0.000 0.000 0.000 0.000 0.000 0.000 0 0.000 0.000 0.000 0.000 0.000 0.000 0.000 0.000 0.000 0.000 0
Projects < 1 mile
2017 Total 0.000 0.000 0.000 0.000 0.000 0.000 0.000 0.000 0.000 0.000 0 1.140 14.807 2.449 0.002 1.221 0.108 1.329 0.256 0.099 0.355 3,530
Merced CountyStructures
2013 Total 0.242 2.869 0.615 0.000 0.209 0.025 0.234 0.044 0.023 0.067 656 0.363 4.303 0.922 0.000 0.313 0.038 0.351 0.066 0.034 0.100 9842014 Total 0.115 1.295 0.259 0.000 0.096 0.013 0.109 0.020 0.012 0.032 273 0.172 1.943 0.389 0.000 0.144 0.020 0.164 0.030 0.018 0.048 409
Projects > 2.5 miles
2014 Total 0.000 0.000 0.000 0.000 0.000 0.000 0.000 0.000 0.000 0.000 0 0.145 1.952 0.336 0.000 0.106 0.013 0.119 0.022 0.012 0.034 4002015 Total 0.000 0.000 0.000 0.000 0.000 0.000 0.000 0.000 0.000 0.000 0 0.237 3.313 0.526 0.001 0.181 0.022 0.203 0.038 0.020 0.058 6802016 Total 0.000 0.000 0.000 0.000 0.000 0.000 0.000 0.000 0.000 0.000 0 0.223 2.415 0.429 0.001 0.099 0.020 0.119 0.021 0.018 0.039 481
Projects < 2.5 miles
2015 Total 0.000 0.000 0.000 0.000 0.000 0.000 0.000 0.000 0.000 0.000 0 0.192 2.553 0.448 0.000 0.180 0.018 0.198 0.038 0.017 0.054 5692016 Total 0.000 0.000 0.000 0.000 0.000 0.000 0.000 0.000 0.000 0.000 0 0.165 1.927 0.342 0.000 0.127 0.016 0.144 0.027 0.015 0.042 416
Projects < 1 mile
2017 Total 0.142 1.851 0.306 0.000 0.153 0.014 0.166 0.032 0.012 0.044 441 0.285 3.702 0.612 0.000 0.305 0.027 0.332 0.064 0.025 0.089 882
Sum of All Projects2013 Total 0.485 5.738 1.229 0.000 0.417 0.050 0.467 0.087 0.046 0.133 1,312 4.967 58.812 12.602 0.004 4.277 0.514 4.791 0.896 0.471 1.368 13,4482014 Total 0.230 2.591 0.519 0.000 0.192 0.026 0.219 0.040 0.024 0.064 545 2.645 30.461 5.989 0.003 2.185 0.295 2.479 0.459 0.270 0.729 6,3902015 Total 0.192 2.553 0.448 0.000 0.180 0.018 0.198 0.038 0.017 0.054 569 0.666 9.179 1.499 0.001 0.542 0.063 0.604 0.114 0.057 0.171 1,9292016 Total 0.165 1.927 0.342 0.000 0.127 0.016 0.144 0.027 0.015 0.042 416 0.612 6.756 1.201 0.002 0.326 0.056 0.382 0.069 0.051 0.120 1,3772017 Total 0.712 9.255 1.531 0.001 0.763 0.068 0.831 0.160 0.062 0.222 2,206 4.559 59.230 9.797 0.006 4.882 0.433 5.315 1.024 0.397 1.421 14,120
Notes:1. Roadway projects included in the RTP will not be summed into the project's total emissions as they would happen with or without construction of the HST.2. Roadway projects not included in the RTP will be summed into the project's total emissions as they are only occurring due to HST construction.3. URBEMIS2007 results were multiplied by the number of roadway projects, meeting the length designation, within each county. The number of roadway projects are tabulated on the Roadway tabs in the Data Request.
Project TypeCounty Structures > 2.5 miles < 2.5 miles < 1 mile Structures > 2.5 miles < 2.5 miles < 1 mileFresno 2 0 1 4 11 1 0 22Madera 0 0 0 0 27 0 0 8Merced 2 0 0 1 3 1 1 2
Included in the RTP Not Included in the RTP
Construction Phase 3
RTP Included Emissions (tpy) 1 Non-RTP Included Emissions (tpy) 2
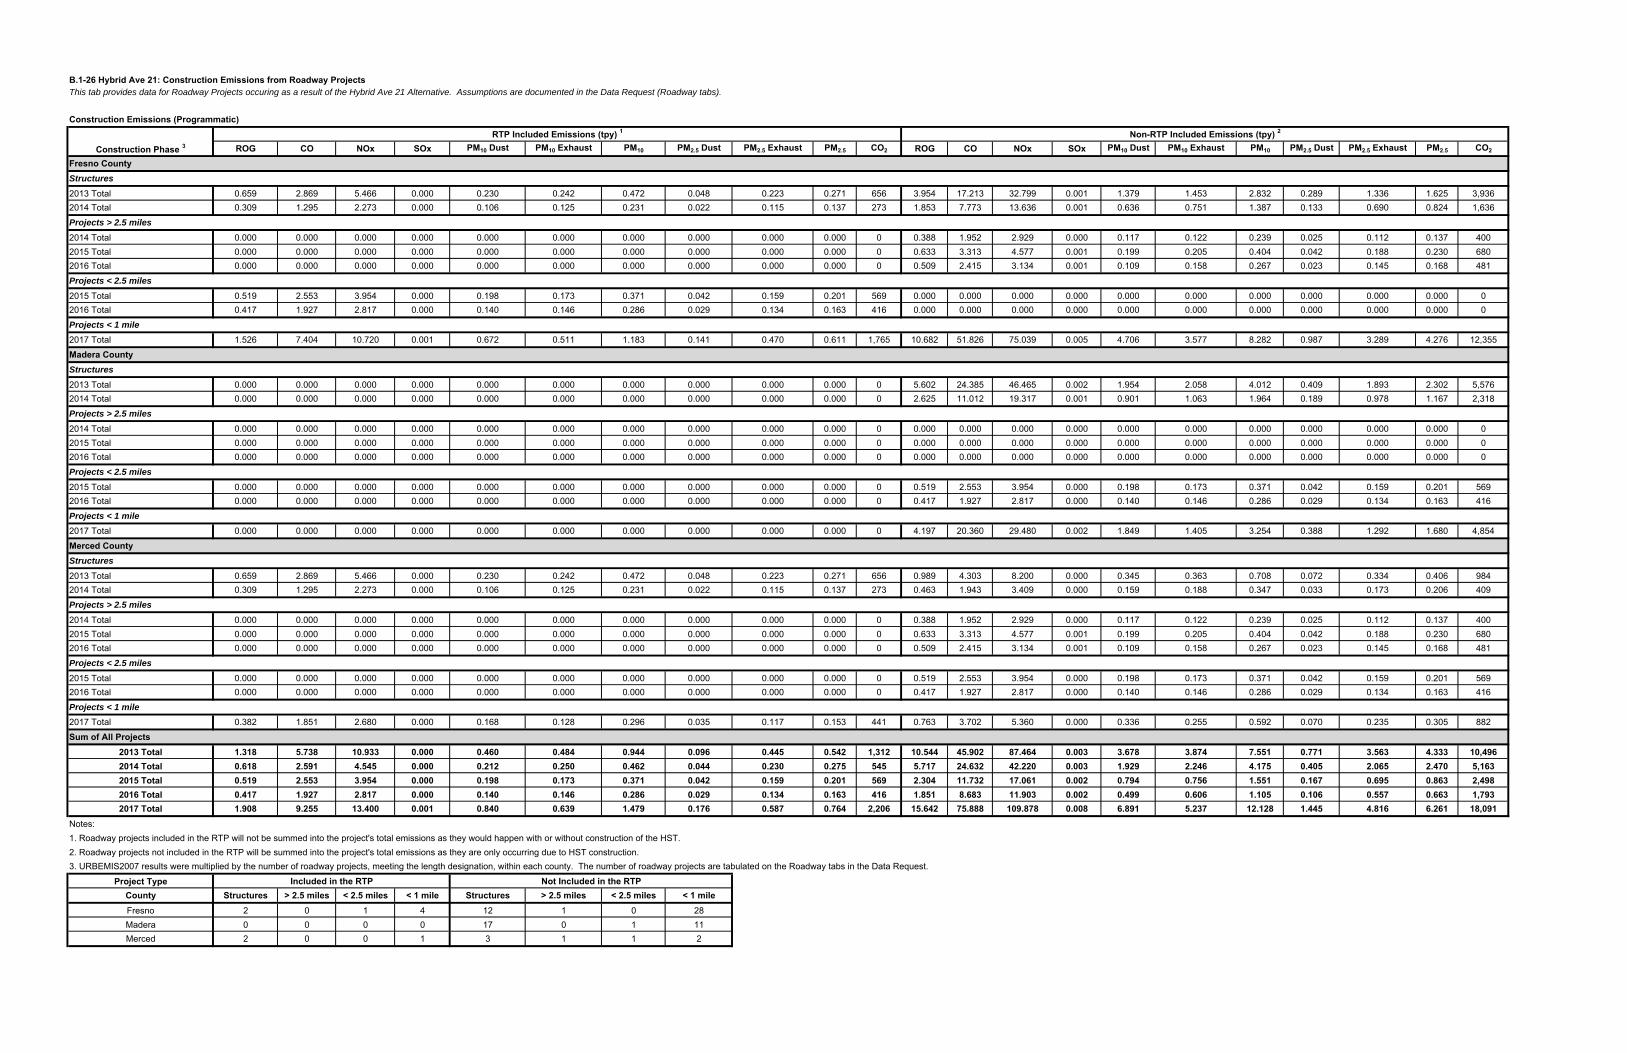
B.1-26 Hybrid Ave 21: Construction Emissions from Roadway ProjectsThis tab provides data for Roadway Projects occuring as a result of the Hybrid Ave 21 Alternative. Assumptions are documented in the Data Request (Roadway tabs).
Construction Emissions (Programmatic)
ROG CO NOx SOx PM10 Dust PM10 Exhaust PM10 PM2.5 Dust PM2.5 Exhaust PM2.5 CO2 ROG CO NOx SOx PM10 Dust PM10 Exhaust PM10 PM2.5 Dust PM2.5 Exhaust PM2.5 CO2
Fresno CountyStructures
2013 Total 0.659 2.869 5.466 0.000 0.230 0.242 0.472 0.048 0.223 0.271 656 3.954 17.213 32.799 0.001 1.379 1.453 2.832 0.289 1.336 1.625 3,9362014 Total 0.309 1.295 2.273 0.000 0.106 0.125 0.231 0.022 0.115 0.137 273 1.853 7.773 13.636 0.001 0.636 0.751 1.387 0.133 0.690 0.824 1,636
Projects > 2.5 miles
2014 Total 0.000 0.000 0.000 0.000 0.000 0.000 0.000 0.000 0.000 0.000 0 0.388 1.952 2.929 0.000 0.117 0.122 0.239 0.025 0.112 0.137 4002015 Total 0.000 0.000 0.000 0.000 0.000 0.000 0.000 0.000 0.000 0.000 0 0.633 3.313 4.577 0.001 0.199 0.205 0.404 0.042 0.188 0.230 6802016 Total 0.000 0.000 0.000 0.000 0.000 0.000 0.000 0.000 0.000 0.000 0 0.509 2.415 3.134 0.001 0.109 0.158 0.267 0.023 0.145 0.168 481
Projects < 2.5 miles
2015 Total 0.519 2.553 3.954 0.000 0.198 0.173 0.371 0.042 0.159 0.201 569 0.000 0.000 0.000 0.000 0.000 0.000 0.000 0.000 0.000 0.000 02016 Total 0.417 1.927 2.817 0.000 0.140 0.146 0.286 0.029 0.134 0.163 416 0.000 0.000 0.000 0.000 0.000 0.000 0.000 0.000 0.000 0.000 0
Projects < 1 mile
2017 Total 1.526 7.404 10.720 0.001 0.672 0.511 1.183 0.141 0.470 0.611 1,765 10.682 51.826 75.039 0.005 4.706 3.577 8.282 0.987 3.289 4.276 12,355
Madera CountyStructures
2013 Total 0.000 0.000 0.000 0.000 0.000 0.000 0.000 0.000 0.000 0.000 0 5.602 24.385 46.465 0.002 1.954 2.058 4.012 0.409 1.893 2.302 5,5762014 Total 0.000 0.000 0.000 0.000 0.000 0.000 0.000 0.000 0.000 0.000 0 2.625 11.012 19.317 0.001 0.901 1.063 1.964 0.189 0.978 1.167 2,318
Projects > 2.5 miles
2014 Total 0.000 0.000 0.000 0.000 0.000 0.000 0.000 0.000 0.000 0.000 0 0.000 0.000 0.000 0.000 0.000 0.000 0.000 0.000 0.000 0.000 02015 Total 0.000 0.000 0.000 0.000 0.000 0.000 0.000 0.000 0.000 0.000 0 0.000 0.000 0.000 0.000 0.000 0.000 0.000 0.000 0.000 0.000 02016 Total 0.000 0.000 0.000 0.000 0.000 0.000 0.000 0.000 0.000 0.000 0 0.000 0.000 0.000 0.000 0.000 0.000 0.000 0.000 0.000 0.000 0
Projects < 2.5 miles
2015 Total 0.000 0.000 0.000 0.000 0.000 0.000 0.000 0.000 0.000 0.000 0 0.519 2.553 3.954 0.000 0.198 0.173 0.371 0.042 0.159 0.201 5692016 Total 0.000 0.000 0.000 0.000 0.000 0.000 0.000 0.000 0.000 0.000 0 0.417 1.927 2.817 0.000 0.140 0.146 0.286 0.029 0.134 0.163 416
Projects < 1 mile
2017 Total 0.000 0.000 0.000 0.000 0.000 0.000 0.000 0.000 0.000 0.000 0 4.197 20.360 29.480 0.002 1.849 1.405 3.254 0.388 1.292 1.680 4,854
Merced CountyStructures
2013 Total 0.659 2.869 5.466 0.000 0.230 0.242 0.472 0.048 0.223 0.271 656 0.989 4.303 8.200 0.000 0.345 0.363 0.708 0.072 0.334 0.406 9842014 Total 0.309 1.295 2.273 0.000 0.106 0.125 0.231 0.022 0.115 0.137 273 0.463 1.943 3.409 0.000 0.159 0.188 0.347 0.033 0.173 0.206 409
Projects > 2.5 miles
2014 Total 0.000 0.000 0.000 0.000 0.000 0.000 0.000 0.000 0.000 0.000 0 0.388 1.952 2.929 0.000 0.117 0.122 0.239 0.025 0.112 0.137 4002015 Total 0.000 0.000 0.000 0.000 0.000 0.000 0.000 0.000 0.000 0.000 0 0.633 3.313 4.577 0.001 0.199 0.205 0.404 0.042 0.188 0.230 6802016 Total 0.000 0.000 0.000 0.000 0.000 0.000 0.000 0.000 0.000 0.000 0 0.509 2.415 3.134 0.001 0.109 0.158 0.267 0.023 0.145 0.168 481
Projects < 2.5 miles
2015 Total 0.000 0.000 0.000 0.000 0.000 0.000 0.000 0.000 0.000 0.000 0 0.519 2.553 3.954 0.000 0.198 0.173 0.371 0.042 0.159 0.201 5692016 Total 0.000 0.000 0.000 0.000 0.000 0.000 0.000 0.000 0.000 0.000 0 0.417 1.927 2.817 0.000 0.140 0.146 0.286 0.029 0.134 0.163 416
Projects < 1 mile
2017 Total 0.382 1.851 2.680 0.000 0.168 0.128 0.296 0.035 0.117 0.153 441 0.763 3.702 5.360 0.000 0.336 0.255 0.592 0.070 0.235 0.305 882
Sum of All Projects2013 Total 1.318 5.738 10.933 0.000 0.460 0.484 0.944 0.096 0.445 0.542 1,312 10.544 45.902 87.464 0.003 3.678 3.874 7.551 0.771 3.563 4.333 10,4962014 Total 0.618 2.591 4.545 0.000 0.212 0.250 0.462 0.044 0.230 0.275 545 5.717 24.632 42.220 0.003 1.929 2.246 4.175 0.405 2.065 2.470 5,1632015 Total 0.519 2.553 3.954 0.000 0.198 0.173 0.371 0.042 0.159 0.201 569 2.304 11.732 17.061 0.002 0.794 0.756 1.551 0.167 0.695 0.863 2,4982016 Total 0.417 1.927 2.817 0.000 0.140 0.146 0.286 0.029 0.134 0.163 416 1.851 8.683 11.903 0.002 0.499 0.606 1.105 0.106 0.557 0.663 1,7932017 Total 1.908 9.255 13.400 0.001 0.840 0.639 1.479 0.176 0.587 0.764 2,206 15.642 75.888 109.878 0.008 6.891 5.237 12.128 1.445 4.816 6.261 18,091
Notes:1. Roadway projects included in the RTP will not be summed into the project's total emissions as they would happen with or without construction of the HST.2. Roadway projects not included in the RTP will be summed into the project's total emissions as they are only occurring due to HST construction.3. URBEMIS2007 results were multiplied by the number of roadway projects, meeting the length designation, within each county. The number of roadway projects are tabulated on the Roadway tabs in the Data Request.
Project TypeCounty Structures > 2.5 miles < 2.5 miles < 1 mile Structures > 2.5 miles < 2.5 miles < 1 mileFresno 2 0 1 4 12 1 0 28Madera 0 0 0 0 17 0 1 11Merced 2 0 0 1 3 1 1 2
Construction Phase 3
RTP Included Emissions (tpy) 1 Non-RTP Included Emissions (tpy) 2
Included in the RTP Not Included in the RTP

B.1-26 Hybrid Ave 21: Construction Emissions from Roadway ProjectsThis tab provides data for Roadway Projects occuring as a result of the Hybrid Ave 21 Alternative. Assumptions are documented in the Data Request (Roadway tabs).
Construction Emissions (Mitigated)
ROG CO NOx SOx PM10 Dust PM10 Exhaust PM10 PM2.5 Dust PM2.5 Exhaust PM2.5 CO2 ROG CO NOx SOx PM10 Dust PM10 Exhaust PM10 PM2.5 Dust PM2.5 Exhaust PM2.5 CO2
Fresno CountyStructures
2013 Total 0.242 2.869 0.615 0.000 0.209 0.025 0.234 0.044 0.023 0.067 656 1.454 17.213 3.688 0.001 1.252 0.150 1.402 0.262 0.138 0.400 3,9362014 Total 0.115 1.295 0.259 0.000 0.096 0.013 0.109 0.020 0.012 0.032 273 0.689 7.773 1.556 0.001 0.577 0.079 0.656 0.121 0.072 0.193 1,636
Projects > 2.5 miles
2014 Total 0.000 0.000 0.000 0.000 0.000 0.000 0.000 0.000 0.000 0.000 0 0.145 1.952 0.336 0.000 0.106 0.013 0.119 0.022 0.012 0.034 4002015 Total 0.000 0.000 0.000 0.000 0.000 0.000 0.000 0.000 0.000 0.000 0 0.237 3.313 0.526 0.001 0.181 0.022 0.203 0.038 0.020 0.058 6802016 Total 0.000 0.000 0.000 0.000 0.000 0.000 0.000 0.000 0.000 0.000 0 0.223 2.415 0.429 0.001 0.099 0.020 0.119 0.021 0.018 0.039 481
Projects < 2.5 miles
2015 Total 0.192 2.553 0.448 0.000 0.180 0.018 0.198 0.038 0.017 0.054 569 0.000 0.000 0.000 0.000 0.000 0.000 0.000 0.000 0.000 0.000 02016 Total 0.165 1.927 0.342 0.000 0.127 0.016 0.144 0.027 0.015 0.042 416 0.000 0.000 0.000 0.000 0.000 0.000 0.000 0.000 0.000 0.000 0
Projects < 1 mile
2017 Total 0.570 7.404 1.225 0.001 0.610 0.054 0.664 0.128 0.050 0.178 1,765 3.989 51.826 8.572 0.005 4.272 0.379 4.651 0.896 0.347 1.243 12,355
Madera CountyStructures
2013 Total 0.000 0.000 0.000 0.000 0.000 0.000 0.000 0.000 0.000 0.000 0 2.059 24.385 5.225 0.002 1.773 0.213 1.987 0.372 0.195 0.567 5,5762014 Total 0.000 0.000 0.000 0.000 0.000 0.000 0.000 0.000 0.000 0.000 0 0.976 11.012 2.204 0.001 0.818 0.111 0.929 0.172 0.102 0.274 2,318
Projects > 2.5 miles
2014 Total 0.000 0.000 0.000 0.000 0.000 0.000 0.000 0.000 0.000 0.000 0 0.000 0.000 0.000 0.000 0.000 0.000 0.000 0.000 0.000 0.000 02015 Total 0.000 0.000 0.000 0.000 0.000 0.000 0.000 0.000 0.000 0.000 0 0.000 0.000 0.000 0.000 0.000 0.000 0.000 0.000 0.000 0.000 02016 Total 0.000 0.000 0.000 0.000 0.000 0.000 0.000 0.000 0.000 0.000 0 0.000 0.000 0.000 0.000 0.000 0.000 0.000 0.000 0.000 0.000 0
Projects < 2.5 miles
2015 Total 0.000 0.000 0.000 0.000 0.000 0.000 0.000 0.000 0.000 0.000 0 0.192 2.553 0.448 0.000 0.180 0.018 0.198 0.038 0.017 0.054 5692016 Total 0.000 0.000 0.000 0.000 0.000 0.000 0.000 0.000 0.000 0.000 0 0.165 1.927 0.342 0.000 0.127 0.016 0.144 0.027 0.015 0.042 416
Projects < 1 mile
2017 Total 0.000 0.000 0.000 0.000 0.000 0.000 0.000 0.000 0.000 0.000 0 1.567 20.360 3.368 0.002 1.678 0.149 1.827 0.352 0.136 0.488 4,854
Merced CountyStructures
2013 Total 0.242 2.869 0.615 0.000 0.209 0.025 0.234 0.044 0.023 0.067 656 0.363 4.303 0.922 0.000 0.313 0.038 0.351 0.066 0.034 0.100 9842014 Total 0.115 1.295 0.259 0.000 0.096 0.013 0.109 0.020 0.012 0.032 273 0.172 1.943 0.389 0.000 0.144 0.020 0.164 0.030 0.018 0.048 409
Projects > 2.5 miles
2014 Total 0.000 0.000 0.000 0.000 0.000 0.000 0.000 0.000 0.000 0.000 0 0.145 1.952 0.336 0.000 0.106 0.013 0.119 0.022 0.012 0.034 4002015 Total 0.000 0.000 0.000 0.000 0.000 0.000 0.000 0.000 0.000 0.000 0 0.237 3.313 0.526 0.001 0.181 0.022 0.203 0.038 0.020 0.058 6802016 Total 0.000 0.000 0.000 0.000 0.000 0.000 0.000 0.000 0.000 0.000 0 0.223 2.415 0.429 0.001 0.099 0.020 0.119 0.021 0.018 0.039 481
Projects < 2.5 miles
2015 Total 0.000 0.000 0.000 0.000 0.000 0.000 0.000 0.000 0.000 0.000 0 0.192 2.553 0.448 0.000 0.180 0.018 0.198 0.038 0.017 0.054 5692016 Total 0.000 0.000 0.000 0.000 0.000 0.000 0.000 0.000 0.000 0.000 0 0.165 1.927 0.342 0.000 0.127 0.016 0.144 0.027 0.015 0.042 416
Projects < 1 mile
2017 Total 0.142 1.851 0.306 0.000 0.153 0.014 0.166 0.032 0.012 0.044 441 0.285 3.702 0.612 0.000 0.305 0.027 0.332 0.064 0.025 0.089 882
Sum of All Projects2013 Total 0.485 5.738 1.229 0.000 0.417 0.050 0.467 0.087 0.046 0.133 1,312 3.876 45.902 9.836 0.003 3.338 0.401 3.739 0.700 0.368 1.068 10,4962014 Total 0.230 2.591 0.519 0.000 0.192 0.026 0.219 0.040 0.024 0.064 545 2.128 24.632 4.822 0.003 1.752 0.236 1.988 0.368 0.216 0.584 5,1632015 Total 0.192 2.553 0.448 0.000 0.180 0.018 0.198 0.038 0.017 0.054 569 0.858 11.732 1.947 0.002 0.721 0.081 0.802 0.152 0.074 0.226 2,4982016 Total 0.165 1.927 0.342 0.000 0.127 0.016 0.144 0.027 0.015 0.042 416 0.777 8.683 1.543 0.002 0.453 0.072 0.525 0.096 0.066 0.162 1,7932017 Total 0.712 9.255 1.531 0.001 0.763 0.068 0.831 0.160 0.062 0.222 2,206 5.841 75.888 12.552 0.008 6.255 0.555 6.810 1.312 0.508 1.821 18,091
Notes:1. Roadway projects included in the RTP will not be summed into the project's total emissions as they would happen with or without construction of the HST.2. Roadway projects not included in the RTP will be summed into the project's total emissions as they are only occurring due to HST construction.3. URBEMIS2007 results were multiplied by the number of roadway projects, meeting the length designation, within each county. The number of roadway projects are tabulated on the Roadway tabs in the Data Request.
Project TypeCounty Structures > 2.5 miles < 2.5 miles < 1 mile Structures > 2.5 miles < 2.5 miles < 1 mileFresno 2 0 1 4 12 1 0 28Madera 0 0 0 0 17 0 1 11Merced 2 0 0 1 3 1 1 2
Included in the RTP Not Included in the RTP
Construction Phase 3
RTP Included Emissions (tpy) 1 Non-RTP Included Emissions (tpy) 2
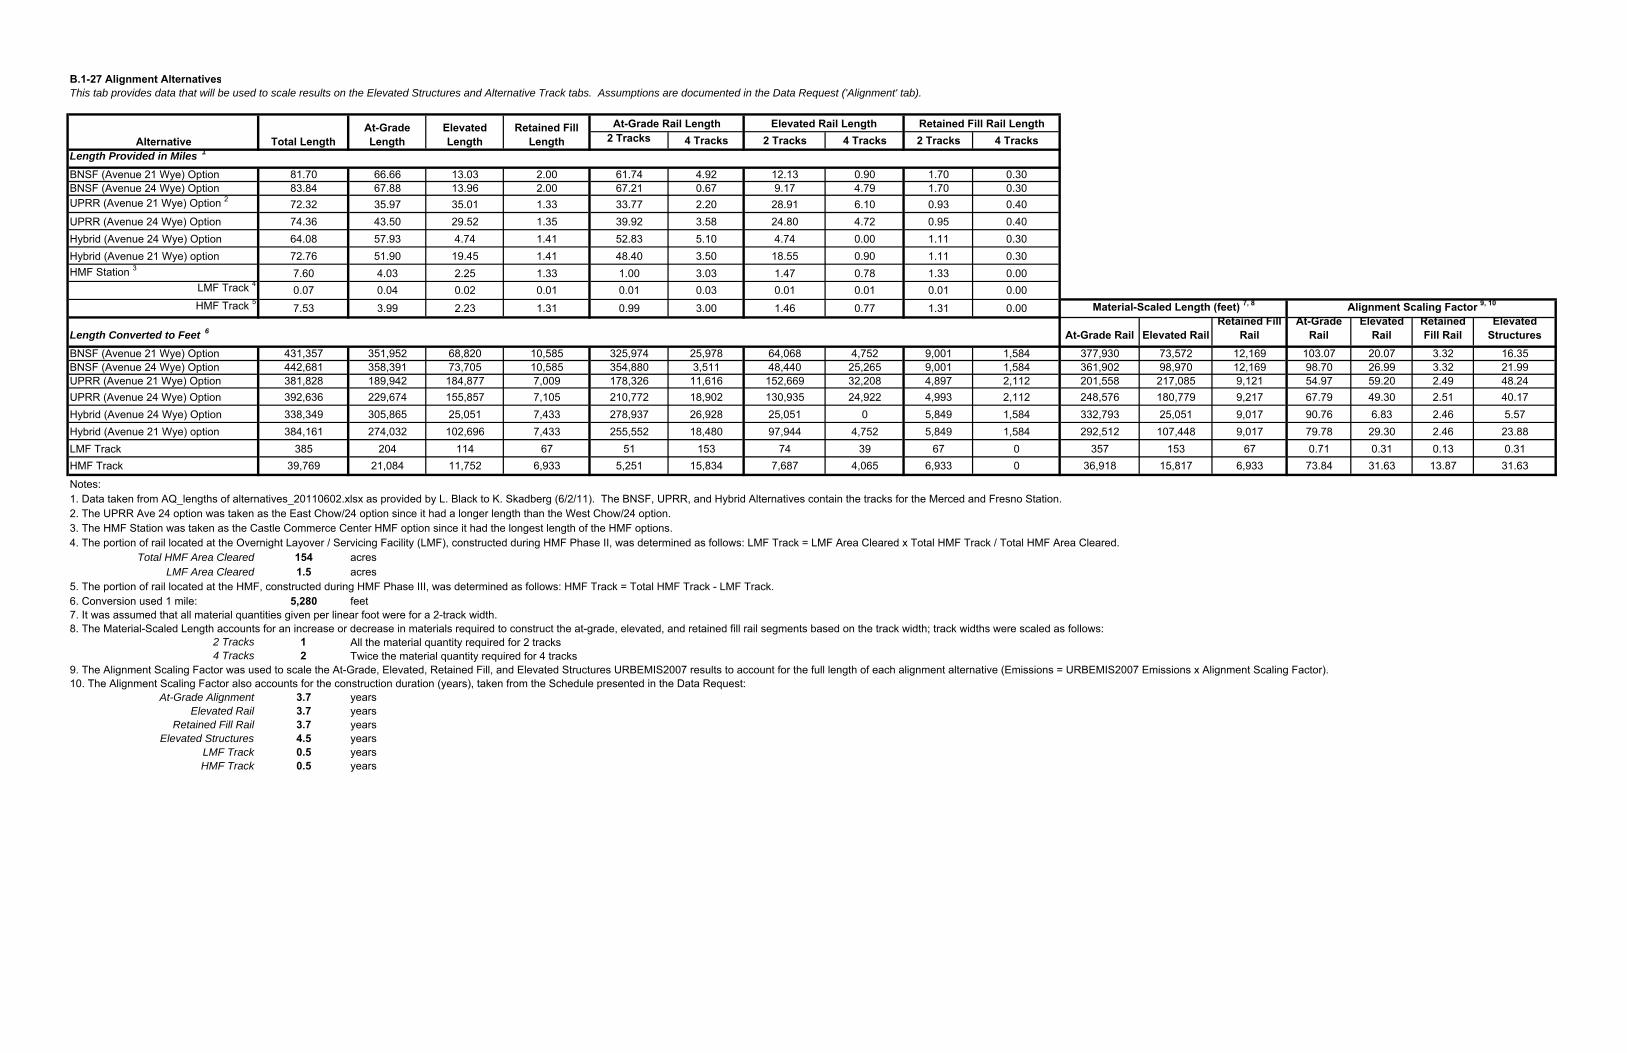
B.1-27 Alignment AlternativesThis tab provides data that will be used to scale results on the Elevated Structures and Alternative Track tabs. Assumptions are documented in the Data Request ('Alignment' tab).
2 Tracks 4 Tracks 2 Tracks 4 Tracks 2 Tracks 4 TracksLength Provided in Miles 1
BNSF (Avenue 21 Wye) Option 81.70 66.66 13.03 2.00 61.74 4.92 12.13 0.90 1.70 0.30BNSF (Avenue 24 Wye) Option 83.84 67.88 13.96 2.00 67.21 0.67 9.17 4.79 1.70 0.30UPRR (Avenue 21 Wye) Option 2 72.32 35.97 35.01 1.33 33.77 2.20 28.91 6.10 0.93 0.40UPRR (Avenue 24 Wye) Option 74.36 43.50 29.52 1.35 39.92 3.58 24.80 4.72 0.95 0.40Hybrid (Avenue 24 Wye) Option 64.08 57.93 4.74 1.41 52.83 5.10 4.74 0.00 1.11 0.30Hybrid (Avenue 21 Wye) option 72.76 51.90 19.45 1.41 48.40 3.50 18.55 0.90 1.11 0.30HMF Station 3 7.60 4.03 2.25 1.33 1.00 3.03 1.47 0.78 1.33 0.00
LMF Track 4 0.07 0.04 0.02 0.01 0.01 0.03 0.01 0.01 0.01 0.00HMF Track 5 7.53 3.99 2.23 1.31 0.99 3.00 1.46 0.77 1.31 0.00
Length Converted to Feet 6 At-Grade Rail Elevated RailRetained Fill
RailAt-Grade
RailElevated
RailRetained Fill Rail
Elevated Structures
BNSF (Avenue 21 Wye) Option 431,357 351,952 68,820 10,585 325,974 25,978 64,068 4,752 9,001 1,584 377,930 73,572 12,169 103.07 20.07 3.32 16.35BNSF (Avenue 24 Wye) Option 442,681 358,391 73,705 10,585 354,880 3,511 48,440 25,265 9,001 1,584 361,902 98,970 12,169 98.70 26.99 3.32 21.99UPRR (Avenue 21 Wye) Option 381,828 189,942 184,877 7,009 178,326 11,616 152,669 32,208 4,897 2,112 201,558 217,085 9,121 54.97 59.20 2.49 48.24UPRR (Avenue 24 Wye) Option 392,636 229,674 155,857 7,105 210,772 18,902 130,935 24,922 4,993 2,112 248,576 180,779 9,217 67.79 49.30 2.51 40.17Hybrid (Avenue 24 Wye) Option 338,349 305,865 25,051 7,433 278,937 26,928 25,051 0 5,849 1,584 332,793 25,051 9,017 90.76 6.83 2.46 5.57Hybrid (Avenue 21 Wye) option 384,161 274,032 102,696 7,433 255,552 18,480 97,944 4,752 5,849 1,584 292,512 107,448 9,017 79.78 29.30 2.46 23.88LMF Track 385 204 114 67 51 153 74 39 67 0 357 153 67 0.71 0.31 0.13 0.31HMF Track 39,769 21,084 11,752 6,933 5,251 15,834 7,687 4,065 6,933 0 36,918 15,817 6,933 73.84 31.63 13.87 31.63
Notes:1. Data taken from AQ_lengths of alternatives_20110602.xlsx as provided by L. Black to K. Skadberg (6/2/11). The BNSF, UPRR, and Hybrid Alternatives contain the tracks for the Merced and Fresno Station.2. The UPRR Ave 24 option was taken as the East Chow/24 option since it had a longer length than the West Chow/24 option.3. The HMF Station was taken as the Castle Commerce Center HMF option since it had the longest length of the HMF options.4. The portion of rail located at the Overnight Layover / Servicing Facility (LMF), constructed during HMF Phase II, was determined as follows: LMF Track = LMF Area Cleared x Total HMF Track / Total HMF Area Cleared.
Total HMF Area Cleared 154 acresLMF Area Cleared 1.5 acres
5. The portion of rail located at the HMF, constructed during HMF Phase III, was determined as follows: HMF Track = Total HMF Track - LMF Track.6. Conversion used 1 mile: 5,280 feet
8. The Material-Scaled Length accounts for an increase or decrease in materials required to construct the at-grade, elevated, and retained fill rail segments based on the track width; track widths were scaled as follows:2 Tracks 1 All the material quantity required for 2 tracks4 Tracks 2 Twice the material quantity required for 4 tracks
9. The Alignment Scaling Factor was used to scale the At-Grade, Elevated, Retained Fill, and Elevated Structures URBEMIS2007 results to account for the full length of each alignment alternative (Emissions = URBEMIS2007 Emissions x Alignment Scaling Factor).10. The Alignment Scaling Factor also accounts for the construction duration (years), taken from the Schedule presented in the Data Request:
At-Grade Alignment 3.7 yearsElevated Rail 3.7 years
Retained Fill Rail 3.7 yearsElevated Structures 4.5 years
LMF Track 0.5 yearsHMF Track 0.5 years
7. It was assumed that all material quantities given per linear foot were for a 2-track width.
Alignment Scaling Factor 9, 10Material-Scaled Length (feet) 7, 8
Alternative Total LengthElevated Length
At-Grade Length
Retained Fill Rail LengthElevated Rail LengthAt-Grade Rail LengthRetained Fill Length

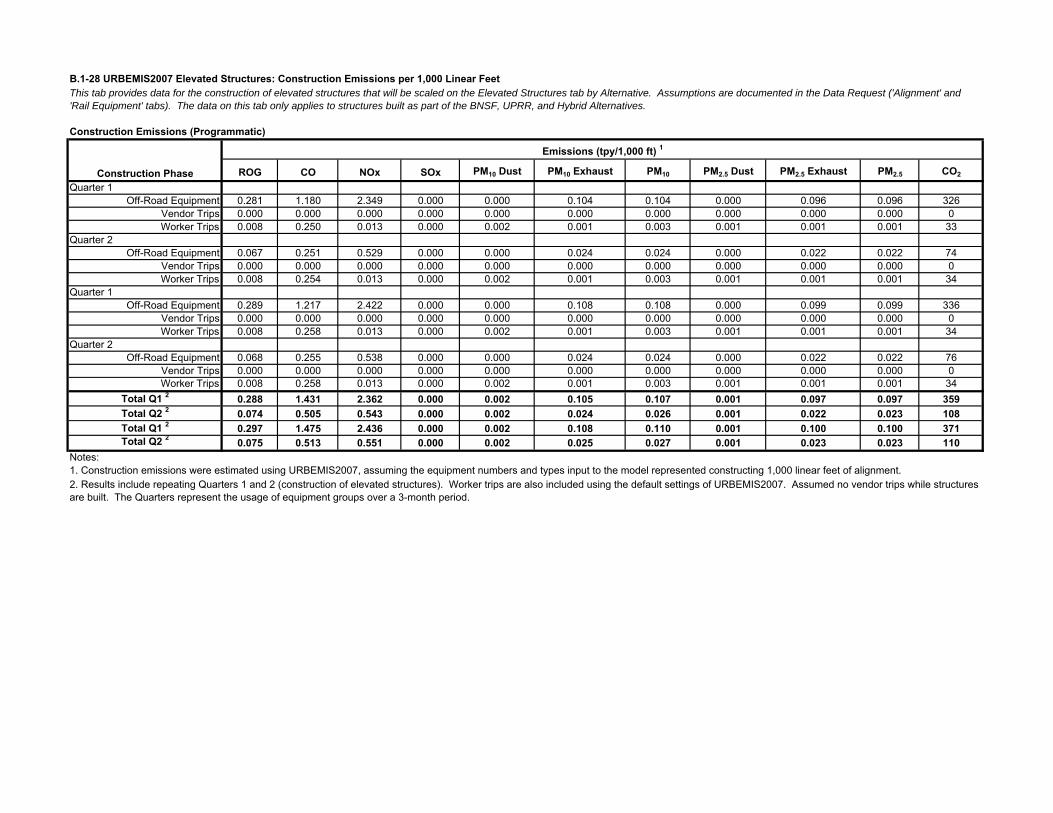
B.1-28 URBEMIS2007 Elevated Structures: Construction Emissions per 1,000 Linear Feet
Construction Emissions (Programmatic)
ROG CO NOx SOx PM10 Dust PM10 Exhaust PM10 PM2.5 Dust PM2.5 Exhaust PM2.5 CO2
Quarter 1Off-Road Equipment 0.281 1.180 2.349 0.000 0.000 0.104 0.104 0.000 0.096 0.096 326
Vendor Trips 0.000 0.000 0.000 0.000 0.000 0.000 0.000 0.000 0.000 0.000 0Worker Trips 0.008 0.250 0.013 0.000 0.002 0.001 0.003 0.001 0.001 0.001 33
Quarter 2Off-Road Equipment 0.067 0.251 0.529 0.000 0.000 0.024 0.024 0.000 0.022 0.022 74
Vendor Trips 0.000 0.000 0.000 0.000 0.000 0.000 0.000 0.000 0.000 0.000 0Worker Trips 0.008 0.254 0.013 0.000 0.002 0.001 0.003 0.001 0.001 0.001 34
Quarter 1Off-Road Equipment 0.289 1.217 2.422 0.000 0.000 0.108 0.108 0.000 0.099 0.099 336
Vendor Trips 0.000 0.000 0.000 0.000 0.000 0.000 0.000 0.000 0.000 0.000 0Worker Trips 0.008 0.258 0.013 0.000 0.002 0.001 0.003 0.001 0.001 0.001 34
Quarter 2Off-Road Equipment 0.068 0.255 0.538 0.000 0.000 0.024 0.024 0.000 0.022 0.022 76
Vendor Trips 0.000 0.000 0.000 0.000 0.000 0.000 0.000 0.000 0.000 0.000 0Worker Trips 0.008 0.258 0.013 0.000 0.002 0.001 0.003 0.001 0.001 0.001 34
Total Q1 2 0.288 1.431 2.362 0.000 0.002 0.105 0.107 0.001 0.097 0.097 359Total Q2 2 0.074 0.505 0.543 0.000 0.002 0.024 0.026 0.001 0.022 0.023 108Total Q1 2 0.297 1.475 2.436 0.000 0.002 0.108 0.110 0.001 0.100 0.100 371Total Q2 2 0.075 0.513 0.551 0.000 0.002 0.025 0.027 0.001 0.023 0.023 110
Notes:1. Construction emissions were estimated using URBEMIS2007, assuming the equipment numbers and types input to the model represented constructing 1,000 linear feet of alignment.
This tab provides data for the construction of elevated structures that will be scaled on the Elevated Structures tab by Alternative. Assumptions are documented in the Data Request ('Alignment' and 'Rail Equipment' tabs). The data on this tab only applies to structures built as part of the BNSF, UPRR, and Hybrid Alternatives.
Construction Phase
Emissions (tpy/1,000 ft) 1
2. Results include repeating Quarters 1 and 2 (construction of elevated structures). Worker trips are also included using the default settings of URBEMIS2007. Assumed no vendor trips while structures are built. The Quarters represent the usage of equipment groups over a 3-month period.
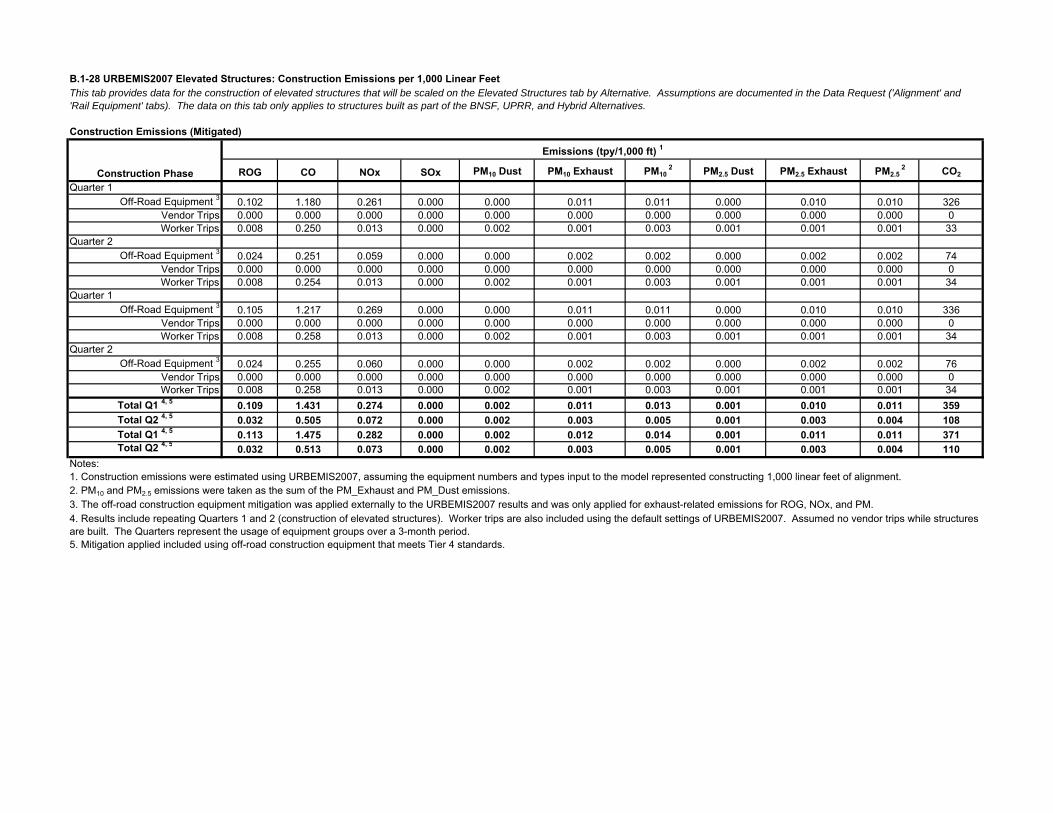
B.1-28 URBEMIS2007 Elevated Structures: Construction Emissions per 1,000 Linear FeetThis tab provides data for the construction of elevated structures that will be scaled on the Elevated Structures tab by Alternative. Assumptions are documented in the Data Request ('Alignment' and 'Rail Equipment' tabs). The data on this tab only applies to structures built as part of the BNSF, UPRR, and Hybrid Alternatives.
Construction Emissions (Mitigated)
ROG CO NOx SOx PM10 Dust PM10 Exhaust PM10 2 PM2.5 Dust PM2.5 Exhaust PM2.5
2 CO2
Quarter 1Off-Road Equipment 3 0.102 1.180 0.261 0.000 0.000 0.011 0.011 0.000 0.010 0.010 326
Vendor Trips 0.000 0.000 0.000 0.000 0.000 0.000 0.000 0.000 0.000 0.000 0Worker Trips 0.008 0.250 0.013 0.000 0.002 0.001 0.003 0.001 0.001 0.001 33
Quarter 2Off-Road Equipment 3 0.024 0.251 0.059 0.000 0.000 0.002 0.002 0.000 0.002 0.002 74
Vendor Trips 0.000 0.000 0.000 0.000 0.000 0.000 0.000 0.000 0.000 0.000 0Worker Trips 0.008 0.254 0.013 0.000 0.002 0.001 0.003 0.001 0.001 0.001 34
Quarter 1Off-Road Equipment 3 0.105 1.217 0.269 0.000 0.000 0.011 0.011 0.000 0.010 0.010 336
Vendor Trips 0.000 0.000 0.000 0.000 0.000 0.000 0.000 0.000 0.000 0.000 0Worker Trips 0.008 0.258 0.013 0.000 0.002 0.001 0.003 0.001 0.001 0.001 34
Quarter 2Off-Road Equipment 3 0.024 0.255 0.060 0.000 0.000 0.002 0.002 0.000 0.002 0.002 76
Vendor Trips 0.000 0.000 0.000 0.000 0.000 0.000 0.000 0.000 0.000 0.000 0Worker Trips 0.008 0.258 0.013 0.000 0.002 0.001 0.003 0.001 0.001 0.001 34
Total Q1 4, 5 0.109 1.431 0.274 0.000 0.002 0.011 0.013 0.001 0.010 0.011 359Total Q2 4, 5 0.032 0.505 0.072 0.000 0.002 0.003 0.005 0.001 0.003 0.004 108Total Q1 4, 5 0.113 1.475 0.282 0.000 0.002 0.012 0.014 0.001 0.011 0.011 371Total Q2 4, 5 0.032 0.513 0.073 0.000 0.002 0.003 0.005 0.001 0.003 0.004 110
Notes:1. Construction emissions were estimated using URBEMIS2007, assuming the equipment numbers and types input to the model represented constructing 1,000 linear feet of alignment.2. PM10 and PM2.5 emissions were taken as the sum of the PM_Exhaust and PM_Dust emissions.3. The off-road construction equipment mitigation was applied externally to the URBEMIS2007 results and was only applied for exhaust-related emissions for ROG, NOx, and PM.
5. Mitigation applied included using off-road construction equipment that meets Tier 4 standards.
4. Results include repeating Quarters 1 and 2 (construction of elevated structures). Worker trips are also included using the default settings of URBEMIS2007. Assumed no vendor trips while structures are built. The Quarters represent the usage of equipment groups over a 3-month period.
Construction Phase
Emissions (tpy/1,000 ft) 1
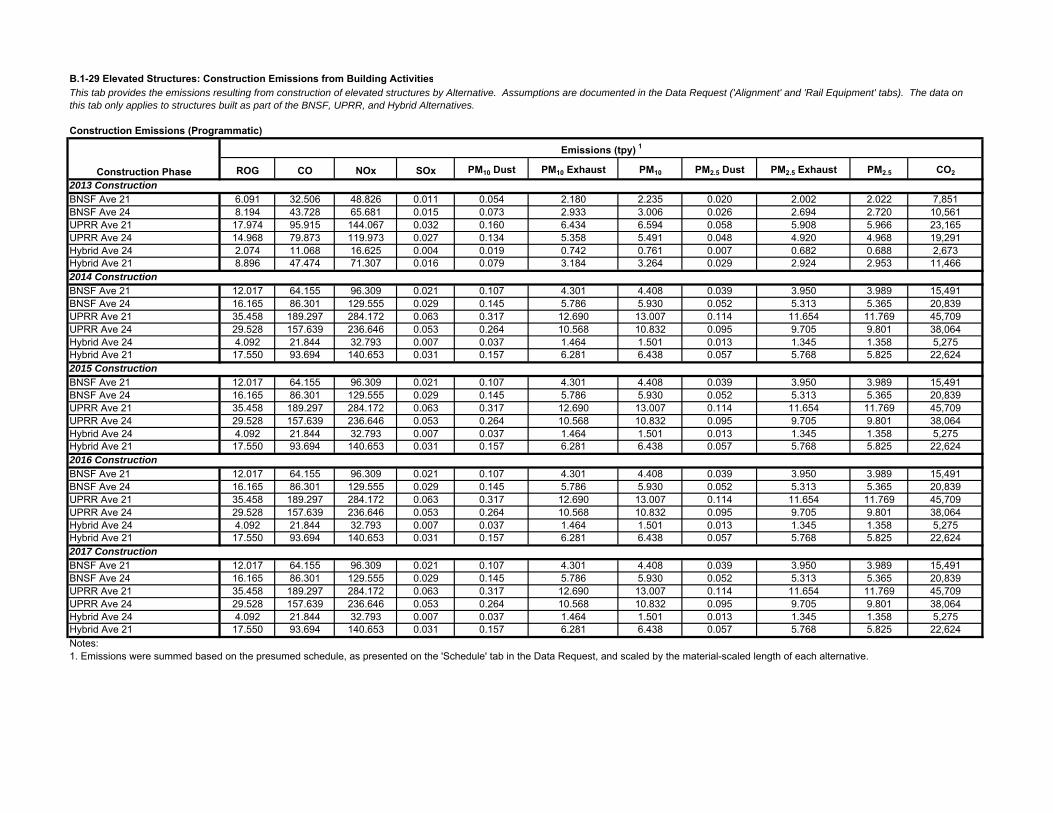
B.1-29 Elevated Structures: Construction Emissions from Building Activities
Construction Emissions (Programmatic)
ROG CO NOx SOx PM10 Dust PM10 Exhaust PM10 PM2.5 Dust PM2.5 Exhaust PM2.5 CO2
2013 ConstructionBNSF Ave 21 6.091 32.506 48.826 0.011 0.054 2.180 2.235 0.020 2.002 2.022 7,851BNSF Ave 24 8.194 43.728 65.681 0.015 0.073 2.933 3.006 0.026 2.694 2.720 10,561UPRR Ave 21 17.974 95.915 144.067 0.032 0.160 6.434 6.594 0.058 5.908 5.966 23,165UPRR Ave 24 14.968 79.873 119.973 0.027 0.134 5.358 5.491 0.048 4.920 4.968 19,291Hybrid Ave 24 2.074 11.068 16.625 0.004 0.019 0.742 0.761 0.007 0.682 0.688 2,673Hybrid Ave 21 8.896 47.474 71.307 0.016 0.079 3.184 3.264 0.029 2.924 2.953 11,4662014 ConstructionBNSF Ave 21 12.017 64.155 96.309 0.021 0.107 4.301 4.408 0.039 3.950 3.989 15,491BNSF Ave 24 16.165 86.301 129.555 0.029 0.145 5.786 5.930 0.052 5.313 5.365 20,839UPRR Ave 21 35.458 189.297 284.172 0.063 0.317 12.690 13.007 0.114 11.654 11.769 45,709UPRR Ave 24 29.528 157.639 236.646 0.053 0.264 10.568 10.832 0.095 9.705 9.801 38,064Hybrid Ave 24 4.092 21.844 32.793 0.007 0.037 1.464 1.501 0.013 1.345 1.358 5,275Hybrid Ave 21 17.550 93.694 140.653 0.031 0.157 6.281 6.438 0.057 5.768 5.825 22,6242015 ConstructionBNSF Ave 21 12.017 64.155 96.309 0.021 0.107 4.301 4.408 0.039 3.950 3.989 15,491BNSF Ave 24 16.165 86.301 129.555 0.029 0.145 5.786 5.930 0.052 5.313 5.365 20,839UPRR Ave 21 35.458 189.297 284.172 0.063 0.317 12.690 13.007 0.114 11.654 11.769 45,709UPRR Ave 24 29.528 157.639 236.646 0.053 0.264 10.568 10.832 0.095 9.705 9.801 38,064Hybrid Ave 24 4.092 21.844 32.793 0.007 0.037 1.464 1.501 0.013 1.345 1.358 5,275Hybrid Ave 21 17.550 93.694 140.653 0.031 0.157 6.281 6.438 0.057 5.768 5.825 22,6242016 ConstructionBNSF Ave 21 12.017 64.155 96.309 0.021 0.107 4.301 4.408 0.039 3.950 3.989 15,491BNSF Ave 24 16.165 86.301 129.555 0.029 0.145 5.786 5.930 0.052 5.313 5.365 20,839UPRR Ave 21 35.458 189.297 284.172 0.063 0.317 12.690 13.007 0.114 11.654 11.769 45,709UPRR Ave 24 29.528 157.639 236.646 0.053 0.264 10.568 10.832 0.095 9.705 9.801 38,064Hybrid Ave 24 4.092 21.844 32.793 0.007 0.037 1.464 1.501 0.013 1.345 1.358 5,275Hybrid Ave 21 17.550 93.694 140.653 0.031 0.157 6.281 6.438 0.057 5.768 5.825 22,6242017 ConstructionBNSF Ave 21 12.017 64.155 96.309 0.021 0.107 4.301 4.408 0.039 3.950 3.989 15,491BNSF Ave 24 16.165 86.301 129.555 0.029 0.145 5.786 5.930 0.052 5.313 5.365 20,839UPRR Ave 21 35.458 189.297 284.172 0.063 0.317 12.690 13.007 0.114 11.654 11.769 45,709UPRR Ave 24 29.528 157.639 236.646 0.053 0.264 10.568 10.832 0.095 9.705 9.801 38,064Hybrid Ave 24 4.092 21.844 32.793 0.007 0.037 1.464 1.501 0.013 1.345 1.358 5,275Hybrid Ave 21 17.550 93.694 140.653 0.031 0.157 6.281 6.438 0.057 5.768 5.825 22,624Notes:1. Emissions were summed based on the presumed schedule, as presented on the 'Schedule' tab in the Data Request, and scaled by the material-scaled length of each alternative.
This tab provides the emissions resulting from construction of elevated structures by Alternative. Assumptions are documented in the Data Request ('Alignment' and 'Rail Equipment' tabs). The data on this tab only applies to structures built as part of the BNSF, UPRR, and Hybrid Alternatives.
Construction Phase
Emissions (tpy) 1
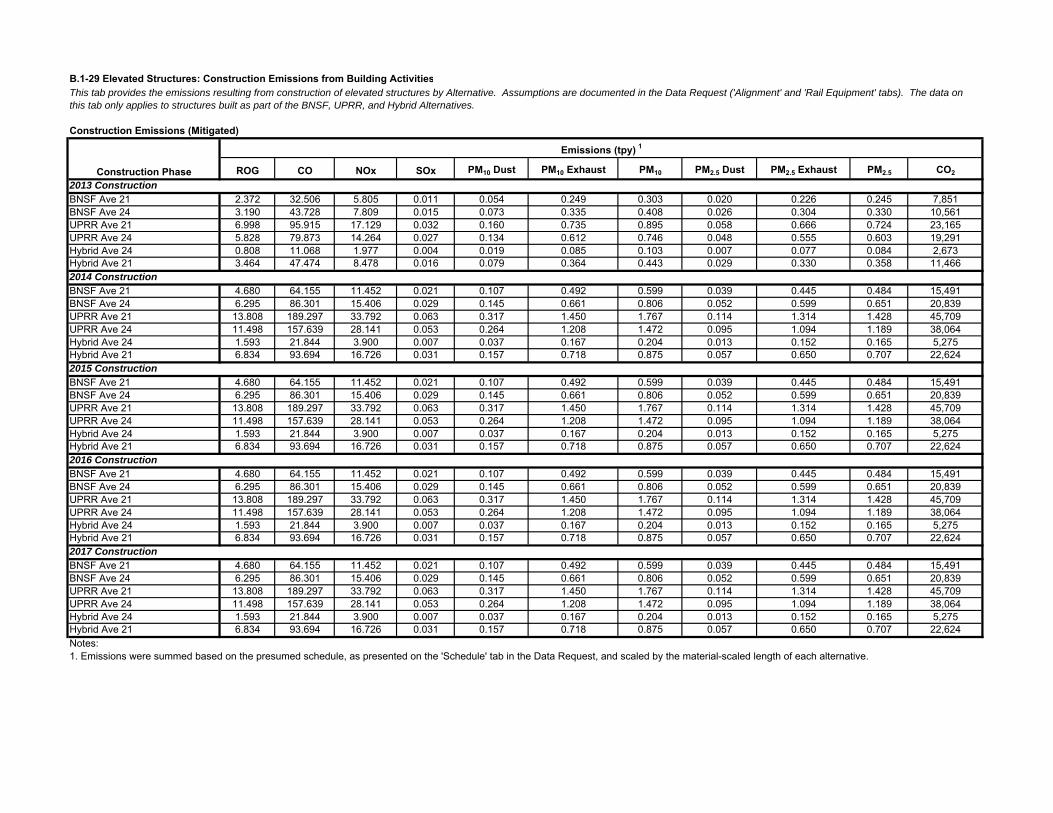
B.1-29 Elevated Structures: Construction Emissions from Building ActivitiesThis tab provides the emissions resulting from construction of elevated structures by Alternative. Assumptions are documented in the Data Request ('Alignment' and 'Rail Equipment' tabs). The data on this tab only applies to structures built as part of the BNSF, UPRR, and Hybrid Alternatives.
Construction Emissions (Mitigated)
ROG CO NOx SOx PM10 Dust PM10 Exhaust PM10 PM2.5 Dust PM2.5 Exhaust PM2.5 CO2
2013 ConstructionBNSF Ave 21 2.372 32.506 5.805 0.011 0.054 0.249 0.303 0.020 0.226 0.245 7,851BNSF Ave 24 3.190 43.728 7.809 0.015 0.073 0.335 0.408 0.026 0.304 0.330 10,561UPRR Ave 21 6.998 95.915 17.129 0.032 0.160 0.735 0.895 0.058 0.666 0.724 23,165UPRR Ave 24 5.828 79.873 14.264 0.027 0.134 0.612 0.746 0.048 0.555 0.603 19,291Hybrid Ave 24 0.808 11.068 1.977 0.004 0.019 0.085 0.103 0.007 0.077 0.084 2,673Hybrid Ave 21 3.464 47.474 8.478 0.016 0.079 0.364 0.443 0.029 0.330 0.358 11,4662014 ConstructionBNSF Ave 21 4.680 64.155 11.452 0.021 0.107 0.492 0.599 0.039 0.445 0.484 15,491BNSF Ave 24 6.295 86.301 15.406 0.029 0.145 0.661 0.806 0.052 0.599 0.651 20,839UPRR Ave 21 13.808 189.297 33.792 0.063 0.317 1.450 1.767 0.114 1.314 1.428 45,709UPRR Ave 24 11.498 157.639 28.141 0.053 0.264 1.208 1.472 0.095 1.094 1.189 38,064Hybrid Ave 24 1.593 21.844 3.900 0.007 0.037 0.167 0.204 0.013 0.152 0.165 5,275Hybrid Ave 21 6.834 93.694 16.726 0.031 0.157 0.718 0.875 0.057 0.650 0.707 22,6242015 ConstructionBNSF Ave 21 4.680 64.155 11.452 0.021 0.107 0.492 0.599 0.039 0.445 0.484 15,491BNSF Ave 24 6.295 86.301 15.406 0.029 0.145 0.661 0.806 0.052 0.599 0.651 20,839UPRR Ave 21 13.808 189.297 33.792 0.063 0.317 1.450 1.767 0.114 1.314 1.428 45,709UPRR Ave 24 11.498 157.639 28.141 0.053 0.264 1.208 1.472 0.095 1.094 1.189 38,064Hybrid Ave 24 1.593 21.844 3.900 0.007 0.037 0.167 0.204 0.013 0.152 0.165 5,275Hybrid Ave 21 6.834 93.694 16.726 0.031 0.157 0.718 0.875 0.057 0.650 0.707 22,6242016 ConstructionBNSF Ave 21 4.680 64.155 11.452 0.021 0.107 0.492 0.599 0.039 0.445 0.484 15,491BNSF Ave 24 6.295 86.301 15.406 0.029 0.145 0.661 0.806 0.052 0.599 0.651 20,839UPRR Ave 21 13.808 189.297 33.792 0.063 0.317 1.450 1.767 0.114 1.314 1.428 45,709UPRR Ave 24 11.498 157.639 28.141 0.053 0.264 1.208 1.472 0.095 1.094 1.189 38,064Hybrid Ave 24 1.593 21.844 3.900 0.007 0.037 0.167 0.204 0.013 0.152 0.165 5,275Hybrid Ave 21 6.834 93.694 16.726 0.031 0.157 0.718 0.875 0.057 0.650 0.707 22,6242017 ConstructionBNSF Ave 21 4.680 64.155 11.452 0.021 0.107 0.492 0.599 0.039 0.445 0.484 15,491BNSF Ave 24 6.295 86.301 15.406 0.029 0.145 0.661 0.806 0.052 0.599 0.651 20,839UPRR Ave 21 13.808 189.297 33.792 0.063 0.317 1.450 1.767 0.114 1.314 1.428 45,709UPRR Ave 24 11.498 157.639 28.141 0.053 0.264 1.208 1.472 0.095 1.094 1.189 38,064Hybrid Ave 24 1.593 21.844 3.900 0.007 0.037 0.167 0.204 0.013 0.152 0.165 5,275Hybrid Ave 21 6.834 93.694 16.726 0.031 0.157 0.718 0.875 0.057 0.650 0.707 22,624Notes:1. Emissions were summed based on the presumed schedule, as presented on the 'Schedule' tab in the Data Request, and scaled by the material-scaled length of each alternative.
Construction Phase
Emissions (tpy) 1
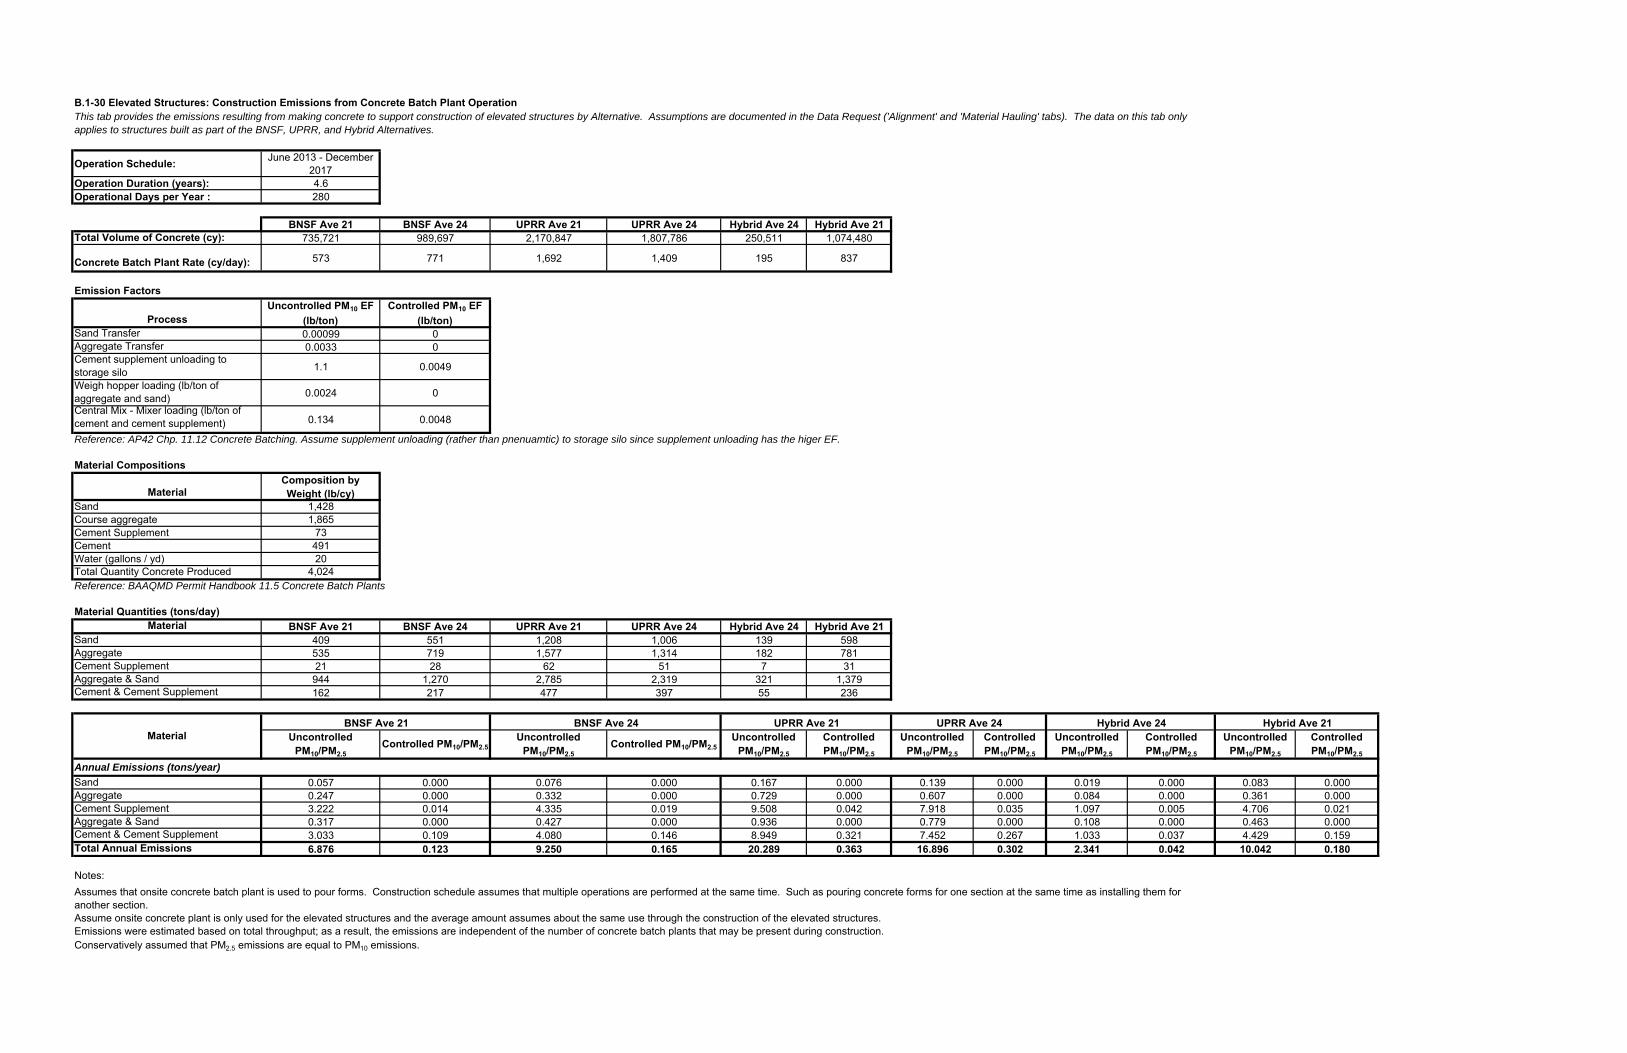
B.1-30 Elevated Structures: Construction Emissions from Concrete Batch Plant Operation
Operation Schedule: June 2013 - December 2017
Operation Duration (years): 4.6Operational Days per Year : 280
BNSF Ave 21 BNSF Ave 24 UPRR Ave 21 UPRR Ave 24 Hybrid Ave 24 Hybrid Ave 21Total Volume of Concrete (cy): 735,721 989,697 2,170,847 1,807,786 250,511 1,074,480
Concrete Batch Plant Rate (cy/day): 573 771 1,692 1,409 195 837
Emission Factors
ProcessUncontrolled PM10 EF
(lb/ton)Controlled PM10 EF
(lb/ton)Sand Transfer 0.00099 0Aggregate Transfer 0.0033 0Cement supplement unloading to storage silo 1.1 0.0049
Weigh hopper loading (lb/ton of aggregate and sand) 0.0024 0
Central Mix - Mixer loading (lb/ton of cement and cement supplement) 0.134 0.0048
Reference: AP42 Chp. 11.12 Concrete Batching. Assume supplement unloading (rather than pnenuamtic) to storage silo since supplement unloading has the higer EF.
Material Compositions
MaterialComposition by Weight (lb/cy)
Sand 1,428Course aggregate 1,865Cement Supplement 73Cement 491Water (gallons / yd) 20Total Quantity Concrete Produced 4,024Reference: BAAQMD Permit Handbook 11.5 Concrete Batch Plants
Material Quantities (tons/day)Material BNSF Ave 21 BNSF Ave 24 UPRR Ave 21 UPRR Ave 24 Hybrid Ave 24 Hybrid Ave 21
Sand 409 551 1,208 1,006 139 598Aggregate 535 719 1,577 1,314 182 781Cement Supplement 21 28 62 51 7 31Aggregate & Sand 944 1,270 2,785 2,319 321 1,379Cement & Cement Supplement 162 217 477 397 55 236
Uncontrolled PM10/PM2.5
Controlled PM10/PM2.5Uncontrolled
PM10/PM2.5Controlled PM10/PM2.5
Uncontrolled PM10/PM2.5
Controlled PM10/PM2.5
Uncontrolled PM10/PM2.5
Controlled PM10/PM2.5
Uncontrolled PM10/PM2.5
Controlled PM10/PM2.5
Uncontrolled PM10/PM2.5
Controlled PM10/PM2.5
Annual Emissions (tons/year)
Sand 0.057 0.000 0.076 0.000 0.167 0.000 0.139 0.000 0.019 0.000 0.083 0.000Aggregate 0.247 0.000 0.332 0.000 0.729 0.000 0.607 0.000 0.084 0.000 0.361 0.000Cement Supplement 3.222 0.014 4.335 0.019 9.508 0.042 7.918 0.035 1.097 0.005 4.706 0.021Aggregate & Sand 0.317 0.000 0.427 0.000 0.936 0.000 0.779 0.000 0.108 0.000 0.463 0.000Cement & Cement Supplement 3.033 0.109 4.080 0.146 8.949 0.321 7.452 0.267 1.033 0.037 4.429 0.159Total Annual Emissions 6.876 0.123 9.250 0.165 20.289 0.363 16.896 0.302 2.341 0.042 10.042 0.180
Notes:
Assume onsite concrete plant is only used for the elevated structures and the average amount assumes about the same use through the construction of the elevated structures.Emissions were estimated based on total throughput; as a result, the emissions are independent of the number of concrete batch plants that may be present during construction.Conservatively assumed that PM2.5 emissions are equal to PM10 emissions.
Hybrid Ave 21
Assumes that onsite concrete batch plant is used to pour forms. Construction schedule assumes that multiple operations are performed at the same time. Such as pouring concrete forms for one section at the same time as installing them for another section.
This tab provides the emissions resulting from making concrete to support construction of elevated structures by Alternative. Assumptions are documented in the Data Request ('Alignment' and 'Material Hauling' tabs). The data on this tab only applies to structures built as part of the BNSF, UPRR, and Hybrid Alternatives.
Hybrid Ave 24BNSF Ave 21 UPRR Ave 21 UPRR Ave 24BNSF Ave 24Material

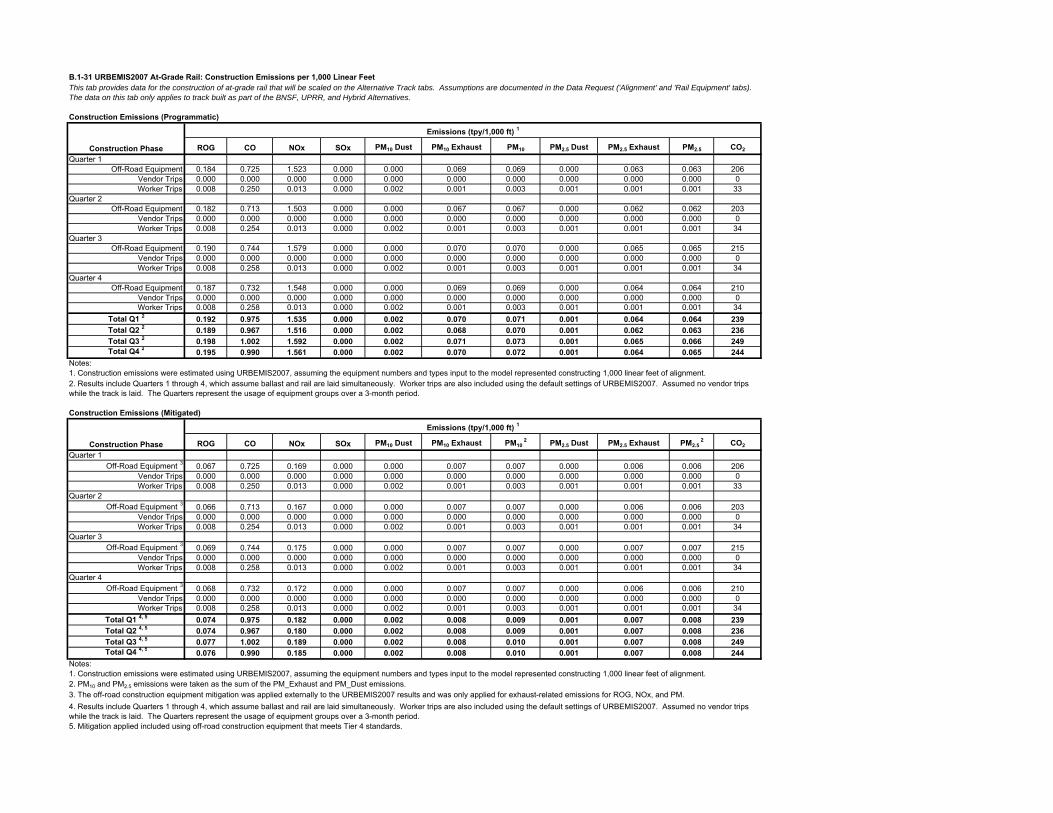
B.1-31 URBEMIS2007 At-Grade Rail: Construction Emissions per 1,000 Linear Feet
Construction Emissions (Programmatic)
ROG CO NOx SOx PM10 Dust PM10 Exhaust PM10 PM2.5 Dust PM2.5 Exhaust PM2.5 CO2
Quarter 1Off-Road Equipment 0.184 0.725 1.523 0.000 0.000 0.069 0.069 0.000 0.063 0.063 206
Vendor Trips 0.000 0.000 0.000 0.000 0.000 0.000 0.000 0.000 0.000 0.000 0Worker Trips 0.008 0.250 0.013 0.000 0.002 0.001 0.003 0.001 0.001 0.001 33
Quarter 2Off-Road Equipment 0.182 0.713 1.503 0.000 0.000 0.067 0.067 0.000 0.062 0.062 203
Vendor Trips 0.000 0.000 0.000 0.000 0.000 0.000 0.000 0.000 0.000 0.000 0Worker Trips 0.008 0.254 0.013 0.000 0.002 0.001 0.003 0.001 0.001 0.001 34
Quarter 3Off-Road Equipment 0.190 0.744 1.579 0.000 0.000 0.070 0.070 0.000 0.065 0.065 215
Vendor Trips 0.000 0.000 0.000 0.000 0.000 0.000 0.000 0.000 0.000 0.000 0Worker Trips 0.008 0.258 0.013 0.000 0.002 0.001 0.003 0.001 0.001 0.001 34
Quarter 4Off-Road Equipment 0.187 0.732 1.548 0.000 0.000 0.069 0.069 0.000 0.064 0.064 210
Vendor Trips 0.000 0.000 0.000 0.000 0.000 0.000 0.000 0.000 0.000 0.000 0Worker Trips 0.008 0.258 0.013 0.000 0.002 0.001 0.003 0.001 0.001 0.001 34
Total Q1 2 0.192 0.975 1.535 0.000 0.002 0.070 0.071 0.001 0.064 0.064 239Total Q2 2 0.189 0.967 1.516 0.000 0.002 0.068 0.070 0.001 0.062 0.063 236Total Q3 2 0.198 1.002 1.592 0.000 0.002 0.071 0.073 0.001 0.065 0.066 249Total Q4 2 0.195 0.990 1.561 0.000 0.002 0.070 0.072 0.001 0.064 0.065 244
Notes:1. Construction emissions were estimated using URBEMIS2007, assuming the equipment numbers and types input to the model represented constructing 1,000 linear feet of alignment.
Construction Emissions (Mitigated)
ROG CO NOx SOx PM10 Dust PM10 Exhaust PM10 2 PM2.5 Dust PM2.5 Exhaust PM2.5
2 CO2
Quarter 1Off-Road Equipment 3 0.067 0.725 0.169 0.000 0.000 0.007 0.007 0.000 0.006 0.006 206
Vendor Trips 0.000 0.000 0.000 0.000 0.000 0.000 0.000 0.000 0.000 0.000 0Worker Trips 0.008 0.250 0.013 0.000 0.002 0.001 0.003 0.001 0.001 0.001 33
Quarter 2Off-Road Equipment 3 0.066 0.713 0.167 0.000 0.000 0.007 0.007 0.000 0.006 0.006 203
Vendor Trips 0.000 0.000 0.000 0.000 0.000 0.000 0.000 0.000 0.000 0.000 0Worker Trips 0.008 0.254 0.013 0.000 0.002 0.001 0.003 0.001 0.001 0.001 34
Quarter 3Off-Road Equipment 3 0.069 0.744 0.175 0.000 0.000 0.007 0.007 0.000 0.007 0.007 215
Vendor Trips 0.000 0.000 0.000 0.000 0.000 0.000 0.000 0.000 0.000 0.000 0Worker Trips 0.008 0.258 0.013 0.000 0.002 0.001 0.003 0.001 0.001 0.001 34
Quarter 4Off-Road Equipment 3 0.068 0.732 0.172 0.000 0.000 0.007 0.007 0.000 0.006 0.006 210
Vendor Trips 0.000 0.000 0.000 0.000 0.000 0.000 0.000 0.000 0.000 0.000 0Worker Trips 0.008 0.258 0.013 0.000 0.002 0.001 0.003 0.001 0.001 0.001 34
Total Q1 4, 5 0.074 0.975 0.182 0.000 0.002 0.008 0.009 0.001 0.007 0.008 239Total Q2 4, 5 0.074 0.967 0.180 0.000 0.002 0.008 0.009 0.001 0.007 0.008 236Total Q3 4, 5 0.077 1.002 0.189 0.000 0.002 0.008 0.010 0.001 0.007 0.008 249Total Q4 4, 5 0.076 0.990 0.185 0.000 0.002 0.008 0.010 0.001 0.007 0.008 244
Notes:1. Construction emissions were estimated using URBEMIS2007, assuming the equipment numbers and types input to the model represented constructing 1,000 linear feet of alignment.2. PM10 and PM2.5 emissions were taken as the sum of the PM_Exhaust and PM_Dust emissions.3. The off-road construction equipment mitigation was applied externally to the URBEMIS2007 results and was only applied for exhaust-related emissions for ROG, NOx, and PM.
5. Mitigation applied included using off-road construction equipment that meets Tier 4 standards.
This tab provides data for the construction of at-grade rail that will be scaled on the Alternative Track tabs. Assumptions are documented in the Data Request ('Alignment' and 'Rail Equipment' tabs). The data on this tab only applies to track built as part of the BNSF, UPRR, and Hybrid Alternatives.
4. Results include Quarters 1 through 4, which assume ballast and rail are laid simultaneously. Worker trips are also included using the default settings of URBEMIS2007. Assumed no vendor trips while the track is laid. The Quarters represent the usage of equipment groups over a 3-month period.
Construction Phase
Emissions (tpy/1,000 ft) 1
Construction Phase
Emissions (tpy/1,000 ft) 1
2. Results include Quarters 1 through 4, which assume ballast and rail are laid simultaneously. Worker trips are also included using the default settings of URBEMIS2007. Assumed no vendor trips while the track is laid. The Quarters represent the usage of equipment groups over a 3-month period.
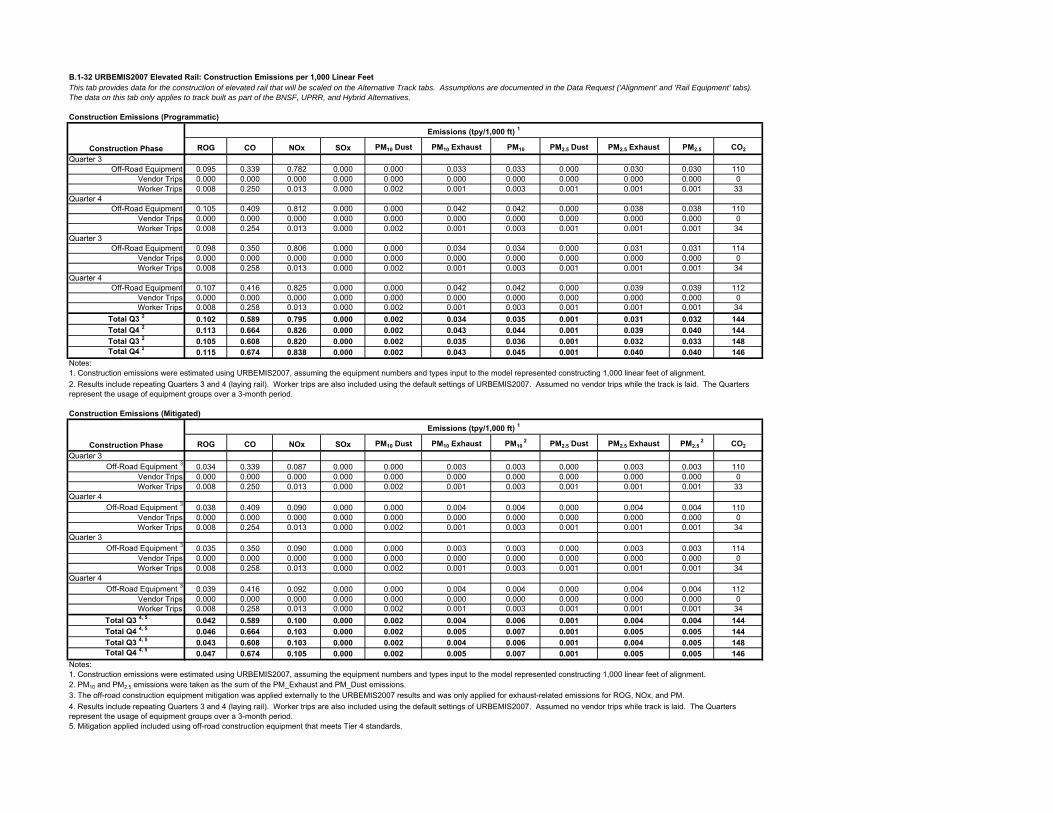
B.1-32 URBEMIS2007 Elevated Rail: Construction Emissions per 1,000 Linear Feet
Construction Emissions (Programmatic)
ROG CO NOx SOx PM10 Dust PM10 Exhaust PM10 PM2.5 Dust PM2.5 Exhaust PM2.5 CO2
Quarter 3Off-Road Equipment 0.095 0.339 0.782 0.000 0.000 0.033 0.033 0.000 0.030 0.030 110
Vendor Trips 0.000 0.000 0.000 0.000 0.000 0.000 0.000 0.000 0.000 0.000 0Worker Trips 0.008 0.250 0.013 0.000 0.002 0.001 0.003 0.001 0.001 0.001 33
Quarter 4Off-Road Equipment 0.105 0.409 0.812 0.000 0.000 0.042 0.042 0.000 0.038 0.038 110
Vendor Trips 0.000 0.000 0.000 0.000 0.000 0.000 0.000 0.000 0.000 0.000 0Worker Trips 0.008 0.254 0.013 0.000 0.002 0.001 0.003 0.001 0.001 0.001 34
Quarter 3Off-Road Equipment 0.098 0.350 0.806 0.000 0.000 0.034 0.034 0.000 0.031 0.031 114
Vendor Trips 0.000 0.000 0.000 0.000 0.000 0.000 0.000 0.000 0.000 0.000 0Worker Trips 0.008 0.258 0.013 0.000 0.002 0.001 0.003 0.001 0.001 0.001 34
Quarter 4Off-Road Equipment 0.107 0.416 0.825 0.000 0.000 0.042 0.042 0.000 0.039 0.039 112
Vendor Trips 0.000 0.000 0.000 0.000 0.000 0.000 0.000 0.000 0.000 0.000 0Worker Trips 0.008 0.258 0.013 0.000 0.002 0.001 0.003 0.001 0.001 0.001 34
Total Q3 2 0.102 0.589 0.795 0.000 0.002 0.034 0.035 0.001 0.031 0.032 144Total Q4 2 0.113 0.664 0.826 0.000 0.002 0.043 0.044 0.001 0.039 0.040 144Total Q3 2 0.105 0.608 0.820 0.000 0.002 0.035 0.036 0.001 0.032 0.033 148Total Q4 2 0.115 0.674 0.838 0.000 0.002 0.043 0.045 0.001 0.040 0.040 146
Notes:1. Construction emissions were estimated using URBEMIS2007, assuming the equipment numbers and types input to the model represented constructing 1,000 linear feet of alignment.
Construction Emissions (Mitigated)
ROG CO NOx SOx PM10 Dust PM10 Exhaust PM10 2 PM2.5 Dust PM2.5 Exhaust PM2.5
2 CO2
Quarter 3Off-Road Equipment 3 0.034 0.339 0.087 0.000 0.000 0.003 0.003 0.000 0.003 0.003 110
Vendor Trips 0.000 0.000 0.000 0.000 0.000 0.000 0.000 0.000 0.000 0.000 0Worker Trips 0.008 0.250 0.013 0.000 0.002 0.001 0.003 0.001 0.001 0.001 33
Quarter 4Off-Road Equipment 3 0.038 0.409 0.090 0.000 0.000 0.004 0.004 0.000 0.004 0.004 110
Vendor Trips 0.000 0.000 0.000 0.000 0.000 0.000 0.000 0.000 0.000 0.000 0Worker Trips 0.008 0.254 0.013 0.000 0.002 0.001 0.003 0.001 0.001 0.001 34
Quarter 3Off-Road Equipment 3 0.035 0.350 0.090 0.000 0.000 0.003 0.003 0.000 0.003 0.003 114
Vendor Trips 0.000 0.000 0.000 0.000 0.000 0.000 0.000 0.000 0.000 0.000 0Worker Trips 0.008 0.258 0.013 0.000 0.002 0.001 0.003 0.001 0.001 0.001 34
Quarter 4Off-Road Equipment 3 0.039 0.416 0.092 0.000 0.000 0.004 0.004 0.000 0.004 0.004 112
Vendor Trips 0.000 0.000 0.000 0.000 0.000 0.000 0.000 0.000 0.000 0.000 0Worker Trips 0.008 0.258 0.013 0.000 0.002 0.001 0.003 0.001 0.001 0.001 34
Total Q3 4, 5 0.042 0.589 0.100 0.000 0.002 0.004 0.006 0.001 0.004 0.004 144Total Q4 4, 5 0.046 0.664 0.103 0.000 0.002 0.005 0.007 0.001 0.005 0.005 144Total Q3 4, 5 0.043 0.608 0.103 0.000 0.002 0.004 0.006 0.001 0.004 0.005 148Total Q4 4, 5 0.047 0.674 0.105 0.000 0.002 0.005 0.007 0.001 0.005 0.005 146
Notes:1. Construction emissions were estimated using URBEMIS2007, assuming the equipment numbers and types input to the model represented constructing 1,000 linear feet of alignment.2. PM10 and PM2.5 emissions were taken as the sum of the PM_Exhaust and PM_Dust emissions.3. The off-road construction equipment mitigation was applied externally to the URBEMIS2007 results and was only applied for exhaust-related emissions for ROG, NOx, and PM.
5. Mitigation applied included using off-road construction equipment that meets Tier 4 standards.
This tab provides data for the construction of elevated rail that will be scaled on the Alternative Track tabs. Assumptions are documented in the Data Request ('Alignment' and 'Rail Equipment' tabs). The data on this tab only applies to track built as part of the BNSF, UPRR, and Hybrid Alternatives.
4. Results include repeating Quarters 3 and 4 (laying rail). Worker trips are also included using the default settings of URBEMIS2007. Assumed no vendor trips while track is laid. The Quarters represent the usage of equipment groups over a 3-month period.
2. Results include repeating Quarters 3 and 4 (laying rail). Worker trips are also included using the default settings of URBEMIS2007. Assumed no vendor trips while the track is laid. The Quarters represent the usage of equipment groups over a 3-month period.
Construction Phase
Emissions (tpy/1,000 ft) 1
Construction Phase
Emissions (tpy/1,000 ft) 1
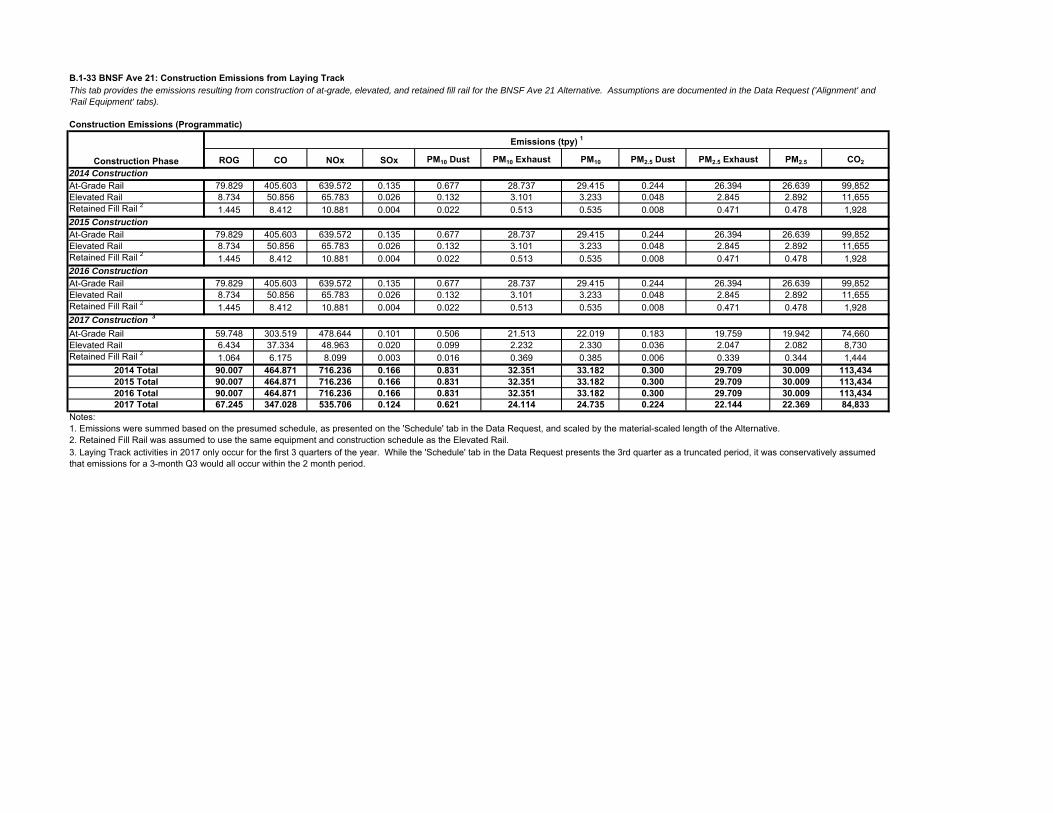
B.1-33 BNSF Ave 21: Construction Emissions from Laying Track
Construction Emissions (Programmatic)
ROG CO NOx SOx PM10 Dust PM10 Exhaust PM10 PM2.5 Dust PM2.5 Exhaust PM2.5 CO2
2014 ConstructionAt-Grade Rail 79.829 405.603 639.572 0.135 0.677 28.737 29.415 0.244 26.394 26.639 99,852Elevated Rail 8.734 50.856 65.783 0.026 0.132 3.101 3.233 0.048 2.845 2.892 11,655Retained Fill Rail 2 1.445 8.412 10.881 0.004 0.022 0.513 0.535 0.008 0.471 0.478 1,9282015 ConstructionAt-Grade Rail 79.829 405.603 639.572 0.135 0.677 28.737 29.415 0.244 26.394 26.639 99,852Elevated Rail 8.734 50.856 65.783 0.026 0.132 3.101 3.233 0.048 2.845 2.892 11,655Retained Fill Rail 2 1.445 8.412 10.881 0.004 0.022 0.513 0.535 0.008 0.471 0.478 1,9282016 ConstructionAt-Grade Rail 79.829 405.603 639.572 0.135 0.677 28.737 29.415 0.244 26.394 26.639 99,852Elevated Rail 8.734 50.856 65.783 0.026 0.132 3.101 3.233 0.048 2.845 2.892 11,655Retained Fill Rail 2 1.445 8.412 10.881 0.004 0.022 0.513 0.535 0.008 0.471 0.478 1,9282017 Construction 3
At-Grade Rail 59.748 303.519 478.644 0.101 0.506 21.513 22.019 0.183 19.759 19.942 74,660Elevated Rail 6.434 37.334 48.963 0.020 0.099 2.232 2.330 0.036 2.047 2.082 8,730Retained Fill Rail 2 1.064 6.175 8.099 0.003 0.016 0.369 0.385 0.006 0.339 0.344 1,444
2014 Total 90.007 464.871 716.236 0.166 0.831 32.351 33.182 0.300 29.709 30.009 113,4342015 Total 90.007 464.871 716.236 0.166 0.831 32.351 33.182 0.300 29.709 30.009 113,4342016 Total 90.007 464.871 716.236 0.166 0.831 32.351 33.182 0.300 29.709 30.009 113,4342017 Total 67.245 347.028 535.706 0.124 0.621 24.114 24.735 0.224 22.144 22.369 84,833
Notes:1. Emissions were summed based on the presumed schedule, as presented on the 'Schedule' tab in the Data Request, and scaled by the material-scaled length of the Alternative.2. Retained Fill Rail was assumed to use the same equipment and construction schedule as the Elevated Rail.3. Laying Track activities in 2017 only occur for the first 3 quarters of the year. While the 'Schedule' tab in the Data Request presents the 3rd quarter as a truncated period, it was conservatively assumed that emissions for a 3-month Q3 would all occur within the 2 month period.
This tab provides the emissions resulting from construction of at-grade, elevated, and retained fill rail for the BNSF Ave 21 Alternative. Assumptions are documented in the Data Request ('Alignment' and 'Rail Equipment' tabs).
Emissions (tpy) 1
Construction Phase
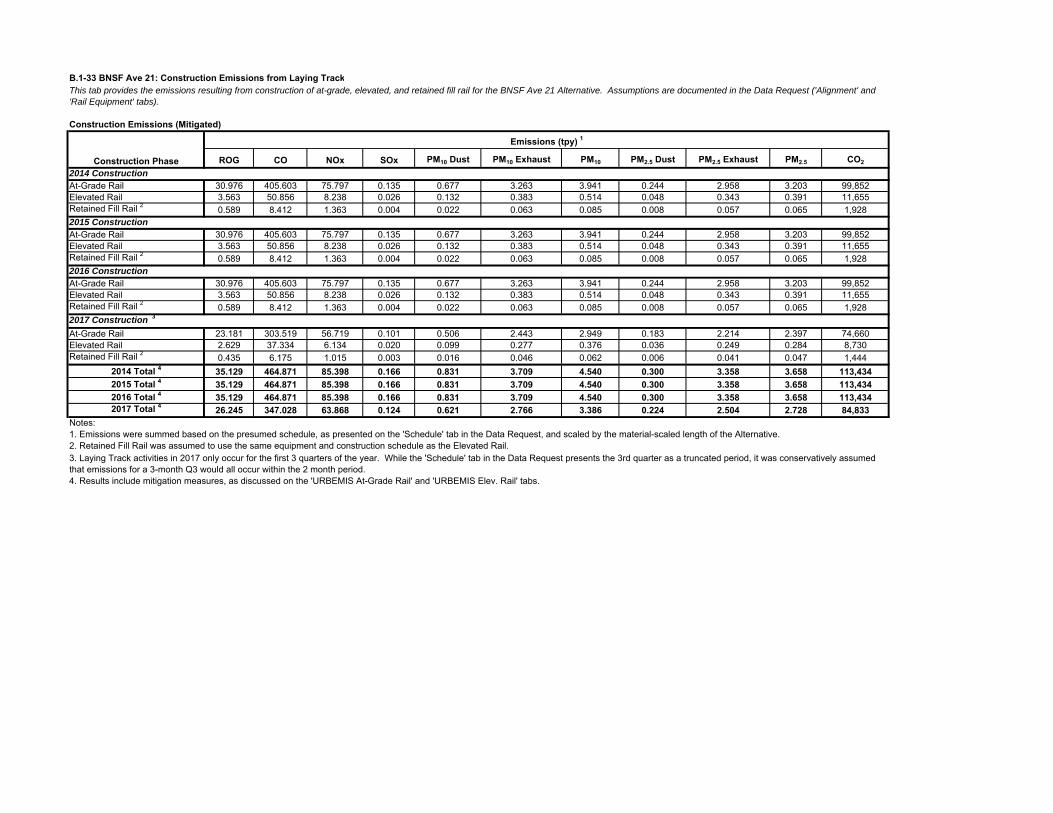
B.1-33 BNSF Ave 21: Construction Emissions from Laying TrackThis tab provides the emissions resulting from construction of at-grade, elevated, and retained fill rail for the BNSF Ave 21 Alternative. Assumptions are documented in the Data Request ('Alignment' and 'Rail Equipment' tabs).
Construction Emissions (Mitigated)
ROG CO NOx SOx PM10 Dust PM10 Exhaust PM10 PM2.5 Dust PM2.5 Exhaust PM2.5 CO2
2014 ConstructionAt-Grade Rail 30.976 405.603 75.797 0.135 0.677 3.263 3.941 0.244 2.958 3.203 99,852Elevated Rail 3.563 50.856 8.238 0.026 0.132 0.383 0.514 0.048 0.343 0.391 11,655Retained Fill Rail 2 0.589 8.412 1.363 0.004 0.022 0.063 0.085 0.008 0.057 0.065 1,9282015 ConstructionAt-Grade Rail 30.976 405.603 75.797 0.135 0.677 3.263 3.941 0.244 2.958 3.203 99,852Elevated Rail 3.563 50.856 8.238 0.026 0.132 0.383 0.514 0.048 0.343 0.391 11,655Retained Fill Rail 2 0.589 8.412 1.363 0.004 0.022 0.063 0.085 0.008 0.057 0.065 1,9282016 ConstructionAt-Grade Rail 30.976 405.603 75.797 0.135 0.677 3.263 3.941 0.244 2.958 3.203 99,852Elevated Rail 3.563 50.856 8.238 0.026 0.132 0.383 0.514 0.048 0.343 0.391 11,655Retained Fill Rail 2 0.589 8.412 1.363 0.004 0.022 0.063 0.085 0.008 0.057 0.065 1,9282017 Construction 3
At-Grade Rail 23.181 303.519 56.719 0.101 0.506 2.443 2.949 0.183 2.214 2.397 74,660Elevated Rail 2.629 37.334 6.134 0.020 0.099 0.277 0.376 0.036 0.249 0.284 8,730Retained Fill Rail 2 0.435 6.175 1.015 0.003 0.016 0.046 0.062 0.006 0.041 0.047 1,444
2014 Total 4 35.129 464.871 85.398 0.166 0.831 3.709 4.540 0.300 3.358 3.658 113,4342015 Total 4 35.129 464.871 85.398 0.166 0.831 3.709 4.540 0.300 3.358 3.658 113,4342016 Total 4 35.129 464.871 85.398 0.166 0.831 3.709 4.540 0.300 3.358 3.658 113,4342017 Total 4 26.245 347.028 63.868 0.124 0.621 2.766 3.386 0.224 2.504 2.728 84,833
Notes:1. Emissions were summed based on the presumed schedule, as presented on the 'Schedule' tab in the Data Request, and scaled by the material-scaled length of the Alternative.2. Retained Fill Rail was assumed to use the same equipment and construction schedule as the Elevated Rail.
4. Results include mitigation measures, as discussed on the 'URBEMIS At-Grade Rail' and 'URBEMIS Elev. Rail' tabs.
3. Laying Track activities in 2017 only occur for the first 3 quarters of the year. While the 'Schedule' tab in the Data Request presents the 3rd quarter as a truncated period, it was conservatively assumed that emissions for a 3-month Q3 would all occur within the 2 month period.
Construction Phase
Emissions (tpy) 1

B.1-33 BNSF Ave 21: Construction Emissions from Laying TrackThis tab provides the emissions resulting from construction of at-grade, elevated, and retained fill rail for the BNSF Ave 21 Alternative. Assumptions are documented in the Data Request ('Alignment' and 'Rail Equipment' tabs).
Fugitive Dust Emissions from Track ConstructionParameter Value
Length of Alternative (ft) 431,357Width of Alternative (ft) 120Total Area Disturbed (acres) 1,188Laying Track Duration (years) 3.7Area Disturbed per Day (acre/day) 1.2PM10 Emission Factor (lbs/acre/day) 1, 2 10PM10 Emissions (lbs/day) 3 11.574PM10 Emissions (tpy) 3 1.620PM2.5 Emissions (lbs/day) 3, 4 2.407PM2.5 Emissions (tpy) 3, 4 0.337Notes:Conversion Factor: 1 acre = 43,560 square feetWorking Days per Year = 280 Assumed; consistent with material hauling estimationsConversion Factor: 1 ton = 2,000 lbs1. Emission factor assumes watering twice daily per the programmatic measures.2. A grading emission factor was used to conservatively represent the PM emissions from track construction activities.3. As a conservative approach, mitigated emissions were assumed equal to unmitigated emissions.4. Assumed PM2.5 emissions were 20.8% of the PM10 emissions, based on the construction data provided in Appendix A of the SCAQMD's Final - Methodology to Calculate Particulate Matter (PM) 2.5 and PM 2.5 Significance Thresholds (2006).
Calculated; see notes below.Refer to 'Schedule' tab of the Data Request
CommentsRefer to 'Alternatives' tabRefer to 'Alignment' tab of the Data Request
Calculated; see notes below.Calculated; see notes below.
Appendix A, Table A-4 of the URBEMIS2007 User Guide (2007)
Calculated; see notes below.
Calculated; see notes below.Calculated; see notes below.

B.1-34 BNSF Ave 24: Construction Emissions from Laying Track
Construction Emissions (Programmatic)
ROG CO NOx SOx PM10 Dust PM10 Exhaust PM10 PM2.5 Dust PM2.5 Exhaust PM2.5 CO2
2014 ConstructionAt-Grade Rail 76.444 388.402 612.449 0.129 0.649 27.519 28.167 0.234 25.275 25.509 95,617Elevated Rail 11.748 68.412 88.491 0.035 0.177 4.172 4.349 0.064 3.826 3.890 15,678Retained Fill Rail 2 1.445 8.412 10.881 0.004 0.022 0.513 0.535 0.008 0.471 0.478 1,9282015 ConstructionAt-Grade Rail 76.444 388.402 612.449 0.129 0.649 27.519 28.167 0.234 25.275 25.509 95,617Elevated Rail 11.748 68.412 88.491 0.035 0.177 4.172 4.349 0.064 3.826 3.890 15,678Retained Fill Rail 2 1.445 8.412 10.881 0.004 0.022 0.513 0.535 0.008 0.471 0.478 1,9282016 ConstructionAt-Grade Rail 76.444 388.402 612.449 0.129 0.649 27.519 28.167 0.234 25.275 25.509 95,617Elevated Rail 11.748 68.412 88.491 0.035 0.177 4.172 4.349 0.064 3.826 3.890 15,678Retained Fill Rail 2 1.445 8.412 10.881 0.004 0.022 0.513 0.535 0.008 0.471 0.478 1,9282017 Construction 3
At-Grade Rail 57.214 290.648 458.346 0.097 0.485 20.601 21.085 0.175 18.921 19.096 71,494Elevated Rail 8.654 50.222 65.865 0.026 0.133 3.002 3.134 0.048 2.753 2.801 11,743Retained Fill Rail 2 1.064 6.175 8.099 0.003 0.016 0.369 0.385 0.006 0.339 0.344 1,444
2014 Total 89.637 465.226 711.821 0.169 0.848 32.203 33.051 0.306 29.572 29.878 113,2232015 Total 89.637 465.226 711.821 0.169 0.848 32.203 33.051 0.306 29.572 29.878 113,2232016 Total 89.637 465.226 711.821 0.169 0.848 32.203 33.051 0.306 29.572 29.878 113,2232017 Total 66.933 347.045 532.310 0.126 0.633 23.972 24.605 0.229 22.013 22.242 84,681
Notes:1. Emissions were summed based on the presumed schedule, as presented on the 'Schedule' tab in the Data Request, and scaled by the material-scaled length of the Alternative.2. Retained Fill Rail was assumed to use the same equipment and construction schedule as the Elevated Rail.
This tab provides the emissions resulting from construction of at-grade, elevated, and retained fill rail for the BNSF Ave 24 Alternative. Assumptions are documented in the Data Request ('Alignment' and 'Rail Equipment' tabs).
Construction Phase
Emissions (tpy) 1
3. Laying Track activities in 2017 only occur for the first 3 quarters of the year. While the 'Schedule' tab in the Data Request presents the 3rd quarter as a truncated period, it was conservatively assumed that emissions for a 3-month Q3 would all occur within the 2 month period.

B.1-34 BNSF Ave 24: Construction Emissions from Laying TrackThis tab provides the emissions resulting from construction of at-grade, elevated, and retained fill rail for the BNSF Ave 24 Alternative. Assumptions are documented in the Data Request ('Alignment' and 'Rail Equipment' tabs).
Construction Emissions (Mitigated)
ROG CO NOx SOx PM10 Dust PM10 Exhaust PM10 PM2.5 Dust PM2.5 Exhaust PM2.5 CO2
2014 ConstructionAt-Grade Rail 29.663 388.402 72.583 0.129 0.649 3.125 3.774 0.234 2.833 3.067 95,617Elevated Rail 4.793 68.412 11.082 0.035 0.177 0.515 0.692 0.064 0.462 0.526 15,678Retained Fill Rail 2 0.589 8.412 1.363 0.004 0.022 0.063 0.085 0.008 0.057 0.065 1,9282015 ConstructionAt-Grade Rail 29.663 388.402 72.583 0.129 0.649 3.125 3.774 0.234 2.833 3.067 95,617Elevated Rail 4.793 68.412 11.082 0.035 0.177 0.515 0.692 0.064 0.462 0.526 15,678Retained Fill Rail 2 0.589 8.412 1.363 0.004 0.022 0.063 0.085 0.008 0.057 0.065 1,9282016 ConstructionAt-Grade Rail 29.663 388.402 72.583 0.129 0.649 3.125 3.774 0.234 2.833 3.067 95,617Elevated Rail 4.793 68.412 11.082 0.035 0.177 0.515 0.692 0.064 0.462 0.526 15,678Retained Fill Rail 2 0.589 8.412 1.363 0.004 0.022 0.063 0.085 0.008 0.057 0.065 1,9282017 Construction 3
At-Grade Rail 22.198 290.648 54.314 0.097 0.485 2.339 2.824 0.175 2.120 2.295 71,494Elevated Rail 3.536 50.222 8.252 0.026 0.133 0.373 0.505 0.048 0.334 0.382 11,743Retained Fill Rail 2 0.435 6.175 1.015 0.003 0.016 0.046 0.062 0.006 0.041 0.047 1,444
2014 Total 4 35.045 465.226 85.027 0.169 0.848 3.703 4.551 0.306 3.352 3.657 113,2232015 Total 4 35.045 465.226 85.027 0.169 0.848 3.703 4.551 0.306 3.352 3.657 113,2232016 Total 4 35.045 465.226 85.027 0.169 0.848 3.703 4.551 0.306 3.352 3.657 113,2232017 Total 4 26.170 347.045 63.580 0.126 0.633 2.758 3.391 0.229 2.496 2.724 84,681
Notes:1. Emissions were summed based on the presumed schedule, as presented on the 'Schedule' tab in the Data Request, and scaled by the material-scaled length of the Alternative.2. Retained Fill Rail was assumed to use the same equipment and construction schedule as the Elevated Rail.
4. Results include mitigation measures, as discussed on the 'URBEMIS At-Grade Rail' and 'URBEMIS Elev. Rail' tabs.
Construction Phase
Emissions (tpy) 1
3. Laying Track activities in 2017 only occur for the first 3 quarters of the year. While the 'Schedule' tab in the Data Request presents the 3rd quarter as a truncated period, it was conservatively assumed that emissions for a 3-month Q3 would all occur within the 2 month period.

B.1-34 BNSF Ave 24: Construction Emissions from Laying TrackThis tab provides the emissions resulting from construction of at-grade, elevated, and retained fill rail for the BNSF Ave 24 Alternative. Assumptions are documented in the Data Request ('Alignment' and 'Rail Equipment' tabs).
Fugitive Dust Emissions from Track ConstructionParameter Value
Length of Alternative (ft) 442,681Width of Alternative (ft) 120Total Area Disturbed (acres) 1,220Laying Track Duration (years) 3.7Area Disturbed per Day (acre/day) 1.2PM10 Emission Factor (lbs/acre/day) 1, 2 10PM10 Emissions (lbs/day) 3 11.878PM10 Emissions (tpy) 3 1.663PM2.5 Emissions (lbs/day) 3, 4 2.471PM2.5 Emissions (tpy) 3, 4 0.346Notes:Conversion Factor: 1 acre = 43,560 square feetWorking Days per Year = 280 Assumed; consistent with material hauling estimationsConversion Factor: 1 ton = 2,000 lbs1. Emission factor assumes watering twice daily per the programmatic measures.2. A grading emission factor was used to conservatively represent the PM emissions from track construction activities.3. As a conservative approach, mitigated emissions were assumed equal to unmitigated emissions.4. Assumed PM2.5 emissions were 20.8% of the PM10 emissions,
Calculated; see notes below.Calculated; see notes below.
Calculated; see notes below.Calculated; see notes below.
based on the construction data provided in Appendix A of the SCAQMD's Final - Methodology to Calculate Particulate Matter (PM) 2.5 and PM 2.5 Significance Thresholds (2006).
Refer to 'Schedule' tab of the Data Request
Calculated; see notes below.Appendix A, Table A-4 of the URBEMIS2007 User Guide (2007)
CommentsRefer to 'Alternatives' tabRefer to 'Alignment' tab of the Data RequestCalculated; see notes below.

B.1-35 UPRR Ave 21: Construction Emissions from Laying Track
Construction Emissions (Programmatic)
ROG CO NOx SOx PM10 Dust PM10 Exhaust PM10 PM2.5 Dust PM2.5 Exhaust PM2.5 CO2
2014 ConstructionAt-Grade Rail 42.575 216.317 341.098 0.072 0.361 15.326 15.687 0.130 14.077 14.207 53,253Elevated Rail 25.770 150.057 194.100 0.078 0.389 9.150 9.539 0.140 8.393 8.533 34,389Retained Fill Rail 2 1.083 6.305 8.155 0.003 0.016 0.384 0.401 0.006 0.353 0.359 1,4452015 ConstructionAt-Grade Rail 42.575 216.317 341.098 0.072 0.361 15.326 15.687 0.130 14.077 14.207 53,253Elevated Rail 25.770 150.057 194.100 0.078 0.389 9.150 9.539 0.140 8.393 8.533 34,389Retained Fill Rail 2 1.083 6.305 8.155 0.003 0.016 0.384 0.401 0.006 0.353 0.359 1,4452016 ConstructionAt-Grade Rail 42.575 216.317 341.098 0.072 0.361 15.326 15.687 0.130 14.077 14.207 53,253Elevated Rail 25.770 150.057 194.100 0.078 0.389 9.150 9.539 0.140 8.393 8.533 34,389Retained Fill Rail 2 1.083 6.305 8.155 0.003 0.016 0.384 0.401 0.006 0.353 0.359 1,4452017 Construction 3
At-Grade Rail 31.865 161.874 255.271 0.054 0.270 11.473 11.743 0.097 10.538 10.635 39,818Elevated Rail 18.983 110.158 144.472 0.058 0.291 6.585 6.875 0.105 6.039 6.144 25,758Retained Fill Rail 2 0.798 4.628 6.070 0.002 0.012 0.277 0.289 0.004 0.254 0.258 1,082
2014 Total 69.427 372.679 543.354 0.153 0.767 24.861 25.628 0.277 22.822 23.099 89,0872015 Total 69.427 372.679 543.354 0.153 0.767 24.861 25.628 0.277 22.822 23.099 89,0872016 Total 69.427 372.679 543.354 0.153 0.767 24.861 25.628 0.277 22.822 23.099 89,0872017 Total 51.646 276.660 405.813 0.114 0.573 18.335 18.908 0.207 16.831 17.037 66,658
Notes:1. Emissions were summed based on the presumed schedule, as presented on the 'Schedule' tab in the Data Request, and scaled by the material-scaled length of the Alternative.2. Retained Fill Rail was assumed to use the same equipment and construction schedule as the Elevated Rail.
This tab provides the emissions resulting from construction of at-grade, elevated, and retained fill rail for the UPRR Ave 21 Alternative. Assumptions are documented in the Data Request ('Alignment' and 'Rail Equipment' tabs).
Construction Phase
Emissions (tpy) 1
3. Laying Track activities in 2017 only occur for the first 3 quarters of the year. While the 'Schedule' tab in the Data Request presents the 3rd quarter as a truncated period, it was conservatively assumed that emissions for a 3-month Q3 would all occur within the 2 month period.

B.1-35 UPRR Ave 21: Construction Emissions from Laying TrackThis tab provides the emissions resulting from construction of at-grade, elevated, and retained fill rail for the UPRR Ave 21 Alternative. Assumptions are documented in the Data Request ('Alignment' and 'Rail Equipment' tabs).
Construction Emissions (Mitigated)
ROG CO NOx SOx PM10 Dust PM10 Exhaust PM10 PM2.5 Dust PM2.5 Exhaust PM2.5 CO2
2014 ConstructionAt-Grade Rail 16.520 216.317 40.424 0.072 0.361 1.740 2.102 0.130 1.578 1.708 53,253Elevated Rail 10.513 150.057 24.307 0.078 0.389 1.129 1.518 0.140 1.013 1.154 34,389Retained Fill Rail 2 0.442 6.305 1.021 0.003 0.016 0.047 0.064 0.006 0.043 0.048 1,4452015 ConstructionAt-Grade Rail 16.520 216.317 40.424 0.072 0.361 1.740 2.102 0.130 1.578 1.708 53,253Elevated Rail 10.513 150.057 24.307 0.078 0.389 1.129 1.518 0.140 1.013 1.154 34,389Retained Fill Rail 2 0.442 6.305 1.021 0.003 0.016 0.047 0.064 0.006 0.043 0.048 1,4452016 ConstructionAt-Grade Rail 16.520 216.317 40.424 0.072 0.361 1.740 2.102 0.130 1.578 1.708 53,253Elevated Rail 10.513 150.057 24.307 0.078 0.389 1.129 1.518 0.140 1.013 1.154 34,389Retained Fill Rail 2 0.442 6.305 1.021 0.003 0.016 0.047 0.064 0.006 0.043 0.048 1,4452017 Construction 3
At-Grade Rail 12.363 161.874 30.250 0.054 0.270 1.303 1.573 0.097 1.181 1.278 39,818Elevated Rail 7.757 110.158 18.100 0.058 0.291 0.818 1.108 0.105 0.733 0.838 25,758Retained Fill Rail 2 0.326 4.628 0.760 0.002 0.012 0.034 0.047 0.004 0.031 0.035 1,082
2014 Total 4 27.476 372.679 65.753 0.153 0.767 2.917 3.683 0.277 2.633 2.910 89,0872015 Total 4 27.476 372.679 65.753 0.153 0.767 2.917 3.683 0.277 2.633 2.910 89,0872016 Total 4 27.476 372.679 65.753 0.153 0.767 2.917 3.683 0.277 2.633 2.910 89,0872017 Total 4 20.446 276.660 49.110 0.114 0.573 2.155 2.728 0.207 1.945 2.152 66,658
Notes:1. Emissions were summed based on the presumed schedule, as presented on the 'Schedule' tab in the Data Request, and scaled by the material-scaled length of the Alternative.2. Retained Fill Rail was assumed to use the same equipment and construction schedule as the Elevated Rail.
4. Results include mitigation measures, as discussed on the 'URBEMIS At-Grade Rail' and 'URBEMIS Elev. Rail' tabs.
Construction Phase
Emissions (tpy) 1
3. Laying Track activities in 2017 only occur for the first 3 quarters of the year. While the 'Schedule' tab in the Data Request presents the 3rd quarter as a truncated period, it was conservatively assumed that emissions for a 3-month Q3 would all occur within the 2 month period.

B.1-35 UPRR Ave 21: Construction Emissions from Laying TrackThis tab provides the emissions resulting from construction of at-grade, elevated, and retained fill rail for the UPRR Ave 21 Alternative. Assumptions are documented in the Data Request ('Alignment' and 'Rail Equipment' tabs).
Fugitive Dust Emissions from Track ConstructionParameter Value
Length of Alternative (ft) 381,828Width of Alternative (ft) 120Total Area Disturbed (acres) 1,052Laying Track Duration (years) 3.7Area Disturbed per Day (acre/day) 1.0PM10 Emission Factor (lbs/acre/day) 1, 2 10PM10 Emissions (lbs/day) 3 10.245PM10 Emissions (tpy) 3 1.434PM2.5 Emissions (lbs/day) 3, 4 2.131PM2.5 Emissions (tpy) 3, 4 0.298Notes:Conversion Factor: 1 acre = 43,560 square feetWorking Days per Year = 280 Assumed; consistent with material hauling estimationsConversion Factor: 1 ton = 2,000 lbs1. Emission factor assumes watering twice daily per the programmatic measures.2. A grading emission factor was used to conservatively represent the PM emissions from track construction activities.3. As a conservative approach, mitigated emissions were assumed equal to unmitigated emissions.4. Assumed PM2.5 emissions were 20.8% of the PM10 emissions,
Calculated; see notes below.Calculated; see notes below.
Calculated; see notes below.Calculated; see notes below.
based on the construction data provided in Appendix A of the SCAQMD's Final - Methodology to Calculate Particulate Matter (PM) 2.5 and PM 2.5 Significance Thresholds (2006).
Refer to 'Schedule' tab of the Data Request
Calculated; see notes below.Appendix A, Table A-4 of the URBEMIS2007 User Guide (2007)
CommentsRefer to 'Alternatives' tabRefer to 'Alignment' tab of the Data RequestCalculated; see notes below.
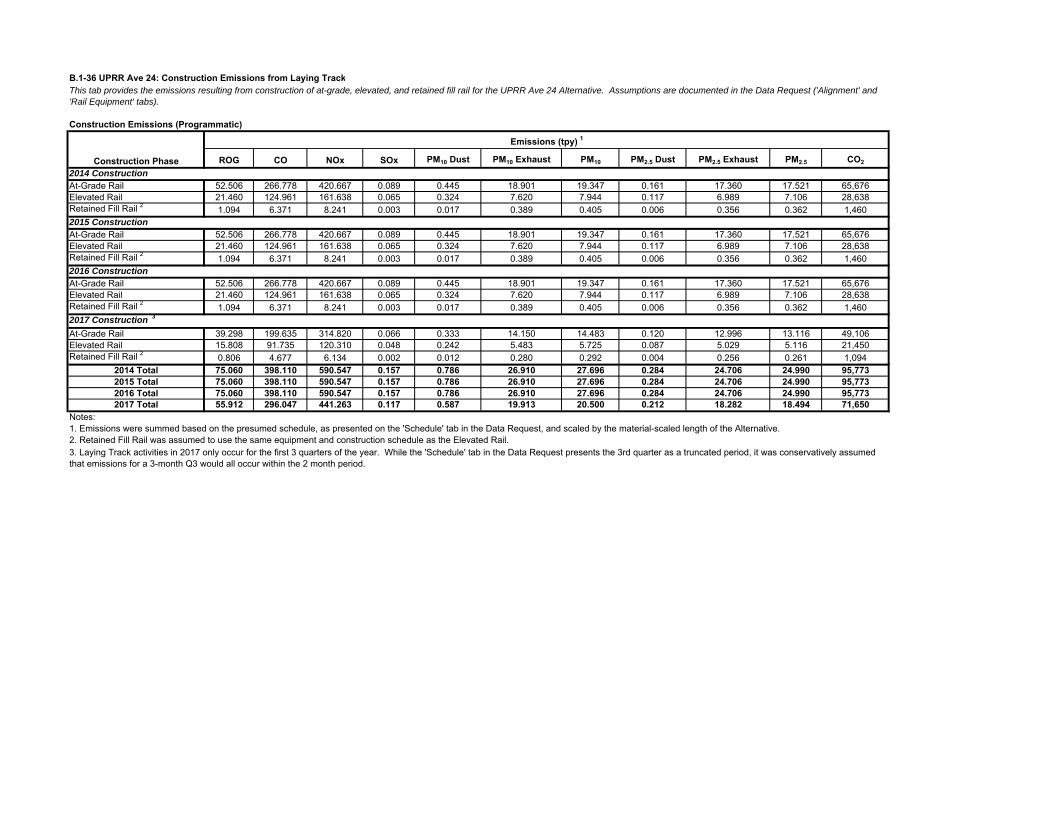
B.1-36 UPRR Ave 24: Construction Emissions from Laying Track
Construction Emissions (Programmatic)
ROG CO NOx SOx PM10 Dust PM10 Exhaust PM10 PM2.5 Dust PM2.5 Exhaust PM2.5 CO2
2014 ConstructionAt-Grade Rail 52.506 266.778 420.667 0.089 0.445 18.901 19.347 0.161 17.360 17.521 65,676Elevated Rail 21.460 124.961 161.638 0.065 0.324 7.620 7.944 0.117 6.989 7.106 28,638Retained Fill Rail 2 1.094 6.371 8.241 0.003 0.017 0.389 0.405 0.006 0.356 0.362 1,4602015 ConstructionAt-Grade Rail 52.506 266.778 420.667 0.089 0.445 18.901 19.347 0.161 17.360 17.521 65,676Elevated Rail 21.460 124.961 161.638 0.065 0.324 7.620 7.944 0.117 6.989 7.106 28,638Retained Fill Rail 2 1.094 6.371 8.241 0.003 0.017 0.389 0.405 0.006 0.356 0.362 1,4602016 ConstructionAt-Grade Rail 52.506 266.778 420.667 0.089 0.445 18.901 19.347 0.161 17.360 17.521 65,676Elevated Rail 21.460 124.961 161.638 0.065 0.324 7.620 7.944 0.117 6.989 7.106 28,638Retained Fill Rail 2 1.094 6.371 8.241 0.003 0.017 0.389 0.405 0.006 0.356 0.362 1,4602017 Construction 3
At-Grade Rail 39.298 199.635 314.820 0.066 0.333 14.150 14.483 0.120 12.996 13.116 49,106Elevated Rail 15.808 91.735 120.310 0.048 0.242 5.483 5.725 0.087 5.029 5.116 21,450Retained Fill Rail 2 0.806 4.677 6.134 0.002 0.012 0.280 0.292 0.004 0.256 0.261 1,094
2014 Total 75.060 398.110 590.547 0.157 0.786 26.910 27.696 0.284 24.706 24.990 95,7732015 Total 75.060 398.110 590.547 0.157 0.786 26.910 27.696 0.284 24.706 24.990 95,7732016 Total 75.060 398.110 590.547 0.157 0.786 26.910 27.696 0.284 24.706 24.990 95,7732017 Total 55.912 296.047 441.263 0.117 0.587 19.913 20.500 0.212 18.282 18.494 71,650
Notes:1. Emissions were summed based on the presumed schedule, as presented on the 'Schedule' tab in the Data Request, and scaled by the material-scaled length of the Alternative.2. Retained Fill Rail was assumed to use the same equipment and construction schedule as the Elevated Rail.
This tab provides the emissions resulting from construction of at-grade, elevated, and retained fill rail for the UPRR Ave 24 Alternative. Assumptions are documented in the Data Request ('Alignment' and 'Rail Equipment' tabs).
Construction Phase
Emissions (tpy) 1
3. Laying Track activities in 2017 only occur for the first 3 quarters of the year. While the 'Schedule' tab in the Data Request presents the 3rd quarter as a truncated period, it was conservatively assumed that emissions for a 3-month Q3 would all occur within the 2 month period.

B.1-36 UPRR Ave 24: Construction Emissions from Laying TrackThis tab provides the emissions resulting from construction of at-grade, elevated, and retained fill rail for the UPRR Ave 24 Alternative. Assumptions are documented in the Data Request ('Alignment' and 'Rail Equipment' tabs).
Construction Emissions (Mitigated)
ROG CO NOx SOx PM10 Dust PM10 Exhaust PM10 PM2.5 Dust PM2.5 Exhaust PM2.5 CO2
2014 ConstructionAt-Grade Rail 20.374 266.778 49.854 0.089 0.445 2.146 2.592 0.161 1.946 2.107 65,676Elevated Rail 8.755 124.961 20.242 0.065 0.324 0.940 1.264 0.117 0.844 0.961 28,638Retained Fill Rail 2 0.446 6.371 1.032 0.003 0.017 0.048 0.064 0.006 0.043 0.049 1,4602015 ConstructionAt-Grade Rail 20.374 266.778 49.854 0.089 0.445 2.146 2.592 0.161 1.946 2.107 65,676Elevated Rail 8.755 124.961 20.242 0.065 0.324 0.940 1.264 0.117 0.844 0.961 28,638Retained Fill Rail 2 0.446 6.371 1.032 0.003 0.017 0.048 0.064 0.006 0.043 0.049 1,4602016 ConstructionAt-Grade Rail 20.374 266.778 49.854 0.089 0.445 2.146 2.592 0.161 1.946 2.107 65,676Elevated Rail 8.755 124.961 20.242 0.065 0.324 0.940 1.264 0.117 0.844 0.961 28,638Retained Fill Rail 2 0.446 6.371 1.032 0.003 0.017 0.048 0.064 0.006 0.043 0.049 1,4602017 Construction 3
At-Grade Rail 15.247 199.635 37.306 0.066 0.333 1.607 1.939 0.120 1.456 1.576 49,106Elevated Rail 6.460 91.735 15.073 0.048 0.242 0.681 0.923 0.087 0.611 0.698 21,450Retained Fill Rail 2 0.329 4.677 0.768 0.002 0.012 0.035 0.047 0.004 0.031 0.036 1,094
2014 Total 4 29.576 398.110 71.128 0.157 0.786 3.134 3.920 0.284 2.833 3.116 95,7732015 Total 4 29.576 398.110 71.128 0.157 0.786 3.134 3.920 0.284 2.833 3.116 95,7732016 Total 4 29.576 398.110 71.128 0.157 0.786 3.134 3.920 0.284 2.833 3.116 95,7732017 Total 4 22.036 296.047 53.148 0.117 0.587 2.322 2.909 0.212 2.098 2.310 71,650
Notes:1. Emissions were summed based on the presumed schedule, as presented on the 'Schedule' tab in the Data Request, and scaled by the material-scaled length of the Alternative.2. Retained Fill Rail was assumed to use the same equipment and construction schedule as the Elevated Rail.
4. Results include mitigation measures, as discussed on the 'URBEMIS At-Grade Rail' and 'URBEMIS Elev. Rail' tabs.
Construction Phase
Emissions (tpy) 1
3. Laying Track activities in 2017 only occur for the first 3 quarters of the year. While the 'Schedule' tab in the Data Request presents the 3rd quarter as a truncated period, it was conservatively assumed that emissions for a 3-month Q3 would all occur within the 2 month period.
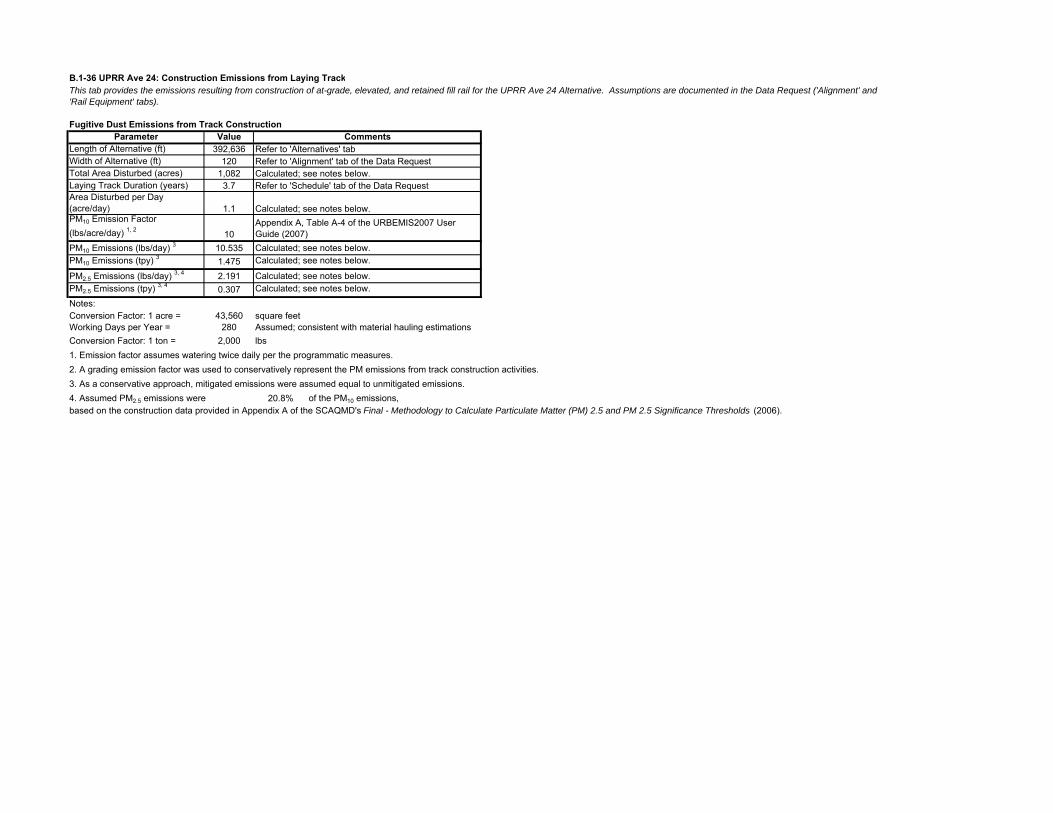
B.1-36 UPRR Ave 24: Construction Emissions from Laying TrackThis tab provides the emissions resulting from construction of at-grade, elevated, and retained fill rail for the UPRR Ave 24 Alternative. Assumptions are documented in the Data Request ('Alignment' and 'Rail Equipment' tabs).
Fugitive Dust Emissions from Track ConstructionParameter Value
Length of Alternative (ft) 392,636Width of Alternative (ft) 120Total Area Disturbed (acres) 1,082Laying Track Duration (years) 3.7Area Disturbed per Day (acre/day) 1.1PM10 Emission Factor (lbs/acre/day) 1, 2 10PM10 Emissions (lbs/day) 3 10.535PM10 Emissions (tpy) 3 1.475PM2.5 Emissions (lbs/day) 3, 4 2.191PM2.5 Emissions (tpy) 3, 4 0.307Notes:Conversion Factor: 1 acre = 43,560 square feetWorking Days per Year = 280 Assumed; consistent with material hauling estimationsConversion Factor: 1 ton = 2,000 lbs1. Emission factor assumes watering twice daily per the programmatic measures.2. A grading emission factor was used to conservatively represent the PM emissions from track construction activities.3. As a conservative approach, mitigated emissions were assumed equal to unmitigated emissions.4. Assumed PM2.5 emissions were 20.8% of the PM10 emissions,
Calculated; see notes below.Calculated; see notes below.
Calculated; see notes below.Calculated; see notes below.
based on the construction data provided in Appendix A of the SCAQMD's Final - Methodology to Calculate Particulate Matter (PM) 2.5 and PM 2.5 Significance Thresholds (2006).
Refer to 'Schedule' tab of the Data Request
Calculated; see notes below.Appendix A, Table A-4 of the URBEMIS2007 User Guide (2007)
CommentsRefer to 'Alternatives' tabRefer to 'Alignment' tab of the Data RequestCalculated; see notes below.

B.1-37 Hybrid Ave 24: Construction Emissions from Laying Track
Construction Emissions (Programmatic)
ROG CO NOx SOx PM10 Dust PM10 Exhaust PM10 PM2.5 Dust PM2.5 Exhaust PM2.5 CO2
2014 ConstructionAt-Grade Rail 70.295 357.161 563.187 0.119 0.596 25.305 25.902 0.215 23.242 23.457 87,926Elevated Rail 2.974 17.316 22.399 0.009 0.045 1.056 1.101 0.016 0.969 0.985 3,968Retained Fill Rail 2 1.070 6.233 8.062 0.003 0.016 0.380 0.396 0.006 0.349 0.354 1,4282015 ConstructionAt-Grade Rail 70.295 357.161 563.187 0.119 0.596 25.305 25.902 0.215 23.242 23.457 87,926Elevated Rail 2.974 17.316 22.399 0.009 0.045 1.056 1.101 0.016 0.969 0.985 3,968Retained Fill Rail 2 1.070 6.233 8.062 0.003 0.016 0.380 0.396 0.006 0.349 0.354 1,4282016 ConstructionAt-Grade Rail 70.295 357.161 563.187 0.119 0.596 25.305 25.902 0.215 23.242 23.457 87,926Elevated Rail 2.974 17.316 22.399 0.009 0.045 1.056 1.101 0.016 0.969 0.985 3,968Retained Fill Rail 2 1.070 6.233 8.062 0.003 0.016 0.380 0.396 0.006 0.349 0.354 1,4282017 Construction 3
At-Grade Rail 52.612 267.270 421.479 0.089 0.446 18.944 19.389 0.161 17.399 17.560 65,743Elevated Rail 2.191 12.712 16.672 0.007 0.034 0.760 0.793 0.012 0.697 0.709 2,972Retained Fill Rail 2 0.788 4.575 6.001 0.002 0.012 0.273 0.286 0.004 0.251 0.255 1,070
2014 Total 74.339 380.710 593.648 0.131 0.657 26.741 27.399 0.237 24.559 24.796 93,3232015 Total 74.339 380.710 593.648 0.131 0.657 26.741 27.399 0.237 24.559 24.796 93,3232016 Total 74.339 380.710 593.648 0.131 0.657 26.741 27.399 0.237 24.559 24.796 93,3232017 Total 55.591 284.557 444.151 0.098 0.491 19.977 20.468 0.177 18.347 18.524 69,785
Notes:1. Emissions were summed based on the presumed schedule, as presented on the 'Schedule' tab in the Data Request, and scaled by the material-scaled length of the Alternative.2. Retained Fill Rail was assumed to use the same equipment and construction schedule as the Elevated Rail.
This tab provides the emissions resulting from construction of at-grade, elevated, and retained fill rail for the Hybrid Ave 24 Alternative. Assumptions are documented in the Data Request ('Alignment' and 'Rail Equipment' tabs).
Construction Phase
Emissions (tpy) 1
3. Laying Track activities in 2017 only occur for the first 3 quarters of the year. While the 'Schedule' tab in the Data Request presents the 3rd quarter as a truncated period, it was conservatively assumed that emissions for a 3-month Q3 would all occur within the 2 month period.

B.1-37 Hybrid Ave 24: Construction Emissions from Laying TrackThis tab provides the emissions resulting from construction of at-grade, elevated, and retained fill rail for the Hybrid Ave 24 Alternative. Assumptions are documented in the Data Request ('Alignment' and 'Rail Equipment' tabs).
Construction Emissions (Mitigated)
ROG CO NOx SOx PM10 Dust PM10 Exhaust PM10 PM2.5 Dust PM2.5 Exhaust PM2.5 CO2
2014 ConstructionAt-Grade Rail 27.277 357.161 66.745 0.119 0.596 2.874 3.470 0.215 2.605 2.820 87,926Elevated Rail 1.213 17.316 2.805 0.009 0.045 0.130 0.175 0.016 0.117 0.133 3,968Retained Fill Rail 2 0.437 6.233 1.010 0.003 0.016 0.047 0.063 0.006 0.042 0.048 1,4282015 ConstructionAt-Grade Rail 27.277 357.161 66.745 0.119 0.596 2.874 3.470 0.215 2.605 2.820 87,926Elevated Rail 1.213 17.316 2.805 0.009 0.045 0.130 0.175 0.016 0.117 0.133 3,968Retained Fill Rail 2 0.437 6.233 1.010 0.003 0.016 0.047 0.063 0.006 0.042 0.048 1,4282016 ConstructionAt-Grade Rail 27.277 357.161 66.745 0.119 0.596 2.874 3.470 0.215 2.605 2.820 87,926Elevated Rail 1.213 17.316 2.805 0.009 0.045 0.130 0.175 0.016 0.117 0.133 3,968Retained Fill Rail 2 0.437 6.233 1.010 0.003 0.016 0.047 0.063 0.006 0.042 0.048 1,4282017 Construction 3
At-Grade Rail 20.413 267.270 49.945 0.089 0.446 2.151 2.596 0.161 1.950 2.111 65,743Elevated Rail 0.895 12.712 2.089 0.007 0.034 0.094 0.128 0.012 0.085 0.097 2,972Retained Fill Rail 2 0.322 4.575 0.752 0.002 0.012 0.034 0.046 0.004 0.030 0.035 1,070
2014 Total 4 28.927 380.710 70.559 0.131 0.657 3.051 3.708 0.237 2.764 3.001 93,3232015 Total 4 28.927 380.710 70.559 0.131 0.657 3.051 3.708 0.237 2.764 3.001 93,3232016 Total 4 28.927 380.710 70.559 0.131 0.657 3.051 3.708 0.237 2.764 3.001 93,3232017 Total 4 21.630 284.557 52.786 0.098 0.491 2.279 2.770 0.177 2.065 2.242 69,785
Notes:1. Emissions were summed based on the presumed schedule, as presented on the 'Schedule' tab in the Data Request, and scaled by the material-scaled length of the Alternative.2. Retained Fill Rail was assumed to use the same equipment and construction schedule as the Elevated Rail.
4. Results include mitigation measures, as discussed on the 'URBEMIS At-Grade Rail' and 'URBEMIS Elev. Rail' tabs.
Construction Phase
Emissions (tpy) 1
3. Laying Track activities in 2017 only occur for the first 3 quarters of the year. While the 'Schedule' tab in the Data Request presents the 3rd quarter as a truncated period, it was conservatively assumed that emissions for a 3-month Q3 would all occur within the 2 month period.

B.1-37 Hybrid Ave 24: Construction Emissions from Laying TrackThis tab provides the emissions resulting from construction of at-grade, elevated, and retained fill rail for the Hybrid Ave 24 Alternative. Assumptions are documented in the Data Request ('Alignment' and 'Rail Equipment' tabs).
Fugitive Dust Emissions from Track ConstructionParameter Value
Length of Alternative (ft) 338,349Width of Alternative (ft) 120Total Area Disturbed (acres) 932Laying Track Duration (years) 3.7Area Disturbed per Day (acre/day) 0.9PM10 Emission Factor (lbs/acre/day) 1, 2 10PM10 Emissions (lbs/day) 3 9.079PM10 Emissions (tpy) 3 1.271PM2.5 Emissions (lbs/day) 3, 4 1.888PM2.5 Emissions (tpy) 3, 4 0.264Notes:Conversion Factor: 1 acre = 43,560 square feetWorking Days per Year = 280 Assumed; consistent with material hauling estimationsConversion Factor: 1 ton = 2,000 lbs1. Emission factor assumes watering twice daily per the programmatic measures.2. A grading emission factor was used to conservatively represent the PM emissions from track construction activities.3. As a conservative approach, mitigated emissions were assumed equal to unmitigated emissions.4. Assumed PM2.5 emissions were 20.8% of the PM10 emissions,
Calculated; see notes below.Calculated; see notes below.
Calculated; see notes below.Calculated; see notes below.
based on the construction data provided in Appendix A of the SCAQMD's Final - Methodology to Calculate Particulate Matter (PM) 2.5 and PM 2.5 Significance Thresholds (2006).
Refer to 'Schedule' tab of the Data Request
Calculated; see notes below.Appendix A, Table A-4 of the URBEMIS2007 User Guide (2007)
CommentsRefer to 'Alternatives' tabRefer to 'Alignment' tab of the Data RequestCalculated; see notes below.
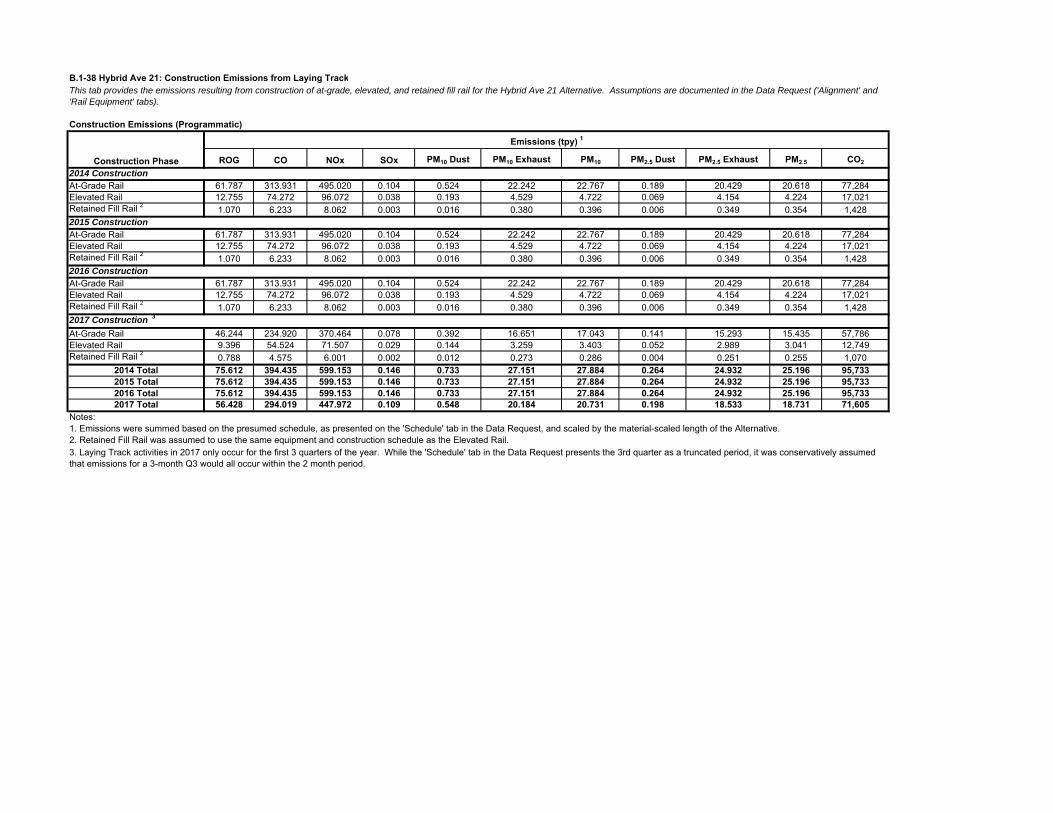
B.1-38 Hybrid Ave 21: Construction Emissions from Laying Track
Construction Emissions (Programmatic)
ROG CO NOx SOx PM10 Dust PM10 Exhaust PM10 PM2.5 Dust PM2.5 Exhaust PM2.5 CO2
2014 ConstructionAt-Grade Rail 61.787 313.931 495.020 0.104 0.524 22.242 22.767 0.189 20.429 20.618 77,284Elevated Rail 12.755 74.272 96.072 0.038 0.193 4.529 4.722 0.069 4.154 4.224 17,021Retained Fill Rail 2 1.070 6.233 8.062 0.003 0.016 0.380 0.396 0.006 0.349 0.354 1,4282015 ConstructionAt-Grade Rail 61.787 313.931 495.020 0.104 0.524 22.242 22.767 0.189 20.429 20.618 77,284Elevated Rail 12.755 74.272 96.072 0.038 0.193 4.529 4.722 0.069 4.154 4.224 17,021Retained Fill Rail 2 1.070 6.233 8.062 0.003 0.016 0.380 0.396 0.006 0.349 0.354 1,4282016 ConstructionAt-Grade Rail 61.787 313.931 495.020 0.104 0.524 22.242 22.767 0.189 20.429 20.618 77,284Elevated Rail 12.755 74.272 96.072 0.038 0.193 4.529 4.722 0.069 4.154 4.224 17,021Retained Fill Rail 2 1.070 6.233 8.062 0.003 0.016 0.380 0.396 0.006 0.349 0.354 1,4282017 Construction 3
At-Grade Rail 46.244 234.920 370.464 0.078 0.392 16.651 17.043 0.141 15.293 15.435 57,786Elevated Rail 9.396 54.524 71.507 0.029 0.144 3.259 3.403 0.052 2.989 3.041 12,749Retained Fill Rail 2 0.788 4.575 6.001 0.002 0.012 0.273 0.286 0.004 0.251 0.255 1,070
2014 Total 75.612 394.435 599.153 0.146 0.733 27.151 27.884 0.264 24.932 25.196 95,7332015 Total 75.612 394.435 599.153 0.146 0.733 27.151 27.884 0.264 24.932 25.196 95,7332016 Total 75.612 394.435 599.153 0.146 0.733 27.151 27.884 0.264 24.932 25.196 95,7332017 Total 56.428 294.019 447.972 0.109 0.548 20.184 20.731 0.198 18.533 18.731 71,605
Notes:1. Emissions were summed based on the presumed schedule, as presented on the 'Schedule' tab in the Data Request, and scaled by the material-scaled length of the Alternative.2. Retained Fill Rail was assumed to use the same equipment and construction schedule as the Elevated Rail.
This tab provides the emissions resulting from construction of at-grade, elevated, and retained fill rail for the Hybrid Ave 21 Alternative. Assumptions are documented in the Data Request ('Alignment' and 'Rail Equipment' tabs).
Construction Phase
Emissions (tpy) 1
3. Laying Track activities in 2017 only occur for the first 3 quarters of the year. While the 'Schedule' tab in the Data Request presents the 3rd quarter as a truncated period, it was conservatively assumed that emissions for a 3-month Q3 would all occur within the 2 month period.

B.1-38 Hybrid Ave 21: Construction Emissions from Laying TrackThis tab provides the emissions resulting from construction of at-grade, elevated, and retained fill rail for the Hybrid Ave 21 Alternative. Assumptions are documented in the Data Request ('Alignment' and 'Rail Equipment' tabs).
Construction Emissions (Mitigated)
ROG CO NOx SOx PM10 Dust PM10 Exhaust PM10 PM2.5 Dust PM2.5 Exhaust PM2.5 CO2
2014 ConstructionAt-Grade Rail 23.975 313.931 58.666 0.104 0.524 2.526 3.050 0.189 2.290 2.479 77,284Elevated Rail 5.204 74.272 12.031 0.038 0.193 0.559 0.751 0.069 0.501 0.571 17,021Retained Fill Rail 2 0.437 6.233 1.010 0.003 0.016 0.047 0.063 0.006 0.042 0.048 1,4282015 ConstructionAt-Grade Rail 23.975 313.931 58.666 0.104 0.524 2.526 3.050 0.189 2.290 2.479 77,284Elevated Rail 5.204 74.272 12.031 0.038 0.193 0.559 0.751 0.069 0.501 0.571 17,021Retained Fill Rail 2 0.437 6.233 1.010 0.003 0.016 0.047 0.063 0.006 0.042 0.048 1,4282016 ConstructionAt-Grade Rail 23.975 313.931 58.666 0.104 0.524 2.526 3.050 0.189 2.290 2.479 77,284Elevated Rail 5.204 74.272 12.031 0.038 0.193 0.559 0.751 0.069 0.501 0.571 17,021Retained Fill Rail 2 0.437 6.233 1.010 0.003 0.016 0.047 0.063 0.006 0.042 0.048 1,4282017 Construction 3
At-Grade Rail 17.942 234.920 43.900 0.078 0.392 1.890 2.282 0.141 1.714 1.855 57,786Elevated Rail 3.839 54.524 8.959 0.029 0.144 0.405 0.549 0.052 0.363 0.415 12,749Retained Fill Rail 2 0.322 4.575 0.752 0.002 0.012 0.034 0.046 0.004 0.030 0.035 1,070
2014 Total 4 29.616 394.435 71.707 0.146 0.733 3.131 3.864 0.264 2.833 3.098 95,7332015 Total 4 29.616 394.435 71.707 0.146 0.733 3.131 3.864 0.264 2.833 3.098 95,7332016 Total 4 29.616 394.435 71.707 0.146 0.733 3.131 3.864 0.264 2.833 3.098 95,7332017 Total 4 22.104 294.019 53.610 0.109 0.548 2.329 2.877 0.198 2.107 2.305 71,605
Notes:1. Emissions were summed based on the presumed schedule, as presented on the 'Schedule' tab in the Data Request, and scaled by the material-scaled length of the Alternative.2. Retained Fill Rail was assumed to use the same equipment and construction schedule as the Elevated Rail.
4. Results include mitigation measures, as discussed on the 'URBEMIS At-Grade Rail' and 'URBEMIS Elev. Rail' tabs.
Construction Phase
Emissions (tpy) 1
3. Laying Track activities in 2017 only occur for the first 3 quarters of the year. While the 'Schedule' tab in the Data Request presents the 3rd quarter as a truncated period, it was conservatively assumed that emissions for a 3-month Q3 would all occur within the 2 month period.

B.1-38 Hybrid Ave 21: Construction Emissions from Laying TrackThis tab provides the emissions resulting from construction of at-grade, elevated, and retained fill rail for the Hybrid Ave 21 Alternative. Assumptions are documented in the Data Request ('Alignment' and 'Rail Equipment' tabs).
Fugitive Dust Emissions from Track ConstructionParameter Value
Length of Alternative (ft) 384,161Width of Alternative (ft) 120Total Area Disturbed (acres) 1,058Laying Track Duration (years) 3.7Area Disturbed per Day (acre/day) 1.0PM10 Emission Factor (lbs/acre/day) 1, 2 10PM10 Emissions (lbs/day) 3 10.308PM10 Emissions (tpy) 3 1.443PM2.5 Emissions (lbs/day) 3, 4 2.144PM2.5 Emissions (tpy) 3, 4 0.300Notes:Conversion Factor: 1 acre = 43,560 square feetWorking Days per Year = 280 Assumed; consistent with material hauling estimationsConversion Factor: 1 ton = 2,000 lbs1. Emission factor assumes watering twice daily per the programmatic measures.2. A grading emission factor was used to conservatively represent the PM emissions from track construction activities.3. As a conservative approach, mitigated emissions were assumed equal to unmitigated emissions.4. Assumed PM2.5 emissions were 20.8% of the PM10 emissions,
Refer to 'Schedule' tab of the Data Request
CommentsRefer to 'Alternatives' tabRefer to 'Alignment' tab of the Data RequestCalculated; see notes below.
based on the construction data provided in Appendix A of the SCAQMD's Final - Methodology to Calculate Particulate Matter (PM) 2.5 and PM 2.5 Significance Thresholds (2006).
Calculated; see notes below.Appendix A, Table A-4 of the URBEMIS2007 User Guide (2007)Calculated; see notes below.Calculated; see notes below.
Calculated; see notes below.Calculated; see notes below.
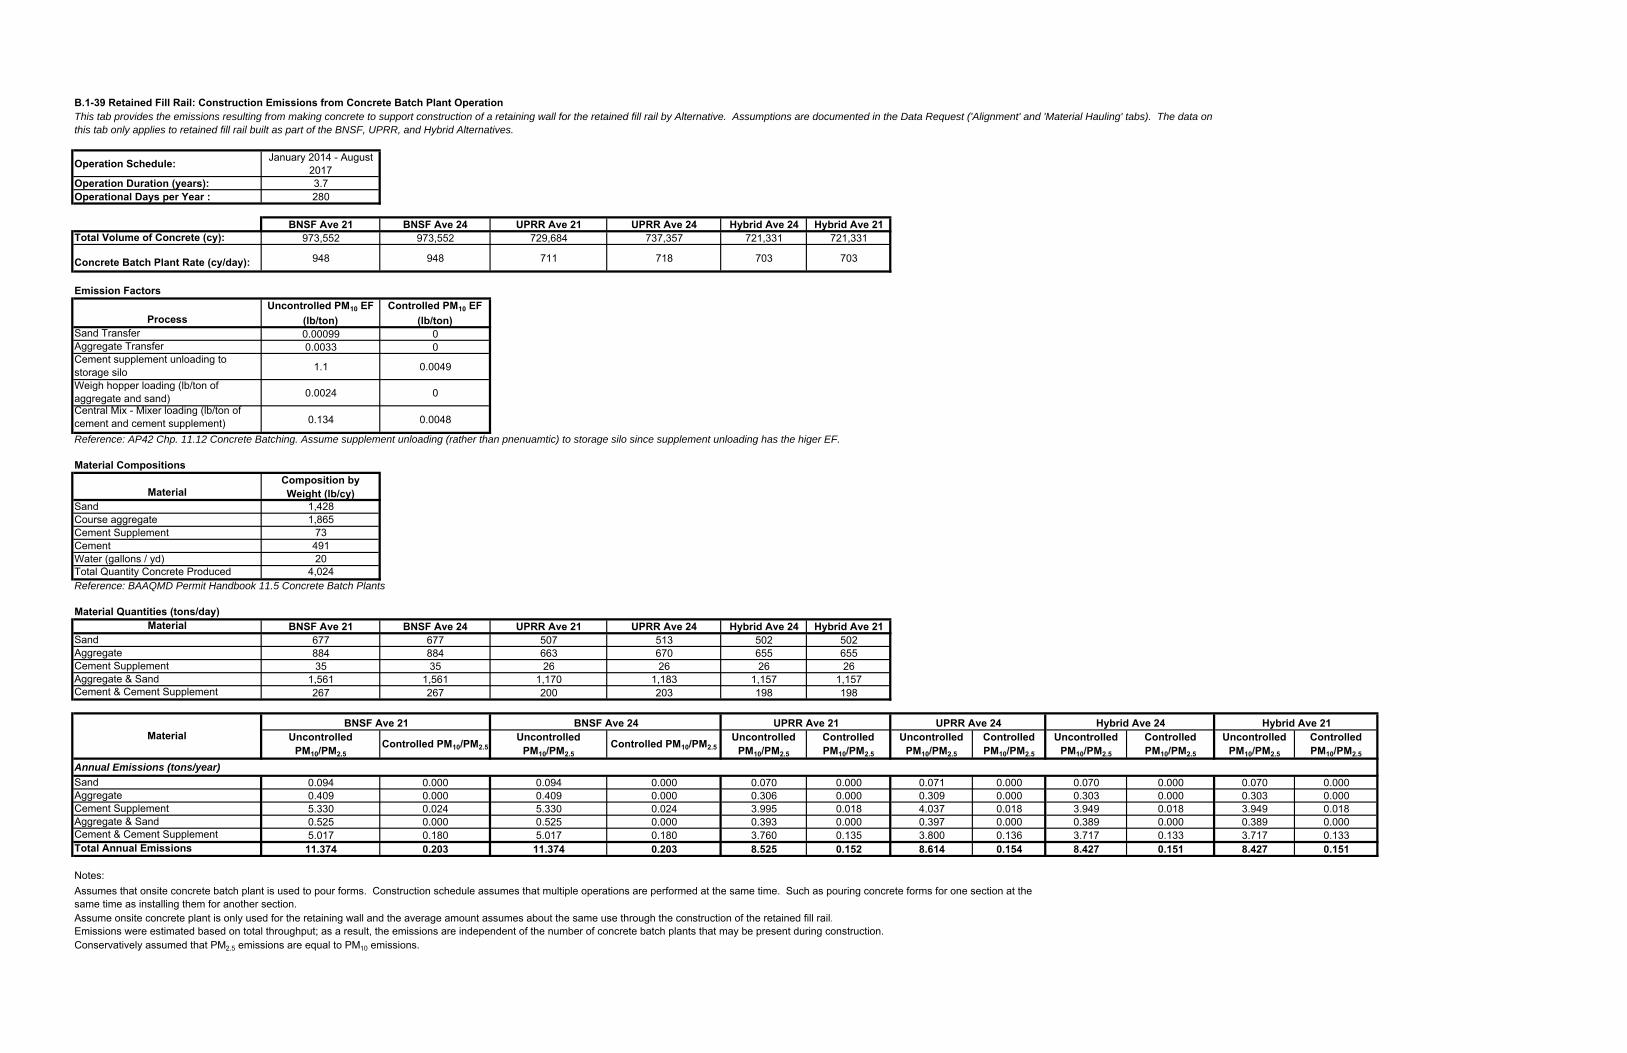
B.1-39 Retained Fill Rail: Construction Emissions from Concrete Batch Plant Operation
Operation Schedule: January 2014 - August 2017
Operation Duration (years): 3.7Operational Days per Year : 280
BNSF Ave 21 BNSF Ave 24 UPRR Ave 21 UPRR Ave 24 Hybrid Ave 24 Hybrid Ave 21Total Volume of Concrete (cy): 973,552 973,552 729,684 737,357 721,331 721,331
Concrete Batch Plant Rate (cy/day): 948 948 711 718 703 703
Emission Factors
ProcessUncontrolled PM10 EF
(lb/ton)Controlled PM10 EF
(lb/ton)Sand Transfer 0.00099 0Aggregate Transfer 0.0033 0Cement supplement unloading to storage silo 1.1 0.0049
Weigh hopper loading (lb/ton of aggregate and sand) 0.0024 0
Central Mix - Mixer loading (lb/ton of cement and cement supplement) 0.134 0.0048
Reference: AP42 Chp. 11.12 Concrete Batching. Assume supplement unloading (rather than pnenuamtic) to storage silo since supplement unloading has the higer EF.
Material Compositions
MaterialComposition by Weight (lb/cy)
Sand 1,428Course aggregate 1,865Cement Supplement 73Cement 491Water (gallons / yd) 20Total Quantity Concrete Produced 4,024Reference: BAAQMD Permit Handbook 11.5 Concrete Batch Plants
Material Quantities (tons/day)Material BNSF Ave 21 BNSF Ave 24 UPRR Ave 21 UPRR Ave 24 Hybrid Ave 24 Hybrid Ave 21
Sand 677 677 507 513 502 502Aggregate 884 884 663 670 655 655Cement Supplement 35 35 26 26 26 26Aggregate & Sand 1,561 1,561 1,170 1,183 1,157 1,157Cement & Cement Supplement 267 267 200 203 198 198
Uncontrolled PM10/PM2.5
Controlled PM10/PM2.5Uncontrolled
PM10/PM2.5Controlled PM10/PM2.5
Uncontrolled PM10/PM2.5
Controlled PM10/PM2.5
Uncontrolled PM10/PM2.5
Controlled PM10/PM2.5
Uncontrolled PM10/PM2.5
Controlled PM10/PM2.5
Uncontrolled PM10/PM2.5
Controlled PM10/PM2.5
Annual Emissions (tons/year)
Sand 0.094 0.000 0.094 0.000 0.070 0.000 0.071 0.000 0.070 0.000 0.070 0.000Aggregate 0.409 0.000 0.409 0.000 0.306 0.000 0.309 0.000 0.303 0.000 0.303 0.000Cement Supplement 5.330 0.024 5.330 0.024 3.995 0.018 4.037 0.018 3.949 0.018 3.949 0.018Aggregate & Sand 0.525 0.000 0.525 0.000 0.393 0.000 0.397 0.000 0.389 0.000 0.389 0.000Cement & Cement Supplement 5.017 0.180 5.017 0.180 3.760 0.135 3.800 0.136 3.717 0.133 3.717 0.133Total Annual Emissions 11.374 0.203 11.374 0.203 8.525 0.152 8.614 0.154 8.427 0.151 8.427 0.151
Notes:
Assume onsite concrete plant is only used for the retaining wall and the average amount assumes about the same use through the construction of the retained fill rail.Emissions were estimated based on total throughput; as a result, the emissions are independent of the number of concrete batch plants that may be present during construction.Conservatively assumed that PM2.5 emissions are equal to PM10 emissions.
Hybrid Ave 21
Assumes that onsite concrete batch plant is used to pour forms. Construction schedule assumes that multiple operations are performed at the same time. Such as pouring concrete forms for one section at the same time as installing them for another section.
This tab provides the emissions resulting from making concrete to support construction of a retaining wall for the retained fill rail by Alternative. Assumptions are documented in the Data Request ('Alignment' and 'Material Hauling' tabs). The data on this tab only applies to retained fill rail built as part of the BNSF, UPRR, and Hybrid Alternatives.
MaterialBNSF Ave 21 BNSF Ave 24 UPRR Ave 21 UPRR Ave 24 Hybrid Ave 24

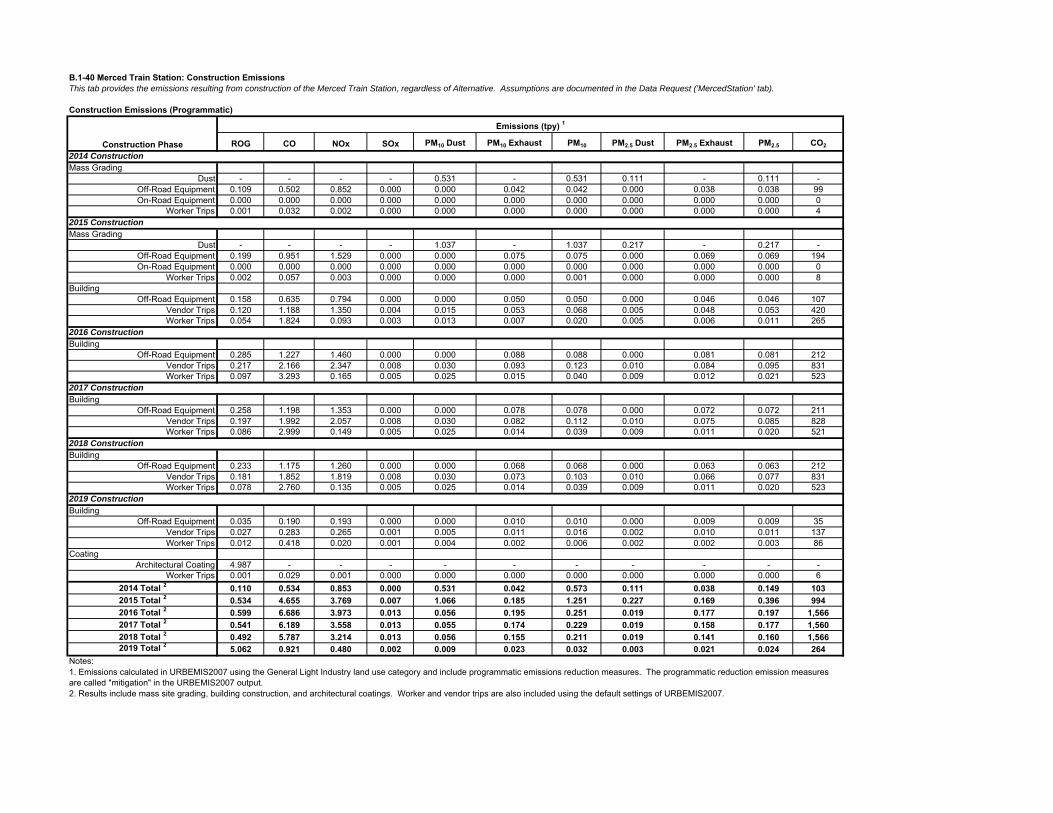
B.1-40 Merced Train Station: Construction EmissionsThis tab provides the emissions resulting from construction of the Merced Train Station, regardless of Alternative. Assumptions are documented in the Data Request ('MercedStation' tab).
Construction Emissions (Programmatic)
ROG CO NOx SOx PM10 Dust PM10 Exhaust PM10 PM2.5 Dust PM2.5 Exhaust PM2.5 CO2
2014 ConstructionMass Grading
Dust - - - - 0.531 - 0.531 0.111 - 0.111 -Off-Road Equipment 0.109 0.502 0.852 0.000 0.000 0.042 0.042 0.000 0.038 0.038 99On-Road Equipment 0.000 0.000 0.000 0.000 0.000 0.000 0.000 0.000 0.000 0.000 0
Worker Trips 0.001 0.032 0.002 0.000 0.000 0.000 0.000 0.000 0.000 0.000 42015 ConstructionMass Grading
Dust - - - - 1.037 - 1.037 0.217 - 0.217 -Off-Road Equipment 0.199 0.951 1.529 0.000 0.000 0.075 0.075 0.000 0.069 0.069 194On-Road Equipment 0.000 0.000 0.000 0.000 0.000 0.000 0.000 0.000 0.000 0.000 0
Worker Trips 0.002 0.057 0.003 0.000 0.000 0.000 0.001 0.000 0.000 0.000 8Building
Off-Road Equipment 0.158 0.635 0.794 0.000 0.000 0.050 0.050 0.000 0.046 0.046 107Vendor Trips 0.120 1.188 1.350 0.004 0.015 0.053 0.068 0.005 0.048 0.053 420Worker Trips 0.054 1.824 0.093 0.003 0.013 0.007 0.020 0.005 0.006 0.011 265
2016 ConstructionBuilding
Off-Road Equipment 0.285 1.227 1.460 0.000 0.000 0.088 0.088 0.000 0.081 0.081 212Vendor Trips 0.217 2.166 2.347 0.008 0.030 0.093 0.123 0.010 0.084 0.095 831Worker Trips 0.097 3.293 0.165 0.005 0.025 0.015 0.040 0.009 0.012 0.021 523
2017 ConstructionBuilding
Off-Road Equipment 0.258 1.198 1.353 0.000 0.000 0.078 0.078 0.000 0.072 0.072 211Vendor Trips 0.197 1.992 2.057 0.008 0.030 0.082 0.112 0.010 0.075 0.085 828Worker Trips 0.086 2.999 0.149 0.005 0.025 0.014 0.039 0.009 0.011 0.020 521
2018 ConstructionBuilding
Off-Road Equipment 0.233 1.175 1.260 0.000 0.000 0.068 0.068 0.000 0.063 0.063 212Vendor Trips 0.181 1.852 1.819 0.008 0.030 0.073 0.103 0.010 0.066 0.077 831Worker Trips 0.078 2.760 0.135 0.005 0.025 0.014 0.039 0.009 0.011 0.020 523
2019 ConstructionBuilding
Off-Road Equipment 0.035 0.190 0.193 0.000 0.000 0.010 0.010 0.000 0.009 0.009 35Vendor Trips 0.027 0.283 0.265 0.001 0.005 0.011 0.016 0.002 0.010 0.011 137Worker Trips 0.012 0.418 0.020 0.001 0.004 0.002 0.006 0.002 0.002 0.003 86
CoatingArchitectural Coating 4.987 - - - - - - - - - -
Worker Trips 0.001 0.029 0.001 0.000 0.000 0.000 0.000 0.000 0.000 0.000 62014 Total 2 0.110 0.534 0.853 0.000 0.531 0.042 0.573 0.111 0.038 0.149 1032015 Total 2 0.534 4.655 3.769 0.007 1.066 0.185 1.251 0.227 0.169 0.396 9942016 Total 2 0.599 6.686 3.973 0.013 0.056 0.195 0.251 0.019 0.177 0.197 1,5662017 Total 2 0.541 6.189 3.558 0.013 0.055 0.174 0.229 0.019 0.158 0.177 1,5602018 Total 2 0.492 5.787 3.214 0.013 0.056 0.155 0.211 0.019 0.141 0.160 1,5662019 Total 2 5.062 0.921 0.480 0.002 0.009 0.023 0.032 0.003 0.021 0.024 264
Notes:
2. Results include mass site grading, building construction, and architectural coatings. Worker and vendor trips are also included using the default settings of URBEMIS2007.
Emissions (tpy) 1
Construction Phase
1. Emissions calculated in URBEMIS2007 using the General Light Industry land use category and include programmatic emissions reduction measures. The programmatic reduction emission measures are called "mitigation" in the URBEMIS2007 output.
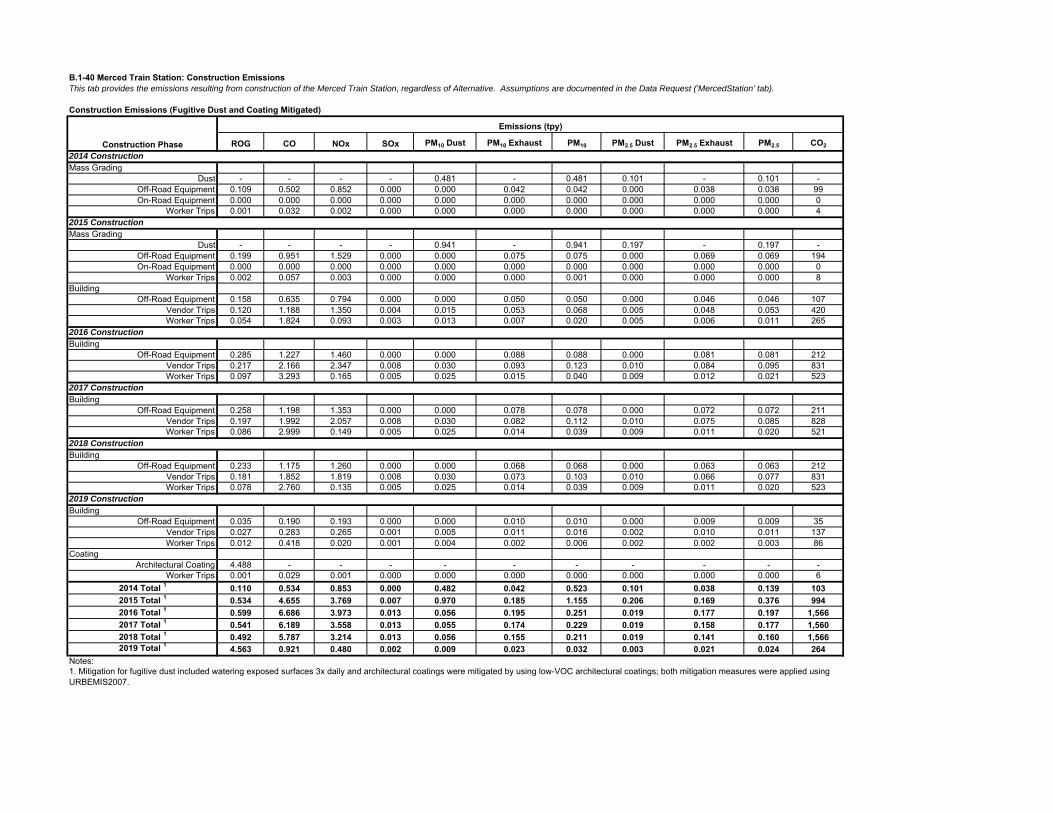
B.1-40 Merced Train Station: Construction EmissionsThis tab provides the emissions resulting from construction of the Merced Train Station, regardless of Alternative. Assumptions are documented in the Data Request ('MercedStation' tab).
Construction Emissions (Fugitive Dust and Coating Mitigated)
ROG CO NOx SOx PM10 Dust PM10 Exhaust PM10 PM2.5 Dust PM2.5 Exhaust PM2.5 CO2
2014 ConstructionMass Grading
Dust - - - - 0.481 - 0.481 0.101 - 0.101 -Off-Road Equipment 0.109 0.502 0.852 0.000 0.000 0.042 0.042 0.000 0.038 0.038 99On-Road Equipment 0.000 0.000 0.000 0.000 0.000 0.000 0.000 0.000 0.000 0.000 0
Worker Trips 0.001 0.032 0.002 0.000 0.000 0.000 0.000 0.000 0.000 0.000 42015 ConstructionMass Grading
Dust - - - - 0.941 - 0.941 0.197 - 0.197 -Off-Road Equipment 0.199 0.951 1.529 0.000 0.000 0.075 0.075 0.000 0.069 0.069 194On-Road Equipment 0.000 0.000 0.000 0.000 0.000 0.000 0.000 0.000 0.000 0.000 0
Worker Trips 0.002 0.057 0.003 0.000 0.000 0.000 0.001 0.000 0.000 0.000 8Building
Off-Road Equipment 0.158 0.635 0.794 0.000 0.000 0.050 0.050 0.000 0.046 0.046 107Vendor Trips 0.120 1.188 1.350 0.004 0.015 0.053 0.068 0.005 0.048 0.053 420Worker Trips 0.054 1.824 0.093 0.003 0.013 0.007 0.020 0.005 0.006 0.011 265
2016 ConstructionBuilding
Off-Road Equipment 0.285 1.227 1.460 0.000 0.000 0.088 0.088 0.000 0.081 0.081 212Vendor Trips 0.217 2.166 2.347 0.008 0.030 0.093 0.123 0.010 0.084 0.095 831Worker Trips 0.097 3.293 0.165 0.005 0.025 0.015 0.040 0.009 0.012 0.021 523
2017 ConstructionBuilding
Off-Road Equipment 0.258 1.198 1.353 0.000 0.000 0.078 0.078 0.000 0.072 0.072 211Vendor Trips 0.197 1.992 2.057 0.008 0.030 0.082 0.112 0.010 0.075 0.085 828Worker Trips 0.086 2.999 0.149 0.005 0.025 0.014 0.039 0.009 0.011 0.020 521
2018 ConstructionBuilding
Off-Road Equipment 0.233 1.175 1.260 0.000 0.000 0.068 0.068 0.000 0.063 0.063 212Vendor Trips 0.181 1.852 1.819 0.008 0.030 0.073 0.103 0.010 0.066 0.077 831Worker Trips 0.078 2.760 0.135 0.005 0.025 0.014 0.039 0.009 0.011 0.020 523
2019 ConstructionBuilding
Off-Road Equipment 0.035 0.190 0.193 0.000 0.000 0.010 0.010 0.000 0.009 0.009 35Vendor Trips 0.027 0.283 0.265 0.001 0.005 0.011 0.016 0.002 0.010 0.011 137Worker Trips 0.012 0.418 0.020 0.001 0.004 0.002 0.006 0.002 0.002 0.003 86
CoatingArchitectural Coating 4.488 - - - - - - - - - -
Worker Trips 0.001 0.029 0.001 0.000 0.000 0.000 0.000 0.000 0.000 0.000 62014 Total 1 0.110 0.534 0.853 0.000 0.482 0.042 0.523 0.101 0.038 0.139 1032015 Total 1 0.534 4.655 3.769 0.007 0.970 0.185 1.155 0.206 0.169 0.376 9942016 Total 1 0.599 6.686 3.973 0.013 0.056 0.195 0.251 0.019 0.177 0.197 1,5662017 Total 1 0.541 6.189 3.558 0.013 0.055 0.174 0.229 0.019 0.158 0.177 1,5602018 Total 1 0.492 5.787 3.214 0.013 0.056 0.155 0.211 0.019 0.141 0.160 1,5662019 Total 1 4.563 0.921 0.480 0.002 0.009 0.023 0.032 0.003 0.021 0.024 264
Notes:
Construction Phase
Emissions (tpy)
1. Mitigation for fugitive dust included watering exposed surfaces 3x daily and architectural coatings were mitigated by using low-VOC architectural coatings; both mitigation measures were applied using URBEMIS2007.
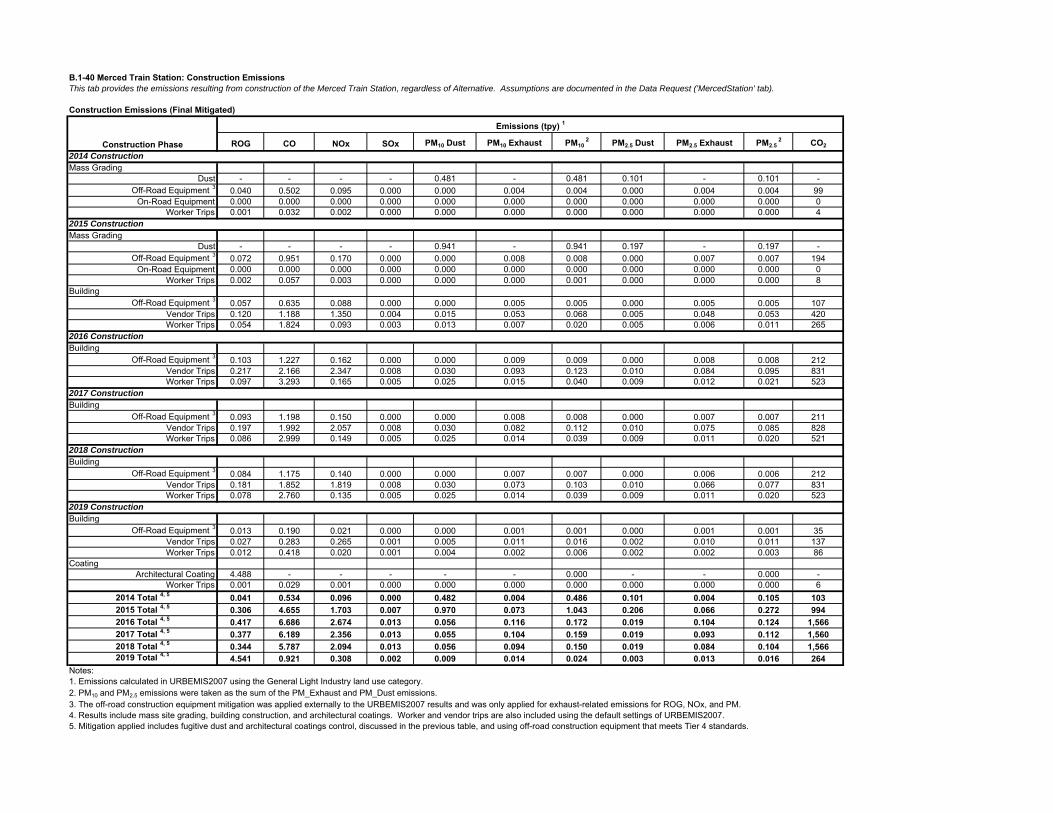
B.1-40 Merced Train Station: Construction EmissionsThis tab provides the emissions resulting from construction of the Merced Train Station, regardless of Alternative. Assumptions are documented in the Data Request ('MercedStation' tab).
Construction Emissions (Final Mitigated)
ROG CO NOx SOx PM10 Dust PM10 Exhaust PM10 2 PM2.5 Dust PM2.5 Exhaust PM2.5
2 CO2
2014 ConstructionMass Grading
Dust - - - - 0.481 - 0.481 0.101 - 0.101 -Off-Road Equipment 3 0.040 0.502 0.095 0.000 0.000 0.004 0.004 0.000 0.004 0.004 99
On-Road Equipment 0.000 0.000 0.000 0.000 0.000 0.000 0.000 0.000 0.000 0.000 0Worker Trips 0.001 0.032 0.002 0.000 0.000 0.000 0.000 0.000 0.000 0.000 4
2015 ConstructionMass Grading
Dust - - - - 0.941 - 0.941 0.197 - 0.197 -Off-Road Equipment 3 0.072 0.951 0.170 0.000 0.000 0.008 0.008 0.000 0.007 0.007 194
On-Road Equipment 0.000 0.000 0.000 0.000 0.000 0.000 0.000 0.000 0.000 0.000 0Worker Trips 0.002 0.057 0.003 0.000 0.000 0.000 0.001 0.000 0.000 0.000 8
BuildingOff-Road Equipment 3 0.057 0.635 0.088 0.000 0.000 0.005 0.005 0.000 0.005 0.005 107
Vendor Trips 0.120 1.188 1.350 0.004 0.015 0.053 0.068 0.005 0.048 0.053 420Worker Trips 0.054 1.824 0.093 0.003 0.013 0.007 0.020 0.005 0.006 0.011 265
2016 ConstructionBuilding
Off-Road Equipment 3 0.103 1.227 0.162 0.000 0.000 0.009 0.009 0.000 0.008 0.008 212Vendor Trips 0.217 2.166 2.347 0.008 0.030 0.093 0.123 0.010 0.084 0.095 831Worker Trips 0.097 3.293 0.165 0.005 0.025 0.015 0.040 0.009 0.012 0.021 523
2017 ConstructionBuilding
Off-Road Equipment 3 0.093 1.198 0.150 0.000 0.000 0.008 0.008 0.000 0.007 0.007 211Vendor Trips 0.197 1.992 2.057 0.008 0.030 0.082 0.112 0.010 0.075 0.085 828Worker Trips 0.086 2.999 0.149 0.005 0.025 0.014 0.039 0.009 0.011 0.020 521
2018 ConstructionBuilding
Off-Road Equipment 3 0.084 1.175 0.140 0.000 0.000 0.007 0.007 0.000 0.006 0.006 212Vendor Trips 0.181 1.852 1.819 0.008 0.030 0.073 0.103 0.010 0.066 0.077 831Worker Trips 0.078 2.760 0.135 0.005 0.025 0.014 0.039 0.009 0.011 0.020 523
2019 ConstructionBuilding
Off-Road Equipment 3 0.013 0.190 0.021 0.000 0.000 0.001 0.001 0.000 0.001 0.001 35Vendor Trips 0.027 0.283 0.265 0.001 0.005 0.011 0.016 0.002 0.010 0.011 137Worker Trips 0.012 0.418 0.020 0.001 0.004 0.002 0.006 0.002 0.002 0.003 86
CoatingArchitectural Coating 4.488 - - - - - 0.000 - - 0.000 -
Worker Trips 0.001 0.029 0.001 0.000 0.000 0.000 0.000 0.000 0.000 0.000 62014 Total 4, 5 0.041 0.534 0.096 0.000 0.482 0.004 0.486 0.101 0.004 0.105 1032015 Total 4, 5 0.306 4.655 1.703 0.007 0.970 0.073 1.043 0.206 0.066 0.272 9942016 Total 4, 5 0.417 6.686 2.674 0.013 0.056 0.116 0.172 0.019 0.104 0.124 1,5662017 Total 4, 5 0.377 6.189 2.356 0.013 0.055 0.104 0.159 0.019 0.093 0.112 1,5602018 Total 4, 5 0.344 5.787 2.094 0.013 0.056 0.094 0.150 0.019 0.084 0.104 1,5662019 Total 4, 5 4.541 0.921 0.308 0.002 0.009 0.014 0.024 0.003 0.013 0.016 264
Notes:1. Emissions calculated in URBEMIS2007 using the General Light Industry land use category.2. PM10 and PM2.5 emissions were taken as the sum of the PM_Exhaust and PM_Dust emissions.3. The off-road construction equipment mitigation was applied externally to the URBEMIS2007 results and was only applied for exhaust-related emissions for ROG, NOx, and PM.4. Results include mass site grading, building construction, and architectural coatings. Worker and vendor trips are also included using the default settings of URBEMIS2007.5. Mitigation applied includes fugitive dust and architectural coatings control, discussed in the previous table, and using off-road construction equipment that meets Tier 4 standards.
Construction Phase
Emissions (tpy) 1
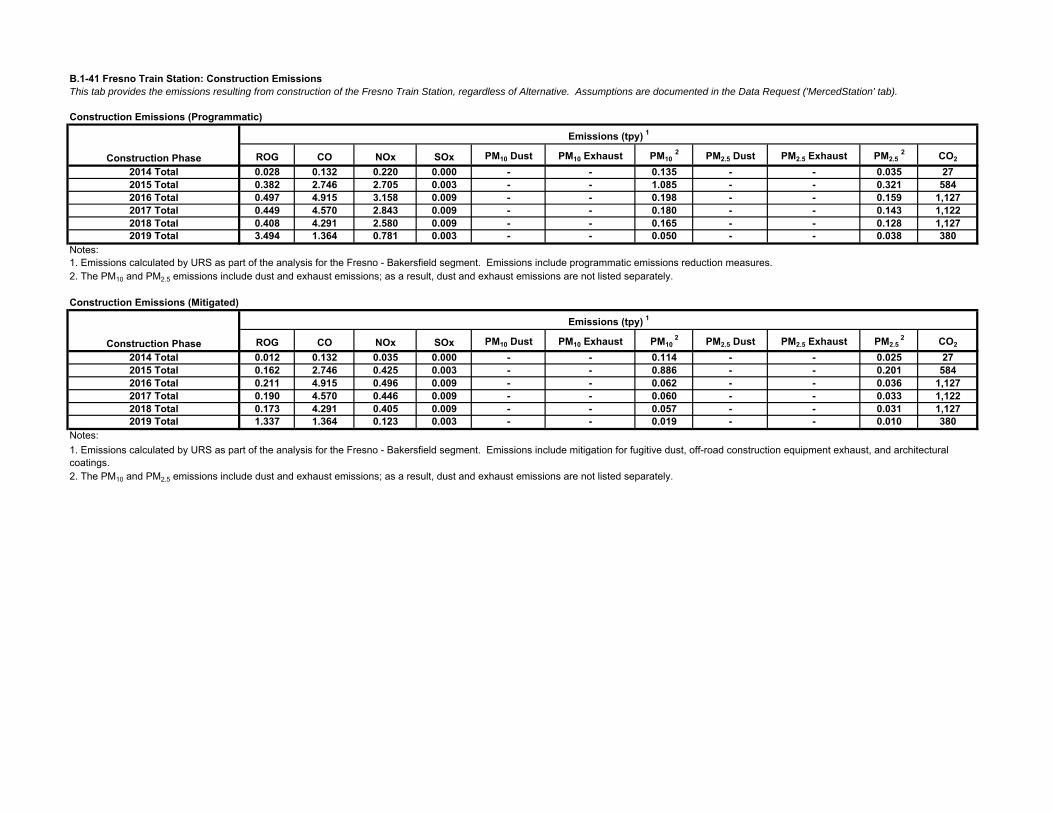
B.1-41 Fresno Train Station: Construction EmissionsThis tab provides the emissions resulting from construction of the Fresno Train Station, regardless of Alternative. Assumptions are documented in the Data Request ('MercedStation' tab).
Construction Emissions (Programmatic)
ROG CO NOx SOx PM10 Dust PM10 Exhaust PM10 2 PM2.5 Dust PM2.5 Exhaust PM2.5
2 CO2
2014 Total 0.028 0.132 0.220 0.000 - - 0.135 - - 0.035 272015 Total 0.382 2.746 2.705 0.003 - - 1.085 - - 0.321 5842016 Total 0.497 4.915 3.158 0.009 - - 0.198 - - 0.159 1,1272017 Total 0.449 4.570 2.843 0.009 - - 0.180 - - 0.143 1,1222018 Total 0.408 4.291 2.580 0.009 - - 0.165 - - 0.128 1,1272019 Total 3.494 1.364 0.781 0.003 - - 0.050 - - 0.038 380
Notes:
2. The PM10 and PM2.5 emissions include dust and exhaust emissions; as a result, dust and exhaust emissions are not listed separately.
Construction Emissions (Mitigated)
ROG CO NOx SOx PM10 Dust PM10 Exhaust PM10 2 PM2.5 Dust PM2.5 Exhaust PM2.5
2 CO2
2014 Total 0.012 0.132 0.035 0.000 - - 0.114 - - 0.025 272015 Total 0.162 2.746 0.425 0.003 - - 0.886 - - 0.201 5842016 Total 0.211 4.915 0.496 0.009 - - 0.062 - - 0.036 1,1272017 Total 0.190 4.570 0.446 0.009 - - 0.060 - - 0.033 1,1222018 Total 0.173 4.291 0.405 0.009 - - 0.057 - - 0.031 1,1272019 Total 1.337 1.364 0.123 0.003 - - 0.019 - - 0.010 380
Notes:
2. The PM10 and PM2.5 emissions include dust and exhaust emissions; as a result, dust and exhaust emissions are not listed separately.
1. Emissions calculated by URS as part of the analysis for the Fresno - Bakersfield segment. Emissions include mitigation for fugitive dust, off-road construction equipment exhaust, and architectural coatings.
Construction Phase
Emissions (tpy) 1
1. Emissions calculated by URS as part of the analysis for the Fresno - Bakersfield segment. Emissions include programmatic emissions reduction measures.
Construction Phase
Emissions (tpy) 1
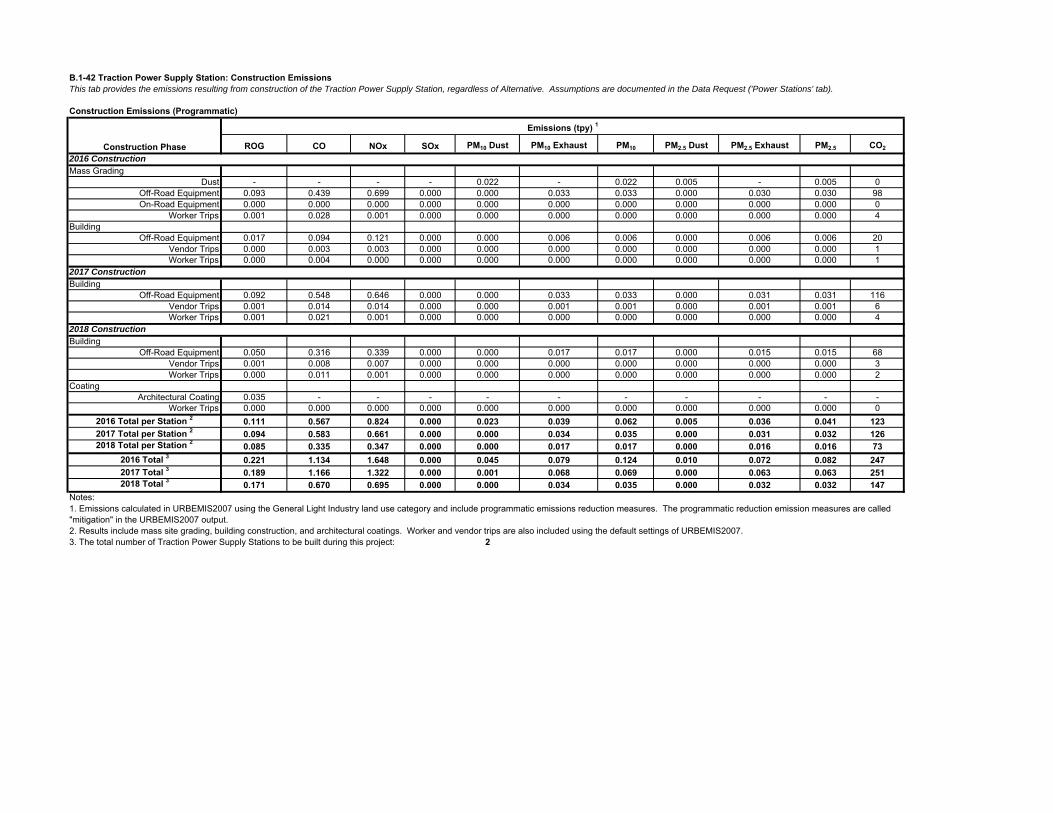
B.1-42 Traction Power Supply Station: Construction EmissionsThis tab provides the emissions resulting from construction of the Traction Power Supply Station, regardless of Alternative. Assumptions are documented in the Data Request ('Power Stations' tab).
Construction Emissions (Programmatic)
ROG CO NOx SOx PM10 Dust PM10 Exhaust PM10 PM2.5 Dust PM2.5 Exhaust PM2.5 CO2
2016 ConstructionMass Grading
Dust - - - - 0.022 - 0.022 0.005 - 0.005 0Off-Road Equipment 0.093 0.439 0.699 0.000 0.000 0.033 0.033 0.000 0.030 0.030 98On-Road Equipment 0.000 0.000 0.000 0.000 0.000 0.000 0.000 0.000 0.000 0.000 0
Worker Trips 0.001 0.028 0.001 0.000 0.000 0.000 0.000 0.000 0.000 0.000 4Building
Off-Road Equipment 0.017 0.094 0.121 0.000 0.000 0.006 0.006 0.000 0.006 0.006 20Vendor Trips 0.000 0.003 0.003 0.000 0.000 0.000 0.000 0.000 0.000 0.000 1Worker Trips 0.000 0.004 0.000 0.000 0.000 0.000 0.000 0.000 0.000 0.000 1
2017 ConstructionBuilding
Off-Road Equipment 0.092 0.548 0.646 0.000 0.000 0.033 0.033 0.000 0.031 0.031 116Vendor Trips 0.001 0.014 0.014 0.000 0.000 0.001 0.001 0.000 0.001 0.001 6Worker Trips 0.001 0.021 0.001 0.000 0.000 0.000 0.000 0.000 0.000 0.000 4
2018 ConstructionBuilding
Off-Road Equipment 0.050 0.316 0.339 0.000 0.000 0.017 0.017 0.000 0.015 0.015 68Vendor Trips 0.001 0.008 0.007 0.000 0.000 0.000 0.000 0.000 0.000 0.000 3Worker Trips 0.000 0.011 0.001 0.000 0.000 0.000 0.000 0.000 0.000 0.000 2
CoatingArchitectural Coating 0.035 - - - - - - - - - -
Worker Trips 0.000 0.000 0.000 0.000 0.000 0.000 0.000 0.000 0.000 0.000 02016 Total per Station 2 0.111 0.567 0.824 0.000 0.023 0.039 0.062 0.005 0.036 0.041 1232017 Total per Station 2 0.094 0.583 0.661 0.000 0.000 0.034 0.035 0.000 0.031 0.032 1262018 Total per Station 2 0.085 0.335 0.347 0.000 0.000 0.017 0.017 0.000 0.016 0.016 73
2016 Total 3 0.221 1.134 1.648 0.000 0.045 0.079 0.124 0.010 0.072 0.082 2472017 Total 3 0.189 1.166 1.322 0.000 0.001 0.068 0.069 0.000 0.063 0.063 2512018 Total 3 0.171 0.670 0.695 0.000 0.000 0.034 0.035 0.000 0.032 0.032 147
Notes:
2. Results include mass site grading, building construction, and architectural coatings. Worker and vendor trips are also included using the default settings of URBEMIS2007.3. The total number of Traction Power Supply Stations to be built during this project: 2
Construction Phase
Emissions (tpy) 1
1. Emissions calculated in URBEMIS2007 using the General Light Industry land use category and include programmatic emissions reduction measures. The programmatic reduction emission measures are called "mitigation" in the URBEMIS2007 output.
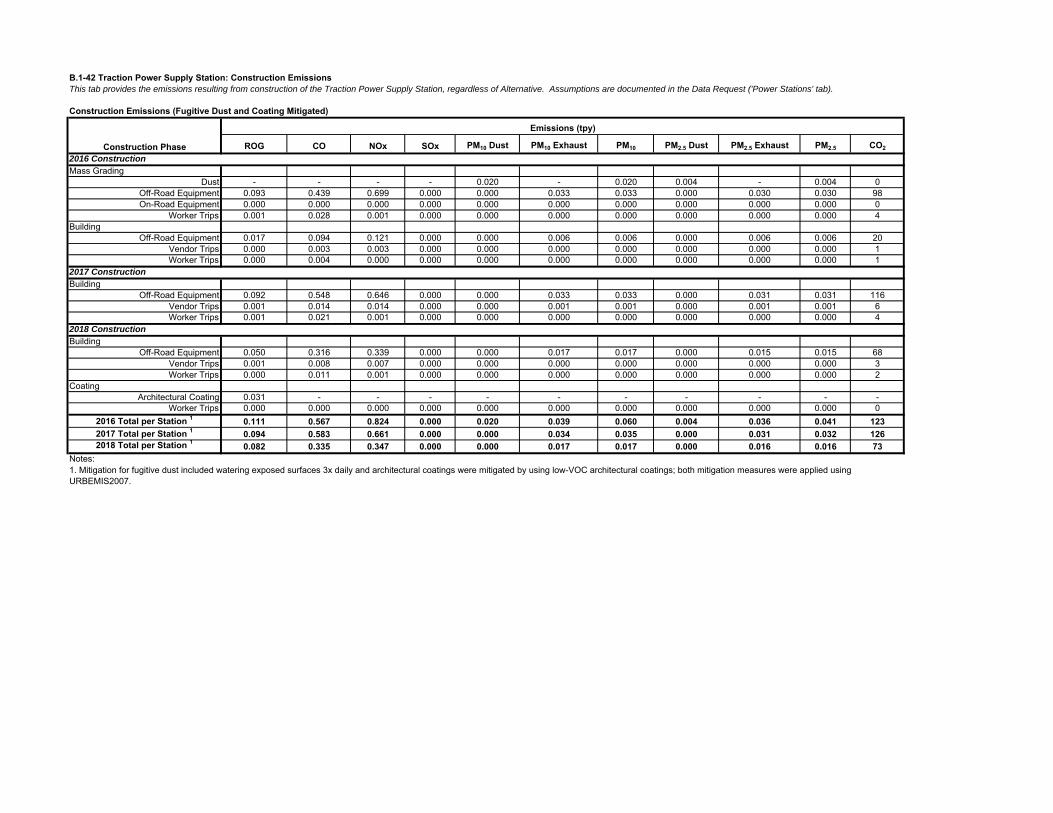
B.1-42 Traction Power Supply Station: Construction EmissionsThis tab provides the emissions resulting from construction of the Traction Power Supply Station, regardless of Alternative. Assumptions are documented in the Data Request ('Power Stations' tab).
Construction Emissions (Fugitive Dust and Coating Mitigated)
ROG CO NOx SOx PM10 Dust PM10 Exhaust PM10 PM2.5 Dust PM2.5 Exhaust PM2.5 CO2
2016 ConstructionMass Grading
Dust - - - - 0.020 - 0.020 0.004 - 0.004 0Off-Road Equipment 0.093 0.439 0.699 0.000 0.000 0.033 0.033 0.000 0.030 0.030 98On-Road Equipment 0.000 0.000 0.000 0.000 0.000 0.000 0.000 0.000 0.000 0.000 0
Worker Trips 0.001 0.028 0.001 0.000 0.000 0.000 0.000 0.000 0.000 0.000 4Building
Off-Road Equipment 0.017 0.094 0.121 0.000 0.000 0.006 0.006 0.000 0.006 0.006 20Vendor Trips 0.000 0.003 0.003 0.000 0.000 0.000 0.000 0.000 0.000 0.000 1Worker Trips 0.000 0.004 0.000 0.000 0.000 0.000 0.000 0.000 0.000 0.000 1
2017 ConstructionBuilding
Off-Road Equipment 0.092 0.548 0.646 0.000 0.000 0.033 0.033 0.000 0.031 0.031 116Vendor Trips 0.001 0.014 0.014 0.000 0.000 0.001 0.001 0.000 0.001 0.001 6Worker Trips 0.001 0.021 0.001 0.000 0.000 0.000 0.000 0.000 0.000 0.000 4
2018 ConstructionBuilding
Off-Road Equipment 0.050 0.316 0.339 0.000 0.000 0.017 0.017 0.000 0.015 0.015 68Vendor Trips 0.001 0.008 0.007 0.000 0.000 0.000 0.000 0.000 0.000 0.000 3Worker Trips 0.000 0.011 0.001 0.000 0.000 0.000 0.000 0.000 0.000 0.000 2
CoatingArchitectural Coating 0.031 - - - - - - - - - -
Worker Trips 0.000 0.000 0.000 0.000 0.000 0.000 0.000 0.000 0.000 0.000 02016 Total per Station 1 0.111 0.567 0.824 0.000 0.020 0.039 0.060 0.004 0.036 0.041 1232017 Total per Station 1 0.094 0.583 0.661 0.000 0.000 0.034 0.035 0.000 0.031 0.032 1262018 Total per Station 1 0.082 0.335 0.347 0.000 0.000 0.017 0.017 0.000 0.016 0.016 73
Notes:
Construction Phase
Emissions (tpy)
1. Mitigation for fugitive dust included watering exposed surfaces 3x daily and architectural coatings were mitigated by using low-VOC architectural coatings; both mitigation measures were applied using URBEMIS2007.
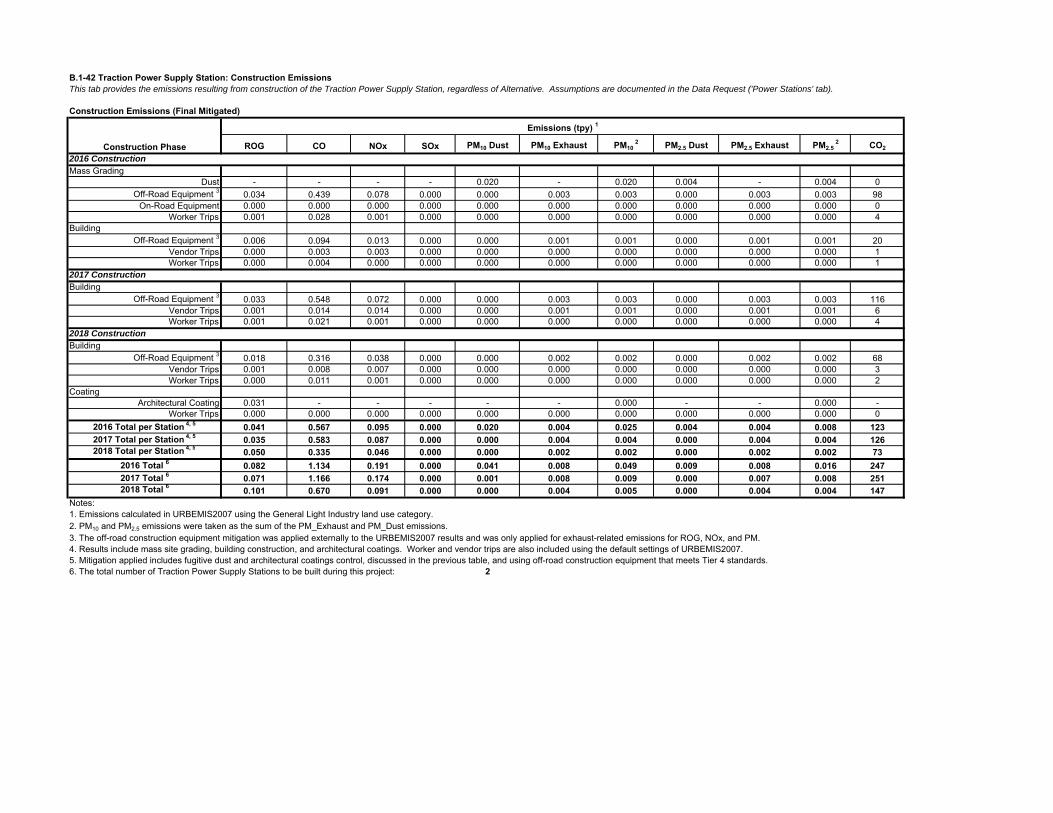
B.1-42 Traction Power Supply Station: Construction EmissionsThis tab provides the emissions resulting from construction of the Traction Power Supply Station, regardless of Alternative. Assumptions are documented in the Data Request ('Power Stations' tab).
Construction Emissions (Final Mitigated)
ROG CO NOx SOx PM10 Dust PM10 Exhaust PM10 2 PM2.5 Dust PM2.5 Exhaust PM2.5
2 CO2
2016 ConstructionMass Grading
Dust - - - - 0.020 - 0.020 0.004 - 0.004 0Off-Road Equipment 3 0.034 0.439 0.078 0.000 0.000 0.003 0.003 0.000 0.003 0.003 98
On-Road Equipment 0.000 0.000 0.000 0.000 0.000 0.000 0.000 0.000 0.000 0.000 0Worker Trips 0.001 0.028 0.001 0.000 0.000 0.000 0.000 0.000 0.000 0.000 4
BuildingOff-Road Equipment 3 0.006 0.094 0.013 0.000 0.000 0.001 0.001 0.000 0.001 0.001 20
Vendor Trips 0.000 0.003 0.003 0.000 0.000 0.000 0.000 0.000 0.000 0.000 1Worker Trips 0.000 0.004 0.000 0.000 0.000 0.000 0.000 0.000 0.000 0.000 1
2017 ConstructionBuilding
Off-Road Equipment 3 0.033 0.548 0.072 0.000 0.000 0.003 0.003 0.000 0.003 0.003 116Vendor Trips 0.001 0.014 0.014 0.000 0.000 0.001 0.001 0.000 0.001 0.001 6Worker Trips 0.001 0.021 0.001 0.000 0.000 0.000 0.000 0.000 0.000 0.000 4
2018 ConstructionBuilding
Off-Road Equipment 3 0.018 0.316 0.038 0.000 0.000 0.002 0.002 0.000 0.002 0.002 68Vendor Trips 0.001 0.008 0.007 0.000 0.000 0.000 0.000 0.000 0.000 0.000 3Worker Trips 0.000 0.011 0.001 0.000 0.000 0.000 0.000 0.000 0.000 0.000 2
CoatingArchitectural Coating 0.031 - - - - - 0.000 - - 0.000 -
Worker Trips 0.000 0.000 0.000 0.000 0.000 0.000 0.000 0.000 0.000 0.000 02016 Total per Station 4, 5 0.041 0.567 0.095 0.000 0.020 0.004 0.025 0.004 0.004 0.008 1232017 Total per Station 4, 5 0.035 0.583 0.087 0.000 0.000 0.004 0.004 0.000 0.004 0.004 1262018 Total per Station 4, 5 0.050 0.335 0.046 0.000 0.000 0.002 0.002 0.000 0.002 0.002 73
2016 Total 6 0.082 1.134 0.191 0.000 0.041 0.008 0.049 0.009 0.008 0.016 2472017 Total 6 0.071 1.166 0.174 0.000 0.001 0.008 0.009 0.000 0.007 0.008 2512018 Total 6 0.101 0.670 0.091 0.000 0.000 0.004 0.005 0.000 0.004 0.004 147
Notes:1. Emissions calculated in URBEMIS2007 using the General Light Industry land use category.2. PM10 and PM2.5 emissions were taken as the sum of the PM_Exhaust and PM_Dust emissions.3. The off-road construction equipment mitigation was applied externally to the URBEMIS2007 results and was only applied for exhaust-related emissions for ROG, NOx, and PM.4. Results include mass site grading, building construction, and architectural coatings. Worker and vendor trips are also included using the default settings of URBEMIS2007.5. Mitigation applied includes fugitive dust and architectural coatings control, discussed in the previous table, and using off-road construction equipment that meets Tier 4 standards.6. The total number of Traction Power Supply Stations to be built during this project: 2
Construction Phase
Emissions (tpy) 1
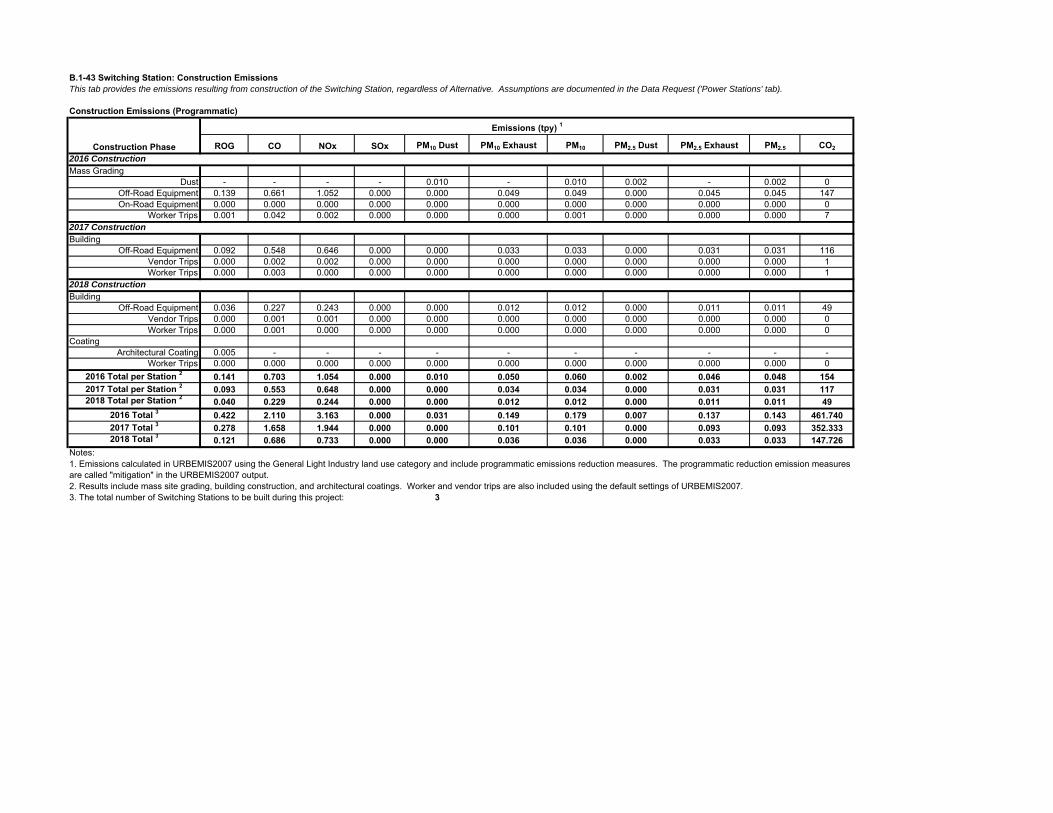
B.1-43 Switching Station: Construction EmissionsThis tab provides the emissions resulting from construction of the Switching Station, regardless of Alternative. Assumptions are documented in the Data Request ('Power Stations' tab).
Construction Emissions (Programmatic)
ROG CO NOx SOx PM10 Dust PM10 Exhaust PM10 PM2.5 Dust PM2.5 Exhaust PM2.5 CO2
2016 ConstructionMass Grading
Dust - - - - 0.010 - 0.010 0.002 - 0.002 0Off-Road Equipment 0.139 0.661 1.052 0.000 0.000 0.049 0.049 0.000 0.045 0.045 147On-Road Equipment 0.000 0.000 0.000 0.000 0.000 0.000 0.000 0.000 0.000 0.000 0
Worker Trips 0.001 0.042 0.002 0.000 0.000 0.000 0.001 0.000 0.000 0.000 72017 ConstructionBuilding
Off-Road Equipment 0.092 0.548 0.646 0.000 0.000 0.033 0.033 0.000 0.031 0.031 116Vendor Trips 0.000 0.002 0.002 0.000 0.000 0.000 0.000 0.000 0.000 0.000 1Worker Trips 0.000 0.003 0.000 0.000 0.000 0.000 0.000 0.000 0.000 0.000 1
2018 ConstructionBuilding
Off-Road Equipment 0.036 0.227 0.243 0.000 0.000 0.012 0.012 0.000 0.011 0.011 49Vendor Trips 0.000 0.001 0.001 0.000 0.000 0.000 0.000 0.000 0.000 0.000 0Worker Trips 0.000 0.001 0.000 0.000 0.000 0.000 0.000 0.000 0.000 0.000 0
CoatingArchitectural Coating 0.005 - - - - - - - - - -
Worker Trips 0.000 0.000 0.000 0.000 0.000 0.000 0.000 0.000 0.000 0.000 02016 Total per Station 2 0.141 0.703 1.054 0.000 0.010 0.050 0.060 0.002 0.046 0.048 1542017 Total per Station 2 0.093 0.553 0.648 0.000 0.000 0.034 0.034 0.000 0.031 0.031 1172018 Total per Station 2 0.040 0.229 0.244 0.000 0.000 0.012 0.012 0.000 0.011 0.011 49
2016 Total 3 0.422 2.110 3.163 0.000 0.031 0.149 0.179 0.007 0.137 0.143 461.7402017 Total 3 0.278 1.658 1.944 0.000 0.000 0.101 0.101 0.000 0.093 0.093 352.3332018 Total 3 0.121 0.686 0.733 0.000 0.000 0.036 0.036 0.000 0.033 0.033 147.726
Notes:
2. Results include mass site grading, building construction, and architectural coatings. Worker and vendor trips are also included using the default settings of URBEMIS2007.3. The total number of Switching Stations to be built during this project: 3
Construction Phase
Emissions (tpy) 1
1. Emissions calculated in URBEMIS2007 using the General Light Industry land use category and include programmatic emissions reduction measures. The programmatic reduction emission measures are called "mitigation" in the URBEMIS2007 output.

B.1-43 Switching Station: Construction EmissionsThis tab provides the emissions resulting from construction of the Switching Station, regardless of Alternative. Assumptions are documented in the Data Request ('Power Stations' tab).
Construction Emissions (Fugitive Dust and Coating Mitigated)
ROG CO NOx SOx PM10 Dust PM10 Exhaust PM10 PM2.5 Dust PM2.5 Exhaust PM2.5 CO2
2016 ConstructionMass Grading
Dust - - - - 0.009 - 0.009 0.002 - 0.002 0Off-Road Equipment 0.139 0.661 1.052 0.000 0.000 0.049 0.049 0.000 0.045 0.045 147On-Road Equipment 0.000 0.000 0.000 0.000 0.000 0.000 0.000 0.000 0.000 0.000 0
Worker Trips 0.001 0.042 0.002 0.000 0.000 0.000 0.001 0.000 0.000 0.000 72017 ConstructionBuilding
Off-Road Equipment 0.092 0.548 0.646 0.000 0.000 0.033 0.033 0.000 0.031 0.031 116Vendor Trips 0.000 0.002 0.002 0.000 0.000 0.000 0.000 0.000 0.000 0.000 1Worker Trips 0.000 0.003 0.000 0.000 0.000 0.000 0.000 0.000 0.000 0.000 1
2018 ConstructionBuilding
Off-Road Equipment 0.036 0.227 0.243 0.000 0.000 0.012 0.012 0.000 0.011 0.011 49Vendor Trips 0.000 0.001 0.001 0.000 0.000 0.000 0.000 0.000 0.000 0.000 0Worker Trips 0.000 0.001 0.000 0.000 0.000 0.000 0.000 0.000 0.000 0.000 0
CoatingArchitectural Coating 0.004 - - - - - - - - - -
Worker Trips 0.000 0.000 0.000 0.000 0.000 0.000 0.000 0.000 0.000 0.000 02016 Total per Station 1 0.141 0.703 1.054 0.000 0.009 0.050 0.059 0.002 0.046 0.048 1542017 Total per Station 1 0.093 0.553 0.648 0.000 0.000 0.034 0.034 0.000 0.031 0.031 1172018 Total per Station 1 0.040 0.229 0.244 0.000 0.000 0.012 0.012 0.000 0.011 0.011 49
Notes:
Construction Phase
Emissions (tpy)
1. Mitigation for fugitive dust included watering exposed surfaces 3x daily and architectural coatings were mitigated by using low-VOC architectural coatings; both mitigation measures were applied using URBEMIS2007.
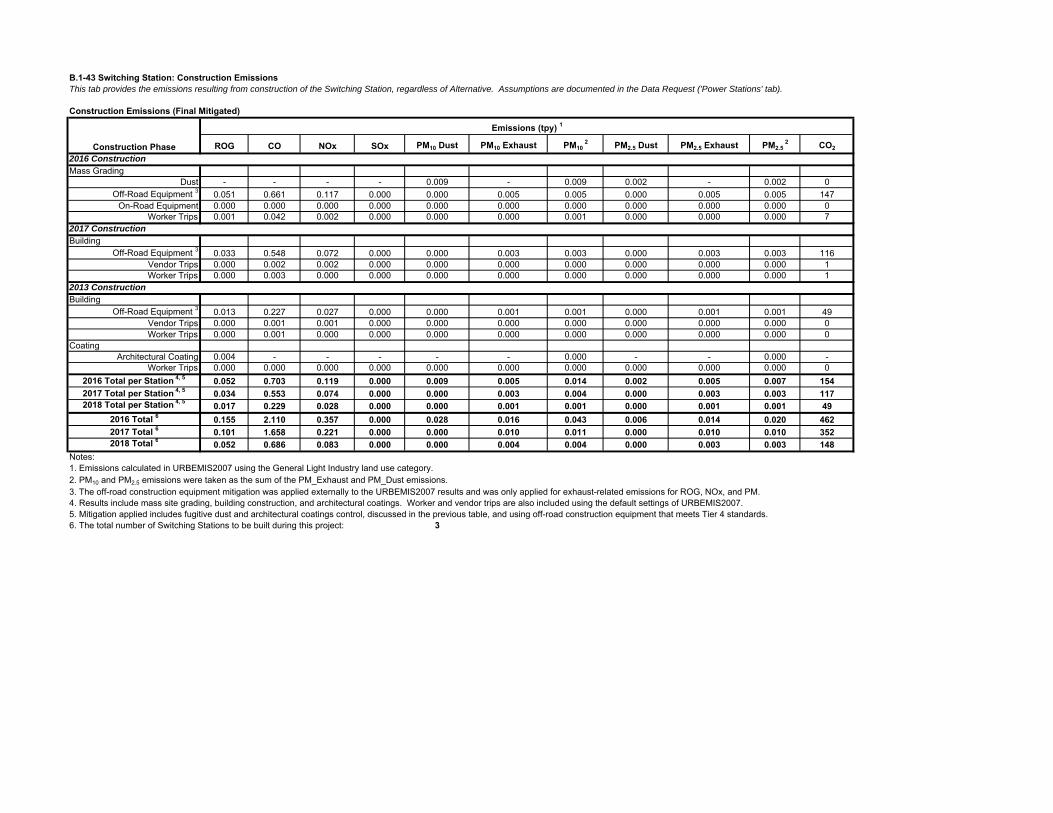
B.1-43 Switching Station: Construction EmissionsThis tab provides the emissions resulting from construction of the Switching Station, regardless of Alternative. Assumptions are documented in the Data Request ('Power Stations' tab).
Construction Emissions (Final Mitigated)
ROG CO NOx SOx PM10 Dust PM10 Exhaust PM10 2 PM2.5 Dust PM2.5 Exhaust PM2.5
2 CO2
2016 ConstructionMass Grading
Dust - - - - 0.009 - 0.009 0.002 - 0.002 0Off-Road Equipment 3 0.051 0.661 0.117 0.000 0.000 0.005 0.005 0.000 0.005 0.005 147
On-Road Equipment 0.000 0.000 0.000 0.000 0.000 0.000 0.000 0.000 0.000 0.000 0Worker Trips 0.001 0.042 0.002 0.000 0.000 0.000 0.001 0.000 0.000 0.000 7
2017 ConstructionBuilding
Off-Road Equipment 3 0.033 0.548 0.072 0.000 0.000 0.003 0.003 0.000 0.003 0.003 116Vendor Trips 0.000 0.002 0.002 0.000 0.000 0.000 0.000 0.000 0.000 0.000 1Worker Trips 0.000 0.003 0.000 0.000 0.000 0.000 0.000 0.000 0.000 0.000 1
2013 ConstructionBuilding
Off-Road Equipment 3 0.013 0.227 0.027 0.000 0.000 0.001 0.001 0.000 0.001 0.001 49Vendor Trips 0.000 0.001 0.001 0.000 0.000 0.000 0.000 0.000 0.000 0.000 0Worker Trips 0.000 0.001 0.000 0.000 0.000 0.000 0.000 0.000 0.000 0.000 0
CoatingArchitectural Coating 0.004 - - - - - 0.000 - - 0.000 -
Worker Trips 0.000 0.000 0.000 0.000 0.000 0.000 0.000 0.000 0.000 0.000 02016 Total per Station 4, 5 0.052 0.703 0.119 0.000 0.009 0.005 0.014 0.002 0.005 0.007 1542017 Total per Station 4, 5 0.034 0.553 0.074 0.000 0.000 0.003 0.004 0.000 0.003 0.003 1172018 Total per Station 4, 5 0.017 0.229 0.028 0.000 0.000 0.001 0.001 0.000 0.001 0.001 49
2016 Total 6 0.155 2.110 0.357 0.000 0.028 0.016 0.043 0.006 0.014 0.020 4622017 Total 6 0.101 1.658 0.221 0.000 0.000 0.010 0.011 0.000 0.010 0.010 3522018 Total 6 0.052 0.686 0.083 0.000 0.000 0.004 0.004 0.000 0.003 0.003 148
Notes:1. Emissions calculated in URBEMIS2007 using the General Light Industry land use category.2. PM10 and PM2.5 emissions were taken as the sum of the PM_Exhaust and PM_Dust emissions.3. The off-road construction equipment mitigation was applied externally to the URBEMIS2007 results and was only applied for exhaust-related emissions for ROG, NOx, and PM.4. Results include mass site grading, building construction, and architectural coatings. Worker and vendor trips are also included using the default settings of URBEMIS2007.5. Mitigation applied includes fugitive dust and architectural coatings control, discussed in the previous table, and using off-road construction equipment that meets Tier 4 standards.6. The total number of Switching Stations to be built during this project: 3
Construction Phase
Emissions (tpy) 1
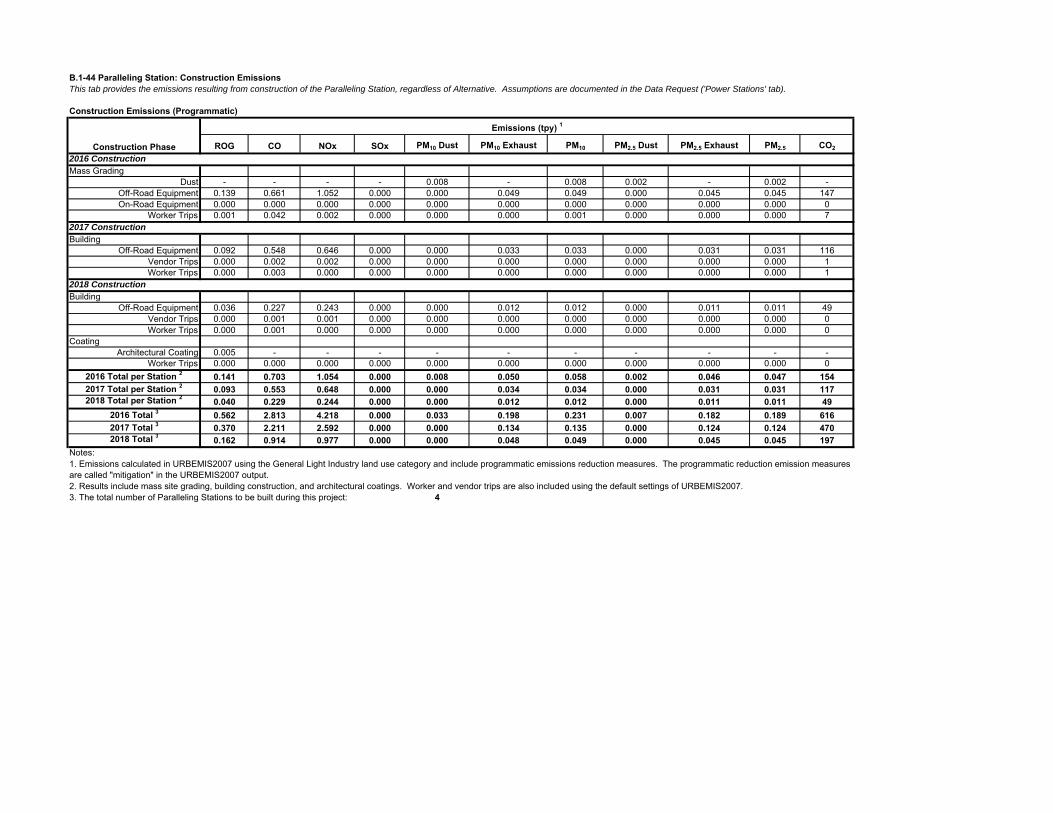
B.1-44 Paralleling Station: Construction EmissionsThis tab provides the emissions resulting from construction of the Paralleling Station, regardless of Alternative. Assumptions are documented in the Data Request ('Power Stations' tab).
Construction Emissions (Programmatic)
ROG CO NOx SOx PM10 Dust PM10 Exhaust PM10 PM2.5 Dust PM2.5 Exhaust PM2.5 CO2
2016 ConstructionMass Grading
Dust - - - - 0.008 - 0.008 0.002 - 0.002 -Off-Road Equipment 0.139 0.661 1.052 0.000 0.000 0.049 0.049 0.000 0.045 0.045 147On-Road Equipment 0.000 0.000 0.000 0.000 0.000 0.000 0.000 0.000 0.000 0.000 0
Worker Trips 0.001 0.042 0.002 0.000 0.000 0.000 0.001 0.000 0.000 0.000 72017 ConstructionBuilding
Off-Road Equipment 0.092 0.548 0.646 0.000 0.000 0.033 0.033 0.000 0.031 0.031 116Vendor Trips 0.000 0.002 0.002 0.000 0.000 0.000 0.000 0.000 0.000 0.000 1Worker Trips 0.000 0.003 0.000 0.000 0.000 0.000 0.000 0.000 0.000 0.000 1
2018 ConstructionBuilding
Off-Road Equipment 0.036 0.227 0.243 0.000 0.000 0.012 0.012 0.000 0.011 0.011 49Vendor Trips 0.000 0.001 0.001 0.000 0.000 0.000 0.000 0.000 0.000 0.000 0Worker Trips 0.000 0.001 0.000 0.000 0.000 0.000 0.000 0.000 0.000 0.000 0
CoatingArchitectural Coating 0.005 - - - - - - - - - -
Worker Trips 0.000 0.000 0.000 0.000 0.000 0.000 0.000 0.000 0.000 0.000 02016 Total per Station 2 0.141 0.703 1.054 0.000 0.008 0.050 0.058 0.002 0.046 0.047 1542017 Total per Station 2 0.093 0.553 0.648 0.000 0.000 0.034 0.034 0.000 0.031 0.031 1172018 Total per Station 2 0.040 0.229 0.244 0.000 0.000 0.012 0.012 0.000 0.011 0.011 49
2016 Total 3 0.562 2.813 4.218 0.000 0.033 0.198 0.231 0.007 0.182 0.189 6162017 Total 3 0.370 2.211 2.592 0.000 0.000 0.134 0.135 0.000 0.124 0.124 4702018 Total 3 0.162 0.914 0.977 0.000 0.000 0.048 0.049 0.000 0.045 0.045 197
Notes:
2. Results include mass site grading, building construction, and architectural coatings. Worker and vendor trips are also included using the default settings of URBEMIS2007.3. The total number of Paralleling Stations to be built during this project: 4
Construction Phase
Emissions (tpy) 1
1. Emissions calculated in URBEMIS2007 using the General Light Industry land use category and include programmatic emissions reduction measures. The programmatic reduction emission measures are called "mitigation" in the URBEMIS2007 output.
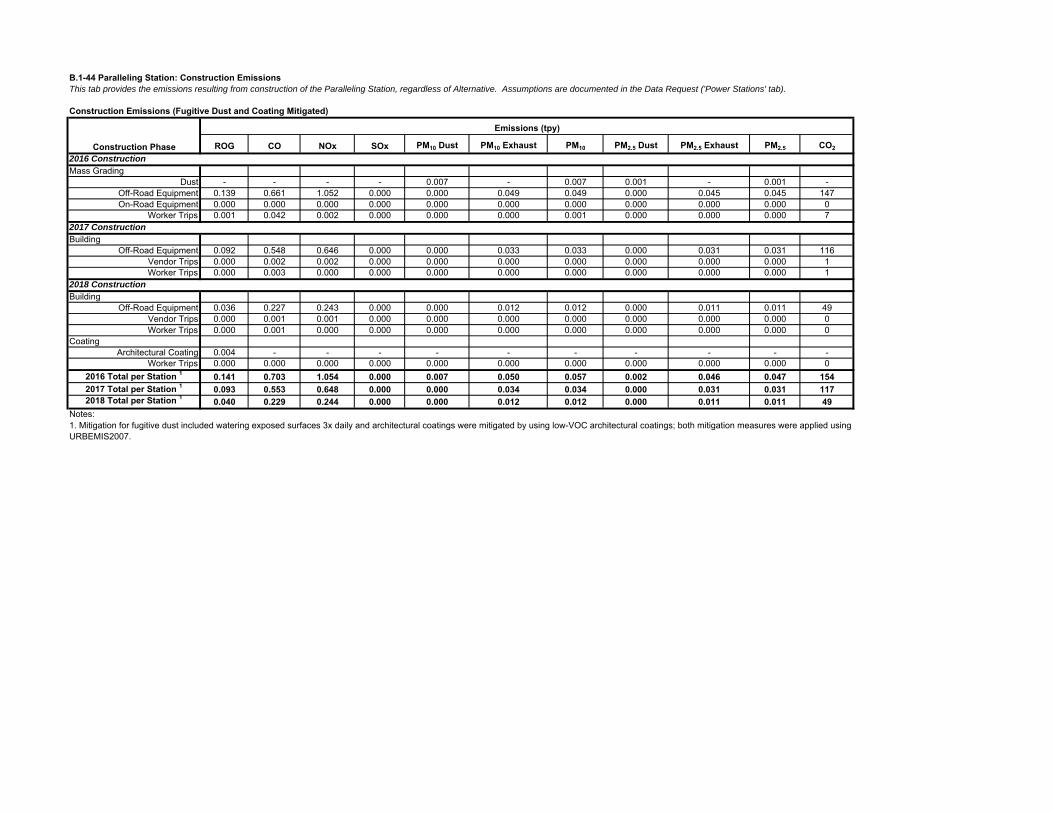
B.1-44 Paralleling Station: Construction EmissionsThis tab provides the emissions resulting from construction of the Paralleling Station, regardless of Alternative. Assumptions are documented in the Data Request ('Power Stations' tab).
Construction Emissions (Fugitive Dust and Coating Mitigated)
ROG CO NOx SOx PM10 Dust PM10 Exhaust PM10 PM2.5 Dust PM2.5 Exhaust PM2.5 CO2
2016 ConstructionMass Grading
Dust - - - - 0.007 - 0.007 0.001 - 0.001 -Off-Road Equipment 0.139 0.661 1.052 0.000 0.000 0.049 0.049 0.000 0.045 0.045 147On-Road Equipment 0.000 0.000 0.000 0.000 0.000 0.000 0.000 0.000 0.000 0.000 0
Worker Trips 0.001 0.042 0.002 0.000 0.000 0.000 0.001 0.000 0.000 0.000 72017 ConstructionBuilding
Off-Road Equipment 0.092 0.548 0.646 0.000 0.000 0.033 0.033 0.000 0.031 0.031 116Vendor Trips 0.000 0.002 0.002 0.000 0.000 0.000 0.000 0.000 0.000 0.000 1Worker Trips 0.000 0.003 0.000 0.000 0.000 0.000 0.000 0.000 0.000 0.000 1
2018 ConstructionBuilding
Off-Road Equipment 0.036 0.227 0.243 0.000 0.000 0.012 0.012 0.000 0.011 0.011 49Vendor Trips 0.000 0.001 0.001 0.000 0.000 0.000 0.000 0.000 0.000 0.000 0Worker Trips 0.000 0.001 0.000 0.000 0.000 0.000 0.000 0.000 0.000 0.000 0
CoatingArchitectural Coating 0.004 - - - - - - - - - -
Worker Trips 0.000 0.000 0.000 0.000 0.000 0.000 0.000 0.000 0.000 0.000 02016 Total per Station 1 0.141 0.703 1.054 0.000 0.007 0.050 0.057 0.002 0.046 0.047 1542017 Total per Station 1 0.093 0.553 0.648 0.000 0.000 0.034 0.034 0.000 0.031 0.031 1172018 Total per Station 1 0.040 0.229 0.244 0.000 0.000 0.012 0.012 0.000 0.011 0.011 49
Notes:
Construction Phase
Emissions (tpy)
1. Mitigation for fugitive dust included watering exposed surfaces 3x daily and architectural coatings were mitigated by using low-VOC architectural coatings; both mitigation measures were applied using URBEMIS2007.

B.1-44 Paralleling Station: Construction EmissionsThis tab provides the emissions resulting from construction of the Paralleling Station, regardless of Alternative. Assumptions are documented in the Data Request ('Power Stations' tab).
Construction Emissions (Final Mitigated)
ROG CO NOx SOx PM10 Dust PM10 Exhaust PM102 PM2.5 Dust PM2.5 Exhaust PM2.5
2 CO2
2016 ConstructionMass Grading
Dust - - - - 0.007 - 0.007 0.001 - 0.001 -Off-Road Equipment 3 0.051 0.661 0.117 0.000 0.000 0.005 0.005 0.000 0.005 0.005 147
On-Road Equipment 0.000 0.000 0.000 0.000 0.000 0.000 0.000 0.000 0.000 0.000 0Worker Trips 0.001 0.042 0.002 0.000 0.000 0.000 0.001 0.000 0.000 0.000 7
2017 ConstructionBuilding
Off-Road Equipment 3 0.033 0.548 0.072 0.000 0.000 0.003 0.003 0.000 0.003 0.003 116Vendor Trips 0.000 0.002 0.002 0.000 0.000 0.000 0.000 0.000 0.000 0.000 1Worker Trips 0.000 0.003 0.000 0.000 0.000 0.000 0.000 0.000 0.000 0.000 1
2018 ConstructionBuilding
Off-Road Equipment 3 0.013 0.227 0.027 0.000 0.000 0.001 0.001 0.000 0.001 0.001 49Vendor Trips 0.000 0.001 0.001 0.000 0.000 0.000 0.000 0.000 0.000 0.000 0Worker Trips 0.000 0.001 0.000 0.000 0.000 0.000 0.000 0.000 0.000 0.000 0
CoatingArchitectural Coating 0.004 - - - - - 0.000 - - 0.000 -
Worker Trips 0.000 0.000 0.000 0.000 0.000 0.000 0.000 0.000 0.000 0.000 02016 Total per Station 4, 5 0.052 0.703 0.119 0.000 0.007 0.005 0.013 0.002 0.005 0.006 1542017 Total per Station 4, 5 0.034 0.553 0.074 0.000 0.000 0.003 0.004 0.000 0.003 0.003 1172018 Total per Station 4, 5 0.017 0.229 0.028 0.000 0.000 0.001 0.001 0.000 0.001 0.001 49
2016 Total 6 0.207 2.813 0.476 0.000 0.030 0.021 0.051 0.006 0.019 0.025 6162017 Total 6 0.135 2.211 0.295 0.000 0.000 0.014 0.014 0.000 0.013 0.013 4702018 Total 6 0.069 0.914 0.111 0.000 0.000 0.005 0.005 0.000 0.005 0.005 197
Notes:1. Emissions calculated in URBEMIS2007 using the General Light Industry land use category.2. PM10 and PM2.5 emissions were taken as the sum of the PM_Exhaust and PM_Dust emissions.3. The off-road construction equipment mitigation was applied externally to the URBEMIS2007 results and was only applied for exhaust-related emissions for ROG, NOx, and PM.4. Results include mass site grading, building construction, and architectural coatings. Worker and vendor trips are also included using the default settings of URBEMIS2007.5. Mitigation applied includes fugitive dust and architectural coatings control, discussed in the previous table, and using off-road construction equipment that meets Tier 4 standards.6. The total number of Paralleling Stations to be built during this project: 4
Construction Phase
Emissions (tpy) 1
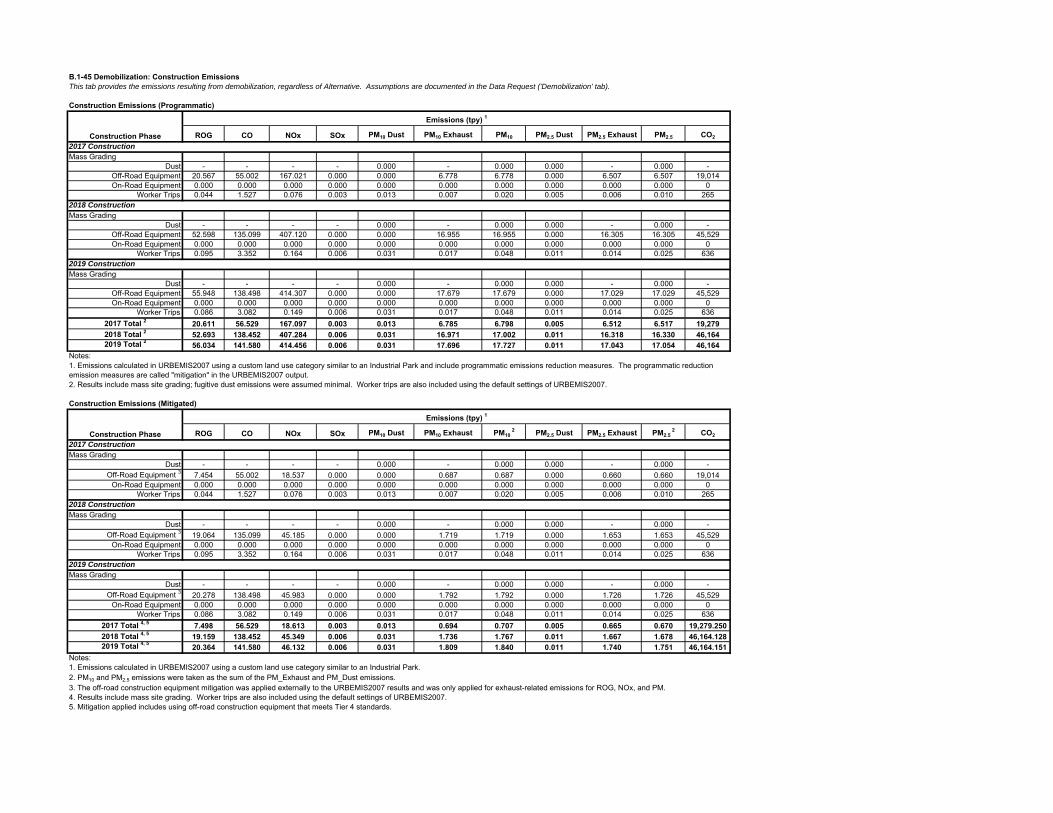
B.1-45 Demobilization: Construction EmissionsThis tab provides the emissions resulting from demobilization, regardless of Alternative. Assumptions are documented in the Data Request ('Demobilization' tab).
Construction Emissions (Programmatic)
ROG CO NOx SOx PM10 Dust PM10 Exhaust PM10 PM2.5 Dust PM2.5 Exhaust PM2.5 CO2
2017 ConstructionMass Grading
Dust - - - - 0.000 - 0.000 0.000 - 0.000 -Off-Road Equipment 20.567 55.002 167.021 0.000 0.000 6.778 6.778 0.000 6.507 6.507 19,014On-Road Equipment 0.000 0.000 0.000 0.000 0.000 0.000 0.000 0.000 0.000 0.000 0
Worker Trips 0.044 1.527 0.076 0.003 0.013 0.007 0.020 0.005 0.006 0.010 2652018 ConstructionMass Grading
Dust - - - - 0.000 - 0.000 0.000 - 0.000 -Off-Road Equipment 52.598 135.099 407.120 0.000 0.000 16.955 16.955 0.000 16.305 16.305 45,529On-Road Equipment 0.000 0.000 0.000 0.000 0.000 0.000 0.000 0.000 0.000 0.000 0
Worker Trips 0.095 3.352 0.164 0.006 0.031 0.017 0.048 0.011 0.014 0.025 6362019 ConstructionMass Grading
Dust - - - - 0.000 - 0.000 0.000 - 0.000 -Off-Road Equipment 55.948 138.498 414.307 0.000 0.000 17.679 17.679 0.000 17.029 17.029 45,529On-Road Equipment 0.000 0.000 0.000 0.000 0.000 0.000 0.000 0.000 0.000 0.000 0
Worker Trips 0.086 3.082 0.149 0.006 0.031 0.017 0.048 0.011 0.014 0.025 6362017 Total 2 20.611 56.529 167.097 0.003 0.013 6.785 6.798 0.005 6.512 6.517 19,2792018 Total 2 52.693 138.452 407.284 0.006 0.031 16.971 17.002 0.011 16.318 16.330 46,1642019 Total 2 56.034 141.580 414.456 0.006 0.031 17.696 17.727 0.011 17.043 17.054 46,164
Notes:
2. Results include mass site grading; fugitive dust emissions were assumed minimal. Worker trips are also included using the default settings of URBEMIS2007.
Construction Emissions (Mitigated)
ROG CO NOx SOx PM10 Dust PM10 Exhaust PM10 2 PM2.5 Dust PM2.5 Exhaust PM2.5
2 CO2
2017 ConstructionMass Grading
Dust - - - - 0.000 - 0.000 0.000 - 0.000 -Off-Road Equipment 3 7.454 55.002 18.537 0.000 0.000 0.687 0.687 0.000 0.660 0.660 19,014
On-Road Equipment 0.000 0.000 0.000 0.000 0.000 0.000 0.000 0.000 0.000 0.000 0Worker Trips 0.044 1.527 0.076 0.003 0.013 0.007 0.020 0.005 0.006 0.010 265
2018 ConstructionMass Grading
Dust - - - - 0.000 - 0.000 0.000 - 0.000 -Off-Road Equipment 3 19.064 135.099 45.185 0.000 0.000 1.719 1.719 0.000 1.653 1.653 45,529
On-Road Equipment 0.000 0.000 0.000 0.000 0.000 0.000 0.000 0.000 0.000 0.000 0Worker Trips 0.095 3.352 0.164 0.006 0.031 0.017 0.048 0.011 0.014 0.025 636
2019 ConstructionMass Grading
Dust - - - - 0.000 - 0.000 0.000 - 0.000 -Off-Road Equipment 3 20.278 138.498 45.983 0.000 0.000 1.792 1.792 0.000 1.726 1.726 45,529
On-Road Equipment 0.000 0.000 0.000 0.000 0.000 0.000 0.000 0.000 0.000 0.000 0Worker Trips 0.086 3.082 0.149 0.006 0.031 0.017 0.048 0.011 0.014 0.025 636
2017 Total 4, 5 7.498 56.529 18.613 0.003 0.013 0.694 0.707 0.005 0.665 0.670 19,279.2502018 Total 4, 5 19.159 138.452 45.349 0.006 0.031 1.736 1.767 0.011 1.667 1.678 46,164.1282019 Total 4, 5 20.364 141.580 46.132 0.006 0.031 1.809 1.840 0.011 1.740 1.751 46,164.151
Notes:1. Emissions calculated in URBEMIS2007 using a custom land use category similar to an Industrial Park.2. PM10 and PM2.5 emissions were taken as the sum of the PM_Exhaust and PM_Dust emissions.3. The off-road construction equipment mitigation was applied externally to the URBEMIS2007 results and was only applied for exhaust-related emissions for ROG, NOx, and PM.4. Results include mass site grading. Worker trips are also included using the default settings of URBEMIS2007.5. Mitigation applied includes using off-road construction equipment that meets Tier 4 standards.
Construction Phase
Emissions (tpy) 1
Construction Phase
Emissions (tpy) 1
1. Emissions calculated in URBEMIS2007 using a custom land use category similar to an Industrial Park and include programmatic emissions reduction measures. The programmatic reduction emission measures are called "mitigation" in the URBEMIS2007 output.
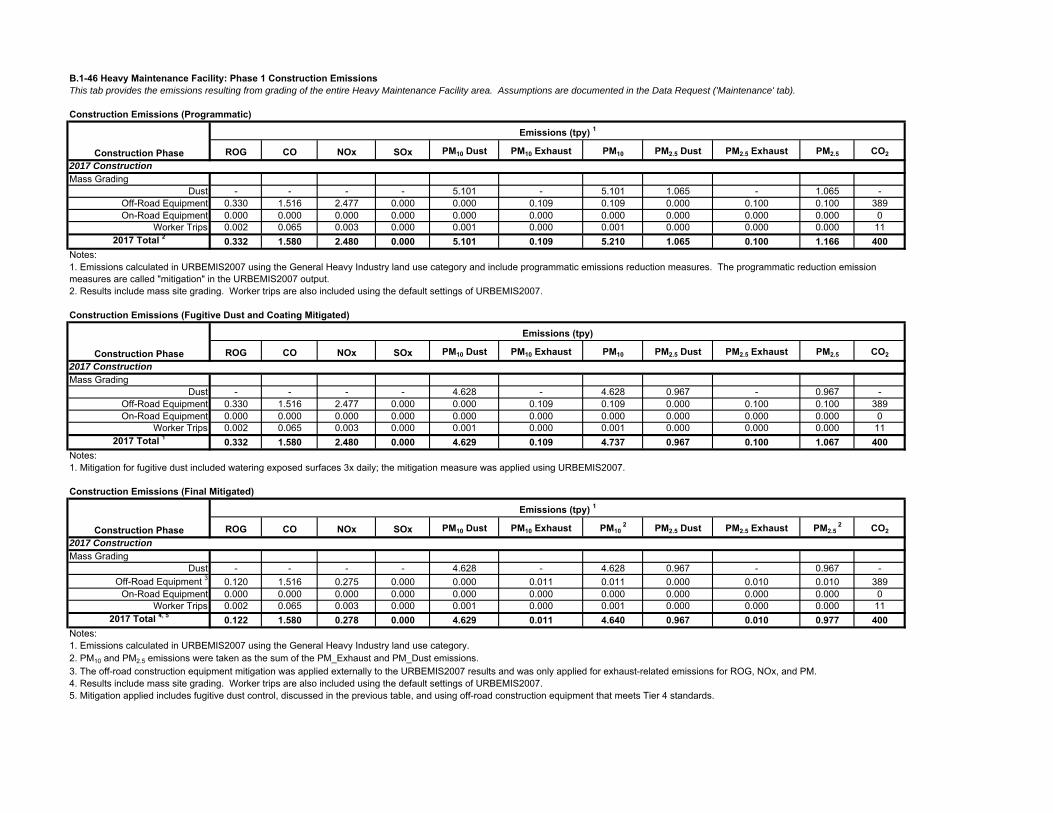
B.1-46 Heavy Maintenance Facility: Phase 1 Construction EmissionsThis tab provides the emissions resulting from grading of the entire Heavy Maintenance Facility area. Assumptions are documented in the Data Request ('Maintenance' tab).
Construction Emissions (Programmatic)
ROG CO NOx SOx PM10 Dust PM10 Exhaust PM10 PM2.5 Dust PM2.5 Exhaust PM2.5 CO2
2017 ConstructionMass Grading
Dust - - - - 5.101 - 5.101 1.065 - 1.065 -Off-Road Equipment 0.330 1.516 2.477 0.000 0.000 0.109 0.109 0.000 0.100 0.100 389On-Road Equipment 0.000 0.000 0.000 0.000 0.000 0.000 0.000 0.000 0.000 0.000 0
Worker Trips 0.002 0.065 0.003 0.000 0.001 0.000 0.001 0.000 0.000 0.000 112017 Total 2 0.332 1.580 2.480 0.000 5.101 0.109 5.210 1.065 0.100 1.166 400
Notes:
2. Results include mass site grading. Worker trips are also included using the default settings of URBEMIS2007.
Construction Emissions (Fugitive Dust and Coating Mitigated)
ROG CO NOx SOx PM10 Dust PM10 Exhaust PM10 PM2.5 Dust PM2.5 Exhaust PM2.5 CO2
2017 ConstructionMass Grading
Dust - - - - 4.628 - 4.628 0.967 - 0.967 -Off-Road Equipment 0.330 1.516 2.477 0.000 0.000 0.109 0.109 0.000 0.100 0.100 389On-Road Equipment 0.000 0.000 0.000 0.000 0.000 0.000 0.000 0.000 0.000 0.000 0
Worker Trips 0.002 0.065 0.003 0.000 0.001 0.000 0.001 0.000 0.000 0.000 112017 Total 1 0.332 1.580 2.480 0.000 4.629 0.109 4.737 0.967 0.100 1.067 400
Notes:1. Mitigation for fugitive dust included watering exposed surfaces 3x daily; the mitigation measure was applied using URBEMIS2007.
Construction Emissions (Final Mitigated)
ROG CO NOx SOx PM10 Dust PM10 Exhaust PM10 2 PM2.5 Dust PM2.5 Exhaust PM2.5
2 CO2
2017 ConstructionMass Grading
Dust - - - - 4.628 - 4.628 0.967 - 0.967 -Off-Road Equipment 3 0.120 1.516 0.275 0.000 0.000 0.011 0.011 0.000 0.010 0.010 389
On-Road Equipment 0.000 0.000 0.000 0.000 0.000 0.000 0.000 0.000 0.000 0.000 0Worker Trips 0.002 0.065 0.003 0.000 0.001 0.000 0.001 0.000 0.000 0.000 11
2017 Total 4, 5 0.122 1.580 0.278 0.000 4.629 0.011 4.640 0.967 0.010 0.977 400Notes:1. Emissions calculated in URBEMIS2007 using the General Heavy Industry land use category.2. PM10 and PM2.5 emissions were taken as the sum of the PM_Exhaust and PM_Dust emissions.3. The off-road construction equipment mitigation was applied externally to the URBEMIS2007 results and was only applied for exhaust-related emissions for ROG, NOx, and PM.4. Results include mass site grading. Worker trips are also included using the default settings of URBEMIS2007.5. Mitigation applied includes fugitive dust control, discussed in the previous table, and using off-road construction equipment that meets Tier 4 standards.
Construction Phase
Emissions (tpy) 1
Construction Phase
Emissions (tpy) 1
Construction Phase
Emissions (tpy)
1. Emissions calculated in URBEMIS2007 using the General Heavy Industry land use category and include programmatic emissions reduction measures. The programmatic reduction emission measures are called "mitigation" in the URBEMIS2007 output.
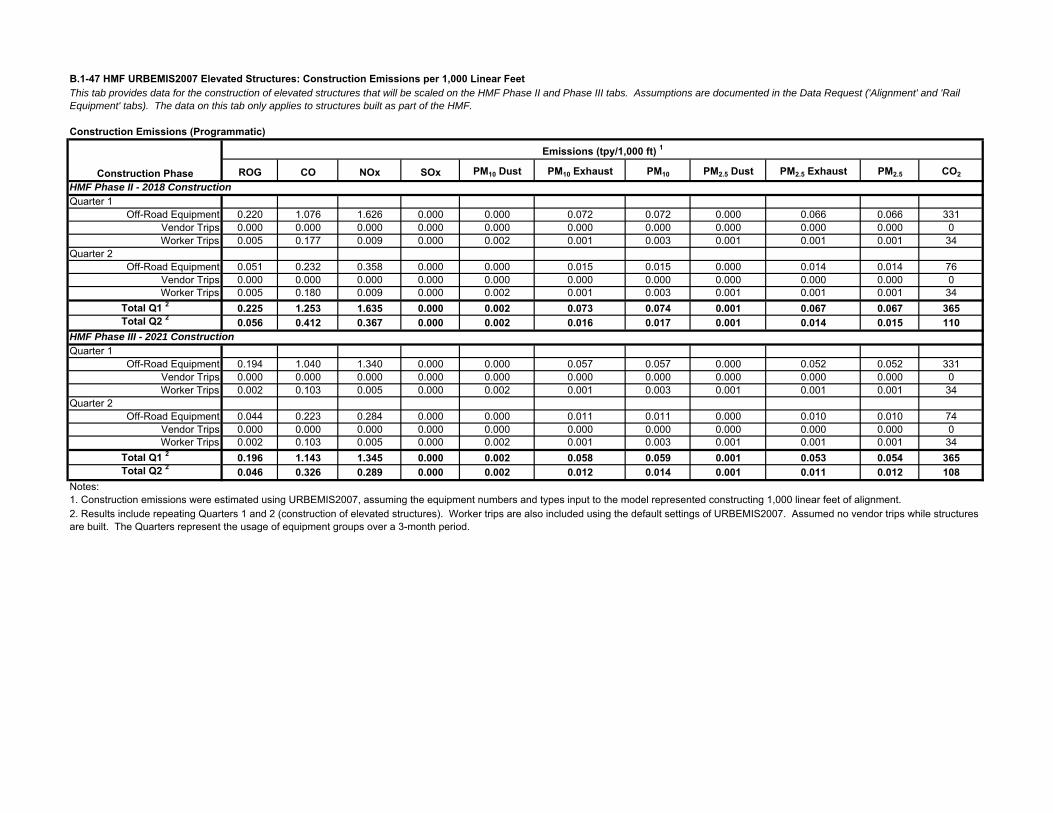
B.1-47 HMF URBEMIS2007 Elevated Structures: Construction Emissions per 1,000 Linear Feet
Construction Emissions (Programmatic)
ROG CO NOx SOx PM10 Dust PM10 Exhaust PM10 PM2.5 Dust PM2.5 Exhaust PM2.5 CO2
HMF Phase II - 2018 ConstructionQuarter 1
Off-Road Equipment 0.220 1.076 1.626 0.000 0.000 0.072 0.072 0.000 0.066 0.066 331Vendor Trips 0.000 0.000 0.000 0.000 0.000 0.000 0.000 0.000 0.000 0.000 0Worker Trips 0.005 0.177 0.009 0.000 0.002 0.001 0.003 0.001 0.001 0.001 34
Quarter 2Off-Road Equipment 0.051 0.232 0.358 0.000 0.000 0.015 0.015 0.000 0.014 0.014 76
Vendor Trips 0.000 0.000 0.000 0.000 0.000 0.000 0.000 0.000 0.000 0.000 0Worker Trips 0.005 0.180 0.009 0.000 0.002 0.001 0.003 0.001 0.001 0.001 34
Total Q1 2 0.225 1.253 1.635 0.000 0.002 0.073 0.074 0.001 0.067 0.067 365Total Q2 2 0.056 0.412 0.367 0.000 0.002 0.016 0.017 0.001 0.014 0.015 110
HMF Phase III - 2021 ConstructionQuarter 1
Off-Road Equipment 0.194 1.040 1.340 0.000 0.000 0.057 0.057 0.000 0.052 0.052 331Vendor Trips 0.000 0.000 0.000 0.000 0.000 0.000 0.000 0.000 0.000 0.000 0Worker Trips 0.002 0.103 0.005 0.000 0.002 0.001 0.003 0.001 0.001 0.001 34
Quarter 2Off-Road Equipment 0.044 0.223 0.284 0.000 0.000 0.011 0.011 0.000 0.010 0.010 74
Vendor Trips 0.000 0.000 0.000 0.000 0.000 0.000 0.000 0.000 0.000 0.000 0Worker Trips 0.002 0.103 0.005 0.000 0.002 0.001 0.003 0.001 0.001 0.001 34
Total Q1 2 0.196 1.143 1.345 0.000 0.002 0.058 0.059 0.001 0.053 0.054 365Total Q2 2 0.046 0.326 0.289 0.000 0.002 0.012 0.014 0.001 0.011 0.012 108
Notes:1. Construction emissions were estimated using URBEMIS2007, assuming the equipment numbers and types input to the model represented constructing 1,000 linear feet of alignment.
This tab provides data for the construction of elevated structures that will be scaled on the HMF Phase II and Phase III tabs. Assumptions are documented in the Data Request ('Alignment' and 'Rail Equipment' tabs). The data on this tab only applies to structures built as part of the HMF.
Construction Phase
Emissions (tpy/1,000 ft) 1
2. Results include repeating Quarters 1 and 2 (construction of elevated structures). Worker trips are also included using the default settings of URBEMIS2007. Assumed no vendor trips while structures are built. The Quarters represent the usage of equipment groups over a 3-month period.
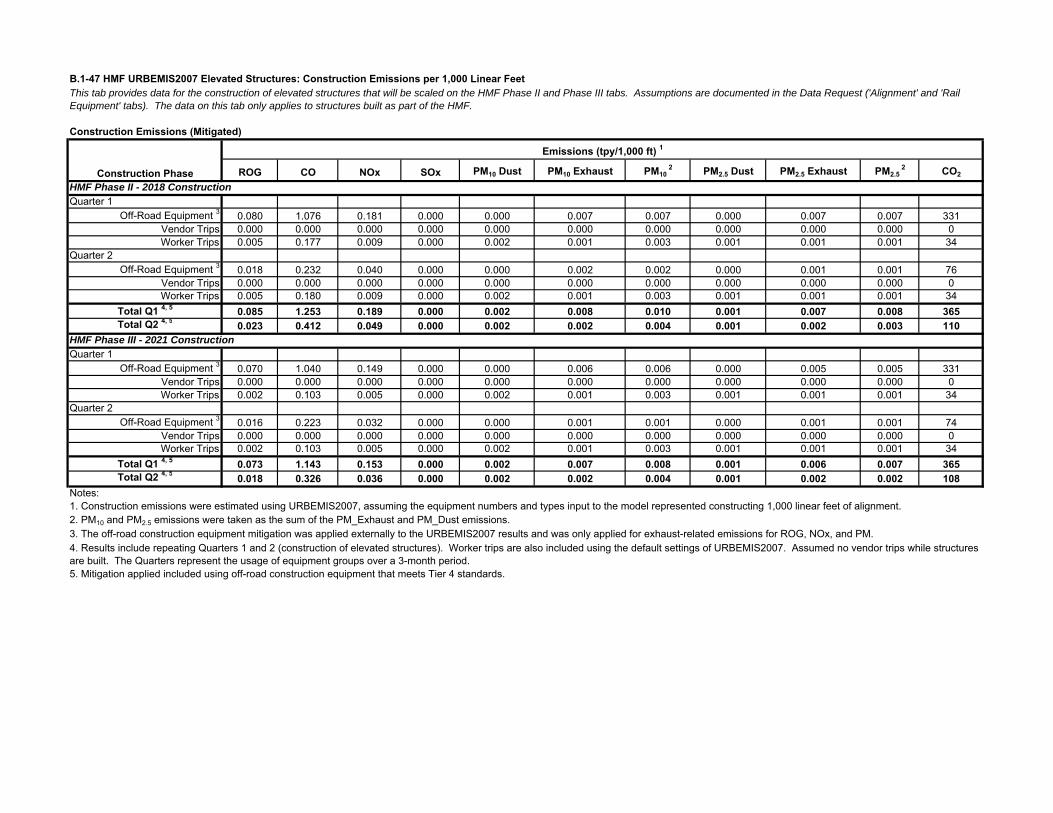
B.1-47 HMF URBEMIS2007 Elevated Structures: Construction Emissions per 1,000 Linear FeetThis tab provides data for the construction of elevated structures that will be scaled on the HMF Phase II and Phase III tabs. Assumptions are documented in the Data Request ('Alignment' and 'Rail Equipment' tabs). The data on this tab only applies to structures built as part of the HMF.
Construction Emissions (Mitigated)
ROG CO NOx SOx PM10 Dust PM10 Exhaust PM10 2 PM2.5 Dust PM2.5 Exhaust PM2.5
2 CO2
HMF Phase II - 2018 ConstructionQuarter 1
Off-Road Equipment 3 0.080 1.076 0.181 0.000 0.000 0.007 0.007 0.000 0.007 0.007 331Vendor Trips 0.000 0.000 0.000 0.000 0.000 0.000 0.000 0.000 0.000 0.000 0Worker Trips 0.005 0.177 0.009 0.000 0.002 0.001 0.003 0.001 0.001 0.001 34
Quarter 2Off-Road Equipment 3 0.018 0.232 0.040 0.000 0.000 0.002 0.002 0.000 0.001 0.001 76
Vendor Trips 0.000 0.000 0.000 0.000 0.000 0.000 0.000 0.000 0.000 0.000 0Worker Trips 0.005 0.180 0.009 0.000 0.002 0.001 0.003 0.001 0.001 0.001 34
Total Q1 4, 5 0.085 1.253 0.189 0.000 0.002 0.008 0.010 0.001 0.007 0.008 365Total Q2 4, 5 0.023 0.412 0.049 0.000 0.002 0.002 0.004 0.001 0.002 0.003 110
HMF Phase III - 2021 ConstructionQuarter 1
Off-Road Equipment 3 0.070 1.040 0.149 0.000 0.000 0.006 0.006 0.000 0.005 0.005 331Vendor Trips 0.000 0.000 0.000 0.000 0.000 0.000 0.000 0.000 0.000 0.000 0Worker Trips 0.002 0.103 0.005 0.000 0.002 0.001 0.003 0.001 0.001 0.001 34
Quarter 2Off-Road Equipment 3 0.016 0.223 0.032 0.000 0.000 0.001 0.001 0.000 0.001 0.001 74
Vendor Trips 0.000 0.000 0.000 0.000 0.000 0.000 0.000 0.000 0.000 0.000 0Worker Trips 0.002 0.103 0.005 0.000 0.002 0.001 0.003 0.001 0.001 0.001 34
Total Q1 4, 5 0.073 1.143 0.153 0.000 0.002 0.007 0.008 0.001 0.006 0.007 365Total Q2 4, 5 0.018 0.326 0.036 0.000 0.002 0.002 0.004 0.001 0.002 0.002 108
Notes:1. Construction emissions were estimated using URBEMIS2007, assuming the equipment numbers and types input to the model represented constructing 1,000 linear feet of alignment.2. PM10 and PM2.5 emissions were taken as the sum of the PM_Exhaust and PM_Dust emissions.3. The off-road construction equipment mitigation was applied externally to the URBEMIS2007 results and was only applied for exhaust-related emissions for ROG, NOx, and PM.
5. Mitigation applied included using off-road construction equipment that meets Tier 4 standards.
4. Results include repeating Quarters 1 and 2 (construction of elevated structures). Worker trips are also included using the default settings of URBEMIS2007. Assumed no vendor trips while structures are built. The Quarters represent the usage of equipment groups over a 3-month period.
Construction Phase
Emissions (tpy/1,000 ft) 1
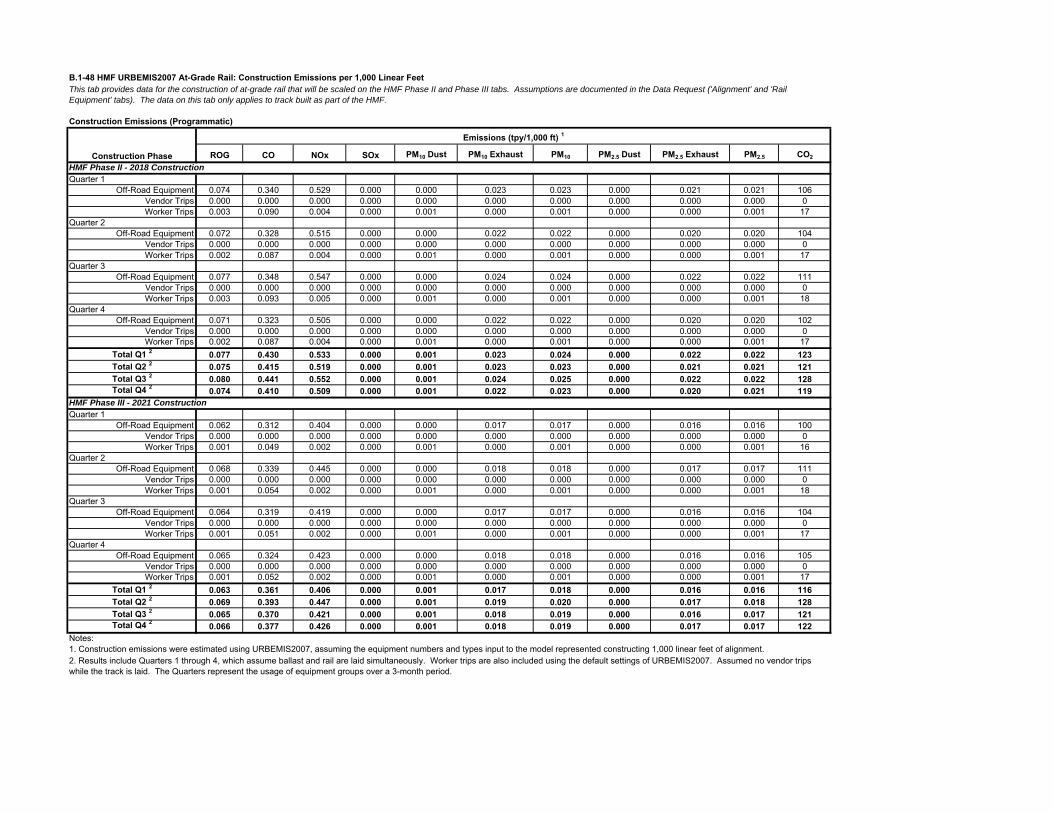
B.1-48 HMF URBEMIS2007 At-Grade Rail: Construction Emissions per 1,000 Linear Feet
Construction Emissions (Programmatic)
ROG CO NOx SOx PM10 Dust PM10 Exhaust PM10 PM2.5 Dust PM2.5 Exhaust PM2.5 CO2
HMF Phase II - 2018 ConstructionQuarter 1
Off-Road Equipment 0.074 0.340 0.529 0.000 0.000 0.023 0.023 0.000 0.021 0.021 106Vendor Trips 0.000 0.000 0.000 0.000 0.000 0.000 0.000 0.000 0.000 0.000 0Worker Trips 0.003 0.090 0.004 0.000 0.001 0.000 0.001 0.000 0.000 0.001 17
Quarter 2Off-Road Equipment 0.072 0.328 0.515 0.000 0.000 0.022 0.022 0.000 0.020 0.020 104
Vendor Trips 0.000 0.000 0.000 0.000 0.000 0.000 0.000 0.000 0.000 0.000 0Worker Trips 0.002 0.087 0.004 0.000 0.001 0.000 0.001 0.000 0.000 0.001 17
Quarter 3Off-Road Equipment 0.077 0.348 0.547 0.000 0.000 0.024 0.024 0.000 0.022 0.022 111
Vendor Trips 0.000 0.000 0.000 0.000 0.000 0.000 0.000 0.000 0.000 0.000 0Worker Trips 0.003 0.093 0.005 0.000 0.001 0.000 0.001 0.000 0.000 0.001 18
Quarter 4Off-Road Equipment 0.071 0.323 0.505 0.000 0.000 0.022 0.022 0.000 0.020 0.020 102
Vendor Trips 0.000 0.000 0.000 0.000 0.000 0.000 0.000 0.000 0.000 0.000 0Worker Trips 0.002 0.087 0.004 0.000 0.001 0.000 0.001 0.000 0.000 0.001 17
Total Q1 2 0.077 0.430 0.533 0.000 0.001 0.023 0.024 0.000 0.022 0.022 123Total Q2 2 0.075 0.415 0.519 0.000 0.001 0.023 0.023 0.000 0.021 0.021 121Total Q3 2 0.080 0.441 0.552 0.000 0.001 0.024 0.025 0.000 0.022 0.022 128Total Q4 2 0.074 0.410 0.509 0.000 0.001 0.022 0.023 0.000 0.020 0.021 119
HMF Phase III - 2021 ConstructionQuarter 1
Off-Road Equipment 0.062 0.312 0.404 0.000 0.000 0.017 0.017 0.000 0.016 0.016 100Vendor Trips 0.000 0.000 0.000 0.000 0.000 0.000 0.000 0.000 0.000 0.000 0Worker Trips 0.001 0.049 0.002 0.000 0.001 0.000 0.001 0.000 0.000 0.001 16
Quarter 2Off-Road Equipment 0.068 0.339 0.445 0.000 0.000 0.018 0.018 0.000 0.017 0.017 111
Vendor Trips 0.000 0.000 0.000 0.000 0.000 0.000 0.000 0.000 0.000 0.000 0Worker Trips 0.001 0.054 0.002 0.000 0.001 0.000 0.001 0.000 0.000 0.001 18
Quarter 3Off-Road Equipment 0.064 0.319 0.419 0.000 0.000 0.017 0.017 0.000 0.016 0.016 104
Vendor Trips 0.000 0.000 0.000 0.000 0.000 0.000 0.000 0.000 0.000 0.000 0Worker Trips 0.001 0.051 0.002 0.000 0.001 0.000 0.001 0.000 0.000 0.001 17
Quarter 4Off-Road Equipment 0.065 0.324 0.423 0.000 0.000 0.018 0.018 0.000 0.016 0.016 105
Vendor Trips 0.000 0.000 0.000 0.000 0.000 0.000 0.000 0.000 0.000 0.000 0Worker Trips 0.001 0.052 0.002 0.000 0.001 0.000 0.001 0.000 0.000 0.001 17
Total Q1 2 0.063 0.361 0.406 0.000 0.001 0.017 0.018 0.000 0.016 0.016 116Total Q2 2 0.069 0.393 0.447 0.000 0.001 0.019 0.020 0.000 0.017 0.018 128Total Q3 2 0.065 0.370 0.421 0.000 0.001 0.018 0.019 0.000 0.016 0.017 121Total Q4 2 0.066 0.377 0.426 0.000 0.001 0.018 0.019 0.000 0.017 0.017 122
Notes:1. Construction emissions were estimated using URBEMIS2007, assuming the equipment numbers and types input to the model represented constructing 1,000 linear feet of alignment.
This tab provides data for the construction of at-grade rail that will be scaled on the HMF Phase II and Phase III tabs. Assumptions are documented in the Data Request ('Alignment' and 'Rail Equipment' tabs). The data on this tab only applies to track built as part of the HMF.
Construction Phase
Emissions (tpy/1,000 ft) 1
2. Results include Quarters 1 through 4, which assume ballast and rail are laid simultaneously. Worker trips are also included using the default settings of URBEMIS2007. Assumed no vendor trips while the track is laid. The Quarters represent the usage of equipment groups over a 3-month period.
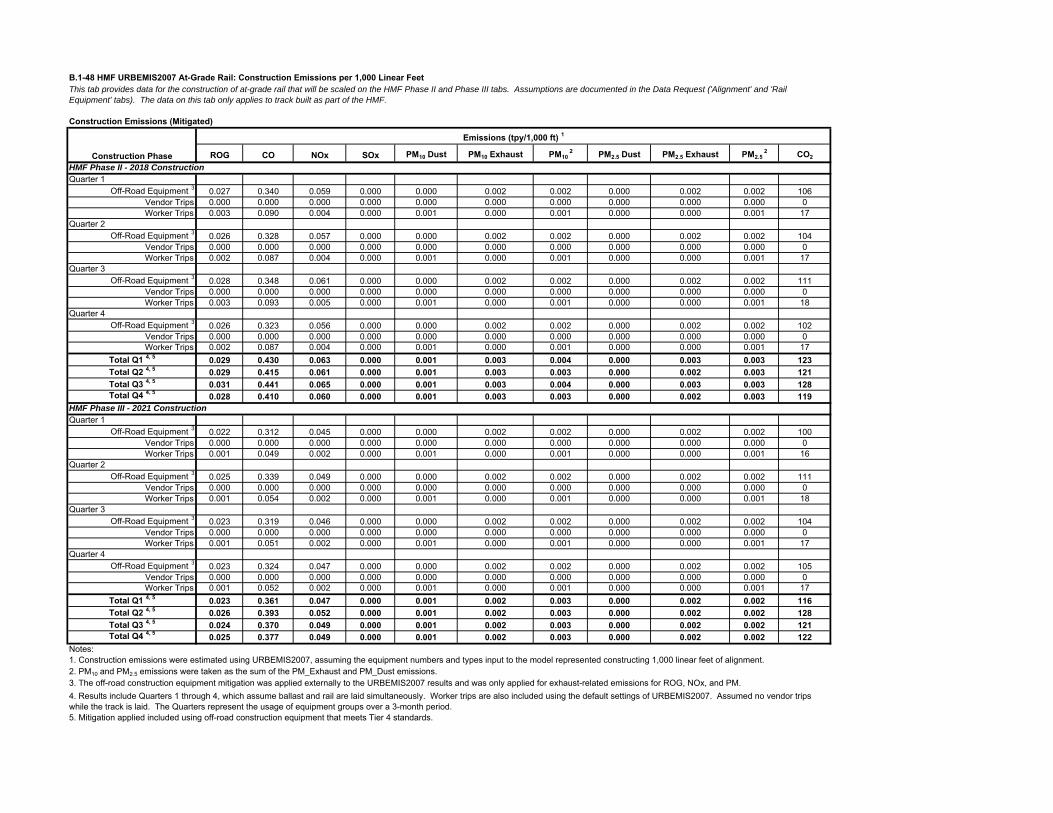
B.1-48 HMF URBEMIS2007 At-Grade Rail: Construction Emissions per 1,000 Linear FeetThis tab provides data for the construction of at-grade rail that will be scaled on the HMF Phase II and Phase III tabs. Assumptions are documented in the Data Request ('Alignment' and 'Rail Equipment' tabs). The data on this tab only applies to track built as part of the HMF.
Construction Emissions (Mitigated)
ROG CO NOx SOx PM10 Dust PM10 Exhaust PM10 2 PM2.5 Dust PM2.5 Exhaust PM2.5
2 CO2
HMF Phase II - 2018 ConstructionQuarter 1
Off-Road Equipment 3 0.027 0.340 0.059 0.000 0.000 0.002 0.002 0.000 0.002 0.002 106Vendor Trips 0.000 0.000 0.000 0.000 0.000 0.000 0.000 0.000 0.000 0.000 0Worker Trips 0.003 0.090 0.004 0.000 0.001 0.000 0.001 0.000 0.000 0.001 17
Quarter 2Off-Road Equipment 3 0.026 0.328 0.057 0.000 0.000 0.002 0.002 0.000 0.002 0.002 104
Vendor Trips 0.000 0.000 0.000 0.000 0.000 0.000 0.000 0.000 0.000 0.000 0Worker Trips 0.002 0.087 0.004 0.000 0.001 0.000 0.001 0.000 0.000 0.001 17
Quarter 3Off-Road Equipment 3 0.028 0.348 0.061 0.000 0.000 0.002 0.002 0.000 0.002 0.002 111
Vendor Trips 0.000 0.000 0.000 0.000 0.000 0.000 0.000 0.000 0.000 0.000 0Worker Trips 0.003 0.093 0.005 0.000 0.001 0.000 0.001 0.000 0.000 0.001 18
Quarter 4Off-Road Equipment 3 0.026 0.323 0.056 0.000 0.000 0.002 0.002 0.000 0.002 0.002 102
Vendor Trips 0.000 0.000 0.000 0.000 0.000 0.000 0.000 0.000 0.000 0.000 0Worker Trips 0.002 0.087 0.004 0.000 0.001 0.000 0.001 0.000 0.000 0.001 17
Total Q1 4, 5 0.029 0.430 0.063 0.000 0.001 0.003 0.004 0.000 0.003 0.003 123Total Q2 4, 5 0.029 0.415 0.061 0.000 0.001 0.003 0.003 0.000 0.002 0.003 121Total Q3 4, 5 0.031 0.441 0.065 0.000 0.001 0.003 0.004 0.000 0.003 0.003 128Total Q4 4, 5 0.028 0.410 0.060 0.000 0.001 0.003 0.003 0.000 0.002 0.003 119
HMF Phase III - 2021 ConstructionQuarter 1
Off-Road Equipment 3 0.022 0.312 0.045 0.000 0.000 0.002 0.002 0.000 0.002 0.002 100Vendor Trips 0.000 0.000 0.000 0.000 0.000 0.000 0.000 0.000 0.000 0.000 0Worker Trips 0.001 0.049 0.002 0.000 0.001 0.000 0.001 0.000 0.000 0.001 16
Quarter 2Off-Road Equipment 3 0.025 0.339 0.049 0.000 0.000 0.002 0.002 0.000 0.002 0.002 111
Vendor Trips 0.000 0.000 0.000 0.000 0.000 0.000 0.000 0.000 0.000 0.000 0Worker Trips 0.001 0.054 0.002 0.000 0.001 0.000 0.001 0.000 0.000 0.001 18
Quarter 3Off-Road Equipment 3 0.023 0.319 0.046 0.000 0.000 0.002 0.002 0.000 0.002 0.002 104
Vendor Trips 0.000 0.000 0.000 0.000 0.000 0.000 0.000 0.000 0.000 0.000 0Worker Trips 0.001 0.051 0.002 0.000 0.001 0.000 0.001 0.000 0.000 0.001 17
Quarter 4Off-Road Equipment 3 0.023 0.324 0.047 0.000 0.000 0.002 0.002 0.000 0.002 0.002 105
Vendor Trips 0.000 0.000 0.000 0.000 0.000 0.000 0.000 0.000 0.000 0.000 0Worker Trips 0.001 0.052 0.002 0.000 0.001 0.000 0.001 0.000 0.000 0.001 17
Total Q1 4, 5 0.023 0.361 0.047 0.000 0.001 0.002 0.003 0.000 0.002 0.002 116Total Q2 4, 5 0.026 0.393 0.052 0.000 0.001 0.002 0.003 0.000 0.002 0.002 128Total Q3 4, 5 0.024 0.370 0.049 0.000 0.001 0.002 0.003 0.000 0.002 0.002 121Total Q4 4, 5 0.025 0.377 0.049 0.000 0.001 0.002 0.003 0.000 0.002 0.002 122
Notes:1. Construction emissions were estimated using URBEMIS2007, assuming the equipment numbers and types input to the model represented constructing 1,000 linear feet of alignment.2. PM10 and PM2.5 emissions were taken as the sum of the PM_Exhaust and PM_Dust emissions.3. The off-road construction equipment mitigation was applied externally to the URBEMIS2007 results and was only applied for exhaust-related emissions for ROG, NOx, and PM.
5. Mitigation applied included using off-road construction equipment that meets Tier 4 standards.
4. Results include Quarters 1 through 4, which assume ballast and rail are laid simultaneously. Worker trips are also included using the default settings of URBEMIS2007. Assumed no vendor trips while the track is laid. The Quarters represent the usage of equipment groups over a 3-month period.
Construction Phase
Emissions (tpy/1,000 ft) 1
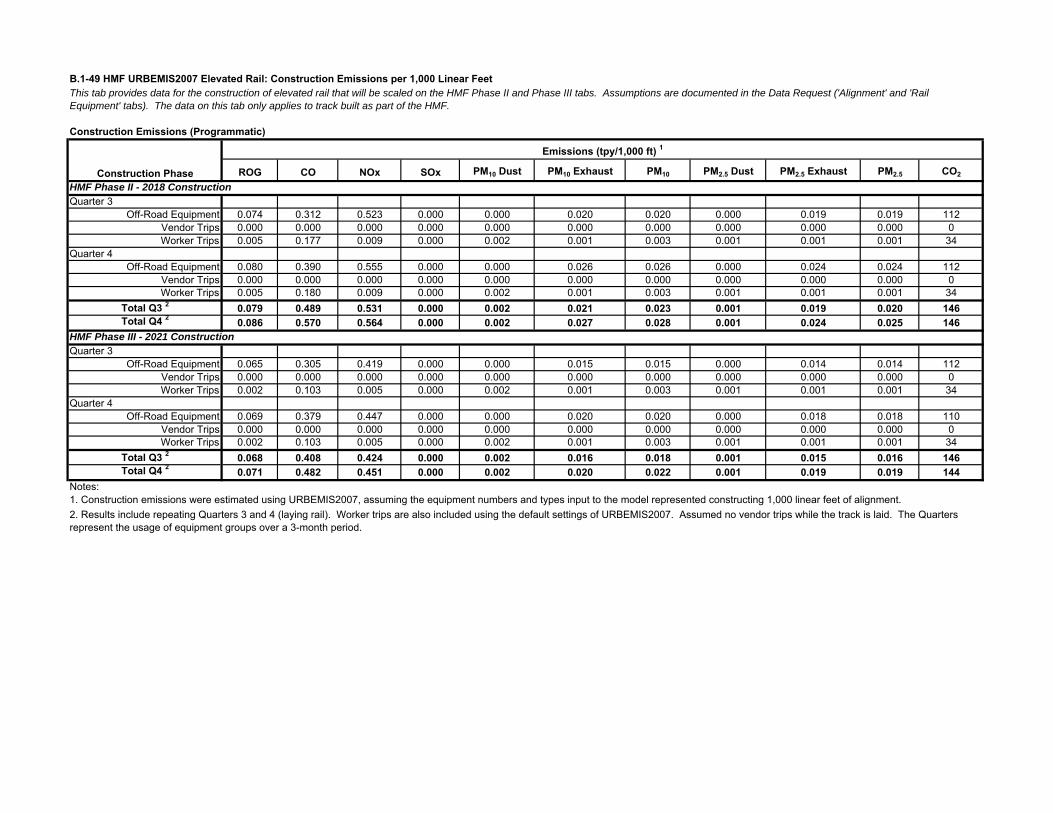
B.1-49 HMF URBEMIS2007 Elevated Rail: Construction Emissions per 1,000 Linear Feet
Construction Emissions (Programmatic)
ROG CO NOx SOx PM10 Dust PM10 Exhaust PM10 PM2.5 Dust PM2.5 Exhaust PM2.5 CO2
HMF Phase II - 2018 ConstructionQuarter 3
Off-Road Equipment 0.074 0.312 0.523 0.000 0.000 0.020 0.020 0.000 0.019 0.019 112Vendor Trips 0.000 0.000 0.000 0.000 0.000 0.000 0.000 0.000 0.000 0.000 0Worker Trips 0.005 0.177 0.009 0.000 0.002 0.001 0.003 0.001 0.001 0.001 34
Quarter 4Off-Road Equipment 0.080 0.390 0.555 0.000 0.000 0.026 0.026 0.000 0.024 0.024 112
Vendor Trips 0.000 0.000 0.000 0.000 0.000 0.000 0.000 0.000 0.000 0.000 0Worker Trips 0.005 0.180 0.009 0.000 0.002 0.001 0.003 0.001 0.001 0.001 34
Total Q3 2 0.079 0.489 0.531 0.000 0.002 0.021 0.023 0.001 0.019 0.020 146Total Q4 2 0.086 0.570 0.564 0.000 0.002 0.027 0.028 0.001 0.024 0.025 146
HMF Phase III - 2021 ConstructionQuarter 3
Off-Road Equipment 0.065 0.305 0.419 0.000 0.000 0.015 0.015 0.000 0.014 0.014 112Vendor Trips 0.000 0.000 0.000 0.000 0.000 0.000 0.000 0.000 0.000 0.000 0Worker Trips 0.002 0.103 0.005 0.000 0.002 0.001 0.003 0.001 0.001 0.001 34
Quarter 4Off-Road Equipment 0.069 0.379 0.447 0.000 0.000 0.020 0.020 0.000 0.018 0.018 110
Vendor Trips 0.000 0.000 0.000 0.000 0.000 0.000 0.000 0.000 0.000 0.000 0Worker Trips 0.002 0.103 0.005 0.000 0.002 0.001 0.003 0.001 0.001 0.001 34
Total Q3 2 0.068 0.408 0.424 0.000 0.002 0.016 0.018 0.001 0.015 0.016 146Total Q4 2 0.071 0.482 0.451 0.000 0.002 0.020 0.022 0.001 0.019 0.019 144
Notes:1. Construction emissions were estimated using URBEMIS2007, assuming the equipment numbers and types input to the model represented constructing 1,000 linear feet of alignment.
This tab provides data for the construction of elevated rail that will be scaled on the HMF Phase II and Phase III tabs. Assumptions are documented in the Data Request ('Alignment' and 'Rail Equipment' tabs). The data on this tab only applies to track built as part of the HMF.
Construction Phase
Emissions (tpy/1,000 ft) 1
2. Results include repeating Quarters 3 and 4 (laying rail). Worker trips are also included using the default settings of URBEMIS2007. Assumed no vendor trips while the track is laid. The Quarters represent the usage of equipment groups over a 3-month period.
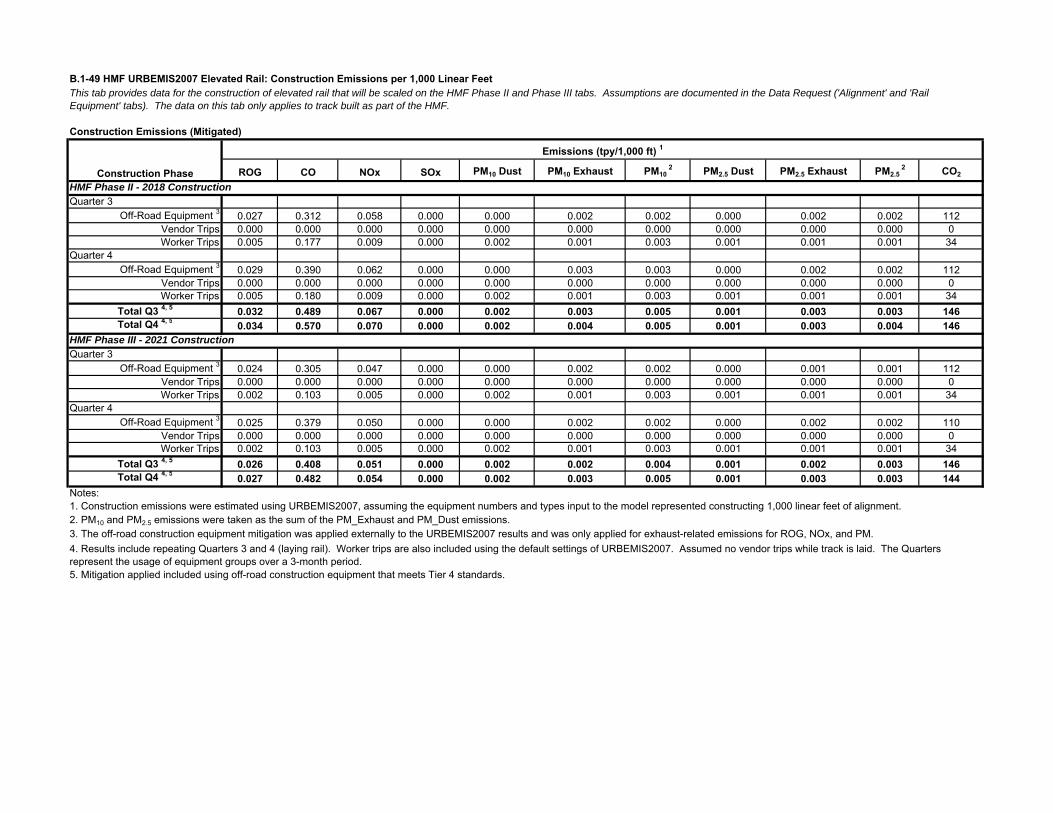
B.1-49 HMF URBEMIS2007 Elevated Rail: Construction Emissions per 1,000 Linear FeetThis tab provides data for the construction of elevated rail that will be scaled on the HMF Phase II and Phase III tabs. Assumptions are documented in the Data Request ('Alignment' and 'Rail Equipment' tabs). The data on this tab only applies to track built as part of the HMF.
Construction Emissions (Mitigated)
ROG CO NOx SOx PM10 Dust PM10 Exhaust PM10 2 PM2.5 Dust PM2.5 Exhaust PM2.5
2 CO2
HMF Phase II - 2018 ConstructionQuarter 3
Off-Road Equipment 3 0.027 0.312 0.058 0.000 0.000 0.002 0.002 0.000 0.002 0.002 112Vendor Trips 0.000 0.000 0.000 0.000 0.000 0.000 0.000 0.000 0.000 0.000 0Worker Trips 0.005 0.177 0.009 0.000 0.002 0.001 0.003 0.001 0.001 0.001 34
Quarter 4Off-Road Equipment 3 0.029 0.390 0.062 0.000 0.000 0.003 0.003 0.000 0.002 0.002 112
Vendor Trips 0.000 0.000 0.000 0.000 0.000 0.000 0.000 0.000 0.000 0.000 0Worker Trips 0.005 0.180 0.009 0.000 0.002 0.001 0.003 0.001 0.001 0.001 34
Total Q3 4, 5 0.032 0.489 0.067 0.000 0.002 0.003 0.005 0.001 0.003 0.003 146Total Q4 4, 5 0.034 0.570 0.070 0.000 0.002 0.004 0.005 0.001 0.003 0.004 146
HMF Phase III - 2021 ConstructionQuarter 3
Off-Road Equipment 3 0.024 0.305 0.047 0.000 0.000 0.002 0.002 0.000 0.001 0.001 112Vendor Trips 0.000 0.000 0.000 0.000 0.000 0.000 0.000 0.000 0.000 0.000 0Worker Trips 0.002 0.103 0.005 0.000 0.002 0.001 0.003 0.001 0.001 0.001 34
Quarter 4Off-Road Equipment 3 0.025 0.379 0.050 0.000 0.000 0.002 0.002 0.000 0.002 0.002 110
Vendor Trips 0.000 0.000 0.000 0.000 0.000 0.000 0.000 0.000 0.000 0.000 0Worker Trips 0.002 0.103 0.005 0.000 0.002 0.001 0.003 0.001 0.001 0.001 34
Total Q3 4, 5 0.026 0.408 0.051 0.000 0.002 0.002 0.004 0.001 0.002 0.003 146Total Q4 4, 5 0.027 0.482 0.054 0.000 0.002 0.003 0.005 0.001 0.003 0.003 144
Notes:1. Construction emissions were estimated using URBEMIS2007, assuming the equipment numbers and types input to the model represented constructing 1,000 linear feet of alignment.2. PM10 and PM2.5 emissions were taken as the sum of the PM_Exhaust and PM_Dust emissions.3. The off-road construction equipment mitigation was applied externally to the URBEMIS2007 results and was only applied for exhaust-related emissions for ROG, NOx, and PM.
5. Mitigation applied included using off-road construction equipment that meets Tier 4 standards.
4. Results include repeating Quarters 3 and 4 (laying rail). Worker trips are also included using the default settings of URBEMIS2007. Assumed no vendor trips while track is laid. The Quarters represent the usage of equipment groups over a 3-month period.
Construction Phase
Emissions (tpy/1,000 ft) 1

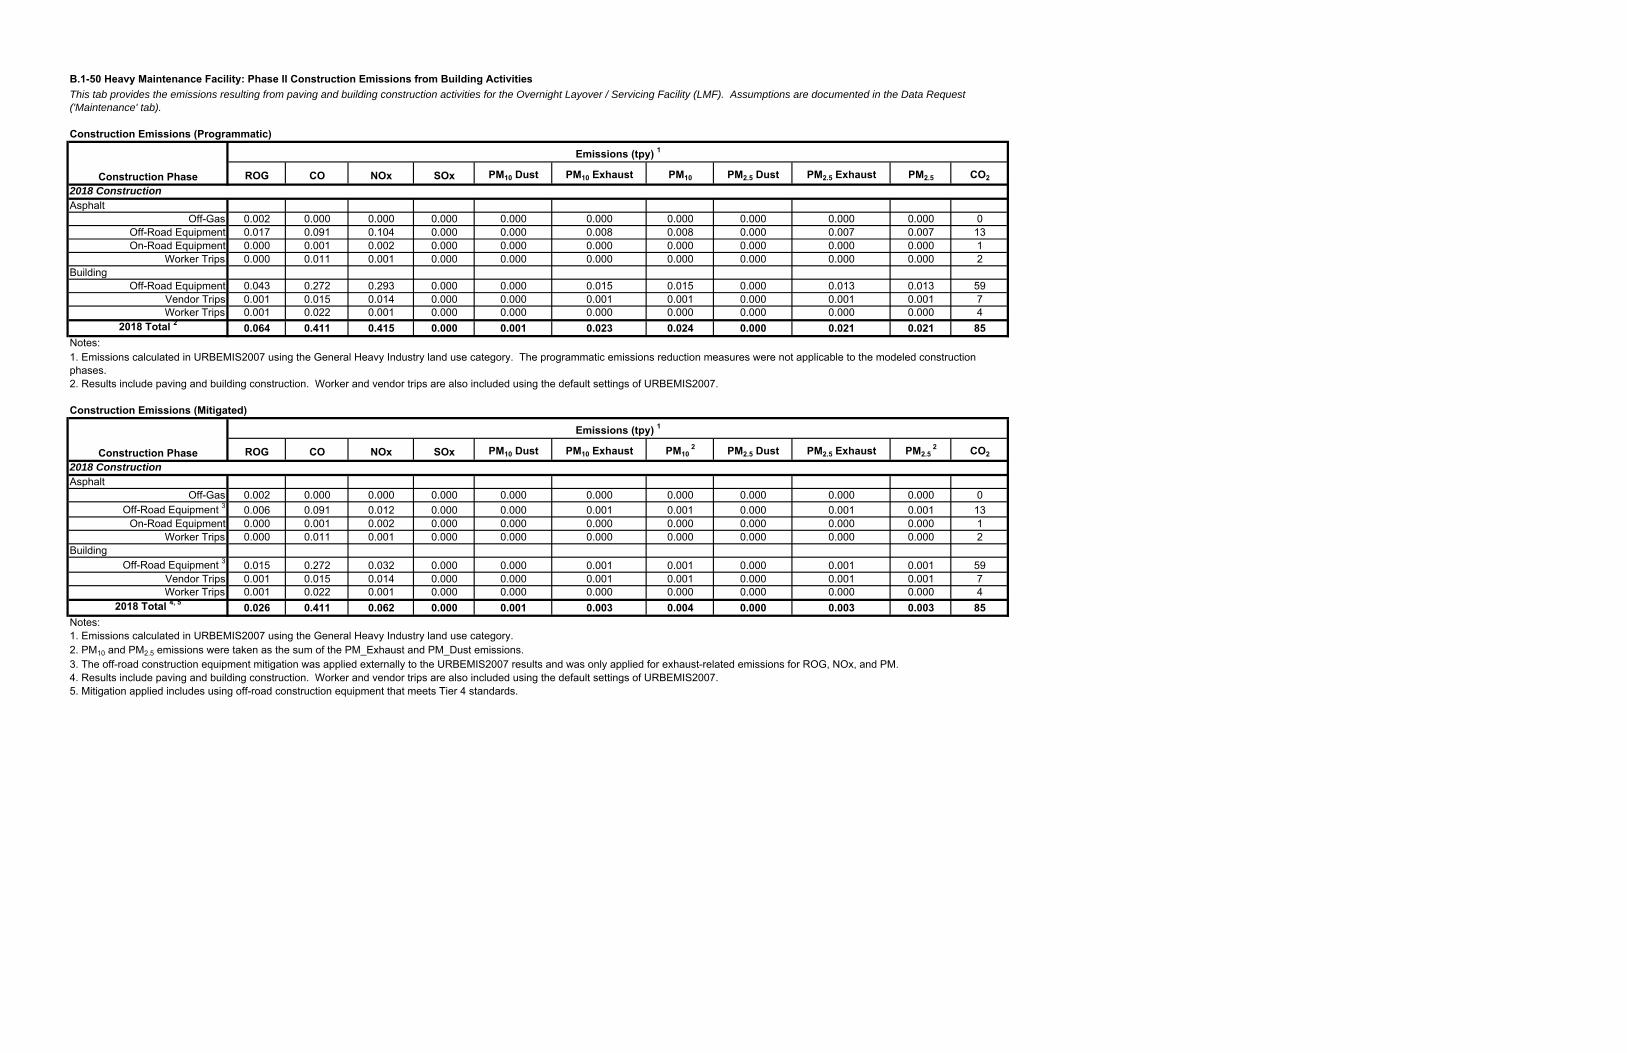
B.1-50 Heavy Maintenance Facility: Phase II Construction Emissions from Building Activities
Construction Emissions (Programmatic)
ROG CO NOx SOx PM10 Dust PM10 Exhaust PM10 PM2.5 Dust PM2.5 Exhaust PM2.5 CO2
2018 ConstructionAsphalt
Off-Gas 0.002 0.000 0.000 0.000 0.000 0.000 0.000 0.000 0.000 0.000 0Off-Road Equipment 0.017 0.091 0.104 0.000 0.000 0.008 0.008 0.000 0.007 0.007 13On-Road Equipment 0.000 0.001 0.002 0.000 0.000 0.000 0.000 0.000 0.000 0.000 1
Worker Trips 0.000 0.011 0.001 0.000 0.000 0.000 0.000 0.000 0.000 0.000 2Building
Off-Road Equipment 0.043 0.272 0.293 0.000 0.000 0.015 0.015 0.000 0.013 0.013 59Vendor Trips 0.001 0.015 0.014 0.000 0.000 0.001 0.001 0.000 0.001 0.001 7Worker Trips 0.001 0.022 0.001 0.000 0.000 0.000 0.000 0.000 0.000 0.000 4
2018 Total 2 0.064 0.411 0.415 0.000 0.001 0.023 0.024 0.000 0.021 0.021 85Notes:
2. Results include paving and building construction. Worker and vendor trips are also included using the default settings of URBEMIS2007.
Construction Emissions (Mitigated)
ROG CO NOx SOx PM10 Dust PM10 Exhaust PM10 2 PM2.5 Dust PM2.5 Exhaust PM2.5
2 CO2
2018 ConstructionAsphalt
Off-Gas 0.002 0.000 0.000 0.000 0.000 0.000 0.000 0.000 0.000 0.000 0Off-Road Equipment 3 0.006 0.091 0.012 0.000 0.000 0.001 0.001 0.000 0.001 0.001 13
On-Road Equipment 0.000 0.001 0.002 0.000 0.000 0.000 0.000 0.000 0.000 0.000 1Worker Trips 0.000 0.011 0.001 0.000 0.000 0.000 0.000 0.000 0.000 0.000 2
BuildingOff-Road Equipment 3 0.015 0.272 0.032 0.000 0.000 0.001 0.001 0.000 0.001 0.001 59
Vendor Trips 0.001 0.015 0.014 0.000 0.000 0.001 0.001 0.000 0.001 0.001 7Worker Trips 0.001 0.022 0.001 0.000 0.000 0.000 0.000 0.000 0.000 0.000 4
2018 Total 4, 5 0.026 0.411 0.062 0.000 0.001 0.003 0.004 0.000 0.003 0.003 85Notes:1. Emissions calculated in URBEMIS2007 using the General Heavy Industry land use category.2. PM10 and PM2.5 emissions were taken as the sum of the PM_Exhaust and PM_Dust emissions.3. The off-road construction equipment mitigation was applied externally to the URBEMIS2007 results and was only applied for exhaust-related emissions for ROG, NOx, and PM.4. Results include paving and building construction. Worker and vendor trips are also included using the default settings of URBEMIS2007.5. Mitigation applied includes using off-road construction equipment that meets Tier 4 standards.
Construction Phase
Emissions (tpy) 1
Construction Phase
Emissions (tpy) 1
This tab provides the emissions resulting from paving and building construction activities for the Overnight Layover / Servicing Facility (LMF). Assumptions are documented in the Data Request ('Maintenance' tab).
1. Emissions calculated in URBEMIS2007 using the General Heavy Industry land use category. The programmatic emissions reduction measures were not applicable to the modeled construction phases.
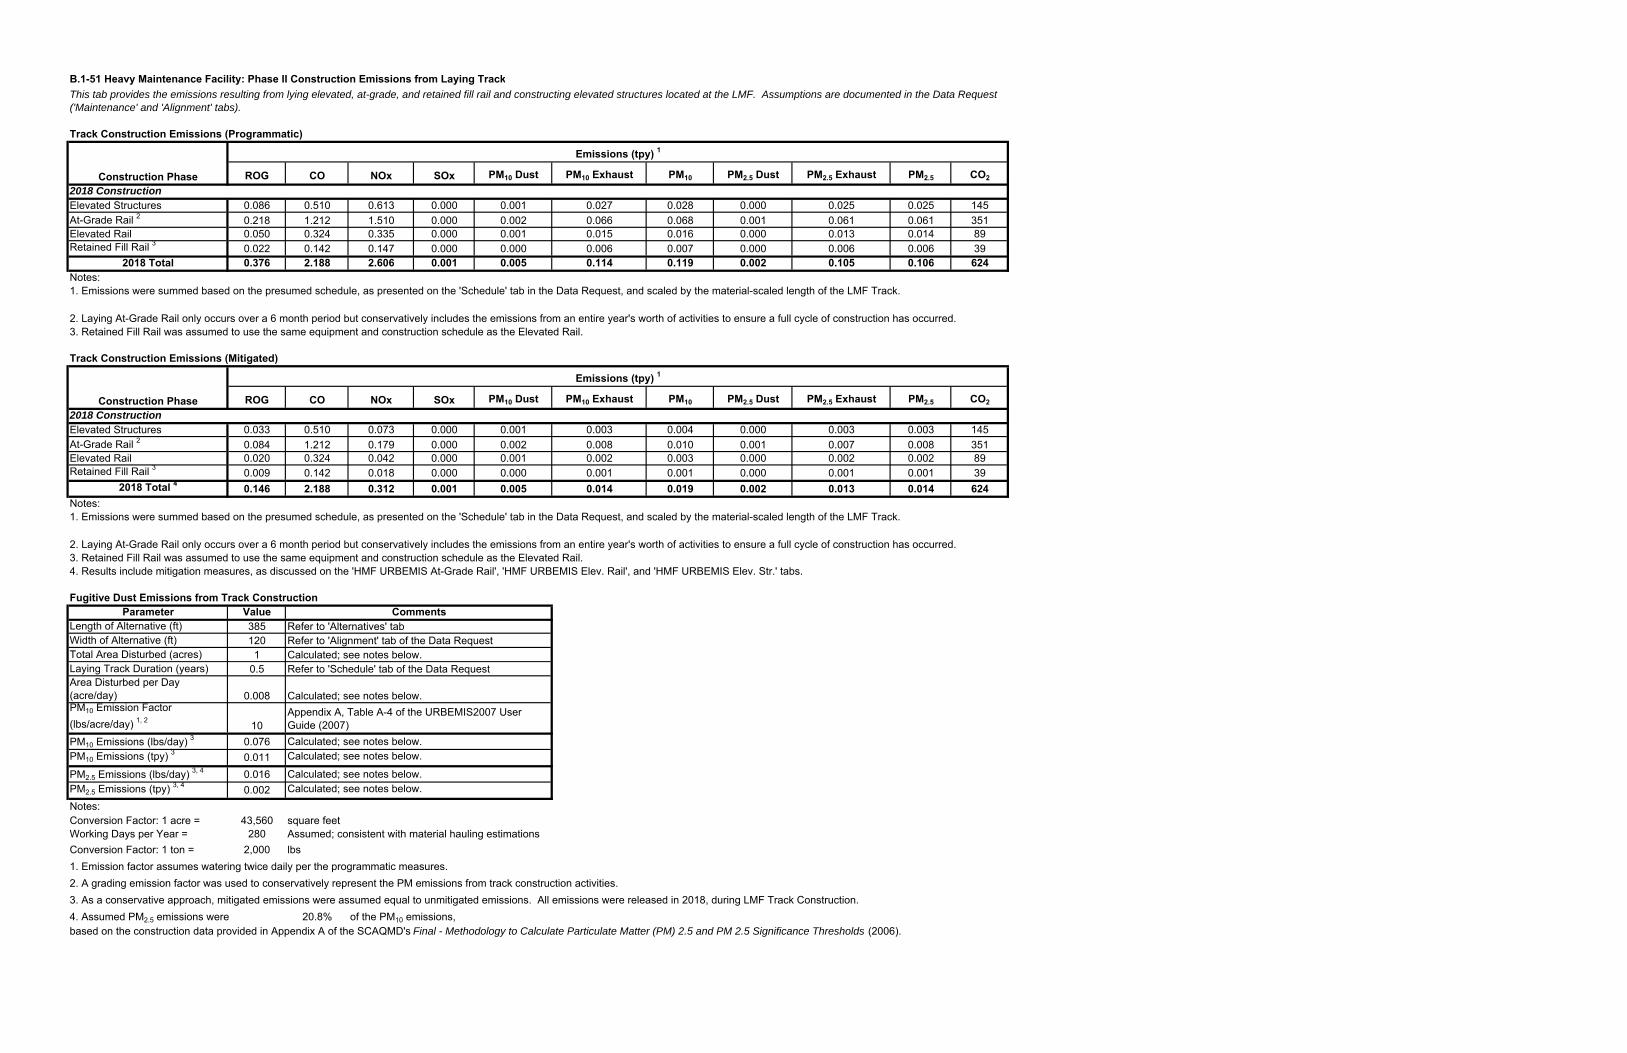
B.1-51 Heavy Maintenance Facility: Phase II Construction Emissions from Laying Track
Track Construction Emissions (Programmatic)
ROG CO NOx SOx PM10 Dust PM10 Exhaust PM10 PM2.5 Dust PM2.5 Exhaust PM2.5 CO2
2018 ConstructionElevated Structures 0.086 0.510 0.613 0.000 0.001 0.027 0.028 0.000 0.025 0.025 145At-Grade Rail 2 0.218 1.212 1.510 0.000 0.002 0.066 0.068 0.001 0.061 0.061 351Elevated Rail 0.050 0.324 0.335 0.000 0.001 0.015 0.016 0.000 0.013 0.014 89Retained Fill Rail 3 0.022 0.142 0.147 0.000 0.000 0.006 0.007 0.000 0.006 0.006 39
2018 Total 0.376 2.188 2.606 0.001 0.005 0.114 0.119 0.002 0.105 0.106 624Notes:1. Emissions were summed based on the presumed schedule, as presented on the 'Schedule' tab in the Data Request, and scaled by the material-scaled length of the LMF Track.
3. Retained Fill Rail was assumed to use the same equipment and construction schedule as the Elevated Rail.
Track Construction Emissions (Mitigated)
ROG CO NOx SOx PM10 Dust PM10 Exhaust PM10 PM2.5 Dust PM2.5 Exhaust PM2.5 CO2
2018 ConstructionElevated Structures 0.033 0.510 0.073 0.000 0.001 0.003 0.004 0.000 0.003 0.003 145At-Grade Rail 2 0.084 1.212 0.179 0.000 0.002 0.008 0.010 0.001 0.007 0.008 351Elevated Rail 0.020 0.324 0.042 0.000 0.001 0.002 0.003 0.000 0.002 0.002 89Retained Fill Rail 3 0.009 0.142 0.018 0.000 0.000 0.001 0.001 0.000 0.001 0.001 39
2018 Total 4 0.146 2.188 0.312 0.001 0.005 0.014 0.019 0.002 0.013 0.014 624Notes:1. Emissions were summed based on the presumed schedule, as presented on the 'Schedule' tab in the Data Request, and scaled by the material-scaled length of the LMF Track.
3. Retained Fill Rail was assumed to use the same equipment and construction schedule as the Elevated Rail.4. Results include mitigation measures, as discussed on the 'HMF URBEMIS At-Grade Rail', 'HMF URBEMIS Elev. Rail', and 'HMF URBEMIS Elev. Str.' tabs.
Fugitive Dust Emissions from Track ConstructionParameter Value
Length of Alternative (ft) 385Width of Alternative (ft) 120Total Area Disturbed (acres) 1Laying Track Duration (years) 0.5Area Disturbed per Day (acre/day) 0.008PM10 Emission Factor (lbs/acre/day) 1, 2 10PM10 Emissions (lbs/day) 3 0.076PM10 Emissions (tpy) 3 0.011PM2.5 Emissions (lbs/day) 3, 4 0.016PM2.5 Emissions (tpy) 3, 4 0.002Notes:Conversion Factor: 1 acre = 43,560 square feetWorking Days per Year = 280 Assumed; consistent with material hauling estimationsConversion Factor: 1 ton = 2,000 lbs1. Emission factor assumes watering twice daily per the programmatic measures.2. A grading emission factor was used to conservatively represent the PM emissions from track construction activities.3. As a conservative approach, mitigated emissions were assumed equal to unmitigated emissions. All emissions were released in 2018, during LMF Track Construction.4. Assumed PM2.5 emissions were 20.8% of the PM10 emissions,
Construction Phase
2. Laying At-Grade Rail only occurs over a 6 month period but conservatively includes the emissions from an entire year's worth of activities to ensure a full cycle of construction has occurred.
Emissions (tpy) 1
Construction Phase
Emissions (tpy) 1
Calculated; see notes below.
Calculated; see notes below.Calculated; see notes below.
based on the construction data provided in Appendix A of the SCAQMD's Final - Methodology to Calculate Particulate Matter (PM) 2.5 and PM 2.5 Significance Thresholds (2006).
This tab provides the emissions resulting from lying elevated, at-grade, and retained fill rail and constructing elevated structures located at the LMF. Assumptions are documented in the Data Request ('Maintenance' and 'Alignment' tabs).
Calculated; see notes below.Refer to 'Schedule' tab of the Data Request
Calculated; see notes below.Appendix A, Table A-4 of the URBEMIS2007 User Guide (2007)Calculated; see notes below.
2. Laying At-Grade Rail only occurs over a 6 month period but conservatively includes the emissions from an entire year's worth of activities to ensure a full cycle of construction has occurred.
CommentsRefer to 'Alternatives' tabRefer to 'Alignment' tab of the Data Request
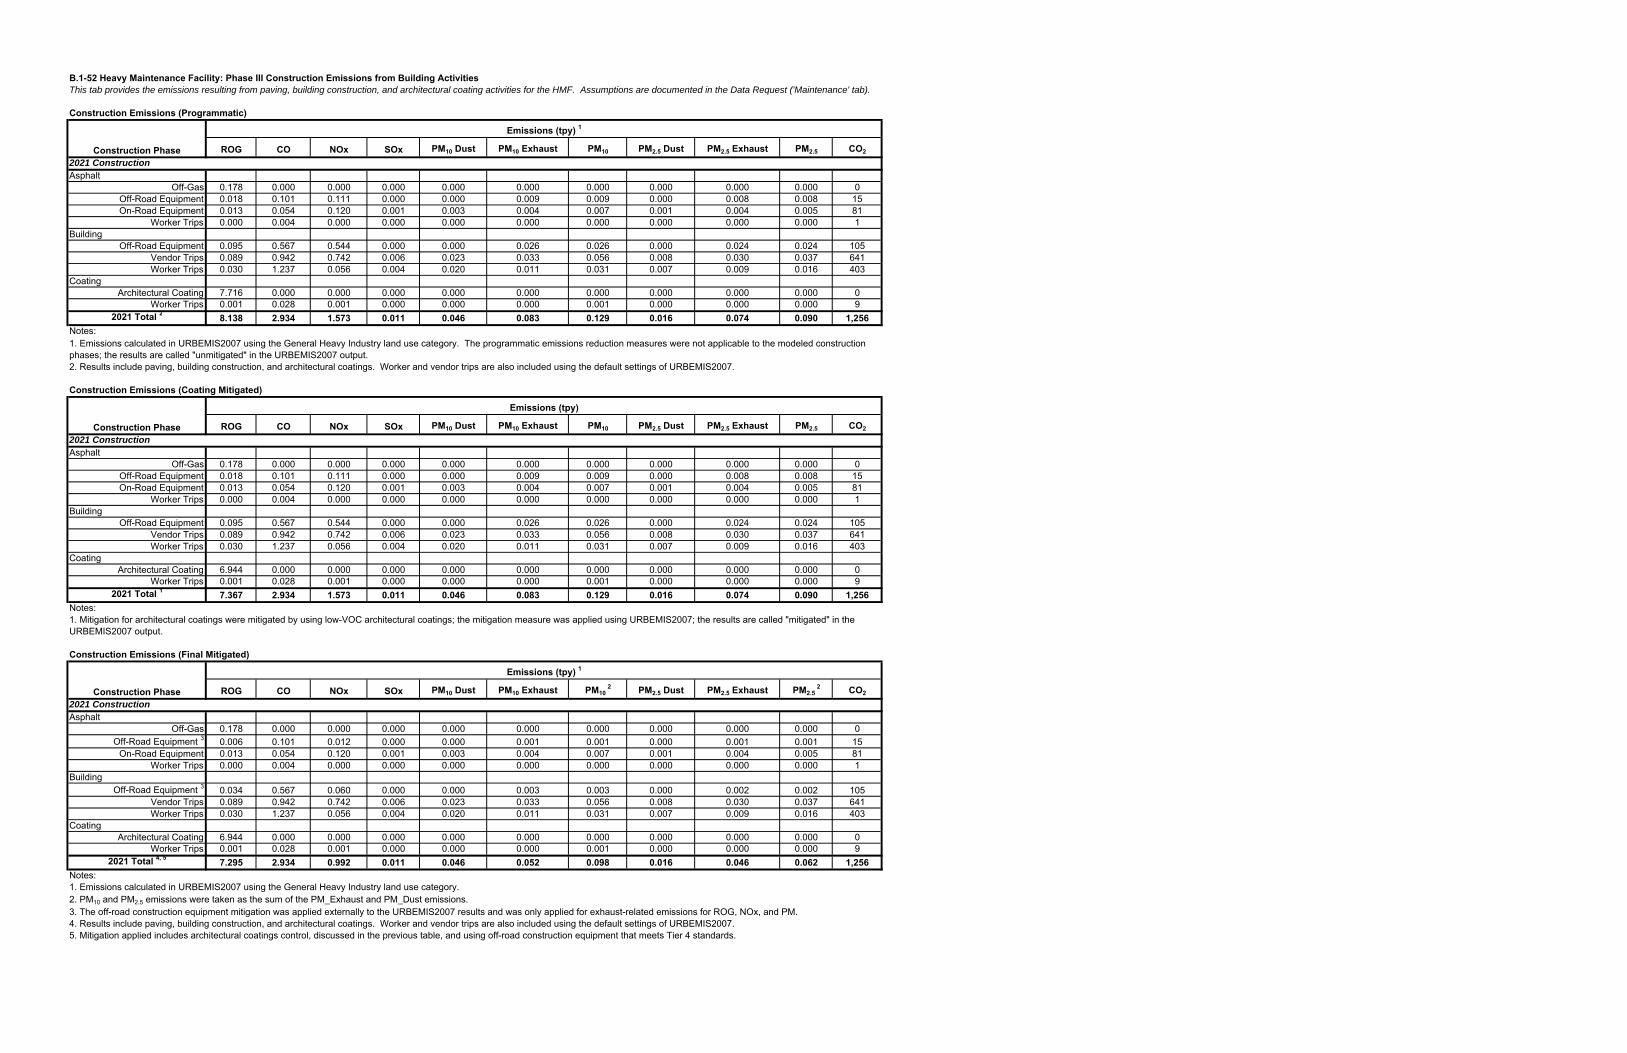
B.1-52 Heavy Maintenance Facility: Phase III Construction Emissions from Building Activities
Construction Emissions (Programmatic)
ROG CO NOx SOx PM10 Dust PM10 Exhaust PM10 PM2.5 Dust PM2.5 Exhaust PM2.5 CO2
2021 ConstructionAsphalt
Off-Gas 0.178 0.000 0.000 0.000 0.000 0.000 0.000 0.000 0.000 0.000 0Off-Road Equipment 0.018 0.101 0.111 0.000 0.000 0.009 0.009 0.000 0.008 0.008 15On-Road Equipment 0.013 0.054 0.120 0.001 0.003 0.004 0.007 0.001 0.004 0.005 81
Worker Trips 0.000 0.004 0.000 0.000 0.000 0.000 0.000 0.000 0.000 0.000 1Building
Off-Road Equipment 0.095 0.567 0.544 0.000 0.000 0.026 0.026 0.000 0.024 0.024 105Vendor Trips 0.089 0.942 0.742 0.006 0.023 0.033 0.056 0.008 0.030 0.037 641Worker Trips 0.030 1.237 0.056 0.004 0.020 0.011 0.031 0.007 0.009 0.016 403
CoatingArchitectural Coating 7.716 0.000 0.000 0.000 0.000 0.000 0.000 0.000 0.000 0.000 0
Worker Trips 0.001 0.028 0.001 0.000 0.000 0.000 0.001 0.000 0.000 0.000 92021 Total 2 8.138 2.934 1.573 0.011 0.046 0.083 0.129 0.016 0.074 0.090 1,256
Notes:
2. Results include paving, building construction, and architectural coatings. Worker and vendor trips are also included using the default settings of URBEMIS2007.
Construction Emissions (Coating Mitigated)
ROG CO NOx SOx PM10 Dust PM10 Exhaust PM10 PM2.5 Dust PM2.5 Exhaust PM2.5 CO2
2021 ConstructionAsphalt
Off-Gas 0.178 0.000 0.000 0.000 0.000 0.000 0.000 0.000 0.000 0.000 0Off-Road Equipment 0.018 0.101 0.111 0.000 0.000 0.009 0.009 0.000 0.008 0.008 15On-Road Equipment 0.013 0.054 0.120 0.001 0.003 0.004 0.007 0.001 0.004 0.005 81
Worker Trips 0.000 0.004 0.000 0.000 0.000 0.000 0.000 0.000 0.000 0.000 1Building
Off-Road Equipment 0.095 0.567 0.544 0.000 0.000 0.026 0.026 0.000 0.024 0.024 105Vendor Trips 0.089 0.942 0.742 0.006 0.023 0.033 0.056 0.008 0.030 0.037 641Worker Trips 0.030 1.237 0.056 0.004 0.020 0.011 0.031 0.007 0.009 0.016 403
CoatingArchitectural Coating 6.944 0.000 0.000 0.000 0.000 0.000 0.000 0.000 0.000 0.000 0
Worker Trips 0.001 0.028 0.001 0.000 0.000 0.000 0.001 0.000 0.000 0.000 92021 Total 1 7.367 2.934 1.573 0.011 0.046 0.083 0.129 0.016 0.074 0.090 1,256
Notes:
Construction Emissions (Final Mitigated)
ROG CO NOx SOx PM10 Dust PM10 Exhaust PM10 2 PM2.5 Dust PM2.5 Exhaust PM2.5
2 CO2
2021 ConstructionAsphalt
Off-Gas 0.178 0.000 0.000 0.000 0.000 0.000 0.000 0.000 0.000 0.000 0Off-Road Equipment 3 0.006 0.101 0.012 0.000 0.000 0.001 0.001 0.000 0.001 0.001 15
On-Road Equipment 0.013 0.054 0.120 0.001 0.003 0.004 0.007 0.001 0.004 0.005 81Worker Trips 0.000 0.004 0.000 0.000 0.000 0.000 0.000 0.000 0.000 0.000 1
BuildingOff-Road Equipment 3 0.034 0.567 0.060 0.000 0.000 0.003 0.003 0.000 0.002 0.002 105
Vendor Trips 0.089 0.942 0.742 0.006 0.023 0.033 0.056 0.008 0.030 0.037 641Worker Trips 0.030 1.237 0.056 0.004 0.020 0.011 0.031 0.007 0.009 0.016 403
CoatingArchitectural Coating 6.944 0.000 0.000 0.000 0.000 0.000 0.000 0.000 0.000 0.000 0
Worker Trips 0.001 0.028 0.001 0.000 0.000 0.000 0.001 0.000 0.000 0.000 92021 Total 4, 5 7.295 2.934 0.992 0.011 0.046 0.052 0.098 0.016 0.046 0.062 1,256
Notes:1. Emissions calculated in URBEMIS2007 using the General Heavy Industry land use category.2. PM10 and PM2.5 emissions were taken as the sum of the PM_Exhaust and PM_Dust emissions.3. The off-road construction equipment mitigation was applied externally to the URBEMIS2007 results and was only applied for exhaust-related emissions for ROG, NOx, and PM.4. Results include paving, building construction, and architectural coatings. Worker and vendor trips are also included using the default settings of URBEMIS2007.5. Mitigation applied includes architectural coatings control, discussed in the previous table, and using off-road construction equipment that meets Tier 4 standards.
Construction Phase
Emissions (tpy) 1
This tab provides the emissions resulting from paving, building construction, and architectural coating activities for the HMF. Assumptions are documented in the Data Request ('Maintenance' tab).
1. Mitigation for architectural coatings were mitigated by using low-VOC architectural coatings; the mitigation measure was applied using URBEMIS2007; the results are called "mitigated" in the URBEMIS2007 output.
Construction Phase
Emissions (tpy) 1
Construction Phase
Emissions (tpy)
1. Emissions calculated in URBEMIS2007 using the General Heavy Industry land use category. The programmatic emissions reduction measures were not applicable to the modeled construction phases; the results are called "unmitigated" in the URBEMIS2007 output.
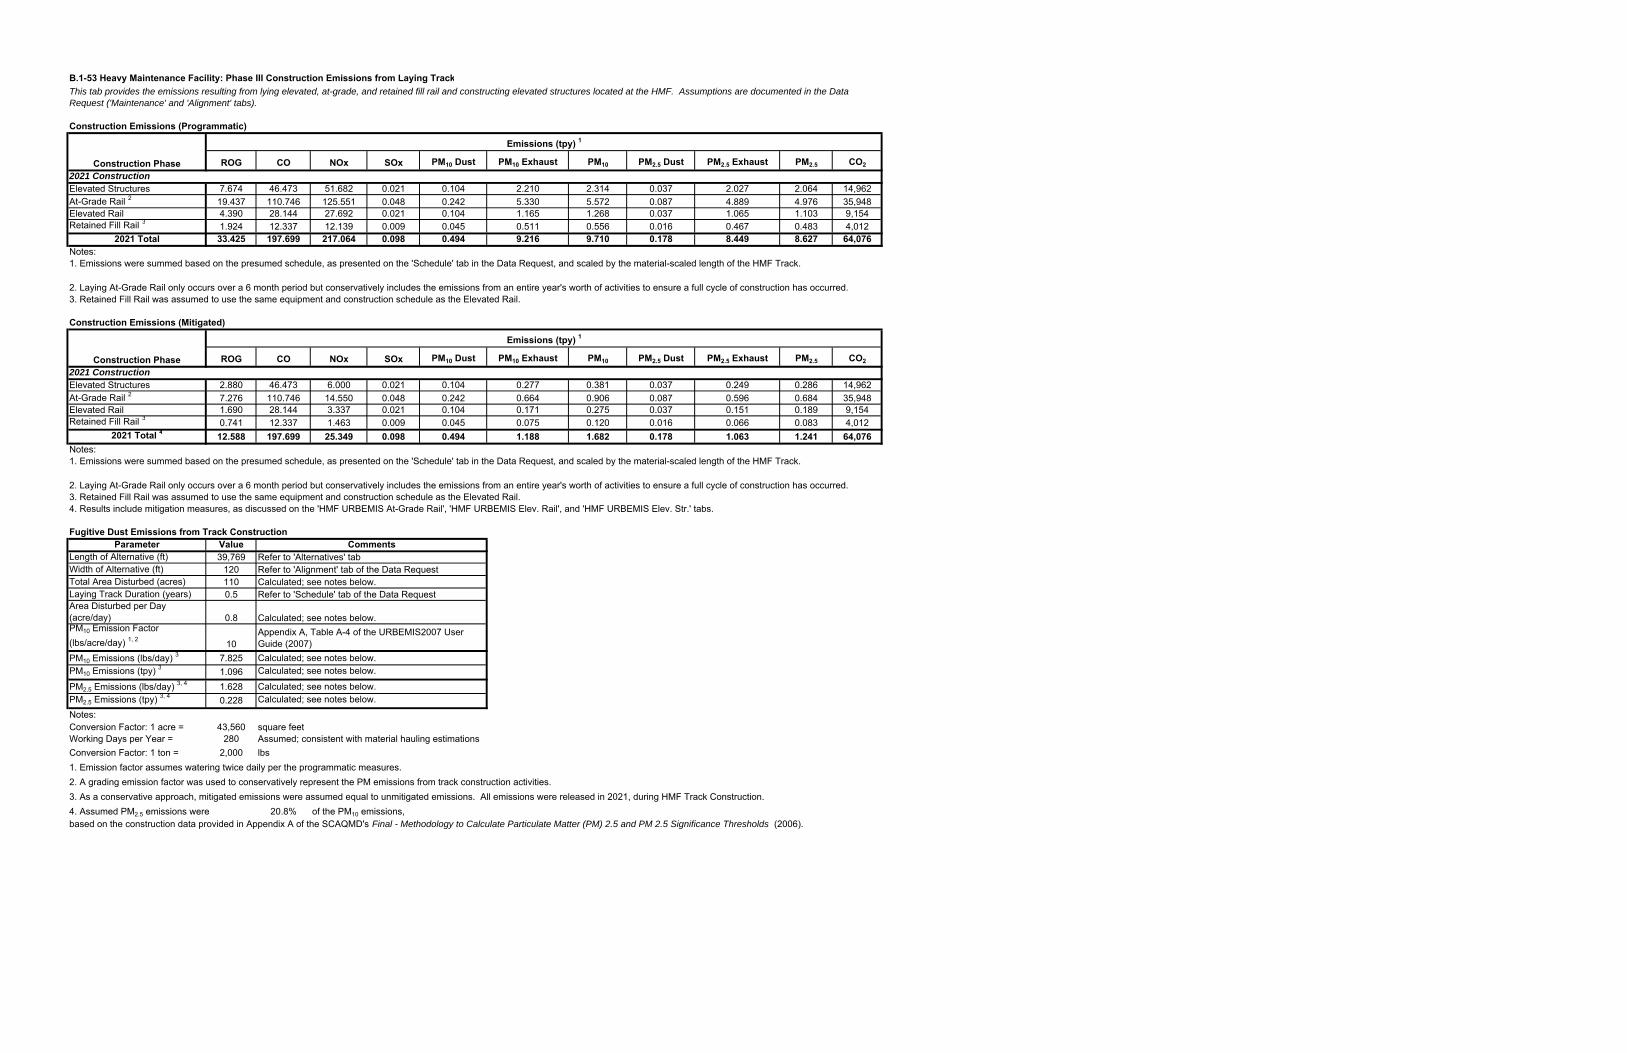
B.1-53 Heavy Maintenance Facility: Phase III Construction Emissions from Laying Track
Construction Emissions (Programmatic)
ROG CO NOx SOx PM10 Dust PM10 Exhaust PM10 PM2.5 Dust PM2.5 Exhaust PM2.5 CO2
2021 ConstructionElevated Structures 7.674 46.473 51.682 0.021 0.104 2.210 2.314 0.037 2.027 2.064 14,962At-Grade Rail 2 19.437 110.746 125.551 0.048 0.242 5.330 5.572 0.087 4.889 4.976 35,948Elevated Rail 4.390 28.144 27.692 0.021 0.104 1.165 1.268 0.037 1.065 1.103 9,154Retained Fill Rail 3 1.924 12.337 12.139 0.009 0.045 0.511 0.556 0.016 0.467 0.483 4,012
2021 Total 33.425 197.699 217.064 0.098 0.494 9.216 9.710 0.178 8.449 8.627 64,076Notes:1. Emissions were summed based on the presumed schedule, as presented on the 'Schedule' tab in the Data Request, and scaled by the material-scaled length of the HMF Track.
3. Retained Fill Rail was assumed to use the same equipment and construction schedule as the Elevated Rail.
Construction Emissions (Mitigated)
ROG CO NOx SOx PM10 Dust PM10 Exhaust PM10 PM2.5 Dust PM2.5 Exhaust PM2.5 CO2
2021 ConstructionElevated Structures 2.880 46.473 6.000 0.021 0.104 0.277 0.381 0.037 0.249 0.286 14,962At-Grade Rail 2 7.276 110.746 14.550 0.048 0.242 0.664 0.906 0.087 0.596 0.684 35,948Elevated Rail 1.690 28.144 3.337 0.021 0.104 0.171 0.275 0.037 0.151 0.189 9,154Retained Fill Rail 3 0.741 12.337 1.463 0.009 0.045 0.075 0.120 0.016 0.066 0.083 4,012
2021 Total 4 12.588 197.699 25.349 0.098 0.494 1.188 1.682 0.178 1.063 1.241 64,076Notes:1. Emissions were summed based on the presumed schedule, as presented on the 'Schedule' tab in the Data Request, and scaled by the material-scaled length of the HMF Track.
3. Retained Fill Rail was assumed to use the same equipment and construction schedule as the Elevated Rail.4. Results include mitigation measures, as discussed on the 'HMF URBEMIS At-Grade Rail', 'HMF URBEMIS Elev. Rail', and 'HMF URBEMIS Elev. Str.' tabs.
Fugitive Dust Emissions from Track ConstructionParameter Value
Length of Alternative (ft) 39,769Width of Alternative (ft) 120Total Area Disturbed (acres) 110Laying Track Duration (years) 0.5Area Disturbed per Day (acre/day) 0.8PM10 Emission Factor (lbs/acre/day) 1, 2 10PM10 Emissions (lbs/day) 3 7.825PM10 Emissions (tpy) 3 1.096PM2.5 Emissions (lbs/day) 3, 4 1.628PM2.5 Emissions (tpy) 3, 4 0.228Notes:Conversion Factor: 1 acre = 43,560 square feetWorking Days per Year = 280 Assumed; consistent with material hauling estimationsConversion Factor: 1 ton = 2,000 lbs1. Emission factor assumes watering twice daily per the programmatic measures.2. A grading emission factor was used to conservatively represent the PM emissions from track construction activities.3. As a conservative approach, mitigated emissions were assumed equal to unmitigated emissions. All emissions were released in 2021, during HMF Track Construction.4. Assumed PM2.5 emissions were 20.8% of the PM10 emissions,
Construction Phase
Emissions (tpy) 1
Construction Phase
Emissions (tpy) 1
Calculated; see notes below.
based on the construction data provided in Appendix A of the SCAQMD's Final - Methodology to Calculate Particulate Matter (PM) 2.5 and PM 2.5 Significance Thresholds (2006).
Refer to 'Alignment' tab of the Data RequestCalculated; see notes below.Refer to 'Schedule' tab of the Data Request
Calculated; see notes below.Appendix A, Table A-4 of the URBEMIS2007 User Guide (2007)
This tab provides the emissions resulting from lying elevated, at-grade, and retained fill rail and constructing elevated structures located at the HMF. Assumptions are documented in the Data Request ('Maintenance' and 'Alignment' tabs).
Calculated; see notes below.Calculated; see notes below.
Calculated; see notes below.
2. Laying At-Grade Rail only occurs over a 6 month period but conservatively includes the emissions from an entire year's worth of activities to ensure a full cycle of construction has occurred.
2. Laying At-Grade Rail only occurs over a 6 month period but conservatively includes the emissions from an entire year's worth of activities to ensure a full cycle of construction has occurred.
CommentsRefer to 'Alternatives' tab
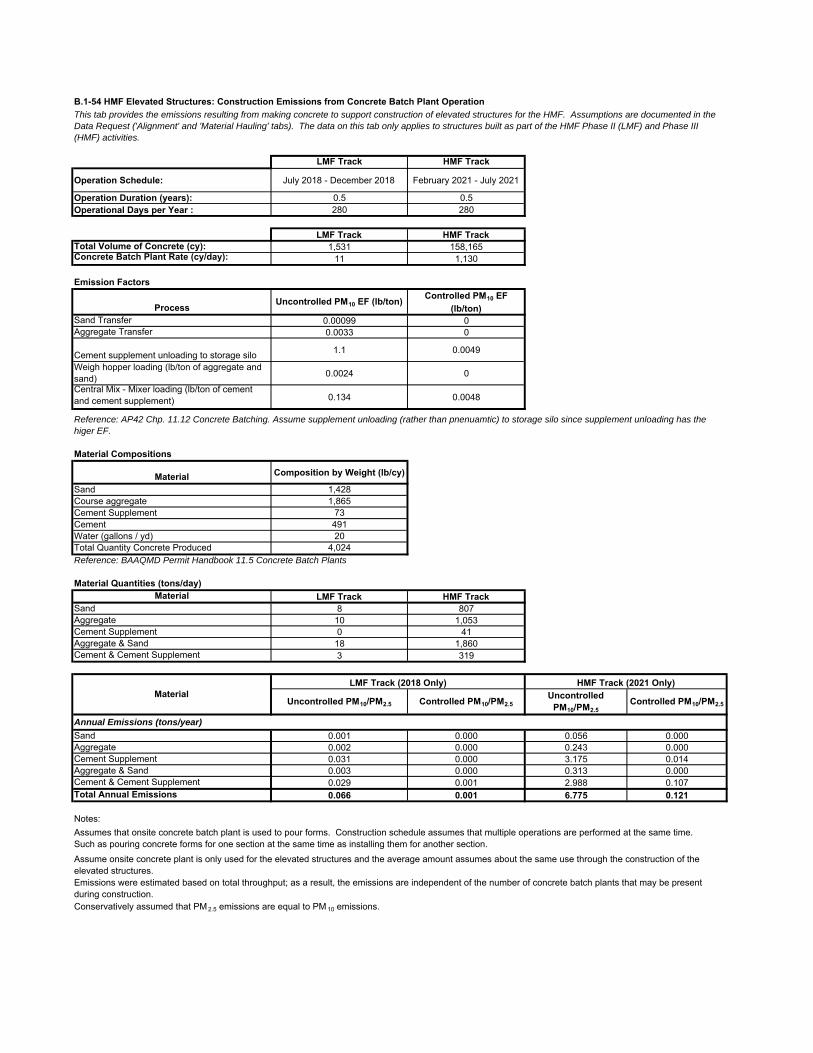
B.1-54 HMF Elevated Structures: Construction Emissions from Concrete Batch Plant Operation
LMF Track HMF Track
Operation Schedule: July 2018 - December 2018 February 2021 - July 2021
Operation Duration (years): 0.5 0.5Operational Days per Year : 280 280
LMF Track HMF TrackTotal Volume of Concrete (cy): 1,531 158,165Concrete Batch Plant Rate (cy/day): 11 1,130
Emission Factors
Process Uncontrolled PM10 EF (lb/ton) Controlled PM10 EF (lb/ton)
Sand Transfer 0.00099 0Aggregate Transfer 0.0033 0
Cement supplement unloading to storage silo 1.1 0.0049
Weigh hopper loading (lb/ton of aggregate and sand) 0.0024 0
Central Mix - Mixer loading (lb/ton of cement and cement supplement) 0.134 0.0048
Material Compositions
Material Composition by Weight (lb/cy)
Sand 1,428Course aggregate 1,865Cement Supplement 73Cement 491Water (gallons / yd) 20Total Quantity Concrete Produced 4,024Reference: BAAQMD Permit Handbook 11.5 Concrete Batch Plants
Material Quantities (tons/day)Material LMF Track HMF Track
Sand 8 807Aggregate 10 1,053Cement Supplement 0 41Aggregate & Sand 18 1,860Cement & Cement Supplement 3 319
Uncontrolled PM10/PM2.5 Controlled PM10/PM2.5Uncontrolled
PM10/PM2.5Controlled PM10/PM2.5
Annual Emissions (tons/year)
Sand 0.001 0.000 0.056 0.000Aggregate 0.002 0.000 0.243 0.000Cement Supplement 0.031 0.000 3.175 0.014Aggregate & Sand 0.003 0.000 0.313 0.000Cement & Cement Supplement 0.029 0.001 2.988 0.107Total Annual Emissions 0.066 0.001 6.775 0.121
Notes:
Conservatively assumed that PM 2.5 emissions are equal to PM 10 emissions.
Emissions were estimated based on total throughput; as a result, the emissions are independent of the number of concrete batch plants that may be present during construction.
This tab provides the emissions resulting from making concrete to support construction of elevated structures for the HMF. Assumptions are documented in the Data Request ('Alignment' and 'Material Hauling' tabs). The data on this tab only applies to structures built as part of the HMF Phase II (LMF) and Phase III (HMF) activities.
Reference: AP42 Chp. 11.12 Concrete Batching. Assume supplement unloading (rather than pnenuamtic) to storage silo since supplement unloading has the higer EF.
Assumes that onsite concrete batch plant is used to pour forms. Construction schedule assumes that multiple operations are performed at the same time. Such as pouring concrete forms for one section at the same time as installing them for another section.Assume onsite concrete plant is only used for the elevated structures and the average amount assumes about the same use through the construction of the elevated structures.
MaterialLMF Track (2018 Only) HMF Track (2021 Only)
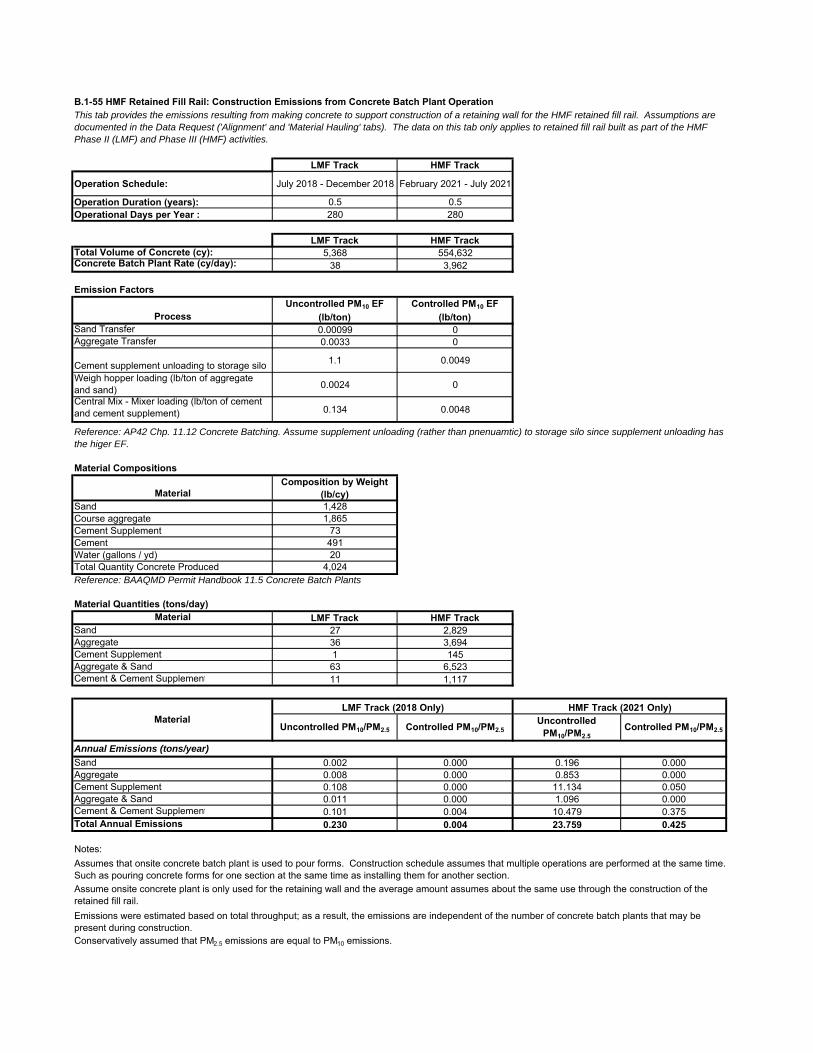
B.1-55 HMF Retained Fill Rail: Construction Emissions from Concrete Batch Plant Operation
LMF Track HMF Track
Operation Schedule: July 2018 - December 2018 February 2021 - July 2021
Operation Duration (years): 0.5 0.5Operational Days per Year : 280 280
LMF Track HMF TrackTotal Volume of Concrete (cy): 5,368 554,632Concrete Batch Plant Rate (cy/day): 38 3,962
Emission Factors
ProcessUncontrolled PM10 EF
(lb/ton)Controlled PM10 EF
(lb/ton)Sand Transfer 0.00099 0Aggregate Transfer 0.0033 0
Cement supplement unloading to storage silo 1.1 0.0049
Weigh hopper loading (lb/ton of aggregate and sand) 0.0024 0
Central Mix - Mixer loading (lb/ton of cement and cement supplement) 0.134 0.0048
Material Compositions
MaterialComposition by Weight
(lb/cy)Sand 1,428Course aggregate 1,865Cement Supplement 73Cement 491Water (gallons / yd) 20Total Quantity Concrete Produced 4,024Reference: BAAQMD Permit Handbook 11.5 Concrete Batch Plants
Material Quantities (tons/day)Material LMF Track HMF Track
Sand 27 2,829Aggregate 36 3,694Cement Supplement 1 145Aggregate & Sand 63 6,523Cement & Cement Supplement 11 1,117
Uncontrolled PM10/PM2.5 Controlled PM10/PM2.5Uncontrolled
PM10/PM2.5Controlled PM10/PM2.5
Annual Emissions (tons/year)
Sand 0.002 0.000 0.196 0.000Aggregate 0.008 0.000 0.853 0.000Cement Supplement 0.108 0.000 11.134 0.050Aggregate & Sand 0.011 0.000 1.096 0.000Cement & Cement Supplement 0.101 0.004 10.479 0.375Total Annual Emissions 0.230 0.004 23.759 0.425
Notes:
Conservatively assumed that PM2.5 emissions are equal to PM10 emissions.
This tab provides the emissions resulting from making concrete to support construction of a retaining wall for the HMF retained fill rail. Assumptions are documented in the Data Request ('Alignment' and 'Material Hauling' tabs). The data on this tab only applies to retained fill rail built as part of the HMF Phase II (LMF) and Phase III (HMF) activities.
Reference: AP42 Chp. 11.12 Concrete Batching. Assume supplement unloading (rather than pnenuamtic) to storage silo since supplement unloading has the higer EF.
Assumes that onsite concrete batch plant is used to pour forms. Construction schedule assumes that multiple operations are performed at the same time. Such as pouring concrete forms for one section at the same time as installing them for another section.Assume onsite concrete plant is only used for the retaining wall and the average amount assumes about the same use through the construction of the retained fill rail.Emissions were estimated based on total throughput; as a result, the emissions are independent of the number of concrete batch plants that may be present during construction.
MaterialLMF Track (2018 Only) HMF Track (2021 Only)
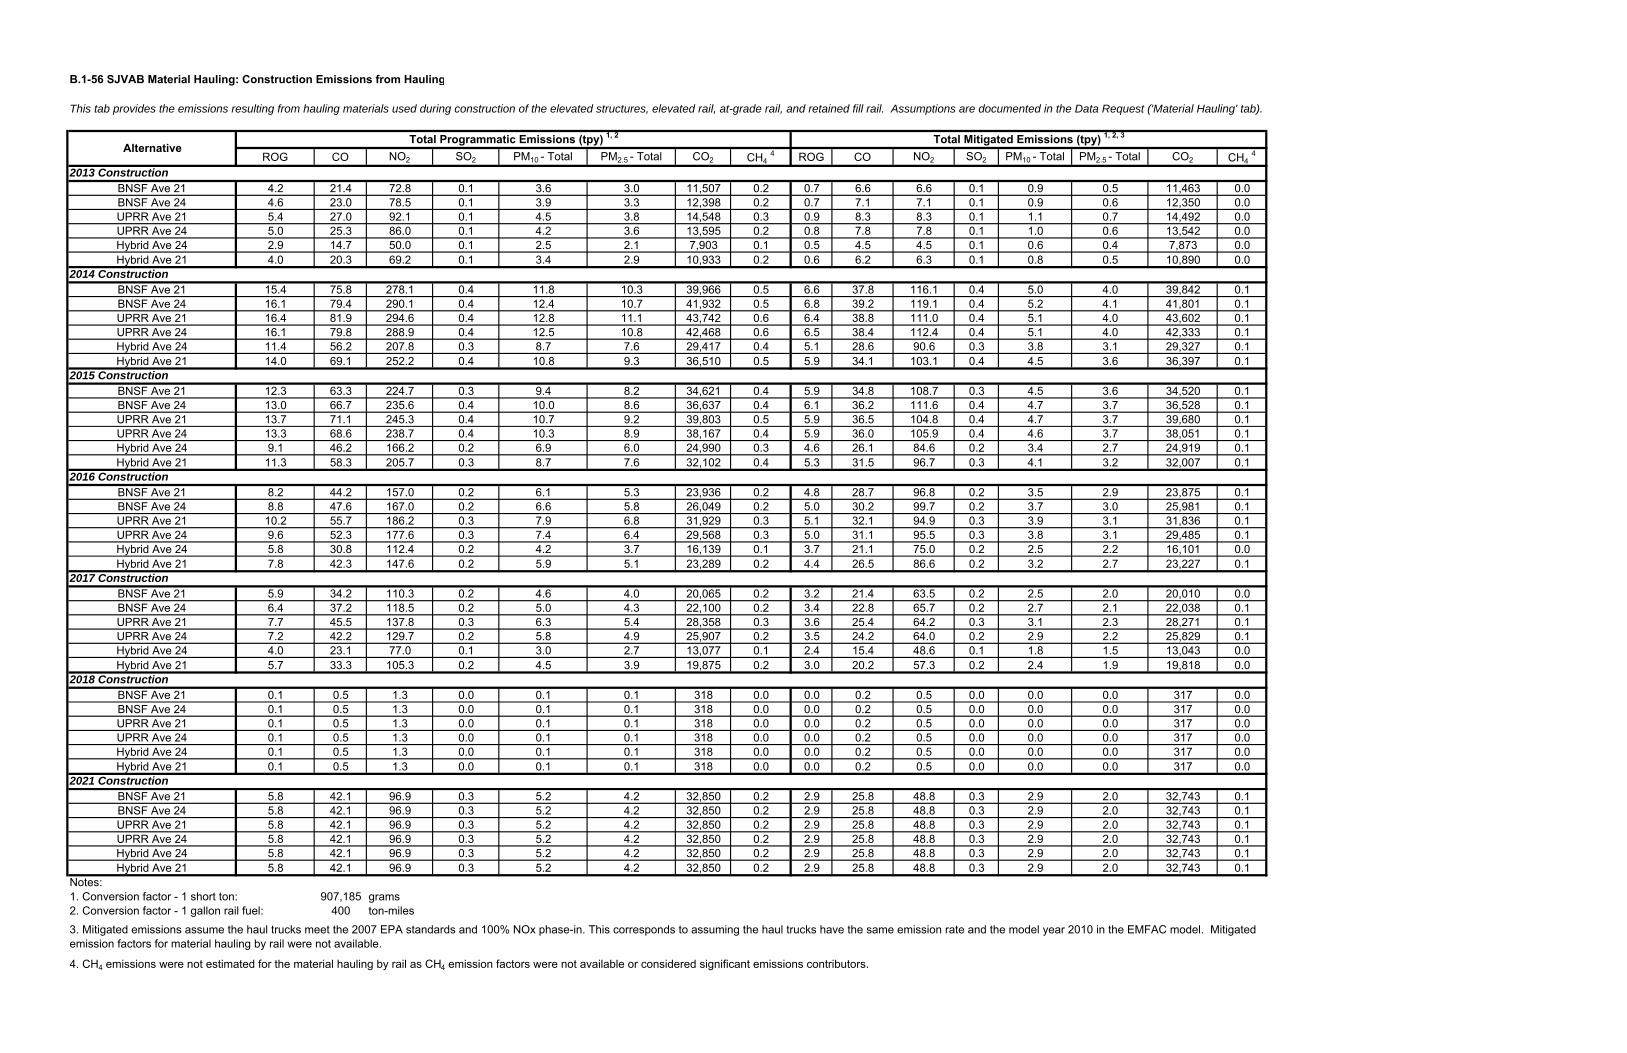
B.1-56 SJVAB Material Hauling: Construction Emissions from Hauling
ROG CO NO2 SO2 PM10 - Total PM2.5 - Total CO2 CH4 4 ROG CO NO2 SO2 PM10 - Total PM2.5 - Total CO2 CH4
4
2013 ConstructionBNSF Ave 21 4.2 21.4 72.8 0.1 3.6 3.0 11,507 0.2 0.7 6.6 6.6 0.1 0.9 0.5 11,463 0.0BNSF Ave 24 4.6 23.0 78.5 0.1 3.9 3.3 12,398 0.2 0.7 7.1 7.1 0.1 0.9 0.6 12,350 0.0UPRR Ave 21 5.4 27.0 92.1 0.1 4.5 3.8 14,548 0.3 0.9 8.3 8.3 0.1 1.1 0.7 14,492 0.0UPRR Ave 24 5.0 25.3 86.0 0.1 4.2 3.6 13,595 0.2 0.8 7.8 7.8 0.1 1.0 0.6 13,542 0.0Hybrid Ave 24 2.9 14.7 50.0 0.1 2.5 2.1 7,903 0.1 0.5 4.5 4.5 0.1 0.6 0.4 7,873 0.0Hybrid Ave 21 4.0 20.3 69.2 0.1 3.4 2.9 10,933 0.2 0.6 6.2 6.3 0.1 0.8 0.5 10,890 0.0
2014 ConstructionBNSF Ave 21 15.4 75.8 278.1 0.4 11.8 10.3 39,966 0.5 6.6 37.8 116.1 0.4 5.0 4.0 39,842 0.1BNSF Ave 24 16.1 79.4 290.1 0.4 12.4 10.7 41,932 0.5 6.8 39.2 119.1 0.4 5.2 4.1 41,801 0.1UPRR Ave 21 16.4 81.9 294.6 0.4 12.8 11.1 43,742 0.6 6.4 38.8 111.0 0.4 5.1 4.0 43,602 0.1UPRR Ave 24 16.1 79.8 288.9 0.4 12.5 10.8 42,468 0.6 6.5 38.4 112.4 0.4 5.1 4.0 42,333 0.1Hybrid Ave 24 11.4 56.2 207.8 0.3 8.7 7.6 29,417 0.4 5.1 28.6 90.6 0.3 3.8 3.1 29,327 0.1Hybrid Ave 21 14.0 69.1 252.2 0.4 10.8 9.3 36,510 0.5 5.9 34.1 103.1 0.4 4.5 3.6 36,397 0.1
2015 ConstructionBNSF Ave 21 12.3 63.3 224.7 0.3 9.4 8.2 34,621 0.4 5.9 34.8 108.7 0.3 4.5 3.6 34,520 0.1BNSF Ave 24 13.0 66.7 235.6 0.4 10.0 8.6 36,637 0.4 6.1 36.2 111.6 0.4 4.7 3.7 36,528 0.1UPRR Ave 21 13.7 71.1 245.3 0.4 10.7 9.2 39,803 0.5 5.9 36.5 104.8 0.4 4.7 3.7 39,680 0.1UPRR Ave 24 13.3 68.6 238.7 0.4 10.3 8.9 38,167 0.4 5.9 36.0 105.9 0.4 4.6 3.7 38,051 0.1Hybrid Ave 24 9.1 46.2 166.2 0.2 6.9 6.0 24,990 0.3 4.6 26.1 84.6 0.2 3.4 2.7 24,919 0.1Hybrid Ave 21 11.3 58.3 205.7 0.3 8.7 7.6 32,102 0.4 5.3 31.5 96.7 0.3 4.1 3.2 32,007 0.1
2016 ConstructionBNSF Ave 21 8.2 44.2 157.0 0.2 6.1 5.3 23,936 0.2 4.8 28.7 96.8 0.2 3.5 2.9 23,875 0.1BNSF Ave 24 8.8 47.6 167.0 0.2 6.6 5.8 26,049 0.2 5.0 30.2 99.7 0.2 3.7 3.0 25,981 0.1UPRR Ave 21 10.2 55.7 186.2 0.3 7.9 6.8 31,929 0.3 5.1 32.1 94.9 0.3 3.9 3.1 31,836 0.1UPRR Ave 24 9.6 52.3 177.6 0.3 7.4 6.4 29,568 0.3 5.0 31.1 95.5 0.3 3.8 3.1 29,485 0.1Hybrid Ave 24 5.8 30.8 112.4 0.2 4.2 3.7 16,139 0.1 3.7 21.1 75.0 0.2 2.5 2.2 16,101 0.0Hybrid Ave 21 7.8 42.3 147.6 0.2 5.9 5.1 23,289 0.2 4.4 26.5 86.6 0.2 3.2 2.7 23,227 0.1
2017 ConstructionBNSF Ave 21 5.9 34.2 110.3 0.2 4.6 4.0 20,065 0.2 3.2 21.4 63.5 0.2 2.5 2.0 20,010 0.0BNSF Ave 24 6.4 37.2 118.5 0.2 5.0 4.3 22,100 0.2 3.4 22.8 65.7 0.2 2.7 2.1 22,038 0.1UPRR Ave 21 7.7 45.5 137.8 0.3 6.3 5.4 28,358 0.3 3.6 25.4 64.2 0.3 3.1 2.3 28,271 0.1UPRR Ave 24 7.2 42.2 129.7 0.2 5.8 4.9 25,907 0.2 3.5 24.2 64.0 0.2 2.9 2.2 25,829 0.1Hybrid Ave 24 4.0 23.1 77.0 0.1 3.0 2.7 13,077 0.1 2.4 15.4 48.6 0.1 1.8 1.5 13,043 0.0Hybrid Ave 21 5.7 33.3 105.3 0.2 4.5 3.9 19,875 0.2 3.0 20.2 57.3 0.2 2.4 1.9 19,818 0.0
2018 ConstructionBNSF Ave 21 0.1 0.5 1.3 0.0 0.1 0.1 318 0.0 0.0 0.2 0.5 0.0 0.0 0.0 317 0.0BNSF Ave 24 0.1 0.5 1.3 0.0 0.1 0.1 318 0.0 0.0 0.2 0.5 0.0 0.0 0.0 317 0.0UPRR Ave 21 0.1 0.5 1.3 0.0 0.1 0.1 318 0.0 0.0 0.2 0.5 0.0 0.0 0.0 317 0.0UPRR Ave 24 0.1 0.5 1.3 0.0 0.1 0.1 318 0.0 0.0 0.2 0.5 0.0 0.0 0.0 317 0.0Hybrid Ave 24 0.1 0.5 1.3 0.0 0.1 0.1 318 0.0 0.0 0.2 0.5 0.0 0.0 0.0 317 0.0Hybrid Ave 21 0.1 0.5 1.3 0.0 0.1 0.1 318 0.0 0.0 0.2 0.5 0.0 0.0 0.0 317 0.0
2021 ConstructionBNSF Ave 21 5.8 42.1 96.9 0.3 5.2 4.2 32,850 0.2 2.9 25.8 48.8 0.3 2.9 2.0 32,743 0.1BNSF Ave 24 5.8 42.1 96.9 0.3 5.2 4.2 32,850 0.2 2.9 25.8 48.8 0.3 2.9 2.0 32,743 0.1UPRR Ave 21 5.8 42.1 96.9 0.3 5.2 4.2 32,850 0.2 2.9 25.8 48.8 0.3 2.9 2.0 32,743 0.1UPRR Ave 24 5.8 42.1 96.9 0.3 5.2 4.2 32,850 0.2 2.9 25.8 48.8 0.3 2.9 2.0 32,743 0.1Hybrid Ave 24 5.8 42.1 96.9 0.3 5.2 4.2 32,850 0.2 2.9 25.8 48.8 0.3 2.9 2.0 32,743 0.1Hybrid Ave 21 5.8 42.1 96.9 0.3 5.2 4.2 32,850 0.2 2.9 25.8 48.8 0.3 2.9 2.0 32,743 0.1
Notes:1. Conversion factor - 1 short ton: 907,185 grams2. Conversion factor - 1 gallon rail fuel: 400 ton-miles
4. CH4 emissions were not estimated for the material hauling by rail as CH4 emission factors were not available or considered significant emissions contributors.
This tab provides the emissions resulting from hauling materials used during construction of the elevated structures, elevated rail, at-grade rail, and retained fill rail. Assumptions are documented in the Data Request ('Material Hauling' tab).
3. Mitigated emissions assume the haul trucks meet the 2007 EPA standards and 100% NOx phase-in. This corresponds to assuming the haul trucks have the same emission rate and the model year 2010 in the EMFAC model. Mitigated emission factors for material hauling by rail were not available.
Total Mitigated Emissions (tpy) 1, 2, 3
AlternativeTotal Programmatic Emissions (tpy) 1, 2
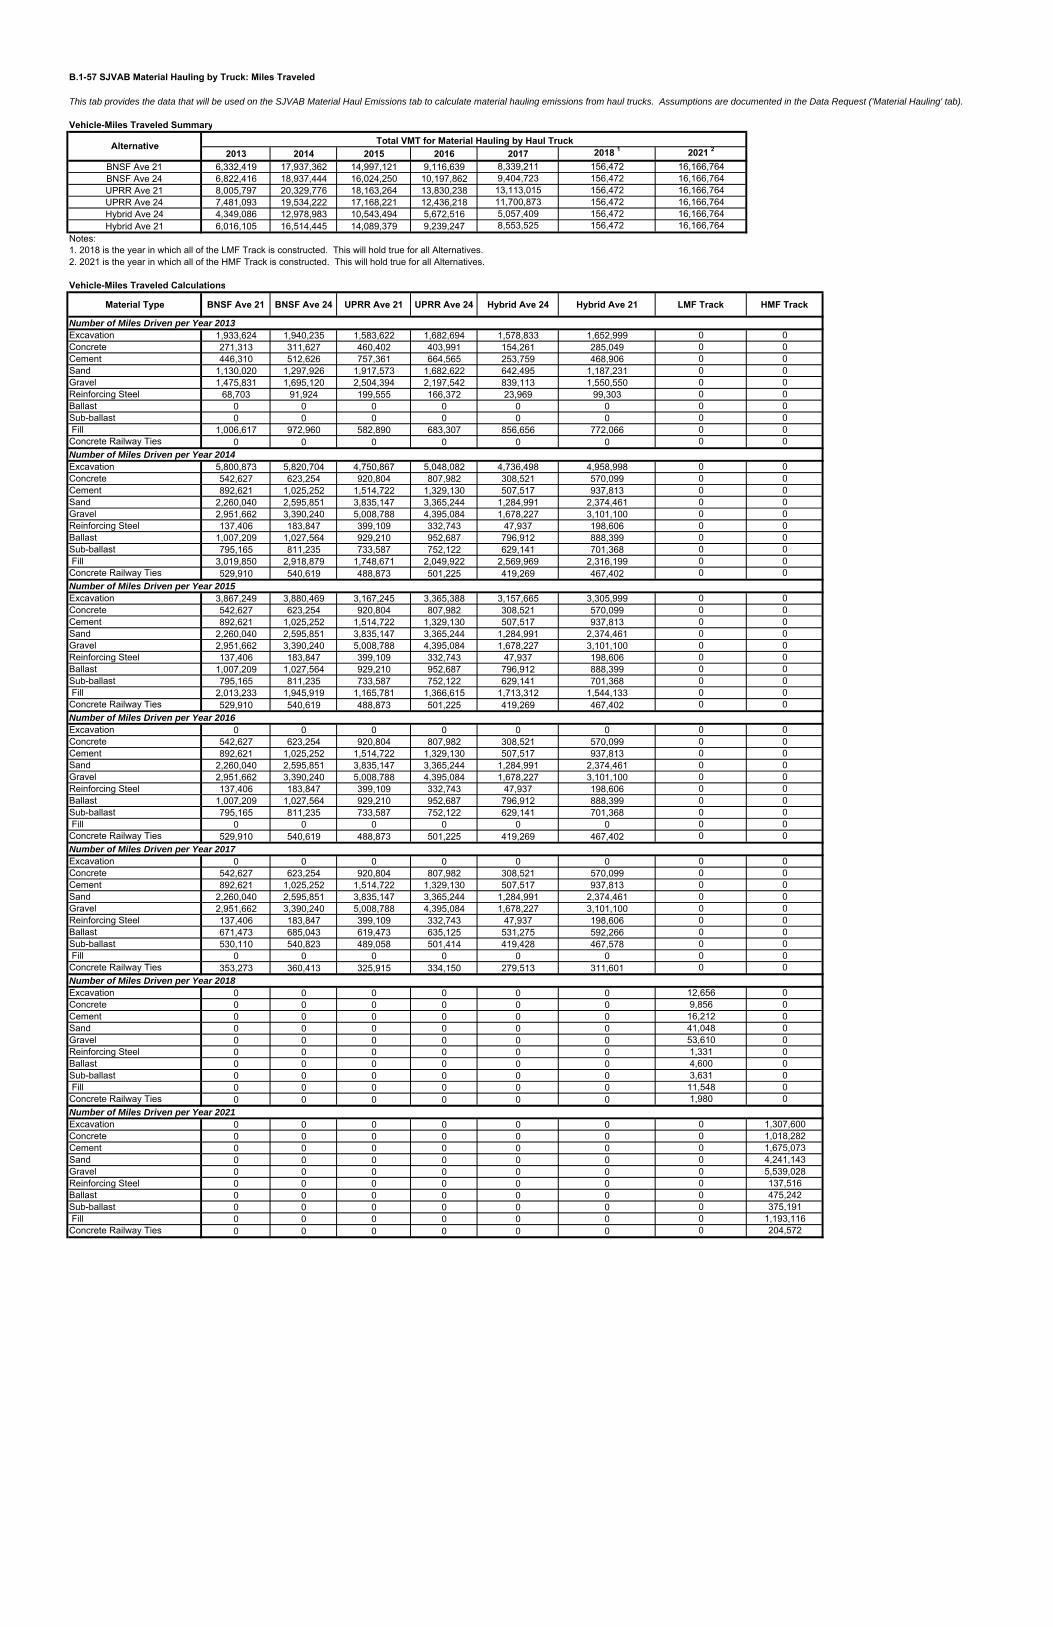
B.1-57 SJVAB Material Hauling by Truck: Miles Traveled
Vehicle-Miles Traveled Summary
2013 2014 2015 2016 2017 2018 1 2021 2
BNSF Ave 21 6,332,419 17,937,362 14,997,121 9,116,639 8,339,211 156,472 16,166,764BNSF Ave 24 6,822,416 18,937,444 16,024,250 10,197,862 9,404,723 156,472 16,166,764UPRR Ave 21 8,005,797 20,329,776 18,163,264 13,830,238 13,113,015 156,472 16,166,764UPRR Ave 24 7,481,093 19,534,222 17,168,221 12,436,218 11,700,873 156,472 16,166,764Hybrid Ave 24 4,349,086 12,978,983 10,543,494 5,672,516 5,057,409 156,472 16,166,764Hybrid Ave 21 6,016,105 16,514,445 14,089,379 9,239,247 8,553,525 156,472 16,166,764
Notes:1. 2018 is the year in which all of the LMF Track is constructed. This will hold true for all Alternatives.2. 2021 is the year in which all of the HMF Track is constructed. This will hold true for all Alternatives.
Vehicle-Miles Traveled Calculations
Material Type BNSF Ave 21 BNSF Ave 24 UPRR Ave 21 UPRR Ave 24 Hybrid Ave 24 Hybrid Ave 21 LMF Track HMF Track
Number of Miles Driven per Year 2013Excavation 1,933,624 1,940,235 1,583,622 1,682,694 1,578,833 1,652,999 0 0Concrete 271,313 311,627 460,402 403,991 154,261 285,049 0 0Cement 446,310 512,626 757,361 664,565 253,759 468,906 0 0Sand 1,130,020 1,297,926 1,917,573 1,682,622 642,495 1,187,231 0 0Gravel 1,475,831 1,695,120 2,504,394 2,197,542 839,113 1,550,550 0 0Reinforcing Steel 68,703 91,924 199,555 166,372 23,969 99,303 0 0Ballast 0 0 0 0 0 0 0 0Sub-ballast 0 0 0 0 0 0 0 0 Fill 1,006,617 972,960 582,890 683,307 856,656 772,066 0 0Concrete Railway Ties 0 0 0 0 0 0 0 0Number of Miles Driven per Year 2014Excavation 5,800,873 5,820,704 4,750,867 5,048,082 4,736,498 4,958,998 0 0Concrete 542,627 623,254 920,804 807,982 308,521 570,099 0 0Cement 892,621 1,025,252 1,514,722 1,329,130 507,517 937,813 0 0Sand 2,260,040 2,595,851 3,835,147 3,365,244 1,284,991 2,374,461 0 0Gravel 2,951,662 3,390,240 5,008,788 4,395,084 1,678,227 3,101,100 0 0Reinforcing Steel 137,406 183,847 399,109 332,743 47,937 198,606 0 0Ballast 1,007,209 1,027,564 929,210 952,687 796,912 888,399 0 0Sub-ballast 795,165 811,235 733,587 752,122 629,141 701,368 0 0 Fill 3,019,850 2,918,879 1,748,671 2,049,922 2,569,969 2,316,199 0 0Concrete Railway Ties 529,910 540,619 488,873 501,225 419,269 467,402 0 0Number of Miles Driven per Year 2015Excavation 3,867,249 3,880,469 3,167,245 3,365,388 3,157,665 3,305,999 0 0Concrete 542,627 623,254 920,804 807,982 308,521 570,099 0 0Cement 892,621 1,025,252 1,514,722 1,329,130 507,517 937,813 0 0Sand 2,260,040 2,595,851 3,835,147 3,365,244 1,284,991 2,374,461 0 0Gravel 2,951,662 3,390,240 5,008,788 4,395,084 1,678,227 3,101,100 0 0Reinforcing Steel 137,406 183,847 399,109 332,743 47,937 198,606 0 0Ballast 1,007,209 1,027,564 929,210 952,687 796,912 888,399 0 0Sub-ballast 795,165 811,235 733,587 752,122 629,141 701,368 0 0 Fill 2,013,233 1,945,919 1,165,781 1,366,615 1,713,312 1,544,133 0 0Concrete Railway Ties 529,910 540,619 488,873 501,225 419,269 467,402 0 0Number of Miles Driven per Year 2016Excavation 0 0 0 0 0 0 0 0Concrete 542,627 623,254 920,804 807,982 308,521 570,099 0 0Cement 892,621 1,025,252 1,514,722 1,329,130 507,517 937,813 0 0Sand 2,260,040 2,595,851 3,835,147 3,365,244 1,284,991 2,374,461 0 0Gravel 2,951,662 3,390,240 5,008,788 4,395,084 1,678,227 3,101,100 0 0Reinforcing Steel 137,406 183,847 399,109 332,743 47,937 198,606 0 0Ballast 1,007,209 1,027,564 929,210 952,687 796,912 888,399 0 0Sub-ballast 795,165 811,235 733,587 752,122 629,141 701,368 0 0 Fill 0 0 0 0 0 0 0 0Concrete Railway Ties 529,910 540,619 488,873 501,225 419,269 467,402 0 0Number of Miles Driven per Year 2017Excavation 0 0 0 0 0 0 0 0Concrete 542,627 623,254 920,804 807,982 308,521 570,099 0 0Cement 892,621 1,025,252 1,514,722 1,329,130 507,517 937,813 0 0Sand 2,260,040 2,595,851 3,835,147 3,365,244 1,284,991 2,374,461 0 0Gravel 2,951,662 3,390,240 5,008,788 4,395,084 1,678,227 3,101,100 0 0Reinforcing Steel 137,406 183,847 399,109 332,743 47,937 198,606 0 0Ballast 671,473 685,043 619,473 635,125 531,275 592,266 0 0Sub-ballast 530,110 540,823 489,058 501,414 419,428 467,578 0 0 Fill 0 0 0 0 0 0 0 0Concrete Railway Ties 353,273 360,413 325,915 334,150 279,513 311,601 0 0Number of Miles Driven per Year 2018Excavation 0 0 0 0 0 0 12,656 0Concrete 0 0 0 0 0 0 9,856 0Cement 0 0 0 0 0 0 16,212 0Sand 0 0 0 0 0 0 41,048 0Gravel 0 0 0 0 0 0 53,610 0Reinforcing Steel 0 0 0 0 0 0 1,331 0Ballast 0 0 0 0 0 0 4,600 0Sub-ballast 0 0 0 0 0 0 3,631 0 Fill 0 0 0 0 0 0 11,548 0Concrete Railway Ties 0 0 0 0 0 0 1,980 0Number of Miles Driven per Year 2021Excavation 0 0 0 0 0 0 0 1,307,600Concrete 0 0 0 0 0 0 0 1,018,282Cement 0 0 0 0 0 0 0 1,675,073Sand 0 0 0 0 0 0 0 4,241,143Gravel 0 0 0 0 0 0 0 5,539,028Reinforcing Steel 0 0 0 0 0 0 0 137,516Ballast 0 0 0 0 0 0 0 475,242Sub-ballast 0 0 0 0 0 0 0 375,191 Fill 0 0 0 0 0 0 0 1,193,116Concrete Railway Ties 0 0 0 0 0 0 0 204,572
Total VMT for Material Hauling by Haul TruckAlternative
This tab provides the data that will be used on the SJVAB Material Haul Emissions tab to calculate material hauling emissions from haul trucks. Assumptions are documented in the Data Request ('Material Hauling' tab).
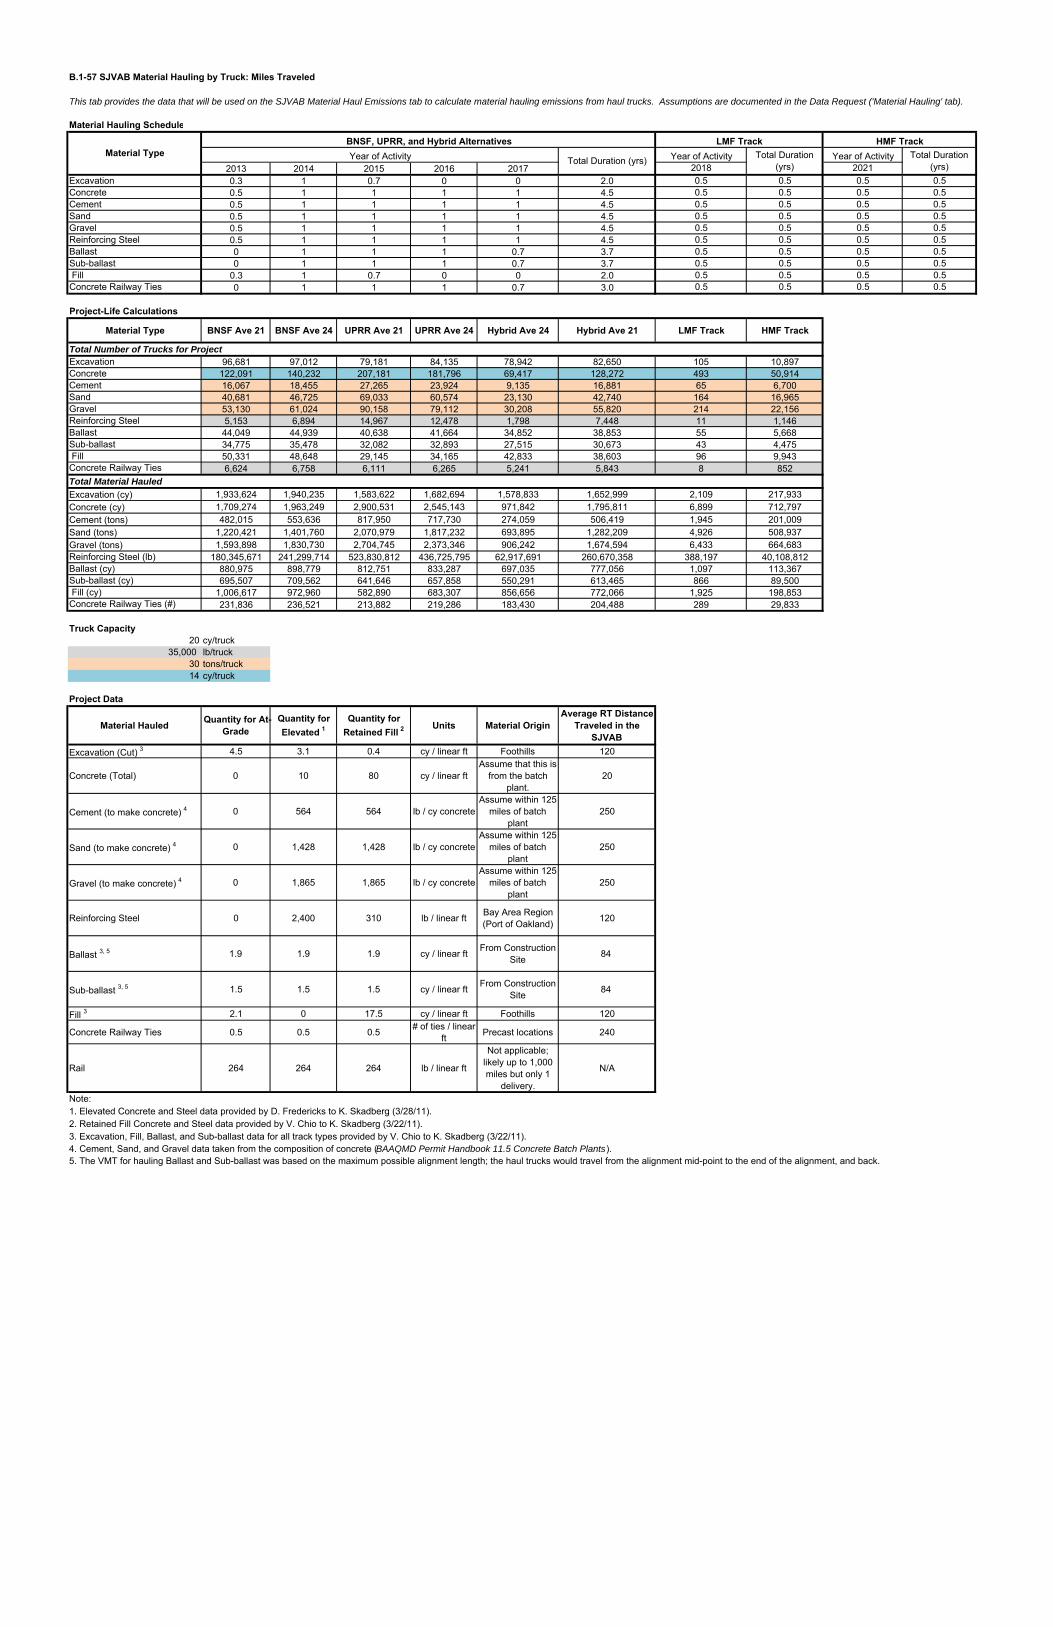
B.1-57 SJVAB Material Hauling by Truck: Miles Traveled
This tab provides the data that will be used on the SJVAB Material Haul Emissions tab to calculate material hauling emissions from haul trucks. Assumptions are documented in the Data Request ('Material Hauling' tab).
Material Hauling Schedule
Year of Activity Year of Activity2013 2014 2015 2016 2017 2018 2021
Excavation 0.3 1 0.7 0 0 2.0 0.5 0.5 0.5 0.5Concrete 0.5 1 1 1 1 4.5 0.5 0.5 0.5 0.5Cement 0.5 1 1 1 1 4.5 0.5 0.5 0.5 0.5Sand 0.5 1 1 1 1 4.5 0.5 0.5 0.5 0.5Gravel 0.5 1 1 1 1 4.5 0.5 0.5 0.5 0.5Reinforcing Steel 0.5 1 1 1 1 4.5 0.5 0.5 0.5 0.5Ballast 0 1 1 1 0.7 3.7 0.5 0.5 0.5 0.5Sub-ballast 0 1 1 1 0.7 3.7 0.5 0.5 0.5 0.5 Fill 0.3 1 0.7 0 0 2.0 0.5 0.5 0.5 0.5Concrete Railway Ties 0 1 1 1 0.7 3.0 0.5 0.5 0.5 0.5
Project-Life Calculations
Material Type BNSF Ave 21 BNSF Ave 24 UPRR Ave 21 UPRR Ave 24 Hybrid Ave 24 Hybrid Ave 21 LMF Track HMF Track
Total Number of Trucks for ProjectExcavation 96,681 97,012 79,181 84,135 78,942 82,650 105 10,897Concrete 122,091 140,232 207,181 181,796 69,417 128,272 493 50,914Cement 16,067 18,455 27,265 23,924 9,135 16,881 65 6,700Sand 40,681 46,725 69,033 60,574 23,130 42,740 164 16,965Gravel 53,130 61,024 90,158 79,112 30,208 55,820 214 22,156Reinforcing Steel 5,153 6,894 14,967 12,478 1,798 7,448 11 1,146Ballast 44,049 44,939 40,638 41,664 34,852 38,853 55 5,668Sub-ballast 34,775 35,478 32,082 32,893 27,515 30,673 43 4,475 Fill 50,331 48,648 29,145 34,165 42,833 38,603 96 9,943Concrete Railway Ties 6,624 6,758 6,111 6,265 5,241 5,843 8 852Total Material Hauled
Excavation (cy) 1,933,624 1,940,235 1,583,622 1,682,694 1,578,833 1,652,999 2,109 217,933Concrete (cy) 1,709,274 1,963,249 2,900,531 2,545,143 971,842 1,795,811 6,899 712,797Cement (tons) 482,015 553,636 817,950 717,730 274,059 506,419 1,945 201,009Sand (tons) 1,220,421 1,401,760 2,070,979 1,817,232 693,895 1,282,209 4,926 508,937Gravel (tons) 1,593,898 1,830,730 2,704,745 2,373,346 906,242 1,674,594 6,433 664,683Reinforcing Steel (lb) 180,345,671 241,299,714 523,830,812 436,725,795 62,917,691 260,670,358 388,197 40,108,812Ballast (cy) 880,975 898,779 812,751 833,287 697,035 777,056 1,097 113,367Sub-ballast (cy) 695,507 709,562 641,646 657,858 550,291 613,465 866 89,500 Fill (cy) 1,006,617 972,960 582,890 683,307 856,656 772,066 1,925 198,853Concrete Railway Ties (#) 231,836 236,521 213,882 219,286 183,430 204,488 289 29,833
Truck Capacity20 cy/truck
35,000 lb/truck30 tons/truck14 cy/truck
Material Hauled Quantity for At-Grade
Quantity for Elevated 1
Quantity for Retained Fill 2
Units Material OriginAverage RT Distance
Traveled in the SJVAB
Excavation (Cut) 3 4.5 3.1 0.4 cy / linear ft Foothills 120
Concrete (Total) 0 10 80 cy / linear ft Assume that this is
from the batch plant.
20
Cement (to make concrete) 4 0 564 564 lb / cy concreteAssume within 125
miles of batch plant
250
Sand (to make concrete) 4 0 1,428 1,428 lb / cy concreteAssume within 125
miles of batch plant
250
Gravel (to make concrete) 4 0 1,865 1,865 lb / cy concreteAssume within 125
miles of batch plant
250
Reinforcing Steel 0 2,400 310 lb / linear ft Bay Area Region (Port of Oakland) 120
Ballast 3, 5 1.9 1.9 1.9 cy / linear ft From Construction Site 84
Sub-ballast 3, 5 1.5 1.5 1.5 cy / linear ft From Construction Site 84
Fill 3 2.1 0 17.5 cy / linear ft Foothills 120
Concrete Railway Ties 0.5 0.5 0.5 # of ties / linear ft Precast locations 240
Rail 264 264 264 lb / linear ft
Not applicable; likely up to 1,000 miles but only 1
delivery.
N/A
Note:1. Elevated Concrete and Steel data provided by D. Fredericks to K. Skadberg (3/28/11).2. Retained Fill Concrete and Steel data provided by V. Chio to K. Skadberg (3/22/11).3. Excavation, Fill, Ballast, and Sub-ballast data for all track types provided by V. Chio to K. Skadberg (3/22/11).4. Cement, Sand, and Gravel data taken from the composition of concrete (BAAQMD Permit Handbook 11.5 Concrete Batch Plants).5. The VMT for hauling Ballast and Sub-ballast was based on the maximum possible alignment length; the haul trucks would travel from the alignment mid-point to the end of the alignment, and back.
Project Data
Total Duration (yrs) Total Duration (yrs)
Year of ActivityBNSF, UPRR, and Hybrid Alternatives LMF Track
Total Duration (yrs)
HMF TrackMaterial Type
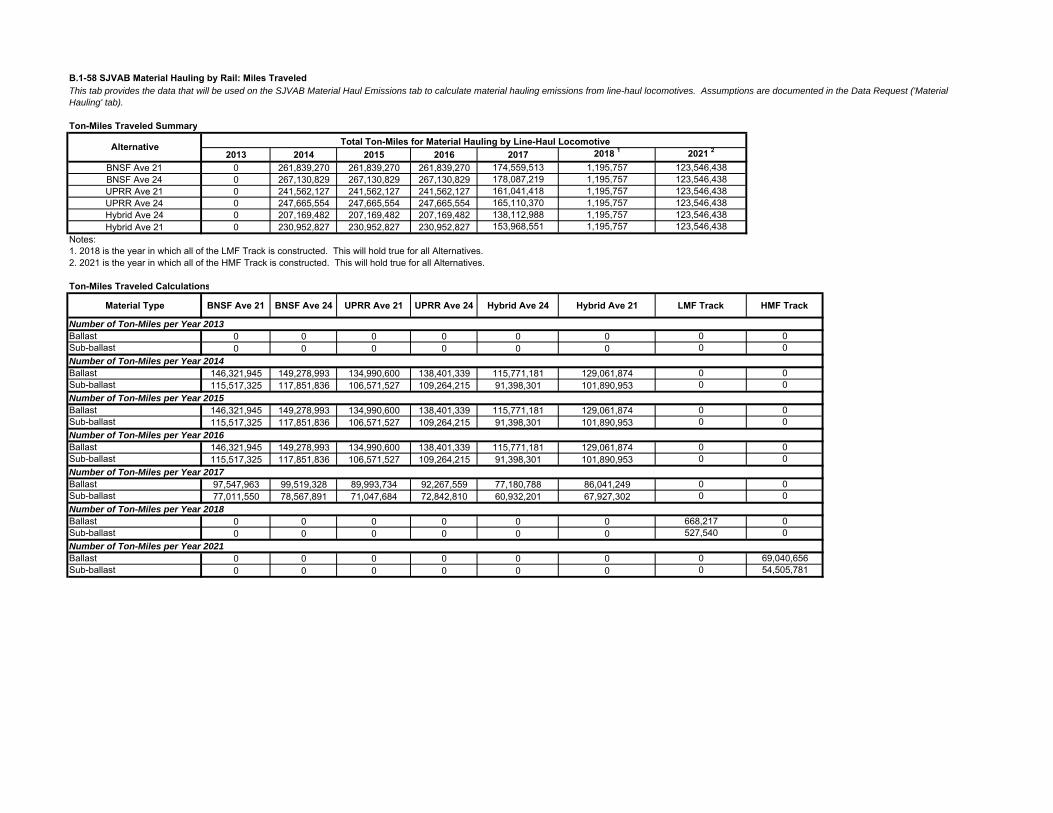
B.1-58 SJVAB Material Hauling by Rail: Miles Traveled
Ton-Miles Traveled Summary
2013 2014 2015 2016 2017 2018 1 2021 2
BNSF Ave 21 0 261,839,270 261,839,270 261,839,270 174,559,513 1,195,757 123,546,438BNSF Ave 24 0 267,130,829 267,130,829 267,130,829 178,087,219 1,195,757 123,546,438UPRR Ave 21 0 241,562,127 241,562,127 241,562,127 161,041,418 1,195,757 123,546,438UPRR Ave 24 0 247,665,554 247,665,554 247,665,554 165,110,370 1,195,757 123,546,438Hybrid Ave 24 0 207,169,482 207,169,482 207,169,482 138,112,988 1,195,757 123,546,438Hybrid Ave 21 0 230,952,827 230,952,827 230,952,827 153,968,551 1,195,757 123,546,438
Notes:1. 2018 is the year in which all of the LMF Track is constructed. This will hold true for all Alternatives.2. 2021 is the year in which all of the HMF Track is constructed. This will hold true for all Alternatives.
Ton-Miles Traveled Calculations
Material Type BNSF Ave 21 BNSF Ave 24 UPRR Ave 21 UPRR Ave 24 Hybrid Ave 24 Hybrid Ave 21 LMF Track HMF Track
Number of Ton-Miles per Year 2013Ballast 0 0 0 0 0 0 0 0Sub-ballast 0 0 0 0 0 0 0 0Number of Ton-Miles per Year 2014Ballast 146,321,945 149,278,993 134,990,600 138,401,339 115,771,181 129,061,874 0 0Sub-ballast 115,517,325 117,851,836 106,571,527 109,264,215 91,398,301 101,890,953 0 0Number of Ton-Miles per Year 2015Ballast 146,321,945 149,278,993 134,990,600 138,401,339 115,771,181 129,061,874 0 0Sub-ballast 115,517,325 117,851,836 106,571,527 109,264,215 91,398,301 101,890,953 0 0Number of Ton-Miles per Year 2016Ballast 146,321,945 149,278,993 134,990,600 138,401,339 115,771,181 129,061,874 0 0Sub-ballast 115,517,325 117,851,836 106,571,527 109,264,215 91,398,301 101,890,953 0 0Number of Ton-Miles per Year 2017Ballast 97,547,963 99,519,328 89,993,734 92,267,559 77,180,788 86,041,249 0 0Sub-ballast 77,011,550 78,567,891 71,047,684 72,842,810 60,932,201 67,927,302 0 0Number of Ton-Miles per Year 2018Ballast 0 0 0 0 0 0 668,217 0Sub-ballast 0 0 0 0 0 0 527,540 0Number of Ton-Miles per Year 2021Ballast 0 0 0 0 0 0 0 69,040,656Sub-ballast 0 0 0 0 0 0 0 54,505,781
This tab provides the data that will be used on the SJVAB Material Haul Emissions tab to calculate material hauling emissions from line-haul locomotives. Assumptions are documented in the Data Request ('Material Hauling' tab).
Alternative Total Ton-Miles for Material Hauling by Line-Haul Locomotive
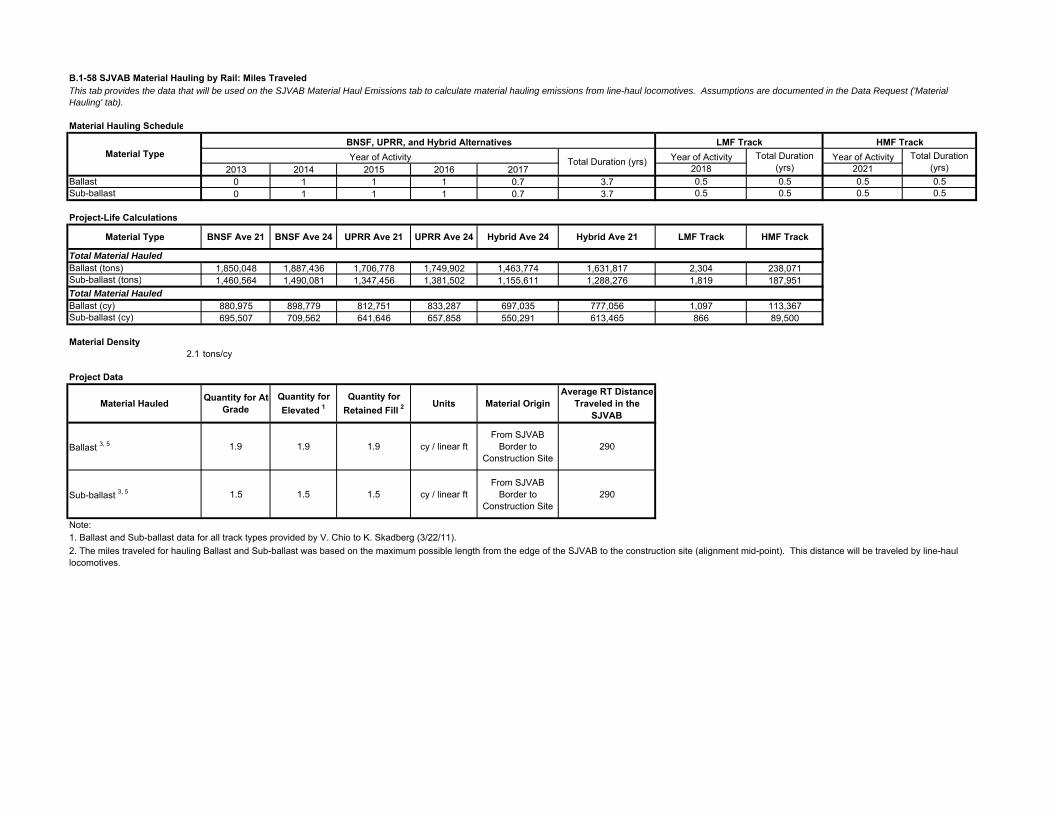
B.1-58 SJVAB Material Hauling by Rail: Miles TraveledThis tab provides the data that will be used on the SJVAB Material Haul Emissions tab to calculate material hauling emissions from line-haul locomotives. Assumptions are documented in the Data Request ('Material Hauling' tab).
Material Hauling Schedule
Year of Activity Year of Activity2013 2014 2015 2016 2017 2018 2021
Ballast 0 1 1 1 0.7 3.7 0.5 0.5 0.5 0.5Sub-ballast 0 1 1 1 0.7 3.7 0.5 0.5 0.5 0.5
Project-Life Calculations
Material Type BNSF Ave 21 BNSF Ave 24 UPRR Ave 21 UPRR Ave 24 Hybrid Ave 24 Hybrid Ave 21 LMF Track HMF Track
Total Material HauledBallast (tons) 1,850,048 1,887,436 1,706,778 1,749,902 1,463,774 1,631,817 2,304 238,071Sub-ballast (tons) 1,460,564 1,490,081 1,347,456 1,381,502 1,155,611 1,288,276 1,819 187,951Total Material HauledBallast (cy) 880,975 898,779 812,751 833,287 697,035 777,056 1,097 113,367Sub-ballast (cy) 695,507 709,562 641,646 657,858 550,291 613,465 866 89,500
Material Density2.1 tons/cy
Material Hauled Quantity for At-Grade
Quantity for Elevated 1
Quantity for Retained Fill 2
Units Material OriginAverage RT Distance
Traveled in the SJVAB
Ballast 3, 5 1.9 1.9 1.9 cy / linear ftFrom SJVAB
Border to Construction Site
290
Sub-ballast 3, 5 1.5 1.5 1.5 cy / linear ftFrom SJVAB
Border to Construction Site
290
Note:1. Ballast and Sub-ballast data for all track types provided by V. Chio to K. Skadberg (3/22/11).
Total Duration (yrs)
Project Data
2. The miles traveled for hauling Ballast and Sub-ballast was based on the maximum possible length from the edge of the SJVAB to the construction site (alignment mid-point). This distance will be traveled by line-haul locomotives.
Material TypeBNSF, UPRR, and Hybrid Alternatives LMF Track HMF TrackYear of Activity Total Duration (yrs) Total Duration
(yrs)
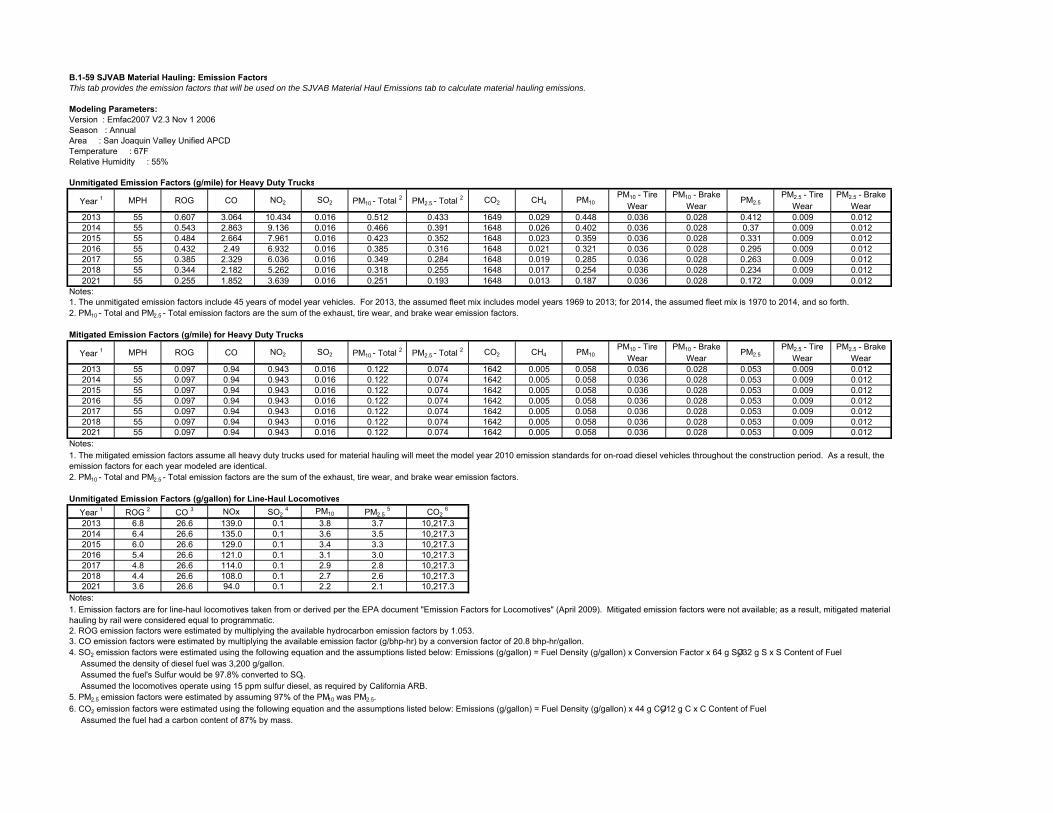
B.1-59 SJVAB Material Hauling: Emission FactorsThis tab provides the emission factors that will be used on the SJVAB Material Haul Emissions tab to calculate material hauling emissions.
Modeling Parameters:Version : Emfac2007 V2.3 Nov 1 2006Season : AnnualArea : San Joaquin Valley Unified APCDTemperature : 67FRelative Humidity : 55%
Unmitigated Emission Factors (g/mile) for Heavy Duty Trucks
Year 1 MPH ROG CO NO2 SO2 PM10 - Total 2 PM2.5 - Total 2 CO2 CH4 PM10PM10 - Tire
WearPM10 - Brake
WearPM2.5
PM2.5 - Tire Wear
PM2.5 - Brake Wear
2013 55 0.607 3.064 10.434 0.016 0.512 0.433 1649 0.029 0.448 0.036 0.028 0.412 0.009 0.0122014 55 0.543 2.863 9.136 0.016 0.466 0.391 1648 0.026 0.402 0.036 0.028 0.37 0.009 0.0122015 55 0.484 2.664 7.961 0.016 0.423 0.352 1648 0.023 0.359 0.036 0.028 0.331 0.009 0.0122016 55 0.432 2.49 6.932 0.016 0.385 0.316 1648 0.021 0.321 0.036 0.028 0.295 0.009 0.0122017 55 0.385 2.329 6.036 0.016 0.349 0.284 1648 0.019 0.285 0.036 0.028 0.263 0.009 0.0122018 55 0.344 2.182 5.262 0.016 0.318 0.255 1648 0.017 0.254 0.036 0.028 0.234 0.009 0.0122021 55 0.255 1.852 3.639 0.016 0.251 0.193 1648 0.013 0.187 0.036 0.028 0.172 0.009 0.012
Notes:1. The unmitigated emission factors include 45 years of model year vehicles. For 2013, the assumed fleet mix includes model years 1969 to 2013; for 2014, the assumed fleet mix is 1970 to 2014, and so forth.2. PM10 - Total and PM2.5 - Total emission factors are the sum of the exhaust, tire wear, and brake wear emission factors.
Mitigated Emission Factors (g/mile) for Heavy Duty Trucks
Year 1 MPH ROG CO NO2 SO2 PM10 - Total 2 PM2.5 - Total 2 CO2 CH4 PM10PM10 - Tire
WearPM10 - Brake
WearPM2.5
PM2.5 - Tire Wear
PM2.5 - Brake Wear
2013 55 0.097 0.94 0.943 0.016 0.122 0.074 1642 0.005 0.058 0.036 0.028 0.053 0.009 0.0122014 55 0.097 0.94 0.943 0.016 0.122 0.074 1642 0.005 0.058 0.036 0.028 0.053 0.009 0.0122015 55 0.097 0.94 0.943 0.016 0.122 0.074 1642 0.005 0.058 0.036 0.028 0.053 0.009 0.0122016 55 0.097 0.94 0.943 0.016 0.122 0.074 1642 0.005 0.058 0.036 0.028 0.053 0.009 0.0122017 55 0.097 0.94 0.943 0.016 0.122 0.074 1642 0.005 0.058 0.036 0.028 0.053 0.009 0.0122018 55 0.097 0.94 0.943 0.016 0.122 0.074 1642 0.005 0.058 0.036 0.028 0.053 0.009 0.0122021 55 0.097 0.94 0.943 0.016 0.122 0.074 1642 0.005 0.058 0.036 0.028 0.053 0.009 0.012
Notes:
2. PM10 - Total and PM2.5 - Total emission factors are the sum of the exhaust, tire wear, and brake wear emission factors.
Unmitigated Emission Factors (g/gallon) for Line-Haul LocomotivesYear 1 ROG 2 CO 3 NOx SO2
4 PM10 PM2.5 5 CO2
6
2013 6.8 26.6 139.0 0.1 3.8 3.7 10,217.32014 6.4 26.6 135.0 0.1 3.6 3.5 10,217.32015 6.0 26.6 129.0 0.1 3.4 3.3 10,217.32016 5.4 26.6 121.0 0.1 3.1 3.0 10,217.32017 4.8 26.6 114.0 0.1 2.9 2.8 10,217.32018 4.4 26.6 108.0 0.1 2.7 2.6 10,217.32021 3.6 26.6 94.0 0.1 2.2 2.1 10,217.3
Notes:
2. ROG emission factors were estimated by multiplying the available hydrocarbon emission factors by 1.053.3. CO emission factors were estimated by multiplying the available emission factor (g/bhp-hr) by a conversion factor of 20.8 bhp-hr/gallon.4. SO2 emission factors were estimated using the following equation and the assumptions listed below: Emissions (g/gallon) = Fuel Density (g/gallon) x Conversion Factor x 64 g SO2/32 g S x S Content of Fuel Assumed the density of diesel fuel was 3,200 g/gallon. Assumed the fuel's Sulfur would be 97.8% converted to SO2. Assumed the locomotives operate using 15 ppm sulfur diesel, as required by California ARB.5. PM2.5 emission factors were estimated by assuming 97% of the PM10 was PM2.5.6. CO2 emission factors were estimated using the following equation and the assumptions listed below: Emissions (g/gallon) = Fuel Density (g/gallon) x 44 g CO2/12 g C x C Content of Fuel Assumed the fuel had a carbon content of 87% by mass.
1. The mitigated emission factors assume all heavy duty trucks used for material hauling will meet the model year 2010 emission standards for on-road diesel vehicles throughout the construction period. As a result, the emission factors for each year modeled are identical.
1. Emission factors are for line-haul locomotives taken from or derived per the EPA document "Emission Factors for Locomotives" (April 2009). Mitigated emission factors were not available; as a result, mitigated material hauling by rail were considered equal to programmatic.
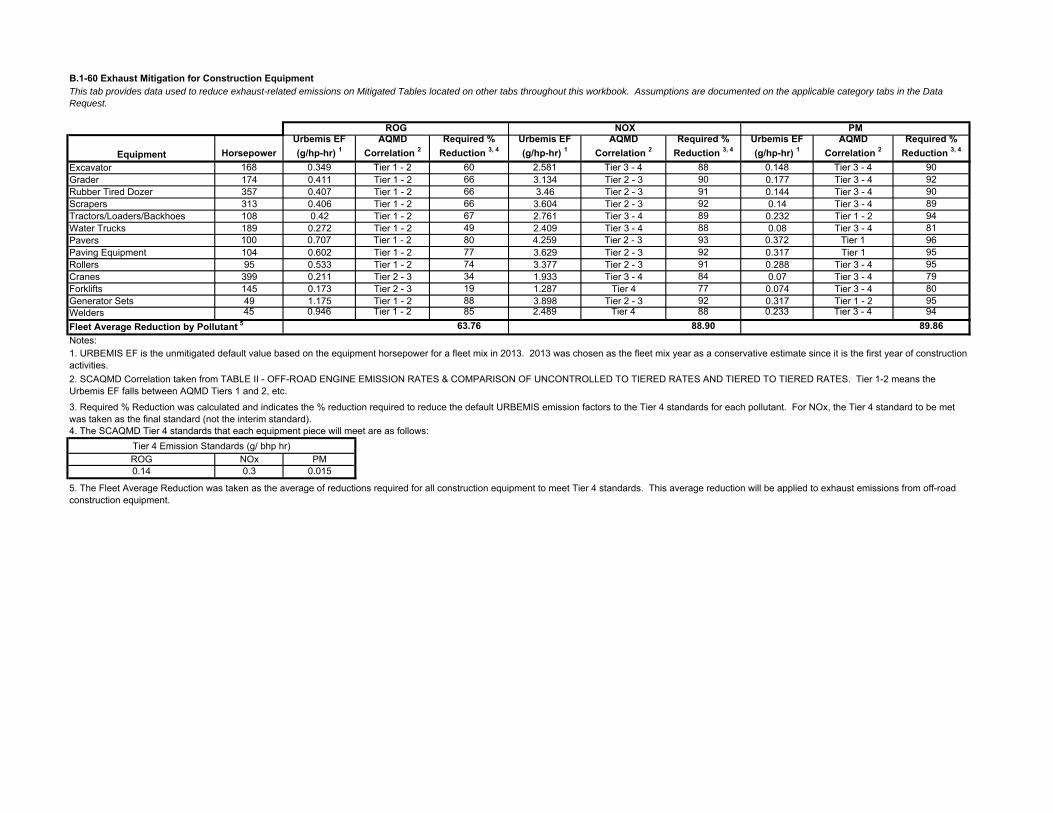
B.1-60 Exhaust Mitigation for Construction Equipment
Equipment HorsepowerUrbemis EF (g/hp-hr) 1
AQMD Correlation 2
Required % Reduction 3, 4
Urbemis EF (g/hp-hr) 1
AQMD Correlation 2
Required % Reduction 3, 4
Urbemis EF (g/hp-hr) 1
AQMD Correlation 2
Required % Reduction 3, 4
Excavator 168 0.349 Tier 1 - 2 60 2.581 Tier 3 - 4 88 0.148 Tier 3 - 4 90Grader 174 0.411 Tier 1 - 2 66 3.134 Tier 2 - 3 90 0.177 Tier 3 - 4 92Rubber Tired Dozer 357 0.407 Tier 1 - 2 66 3.46 Tier 2 - 3 91 0.144 Tier 3 - 4 90Scrapers 313 0.406 Tier 1 - 2 66 3.604 Tier 2 - 3 92 0.14 Tier 3 - 4 89Tractors/Loaders/Backhoes 108 0.42 Tier 1 - 2 67 2.761 Tier 3 - 4 89 0.232 Tier 1 - 2 94Water Trucks 189 0.272 Tier 1 - 2 49 2.409 Tier 3 - 4 88 0.08 Tier 3 - 4 81Pavers 100 0.707 Tier 1 - 2 80 4.259 Tier 2 - 3 93 0.372 Tier 1 96Paving Equipment 104 0.602 Tier 1 - 2 77 3.629 Tier 2 - 3 92 0.317 Tier 1 95Rollers 95 0.533 Tier 1 - 2 74 3.377 Tier 2 - 3 91 0.288 Tier 3 - 4 95Cranes 399 0.211 Tier 2 - 3 34 1.933 Tier 3 - 4 84 0.07 Tier 3 - 4 79Forklifts 145 0.173 Tier 2 - 3 19 1.287 Tier 4 77 0.074 Tier 3 - 4 80Generator Sets 49 1.175 Tier 1 - 2 88 3.898 Tier 2 - 3 92 0.317 Tier 1 - 2 95Welders 45 0.946 Tier 1 - 2 85 2.489 Tier 4 88 0.233 Tier 3 - 4 94
63.76 88.90 89.86Notes:
4. The SCAQMD Tier 4 standards that each equipment piece will meet are as follows:
ROG NOx PM0.14 0.3 0.015
This tab provides data used to reduce exhaust-related emissions on Mitigated Tables located on other tabs throughout this workbook. Assumptions are documented on the applicable category tabs in the Data Request.
Tier 4 Emission Standards (g/ bhp hr)
1. URBEMIS EF is the unmitigated default value based on the equipment horsepower for a fleet mix in 2013. 2013 was chosen as the fleet mix year as a conservative estimate since it is the first year of construction activities.
5. The Fleet Average Reduction was taken as the average of reductions required for all construction equipment to meet Tier 4 standards. This average reduction will be applied to exhaust emissions from off-road construction equipment.
ROG NOX PM
2. SCAQMD Correlation taken from TABLE II - OFF-ROAD ENGINE EMISSION RATES & COMPARISON OF UNCONTROLLED TO TIERED RATES AND TIERED TO TIERED RATES. Tier 1-2 means the Urbemis EF falls between AQMD Tiers 1 and 2, etc.
3. Required % Reduction was calculated and indicates the % reduction required to reduce the default URBEMIS emission factors to the Tier 4 standards for each pollutant. For NOx, the Tier 4 standard to be met was taken as the final standard (not the interim standard).
Fleet Average Reduction by Pollutant 5

B.2 URBEMIS2007 Output


B.2-1 Mobilization


Page: 12/3/2012 11:22:18 AM
ROG NOx CO SO2 PM10 Dust PM10 Exhaust PM10 PM2.5 Exhaust
CO2
0.32 3.58 1.30 0.00 0.00 0.12 0.13 0.12 473.44
0.32 3.58 1.30 0.00 0.00 0.12 0.13 0.12 473.44
0.00 0.00 0.00 0.00 0.00 0.00 0.00 0.00 0.00
Urbemis 2007 Version 9.2.4
Summary Report for Annual Emissions (Tons/Year)
File Name: Q:\P&E\ANV\ITEMS TO BE RELOCATED\CA High Speed Rail\Construction Info\Merced to Fresno\URBEMIS\Revised with Urbemis-ARB Corrected\mobilization-Site 1.urb924Project Name: Mobilization Site 1Project Location: San Joaquin Valley APCD
On-Road Vehicle Emissions Based on: Version : Emfac2007 V2.3 Nov 1 2006
Off-Road Vehicle Emissions Based on: OFFROAD2007
CONSTRUCTION EMISSION ESTIMATES
PM2.5 Dust PM2.5
2013 TOTALS (tons/year unmitigated) 0.00 0.12
2013 TOTALS (tons/year mitigated) 0.00 0.12
Percent Reduction 0.00 0.00
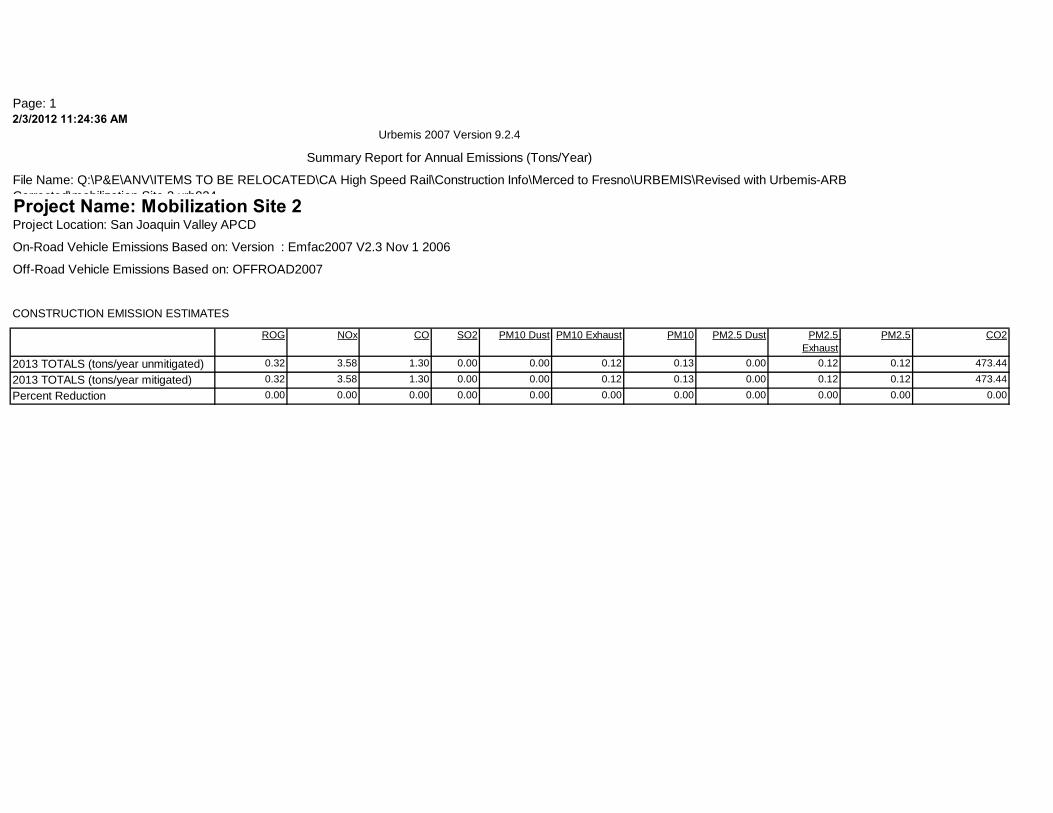
Page: 12/3/2012 11:24:36 AM
ROG NOx CO SO2 PM10 Dust PM10 Exhaust PM10 PM2.5 Exhaust
CO2
0.32 3.58 1.30 0.00 0.00 0.12 0.13 0.12 473.44
0.32 3.58 1.30 0.00 0.00 0.12 0.13 0.12 473.44
0.00 0.00 0.00 0.00 0.00 0.00 0.00 0.00 0.00
Urbemis 2007 Version 9.2.4
Summary Report for Annual Emissions (Tons/Year)
File Name: Q:\P&E\ANV\ITEMS TO BE RELOCATED\CA High Speed Rail\Construction Info\Merced to Fresno\URBEMIS\Revised with Urbemis-ARB Corrected\mobilization-Site 2.urb924Project Name: Mobilization Site 2Project Location: San Joaquin Valley APCD
On-Road Vehicle Emissions Based on: Version : Emfac2007 V2.3 Nov 1 2006
Off-Road Vehicle Emissions Based on: OFFROAD2007
CONSTRUCTION EMISSION ESTIMATES
PM2.5 Dust PM2.5
2013 TOTALS (tons/year unmitigated) 0.00 0.12
2013 TOTALS (tons/year mitigated) 0.00 0.12
Percent Reduction 0.00 0.00

B.2-2 Site Preparation


Page: 12/2/2012 01:01:07 PM
ROG NOx CO SO2 PM10 Dust PM10 Exhaust PM10 PM2.5 Exhaust
CO2
0.03 0.28 0.14 0.00 0.21 0.01 0.22 0.01 42.10
0.12 1.15 0.60 0.00 0.91 0.05 0.97 0.05 187.53
0.07 0.70 0.38 0.00 0.62 0.03 0.65 0.03 126.30
0.02 0.21 0.12 0.00 0.21 0.01 0.21 0.01 42.10
0.01 0.09 0.05 0.00 0.09 0.00 0.10 0.00 19.14
Urbemis 2007 Version 9.2.4
Summary Report for Annual Emissions (Tons/Year)
File Name: C:\Revised with Urbemis-ARB Corrected\Demolition Rev - BNSF.urb924
Project Name: Demolition - BNSFProject Location: San Joaquin Valley APCD
On-Road Vehicle Emissions Based on: Version : Emfac2007 V2.3 Nov 1 2006
Off-Road Vehicle Emissions Based on: OFFROAD2007
CONSTRUCTION EMISSION ESTIMATES
PM2.5 Dust PM2.5
2013 TOTALS (tons/year unmitigated) 0.04 0.06
2014 TOTALS (tons/year unmitigated) 0.19 0.24
2015 TOTALS (tons/year unmitigated) 0.13 0.16
2016 TOTALS (tons/year unmitigated) 0.04 0.05
2017 TOTALS (tons/year unmitigated) 0.02 0.02
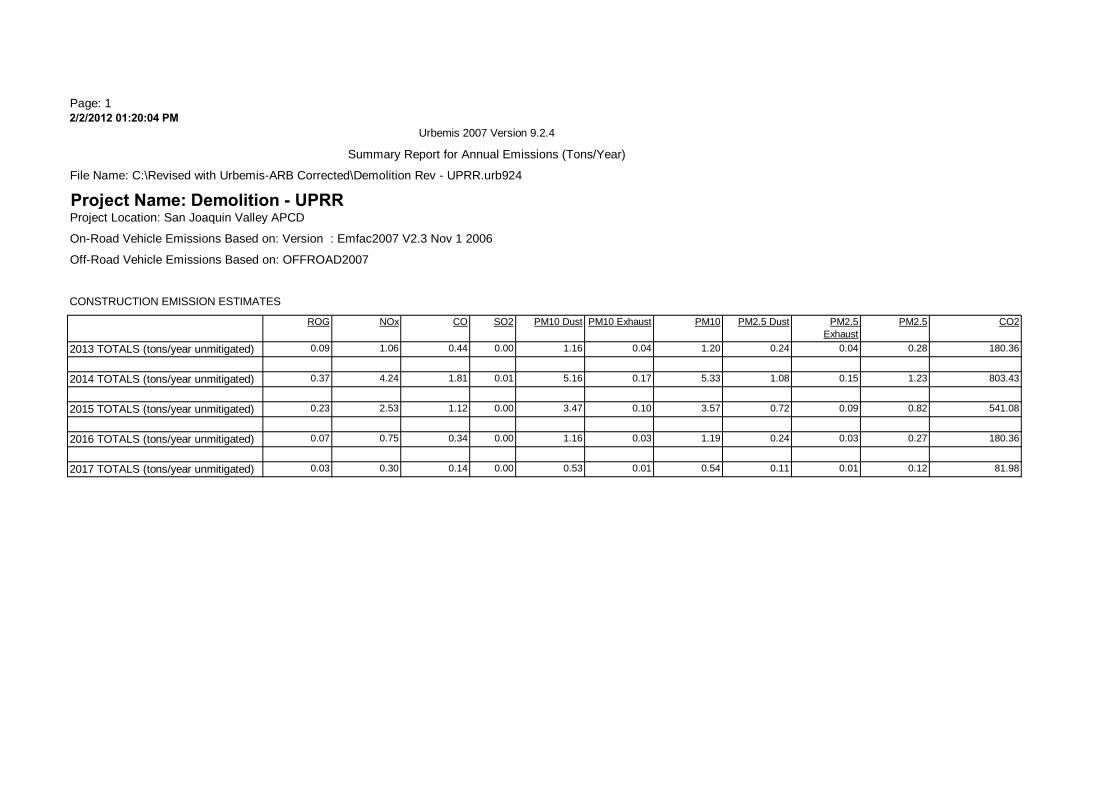
Page: 12/2/2012 01:20:04 PM
ROG NOx CO SO2 PM10 Dust PM10 Exhaust PM10 PM2.5 Exhaust
CO2
0.09 1.06 0.44 0.00 1.16 0.04 1.20 0.04 180.36
0.37 4.24 1.81 0.01 5.16 0.17 5.33 0.15 803.43
0.23 2.53 1.12 0.00 3.47 0.10 3.57 0.09 541.08
0.07 0.75 0.34 0.00 1.16 0.03 1.19 0.03 180.36
0.03 0.30 0.14 0.00 0.53 0.01 0.54 0.01 81.98
Urbemis 2007 Version 9.2.4
Summary Report for Annual Emissions (Tons/Year)
File Name: C:\Revised with Urbemis-ARB Corrected\Demolition Rev - UPRR.urb924
Project Name: Demolition - UPRRProject Location: San Joaquin Valley APCD
On-Road Vehicle Emissions Based on: Version : Emfac2007 V2.3 Nov 1 2006
Off-Road Vehicle Emissions Based on: OFFROAD2007
CONSTRUCTION EMISSION ESTIMATES
PM2.5 Dust PM2.5
2013 TOTALS (tons/year unmitigated) 0.24 0.28
2014 TOTALS (tons/year unmitigated) 1.08 1.23
2015 TOTALS (tons/year unmitigated) 0.72 0.82
2016 TOTALS (tons/year unmitigated) 0.24 0.27
2017 TOTALS (tons/year unmitigated) 0.11 0.12

Page: 12/2/2012 01:16:56 PM
ROG NOx CO SO2 PM10 Dust PM10 Exhaust PM10 PM2.5 Exhaust
CO2
0.08 0.90 0.38 0.00 0.93 0.04 0.97 0.03 150.26
0.40 4.71 1.85 0.01 4.15 0.18 4.33 0.17 812.30
0.20 2.16 0.98 0.00 2.79 0.09 2.88 0.08 450.78
0.06 0.64 0.30 0.00 0.93 0.03 0.96 0.02 150.26
0.03 0.26 0.13 0.00 0.42 0.01 0.43 0.01 68.30
Urbemis 2007 Version 9.2.4
Summary Report for Annual Emissions (Tons/Year)
File Name: C:\Revised with Urbemis-ARB Corrected\Demolition Rev - Hybrid.urb924
Project Name: Demolition - HybridProject Location: San Joaquin Valley APCD
On-Road Vehicle Emissions Based on: Version : Emfac2007 V2.3 Nov 1 2006
Off-Road Vehicle Emissions Based on: OFFROAD2007
CONSTRUCTION EMISSION ESTIMATES
PM2.5 Dust PM2.5
2013 TOTALS (tons/year unmitigated) 0.19 0.23
2014 TOTALS (tons/year unmitigated) 0.87 1.03
2015 TOTALS (tons/year unmitigated) 0.58 0.66
2016 TOTALS (tons/year unmitigated) 0.19 0.22
2017 TOTALS (tons/year unmitigated) 0.09 0.10
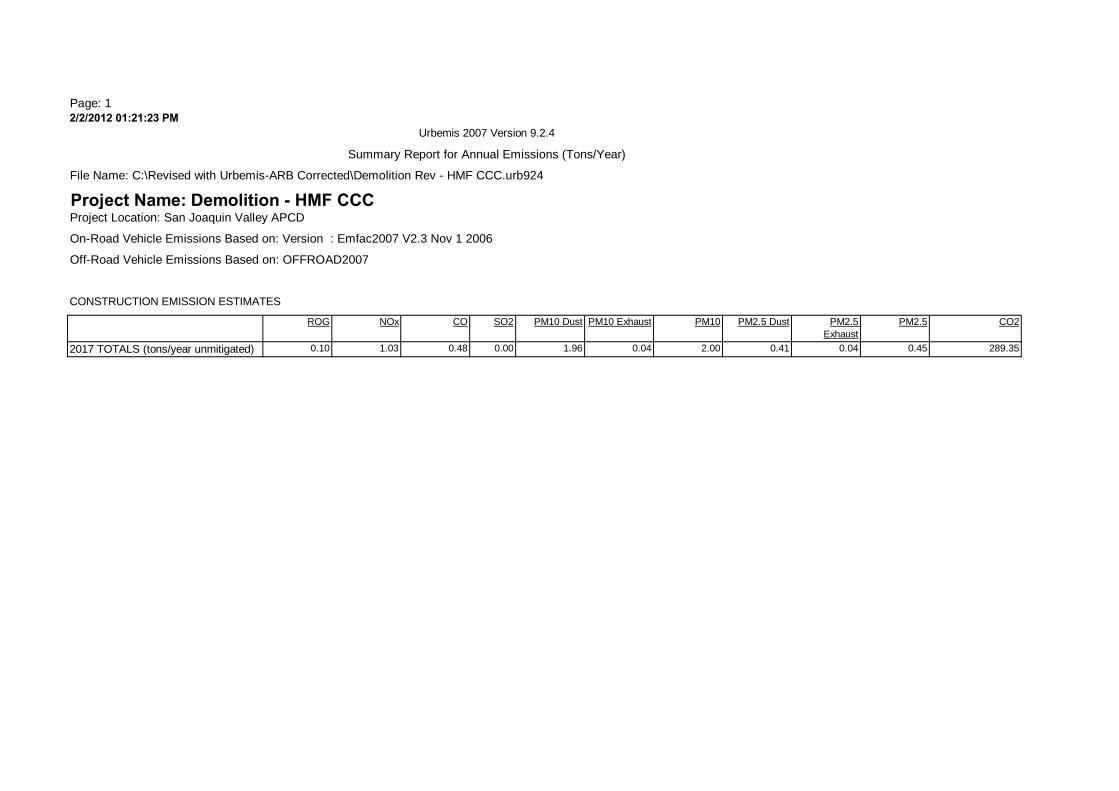
Page: 12/2/2012 01:21:23 PM
ROG NOx CO SO2 PM10 Dust PM10 Exhaust PM10 PM2.5 Exhaust
CO2
0.10 1.03 0.48 0.00 1.96 0.04 2.00 0.04 289.35
Urbemis 2007 Version 9.2.4
Summary Report for Annual Emissions (Tons/Year)
File Name: C:\Revised with Urbemis-ARB Corrected\Demolition Rev - HMF CCC.urb924
Project Name: Demolition - HMF CCCProject Location: San Joaquin Valley APCD
On-Road Vehicle Emissions Based on: Version : Emfac2007 V2.3 Nov 1 2006
Off-Road Vehicle Emissions Based on: OFFROAD2007
CONSTRUCTION EMISSION ESTIMATES
PM2.5 Dust PM2.5
2017 TOTALS (tons/year unmitigated) 0.41 0.45
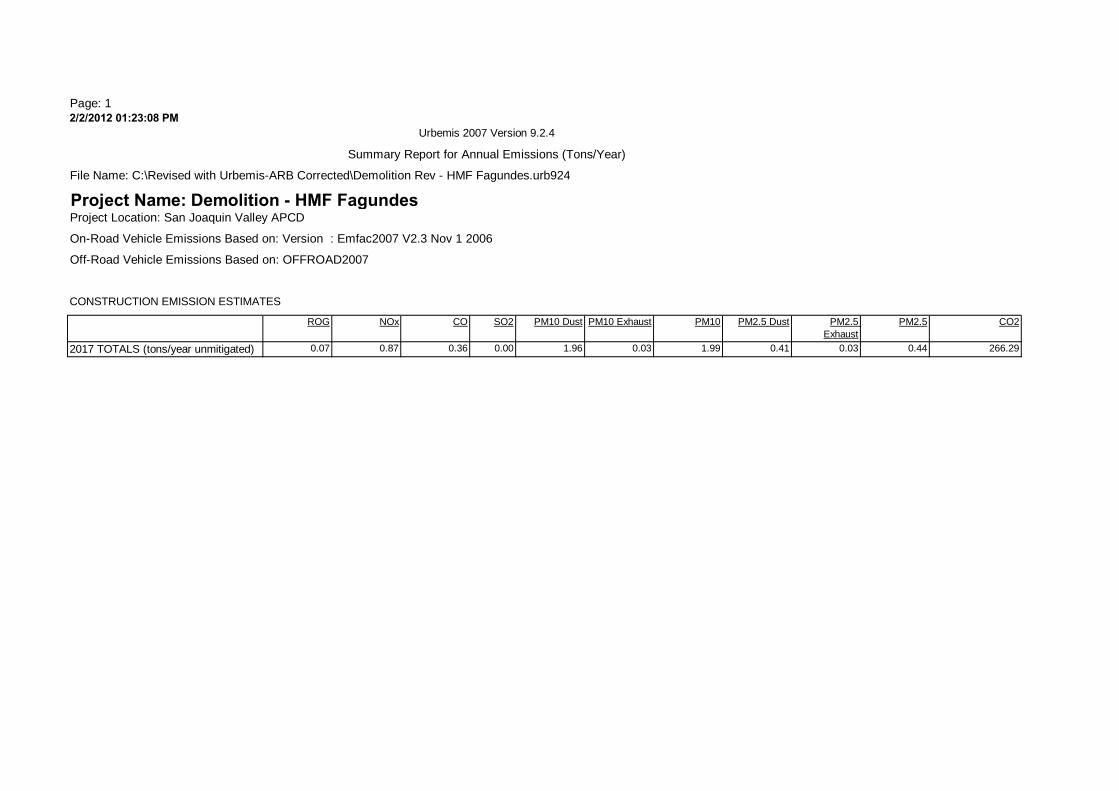
Page: 12/2/2012 01:23:08 PM
ROG NOx CO SO2 PM10 Dust PM10 Exhaust PM10 PM2.5 Exhaust
CO2
0.07 0.87 0.36 0.00 1.96 0.03 1.99 0.03 266.29
Urbemis 2007 Version 9.2.4
Summary Report for Annual Emissions (Tons/Year)
File Name: C:\Revised with Urbemis-ARB Corrected\Demolition Rev - HMF Fagundes.urb924
Project Name: Demolition - HMF FagundesProject Location: San Joaquin Valley APCD
On-Road Vehicle Emissions Based on: Version : Emfac2007 V2.3 Nov 1 2006
Off-Road Vehicle Emissions Based on: OFFROAD2007
CONSTRUCTION EMISSION ESTIMATES
PM2.5 Dust PM2.5
2017 TOTALS (tons/year unmitigated) 0.41 0.44
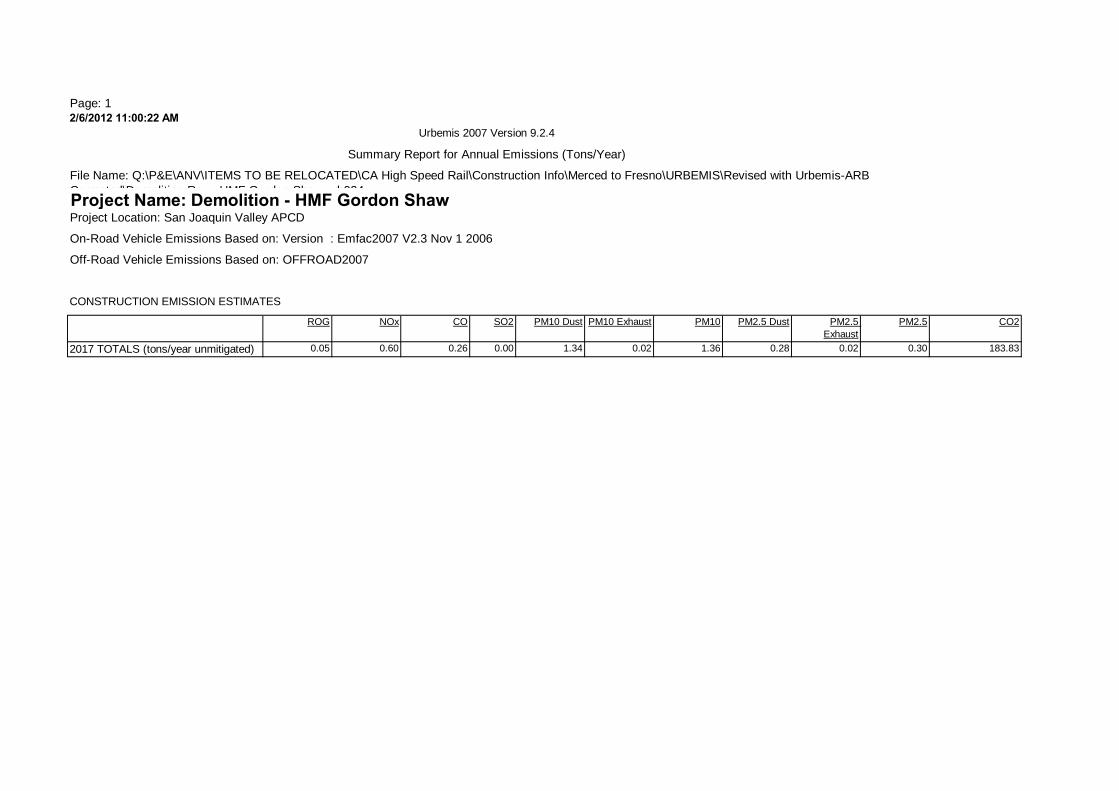
Page: 12/6/2012 11:00:22 AM
ROG NOx CO SO2 PM10 Dust PM10 Exhaust PM10 PM2.5 Exhaust
CO2
0.05 0.60 0.26 0.00 1.34 0.02 1.36 0.02 183.83
Urbemis 2007 Version 9.2.4
Summary Report for Annual Emissions (Tons/Year)
File Name: Q:\P&E\ANV\ITEMS TO BE RELOCATED\CA High Speed Rail\Construction Info\Merced to Fresno\URBEMIS\Revised with Urbemis-ARB Corrected\Demolition Rev - HMF Gordon Shaw.urb924Project Name: Demolition - HMF Gordon ShawProject Location: San Joaquin Valley APCD
On-Road Vehicle Emissions Based on: Version : Emfac2007 V2.3 Nov 1 2006
Off-Road Vehicle Emissions Based on: OFFROAD2007
CONSTRUCTION EMISSION ESTIMATES
PM2.5 Dust PM2.5
2017 TOTALS (tons/year unmitigated) 0.28 0.30

Page: 12/2/2012 01:25:49 PM
ROG NOx CO SO2 PM10 Dust PM10 Exhaust PM10 PM2.5 Exhaust
CO2
0.05 0.60 0.26 0.00 1.34 0.02 1.36 0.02 183.83
Urbemis 2007 Version 9.2.4
Summary Report for Annual Emissions (Tons/Year)
File Name: C:\Revised with Urbemis-ARB Corrected\Demolition Rev - HMF Harris DeJaeger.urb924
Project Name: Demolition - HMF Harris DeJaegerProject Location: San Joaquin Valley APCD
On-Road Vehicle Emissions Based on: Version : Emfac2007 V2.3 Nov 1 2006
Off-Road Vehicle Emissions Based on: OFFROAD2007
CONSTRUCTION EMISSION ESTIMATES
PM2.5 Dust PM2.5
2017 TOTALS (tons/year unmitigated) 0.28 0.30

Page: 12/2/2012 01:27:03 PM
ROG NOx CO SO2 PM10 Dust PM10 Exhaust PM10 PM2.5 Exhaust
CO2
0.05 0.60 0.26 0.00 1.34 0.02 1.36 0.02 183.83
Urbemis 2007 Version 9.2.4
Summary Report for Annual Emissions (Tons/Year)
File Name: C:\Revised with Urbemis-ARB Corrected\Demolition Rev - HMF Kojima.urb924
Project Name: Demolition - HMF KojimaProject Location: San Joaquin Valley APCD
On-Road Vehicle Emissions Based on: Version : Emfac2007 V2.3 Nov 1 2006
Off-Road Vehicle Emissions Based on: OFFROAD2007
CONSTRUCTION EMISSION ESTIMATES
PM2.5 Dust PM2.5
2017 TOTALS (tons/year unmitigated) 0.28 0.30
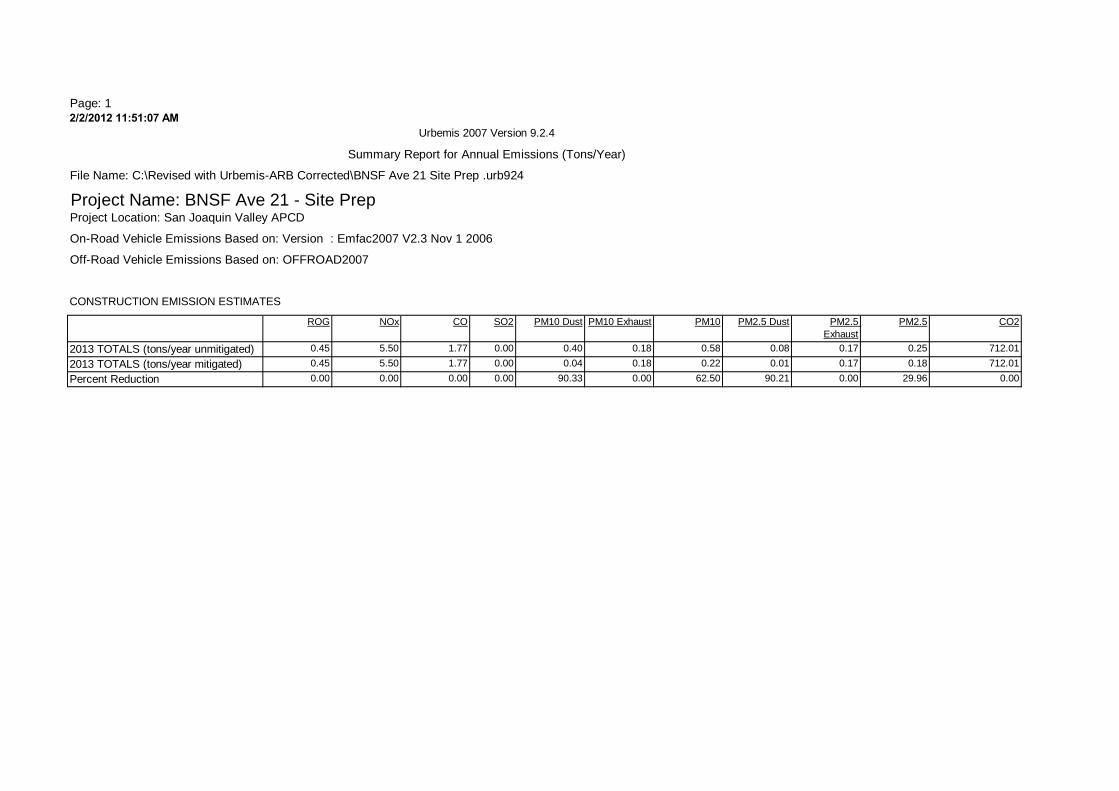
Page: 12/2/2012 11:51:07 AM
ROG NOx CO SO2 PM10 Dust PM10 Exhaust PM10 PM2.5 Exhaust
CO2
0.45 5.50 1.77 0.00 0.40 0.18 0.58 0.17 712.01
0.45 5.50 1.77 0.00 0.04 0.18 0.22 0.17 712.01
0.00 0.00 0.00 0.00 90.33 0.00 62.50 0.00 0.00
Urbemis 2007 Version 9.2.4
Summary Report for Annual Emissions (Tons/Year)
File Name: C:\Revised with Urbemis-ARB Corrected\BNSF Ave 21 Site Prep .urb924
Project Name: BNSF Ave 21 - Site Prep Project Location: San Joaquin Valley APCD
On-Road Vehicle Emissions Based on: Version : Emfac2007 V2.3 Nov 1 2006
Off-Road Vehicle Emissions Based on: OFFROAD2007
CONSTRUCTION EMISSION ESTIMATES
PM2.5 Dust PM2.5
2013 TOTALS (tons/year unmitigated) 0.08 0.25
2013 TOTALS (tons/year mitigated) 0.01 0.18
Percent Reduction 90.21 29.96

Page: 12/2/2012 11:52:24 AM
ROG NOx CO SO2 PM10 Dust PM10 Exhaust PM10 PM2.5 Exhaust
CO2
0.45 5.50 1.77 0.00 0.40 0.18 0.58 0.17 712.01
0.45 5.50 1.77 0.00 0.04 0.18 0.22 0.17 712.01
0.00 0.00 0.00 0.00 90.33 0.00 62.50 0.00 0.00
Urbemis 2007 Version 9.2.4
Summary Report for Annual Emissions (Tons/Year)
File Name: C:\Revised with Urbemis-ARB Corrected\BNSF Ave 24 Site Prep.urb924
Project Name: BNSF Ave 24 - Site Prep MitigatedProject Location: San Joaquin Valley APCD
On-Road Vehicle Emissions Based on: Version : Emfac2007 V2.3 Nov 1 2006
Off-Road Vehicle Emissions Based on: OFFROAD2007
CONSTRUCTION EMISSION ESTIMATES
PM2.5 Dust PM2.5
2013 TOTALS (tons/year unmitigated) 0.08 0.25
2013 TOTALS (tons/year mitigated) 0.01 0.18
Percent Reduction 90.21 29.96

Page: 12/2/2012 11:59:46 AM
ROG NOx CO SO2 PM10 Dust PM10 Exhaust PM10 PM2.5 Exhaust
CO2
0.45 5.50 1.77 0.00 0.40 0.18 0.58 0.17 712.01
0.45 5.50 1.77 0.00 0.04 0.18 0.22 0.17 712.01
0.00 0.00 0.00 0.00 90.33 0.00 62.50 0.00 0.00
Urbemis 2007 Version 9.2.4
Summary Report for Annual Emissions (Tons/Year)
File Name: C:\Revised with Urbemis-ARB Corrected\UPRR Ave 21 Site Prep.urb924
Project Name: UPRR Ave 21 - Site Prep MitigatedProject Location: San Joaquin Valley APCD
On-Road Vehicle Emissions Based on: Version : Emfac2007 V2.3 Nov 1 2006
Off-Road Vehicle Emissions Based on: OFFROAD2007
CONSTRUCTION EMISSION ESTIMATES
PM2.5 Dust PM2.5
2013 TOTALS (tons/year unmitigated) 0.08 0.25
2013 TOTALS (tons/year mitigated) 0.01 0.18
Percent Reduction 90.21 29.96
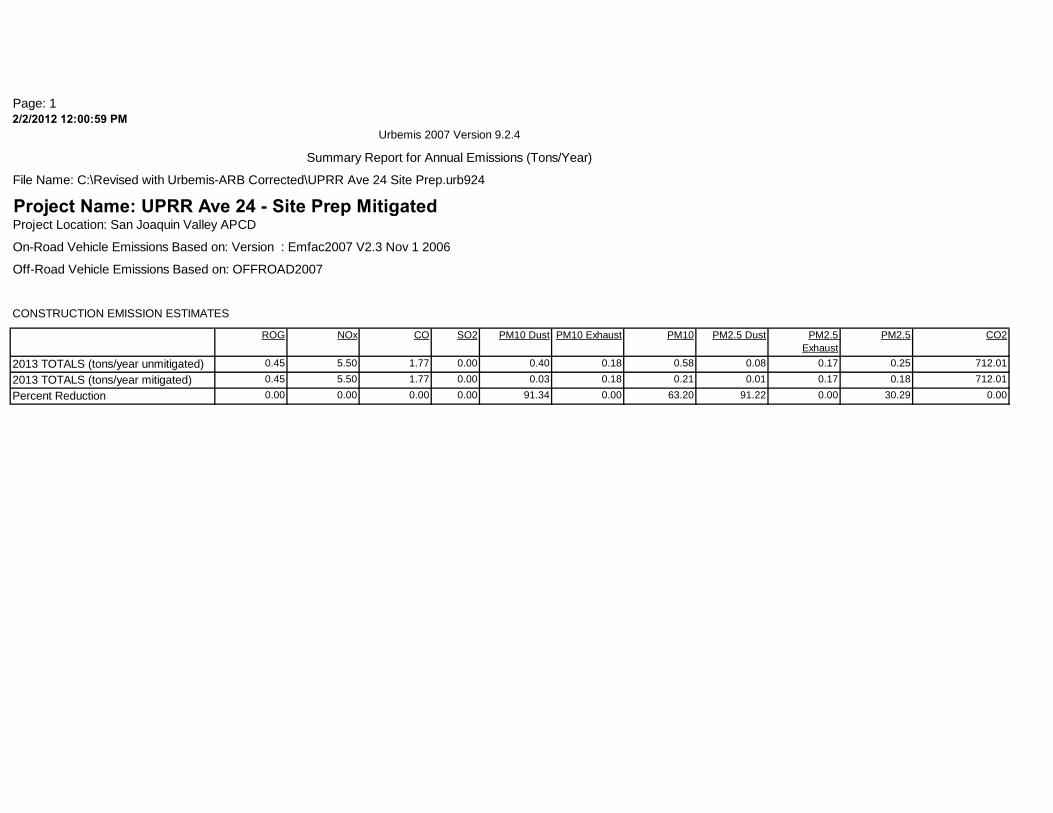
Page: 12/2/2012 12:00:59 PM
ROG NOx CO SO2 PM10 Dust PM10 Exhaust PM10 PM2.5 Exhaust
CO2
0.45 5.50 1.77 0.00 0.40 0.18 0.58 0.17 712.01
0.45 5.50 1.77 0.00 0.03 0.18 0.21 0.17 712.01
0.00 0.00 0.00 0.00 91.34 0.00 63.20 0.00 0.00
Urbemis 2007 Version 9.2.4
Summary Report for Annual Emissions (Tons/Year)
File Name: C:\Revised with Urbemis-ARB Corrected\UPRR Ave 24 Site Prep.urb924
Project Name: UPRR Ave 24 - Site Prep MitigatedProject Location: San Joaquin Valley APCD
On-Road Vehicle Emissions Based on: Version : Emfac2007 V2.3 Nov 1 2006
Off-Road Vehicle Emissions Based on: OFFROAD2007
CONSTRUCTION EMISSION ESTIMATES
PM2.5 Dust PM2.5
2013 TOTALS (tons/year unmitigated) 0.08 0.25
2013 TOTALS (tons/year mitigated) 0.01 0.18
Percent Reduction 91.22 30.29

Page: 12/2/2012 11:58:36 AM
ROG NOx CO SO2 PM10 Dust PM10 Exhaust PM10 PM2.5 Exhaust
CO2
0.45 5.50 1.77 0.00 0.40 0.18 0.58 0.17 712.01
0.45 5.50 1.77 0.00 0.04 0.18 0.22 0.17 712.01
0.00 0.00 0.00 0.00 90.33 0.00 62.50 0.00 0.00
Urbemis 2007 Version 9.2.4
Summary Report for Annual Emissions (Tons/Year)
File Name: C:\Revised with Urbemis-ARB Corrected\Hybrid Ave 24 Site Prep.urb924
Project Name: Hybrid Ave 24 - Site Prep MitigatedProject Location: San Joaquin Valley APCD
On-Road Vehicle Emissions Based on: Version : Emfac2007 V2.3 Nov 1 2006
Off-Road Vehicle Emissions Based on: OFFROAD2007
CONSTRUCTION EMISSION ESTIMATES
PM2.5 Dust PM2.5
2013 TOTALS (tons/year unmitigated) 0.08 0.25
2013 TOTALS (tons/year mitigated) 0.01 0.18
Percent Reduction 90.21 29.96

Page: 12/2/2012 11:53:30 AM
ROG NOx CO SO2 PM10 Dust PM10 Exhaust PM10 PM2.5 Exhaust
CO2
0.45 5.50 1.77 0.00 0.40 0.18 0.58 0.17 712.01
0.45 5.50 1.77 0.00 0.04 0.18 0.22 0.17 712.01
0.00 0.00 0.00 0.00 90.33 0.00 62.50 0.00 0.00
Urbemis 2007 Version 9.2.4
Summary Report for Annual Emissions (Tons/Year)
File Name: C:\Revised with Urbemis-ARB Corrected\Hybrid Ave 21 Site Prep.urb924
Project Name: Hybrid Ave 21 - Site Prep MitigatedProject Location: San Joaquin Valley APCD
On-Road Vehicle Emissions Based on: Version : Emfac2007 V2.3 Nov 1 2006
Off-Road Vehicle Emissions Based on: OFFROAD2007
CONSTRUCTION EMISSION ESTIMATES
PM2.5 Dust PM2.5
2013 TOTALS (tons/year unmitigated) 0.08 0.25
2013 TOTALS (tons/year mitigated) 0.01 0.18
Percent Reduction 90.21 29.96

B.2-3 Earth Moving

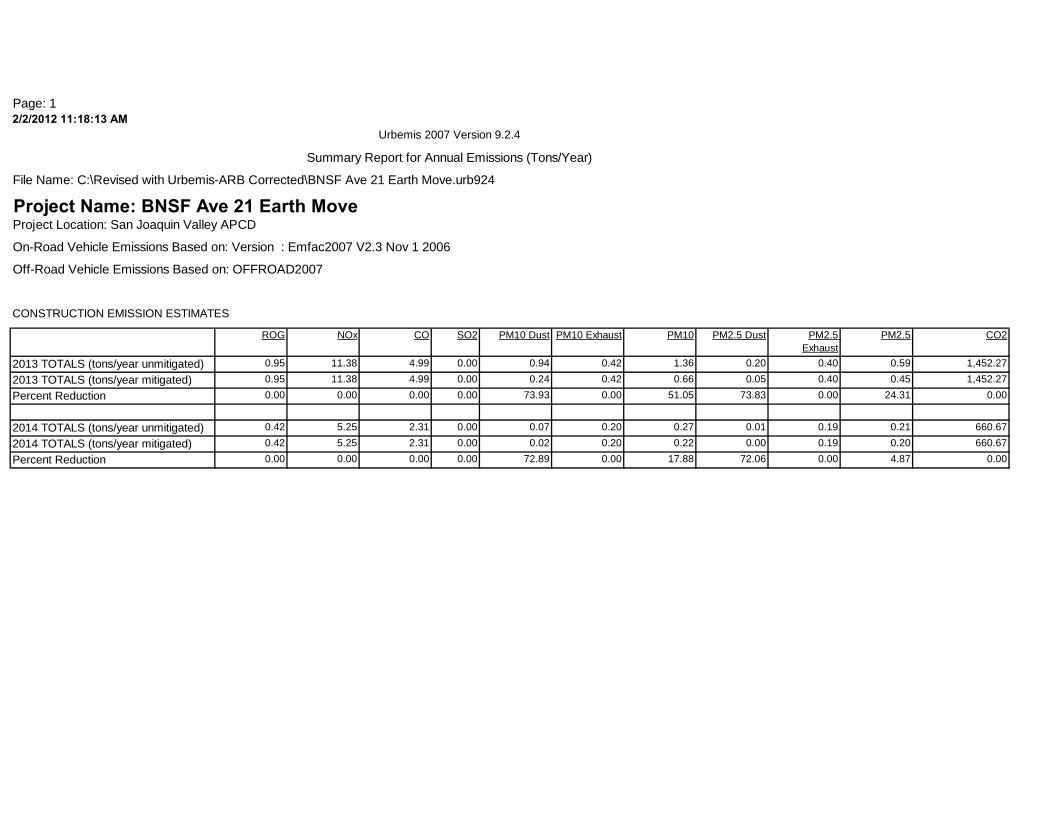
Page: 12/2/2012 11:18:13 AM
ROG NOx CO SO2 PM10 Dust PM10 Exhaust PM10 PM2.5 Exhaust
CO2
0.95 11.38 4.99 0.00 0.94 0.42 1.36 0.40 1,452.27
0.95 11.38 4.99 0.00 0.24 0.42 0.66 0.40 1,452.27
0.00 0.00 0.00 0.00 73.93 0.00 51.05 0.00 0.00
0.42 5.25 2.31 0.00 0.07 0.20 0.27 0.19 660.67
0.42 5.25 2.31 0.00 0.02 0.20 0.22 0.19 660.67
0.00 0.00 0.00 0.00 72.89 0.00 17.88 0.00 0.00
Urbemis 2007 Version 9.2.4
Summary Report for Annual Emissions (Tons/Year)
File Name: C:\Revised with Urbemis-ARB Corrected\BNSF Ave 21 Earth Move.urb924
Project Name: BNSF Ave 21 Earth MoveProject Location: San Joaquin Valley APCD
On-Road Vehicle Emissions Based on: Version : Emfac2007 V2.3 Nov 1 2006
Off-Road Vehicle Emissions Based on: OFFROAD2007
CONSTRUCTION EMISSION ESTIMATES
PM2.5 Dust PM2.5
2013 TOTALS (tons/year unmitigated) 0.20 0.59
2013 TOTALS (tons/year mitigated) 0.05 0.45
Percent Reduction 73.83 24.31
2014 TOTALS (tons/year unmitigated) 0.01 0.21
2014 TOTALS (tons/year mitigated) 0.00 0.20
Percent Reduction 72.06 4.87
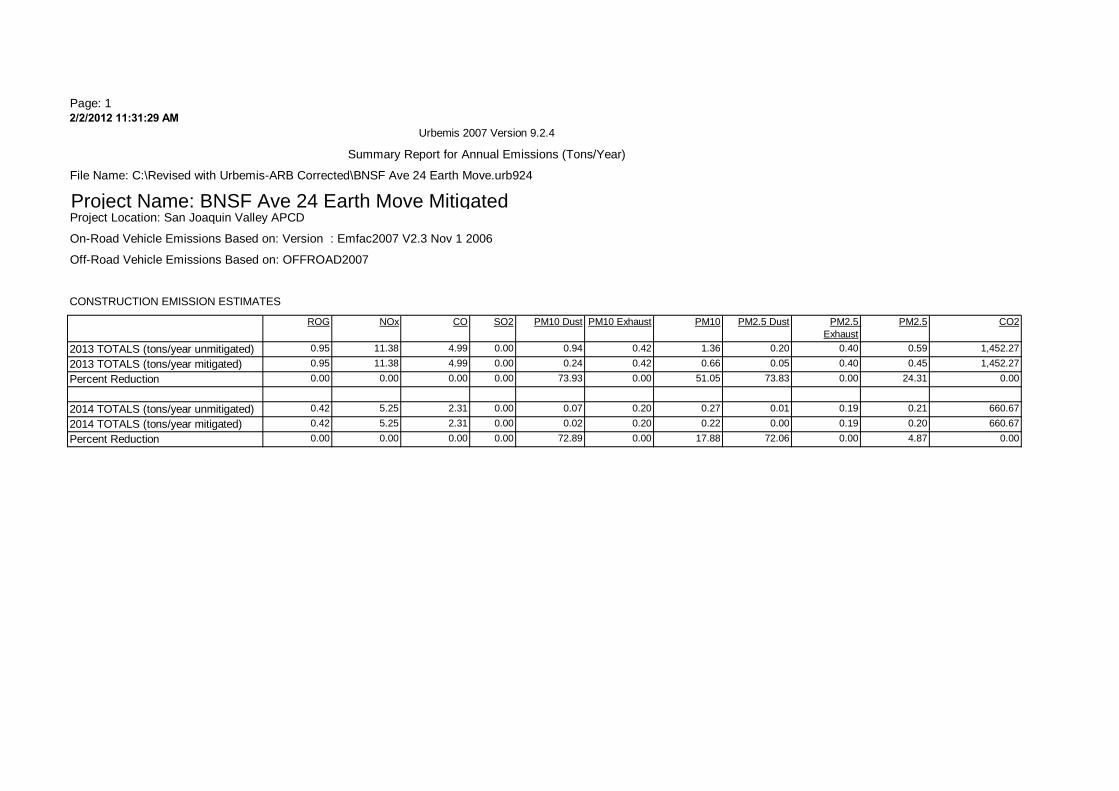
Page: 12/2/2012 11:31:29 AM
ROG NOx CO SO2 PM10 Dust PM10 Exhaust PM10 PM2.5 Exhaust
CO2
0.95 11.38 4.99 0.00 0.94 0.42 1.36 0.40 1,452.27
0.95 11.38 4.99 0.00 0.24 0.42 0.66 0.40 1,452.27
0.00 0.00 0.00 0.00 73.93 0.00 51.05 0.00 0.00
0.42 5.25 2.31 0.00 0.07 0.20 0.27 0.19 660.67
0.42 5.25 2.31 0.00 0.02 0.20 0.22 0.19 660.67
0.00 0.00 0.00 0.00 72.89 0.00 17.88 0.00 0.00
Urbemis 2007 Version 9.2.4
Summary Report for Annual Emissions (Tons/Year)
File Name: C:\Revised with Urbemis-ARB Corrected\BNSF Ave 24 Earth Move.urb924
Project Name: BNSF Ave 24 Earth Move MitigatedProject Location: San Joaquin Valley APCD
On-Road Vehicle Emissions Based on: Version : Emfac2007 V2.3 Nov 1 2006
Off-Road Vehicle Emissions Based on: OFFROAD2007
CONSTRUCTION EMISSION ESTIMATES
PM2.5 Dust PM2.5
2013 TOTALS (tons/year unmitigated) 0.20 0.59
2013 TOTALS (tons/year mitigated) 0.05 0.45
Percent Reduction 73.83 24.31
2014 TOTALS (tons/year unmitigated) 0.01 0.21
2014 TOTALS (tons/year mitigated) 0.00 0.20
Percent Reduction 72.06 4.87

Page: 12/2/2012 11:42:04 AM
ROG NOx CO SO2 PM10 Dust PM10 Exhaust PM10 PM2.5 Exhaust
CO2
0.95 11.38 4.99 0.00 0.94 0.42 1.36 0.40 1,452.27
0.95 11.38 4.99 0.00 0.27 0.42 0.69 0.40 1,452.27
0.00 0.00 0.00 0.00 71.36 0.00 49.27 0.00 0.00
0.42 5.25 2.31 0.00 0.07 0.20 0.27 0.19 660.67
0.42 5.25 2.31 0.00 0.02 0.20 0.22 0.19 660.67
0.00 0.00 0.00 0.00 67.44 0.00 16.54 0.00 0.00
Urbemis 2007 Version 9.2.4
Summary Report for Annual Emissions (Tons/Year)
File Name: C:\Revised with Urbemis-ARB Corrected\UPPR Ave 21 Earth Move.urb924
Project Name: UPRR Ave 21 Earth Move MitigatedProject Location: San Joaquin Valley APCD
On-Road Vehicle Emissions Based on: Version : Emfac2007 V2.3 Nov 1 2006
Off-Road Vehicle Emissions Based on: OFFROAD2007
CONSTRUCTION EMISSION ESTIMATES
PM2.5 Dust PM2.5
2013 TOTALS (tons/year unmitigated) 0.20 0.59
2013 TOTALS (tons/year mitigated) 0.06 0.46
Percent Reduction 71.26 23.47
2014 TOTALS (tons/year unmitigated) 0.01 0.21
2014 TOTALS (tons/year mitigated) 0.00 0.20
Percent Reduction 66.67 4.50

Page: 12/2/2012 11:44:33 AM
ROG NOx CO SO2 PM10 Dust PM10 Exhaust PM10 PM2.5 Exhaust
CO2
0.95 11.38 4.99 0.00 0.94 0.42 1.36 0.40 1,452.27
0.95 11.38 4.99 0.00 0.24 0.42 0.66 0.40 1,452.27
0.00 0.00 0.00 0.00 73.93 0.00 51.05 0.00 0.00
0.42 5.25 2.31 0.00 0.07 0.20 0.27 0.19 660.67
0.42 5.25 2.31 0.00 0.02 0.20 0.22 0.19 660.67
0.00 0.00 0.00 0.00 72.89 0.00 17.88 0.00 0.00
Urbemis 2007 Version 9.2.4
Summary Report for Annual Emissions (Tons/Year)
File Name: C:\Revised with Urbemis-ARB Corrected\UPPR Ave 24 Earth Move.urb924
Project Name: UPRR Ave 24 Earth Move MitigatedProject Location: San Joaquin Valley APCD
On-Road Vehicle Emissions Based on: Version : Emfac2007 V2.3 Nov 1 2006
Off-Road Vehicle Emissions Based on: OFFROAD2007
CONSTRUCTION EMISSION ESTIMATES
PM2.5 Dust PM2.5
2013 TOTALS (tons/year unmitigated) 0.20 0.59
2013 TOTALS (tons/year mitigated) 0.05 0.45
Percent Reduction 73.83 24.31
2014 TOTALS (tons/year unmitigated) 0.01 0.21
2014 TOTALS (tons/year mitigated) 0.00 0.20
Percent Reduction 72.06 4.87
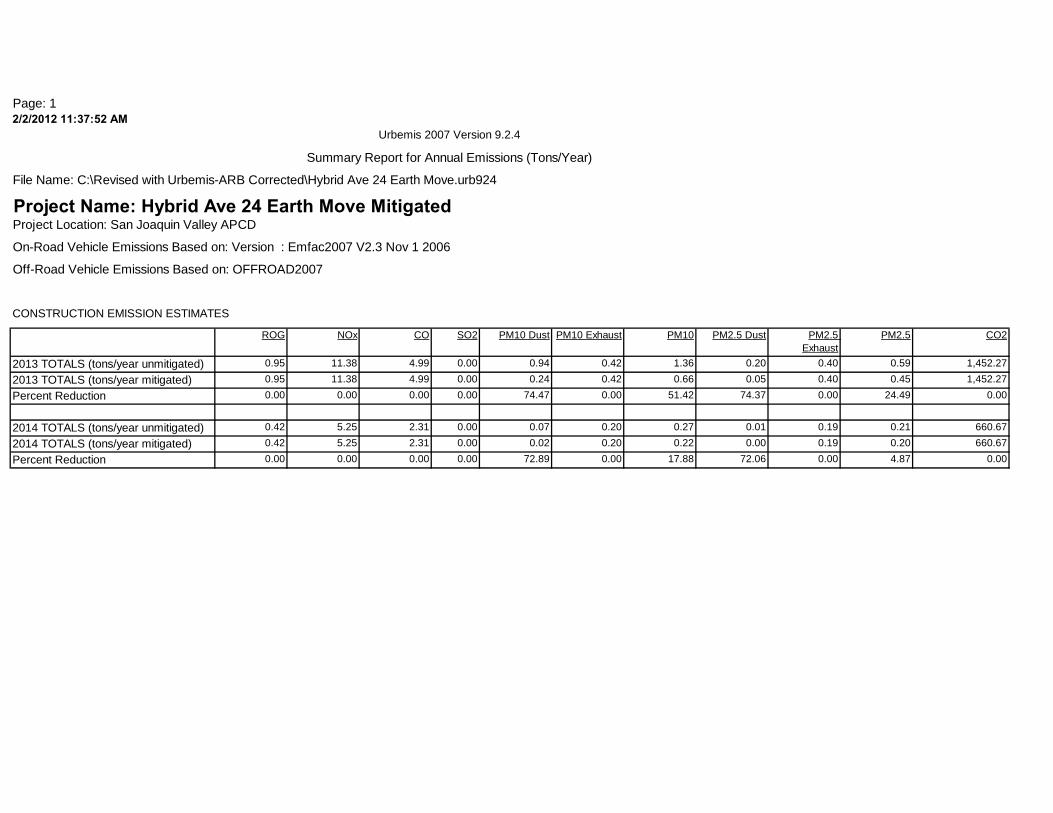
Page: 12/2/2012 11:37:52 AM
ROG NOx CO SO2 PM10 Dust PM10 Exhaust PM10 PM2.5 Exhaust
CO2
0.95 11.38 4.99 0.00 0.94 0.42 1.36 0.40 1,452.27
0.95 11.38 4.99 0.00 0.24 0.42 0.66 0.40 1,452.27
0.00 0.00 0.00 0.00 74.47 0.00 51.42 0.00 0.00
0.42 5.25 2.31 0.00 0.07 0.20 0.27 0.19 660.67
0.42 5.25 2.31 0.00 0.02 0.20 0.22 0.19 660.67
0.00 0.00 0.00 0.00 72.89 0.00 17.88 0.00 0.00
Urbemis 2007 Version 9.2.4
Summary Report for Annual Emissions (Tons/Year)
File Name: C:\Revised with Urbemis-ARB Corrected\Hybrid Ave 24 Earth Move.urb924
Project Name: Hybrid Ave 24 Earth Move MitigatedProject Location: San Joaquin Valley APCD
On-Road Vehicle Emissions Based on: Version : Emfac2007 V2.3 Nov 1 2006
Off-Road Vehicle Emissions Based on: OFFROAD2007
CONSTRUCTION EMISSION ESTIMATES
PM2.5 Dust PM2.5
2013 TOTALS (tons/year unmitigated) 0.20 0.59
2013 TOTALS (tons/year mitigated) 0.05 0.45
Percent Reduction 74.37 24.49
2014 TOTALS (tons/year unmitigated) 0.01 0.21
2014 TOTALS (tons/year mitigated) 0.00 0.20
Percent Reduction 72.06 4.87
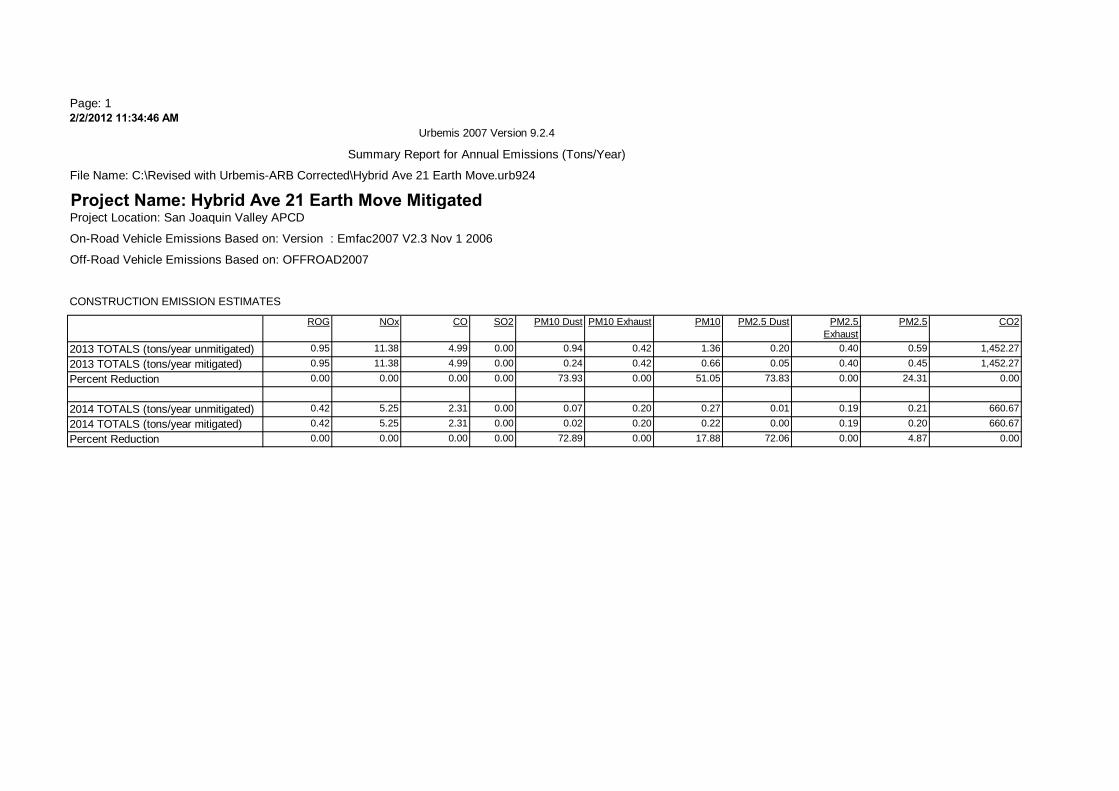
Page: 12/2/2012 11:34:46 AM
ROG NOx CO SO2 PM10 Dust PM10 Exhaust PM10 PM2.5 Exhaust
CO2
0.95 11.38 4.99 0.00 0.94 0.42 1.36 0.40 1,452.27
0.95 11.38 4.99 0.00 0.24 0.42 0.66 0.40 1,452.27
0.00 0.00 0.00 0.00 73.93 0.00 51.05 0.00 0.00
0.42 5.25 2.31 0.00 0.07 0.20 0.27 0.19 660.67
0.42 5.25 2.31 0.00 0.02 0.20 0.22 0.19 660.67
0.00 0.00 0.00 0.00 72.89 0.00 17.88 0.00 0.00
Urbemis 2007 Version 9.2.4
Summary Report for Annual Emissions (Tons/Year)
File Name: C:\Revised with Urbemis-ARB Corrected\Hybrid Ave 21 Earth Move.urb924
Project Name: Hybrid Ave 21 Earth Move MitigatedProject Location: San Joaquin Valley APCD
On-Road Vehicle Emissions Based on: Version : Emfac2007 V2.3 Nov 1 2006
Off-Road Vehicle Emissions Based on: OFFROAD2007
CONSTRUCTION EMISSION ESTIMATES
PM2.5 Dust PM2.5
2013 TOTALS (tons/year unmitigated) 0.20 0.59
2013 TOTALS (tons/year mitigated) 0.05 0.45
Percent Reduction 73.83 24.31
2014 TOTALS (tons/year unmitigated) 0.01 0.21
2014 TOTALS (tons/year mitigated) 0.00 0.20
Percent Reduction 72.06 4.87
B.2-4 Roadways

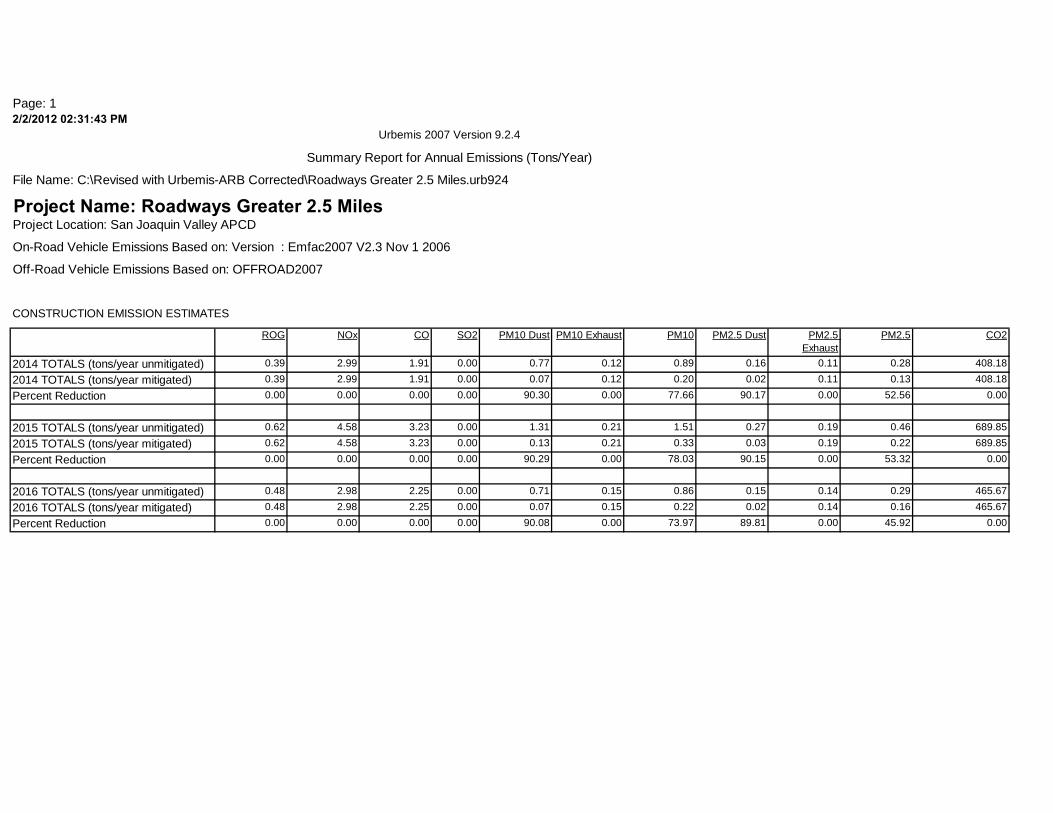
Page: 12/2/2012 02:31:43 PM
ROG NOx CO SO2 PM10 Dust PM10 Exhaust PM10 PM2.5 Exhaust
CO2
0.39 2.99 1.91 0.00 0.77 0.12 0.89 0.11 408.18
0.39 2.99 1.91 0.00 0.07 0.12 0.20 0.11 408.18
0.00 0.00 0.00 0.00 90.30 0.00 77.66 0.00 0.00
0.62 4.58 3.23 0.00 1.31 0.21 1.51 0.19 689.85
0.62 4.58 3.23 0.00 0.13 0.21 0.33 0.19 689.85
0.00 0.00 0.00 0.00 90.29 0.00 78.03 0.00 0.00
0.48 2.98 2.25 0.00 0.71 0.15 0.86 0.14 465.67
0.48 2.98 2.25 0.00 0.07 0.15 0.22 0.14 465.67
0.00 0.00 0.00 0.00 90.08 0.00 73.97 0.00 0.00
Urbemis 2007 Version 9.2.4
Summary Report for Annual Emissions (Tons/Year)
File Name: C:\Revised with Urbemis-ARB Corrected\Roadways Greater 2.5 Miles.urb924
Project Name: Roadways Greater 2.5 Miles Project Location: San Joaquin Valley APCD
On-Road Vehicle Emissions Based on: Version : Emfac2007 V2.3 Nov 1 2006
Off-Road Vehicle Emissions Based on: OFFROAD2007
CONSTRUCTION EMISSION ESTIMATES
PM2.5 Dust PM2.5
2014 TOTALS (tons/year unmitigated) 0.16 0.28
2014 TOTALS (tons/year mitigated) 0.02 0.13
Percent Reduction 90.17 52.56
2015 TOTALS (tons/year unmitigated) 0.27 0.46
2015 TOTALS (tons/year mitigated) 0.03 0.22
Percent Reduction 90.15 53.32
2016 TOTALS (tons/year unmitigated) 0.15 0.29
2016 TOTALS (tons/year mitigated) 0.02 0.16
Percent Reduction 89.81 45.92
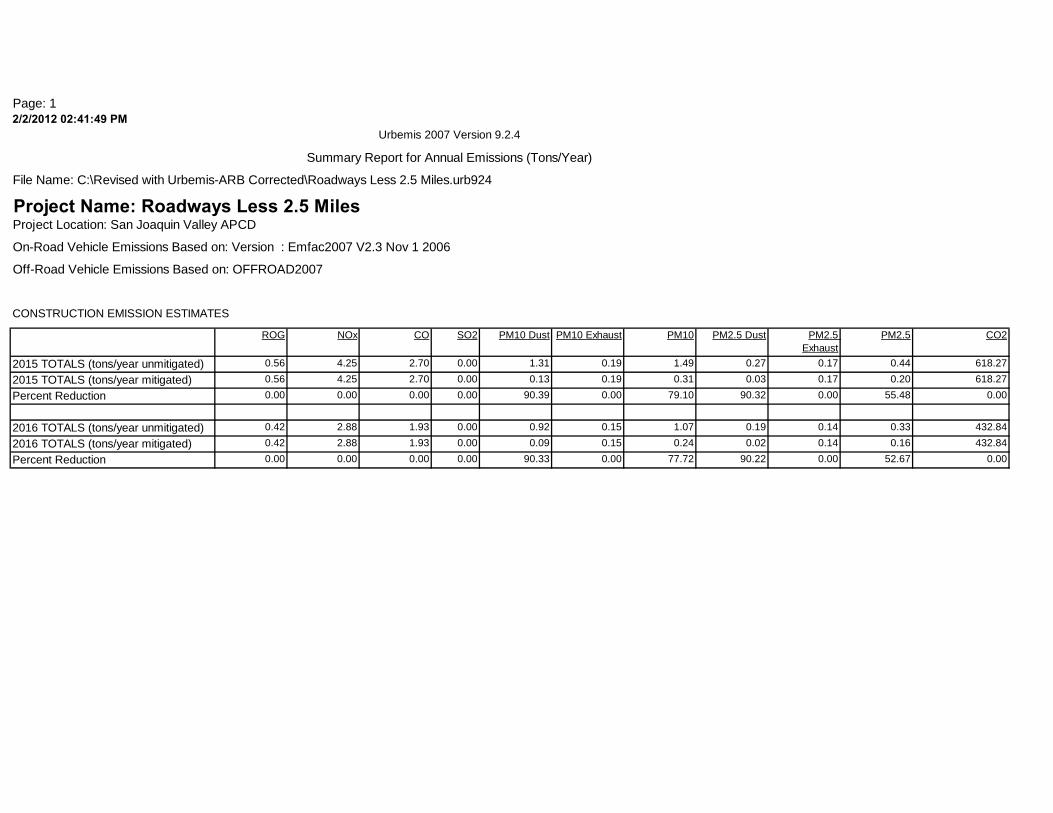
Page: 12/2/2012 02:41:49 PM
ROG NOx CO SO2 PM10 Dust PM10 Exhaust PM10 PM2.5 Exhaust
CO2
0.56 4.25 2.70 0.00 1.31 0.19 1.49 0.17 618.27
0.56 4.25 2.70 0.00 0.13 0.19 0.31 0.17 618.27
0.00 0.00 0.00 0.00 90.39 0.00 79.10 0.00 0.00
0.42 2.88 1.93 0.00 0.92 0.15 1.07 0.14 432.84
0.42 2.88 1.93 0.00 0.09 0.15 0.24 0.14 432.84
0.00 0.00 0.00 0.00 90.33 0.00 77.72 0.00 0.00
Urbemis 2007 Version 9.2.4
Summary Report for Annual Emissions (Tons/Year)
File Name: C:\Revised with Urbemis-ARB Corrected\Roadways Less 2.5 Miles.urb924
Project Name: Roadways Less 2.5 Miles Project Location: San Joaquin Valley APCD
On-Road Vehicle Emissions Based on: Version : Emfac2007 V2.3 Nov 1 2006
Off-Road Vehicle Emissions Based on: OFFROAD2007
CONSTRUCTION EMISSION ESTIMATES
PM2.5 Dust PM2.5
2015 TOTALS (tons/year unmitigated) 0.27 0.44
2015 TOTALS (tons/year mitigated) 0.03 0.20
Percent Reduction 90.32 55.48
2016 TOTALS (tons/year unmitigated) 0.19 0.33
2016 TOTALS (tons/year mitigated) 0.02 0.16
Percent Reduction 90.22 52.67
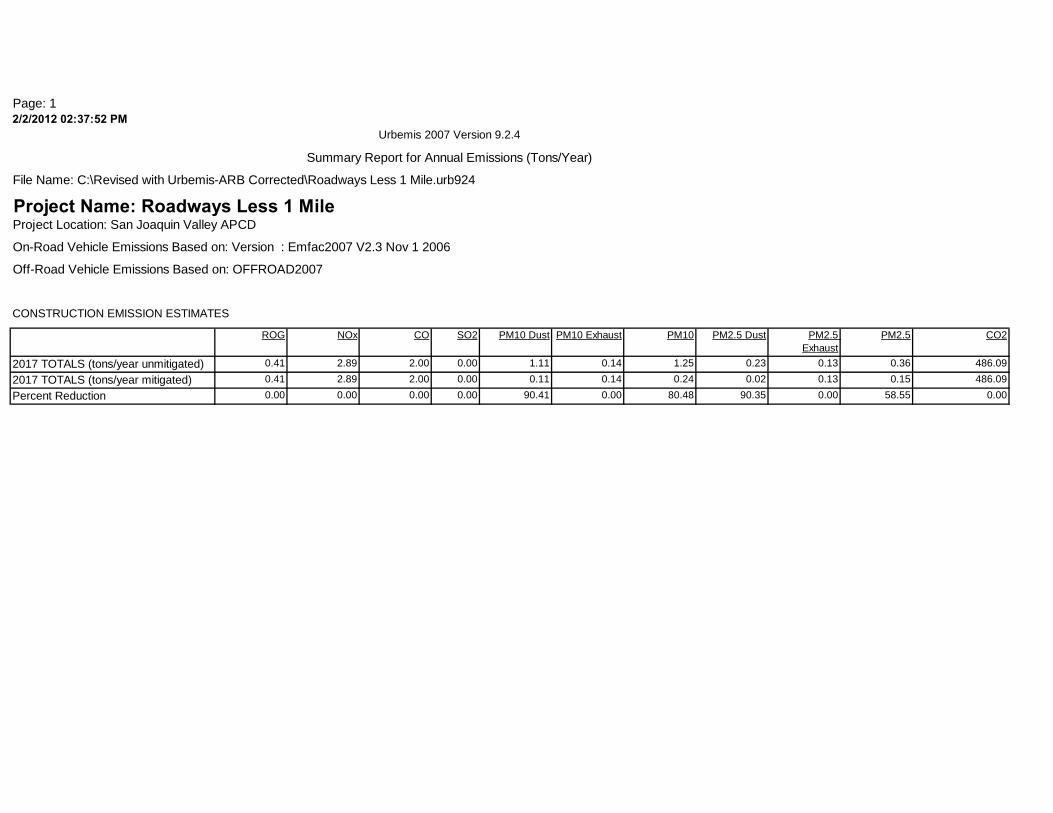
Page: 12/2/2012 02:37:52 PM
ROG NOx CO SO2 PM10 Dust PM10 Exhaust PM10 PM2.5 Exhaust
CO2
0.41 2.89 2.00 0.00 1.11 0.14 1.25 0.13 486.09
0.41 2.89 2.00 0.00 0.11 0.14 0.24 0.13 486.09
0.00 0.00 0.00 0.00 90.41 0.00 80.48 0.00 0.00
Urbemis 2007 Version 9.2.4
Summary Report for Annual Emissions (Tons/Year)
File Name: C:\Revised with Urbemis-ARB Corrected\Roadways Less 1 Mile.urb924
Project Name: Roadways Less 1 MileProject Location: San Joaquin Valley APCD
On-Road Vehicle Emissions Based on: Version : Emfac2007 V2.3 Nov 1 2006
Off-Road Vehicle Emissions Based on: OFFROAD2007
CONSTRUCTION EMISSION ESTIMATES
PM2.5 Dust PM2.5
2017 TOTALS (tons/year unmitigated) 0.23 0.36
2017 TOTALS (tons/year mitigated) 0.02 0.15
Percent Reduction 90.35 58.55


B.2-5 Elevated Structures

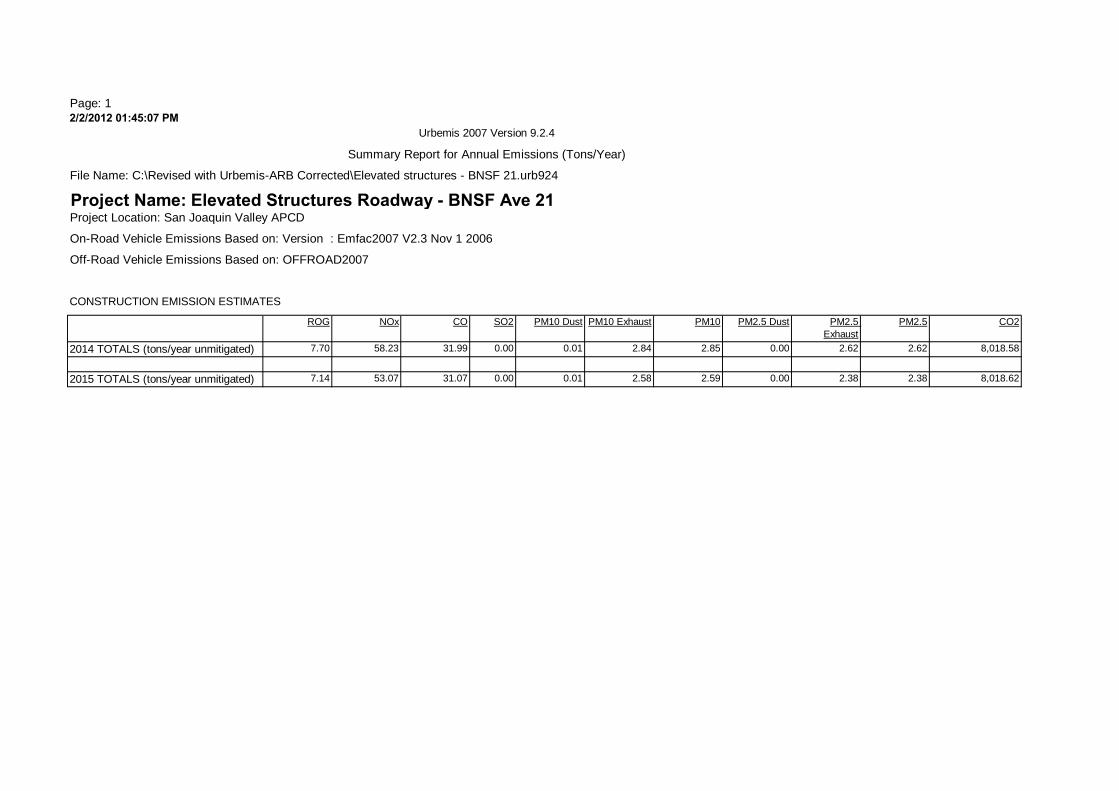
Page: 12/2/2012 01:45:07 PM
ROG NOx CO SO2 PM10 Dust PM10 Exhaust PM10 PM2.5 Exhaust
CO2
7.70 58.23 31.99 0.00 0.01 2.84 2.85 2.62 8,018.58
7.14 53.07 31.07 0.00 0.01 2.58 2.59 2.38 8,018.62
Urbemis 2007 Version 9.2.4
Summary Report for Annual Emissions (Tons/Year)
File Name: C:\Revised with Urbemis-ARB Corrected\Elevated structures - BNSF 21.urb924
Project Name: Elevated Structures Roadway - BNSF Ave 21 Project Location: San Joaquin Valley APCD
On-Road Vehicle Emissions Based on: Version : Emfac2007 V2.3 Nov 1 2006
Off-Road Vehicle Emissions Based on: OFFROAD2007
CONSTRUCTION EMISSION ESTIMATES
PM2.5 Dust PM2.5
2014 TOTALS (tons/year unmitigated) 0.00 2.62
2015 TOTALS (tons/year unmitigated) 0.00 2.38

Page: 12/2/2012 01:50:59 PM
ROG NOx CO SO2 PM10 Dust PM10 Exhaust PM10 PM2.5 Exhaust
CO2
9.00 68.32 37.03 0.00 0.01 3.32 3.33 3.05 9,479.95
8.35 62.19 35.93 0.00 0.01 3.01 3.02 2.77 9,479.99
Urbemis 2007 Version 9.2.4
Summary Report for Annual Emissions (Tons/Year)
File Name: C:\Revised with Urbemis-ARB Corrected\Elevated structures - BNSF 24.urb924
Project Name: Elevated Structures Roadway - BNSF Ave 24Project Location: San Joaquin Valley APCD
On-Road Vehicle Emissions Based on: Version : Emfac2007 V2.3 Nov 1 2006
Off-Road Vehicle Emissions Based on: OFFROAD2007
CONSTRUCTION EMISSION ESTIMATES
PM2.5 Dust PM2.5
2014 TOTALS (tons/year unmitigated) 0.00 3.06
2015 TOTALS (tons/year unmitigated) 0.00 2.77
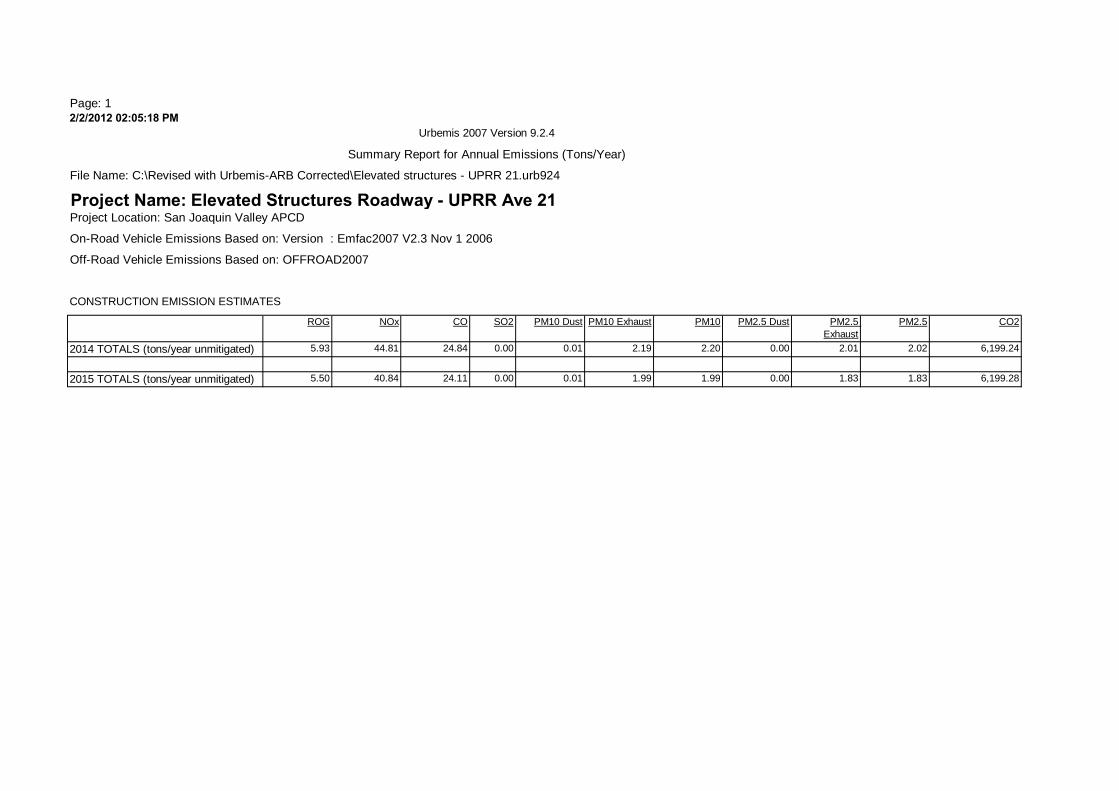
Page: 12/2/2012 02:05:18 PM
ROG NOx CO SO2 PM10 Dust PM10 Exhaust PM10 PM2.5 Exhaust
CO2
5.93 44.81 24.84 0.00 0.01 2.19 2.20 2.01 6,199.24
5.50 40.84 24.11 0.00 0.01 1.99 1.99 1.83 6,199.28
Urbemis 2007 Version 9.2.4
Summary Report for Annual Emissions (Tons/Year)
File Name: C:\Revised with Urbemis-ARB Corrected\Elevated structures - UPRR 21.urb924
Project Name: Elevated Structures Roadway - UPRR Ave 21 Project Location: San Joaquin Valley APCD
On-Road Vehicle Emissions Based on: Version : Emfac2007 V2.3 Nov 1 2006
Off-Road Vehicle Emissions Based on: OFFROAD2007
CONSTRUCTION EMISSION ESTIMATES
PM2.5 Dust PM2.5
2014 TOTALS (tons/year unmitigated) 0.00 2.02
2015 TOTALS (tons/year unmitigated) 0.00 1.83

Page: 12/2/2012 02:10:10 PM
ROG NOx CO SO2 PM10 Dust PM10 Exhaust PM10 PM2.5 Exhaust
CO2
6.52 49.28 27.22 0.00 0.01 2.41 2.41 2.21 6,805.69
6.05 44.92 26.43 0.00 0.01 2.19 2.19 2.01 6,805.73
Urbemis 2007 Version 9.2.4
Summary Report for Annual Emissions (Tons/Year)
File Name: C:\Revised with Urbemis-ARB Corrected\Elevated structures - UPRR 24.urb924
Project Name: Elevated Structures Roadway - UPRR Ave 24Project Location: San Joaquin Valley APCD
On-Road Vehicle Emissions Based on: Version : Emfac2007 V2.3 Nov 1 2006
Off-Road Vehicle Emissions Based on: OFFROAD2007
CONSTRUCTION EMISSION ESTIMATES
PM2.5 Dust PM2.5
2014 TOTALS (tons/year unmitigated) 0.00 2.22
2015 TOTALS (tons/year unmitigated) 0.00 2.01
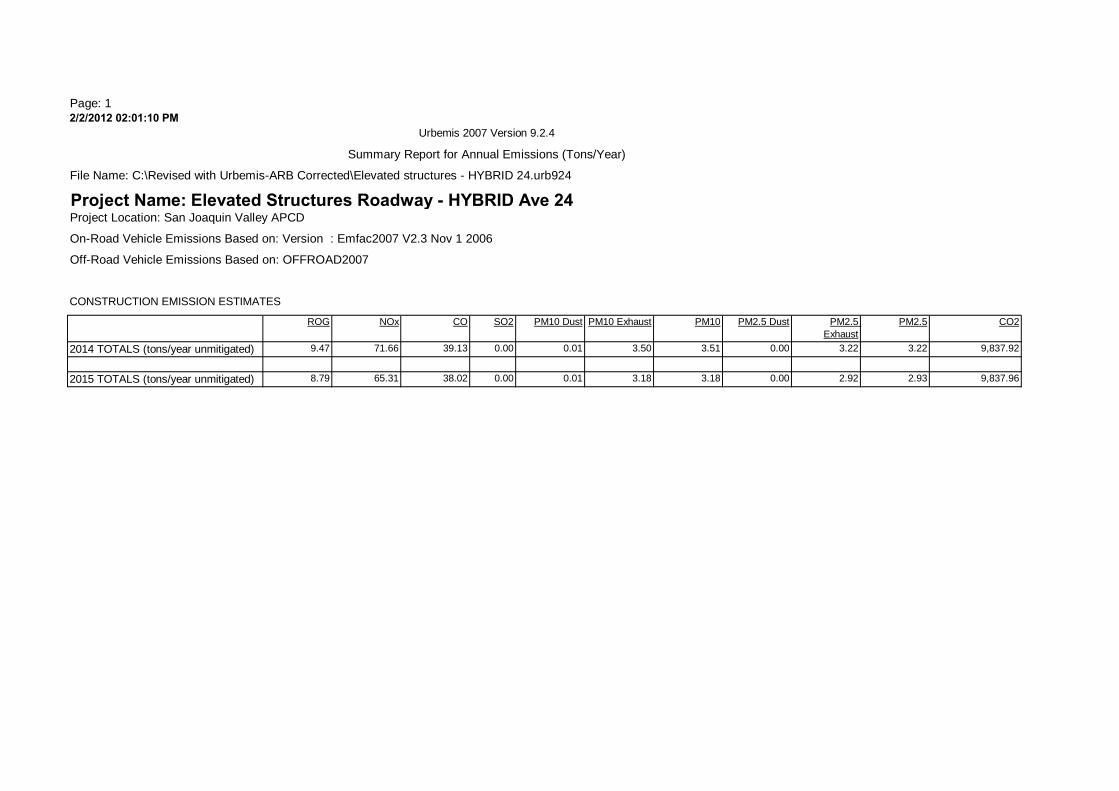
Page: 12/2/2012 02:01:10 PM
ROG NOx CO SO2 PM10 Dust PM10 Exhaust PM10 PM2.5 Exhaust
CO2
9.47 71.66 39.13 0.00 0.01 3.50 3.51 3.22 9,837.92
8.79 65.31 38.02 0.00 0.01 3.18 3.18 2.92 9,837.96
Urbemis 2007 Version 9.2.4
Summary Report for Annual Emissions (Tons/Year)
File Name: C:\Revised with Urbemis-ARB Corrected\Elevated structures - HYBRID 24.urb924
Project Name: Elevated Structures Roadway - HYBRID Ave 24Project Location: San Joaquin Valley APCD
On-Road Vehicle Emissions Based on: Version : Emfac2007 V2.3 Nov 1 2006
Off-Road Vehicle Emissions Based on: OFFROAD2007
CONSTRUCTION EMISSION ESTIMATES
PM2.5 Dust PM2.5
2014 TOTALS (tons/year unmitigated) 0.00 3.22
2015 TOTALS (tons/year unmitigated) 0.00 2.93
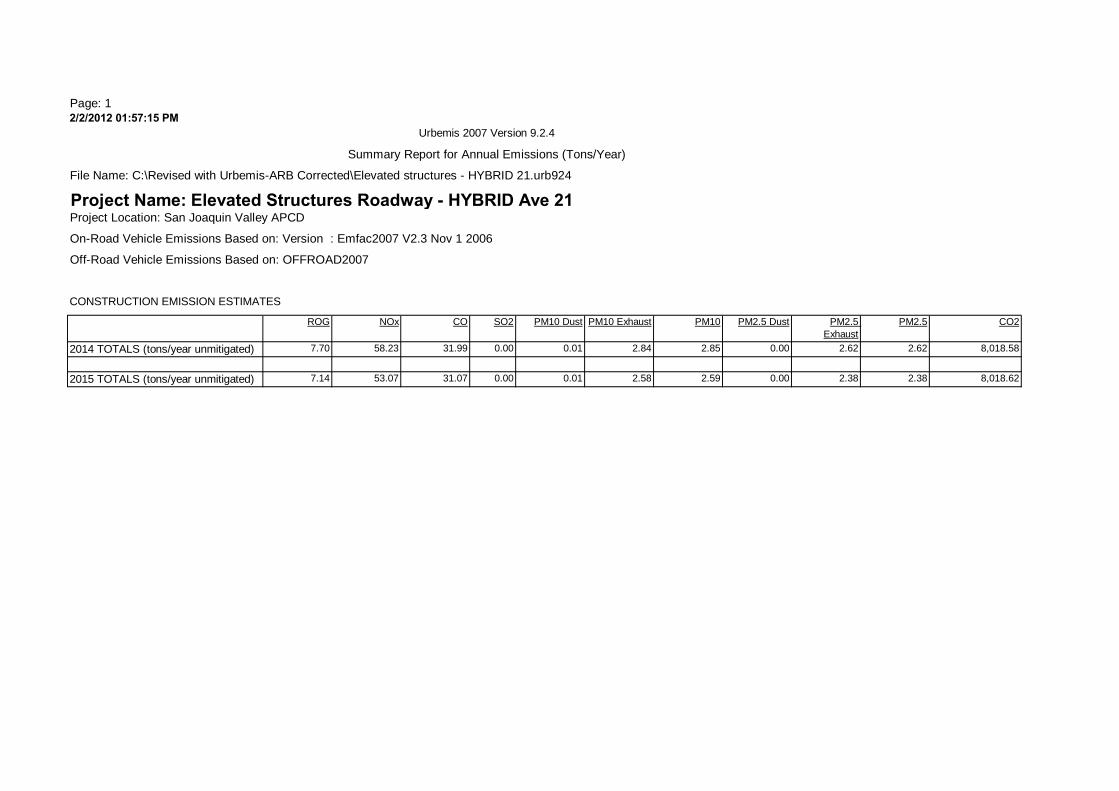
Page: 12/2/2012 01:57:15 PM
ROG NOx CO SO2 PM10 Dust PM10 Exhaust PM10 PM2.5 Exhaust
CO2
7.70 58.23 31.99 0.00 0.01 2.84 2.85 2.62 8,018.58
7.14 53.07 31.07 0.00 0.01 2.58 2.59 2.38 8,018.62
Urbemis 2007 Version 9.2.4
Summary Report for Annual Emissions (Tons/Year)
File Name: C:\Revised with Urbemis-ARB Corrected\Elevated structures - HYBRID 21.urb924
Project Name: Elevated Structures Roadway - HYBRID Ave 21 Project Location: San Joaquin Valley APCD
On-Road Vehicle Emissions Based on: Version : Emfac2007 V2.3 Nov 1 2006
Off-Road Vehicle Emissions Based on: OFFROAD2007
CONSTRUCTION EMISSION ESTIMATES
PM2.5 Dust PM2.5
2014 TOTALS (tons/year unmitigated) 0.00 2.62
2015 TOTALS (tons/year unmitigated) 0.00 2.38
B.2-6 Laying Track

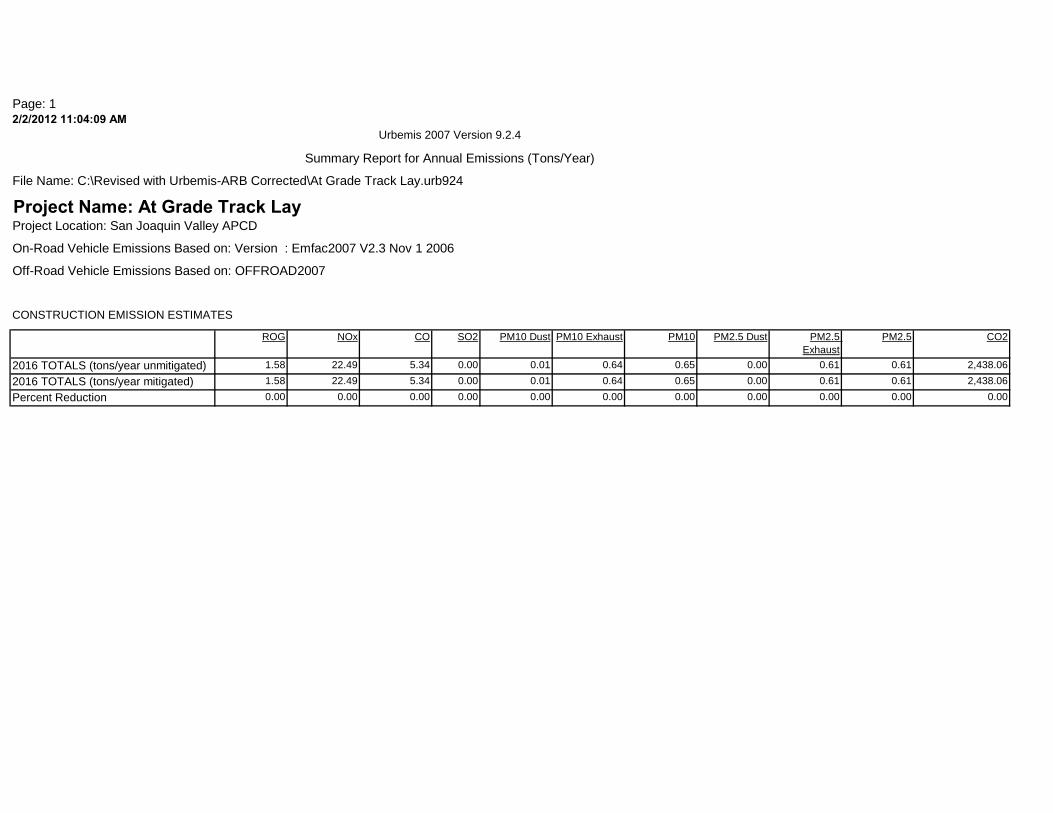
Page: 12/2/2012 11:04:09 AM
ROG NOx CO SO2 PM10 Dust PM10 Exhaust PM10 PM2.5 Exhaust
CO2
1.58 22.49 5.34 0.00 0.01 0.64 0.65 0.61 2,438.06
1.58 22.49 5.34 0.00 0.01 0.64 0.65 0.61 2,438.06
0.00 0.00 0.00 0.00 0.00 0.00 0.00 0.00 0.00
Urbemis 2007 Version 9.2.4
Summary Report for Annual Emissions (Tons/Year)
File Name: C:\Revised with Urbemis-ARB Corrected\At Grade Track Lay.urb924
Project Name: At Grade Track LayProject Location: San Joaquin Valley APCD
On-Road Vehicle Emissions Based on: Version : Emfac2007 V2.3 Nov 1 2006
Off-Road Vehicle Emissions Based on: OFFROAD2007
CONSTRUCTION EMISSION ESTIMATES
PM2.5 Dust PM2.5
2016 TOTALS (tons/year unmitigated) 0.00 0.61
2016 TOTALS (tons/year mitigated) 0.00 0.61
Percent Reduction 0.00 0.00

Page: 12/2/2012 11:11:58 AM
ROG NOx CO SO2 PM10 Dust PM10 Exhaust PM10 PM2.5 Exhaust
CO2
1.83 25.92 6.39 0.00 0.01 0.75 0.76 0.71 2,872.42
1.83 25.92 6.39 0.00 0.01 0.75 0.76 0.71 2,872.42
0.00 0.00 0.00 0.00 0.00 0.00 0.00 0.00 0.00
Urbemis 2007 Version 9.2.4
Summary Report for Annual Emissions (Tons/Year)
File Name: C:\Revised with Urbemis-ARB Corrected\Elevated Track Lay & Retained Fill.urb924
Project Name: Elevated Track Lay Retained FillProject Location: San Joaquin Valley APCD
On-Road Vehicle Emissions Based on: Version : Emfac2007 V2.3 Nov 1 2006
Off-Road Vehicle Emissions Based on: OFFROAD2007
CONSTRUCTION EMISSION ESTIMATES
PM2.5 Dust PM2.5
2016 TOTALS (tons/year unmitigated) 0.00 0.71
2016 TOTALS (tons/year mitigated) 0.00 0.71
Percent Reduction 0.00 0.00
B.2-7 Merced Train Station

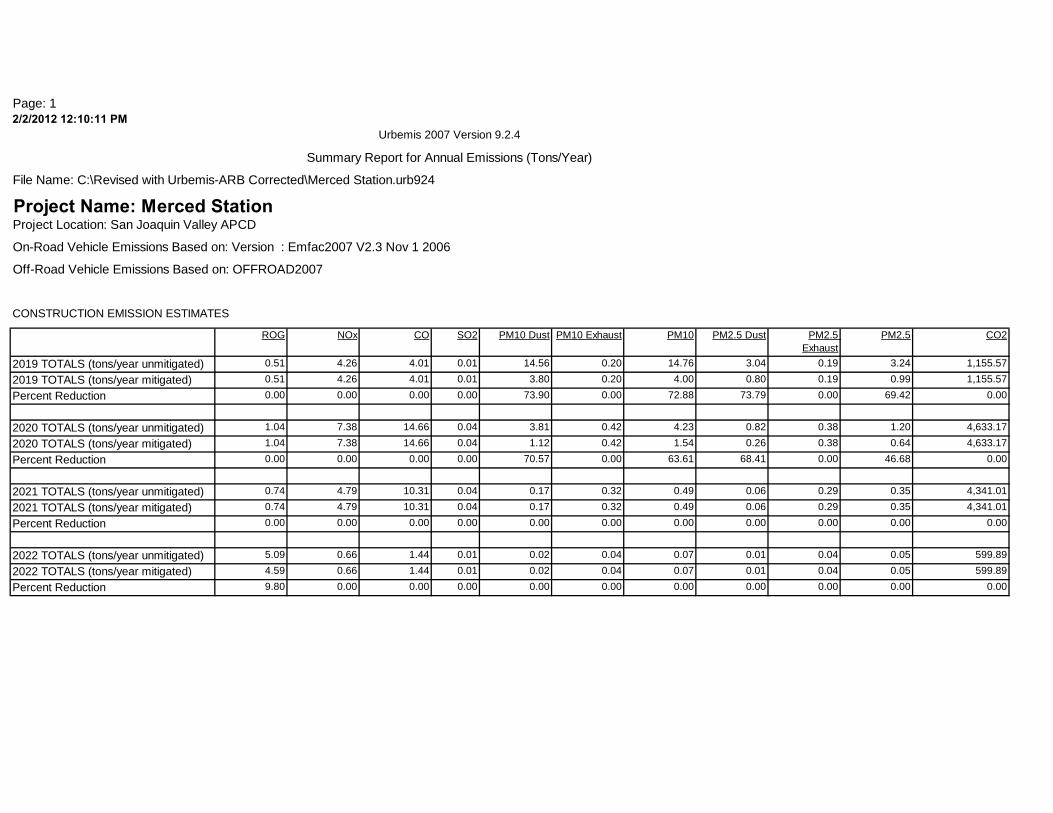
Page: 12/2/2012 12:10:11 PM
ROG NOx CO SO2 PM10 Dust PM10 Exhaust PM10 PM2.5 Exhaust
CO2
0.51 4.26 4.01 0.01 14.56 0.20 14.76 0.19 1,155.57
0.51 4.26 4.01 0.01 3.80 0.20 4.00 0.19 1,155.57
0.00 0.00 0.00 0.00 73.90 0.00 72.88 0.00 0.00
1.04 7.38 14.66 0.04 3.81 0.42 4.23 0.38 4,633.17
1.04 7.38 14.66 0.04 1.12 0.42 1.54 0.38 4,633.17
0.00 0.00 0.00 0.00 70.57 0.00 63.61 0.00 0.00
0.74 4.79 10.31 0.04 0.17 0.32 0.49 0.29 4,341.01
0.74 4.79 10.31 0.04 0.17 0.32 0.49 0.29 4,341.01
0.00 0.00 0.00 0.00 0.00 0.00 0.00 0.00 0.00
5.09 0.66 1.44 0.01 0.02 0.04 0.07 0.04 599.89
4.59 0.66 1.44 0.01 0.02 0.04 0.07 0.04 599.89
9.80 0.00 0.00 0.00 0.00 0.00 0.00 0.00 0.00
Urbemis 2007 Version 9.2.4
Summary Report for Annual Emissions (Tons/Year)
File Name: C:\Revised with Urbemis-ARB Corrected\Merced Station.urb924
Project Name: Merced StationProject Location: San Joaquin Valley APCD
On-Road Vehicle Emissions Based on: Version : Emfac2007 V2.3 Nov 1 2006
Off-Road Vehicle Emissions Based on: OFFROAD2007
CONSTRUCTION EMISSION ESTIMATES
PM2.5 Dust PM2.5
2019 TOTALS (tons/year unmitigated) 3.04 3.24
2019 TOTALS (tons/year mitigated) 0.80 0.99
Percent Reduction 73.79 69.42
2020 TOTALS (tons/year unmitigated) 0.82 1.20
2020 TOTALS (tons/year mitigated) 0.26 0.64
Percent Reduction 68.41 46.68
2021 TOTALS (tons/year unmitigated) 0.06 0.35
2021 TOTALS (tons/year mitigated) 0.06 0.35
Percent Reduction 0.00 0.00
2022 TOTALS (tons/year unmitigated) 0.01 0.05
2022 TOTALS (tons/year mitigated) 0.01 0.05
Percent Reduction 0.00 0.00


B.2-8 Power Stations

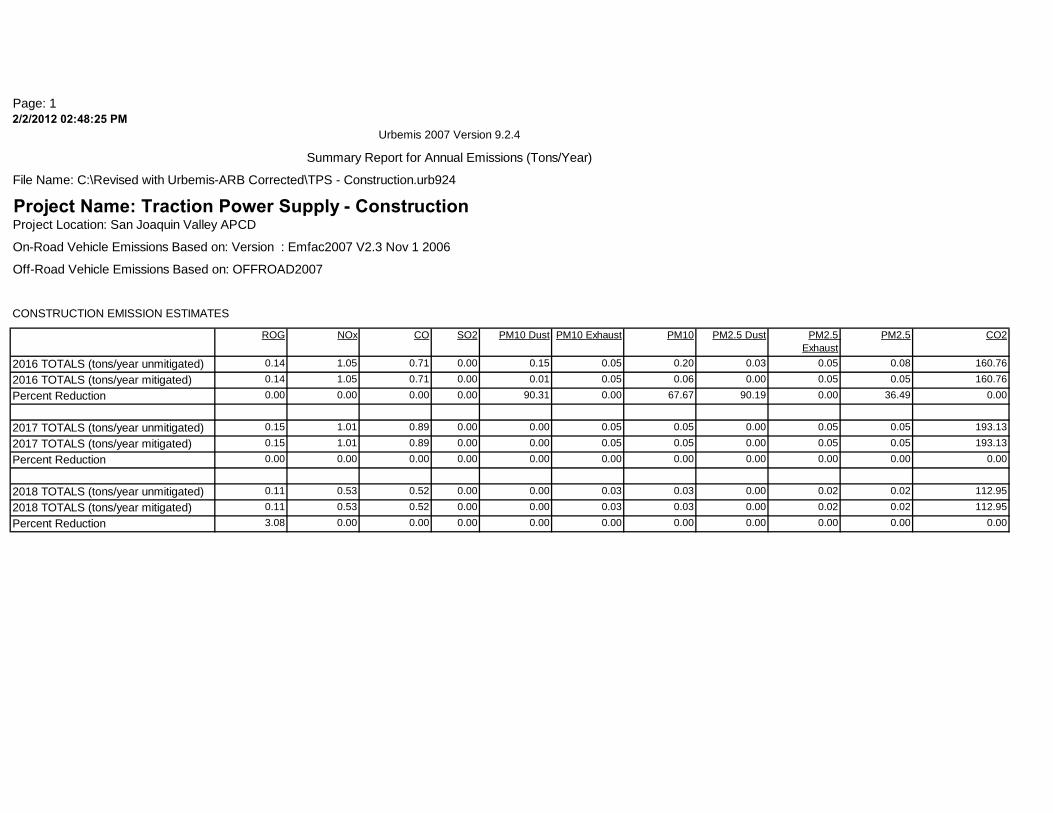
Page: 12/2/2012 02:48:25 PM
ROG NOx CO SO2 PM10 Dust PM10 Exhaust PM10 PM2.5 Exhaust
CO2
0.14 1.05 0.71 0.00 0.15 0.05 0.20 0.05 160.76
0.14 1.05 0.71 0.00 0.01 0.05 0.06 0.05 160.76
0.00 0.00 0.00 0.00 90.31 0.00 67.67 0.00 0.00
0.15 1.01 0.89 0.00 0.00 0.05 0.05 0.05 193.13
0.15 1.01 0.89 0.00 0.00 0.05 0.05 0.05 193.13
0.00 0.00 0.00 0.00 0.00 0.00 0.00 0.00 0.00
0.11 0.53 0.52 0.00 0.00 0.03 0.03 0.02 112.95
0.11 0.53 0.52 0.00 0.00 0.03 0.03 0.02 112.95
3.08 0.00 0.00 0.00 0.00 0.00 0.00 0.00 0.00
Urbemis 2007 Version 9.2.4
Summary Report for Annual Emissions (Tons/Year)
File Name: C:\Revised with Urbemis-ARB Corrected\TPS - Construction.urb924
Project Name: Traction Power Supply - Construction Project Location: San Joaquin Valley APCD
On-Road Vehicle Emissions Based on: Version : Emfac2007 V2.3 Nov 1 2006
Off-Road Vehicle Emissions Based on: OFFROAD2007
CONSTRUCTION EMISSION ESTIMATES
PM2.5 Dust PM2.5
2016 TOTALS (tons/year unmitigated) 0.03 0.08
2016 TOTALS (tons/year mitigated) 0.00 0.05
Percent Reduction 90.19 36.49
2017 TOTALS (tons/year unmitigated) 0.00 0.05
2017 TOTALS (tons/year mitigated) 0.00 0.05
Percent Reduction 0.00 0.00
2018 TOTALS (tons/year unmitigated) 0.00 0.02
2018 TOTALS (tons/year mitigated) 0.00 0.02
Percent Reduction 0.00 0.00
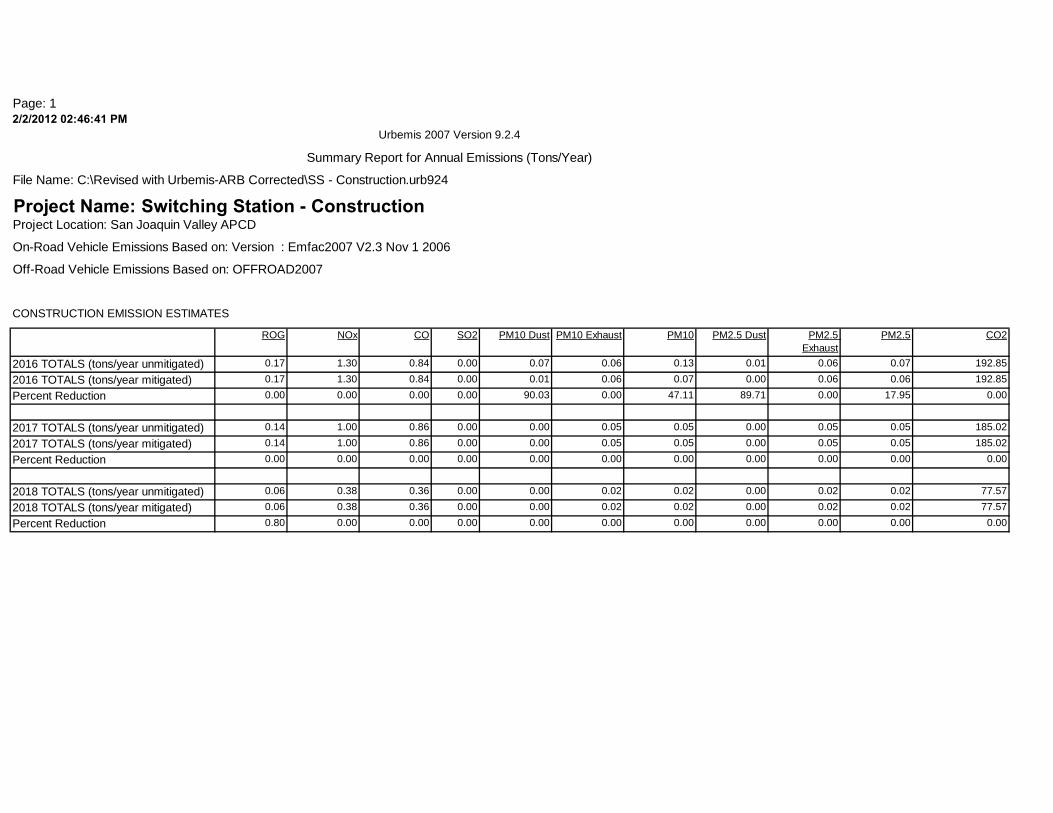
Page: 12/2/2012 02:46:41 PM
ROG NOx CO SO2 PM10 Dust PM10 Exhaust PM10 PM2.5 Exhaust
CO2
0.17 1.30 0.84 0.00 0.07 0.06 0.13 0.06 192.85
0.17 1.30 0.84 0.00 0.01 0.06 0.07 0.06 192.85
0.00 0.00 0.00 0.00 90.03 0.00 47.11 0.00 0.00
0.14 1.00 0.86 0.00 0.00 0.05 0.05 0.05 185.02
0.14 1.00 0.86 0.00 0.00 0.05 0.05 0.05 185.02
0.00 0.00 0.00 0.00 0.00 0.00 0.00 0.00 0.00
0.06 0.38 0.36 0.00 0.00 0.02 0.02 0.02 77.57
0.06 0.38 0.36 0.00 0.00 0.02 0.02 0.02 77.57
0.80 0.00 0.00 0.00 0.00 0.00 0.00 0.00 0.00
Urbemis 2007 Version 9.2.4
Summary Report for Annual Emissions (Tons/Year)
File Name: C:\Revised with Urbemis-ARB Corrected\SS - Construction.urb924
Project Name: Switching Station - Construction Project Location: San Joaquin Valley APCD
On-Road Vehicle Emissions Based on: Version : Emfac2007 V2.3 Nov 1 2006
Off-Road Vehicle Emissions Based on: OFFROAD2007
CONSTRUCTION EMISSION ESTIMATES
PM2.5 Dust PM2.5
2016 TOTALS (tons/year unmitigated) 0.01 0.07
2016 TOTALS (tons/year mitigated) 0.00 0.06
Percent Reduction 89.71 17.95
2017 TOTALS (tons/year unmitigated) 0.00 0.05
2017 TOTALS (tons/year mitigated) 0.00 0.05
Percent Reduction 0.00 0.00
2018 TOTALS (tons/year unmitigated) 0.00 0.02
2018 TOTALS (tons/year mitigated) 0.00 0.02
Percent Reduction 0.00 0.00

Page: 12/2/2012 02:44:48 PM
ROG NOx CO SO2 PM10 Dust PM10 Exhaust PM10 PM2.5 Exhaust
CO2
0.17 1.30 0.84 0.00 0.05 0.06 0.11 0.06 192.85
0.17 1.30 0.84 0.00 0.01 0.06 0.07 0.06 192.85
0.00 0.00 0.00 0.00 89.92 0.00 42.06 0.00 0.00
0.14 1.00 0.86 0.00 0.00 0.05 0.05 0.05 185.02
0.14 1.00 0.86 0.00 0.00 0.05 0.05 0.05 185.02
0.00 0.00 0.00 0.00 0.00 0.00 0.00 0.00 0.00
0.06 0.38 0.36 0.00 0.00 0.02 0.02 0.02 77.57
0.06 0.38 0.36 0.00 0.00 0.02 0.02 0.02 77.57
0.80 0.00 0.00 0.00 0.00 0.00 0.00 0.00 0.00
Urbemis 2007 Version 9.2.4
Summary Report for Annual Emissions (Tons/Year)
File Name: C:\Revised with Urbemis-ARB Corrected\PS - Construction.urb924
Project Name: Paralleling Station - ConstructionProject Location: San Joaquin Valley APCD
On-Road Vehicle Emissions Based on: Version : Emfac2007 V2.3 Nov 1 2006
Off-Road Vehicle Emissions Based on: OFFROAD2007
CONSTRUCTION EMISSION ESTIMATES
PM2.5 Dust PM2.5
2016 TOTALS (tons/year unmitigated) 0.01 0.07
2016 TOTALS (tons/year mitigated) 0.00 0.06
Percent Reduction 89.52 14.95
2017 TOTALS (tons/year unmitigated) 0.00 0.05
2017 TOTALS (tons/year mitigated) 0.00 0.05
Percent Reduction 0.00 0.00
2018 TOTALS (tons/year unmitigated) 0.00 0.02
2018 TOTALS (tons/year mitigated) 0.00 0.02
Percent Reduction 0.00 0.00


B.2-9 Demobilization

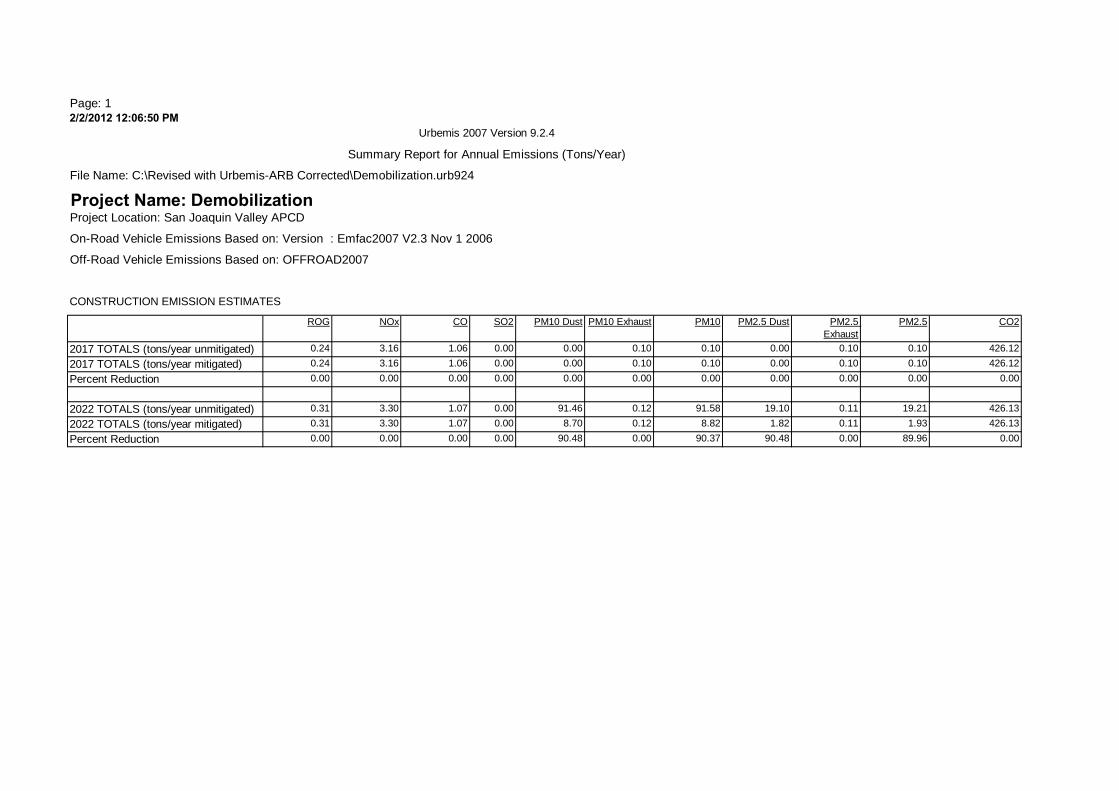
Page: 12/2/2012 12:06:50 PM
ROG NOx CO SO2 PM10 Dust PM10 Exhaust PM10 PM2.5 Exhaust
CO2
0.24 3.16 1.06 0.00 0.00 0.10 0.10 0.10 426.12
0.24 3.16 1.06 0.00 0.00 0.10 0.10 0.10 426.12
0.00 0.00 0.00 0.00 0.00 0.00 0.00 0.00 0.00
0.31 3.30 1.07 0.00 91.46 0.12 91.58 0.11 426.13
0.31 3.30 1.07 0.00 8.70 0.12 8.82 0.11 426.13
0.00 0.00 0.00 0.00 90.48 0.00 90.37 0.00 0.00
Urbemis 2007 Version 9.2.4
Summary Report for Annual Emissions (Tons/Year)
File Name: C:\Revised with Urbemis-ARB Corrected\Demobilization.urb924
Project Name: Demobilization Project Location: San Joaquin Valley APCD
On-Road Vehicle Emissions Based on: Version : Emfac2007 V2.3 Nov 1 2006
Off-Road Vehicle Emissions Based on: OFFROAD2007
CONSTRUCTION EMISSION ESTIMATES
PM2.5 Dust PM2.5
2017 TOTALS (tons/year unmitigated) 0.00 0.10
2017 TOTALS (tons/year mitigated) 0.00 0.10
Percent Reduction 0.00 0.00
2022 TOTALS (tons/year unmitigated) 19.10 19.21
2022 TOTALS (tons/year mitigated) 1.82 1.93
Percent Reduction 90.48 89.96

B.2-10 HMF

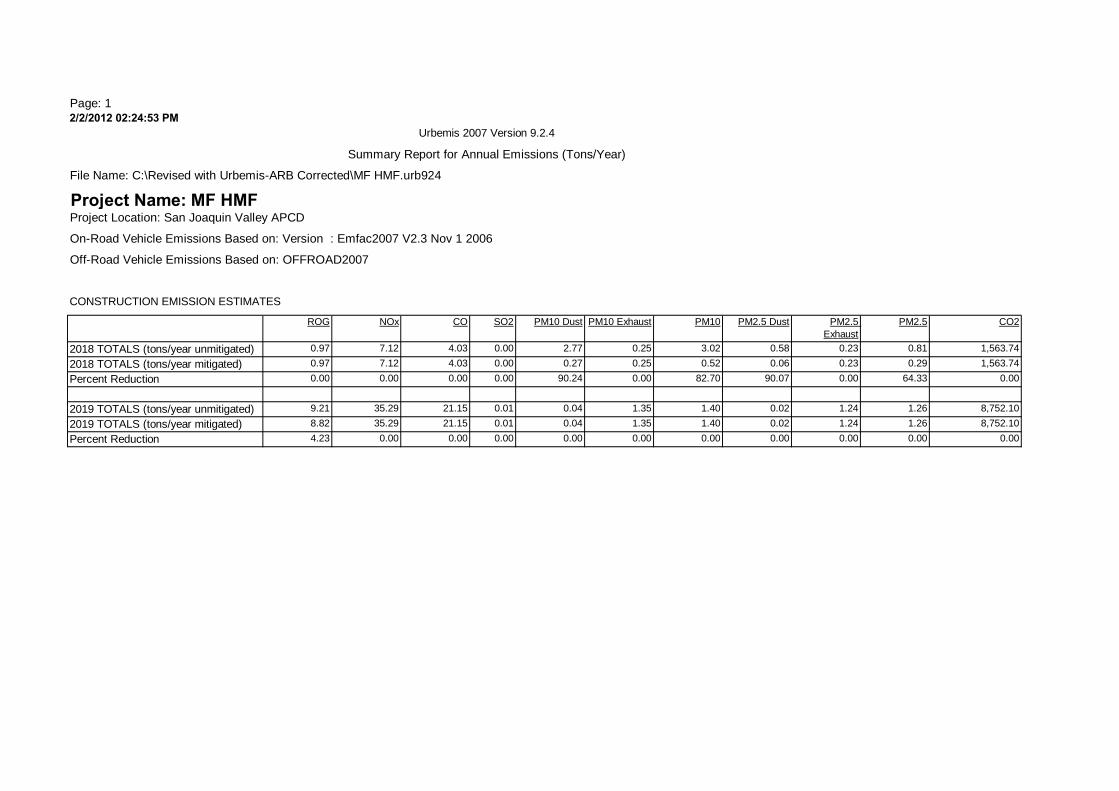
Page: 12/2/2012 02:24:53 PM
ROG NOx CO SO2 PM10 Dust PM10 Exhaust PM10 PM2.5 Exhaust
CO2
0.97 7.12 4.03 0.00 2.77 0.25 3.02 0.23 1,563.74
0.97 7.12 4.03 0.00 0.27 0.25 0.52 0.23 1,563.74
0.00 0.00 0.00 0.00 90.24 0.00 82.70 0.00 0.00
9.21 35.29 21.15 0.01 0.04 1.35 1.40 1.24 8,752.10
8.82 35.29 21.15 0.01 0.04 1.35 1.40 1.24 8,752.10
4.23 0.00 0.00 0.00 0.00 0.00 0.00 0.00 0.00
Urbemis 2007 Version 9.2.4
Summary Report for Annual Emissions (Tons/Year)
File Name: C:\Revised with Urbemis-ARB Corrected\MF HMF.urb924
Project Name: MF HMF Project Location: San Joaquin Valley APCD
On-Road Vehicle Emissions Based on: Version : Emfac2007 V2.3 Nov 1 2006
Off-Road Vehicle Emissions Based on: OFFROAD2007
CONSTRUCTION EMISSION ESTIMATES
PM2.5 Dust PM2.5
2018 TOTALS (tons/year unmitigated) 0.58 0.81
2018 TOTALS (tons/year mitigated) 0.06 0.29
Percent Reduction 90.07 64.33
2019 TOTALS (tons/year unmitigated) 0.02 1.26
2019 TOTALS (tons/year mitigated) 0.02 1.26
Percent Reduction 0.00 0.00
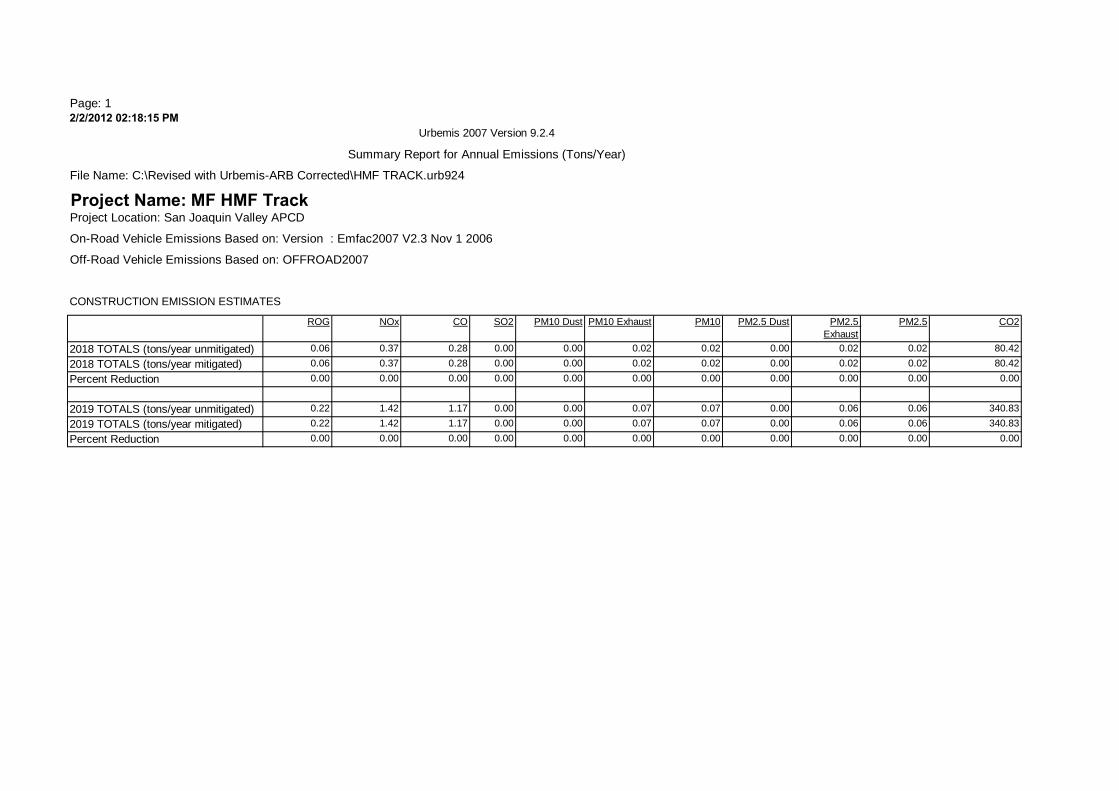
Page: 12/2/2012 02:18:15 PM
ROG NOx CO SO2 PM10 Dust PM10 Exhaust PM10 PM2.5 Exhaust
CO2
0.06 0.37 0.28 0.00 0.00 0.02 0.02 0.02 80.42
0.06 0.37 0.28 0.00 0.00 0.02 0.02 0.02 80.42
0.00 0.00 0.00 0.00 0.00 0.00 0.00 0.00 0.00
0.22 1.42 1.17 0.00 0.00 0.07 0.07 0.06 340.83
0.22 1.42 1.17 0.00 0.00 0.07 0.07 0.06 340.83
0.00 0.00 0.00 0.00 0.00 0.00 0.00 0.00 0.00
Urbemis 2007 Version 9.2.4
Summary Report for Annual Emissions (Tons/Year)
File Name: C:\Revised with Urbemis-ARB Corrected\HMF TRACK.urb924
Project Name: MF HMF Track Project Location: San Joaquin Valley APCD
On-Road Vehicle Emissions Based on: Version : Emfac2007 V2.3 Nov 1 2006
Off-Road Vehicle Emissions Based on: OFFROAD2007
CONSTRUCTION EMISSION ESTIMATES
PM2.5 Dust PM2.5
2018 TOTALS (tons/year unmitigated) 0.00 0.02
2018 TOTALS (tons/year mitigated) 0.00 0.02
Percent Reduction 0.00 0.00
2019 TOTALS (tons/year unmitigated) 0.00 0.06
2019 TOTALS (tons/year mitigated) 0.00 0.06
Percent Reduction 0.00 0.00
B.2-11 Fresno Train Station

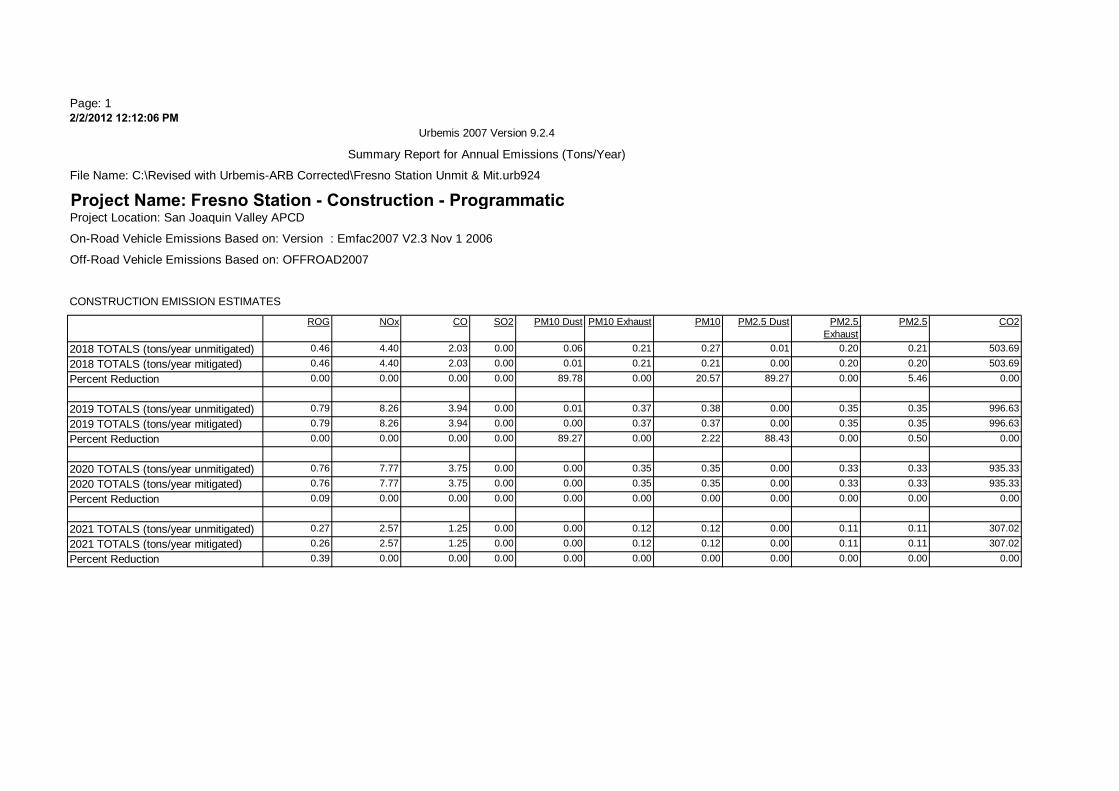
Page: 12/2/2012 12:12:06 PM
ROG NOx CO SO2 PM10 Dust PM10 Exhaust PM10 PM2.5 Exhaust
CO2
0.46 4.40 2.03 0.00 0.06 0.21 0.27 0.20 503.69
0.46 4.40 2.03 0.00 0.01 0.21 0.21 0.20 503.69
0.00 0.00 0.00 0.00 89.78 0.00 20.57 0.00 0.00
0.79 8.26 3.94 0.00 0.01 0.37 0.38 0.35 996.63
0.79 8.26 3.94 0.00 0.00 0.37 0.37 0.35 996.63
0.00 0.00 0.00 0.00 89.27 0.00 2.22 0.00 0.00
0.76 7.77 3.75 0.00 0.00 0.35 0.35 0.33 935.33
0.76 7.77 3.75 0.00 0.00 0.35 0.35 0.33 935.33
0.09 0.00 0.00 0.00 0.00 0.00 0.00 0.00 0.00
0.27 2.57 1.25 0.00 0.00 0.12 0.12 0.11 307.02
0.26 2.57 1.25 0.00 0.00 0.12 0.12 0.11 307.02
0.39 0.00 0.00 0.00 0.00 0.00 0.00 0.00 0.00
Urbemis 2007 Version 9.2.4
Summary Report for Annual Emissions (Tons/Year)
File Name: C:\Revised with Urbemis-ARB Corrected\Fresno Station Unmit & Mit.urb924
Project Name: Fresno Station - Construction - ProgrammaticProject Location: San Joaquin Valley APCD
On-Road Vehicle Emissions Based on: Version : Emfac2007 V2.3 Nov 1 2006
Off-Road Vehicle Emissions Based on: OFFROAD2007
CONSTRUCTION EMISSION ESTIMATES
PM2.5 Dust PM2.5
2018 TOTALS (tons/year unmitigated) 0.01 0.21
2018 TOTALS (tons/year mitigated) 0.00 0.20
Percent Reduction 89.27 5.46
2019 TOTALS (tons/year unmitigated) 0.00 0.35
2019 TOTALS (tons/year mitigated) 0.00 0.35
Percent Reduction 88.43 0.50
2020 TOTALS (tons/year unmitigated) 0.00 0.33
2020 TOTALS (tons/year mitigated) 0.00 0.33
Percent Reduction 0.00 0.00
2021 TOTALS (tons/year unmitigated) 0.00 0.11
2021 TOTALS (tons/year mitigated) 0.00 0.11
Percent Reduction 0.00 0.00

B.3 Road Construction Emissions Model Output

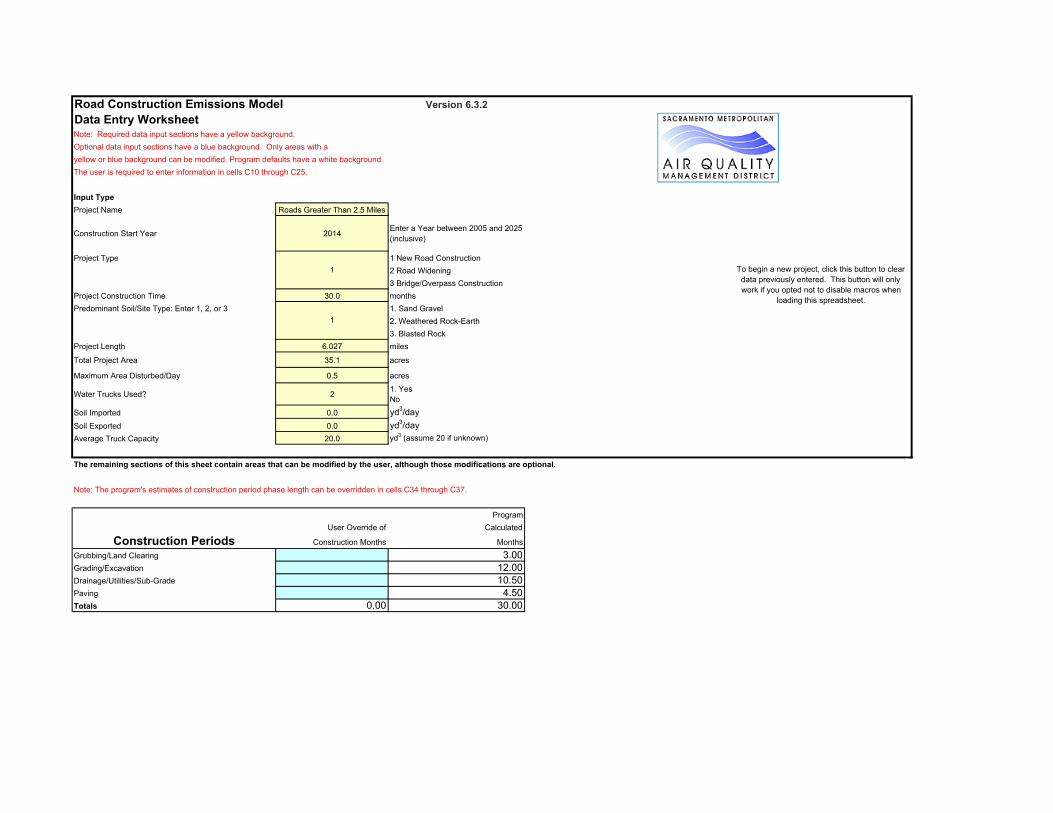
Road Construction Emissions Model Version 6.3.2Data Entry Worksheet
Optional data input sections have a blue background. Only areas with a yellow or blue background can be modified. Program defaults have a white background. The user is required to enter information in cells C10 through C25.
Input TypeProject Name Roads Greater Than 2.5 Miles
Construction Start Year 2014 Enter a Year between 2005 and 2025 (inclusive)
Project Type 1 New Road Construction2 Road Widening3 Bridge/Overpass Construction
Project Construction Time 30.0 monthsPredominant Soil/Site Type: Enter 1, 2, or 3 1. Sand Gravel
2. Weathered Rock-Earth3. Blasted Rock
Project Length 6.027 miles
Total Project Area 35.1 acres
Maximum Area Disturbed/Day 0.5 acres
Water Trucks Used? 2 1. Yes No
Soil Imported 0.0 yd3/daySoil Exported 0.0 yd3/dayAverage Truck Capacity 20.0 yd3 (assume 20 if unknown)
The remaining sections of this sheet contain areas that can be modified by the user, although those modifications are optional.
To begin a new project, click this button to clear data previously entered. This button will only work if you opted not to disable macros when
loading this spreadsheet.
Note: Required data input sections have a yellow background.
1
1
Note: The program's estimates of construction period phase length can be overridden in cells C34 through C37.
Program User Override of Calculated
Construction Periods Construction Months Months
Grubbing/Land Clearing 3.00Grading/Excavation 12.00Drainage/Utilities/Sub-Grade 10.50Paving 4.50Totals 0.00 30.00
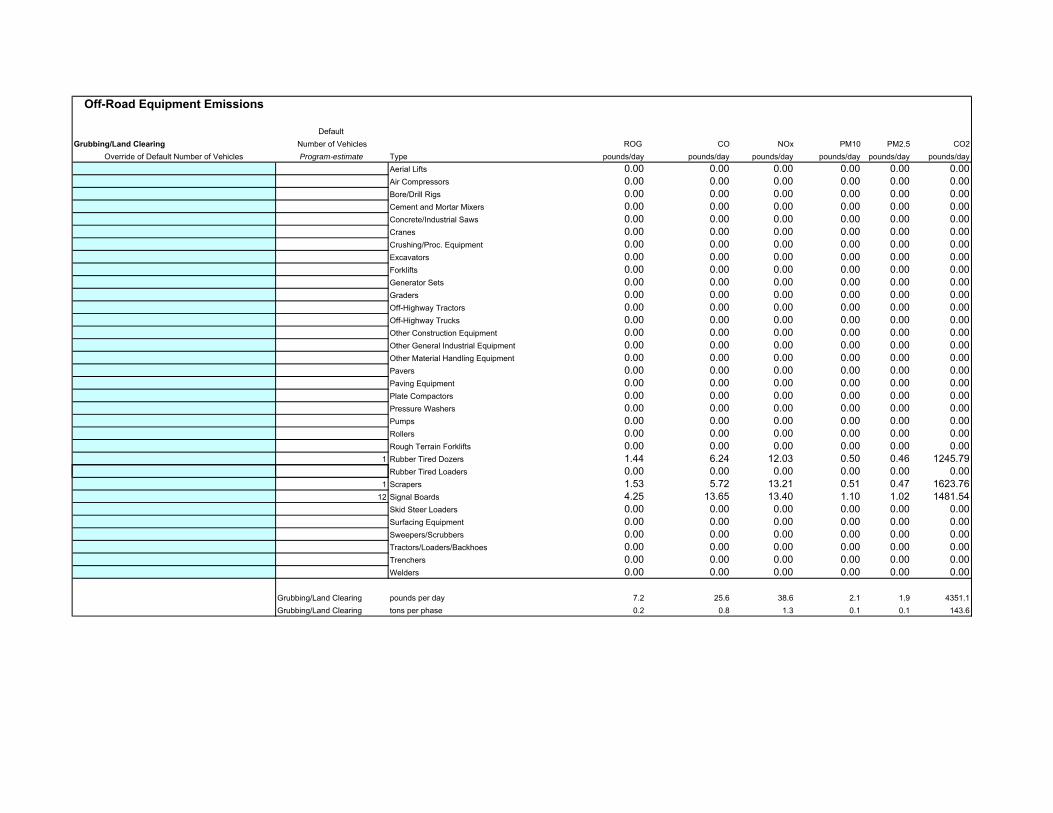
Off-Road Equipment Emissions
Default Grubbing/Land Clearing Number of Vehicles ROG CO NOx PM10 PM2.5 CO2
Override of Default Number of Vehicles Program-estimate Type pounds/day pounds/day pounds/day pounds/day pounds/day pounds/dayAerial Lifts 0.00 0.00 0.00 0.00 0.00 0.00Air Compressors 0.00 0.00 0.00 0.00 0.00 0.00Bore/Drill Rigs 0.00 0.00 0.00 0.00 0.00 0.00Cement and Mortar Mixers 0.00 0.00 0.00 0.00 0.00 0.00Concrete/Industrial Saws 0.00 0.00 0.00 0.00 0.00 0.00Cranes 0.00 0.00 0.00 0.00 0.00 0.00Crushing/Proc. Equipment 0.00 0.00 0.00 0.00 0.00 0.00Excavators 0.00 0.00 0.00 0.00 0.00 0.00Forklifts 0.00 0.00 0.00 0.00 0.00 0.00Generator Sets 0.00 0.00 0.00 0.00 0.00 0.00Graders 0.00 0.00 0.00 0.00 0.00 0.00Off-Highway Tractors 0.00 0.00 0.00 0.00 0.00 0.00Off-Highway Trucks 0.00 0.00 0.00 0.00 0.00 0.00Other Construction Equipment 0.00 0.00 0.00 0.00 0.00 0.00Other General Industrial Equipment 0.00 0.00 0.00 0.00 0.00 0.00Other Material Handling Equipment 0.00 0.00 0.00 0.00 0.00 0.00Pavers 0.00 0.00 0.00 0.00 0.00 0.00Paving Equipment 0.00 0.00 0.00 0.00 0.00 0.00Plate Compactors 0.00 0.00 0.00 0.00 0.00 0.00Pressure Washers 0.00 0.00 0.00 0.00 0.00 0.00Pumps 0.00 0.00 0.00 0.00 0.00 0.00Rollers 0.00 0.00 0.00 0.00 0.00 0.00Rough Terrain Forklifts 0.00 0.00 0.00 0.00 0.00 0.00
1 Rubber Tired Dozers 1.44 6.24 12.03 0.50 0.46 1245.79Rubber Tired Loaders 0.00 0.00 0.00 0.00 0.00 0.00
1 Scrapers 1.53 5.72 13.21 0.51 0.47 1623.7612 Signal Boards 4.25 13.65 13.40 1.10 1.02 1481.54
Skid Steer Loaders 0.00 0.00 0.00 0.00 0.00 0.00Surfacing Equipment 0.00 0.00 0.00 0.00 0.00 0.00Sweepers/Scrubbers 0.00 0.00 0.00 0.00 0.00 0.00Tractors/Loaders/Backhoes 0.00 0.00 0.00 0.00 0.00 0.00Trenchers 0.00 0.00 0.00 0.00 0.00 0.00Welders 0.00 0.00 0.00 0.00 0.00 0.00
Grubbing/Land Clearing pounds per day 7.2 25.6 38.6 2.1 1.9 4351.1Grubbing/Land Clearing tons per phase 0.2 0.8 1.3 0.1 0.1 143.6

DefaultGrading/Excavation Number of Vehicles ROG CO NOx PM10 PM2.5 CO2
Override of Default Number of Vehicles Program-estimate Type pounds/day pounds/day pounds/day pounds/day pounds/day pounds/dayAerial Lifts 0.00 0.00 0.00 0.00 0.00 0.00Air Compressors 0.00 0.00 0.00 0.00 0.00 0.00Bore/Drill Rigs 0.00 0.00 0.00 0.00 0.00 0.00Cement and Mortar Mixers 0.00 0.00 0.00 0.00 0.00 0.00Concrete/Industrial Saws 0.00 0.00 0.00 0.00 0.00 0.00
0 Cranes 0.00 0.00 0.00 0.00 0.00 0.00Crushing/Proc. Equipment 0.00 0.00 0.00 0.00 0.00 0.00
1 Excavators 0.54 3.25 3.96 0.22 0.20 547.36Forklifts 0.00 0.00 0.00 0.00 0.00 0.00Generator Sets 0.00 0.00 0.00 0.00 0.00 0.00
1 Graders 0.72 3.83 5.38 0.30 0.27 647.87Off-Highway Tractors 0.00 0.00 0.00 0.00 0.00 0.00Off-Highway Trucks 0.00 0.00 0.00 0.00 0.00 0.00
0 Other Construction Equipment 0.02 0.09 0.11 0.01 0.01 14.39Other General Industrial Equipment 0.00 0.00 0.00 0.00 0.00 0.00Other Material Handling Equipment 0.00 0.00 0.00 0.00 0.00 0.00Pavers 0.00 0.00 0.00 0.00 0.00 0.00Paving Equipment 0.00 0.00 0.00 0.00 0.00 0.00Plate Compactors 0.00 0.00 0.00 0.00 0.00 0.00Pressure Washers 0.00 0.00 0.00 0.00 0.00 0.00Pumps 0.00 0.00 0.00 0.00 0.00 0.00Rollers 0.00 0.00 0.00 0.00 0.00 0.00Rough Terrain Forklifts 0.00 0.00 0.00 0.00 0.00 0.00Rubber Tired Dozers 0.00 0.00 0.00 0.00 0.00 0.00
1 Rubber Tired Loaders 0.50 2.70 3.77 0.21 0.19 458.861 Scrapers 1.51 5.64 12.95 0.50 0.46 1623.76
12 Signal Boards 4.14 13.55 13.28 1.08 0.99 1481.540 00 0 00 0 00 0 00 0 00 0 00Skid Steer Loaders 0.00 0.00 0.00 0.00 0.00 0.00
Surfacing Equipment 0.00 0.00 0.00 0.00 0.00 0.00Sweepers/Scrubbers 0.00 0.00 0.00 0.00 0.00 0.00Tractors/Loaders/Backhoes 0.00 0.00 0.00 0.00 0.00 0.00Trenchers 0.00 0.00 0.00 0.00 0.00 0.00Welders 0.00 0.00 0.00 0.00 0.00 0.00
Grading/Excavation pounds per day 7.4 29.1 39.4 2.3 2.1 4773.8Grading tons per phase 1.0 3.8 5.2 0.3 0.3 630.1

DefaultDrainage/Utilities/Subgrade Number of Vehicles ROG CO NOx PM10 PM2.5 CO2
Override of Default Number of Vehicles Program-estimate pounds/day pounds/day pounds/day pounds/day pounds/day pounds/dayAerial Lifts 0.00 0.00 0.00 0.00 0.00 0.00Air Compressors 0.00 0.00 0.00 0.00 0.00 0.00Bore/Drill Rigs 0.00 0.00 0.00 0.00 0.00 0.00Cement and Mortar Mixers 0.00 0.00 0.00 0.00 0.00 0.00Concrete/Industrial Saws 0.00 0.00 0.00 0.00 0.00 0.00Cranes 0.00 0.00 0.00 0.00 0.00 0.00Crushing/Proc. Equipment 0.00 0.00 0.00 0.00 0.00 0.00Excavators 0.00 0.00 0.00 0.00 0.00 0.00Forklifts 0.00 0.00 0.00 0.00 0.00 0.00Generator Sets 0.00 0.00 0.00 0.00 0.00 0.00
1 Graders 0.68 3.83 4.93 0.27 0.25 647.87Off-Highway Tractors 0.00 0.00 0.00 0.00 0.00 0.00Off-Highway Trucks 0.00 0.00 0.00 0.00 0.00 0.00Other Construction Equipment 0.00 0.00 0.00 0.00 0.00 0.00Other General Industrial Equipment 0.00 0.00 0.00 0.00 0.00 0.00Other Material Handling Equipment 0.00 0.00 0.00 0.00 0.00 0.00Pavers 0.00 0.00 0.00 0.00 0.00 0.00Paving Equipment 0.00 0.00 0.00 0.00 0.00 0.00
1 Plate Compactors 0.02 0.09 0.11 0.00 0.00 14.83Pressure Washers 0.00 0.00 0.00 0.00 0.00 0.00Pumps 0.00 0.00 0.00 0.00 0.00 0.00Rollers 0.00 0.00 0.00 0.00 0.00 0.00Rough Terrain Forklifts 0.00 0.00 0.00 0.00 0.00 0.00Rubber Tired Dozers 0.00 0.00 0.00 0.00 0.00 0.00Rubber Tired Loaders 0.00 0.00 0.00 0.00 0.00 0.00
1 Scrapers 1.45 5.35 12.05 0.46 0.43 1623.7612 Signal Boards 3.77 13.17 12.83 0.99 0.91 1481.54
0 00 0 00 0 00 0 00 0 00 0 00Skid Steer Loaders 0.00 0.00 0.00 0.00 0.00 0.00Surfacing Equipment 0.00 0.00 0.00 0.00 0.00 0.00Sweepers/Scrubbers 0.00 0.00 0.00 0.00 0.00 0.00Tractors/Loaders/Backhoes 0.00 0.00 0.00 0.00 0.00 0.00
1 Trenchers 0.62 2.51 3.82 0.32 0.29 353.84Welders 0.00 0.00 0.00 0.00 0.00 0.00
Drainage pounds per day 6.5 24.9 33.7 2.0 1.9 4121.8Drainage tons per phase 0.8 2.9 3.9 0.2 0.2 476.1
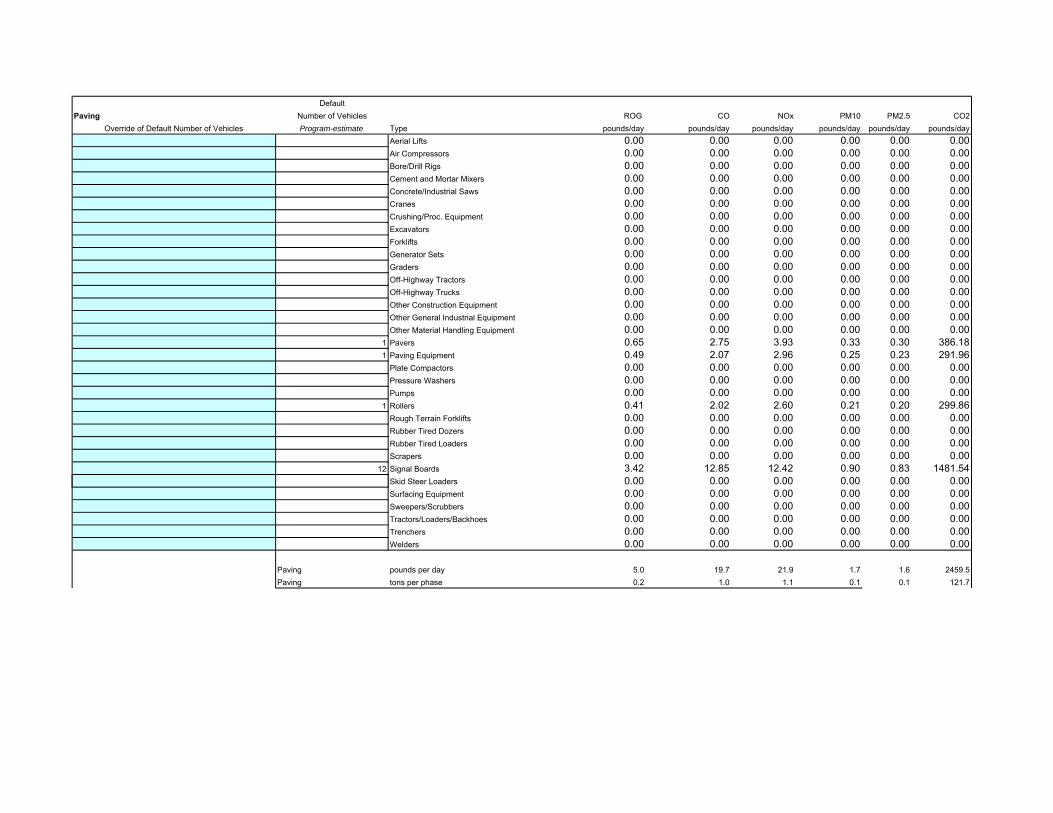
DefaultPaving Number of Vehicles ROG CO NOx PM10 PM2.5 CO2
Override of Default Number of Vehicles Program-estimate Type pounds/day pounds/day pounds/day pounds/day pounds/day pounds/dayAerial Lifts 0.00 0.00 0.00 0.00 0.00 0.00Air Compressors 0.00 0.00 0.00 0.00 0.00 0.00Bore/Drill Rigs 0.00 0.00 0.00 0.00 0.00 0.00Cement and Mortar Mixers 0.00 0.00 0.00 0.00 0.00 0.00Concrete/Industrial Saws 0.00 0.00 0.00 0.00 0.00 0.00Cranes 0.00 0.00 0.00 0.00 0.00 0.00Crushing/Proc. Equipment 0.00 0.00 0.00 0.00 0.00 0.00Excavators 0.00 0.00 0.00 0.00 0.00 0.00Forklifts 0.00 0.00 0.00 0.00 0.00 0.00Generator Sets 0.00 0.00 0.00 0.00 0.00 0.00Graders 0.00 0.00 0.00 0.00 0.00 0.00Off-Highway Tractors 0.00 0.00 0.00 0.00 0.00 0.00Off-Highway Trucks 0.00 0.00 0.00 0.00 0.00 0.00Other Construction Equipment 0.00 0.00 0.00 0.00 0.00 0.00Other General Industrial Equipment 0.00 0.00 0.00 0.00 0.00 0.00Other Material Handling Equipment 0.00 0.00 0.00 0.00 0.00 0.00
1 Pavers 0.65 2.75 3.93 0.33 0.30 386.181 Paving Equipment 0.49 2.07 2.96 0.25 0.23 291.96
Plate Compactors 0.00 0.00 0.00 0.00 0.00 0.00Pressure Washers 0.00 0.00 0.00 0.00 0.00 0.00Pumps 0.00 0.00 0.00 0.00 0.00 0.00
1 Rollers 0.41 2.02 2.60 0.21 0.20 299.86Rough Terrain Forklifts 0.00 0.00 0.00 0.00 0.00 0.00Rubber Tired Dozers 0.00 0.00 0.00 0.00 0.00 0.00Rubber Tired Loaders 0.00 0.00 0.00 0.00 0.00 0.00Scrapers 0.00 0.00 0.00 0.00 0.00 0.00
12 Signal Boards 3.42 12.85 12.42 0.90 0.83 1481.540 00 0 00 0 00 0 00 0 00 0 00Skid Steer Loaders 0.00 0.00 0.00 0.00 0.00 0.00
Surfacing Equipment 0.00 0.00 0.00 0.00 0.00 0.00Sweepers/Scrubbers 0.00 0.00 0.00 0.00 0.00 0.00Tractors/Loaders/Backhoes 0.00 0.00 0.00 0.00 0.00 0.00Trenchers 0.00 0.00 0.00 0.00 0.00 0.00Welders 0.00 0.00 0.00 0.00 0.00 0.00
Paving pounds per day 5.0 19.7 21.9 1.7 1.6 2459.5Paving tons per phase 0.2 1.0 1.1 0.1 0.1 121.7

Road Construction Emissions Model Version 6.3.2Data Entry Worksheet
Optional data input sections have a blue background. Only areas with a yellow or blue background can be modified. Program defaults have a white background. The user is required to enter information in cells C10 through C25.
Input TypeProject Name Roads Less Than 2.5 Miles
Construction Start Year 2015 Enter a Year between 2005 and 2025 (inclusive)
Project Type 1 New Road Construction2 Road Widening3 Bridge/Overpass Construction
Project Construction Time 24.0 monthsPredominant Soil/Site Type: Enter 1, 2, or 3 1. Sand Gravel
2. Weathered Rock-Earth3. Blasted Rock
Project Length 1.948 miles
Total Project Area 11.3 acres
Maximum Area Disturbed/Day 0.5 acres
Water Trucks Used? 2 1. Yes No
Soil Imported 0.0 yd3/daySoil Exported 0.0 yd3/dayAverage Truck Capacity 20.0 yd3 (assume 20 if unknown)
The remaining sections of this sheet contain areas that can be modified by the user, although those modifications are optional.
To begin a new project, click this button to clear data previously entered. This button will only work if you opted not to disable macros when
loading this spreadsheet.
Note: Required data input sections have a yellow background.
1
1
Note: The program's estimates of construction period phase length can be overridden in cells C34 through C37.
Program User Override of Calculated
Construction Periods Construction Months Months
Grubbing/Land Clearing 2.40Grading/Excavation 9.60Drainage/Utilities/Sub-Grade 8.40Paving 3.60Totals 0.00 24.00

Off-Road Equipment Emissions
Default Grubbing/Land Clearing Number of Vehicles ROG CO NOx PM10 PM2.5 CO2
Override of Default Number of Vehicles Program-estimate Type pounds/day pounds/day pounds/day pounds/day pounds/day pounds/dayAerial Lifts 0.00 0.00 0.00 0.00 0.00 0.00Air Compressors 0.00 0.00 0.00 0.00 0.00 0.00Bore/Drill Rigs 0.00 0.00 0.00 0.00 0.00 0.00Cement and Mortar Mixers 0.00 0.00 0.00 0.00 0.00 0.00Concrete/Industrial Saws 0.00 0.00 0.00 0.00 0.00 0.00Cranes 0.00 0.00 0.00 0.00 0.00 0.00Crushing/Proc. Equipment 0.00 0.00 0.00 0.00 0.00 0.00Excavators 0.00 0.00 0.00 0.00 0.00 0.00Forklifts 0.00 0.00 0.00 0.00 0.00 0.00Generator Sets 0.00 0.00 0.00 0.00 0.00 0.00Graders 0.00 0.00 0.00 0.00 0.00 0.00Off-Highway Tractors 0.00 0.00 0.00 0.00 0.00 0.00Off-Highway Trucks 0.00 0.00 0.00 0.00 0.00 0.00Other Construction Equipment 0.00 0.00 0.00 0.00 0.00 0.00Other General Industrial Equipment 0.00 0.00 0.00 0.00 0.00 0.00Other Material Handling Equipment 0.00 0.00 0.00 0.00 0.00 0.00Pavers 0.00 0.00 0.00 0.00 0.00 0.00Paving Equipment 0.00 0.00 0.00 0.00 0.00 0.00Plate Compactors 0.00 0.00 0.00 0.00 0.00 0.00Pressure Washers 0.00 0.00 0.00 0.00 0.00 0.00Pumps 0.00 0.00 0.00 0.00 0.00 0.00Rollers 0.00 0.00 0.00 0.00 0.00 0.00Rough Terrain Forklifts 0.00 0.00 0.00 0.00 0.00 0.00
1 Rubber Tired Dozers 1.38 5.84 11.27 0.46 0.43 1245.79Rubber Tired Loaders 0.00 0.00 0.00 0.00 0.00 0.00
1 Scrapers 1.46 5.39 12.19 0.47 0.43 1623.764 Signal Boards 1.24 4.28 4.17 0.32 0.30 478.85
Skid Steer Loaders 0.00 0.00 0.00 0.00 0.00 0.00Surfacing Equipment 0.00 0.00 0.00 0.00 0.00 0.00Sweepers/Scrubbers 0.00 0.00 0.00 0.00 0.00 0.00Tractors/Loaders/Backhoes 0.00 0.00 0.00 0.00 0.00 0.00Trenchers 0.00 0.00 0.00 0.00 0.00 0.00Welders 0.00 0.00 0.00 0.00 0.00 0.00
Grubbing/Land Clearing pounds per day 4.1 15.5 27.6 1.3 1.2 3348.4Grubbing/Land Clearing tons per phase 0.1 0.4 0.7 0.0 0.0 88.4

DefaultGrading/Excavation Number of Vehicles ROG CO NOx PM10 PM2.5 CO2
Override of Default Number of Vehicles Program-estimate Type pounds/day pounds/day pounds/day pounds/day pounds/day pounds/dayAerial Lifts 0.00 0.00 0.00 0.00 0.00 0.00Air Compressors 0.00 0.00 0.00 0.00 0.00 0.00Bore/Drill Rigs 0.00 0.00 0.00 0.00 0.00 0.00Cement and Mortar Mixers 0.00 0.00 0.00 0.00 0.00 0.00Concrete/Industrial Saws 0.00 0.00 0.00 0.00 0.00 0.00
0 Cranes 0.00 0.00 0.00 0.00 0.00 0.00Crushing/Proc. Equipment 0.00 0.00 0.00 0.00 0.00 0.00
1 Excavators 0.51 3.25 3.62 0.20 0.18 547.36Forklifts 0.00 0.00 0.00 0.00 0.00 0.00Generator Sets 0.00 0.00 0.00 0.00 0.00 0.00
1 Graders 0.68 3.83 5.00 0.28 0.25 647.87Off-Highway Tractors 0.00 0.00 0.00 0.00 0.00 0.00Off-Highway Trucks 0.00 0.00 0.00 0.00 0.00 0.00
0 Other Construction Equipment 0.01 0.09 0.11 0.01 0.01 14.39Other General Industrial Equipment 0.00 0.00 0.00 0.00 0.00 0.00Other Material Handling Equipment 0.00 0.00 0.00 0.00 0.00 0.00Pavers 0.00 0.00 0.00 0.00 0.00 0.00Paving Equipment 0.00 0.00 0.00 0.00 0.00 0.00Plate Compactors 0.00 0.00 0.00 0.00 0.00 0.00Pressure Washers 0.00 0.00 0.00 0.00 0.00 0.00Pumps 0.00 0.00 0.00 0.00 0.00 0.00Rollers 0.00 0.00 0.00 0.00 0.00 0.00Rough Terrain Forklifts 0.00 0.00 0.00 0.00 0.00 0.00Rubber Tired Dozers 0.00 0.00 0.00 0.00 0.00 0.00
1 Rubber Tired Loaders 0.47 2.70 3.49 0.19 0.18 458.861 Scrapers 1.46 5.39 12.19 0.47 0.43 1623.764 Signal Boards 1.24 4.28 4.17 0.32 0.30 478.85
0 00 0 00 0 00 0 00 0 00 0 00Skid Steer Loaders 0.00 0.00 0.00 0.00 0.00 0.00Surfacing Equipment 0.00 0.00 0.00 0.00 0.00 0.00Sweepers/Scrubbers 0.00 0.00 0.00 0.00 0.00 0.00Tractors/Loaders/Backhoes 0.00 0.00 0.00 0.00 0.00 0.00Trenchers 0.00 0.00 0.00 0.00 0.00 0.00Welders 0.00 0.00 0.00 0.00 0.00 0.00
Grading/Excavation pounds per day 4.4 19.5 28.6 1.5 1.3 3771.1Grading tons per phase 0.5 2.1 3.0 0.2 0.1 398.2

DefaultDrainage/Utilities/Subgrade Number of Vehicles ROG CO NOx PM10 PM2.5 CO2
Override of Default Number of Vehicles Program-estimate pounds/day pounds/day pounds/day pounds/day pounds/day pounds/dayAerial Lifts 0.00 0.00 0.00 0.00 0.00 0.00Air Compressors 0.00 0.00 0.00 0.00 0.00 0.00Bore/Drill Rigs 0.00 0.00 0.00 0.00 0.00 0.00Cement and Mortar Mixers 0.00 0.00 0.00 0.00 0.00 0.00Concrete/Industrial Saws 0.00 0.00 0.00 0.00 0.00 0.00Cranes 0.00 0.00 0.00 0.00 0.00 0.00Crushing/Proc. Equipment 0.00 0.00 0.00 0.00 0.00 0.00Excavators 0.00 0.00 0.00 0.00 0.00 0.00Forklifts 0.00 0.00 0.00 0.00 0.00 0.00Generator Sets 0.00 0.00 0.00 0.00 0.00 0.00
1 Graders 0.64 3.82 4.52 0.25 0.23 647.87Off-Highway Tractors 0.00 0.00 0.00 0.00 0.00 0.00Off-Highway Trucks 0.00 0.00 0.00 0.00 0.00 0.00Other Construction Equipment 0.00 0.00 0.00 0.00 0.00 0.00Other General Industrial Equipment 0.00 0.00 0.00 0.00 0.00 0.00Other Material Handling Equipment 0.00 0.00 0.00 0.00 0.00 0.00Pavers 0.00 0.00 0.00 0.00 0.00 0.00Paving Equipment 0.00 0.00 0.00 0.00 0.00 0.00
1 Plate Compactors 0.02 0.09 0.11 0.00 0.00 14.83Pressure Washers 0.00 0.00 0.00 0.00 0.00 0.00Pumps 0.00 0.00 0.00 0.00 0.00 0.00Rollers 0.00 0.00 0.00 0.00 0.00 0.00Rough Terrain Forklifts 0.00 0.00 0.00 0.00 0.00 0.00Rubber Tired Dozers 0.00 0.00 0.00 0.00 0.00 0.00Rubber Tired Loaders 0.00 0.00 0.00 0.00 0.00 0.00
1 Scrapers 1.38 5.10 11.22 0.43 0.40 1623.764 Signal Boards 1.11 4.15 4.01 0.29 0.27 478.85
0 00 0 00 0 00 0 00 0 00 0 00Skid Steer Loaders 0.00 0.00 0.00 0.00 0.00 0.00Surfacing Equipment 0.00 0.00 0.00 0.00 0.00 0.00Sweepers/Scrubbers 0.00 0.00 0.00 0.00 0.00 0.00Tractors/Loaders/Backhoes 0.00 0.00 0.00 0.00 0.00 0.00
1 Trenchers 0.59 2.49 3.63 0.30 0.28 353.84Welders 0.00 0.00 0.00 0.00 0.00 0.00
Drainage pounds per day 3.7 15.7 23.5 1.3 1.2 3119.1Drainage tons per phase 0.3 1.4 2.2 0.1 0.1 288.2
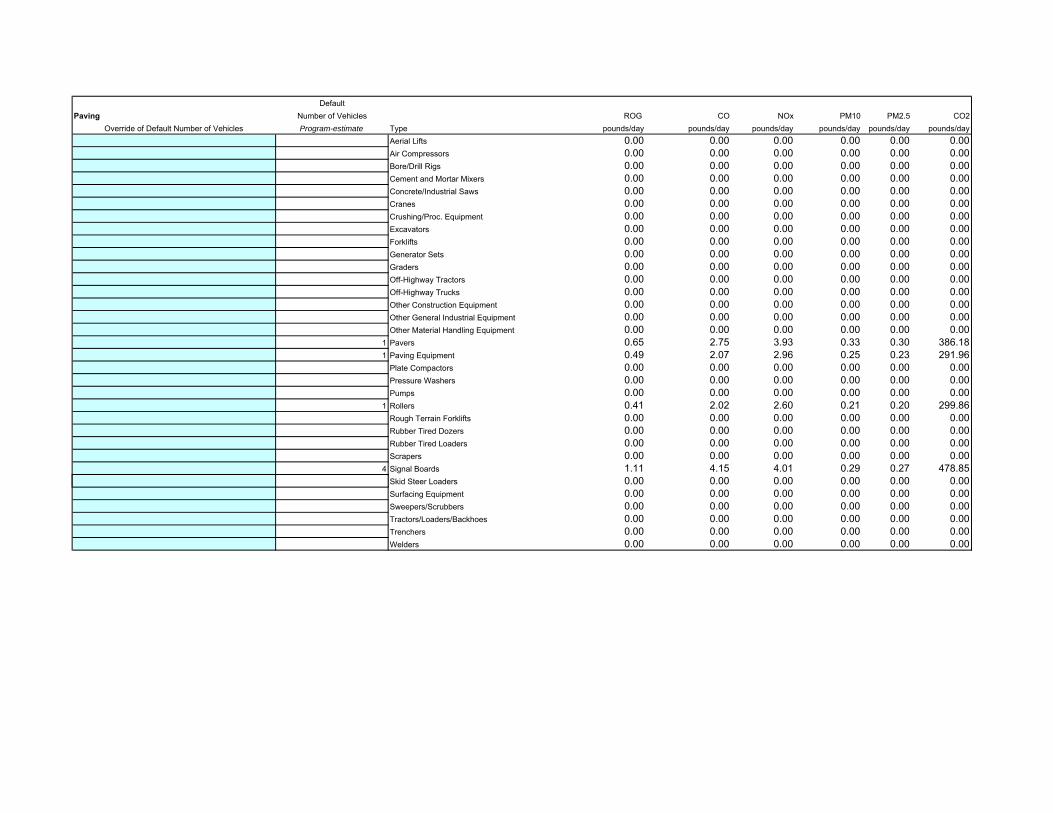
DefaultPaving Number of Vehicles ROG CO NOx PM10 PM2.5 CO2
Override of Default Number of Vehicles Program-estimate Type pounds/day pounds/day pounds/day pounds/day pounds/day pounds/dayAerial Lifts 0.00 0.00 0.00 0.00 0.00 0.00Air Compressors 0.00 0.00 0.00 0.00 0.00 0.00Bore/Drill Rigs 0.00 0.00 0.00 0.00 0.00 0.00Cement and Mortar Mixers 0.00 0.00 0.00 0.00 0.00 0.00Concrete/Industrial Saws 0.00 0.00 0.00 0.00 0.00 0.00Cranes 0.00 0.00 0.00 0.00 0.00 0.00Crushing/Proc. Equipment 0.00 0.00 0.00 0.00 0.00 0.00Excavators 0.00 0.00 0.00 0.00 0.00 0.00Forklifts 0.00 0.00 0.00 0.00 0.00 0.00Generator Sets 0.00 0.00 0.00 0.00 0.00 0.00Graders 0.00 0.00 0.00 0.00 0.00 0.00Off-Highway Tractors 0.00 0.00 0.00 0.00 0.00 0.00Off-Highway Trucks 0.00 0.00 0.00 0.00 0.00 0.00Other Construction Equipment 0.00 0.00 0.00 0.00 0.00 0.00Other General Industrial Equipment 0.00 0.00 0.00 0.00 0.00 0.00Other Material Handling Equipment 0.00 0.00 0.00 0.00 0.00 0.00
1 Pavers 0.65 2.75 3.93 0.33 0.30 386.181 Paving Equipment 0.49 2.07 2.96 0.25 0.23 291.96
Plate Compactors 0.00 0.00 0.00 0.00 0.00 0.00Pressure Washers 0.00 0.00 0.00 0.00 0.00 0.00Pumps 0.00 0.00 0.00 0.00 0.00 0.00
1 Rollers 0.41 2.02 2.60 0.21 0.20 299.86Rough Terrain Forklifts 0.00 0.00 0.00 0.00 0.00 0.00Rubber Tired Dozers 0.00 0.00 0.00 0.00 0.00 0.00Rubber Tired Loaders 0.00 0.00 0.00 0.00 0.00 0.00Scrapers 0.00 0.00 0.00 0.00 0.00 0.00
4 Signal Boards 1.11 4.15 4.01 0.29 0.27 478.850 00 0 00 0 00 0 00 0 00 0 00Skid Steer Loaders 0.00 0.00 0.00 0.00 0.00 0.00
Surfacing Equipment 0.00 0.00 0.00 0.00 0.00 0.00Sweepers/Scrubbers 0.00 0.00 0.00 0.00 0.00 0.00Tractors/Loaders/Backhoes 0.00 0.00 0.00 0.00 0.00 0.00Trenchers 0.00 0.00 0.00 0.00 0.00 0.00Welders 0.00 0.00 0.00 0.00 0.00 0.00

Road Construction Emissions Model Version 6.3.2Data Entry Worksheet
Optional data input sections have a blue background. Only areas with a yellow or blue background can be modified. Program defaults have a white background. The user is required to enter information in cells C10 through C25.
Input TypeProject Name Roads Less Than 1 Mile
Construction Start Year 2017 Enter a Year between 2005 and 2025 (inclusive)
Project Type 1 New Road Construction2 Road Widening3 Bridge/Overpass Construction
Project Construction Time 12.0 monthsPredominant Soil/Site Type: Enter 1, 2, or 3 1. Sand Gravel
2. Weathered Rock-Earth3. Blasted Rock
Project Length 0.414 miles
Total Project Area 2.4 acres
Maximum Area Disturbed/Day 0.5 acres
Water Trucks Used? 2 1. Yes No
Soil Imported 0.0 yd3/daySoil Exported 0.0 yd3/dayAverage Truck Capacity 20.0 yd3 (assume 20 if unknown)
The remaining sections of this sheet contain areas that can be modified by the user, although those modifications are optional.
To begin a new project, click this button to clear data previously entered. This button will only work if you opted not to disable macros when
loading this spreadsheet.
Note: Required data input sections have a yellow background.
1
1
Note: The program's estimates of construction period phase length can be overridden in cells C34 through C37.
Program User Override of Calculated
Construction Periods Construction Months Months
Grubbing/Land Clearing 1.20Grading/Excavation 4.80Drainage/Utilities/Sub-Grade 4.20Paving 1.80Totals 0.00 12.00

Off-Road Equipment Emissions
Default Grubbing/Land Clearing Number of Vehicles ROG CO NOx PM10 PM2.5 CO2
Override of Default Number of Vehicles Program-estimate Type pounds/day pounds/day pounds/day pounds/day pounds/day pounds/dayAerial Lifts 0.00 0.00 0.00 0.00 0.00 0.00Air Compressors 0.00 0.00 0.00 0.00 0.00 0.00Bore/Drill Rigs 0.00 0.00 0.00 0.00 0.00 0.00Cement and Mortar Mixers 0.00 0.00 0.00 0.00 0.00 0.00Concrete/Industrial Saws 0.00 0.00 0.00 0.00 0.00 0.00Cranes 0.00 0.00 0.00 0.00 0.00 0.00Crushing/Proc. Equipment 0.00 0.00 0.00 0.00 0.00 0.00Excavators 0.00 0.00 0.00 0.00 0.00 0.00Forklifts 0.00 0.00 0.00 0.00 0.00 0.00Generator Sets 0.00 0.00 0.00 0.00 0.00 0.00Graders 0.00 0.00 0.00 0.00 0.00 0.00Off-Highway Tractors 0.00 0.00 0.00 0.00 0.00 0.00Off-Highway Trucks 0.00 0.00 0.00 0.00 0.00 0.00Other Construction Equipment 0.00 0.00 0.00 0.00 0.00 0.00Other General Industrial Equipment 0.00 0.00 0.00 0.00 0.00 0.00Other Material Handling Equipment 0.00 0.00 0.00 0.00 0.00 0.00Pavers 0.00 0.00 0.00 0.00 0.00 0.00Paving Equipment 0.00 0.00 0.00 0.00 0.00 0.00Plate Compactors 0.00 0.00 0.00 0.00 0.00 0.00Pressure Washers 0.00 0.00 0.00 0.00 0.00 0.00Pumps 0.00 0.00 0.00 0.00 0.00 0.00Rollers 0.00 0.00 0.00 0.00 0.00 0.00Rough Terrain Forklifts 0.00 0.00 0.00 0.00 0.00 0.00
1 Rubber Tired Dozers 1.25 5.15 9.83 0.40 0.37 1245.79Rubber Tired Loaders 0.00 0.00 0.00 0.00 0.00 0.00
1 Scrapers 1.31 4.84 10.31 0.39 0.36 1623.761 Signal Boards 0.21 0.86 0.82 0.05 0.05 101.77
Skid Steer Loaders 0.00 0.00 0.00 0.00 0.00 0.00Surfacing Equipment 0.00 0.00 0.00 0.00 0.00 0.00Sweepers/Scrubbers 0.00 0.00 0.00 0.00 0.00 0.00Tractors/Loaders/Backhoes 0.00 0.00 0.00 0.00 0.00 0.00Trenchers 0.00 0.00 0.00 0.00 0.00 0.00Welders 0.00 0.00 0.00 0.00 0.00 0.00
Grubbing/Land Clearing pounds per day 2.8 10.9 21.0 0.8 0.8 2971.3Grubbing/Land Clearing tons per phase 0.0 0.1 0.3 0.0 0.0 39.2
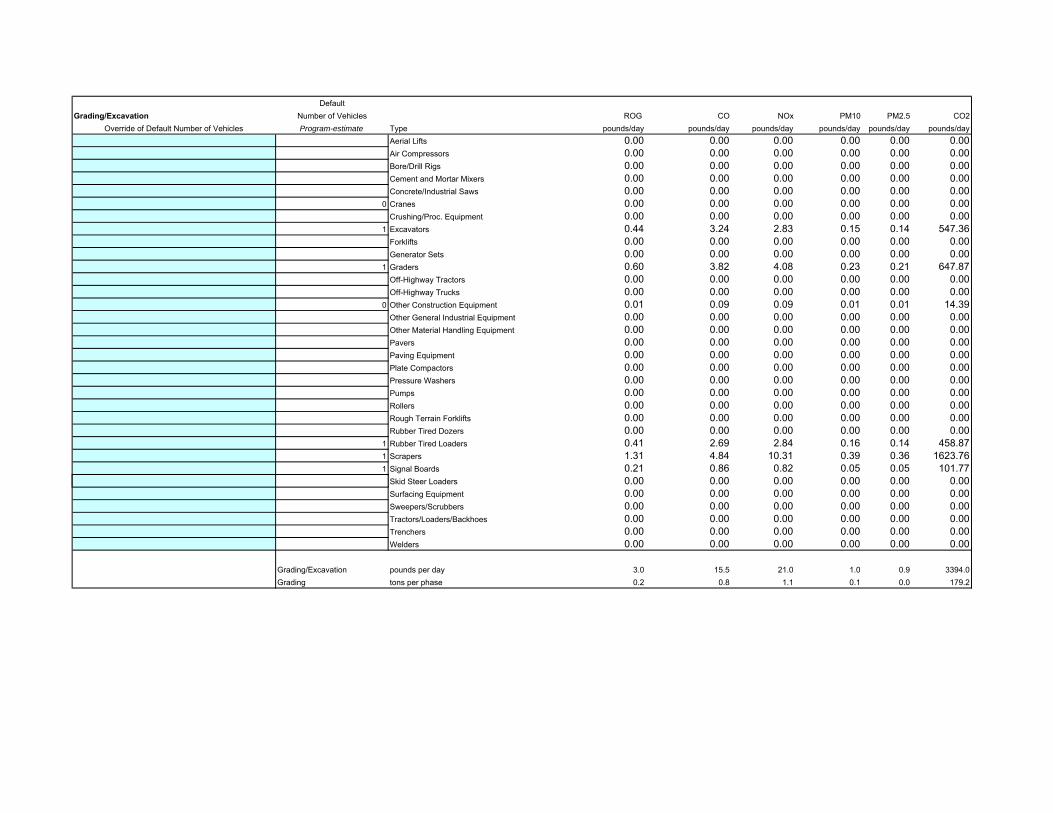
DefaultGrading/Excavation Number of Vehicles ROG CO NOx PM10 PM2.5 CO2
Override of Default Number of Vehicles Program-estimate Type pounds/day pounds/day pounds/day pounds/day pounds/day pounds/dayAerial Lifts 0.00 0.00 0.00 0.00 0.00 0.00Air Compressors 0.00 0.00 0.00 0.00 0.00 0.00Bore/Drill Rigs 0.00 0.00 0.00 0.00 0.00 0.00Cement and Mortar Mixers 0.00 0.00 0.00 0.00 0.00 0.00Concrete/Industrial Saws 0.00 0.00 0.00 0.00 0.00 0.00
0 Cranes 0.00 0.00 0.00 0.00 0.00 0.00Crushing/Proc. Equipment 0.00 0.00 0.00 0.00 0.00 0.00
1 Excavators 0.44 3.24 2.83 0.15 0.14 547.36Forklifts 0.00 0.00 0.00 0.00 0.00 0.00Generator Sets 0.00 0.00 0.00 0.00 0.00 0.00
1 Graders 0.60 3.82 4.08 0.23 0.21 647.87Off-Highway Tractors 0.00 0.00 0.00 0.00 0.00 0.00Off-Highway Trucks 0.00 0.00 0.00 0.00 0.00 0.00
0 Other Construction Equipment 0.01 0.09 0.09 0.01 0.01 14.39Other General Industrial Equipment 0.00 0.00 0.00 0.00 0.00 0.00Other Material Handling Equipment 0.00 0.00 0.00 0.00 0.00 0.00Pavers 0.00 0.00 0.00 0.00 0.00 0.00Paving Equipment 0.00 0.00 0.00 0.00 0.00 0.00Plate Compactors 0.00 0.00 0.00 0.00 0.00 0.00Pressure Washers 0.00 0.00 0.00 0.00 0.00 0.00Pumps 0.00 0.00 0.00 0.00 0.00 0.00Rollers 0.00 0.00 0.00 0.00 0.00 0.00Rough Terrain Forklifts 0.00 0.00 0.00 0.00 0.00 0.00Rubber Tired Dozers 0.00 0.00 0.00 0.00 0.00 0.00
1 Rubber Tired Loaders 0.41 2.69 2.84 0.16 0.14 458.871 Scrapers 1.31 4.84 10.31 0.39 0.36 1623.761 Signal Boards 0.21 0.86 0.82 0.05 0.05 101.77
0 00 0 00 0 00 0 00 0 00 0 00Skid Steer Loaders 0.00 0.00 0.00 0.00 0.00 0.00Surfacing Equipment 0.00 0.00 0.00 0.00 0.00 0.00Sweepers/Scrubbers 0.00 0.00 0.00 0.00 0.00 0.00Tractors/Loaders/Backhoes 0.00 0.00 0.00 0.00 0.00 0.00Trenchers 0.00 0.00 0.00 0.00 0.00 0.00Welders 0.00 0.00 0.00 0.00 0.00 0.00
Grading/Excavation pounds per day 3.0 15.5 21.0 1.0 0.9 3394.0Grading tons per phase 0.2 0.8 1.1 0.1 0.0 179.2
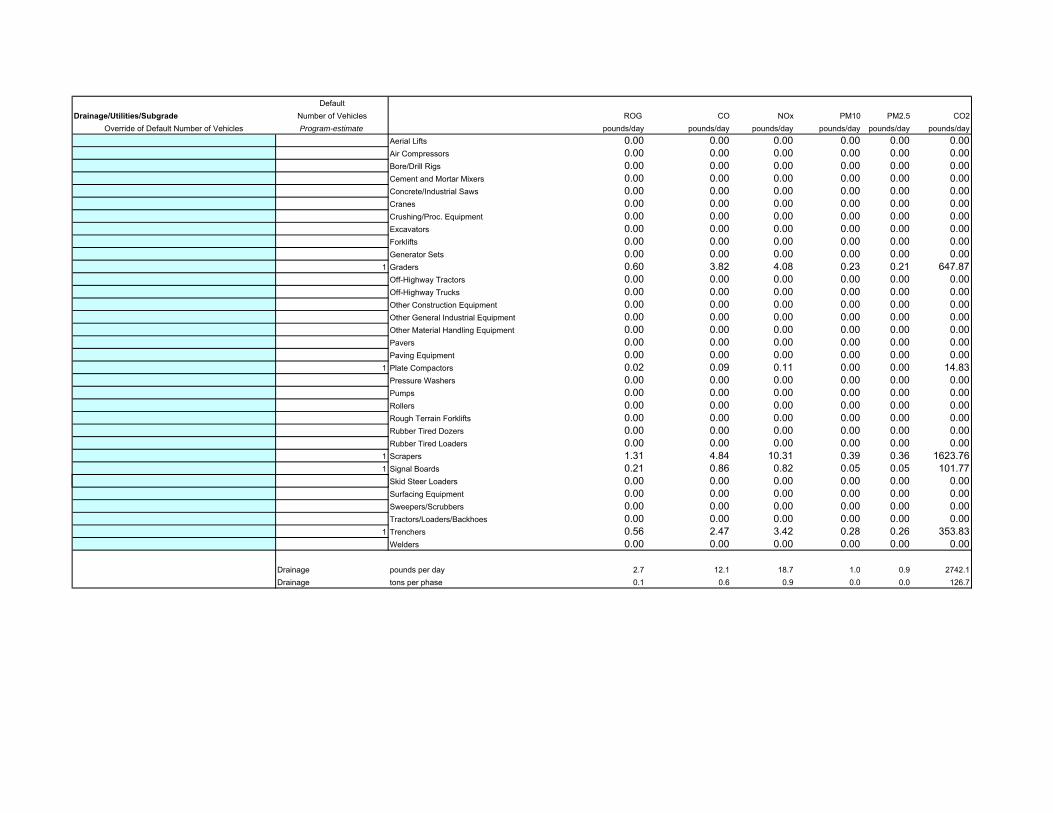
DefaultDrainage/Utilities/Subgrade Number of Vehicles ROG CO NOx PM10 PM2.5 CO2
Override of Default Number of Vehicles Program-estimate pounds/day pounds/day pounds/day pounds/day pounds/day pounds/dayAerial Lifts 0.00 0.00 0.00 0.00 0.00 0.00Air Compressors 0.00 0.00 0.00 0.00 0.00 0.00Bore/Drill Rigs 0.00 0.00 0.00 0.00 0.00 0.00Cement and Mortar Mixers 0.00 0.00 0.00 0.00 0.00 0.00Concrete/Industrial Saws 0.00 0.00 0.00 0.00 0.00 0.00Cranes 0.00 0.00 0.00 0.00 0.00 0.00Crushing/Proc. Equipment 0.00 0.00 0.00 0.00 0.00 0.00Excavators 0.00 0.00 0.00 0.00 0.00 0.00Forklifts 0.00 0.00 0.00 0.00 0.00 0.00Generator Sets 0.00 0.00 0.00 0.00 0.00 0.00
1 Graders 0.60 3.82 4.08 0.23 0.21 647.87Off-Highway Tractors 0.00 0.00 0.00 0.00 0.00 0.00Off-Highway Trucks 0.00 0.00 0.00 0.00 0.00 0.00Other Construction Equipment 0.00 0.00 0.00 0.00 0.00 0.00Other General Industrial Equipment 0.00 0.00 0.00 0.00 0.00 0.00Other Material Handling Equipment 0.00 0.00 0.00 0.00 0.00 0.00Pavers 0.00 0.00 0.00 0.00 0.00 0.00Paving Equipment 0.00 0.00 0.00 0.00 0.00 0.00
1 Plate Compactors 0.02 0.09 0.11 0.00 0.00 14.83Pressure Washers 0.00 0.00 0.00 0.00 0.00 0.00Pumps 0.00 0.00 0.00 0.00 0.00 0.00Rollers 0.00 0.00 0.00 0.00 0.00 0.00Rough Terrain Forklifts 0.00 0.00 0.00 0.00 0.00 0.00Rubber Tired Dozers 0.00 0.00 0.00 0.00 0.00 0.00Rubber Tired Loaders 0.00 0.00 0.00 0.00 0.00 0.00
1 Scrapers 1.31 4.84 10.31 0.39 0.36 1623.761 Signal Boards 0.21 0.86 0.82 0.05 0.05 101.77
0 00 0 00 0 00 0 00 0 00 0 00Skid Steer Loaders 0.00 0.00 0.00 0.00 0.00 0.00Surfacing Equipment 0.00 0.00 0.00 0.00 0.00 0.00Sweepers/Scrubbers 0.00 0.00 0.00 0.00 0.00 0.00Tractors/Loaders/Backhoes 0.00 0.00 0.00 0.00 0.00 0.00
1 Trenchers 0.56 2.47 3.42 0.28 0.26 353.83Welders 0.00 0.00 0.00 0.00 0.00 0.00
Drainage pounds per day 2.7 12.1 18.7 1.0 0.9 2742.1Drainage tons per phase 0.1 0.6 0.9 0.0 0.0 126.7

DefaultPaving Number of Vehicles ROG CO NOx PM10 PM2.5 CO2
Override of Default Number of Vehicles Program-estimate Type pounds/day pounds/day pounds/day pounds/day pounds/day pounds/dayAerial Lifts 0.00 0.00 0.00 0.00 0.00 0.00Air Compressors 0.00 0.00 0.00 0.00 0.00 0.00Bore/Drill Rigs 0.00 0.00 0.00 0.00 0.00 0.00Cement and Mortar Mixers 0.00 0.00 0.00 0.00 0.00 0.00Concrete/Industrial Saws 0.00 0.00 0.00 0.00 0.00 0.00Cranes 0.00 0.00 0.00 0.00 0.00 0.00Crushing/Proc. Equipment 0.00 0.00 0.00 0.00 0.00 0.00Excavators 0.00 0.00 0.00 0.00 0.00 0.00Forklifts 0.00 0.00 0.00 0.00 0.00 0.00Generator Sets 0.00 0.00 0.00 0.00 0.00 0.00Graders 0.00 0.00 0.00 0.00 0.00 0.00Off-Highway Tractors 0.00 0.00 0.00 0.00 0.00 0.00Off-Highway Trucks 0.00 0.00 0.00 0.00 0.00 0.00Other Construction Equipment 0.00 0.00 0.00 0.00 0.00 0.00Other General Industrial Equipment 0.00 0.00 0.00 0.00 0.00 0.00Other Material Handling Equipment 0.00 0.00 0.00 0.00 0.00 0.00
1 Pavers 0.61 2.73 3.69 0.31 0.28 386.181 Paving Equipment 0.46 2.05 2.78 0.23 0.21 291.96
Plate Compactors 0.00 0.00 0.00 0.00 0.00 0.00Pressure Washers 0.00 0.00 0.00 0.00 0.00 0.00Pumps 0.00 0.00 0.00 0.00 0.00 0.00
1 Rollers 0.38 2.01 2.42 0.19 0.18 299.86Rough Terrain Forklifts 0.00 0.00 0.00 0.00 0.00 0.00Rubber Tired Dozers 0.00 0.00 0.00 0.00 0.00 0.00Rubber Tired Loaders 0.00 0.00 0.00 0.00 0.00 0.00Scrapers 0.00 0.00 0.00 0.00 0.00 0.00
1 Signal Boards 0.21 0.86 0.82 0.05 0.05 101.770 00 0 00 0 00 0 00 0 00 0 00Skid Steer Loaders 0.00 0.00 0.00 0.00 0.00 0.00
Surfacing Equipment 0.00 0.00 0.00 0.00 0.00 0.00Sweepers/Scrubbers 0.00 0.00 0.00 0.00 0.00 0.00Tractors/Loaders/Backhoes 0.00 0.00 0.00 0.00 0.00 0.00Trenchers 0.00 0.00 0.00 0.00 0.00 0.00Welders 0.00 0.00 0.00 0.00 0.00 0.00
Paving pounds per day 1.7 7.7 9.7 0.8 0.7 1079.8Paving tons per phase 0.0 0.2 0.2 0.0 0.0 21.4

Road Construction Emissions Model Version 6.3.2Data Entry Worksheet
Optional data input sections have a blue background. Only areas with a yellow or blue background can be modified. Program defaults have a white background. The user is required to enter information in cells C10 through C25.
Input TypeProject Name Structures
Construction Start Year 2013 Enter a Year between 2005 and 2025 (inclusive)
Project Type 1 New Road Construction2 Road Widening3 Bridge/Overpass Construction
Project Construction Time 12.0 monthsPredominant Soil/Site Type: Enter 1, 2, or 3 1. Sand Gravel
2. Weathered Rock-Earth3. Blasted Rock
Project Length 0.103 miles
Total Project Area 0.6 acres
Maximum Area Disturbed/Day 0.5 acres
Water Trucks Used? 2 1. Yes No
Soil Imported 0.0 yd3/daySoil Exported 0.0 yd3/dayAverage Truck Capacity 20.0 yd3 (assume 20 if unknown)
The remaining sections of this sheet contain areas that can be modified by the user, although those modifications are optional.
To begin a new project, click this button to clear data previously entered. This button will only work if you opted not to disable macros when
loading this spreadsheet.
Note: Required data input sections have a yellow background.
3
1
Note: The program's estimates of construction period phase length can be overridden in cells C34 through C37.
Program User Override of Calculated
Construction Periods Construction Months Months
Grubbing/Land Clearing 1.20Grading/Excavation 4.80Drainage/Utilities/Sub-Grade 4.20Paving 1.80Totals 0.00 12.00
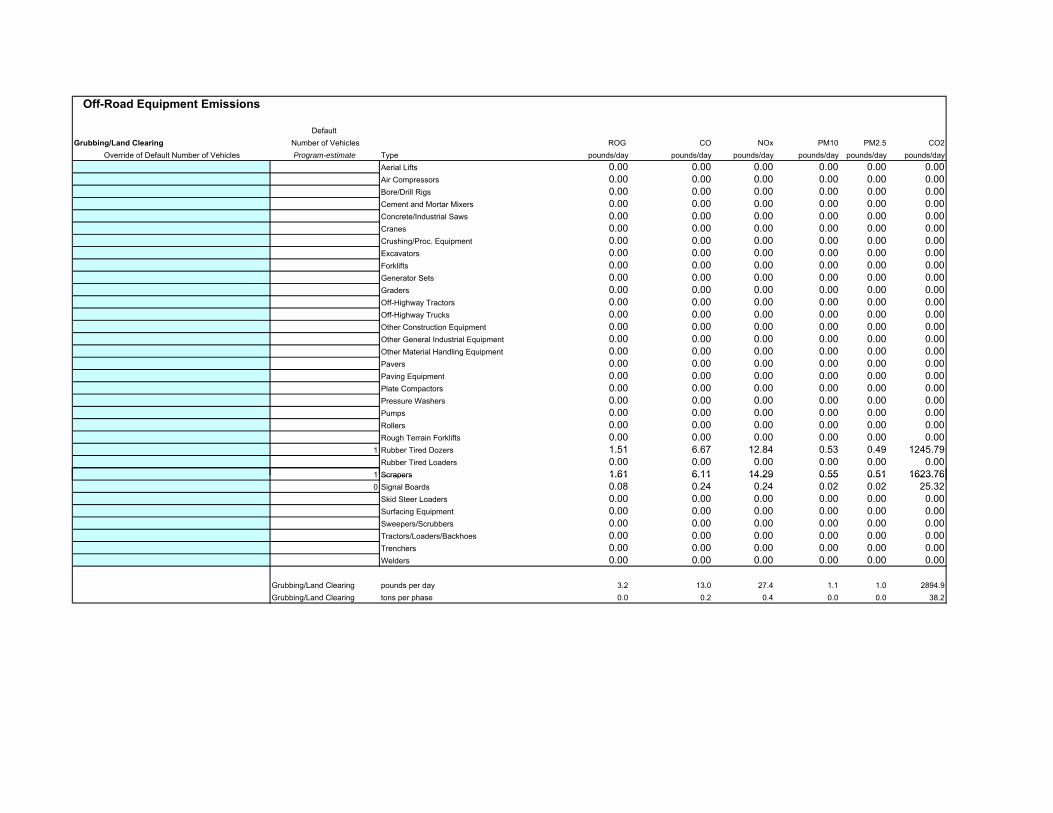
Off-Road Equipment Emissions
Default Grubbing/Land Clearing Number of Vehicles ROG CO NOx PM10 PM2.5 CO2
Override of Default Number of Vehicles Program-estimate Type pounds/day pounds/day pounds/day pounds/day pounds/day pounds/dayAerial Lifts 0.00 0.00 0.00 0.00 0.00 0.00Air Compressors 0.00 0.00 0.00 0.00 0.00 0.00Bore/Drill Rigs 0.00 0.00 0.00 0.00 0.00 0.00Cement and Mortar Mixers 0.00 0.00 0.00 0.00 0.00 0.00Concrete/Industrial Saws 0.00 0.00 0.00 0.00 0.00 0.00Cranes 0.00 0.00 0.00 0.00 0.00 0.00Crushing/Proc. Equipment 0.00 0.00 0.00 0.00 0.00 0.00Excavators 0.00 0.00 0.00 0.00 0.00 0.00Forklifts 0.00 0.00 0.00 0.00 0.00 0.00Generator Sets 0.00 0.00 0.00 0.00 0.00 0.00Graders 0.00 0.00 0.00 0.00 0.00 0.00Off-Highway Tractors 0.00 0.00 0.00 0.00 0.00 0.00Off-Highway Trucks 0.00 0.00 0.00 0.00 0.00 0.00Other Construction Equipment 0.00 0.00 0.00 0.00 0.00 0.00Other General Industrial Equipment 0.00 0.00 0.00 0.00 0.00 0.00Other Material Handling Equipment 0.00 0.00 0.00 0.00 0.00 0.00Pavers 0.00 0.00 0.00 0.00 0.00 0.00Paving Equipment 0.00 0.00 0.00 0.00 0.00 0.00Plate Compactors 0.00 0.00 0.00 0.00 0.00 0.00Pressure Washers 0.00 0.00 0.00 0.00 0.00 0.00Pumps 0.00 0.00 0.00 0.00 0.00 0.00Rollers 0.00 0.00 0.00 0.00 0.00 0.00Rough Terrain Forklifts 0.00 0.00 0.00 0.00 0.00 0.00
1 Rubber Tired Dozers 1.51 6.67 12.84 0.53 0.49 1245.79Rubber Tired Loaders 0.00 0.00 0.00 0.00 0.00 0.00
1 Scrapers 1.61 6.11 14.29 0.55 0.51 1623.761 Scrapers 1.61 6.11 14.29 0.55 0.51 1623.760 Signal Boards 0.08 0.24 0.24 0.02 0.02 25.32
Skid Steer Loaders 0.00 0.00 0.00 0.00 0.00 0.00Surfacing Equipment 0.00 0.00 0.00 0.00 0.00 0.00Sweepers/Scrubbers 0.00 0.00 0.00 0.00 0.00 0.00Tractors/Loaders/Backhoes 0.00 0.00 0.00 0.00 0.00 0.00Trenchers 0.00 0.00 0.00 0.00 0.00 0.00Welders 0.00 0.00 0.00 0.00 0.00 0.00
Grubbing/Land Clearing pounds per day 3.2 13.0 27.4 1.1 1.0 2894.9Grubbing/Land Clearing tons per phase 0.0 0.2 0.4 0.0 0.0 38.2
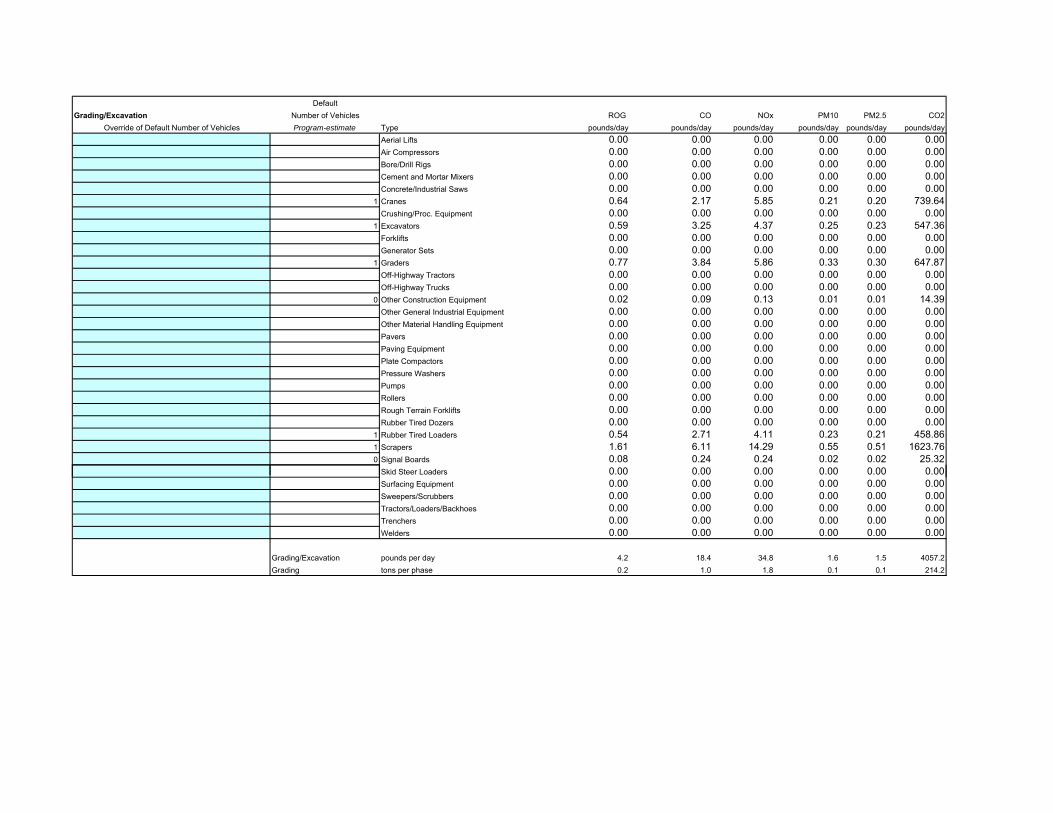
DefaultGrading/Excavation Number of Vehicles ROG CO NOx PM10 PM2.5 CO2
Override of Default Number of Vehicles Program-estimate Type pounds/day pounds/day pounds/day pounds/day pounds/day pounds/dayAerial Lifts 0.00 0.00 0.00 0.00 0.00 0.00Air Compressors 0.00 0.00 0.00 0.00 0.00 0.00Bore/Drill Rigs 0.00 0.00 0.00 0.00 0.00 0.00Cement and Mortar Mixers 0.00 0.00 0.00 0.00 0.00 0.00Concrete/Industrial Saws 0.00 0.00 0.00 0.00 0.00 0.00
1 Cranes 0.64 2.17 5.85 0.21 0.20 739.64Crushing/Proc. Equipment 0.00 0.00 0.00 0.00 0.00 0.00
1 Excavators 0.59 3.25 4.37 0.25 0.23 547.36Forklifts 0.00 0.00 0.00 0.00 0.00 0.00Generator Sets 0.00 0.00 0.00 0.00 0.00 0.00
1 Graders 0.77 3.84 5.86 0.33 0.30 647.87Off-Highway Tractors 0.00 0.00 0.00 0.00 0.00 0.00Off-Highway Trucks 0.00 0.00 0.00 0.00 0.00 0.00
0 Other Construction Equipment 0.02 0.09 0.13 0.01 0.01 14.39Other General Industrial Equipment 0.00 0.00 0.00 0.00 0.00 0.00Other Material Handling Equipment 0.00 0.00 0.00 0.00 0.00 0.00Pavers 0.00 0.00 0.00 0.00 0.00 0.00Paving Equipment 0.00 0.00 0.00 0.00 0.00 0.00Plate Compactors 0.00 0.00 0.00 0.00 0.00 0.00Pressure Washers 0.00 0.00 0.00 0.00 0.00 0.00Pumps 0.00 0.00 0.00 0.00 0.00 0.00Rollers 0.00 0.00 0.00 0.00 0.00 0.00Rough Terrain Forklifts 0.00 0.00 0.00 0.00 0.00 0.00Rubber Tired Dozers 0.00 0.00 0.00 0.00 0.00 0.00
1 Rubber Tired Loaders 0.54 2.71 4.11 0.23 0.21 458.861 Scrapers 1.61 6.11 14.29 0.55 0.51 1623.760 Signal Boards 0.08 0.24 0.24 0.02 0.02 25.32
Skid Steer Loaders 0.00 0.00 0.00 0.00 0.00 0.00Surfacing Equipment 0.00 0.00 0.00 0.00 0.00 0.00Sweepers/Scrubbers 0.00 0.00 0.00 0.00 0.00 0.00Tractors/Loaders/Backhoes 0.00 0.00 0.00 0.00 0.00 0.00Trenchers 0.00 0.00 0.00 0.00 0.00 0.00Welders 0.00 0.00 0.00 0.00 0.00 0.00
Grading/Excavation pounds per day 4.2 18.4 34.8 1.6 1.5 4057.2Grading tons per phase 0.2 1.0 1.8 0.1 0.1 214.2
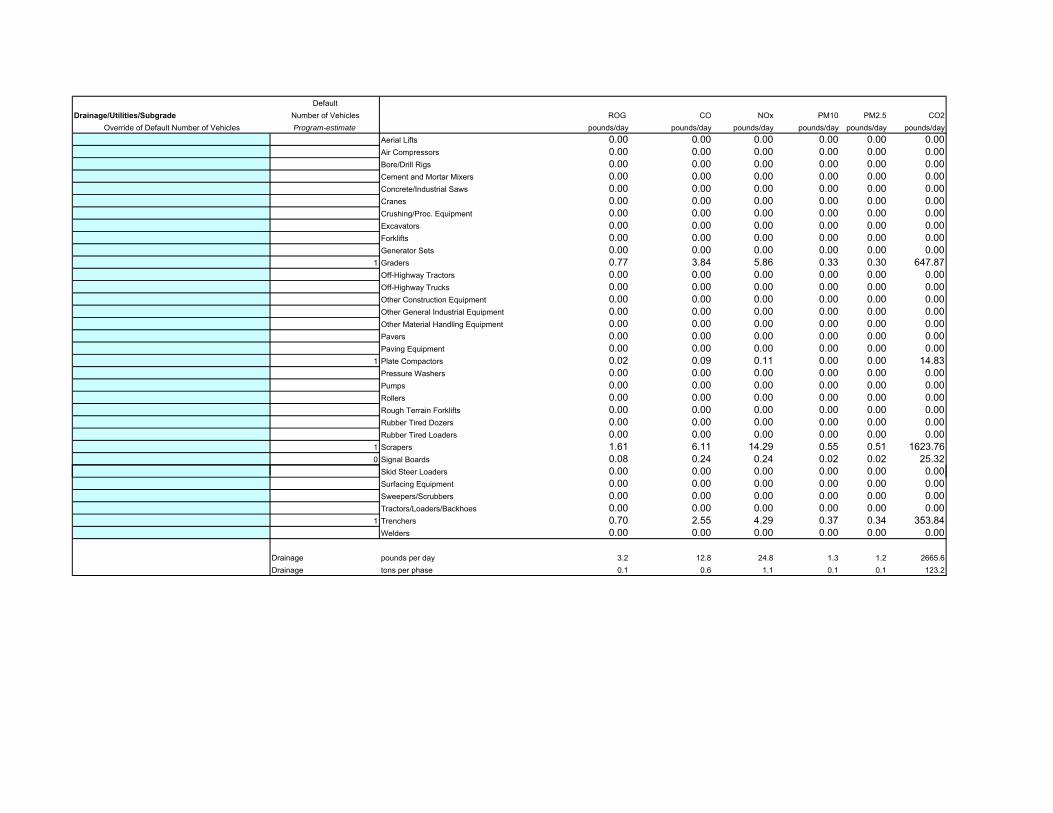
DefaultDrainage/Utilities/Subgrade Number of Vehicles ROG CO NOx PM10 PM2.5 CO2
Override of Default Number of Vehicles Program-estimate pounds/day pounds/day pounds/day pounds/day pounds/day pounds/dayAerial Lifts 0.00 0.00 0.00 0.00 0.00 0.00Air Compressors 0.00 0.00 0.00 0.00 0.00 0.00Bore/Drill Rigs 0.00 0.00 0.00 0.00 0.00 0.00Cement and Mortar Mixers 0.00 0.00 0.00 0.00 0.00 0.00Concrete/Industrial Saws 0.00 0.00 0.00 0.00 0.00 0.00Cranes 0.00 0.00 0.00 0.00 0.00 0.00Crushing/Proc. Equipment 0.00 0.00 0.00 0.00 0.00 0.00Excavators 0.00 0.00 0.00 0.00 0.00 0.00Forklifts 0.00 0.00 0.00 0.00 0.00 0.00Generator Sets 0.00 0.00 0.00 0.00 0.00 0.00
1 Graders 0.77 3.84 5.86 0.33 0.30 647.87Off-Highway Tractors 0.00 0.00 0.00 0.00 0.00 0.00Off-Highway Trucks 0.00 0.00 0.00 0.00 0.00 0.00Other Construction Equipment 0.00 0.00 0.00 0.00 0.00 0.00Other General Industrial Equipment 0.00 0.00 0.00 0.00 0.00 0.00Other Material Handling Equipment 0.00 0.00 0.00 0.00 0.00 0.00Pavers 0.00 0.00 0.00 0.00 0.00 0.00Paving Equipment 0.00 0.00 0.00 0.00 0.00 0.00
1 Plate Compactors 0.02 0.09 0.11 0.00 0.00 14.83Pressure Washers 0.00 0.00 0.00 0.00 0.00 0.00Pumps 0.00 0.00 0.00 0.00 0.00 0.00Rollers 0.00 0.00 0.00 0.00 0.00 0.00Rough Terrain Forklifts 0.00 0.00 0.00 0.00 0.00 0.00Rubber Tired Dozers 0.00 0.00 0.00 0.00 0.00 0.00Rubber Tired Loaders 0.00 0.00 0.00 0.00 0.00 0.00
1 Scrapers 1.61 6.11 14.29 0.55 0.51 1623.760 Signal Boards 0.08 0.24 0.24 0.02 0.02 25.32
Skid Steer Loaders 0.00 0.00 0.00 0.00 0.00 0.00Surfacing Equipment 0.00 0.00 0.00 0.00 0.00 0.00Sweepers/Scrubbers 0.00 0.00 0.00 0.00 0.00 0.00Tractors/Loaders/Backhoes 0.00 0.00 0.00 0.00 0.00 0.00
1 Trenchers 0.70 2.55 4.29 0.37 0.34 353.84Welders 0.00 0.00 0.00 0.00 0.00 0.00
Drainage pounds per day 3.2 12.8 24.8 1.3 1.2 2665.6Drainage tons per phase 0.1 0.6 1.1 0.1 0.1 123.2
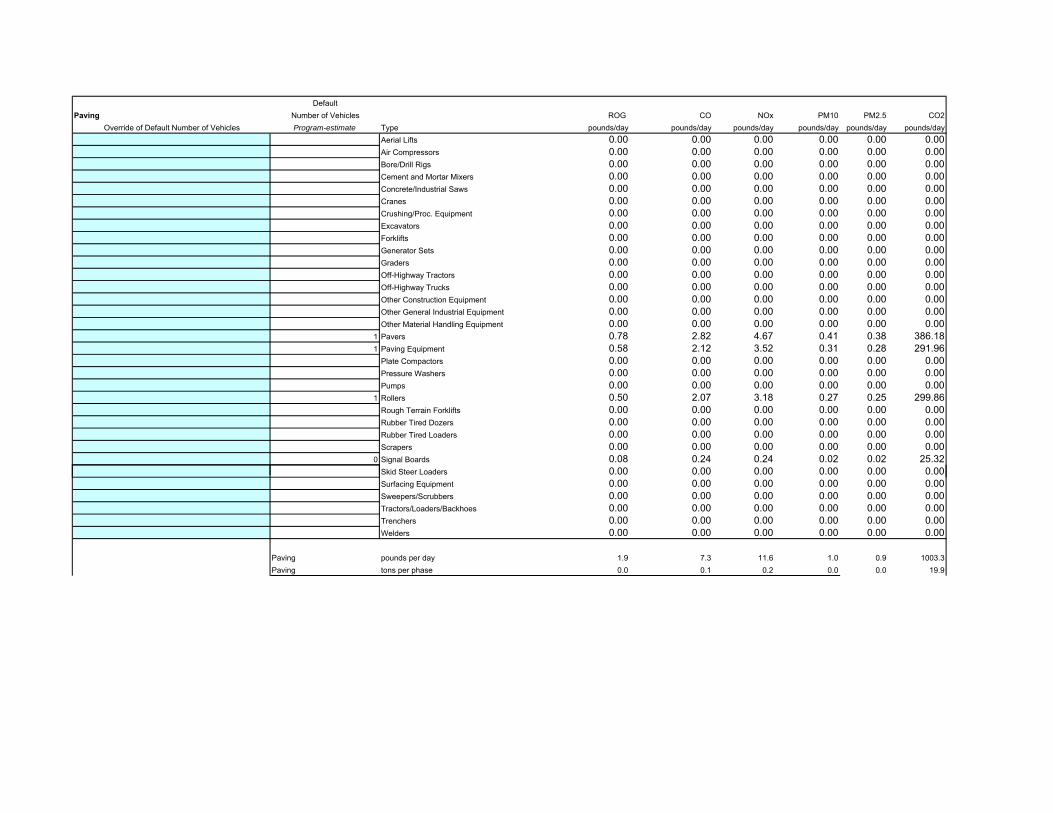
DefaultPaving Number of Vehicles ROG CO NOx PM10 PM2.5 CO2
Override of Default Number of Vehicles Program-estimate Type pounds/day pounds/day pounds/day pounds/day pounds/day pounds/dayAerial Lifts 0.00 0.00 0.00 0.00 0.00 0.00Air Compressors 0.00 0.00 0.00 0.00 0.00 0.00Bore/Drill Rigs 0.00 0.00 0.00 0.00 0.00 0.00Cement and Mortar Mixers 0.00 0.00 0.00 0.00 0.00 0.00Concrete/Industrial Saws 0.00 0.00 0.00 0.00 0.00 0.00Cranes 0.00 0.00 0.00 0.00 0.00 0.00Crushing/Proc. Equipment 0.00 0.00 0.00 0.00 0.00 0.00Excavators 0.00 0.00 0.00 0.00 0.00 0.00Forklifts 0.00 0.00 0.00 0.00 0.00 0.00Generator Sets 0.00 0.00 0.00 0.00 0.00 0.00Graders 0.00 0.00 0.00 0.00 0.00 0.00Off-Highway Tractors 0.00 0.00 0.00 0.00 0.00 0.00Off-Highway Trucks 0.00 0.00 0.00 0.00 0.00 0.00Other Construction Equipment 0.00 0.00 0.00 0.00 0.00 0.00Other General Industrial Equipment 0.00 0.00 0.00 0.00 0.00 0.00Other Material Handling Equipment 0.00 0.00 0.00 0.00 0.00 0.00
1 Pavers 0.78 2.82 4.67 0.41 0.38 386.181 Paving Equipment 0.58 2.12 3.52 0.31 0.28 291.96
Plate Compactors 0.00 0.00 0.00 0.00 0.00 0.00Pressure Washers 0.00 0.00 0.00 0.00 0.00 0.00Pumps 0.00 0.00 0.00 0.00 0.00 0.00
1 Rollers 0.50 2.07 3.18 0.27 0.25 299.86Rough Terrain Forklifts 0.00 0.00 0.00 0.00 0.00 0.00Rubber Tired Dozers 0.00 0.00 0.00 0.00 0.00 0.00Rubber Tired Loaders 0.00 0.00 0.00 0.00 0.00 0.00Scrapers 0.00 0.00 0.00 0.00 0.00 0.00
0 Signal Boards 0.08 0.24 0.24 0.02 0.02 25.32Skid Steer Loaders 0.00 0.00 0.00 0.00 0.00 0.00Surfacing Equipment 0.00 0.00 0.00 0.00 0.00 0.00Sweepers/Scrubbers 0.00 0.00 0.00 0.00 0.00 0.00Tractors/Loaders/Backhoes 0.00 0.00 0.00 0.00 0.00 0.00Trenchers 0.00 0.00 0.00 0.00 0.00 0.00Welders 0.00 0.00 0.00 0.00 0.00 0.00
Paving pounds per day 1.9 7.3 11.6 1.0 0.9 1003.3Paving tons per phase 0.0 0.1 0.2 0.0 0.0 19.9
B.4 EMFAC Output


B.4‐1 Emission Factors for Programmatic Material Hauling Construction Emissions
Title : Haul
Version : Emfac2007 V2.3 Nov 1 2006
Run Date : 2011/04/01 09:35:17
Scen Year: 2013 ‐‐ All model years in the range 1969 to 2013 selected
Season : Annual
Area : San Joaquin Valley Unified APCD
*****************************************************************************************
Year: 2013 ‐‐ Model Years 1969 to 2013 Inclusive ‐‐ Annual
Emfac2007 Emission Factors: V2.3 Nov 1 2006
District Average District Average San Joaquin Valley Unified APCD
Table 1: Running Exhaust Emissions (grams/mile)
Pollutant Name: Reactive Org Gases Temperature: 67F Relative Humidity: 55%
Speed MHD MHD MHD MHD HHD HHD HHD HHD ALL ALL ALL ALL
MPH NCAT CAT DSL ALL NCAT CAT DSL ALL NCAT CAT DSL ALL
55 2.513 0.199 0.146 0.164 9.005 0.939 0.602 0.607 3.525 0.442 0.545 0.544
Pollutant Name: Carbon Monoxide Temperature: 67F Relative Humidity: 55%
Speed MHD MHD MHD MHD HHD HHD HHD HHD ALL ALL ALL ALL
MPH NCAT CAT DSL ALL NCAT CAT DSL ALL NCAT CAT DSL ALL
55 100.68 5.244 1.493 2.463 495.433 31.98 2.653 3.064 162.221 13.997 2.508 2.978
Pollutant Name: Oxides of Nitrogen Temperature: 67F Relative Humidity: 55%
Speed MHD MHD MHD MHD HHD HHD HHD HHD ALL ALL ALL ALL
MPH NCAT CAT DSL ALL NCAT CAT DSL ALL NCAT CAT DSL ALL
55 3.525 1.921 7.368 6.556 25.749 8.583 10.454 10.434 6.989 4.102 10.068 9.881
Pollutant Name: Carbon Dioxide Temperature: 67F Relative Humidity: 55%
Speed MHD MHD MHD MHD HHD HHD HHD HHD ALL ALL ALL ALL
MPH NCAT CAT DSL ALL NCAT CAT DSL ALL NCAT CAT DSL ALL
55 507.469 507.469 1505 1355.056 507.469 507.469 1662.352 1648.566 507.469 507.469 1642.687 1606.761
Pollutant Name: Sulfur Dioxide Temperature: 67F Relative Humidity: 55%
Speed MHD MHD MHD MHD HHD HHD HHD HHD ALL ALL ALL ALL
MPH NCAT CAT DSL ALL NCAT CAT DSL ALL NCAT CAT DSL ALL
55 0.006 0.005 0.014 0.013 0.013 0.005 0.016 0.016 0.007 0.005 0.016 0.015
Pollutant Name: PM10 Temperature: 67F Relative Humidity: 55%
Speed MHD MHD MHD MHD HHD HHD HHD HHD ALL ALL ALL ALL
MPH NCAT CAT DSL ALL NCAT CAT DSL ALL NCAT CAT DSL ALL
55 0.01 0.005 0.169 0.145 0.01 0.009 0.453 0.448 0.01 0.006 0.418 0.405
Pollutant Name: PM10 ‐ Tire Wear Temperature: 67F Relative Humidity: 55%
Speed MHD MHD MHD MHD HHD HHD HHD HHD ALL ALL ALL ALL
MPH NCAT CAT DSL ALL NCAT CAT DSL ALL NCAT CAT DSL ALL
55 0.012 0.012 0.012 0.012 0.012 0.012 0.036 0.036 0.012 0.012 0.033 0.032
Pollutant Name: PM10 ‐ Brake Wear Temperature: 67F Relative Humidity: 55%
Speed MHD MHD MHD MHD HHD HHD HHD HHD ALL ALL ALL ALL
MPH NCAT CAT DSL ALL NCAT CAT DSL ALL NCAT CAT DSL ALL
55 0.013 0.013 0.013 0.013 0.028 0.028 0.028 0.028 0.015 0.018 0.026 0.026
Pollutant Name: Methane Temperature: 67F Relative Humidity: 55%
Speed MHD MHD MHD MHD HHD HHD HHD HHD ALL ALL ALL ALL
MPH NCAT CAT DSL ALL NCAT CAT DSL ALL NCAT CAT DSL ALL
55 0.206 0.038 0.007 0.012 0.454 0.12 0.028 0.029 0.245 0.064 0.025 0.027
Pollutant Name: PM2.5 Temperature: 67F Relative Humidity: 55%
Speed MHD MHD MHD MHD HHD HHD HHD HHD ALL ALL ALL ALL
MPH NCAT CAT DSL ALL NCAT CAT DSL ALL NCAT CAT DSL ALL
55 0.007 0.005 0.156 0.133 0.007 0.008 0.417 0.412 0.007 0.006 0.384 0.372
Pollutant Name: PM2.5 ‐ Tire Wear Temperature: 67F Relative Humidity: 55%
Speed MHD MHD MHD MHD HHD HHD HHD HHD ALL ALL ALL ALL
MPH NCAT CAT DSL ALL NCAT CAT DSL ALL NCAT CAT DSL ALL
55 0.003 0.003 0.003 0.003 0.003 0.003 0.009 0.009 0.003 0.003 0.008 0.008
Pollutant Name: PM2.5 ‐ Brake Wear Temperature: 67F Relative Humidity: 55%
Speed MHD MHD MHD MHD HHD HHD HHD HHD ALL ALL ALL ALL
MPH NCAT CAT DSL ALL NCAT CAT DSL ALL NCAT CAT DSL ALL
55 0.005 0.005 0.005 0.005 0.012 0.012 0.012 0.012 0.006 0.008 0.011 0.011
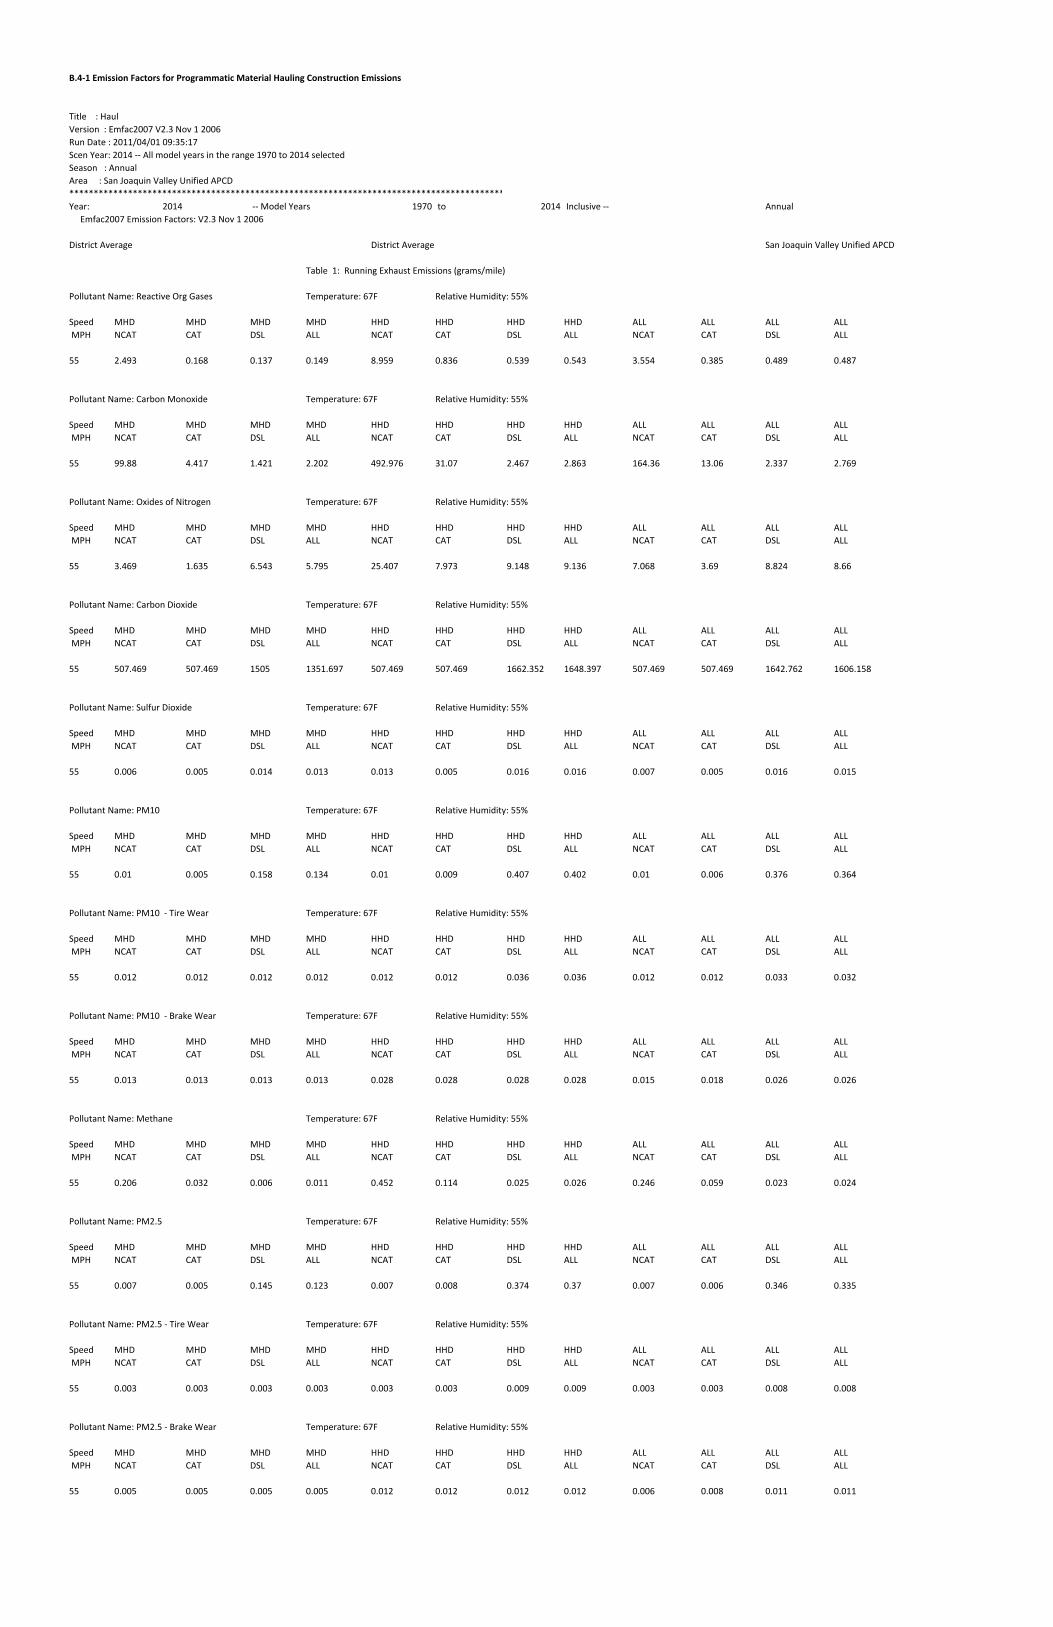
B.4‐1 Emission Factors for Programmatic Material Hauling Construction Emissions
Title : Haul
Version : Emfac2007 V2.3 Nov 1 2006
Run Date : 2011/04/01 09:35:17
Scen Year: 2014 ‐‐ All model years in the range 1970 to 2014 selected
Season : Annual
Area : San Joaquin Valley Unified APCD
*****************************************************************************************
Year: 2014 ‐‐ Model Years 1970 to 2014 Inclusive ‐‐ Annual
Emfac2007 Emission Factors: V2.3 Nov 1 2006
District Average District Average San Joaquin Valley Unified APCD
Table 1: Running Exhaust Emissions (grams/mile)
Pollutant Name: Reactive Org Gases Temperature: 67F Relative Humidity: 55%
Speed MHD MHD MHD MHD HHD HHD HHD HHD ALL ALL ALL ALL
MPH NCAT CAT DSL ALL NCAT CAT DSL ALL NCAT CAT DSL ALL
55 2.493 0.168 0.137 0.149 8.959 0.836 0.539 0.543 3.554 0.385 0.489 0.487
Pollutant Name: Carbon Monoxide Temperature: 67F Relative Humidity: 55%
Speed MHD MHD MHD MHD HHD HHD HHD HHD ALL ALL ALL ALL
MPH NCAT CAT DSL ALL NCAT CAT DSL ALL NCAT CAT DSL ALL
55 99.88 4.417 1.421 2.202 492.976 31.07 2.467 2.863 164.36 13.06 2.337 2.769
Pollutant Name: Oxides of Nitrogen Temperature: 67F Relative Humidity: 55%
Speed MHD MHD MHD MHD HHD HHD HHD HHD ALL ALL ALL ALL
MPH NCAT CAT DSL ALL NCAT CAT DSL ALL NCAT CAT DSL ALL
55 3.469 1.635 6.543 5.795 25.407 7.973 9.148 9.136 7.068 3.69 8.824 8.66
Pollutant Name: Carbon Dioxide Temperature: 67F Relative Humidity: 55%
Speed MHD MHD MHD MHD HHD HHD HHD HHD ALL ALL ALL ALL
MPH NCAT CAT DSL ALL NCAT CAT DSL ALL NCAT CAT DSL ALL
55 507.469 507.469 1505 1351.697 507.469 507.469 1662.352 1648.397 507.469 507.469 1642.762 1606.158
Pollutant Name: Sulfur Dioxide Temperature: 67F Relative Humidity: 55%
Speed MHD MHD MHD MHD HHD HHD HHD HHD ALL ALL ALL ALL
MPH NCAT CAT DSL ALL NCAT CAT DSL ALL NCAT CAT DSL ALL
55 0.006 0.005 0.014 0.013 0.013 0.005 0.016 0.016 0.007 0.005 0.016 0.015
Pollutant Name: PM10 Temperature: 67F Relative Humidity: 55%
Speed MHD MHD MHD MHD HHD HHD HHD HHD ALL ALL ALL ALL
MPH NCAT CAT DSL ALL NCAT CAT DSL ALL NCAT CAT DSL ALL
55 0.01 0.005 0.158 0.134 0.01 0.009 0.407 0.402 0.01 0.006 0.376 0.364
Pollutant Name: PM10 ‐ Tire Wear Temperature: 67F Relative Humidity: 55%
Speed MHD MHD MHD MHD HHD HHD HHD HHD ALL ALL ALL ALL
MPH NCAT CAT DSL ALL NCAT CAT DSL ALL NCAT CAT DSL ALL
55 0.012 0.012 0.012 0.012 0.012 0.012 0.036 0.036 0.012 0.012 0.033 0.032
Pollutant Name: PM10 ‐ Brake Wear Temperature: 67F Relative Humidity: 55%
Speed MHD MHD MHD MHD HHD HHD HHD HHD ALL ALL ALL ALL
MPH NCAT CAT DSL ALL NCAT CAT DSL ALL NCAT CAT DSL ALL
55 0.013 0.013 0.013 0.013 0.028 0.028 0.028 0.028 0.015 0.018 0.026 0.026
Pollutant Name: Methane Temperature: 67F Relative Humidity: 55%
Speed MHD MHD MHD MHD HHD HHD HHD HHD ALL ALL ALL ALL
MPH NCAT CAT DSL ALL NCAT CAT DSL ALL NCAT CAT DSL ALL
55 0.206 0.032 0.006 0.011 0.452 0.114 0.025 0.026 0.246 0.059 0.023 0.024
Pollutant Name: PM2.5 Temperature: 67F Relative Humidity: 55%
Speed MHD MHD MHD MHD HHD HHD HHD HHD ALL ALL ALL ALL
MPH NCAT CAT DSL ALL NCAT CAT DSL ALL NCAT CAT DSL ALL
55 0.007 0.005 0.145 0.123 0.007 0.008 0.374 0.37 0.007 0.006 0.346 0.335
Pollutant Name: PM2.5 ‐ Tire Wear Temperature: 67F Relative Humidity: 55%
Speed MHD MHD MHD MHD HHD HHD HHD HHD ALL ALL ALL ALL
MPH NCAT CAT DSL ALL NCAT CAT DSL ALL NCAT CAT DSL ALL
55 0.003 0.003 0.003 0.003 0.003 0.003 0.009 0.009 0.003 0.003 0.008 0.008
Pollutant Name: PM2.5 ‐ Brake Wear Temperature: 67F Relative Humidity: 55%
Speed MHD MHD MHD MHD HHD HHD HHD HHD ALL ALL ALL ALL
MPH NCAT CAT DSL ALL NCAT CAT DSL ALL NCAT CAT DSL ALL
55 0.005 0.005 0.005 0.005 0.012 0.012 0.012 0.012 0.006 0.008 0.011 0.011

B.4‐1 Emission Factors for Programmatic Material Hauling Construction Emissions
Title : Haul
Version : Emfac2007 V2.3 Nov 1 2006
Run Date : 2011/04/01 09:35:17
Scen Year: 2015 ‐‐ All model years in the range 1971 to 2015 selected
Season : Annual
Area : San Joaquin Valley Unified APCD
*****************************************************************************************
Year: 2015 ‐‐ Model Years 1971 to 2015 Inclusive ‐‐ Annual
Emfac2007 Emission Factors: V2.3 Nov 1 2006
District Average District Average San Joaquin Valley Unified APCD
Table 1: Running Exhaust Emissions (grams/mile)
Pollutant Name: Reactive Org Gases Temperature: 67F Relative Humidity: 55%
Speed MHD MHD MHD MHD HHD HHD HHD HHD ALL ALL ALL ALL
MPH NCAT CAT DSL ALL NCAT CAT DSL ALL NCAT CAT DSL ALL
55 2.471 0.141 0.128 0.136 8.89 0.742 0.481 0.484 3.427 0.334 0.437 0.435
Pollutant Name: Carbon Monoxide Temperature: 67F Relative Humidity: 55%
Speed MHD MHD MHD MHD HHD HHD HHD HHD ALL ALL ALL ALL
MPH NCAT CAT DSL ALL NCAT CAT DSL ALL NCAT CAT DSL ALL
55 99.098 3.708 1.352 1.966 489.554 30.259 2.29 2.664 157.208 12.228 2.174 2.565
Pollutant Name: Oxides of Nitrogen Temperature: 67F Relative Humidity: 55%
Speed MHD MHD MHD MHD HHD HHD HHD HHD ALL ALL ALL ALL
MPH NCAT CAT DSL ALL NCAT CAT DSL ALL NCAT CAT DSL ALL
55 3.42 1.385 5.779 5.095 25.068 7.436 7.967 7.961 6.642 3.326 7.695 7.554
Pollutant Name: Carbon Dioxide Temperature: 67F Relative Humidity: 55%
Speed MHD MHD MHD MHD HHD HHD HHD HHD ALL ALL ALL ALL
MPH NCAT CAT DSL ALL NCAT CAT DSL ALL NCAT CAT DSL ALL
55 507.469 507.469 1505 1348.483 507.469 507.469 1662.352 1648.301 507.469 507.469 1642.845 1605.658
Pollutant Name: Sulfur Dioxide Temperature: 67F Relative Humidity: 55%
Speed MHD MHD MHD MHD HHD HHD HHD HHD ALL ALL ALL ALL
MPH NCAT CAT DSL ALL NCAT CAT DSL ALL NCAT CAT DSL ALL
55 0.006 0.005 0.014 0.013 0.013 0.005 0.016 0.016 0.007 0.005 0.016 0.015
Pollutant Name: PM10 Temperature: 67F Relative Humidity: 55%
Speed MHD MHD MHD MHD HHD HHD HHD HHD ALL ALL ALL ALL
MPH NCAT CAT DSL ALL NCAT CAT DSL ALL NCAT CAT DSL ALL
55 0.01 0.005 0.147 0.124 0.01 0.009 0.364 0.359 0.01 0.006 0.337 0.326
Pollutant Name: PM10 ‐ Tire Wear Temperature: 67F Relative Humidity: 55%
Speed MHD MHD MHD MHD HHD HHD HHD HHD ALL ALL ALL ALL
MPH NCAT CAT DSL ALL NCAT CAT DSL ALL NCAT CAT DSL ALL
55 0.012 0.012 0.012 0.012 0.012 0.012 0.036 0.036 0.012 0.012 0.033 0.032
Pollutant Name: PM10 ‐ Brake Wear Temperature: 67F Relative Humidity: 55%
Speed MHD MHD MHD MHD HHD HHD HHD HHD ALL ALL ALL ALL
MPH NCAT CAT DSL ALL NCAT CAT DSL ALL NCAT CAT DSL ALL
55 0.013 0.013 0.013 0.013 0.028 0.028 0.028 0.028 0.015 0.018 0.026 0.026
Pollutant Name: Methane Temperature: 67F Relative Humidity: 55%
Speed MHD MHD MHD MHD HHD HHD HHD HHD ALL ALL ALL ALL
MPH NCAT CAT DSL ALL NCAT CAT DSL ALL NCAT CAT DSL ALL
55 0.205 0.027 0.006 0.01 0.449 0.109 0.022 0.023 0.241 0.054 0.02 0.021
Pollutant Name: PM2.5 Temperature: 67F Relative Humidity: 55%
Speed MHD MHD MHD MHD HHD HHD HHD HHD ALL ALL ALL ALL
MPH NCAT CAT DSL ALL NCAT CAT DSL ALL NCAT CAT DSL ALL
55 0.007 0.005 0.135 0.114 0.007 0.008 0.335 0.331 0.007 0.006 0.31 0.3
Pollutant Name: PM2.5 ‐ Tire Wear Temperature: 67F Relative Humidity: 55%
Speed MHD MHD MHD MHD HHD HHD HHD HHD ALL ALL ALL ALL
MPH NCAT CAT DSL ALL NCAT CAT DSL ALL NCAT CAT DSL ALL
55 0.003 0.003 0.003 0.003 0.003 0.003 0.009 0.009 0.003 0.003 0.008 0.008
Pollutant Name: PM2.5 ‐ Brake Wear Temperature: 67F Relative Humidity: 55%
Speed MHD MHD MHD MHD HHD HHD HHD HHD ALL ALL ALL ALL
MPH NCAT CAT DSL ALL NCAT CAT DSL ALL NCAT CAT DSL ALL
55 0.005 0.005 0.005 0.005 0.012 0.012 0.012 0.012 0.006 0.008 0.011 0.011

B.4‐1 Emission Factors for Programmatic Material Hauling Construction Emissions
Title : Haul
Version : Emfac2007 V2.3 Nov 1 2006
Run Date : 2011/04/01 09:35:17
Scen Year: 2016 ‐‐ All model years in the range 1972 to 2016 selected
Season : Annual
Area : San Joaquin Valley Unified APCD
*****************************************************************************************
Year: 2016 ‐‐ Model Years 1972 to 2016 Inclusive ‐‐ Annual
Emfac2007 Emission Factors: V2.3 Nov 1 2006
District Average District Average San Joaquin Valley Unified APCD
Table 1: Running Exhaust Emissions (grams/mile)
Pollutant Name: Reactive Org Gases Temperature: 67F Relative Humidity: 55%
Speed MHD MHD MHD MHD HHD HHD HHD HHD ALL ALL ALL ALL
MPH NCAT CAT DSL ALL NCAT CAT DSL ALL NCAT CAT DSL ALL
55 2.453 0.12 0.12 0.124 8.848 0.662 0.428 0.432 3.427 0.292 0.39 0.388
Pollutant Name: Carbon Monoxide Temperature: 67F Relative Humidity: 55%
Speed MHD MHD MHD MHD HHD HHD HHD HHD ALL ALL ALL ALL
MPH NCAT CAT DSL ALL NCAT CAT DSL ALL NCAT CAT DSL ALL
55 98.365 3.129 1.294 1.775 487.171 29.634 2.127 2.49 157.546 11.555 2.024 2.389
Pollutant Name: Oxides of Nitrogen Temperature: 67F Relative Humidity: 55%
Speed MHD MHD MHD MHD HHD HHD HHD HHD ALL ALL ALL ALL
MPH NCAT CAT DSL ALL NCAT CAT DSL ALL NCAT CAT DSL ALL
55 3.374 1.178 5.112 4.487 24.78 6.978 6.931 6.932 6.632 3.022 6.706 6.585
Pollutant Name: Carbon Dioxide Temperature: 67F Relative Humidity: 55%
Speed MHD MHD MHD MHD HHD HHD HHD HHD ALL ALL ALL ALL
MPH NCAT CAT DSL ALL NCAT CAT DSL ALL NCAT CAT DSL ALL
55 507.469 507.469 1505 1345.45 507.469 507.469 1662.352 1648.215 507.469 507.469 1642.94 1605.228
Pollutant Name: Sulfur Dioxide Temperature: 67F Relative Humidity: 55%
Speed MHD MHD MHD MHD HHD HHD HHD HHD ALL ALL ALL ALL
MPH NCAT CAT DSL ALL NCAT CAT DSL ALL NCAT CAT DSL ALL
55 0.006 0.005 0.014 0.013 0.012 0.005 0.016 0.016 0.007 0.005 0.016 0.015
Pollutant Name: PM10 Temperature: 67F Relative Humidity: 55%
Speed MHD MHD MHD MHD HHD HHD HHD HHD ALL ALL ALL ALL
MPH NCAT CAT DSL ALL NCAT CAT DSL ALL NCAT CAT DSL ALL
55 0.01 0.005 0.137 0.116 0.01 0.009 0.325 0.321 0.01 0.006 0.301 0.292
Pollutant Name: PM10 ‐ Tire Wear Temperature: 67F Relative Humidity: 55%
Speed MHD MHD MHD MHD HHD HHD HHD HHD ALL ALL ALL ALL
MPH NCAT CAT DSL ALL NCAT CAT DSL ALL NCAT CAT DSL ALL
55 0.012 0.012 0.012 0.012 0.012 0.012 0.036 0.036 0.012 0.012 0.033 0.032
Pollutant Name: PM10 ‐ Brake Wear Temperature: 67F Relative Humidity: 55%
Speed MHD MHD MHD MHD HHD HHD HHD HHD ALL ALL ALL ALL
MPH NCAT CAT DSL ALL NCAT CAT DSL ALL NCAT CAT DSL ALL
55 0.013 0.013 0.013 0.013 0.028 0.028 0.028 0.028 0.015 0.018 0.026 0.026
Pollutant Name: Methane Temperature: 67F Relative Humidity: 55%
Speed MHD MHD MHD MHD HHD HHD HHD HHD ALL ALL ALL ALL
MPH NCAT CAT DSL ALL NCAT CAT DSL ALL NCAT CAT DSL ALL
55 0.204 0.023 0.006 0.009 0.448 0.106 0.02 0.021 0.241 0.049 0.018 0.019
Pollutant Name: PM2.5 Temperature: 67F Relative Humidity: 55%
Speed MHD MHD MHD MHD HHD HHD HHD HHD ALL ALL ALL ALL
MPH NCAT CAT DSL ALL NCAT CAT DSL ALL NCAT CAT DSL ALL
55 0.007 0.005 0.126 0.107 0.007 0.008 0.299 0.295 0.007 0.006 0.277 0.268
Pollutant Name: PM2.5 ‐ Tire Wear Temperature: 67F Relative Humidity: 55%
Speed MHD MHD MHD MHD HHD HHD HHD HHD ALL ALL ALL ALL
MPH NCAT CAT DSL ALL NCAT CAT DSL ALL NCAT CAT DSL ALL
55 0.003 0.003 0.003 0.003 0.003 0.003 0.009 0.009 0.003 0.003 0.008 0.008
Pollutant Name: PM2.5 ‐ Brake Wear Temperature: 67F Relative Humidity: 55%
Speed MHD MHD MHD MHD HHD HHD HHD HHD ALL ALL ALL ALL
MPH NCAT CAT DSL ALL NCAT CAT DSL ALL NCAT CAT DSL ALL
55 0.005 0.005 0.005 0.005 0.012 0.012 0.012 0.012 0.006 0.008 0.011 0.011
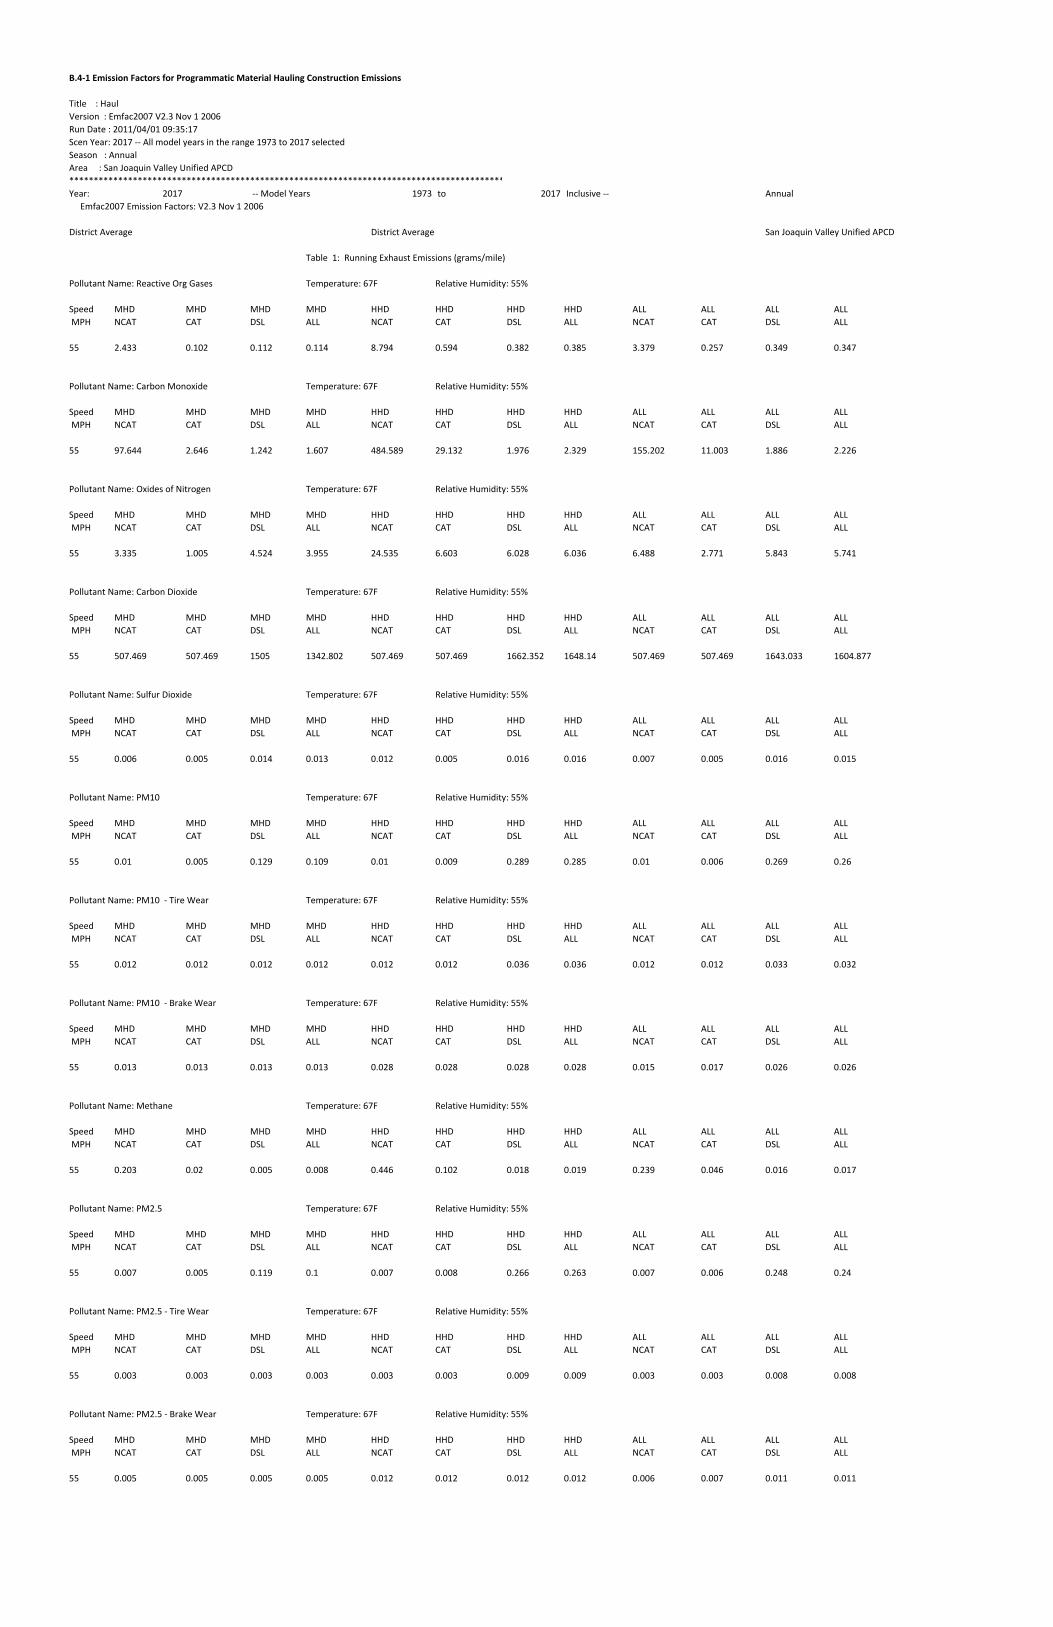
B.4‐1 Emission Factors for Programmatic Material Hauling Construction Emissions
Title : Haul
Version : Emfac2007 V2.3 Nov 1 2006
Run Date : 2011/04/01 09:35:17
Scen Year: 2017 ‐‐ All model years in the range 1973 to 2017 selected
Season : Annual
Area : San Joaquin Valley Unified APCD
*****************************************************************************************
Year: 2017 ‐‐ Model Years 1973 to 2017 Inclusive ‐‐ Annual
Emfac2007 Emission Factors: V2.3 Nov 1 2006
District Average District Average San Joaquin Valley Unified APCD
Table 1: Running Exhaust Emissions (grams/mile)
Pollutant Name: Reactive Org Gases Temperature: 67F Relative Humidity: 55%
Speed MHD MHD MHD MHD HHD HHD HHD HHD ALL ALL ALL ALL
MPH NCAT CAT DSL ALL NCAT CAT DSL ALL NCAT CAT DSL ALL
55 2.433 0.102 0.112 0.114 8.794 0.594 0.382 0.385 3.379 0.257 0.349 0.347
Pollutant Name: Carbon Monoxide Temperature: 67F Relative Humidity: 55%
Speed MHD MHD MHD MHD HHD HHD HHD HHD ALL ALL ALL ALL
MPH NCAT CAT DSL ALL NCAT CAT DSL ALL NCAT CAT DSL ALL
55 97.644 2.646 1.242 1.607 484.589 29.132 1.976 2.329 155.202 11.003 1.886 2.226
Pollutant Name: Oxides of Nitrogen Temperature: 67F Relative Humidity: 55%
Speed MHD MHD MHD MHD HHD HHD HHD HHD ALL ALL ALL ALL
MPH NCAT CAT DSL ALL NCAT CAT DSL ALL NCAT CAT DSL ALL
55 3.335 1.005 4.524 3.955 24.535 6.603 6.028 6.036 6.488 2.771 5.843 5.741
Pollutant Name: Carbon Dioxide Temperature: 67F Relative Humidity: 55%
Speed MHD MHD MHD MHD HHD HHD HHD HHD ALL ALL ALL ALL
MPH NCAT CAT DSL ALL NCAT CAT DSL ALL NCAT CAT DSL ALL
55 507.469 507.469 1505 1342.802 507.469 507.469 1662.352 1648.14 507.469 507.469 1643.033 1604.877
Pollutant Name: Sulfur Dioxide Temperature: 67F Relative Humidity: 55%
Speed MHD MHD MHD MHD HHD HHD HHD HHD ALL ALL ALL ALL
MPH NCAT CAT DSL ALL NCAT CAT DSL ALL NCAT CAT DSL ALL
55 0.006 0.005 0.014 0.013 0.012 0.005 0.016 0.016 0.007 0.005 0.016 0.015
Pollutant Name: PM10 Temperature: 67F Relative Humidity: 55%
Speed MHD MHD MHD MHD HHD HHD HHD HHD ALL ALL ALL ALL
MPH NCAT CAT DSL ALL NCAT CAT DSL ALL NCAT CAT DSL ALL
55 0.01 0.005 0.129 0.109 0.01 0.009 0.289 0.285 0.01 0.006 0.269 0.26
Pollutant Name: PM10 ‐ Tire Wear Temperature: 67F Relative Humidity: 55%
Speed MHD MHD MHD MHD HHD HHD HHD HHD ALL ALL ALL ALL
MPH NCAT CAT DSL ALL NCAT CAT DSL ALL NCAT CAT DSL ALL
55 0.012 0.012 0.012 0.012 0.012 0.012 0.036 0.036 0.012 0.012 0.033 0.032
Pollutant Name: PM10 ‐ Brake Wear Temperature: 67F Relative Humidity: 55%
Speed MHD MHD MHD MHD HHD HHD HHD HHD ALL ALL ALL ALL
MPH NCAT CAT DSL ALL NCAT CAT DSL ALL NCAT CAT DSL ALL
55 0.013 0.013 0.013 0.013 0.028 0.028 0.028 0.028 0.015 0.017 0.026 0.026
Pollutant Name: Methane Temperature: 67F Relative Humidity: 55%
Speed MHD MHD MHD MHD HHD HHD HHD HHD ALL ALL ALL ALL
MPH NCAT CAT DSL ALL NCAT CAT DSL ALL NCAT CAT DSL ALL
55 0.203 0.02 0.005 0.008 0.446 0.102 0.018 0.019 0.239 0.046 0.016 0.017
Pollutant Name: PM2.5 Temperature: 67F Relative Humidity: 55%
Speed MHD MHD MHD MHD HHD HHD HHD HHD ALL ALL ALL ALL
MPH NCAT CAT DSL ALL NCAT CAT DSL ALL NCAT CAT DSL ALL
55 0.007 0.005 0.119 0.1 0.007 0.008 0.266 0.263 0.007 0.006 0.248 0.24
Pollutant Name: PM2.5 ‐ Tire Wear Temperature: 67F Relative Humidity: 55%
Speed MHD MHD MHD MHD HHD HHD HHD HHD ALL ALL ALL ALL
MPH NCAT CAT DSL ALL NCAT CAT DSL ALL NCAT CAT DSL ALL
55 0.003 0.003 0.003 0.003 0.003 0.003 0.009 0.009 0.003 0.003 0.008 0.008
Pollutant Name: PM2.5 ‐ Brake Wear Temperature: 67F Relative Humidity: 55%
Speed MHD MHD MHD MHD HHD HHD HHD HHD ALL ALL ALL ALL
MPH NCAT CAT DSL ALL NCAT CAT DSL ALL NCAT CAT DSL ALL
55 0.005 0.005 0.005 0.005 0.012 0.012 0.012 0.012 0.006 0.007 0.011 0.011

B.4‐1 Emission Factors for Programmatic Material Hauling Construction Emissions
Title : Haul
Version : Emfac2007 V2.3 Nov 1 2006
Run Date : 2011/04/01 09:35:17
Scen Year: 2018 ‐‐ All model years in the range 1974 to 2018 selected
Season : Annual
Area : San Joaquin Valley Unified APCD
*****************************************************************************************
Year: 2018 ‐‐ Model Years 1974 to 2018 Inclusive ‐‐ Annual
Emfac2007 Emission Factors: V2.3 Nov 1 2006
District Average District Average San Joaquin Valley Unified APCD
Table 1: Running Exhaust Emissions (grams/mile)
Pollutant Name: Reactive Org Gases Temperature: 67F Relative Humidity: 55%
Speed MHD MHD MHD MHD HHD HHD HHD HHD ALL ALL ALL ALL
MPH NCAT CAT DSL ALL NCAT CAT DSL ALL NCAT CAT DSL ALL
55 2.414 0.086 0.106 0.105 8.747 0.533 0.341 0.344 3.516 0.226 0.313 0.31
Pollutant Name: Carbon Monoxide Temperature: 67F Relative Humidity: 55%
Speed MHD MHD MHD MHD HHD HHD HHD HHD ALL ALL ALL ALL
MPH NCAT CAT DSL ALL NCAT CAT DSL ALL NCAT CAT DSL ALL
55 96.955 2.234 1.198 1.451 482.506 28.679 1.837 2.182 164.044 10.513 1.759 2.079
Pollutant Name: Oxides of Nitrogen Temperature: 67F Relative Humidity: 55%
Speed MHD MHD MHD MHD HHD HHD HHD HHD ALL ALL ALL ALL
MPH NCAT CAT DSL ALL NCAT CAT DSL ALL NCAT CAT DSL ALL
55 3.302 0.857 4.009 3.492 24.349 6.275 5.249 5.262 6.964 2.553 5.097 5.012
Pollutant Name: Carbon Dioxide Temperature: 67F Relative Humidity: 55%
Speed MHD MHD MHD MHD HHD HHD HHD HHD ALL ALL ALL ALL
MPH NCAT CAT DSL ALL NCAT CAT DSL ALL NCAT CAT DSL ALL
55 507.469 507.469 1505 1340.51 507.469 507.469 1662.352 1648.09 507.469 507.469 1643.108 1604.575
Pollutant Name: Sulfur Dioxide Temperature: 67F Relative Humidity: 55%
Speed MHD MHD MHD MHD HHD HHD HHD HHD ALL ALL ALL ALL
MPH NCAT CAT DSL ALL NCAT CAT DSL ALL NCAT CAT DSL ALL
55 0.006 0.005 0.014 0.013 0.012 0.005 0.016 0.016 0.007 0.005 0.016 0.015
Pollutant Name: PM10 Temperature: 67F Relative Humidity: 55%
Speed MHD MHD MHD MHD HHD HHD HHD HHD ALL ALL ALL ALL
MPH NCAT CAT DSL ALL NCAT CAT DSL ALL NCAT CAT DSL ALL
55 0.01 0.005 0.122 0.103 0.01 0.009 0.257 0.254 0.01 0.006 0.241 0.233
Pollutant Name: PM10 ‐ Tire Wear Temperature: 67F Relative Humidity: 55%
Speed MHD MHD MHD MHD HHD HHD HHD HHD ALL ALL ALL ALL
MPH NCAT CAT DSL ALL NCAT CAT DSL ALL NCAT CAT DSL ALL
55 0.012 0.012 0.012 0.012 0.012 0.012 0.036 0.036 0.012 0.012 0.033 0.032
Pollutant Name: PM10 ‐ Brake Wear Temperature: 67F Relative Humidity: 55%
Speed MHD MHD MHD MHD HHD HHD HHD HHD ALL ALL ALL ALL
MPH NCAT CAT DSL ALL NCAT CAT DSL ALL NCAT CAT DSL ALL
55 0.013 0.013 0.013 0.013 0.028 0.028 0.028 0.028 0.015 0.017 0.026 0.026
Pollutant Name: Methane Temperature: 67F Relative Humidity: 55%
Speed MHD MHD MHD MHD HHD HHD HHD HHD ALL ALL ALL ALL
MPH NCAT CAT DSL ALL NCAT CAT DSL ALL NCAT CAT DSL ALL
55 0.203 0.017 0.005 0.007 0.444 0.099 0.016 0.017 0.245 0.043 0.015 0.016
Pollutant Name: PM2.5 Temperature: 67F Relative Humidity: 55%
Speed MHD MHD MHD MHD HHD HHD HHD HHD ALL ALL ALL ALL
MPH NCAT CAT DSL ALL NCAT CAT DSL ALL NCAT CAT DSL ALL
55 0.007 0.005 0.112 0.094 0.007 0.008 0.237 0.234 0.007 0.006 0.221 0.214
Pollutant Name: PM2.5 ‐ Tire Wear Temperature: 67F Relative Humidity: 55%
Speed MHD MHD MHD MHD HHD HHD HHD HHD ALL ALL ALL ALL
MPH NCAT CAT DSL ALL NCAT CAT DSL ALL NCAT CAT DSL ALL
55 0.003 0.003 0.003 0.003 0.003 0.003 0.009 0.009 0.003 0.003 0.008 0.008
Pollutant Name: PM2.5 ‐ Brake Wear Temperature: 67F Relative Humidity: 55%
Speed MHD MHD MHD MHD HHD HHD HHD HHD ALL ALL ALL ALL
MPH NCAT CAT DSL ALL NCAT CAT DSL ALL NCAT CAT DSL ALL
55 0.005 0.005 0.005 0.005 0.012 0.012 0.012 0.012 0.007 0.007 0.011 0.011
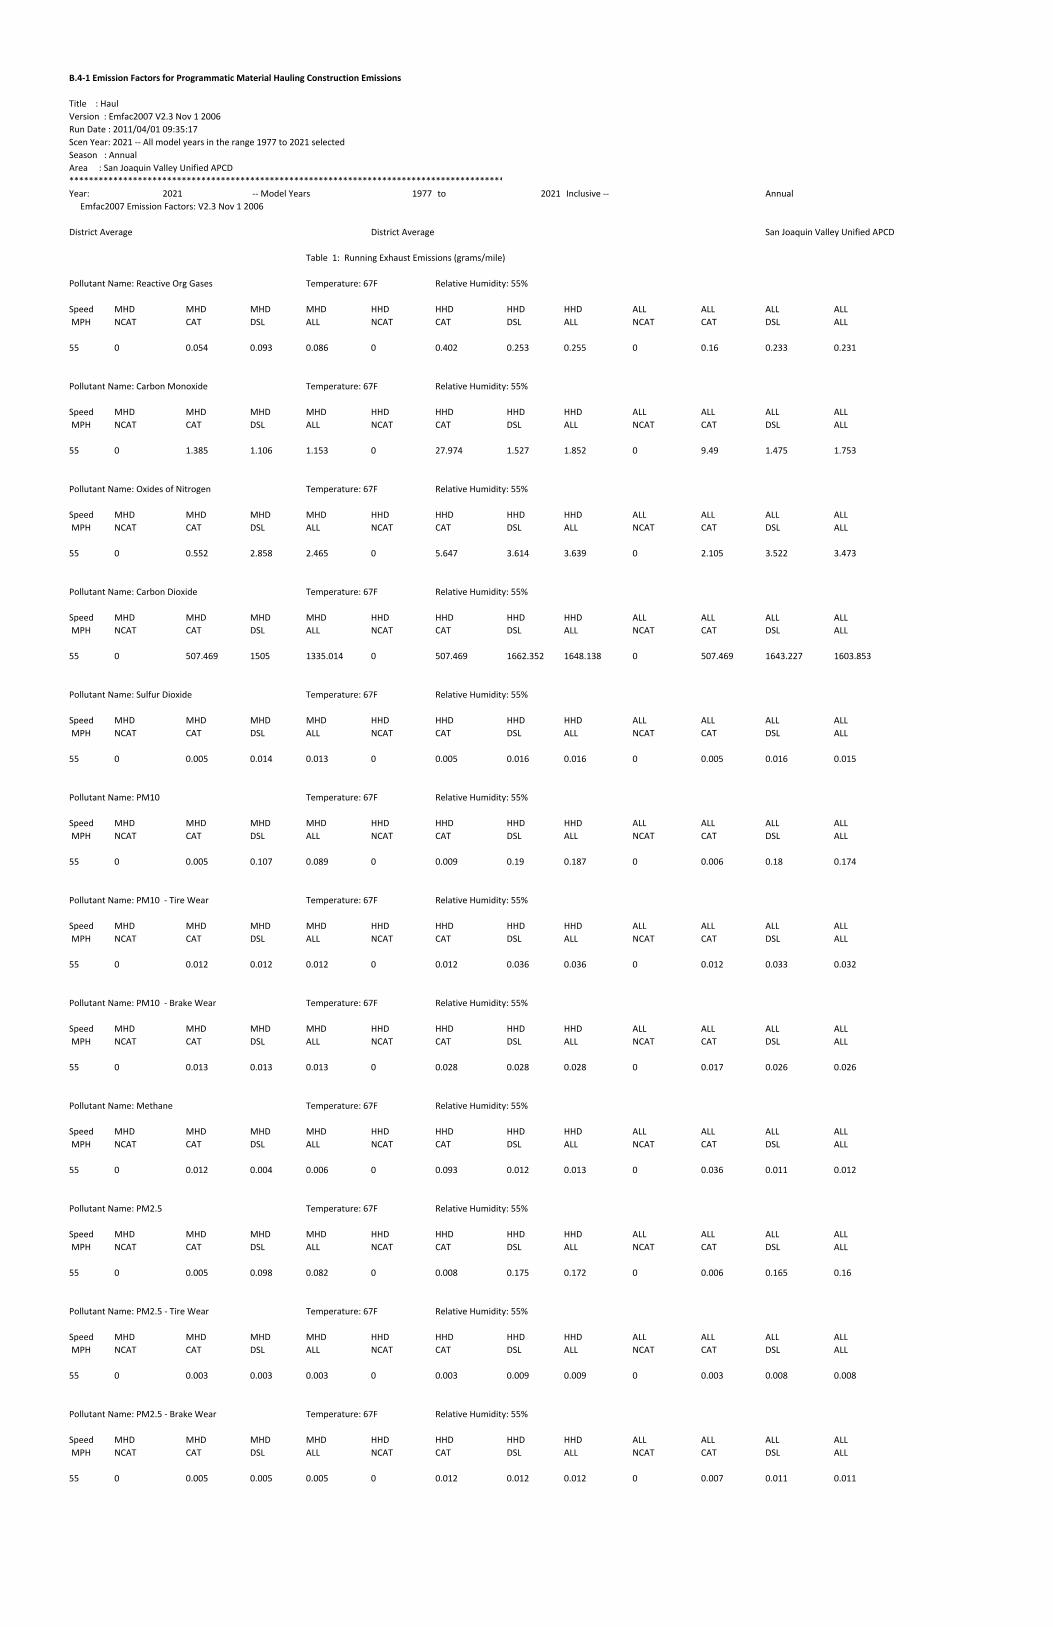
B.4‐1 Emission Factors for Programmatic Material Hauling Construction Emissions
Title : Haul
Version : Emfac2007 V2.3 Nov 1 2006
Run Date : 2011/04/01 09:35:17
Scen Year: 2021 ‐‐ All model years in the range 1977 to 2021 selected
Season : Annual
Area : San Joaquin Valley Unified APCD
*****************************************************************************************
Year: 2021 ‐‐ Model Years 1977 to 2021 Inclusive ‐‐ Annual
Emfac2007 Emission Factors: V2.3 Nov 1 2006
District Average District Average San Joaquin Valley Unified APCD
Table 1: Running Exhaust Emissions (grams/mile)
Pollutant Name: Reactive Org Gases Temperature: 67F Relative Humidity: 55%
Speed MHD MHD MHD MHD HHD HHD HHD HHD ALL ALL ALL ALL
MPH NCAT CAT DSL ALL NCAT CAT DSL ALL NCAT CAT DSL ALL
55 0 0.054 0.093 0.086 0 0.402 0.253 0.255 0 0.16 0.233 0.231
Pollutant Name: Carbon Monoxide Temperature: 67F Relative Humidity: 55%
Speed MHD MHD MHD MHD HHD HHD HHD HHD ALL ALL ALL ALL
MPH NCAT CAT DSL ALL NCAT CAT DSL ALL NCAT CAT DSL ALL
55 0 1.385 1.106 1.153 0 27.974 1.527 1.852 0 9.49 1.475 1.753
Pollutant Name: Oxides of Nitrogen Temperature: 67F Relative Humidity: 55%
Speed MHD MHD MHD MHD HHD HHD HHD HHD ALL ALL ALL ALL
MPH NCAT CAT DSL ALL NCAT CAT DSL ALL NCAT CAT DSL ALL
55 0 0.552 2.858 2.465 0 5.647 3.614 3.639 0 2.105 3.522 3.473
Pollutant Name: Carbon Dioxide Temperature: 67F Relative Humidity: 55%
Speed MHD MHD MHD MHD HHD HHD HHD HHD ALL ALL ALL ALL
MPH NCAT CAT DSL ALL NCAT CAT DSL ALL NCAT CAT DSL ALL
55 0 507.469 1505 1335.014 0 507.469 1662.352 1648.138 0 507.469 1643.227 1603.853
Pollutant Name: Sulfur Dioxide Temperature: 67F Relative Humidity: 55%
Speed MHD MHD MHD MHD HHD HHD HHD HHD ALL ALL ALL ALL
MPH NCAT CAT DSL ALL NCAT CAT DSL ALL NCAT CAT DSL ALL
55 0 0.005 0.014 0.013 0 0.005 0.016 0.016 0 0.005 0.016 0.015
Pollutant Name: PM10 Temperature: 67F Relative Humidity: 55%
Speed MHD MHD MHD MHD HHD HHD HHD HHD ALL ALL ALL ALL
MPH NCAT CAT DSL ALL NCAT CAT DSL ALL NCAT CAT DSL ALL
55 0 0.005 0.107 0.089 0 0.009 0.19 0.187 0 0.006 0.18 0.174
Pollutant Name: PM10 ‐ Tire Wear Temperature: 67F Relative Humidity: 55%
Speed MHD MHD MHD MHD HHD HHD HHD HHD ALL ALL ALL ALL
MPH NCAT CAT DSL ALL NCAT CAT DSL ALL NCAT CAT DSL ALL
55 0 0.012 0.012 0.012 0 0.012 0.036 0.036 0 0.012 0.033 0.032
Pollutant Name: PM10 ‐ Brake Wear Temperature: 67F Relative Humidity: 55%
Speed MHD MHD MHD MHD HHD HHD HHD HHD ALL ALL ALL ALL
MPH NCAT CAT DSL ALL NCAT CAT DSL ALL NCAT CAT DSL ALL
55 0 0.013 0.013 0.013 0 0.028 0.028 0.028 0 0.017 0.026 0.026
Pollutant Name: Methane Temperature: 67F Relative Humidity: 55%
Speed MHD MHD MHD MHD HHD HHD HHD HHD ALL ALL ALL ALL
MPH NCAT CAT DSL ALL NCAT CAT DSL ALL NCAT CAT DSL ALL
55 0 0.012 0.004 0.006 0 0.093 0.012 0.013 0 0.036 0.011 0.012
Pollutant Name: PM2.5 Temperature: 67F Relative Humidity: 55%
Speed MHD MHD MHD MHD HHD HHD HHD HHD ALL ALL ALL ALL
MPH NCAT CAT DSL ALL NCAT CAT DSL ALL NCAT CAT DSL ALL
55 0 0.005 0.098 0.082 0 0.008 0.175 0.172 0 0.006 0.165 0.16
Pollutant Name: PM2.5 ‐ Tire Wear Temperature: 67F Relative Humidity: 55%
Speed MHD MHD MHD MHD HHD HHD HHD HHD ALL ALL ALL ALL
MPH NCAT CAT DSL ALL NCAT CAT DSL ALL NCAT CAT DSL ALL
55 0 0.003 0.003 0.003 0 0.003 0.009 0.009 0 0.003 0.008 0.008
Pollutant Name: PM2.5 ‐ Brake Wear Temperature: 67F Relative Humidity: 55%
Speed MHD MHD MHD MHD HHD HHD HHD HHD ALL ALL ALL ALL
MPH NCAT CAT DSL ALL NCAT CAT DSL ALL NCAT CAT DSL ALL
55 0 0.005 0.005 0.005 0 0.012 0.012 0.012 0 0.007 0.011 0.011
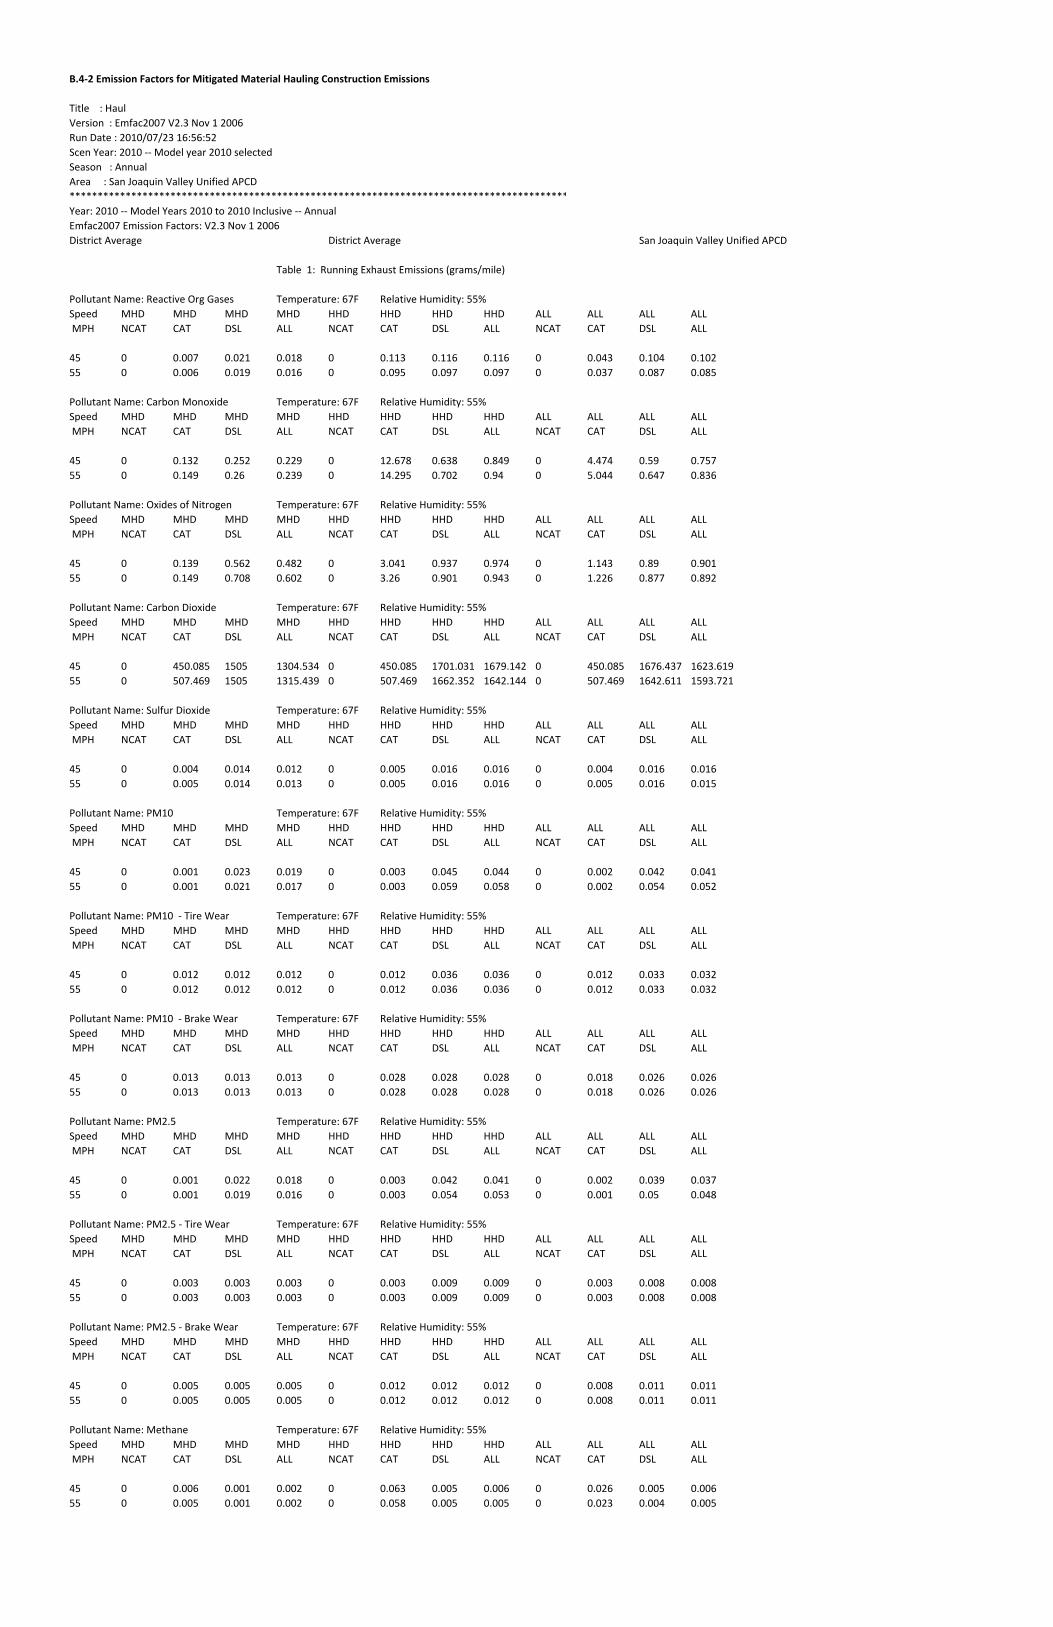
B.4‐2 Emission Factors for Mitigated Material Hauling Construction Emissions
Title : Haul
Version : Emfac2007 V2.3 Nov 1 2006
Run Date : 2010/07/23 16:56:52
Scen Year: 2010 ‐‐ Model year 2010 selected
Season : Annual
Area : San Joaquin Valley Unified APCD
*****************************************************************************************
Year: 2010 ‐‐ Model Years 2010 to 2010 Inclusive ‐‐ Annual
Emfac2007 Emission Factors: V2.3 Nov 1 2006
District Average District Average San Joaquin Valley Unified APCD
Table 1: Running Exhaust Emissions (grams/mile)
Pollutant Name: Reactive Org Gases Temperature: 67F Relative Humidity: 55%
Speed MHD MHD MHD MHD HHD HHD HHD HHD ALL ALL ALL ALL
MPH NCAT CAT DSL ALL NCAT CAT DSL ALL NCAT CAT DSL ALL
45 0 0.007 0.021 0.018 0 0.113 0.116 0.116 0 0.043 0.104 0.102
55 0 0.006 0.019 0.016 0 0.095 0.097 0.097 0 0.037 0.087 0.085
Pollutant Name: Carbon Monoxide Temperature: 67F Relative Humidity: 55%
Speed MHD MHD MHD MHD HHD HHD HHD HHD ALL ALL ALL ALL
MPH NCAT CAT DSL ALL NCAT CAT DSL ALL NCAT CAT DSL ALL
45 0 0.132 0.252 0.229 0 12.678 0.638 0.849 0 4.474 0.59 0.757
55 0 0.149 0.26 0.239 0 14.295 0.702 0.94 0 5.044 0.647 0.836
Pollutant Name: Oxides of Nitrogen Temperature: 67F Relative Humidity: 55%
Speed MHD MHD MHD MHD HHD HHD HHD HHD ALL ALL ALL ALL
MPH NCAT CAT DSL ALL NCAT CAT DSL ALL NCAT CAT DSL ALL
45 0 0.139 0.562 0.482 0 3.041 0.937 0.974 0 1.143 0.89 0.901
55 0 0.149 0.708 0.602 0 3.26 0.901 0.943 0 1.226 0.877 0.892
Pollutant Name: Carbon Dioxide Temperature: 67F Relative Humidity: 55%
Speed MHD MHD MHD MHD HHD HHD HHD HHD ALL ALL ALL ALL
MPH NCAT CAT DSL ALL NCAT CAT DSL ALL NCAT CAT DSL ALL
45 0 450.085 1505 1304.534 0 450.085 1701.031 1679.142 0 450.085 1676.437 1623.619
55 0 507.469 1505 1315.439 0 507.469 1662.352 1642.144 0 507.469 1642.611 1593.721
Pollutant Name: Sulfur Dioxide Temperature: 67F Relative Humidity: 55%
Speed MHD MHD MHD MHD HHD HHD HHD HHD ALL ALL ALL ALL
MPH NCAT CAT DSL ALL NCAT CAT DSL ALL NCAT CAT DSL ALL
45 0 0.004 0.014 0.012 0 0.005 0.016 0.016 0 0.004 0.016 0.016
55 0 0.005 0.014 0.013 0 0.005 0.016 0.016 0 0.005 0.016 0.015
Pollutant Name: PM10 Temperature: 67F Relative Humidity: 55%
Speed MHD MHD MHD MHD HHD HHD HHD HHD ALL ALL ALL ALL
MPH NCAT CAT DSL ALL NCAT CAT DSL ALL NCAT CAT DSL ALL
45 0 0.001 0.023 0.019 0 0.003 0.045 0.044 0 0.002 0.042 0.041
55 0 0.001 0.021 0.017 0 0.003 0.059 0.058 0 0.002 0.054 0.052
Pollutant Name: PM10 ‐ Tire Wear Temperature: 67F Relative Humidity: 55%
Speed MHD MHD MHD MHD HHD HHD HHD HHD ALL ALL ALL ALL
MPH NCAT CAT DSL ALL NCAT CAT DSL ALL NCAT CAT DSL ALL
45 0 0.012 0.012 0.012 0 0.012 0.036 0.036 0 0.012 0.033 0.032
55 0 0.012 0.012 0.012 0 0.012 0.036 0.036 0 0.012 0.033 0.032
Pollutant Name: PM10 ‐ Brake Wear Temperature: 67F Relative Humidity: 55%
Speed MHD MHD MHD MHD HHD HHD HHD HHD ALL ALL ALL ALL
MPH NCAT CAT DSL ALL NCAT CAT DSL ALL NCAT CAT DSL ALL
45 0 0.013 0.013 0.013 0 0.028 0.028 0.028 0 0.018 0.026 0.026
55 0 0.013 0.013 0.013 0 0.028 0.028 0.028 0 0.018 0.026 0.026
Pollutant Name: PM2.5 Temperature: 67F Relative Humidity: 55%
Speed MHD MHD MHD MHD HHD HHD HHD HHD ALL ALL ALL ALL
MPH NCAT CAT DSL ALL NCAT CAT DSL ALL NCAT CAT DSL ALL
45 0 0.001 0.022 0.018 0 0.003 0.042 0.041 0 0.002 0.039 0.037
55 0 0.001 0.019 0.016 0 0.003 0.054 0.053 0 0.001 0.05 0.048
Pollutant Name: PM2.5 ‐ Tire Wear Temperature: 67F Relative Humidity: 55%
Speed MHD MHD MHD MHD HHD HHD HHD HHD ALL ALL ALL ALL
MPH NCAT CAT DSL ALL NCAT CAT DSL ALL NCAT CAT DSL ALL
45 0 0.003 0.003 0.003 0 0.003 0.009 0.009 0 0.003 0.008 0.008
55 0 0.003 0.003 0.003 0 0.003 0.009 0.009 0 0.003 0.008 0.008
Pollutant Name: PM2.5 ‐ Brake Wear Temperature: 67F Relative Humidity: 55%
Speed MHD MHD MHD MHD HHD HHD HHD HHD ALL ALL ALL ALL
MPH NCAT CAT DSL ALL NCAT CAT DSL ALL NCAT CAT DSL ALL
45 0 0.005 0.005 0.005 0 0.012 0.012 0.012 0 0.008 0.011 0.011
55 0 0.005 0.005 0.005 0 0.012 0.012 0.012 0 0.008 0.011 0.011
Pollutant Name: Methane Temperature: 67F Relative Humidity: 55%
Speed MHD MHD MHD MHD HHD HHD HHD HHD ALL ALL ALL ALL
MPH NCAT CAT DSL ALL NCAT CAT DSL ALL NCAT CAT DSL ALL
45 0 0.006 0.001 0.002 0 0.063 0.005 0.006 0 0.026 0.005 0.006
55 0 0.005 0.001 0.002 0 0.058 0.005 0.005 0 0.023 0.004 0.005
APPENDIX C
2035 Operational Emissions

CALIFORNIA HIGH-SPEED TRAIN PROJECT EIR/EIS AIR QUALITY TECHNICAL REPORT MERCED TO FRESNO SECTION APPENDIX C
Page i
Contents
C. 2035 Operational Emissions Appendix C.1 HST 2035 Operational Emissions Summary File
C.1-1 Summary of Operation-Related GHG Emissions C.1-2 Summary of Operational Emissions C.1-3 Merced Train Station: Operational Emissions C.1-4 Heavy Maintenance Facility: Onsite Operational Emissions C.1-5 Heavy Maintenance Facility: Offsite Operational Emissions C.1-6 Overnight Layover / Servicing Facility: Operational Emissions C.1-7 Train Dust Wake: Fugitive Dust Emissions C.1-8 Regional Emissions: Vehicle Miles Traveled C.1-9 Statewide Emissions: Vehicle Miles Traveled C.1-10 Regional and Statewide Emissions: Power and Flight Demands
C.2 URBEMIS2007 Output File: Merced Station – Operation 2035
C.3 EMFAC Output Files C.3-1 Emission Factors for Non-Bus Offsite Vehicles for 2035 Operational Emissions C.3-2 Emission Factors for Buses for 2035 Operational Emissions

C.1 HST 2035 Operational Emissions

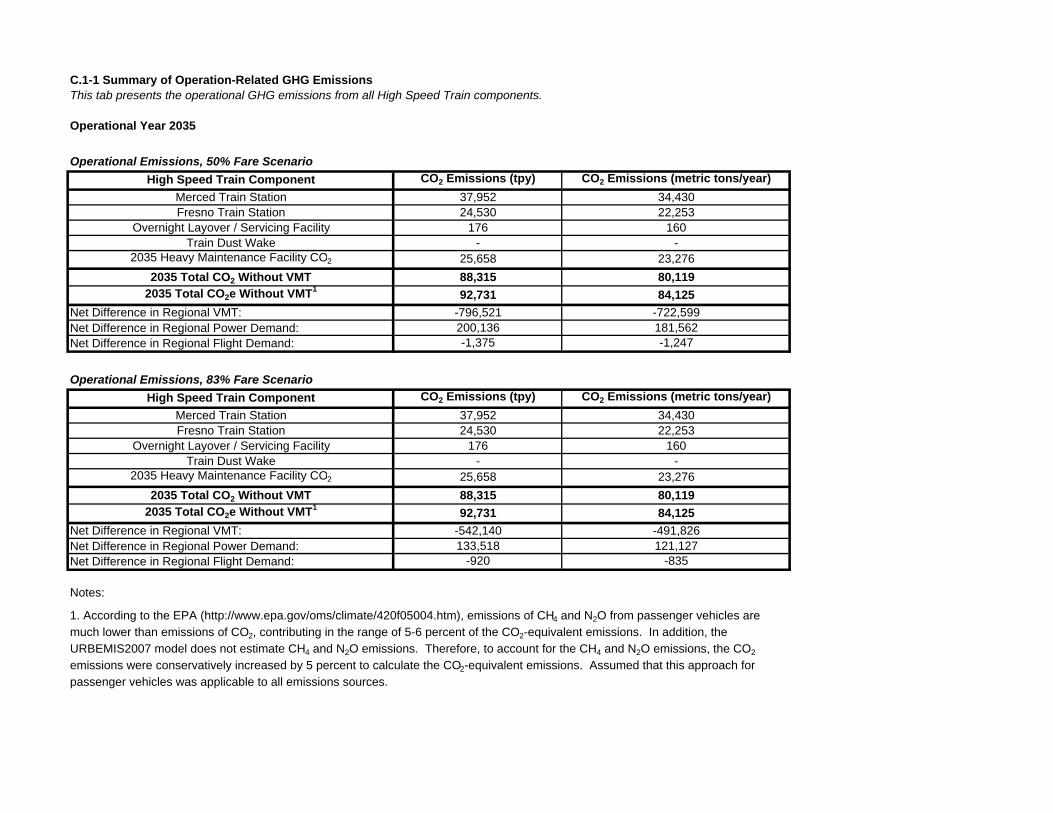
C.1-1 Summary of Operation-Related GHG EmissionsThis tab presents the operational GHG emissions from all High Speed Train components.
Operational Year 2035
Operational Emissions, 50% Fare Scenario
High Speed Train Component CO2 Emissions (tpy) CO2 Emissions (metric tons/year)
Merced Train Station 37,952 34,430Fresno Train Station 24,530 22,253
Overnight Layover / Servicing Facility 176 160Train Dust Wake - -
2035 Heavy Maintenance Facility CO2 25,658 23,276
2035 Total CO2 Without VMT 88,315 80,1192035 Total CO2e Without VMT1
92,731 84,125
Net Difference in Regional VMT: -796,521 -722,599Net Difference in Regional Power Demand: 200,136 181,562Net Difference in Regional Flight Demand: -1,375 -1,247
Operational Emissions, 83% Fare Scenario
High Speed Train Component CO2 Emissions (tpy) CO2 Emissions (metric tons/year)
Merced Train Station 37,952 34,430Fresno Train Station 24,530 22,253
Overnight Layover / Servicing Facility 176 160Train Dust Wake - -
2035 Heavy Maintenance Facility CO2 25,658 23,276
2035 Total CO2 Without VMT 88,315 80,1192035 Total CO2e Without VMT1
92,731 84,125
Net Difference in Regional VMT: -542,140 -491,826Net Difference in Regional Power Demand: 133,518 121,127Net Difference in Regional Flight Demand: -920 -835
Notes:
1. According to the EPA (http://www.epa.gov/oms/climate/420f05004.htm), emissions of CH4 and N2O from passenger vehicles are much lower than emissions of CO2, contributing in the range of 5-6 percent of the CO2-equivalent emissions. In addition, the URBEMIS2007 model does not estimate CH4 and N2O emissions. Therefore, to account for the CH4 and N2O emissions, the CO2
emissions were conservatively increased by 5 percent to calculate the CO2-equivalent emissions. Assumed that this approach for passenger vehicles was applicable to all emissions sources.
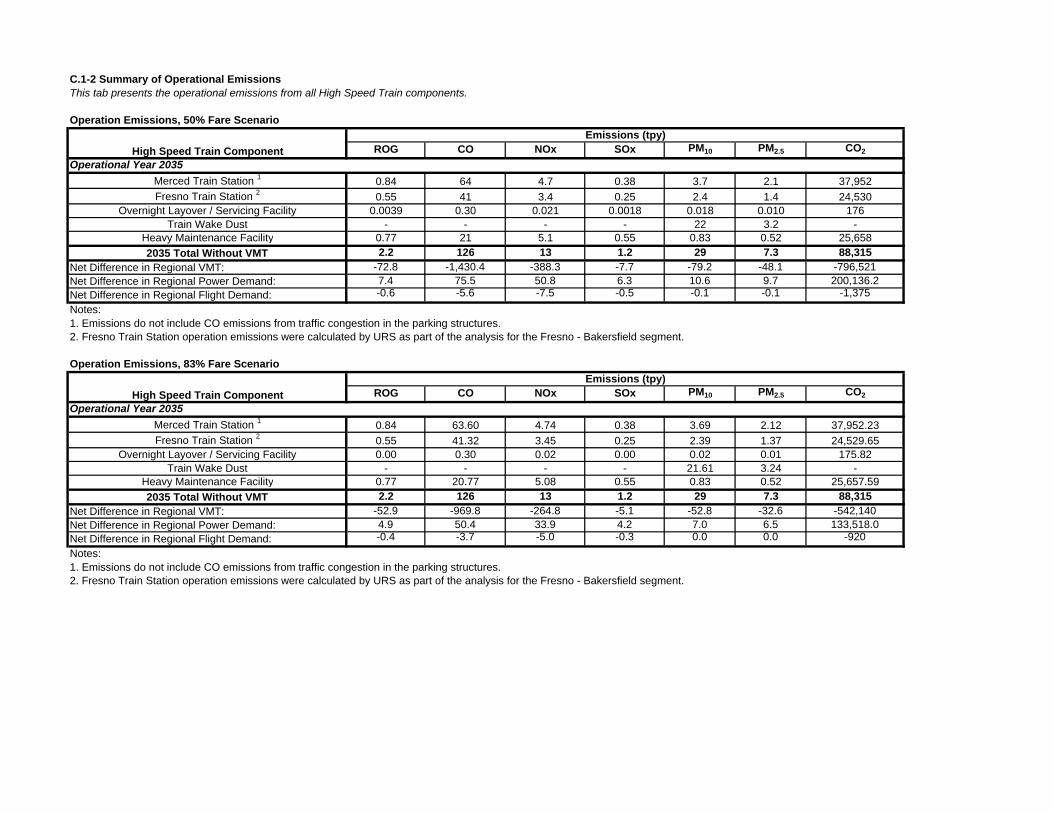
C.1-2 Summary of Operational Emissions This tab presents the operational emissions from all High Speed Train components.
Operation Emissions, 50% Fare Scenario
ROG CO NOx SOx PM10 PM2.5 CO2
Operational Year 2035
Merced Train Station 1 0.84 64 4.7 0.38 3.7 2.1 37,952
Fresno Train Station 2 0.55 41 3.4 0.25 2.4 1.4 24,530Overnight Layover / Servicing Facility 0.0039 0.30 0.021 0.0018 0.018 0.010 176
Train Wake Dust - - - - 22 3.2 -Heavy Maintenance Facility 0.77 21 5.1 0.55 0.83 0.52 25,658
2035 Total Without VMT 2.2 126 13 1.2 29 7.3 88,315
Net Difference in Regional VMT: -72.8 -1,430.4 -388.3 -7.7 -79.2 -48.1 -796,521Net Difference in Regional Power Demand: 7.4 75.5 50.8 6.3 10.6 9.7 200,136.2Net Difference in Regional Flight Demand: -0.6 -5.6 -7.5 -0.5 -0.1 -0.1 -1,375
Notes:1. Emissions do not include CO emissions from traffic congestion in the parking structures.
Operation Emissions, 83% Fare Scenario
ROG CO NOx SOx PM10 PM2.5 CO2
Operational Year 2035
Merced Train Station 1 0.84 63.60 4.74 0.38 3.69 2.12 37,952.23
Fresno Train Station 2 0.55 41.32 3.45 0.25 2.39 1.37 24,529.65Overnight Layover / Servicing Facility 0.00 0.30 0.02 0.00 0.02 0.01 175.82
Train Wake Dust - - - - 21.61 3.24 -Heavy Maintenance Facility 0.77 20.77 5.08 0.55 0.83 0.52 25,657.59
2035 Total Without VMT 2.2 126 13 1.2 29 7.3 88,315
Net Difference in Regional VMT: -52.9 -969.8 -264.8 -5.1 -52.8 -32.6 -542,140Net Difference in Regional Power Demand: 4.9 50.4 33.9 4.2 7.0 6.5 133,518.0Net Difference in Regional Flight Demand: -0.4 -3.7 -5.0 -0.3 0.0 0.0 -920
Notes:1. Emissions do not include CO emissions from traffic congestion in the parking structures.2. Fresno Train Station operation emissions were calculated by URS as part of the analysis for the Fresno - Bakersfield segment.
High Speed Train Component
Emissions (tpy)
2. Fresno Train Station operation emissions were calculated by URS as part of the analysis for the Fresno - Bakersfield segment.
High Speed Train Component
Emissions (tpy)
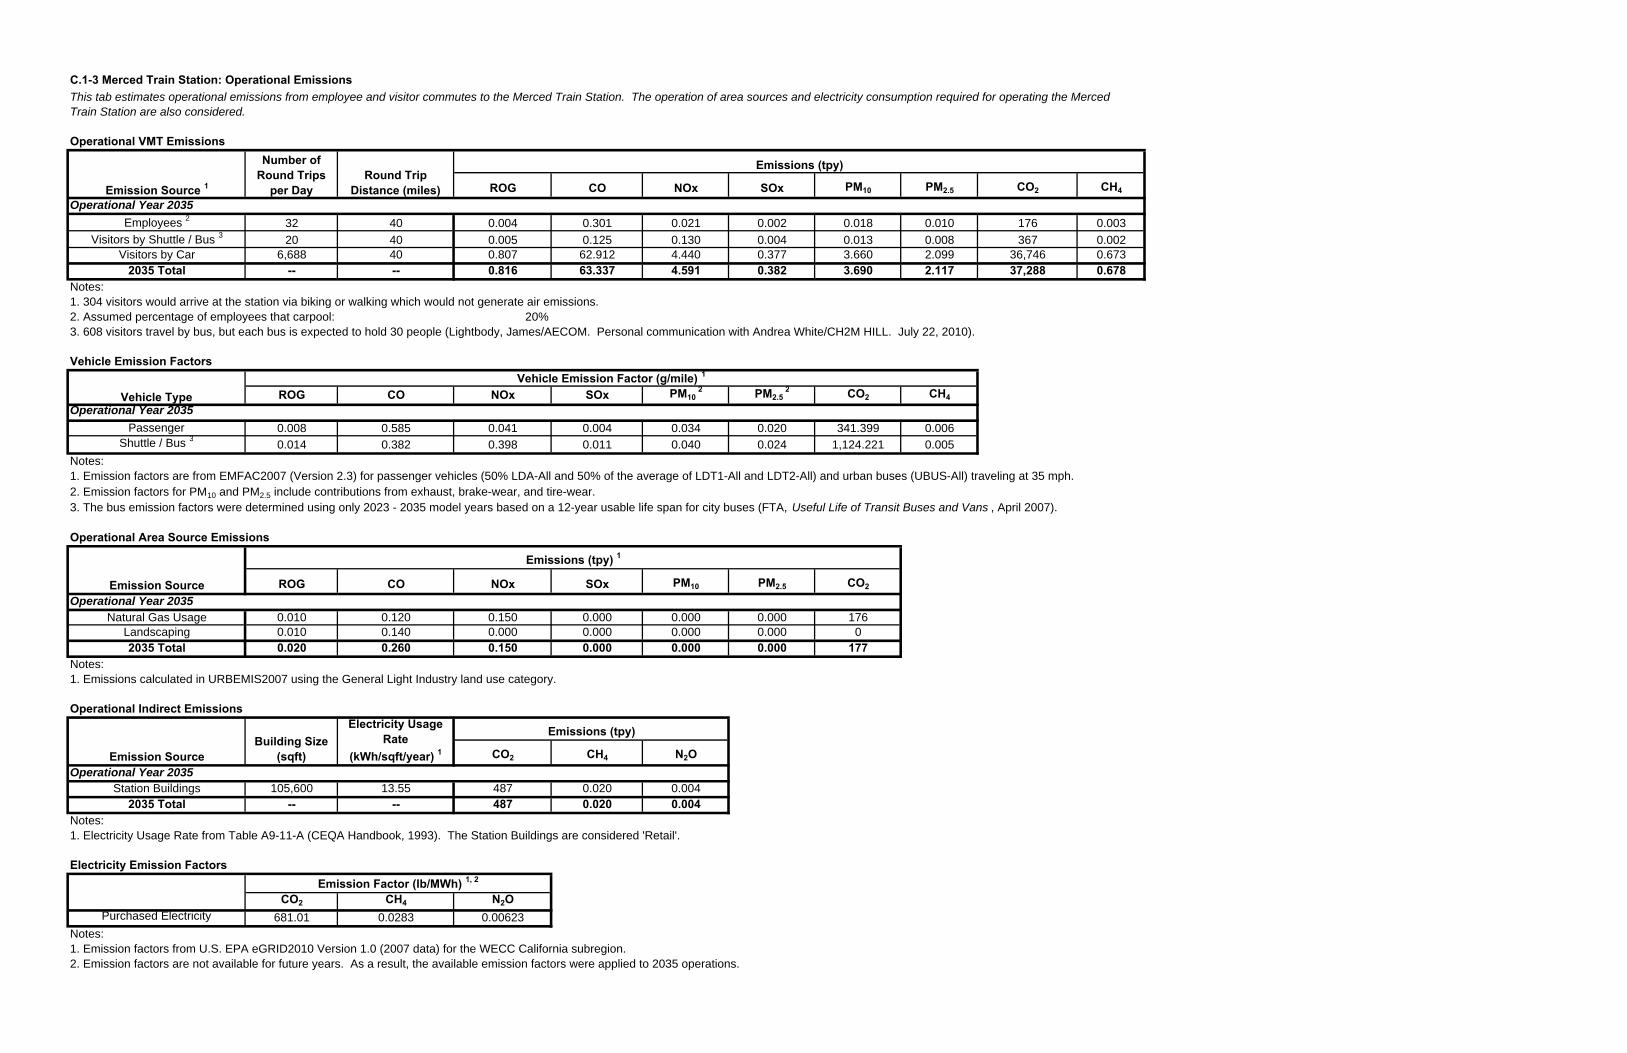
C.1-3 Merced Train Station: Operational Emissions
Operational VMT Emissions
ROG CO NOx SOx PM10 PM2.5 CO2 CH4
Operational Year 2035
Employees 2 32 40 0.004 0.301 0.021 0.002 0.018 0.010 176 0.003
Visitors by Shuttle / Bus 3 20 40 0.005 0.125 0.130 0.004 0.013 0.008 367 0.002Visitors by Car 6,688 40 0.807 62.912 4.440 0.377 3.660 2.099 36,746 0.673
2035 Total -- -- 0.816 63.337 4.591 0.382 3.690 2.117 37,288 0.678Notes:1. 304 visitors would arrive at the station via biking or walking which would not generate air emissions.2. Assumed percentage of employees that carpool: 20%3. 608 visitors travel by bus, but each bus is expected to hold 30 people (Lightbody, James/AECOM. Personal communication with Andrea White/CH2M HILL. July 22, 2010).
Vehicle Emission Factors
ROG CO NOx SOx PM10 2 PM2.5
2 CO2 CH4
Operational Year 2035
Passenger 0.008 0.585 0.041 0.004 0.034 0.020 341.399 0.006Shuttle / Bus 3 0.014 0.382 0.398 0.011 0.040 0.024 1,124.221 0.005
Notes:1. Emission factors are from EMFAC2007 (Version 2.3) for passenger vehicles (50% LDA-All and 50% of the average of LDT1-All and LDT2-All) and urban buses (UBUS-All) traveling at 35 mph.2. Emission factors for PM10 and PM2.5 include contributions from exhaust, brake-wear, and tire-wear.3. The bus emission factors were determined using only 2023 - 2035 model years based on a 12-year usable life span for city buses (FTA, Useful Life of Transit Buses and Vans , April 2007).
Operational Area Source Emissions
ROG CO NOx SOx PM10 PM2.5 CO2
Operational Year 2035Natural Gas Usage 0.010 0.120 0.150 0.000 0.000 0.000 176
Landscaping 0.010 0.140 0.000 0.000 0.000 0.000 02035 Total 0.020 0.260 0.150 0.000 0.000 0.000 177
Notes:
Operational Indirect Emissions
CO2 CH4 N2OOperational Year 2035
Station Buildings 105,600 13.55 487 0.020 0.0042035 Total -- -- 487 0.020 0.004
Notes:1. Electricity Usage Rate from Table A9-11-A (CEQA Handbook, 1993). The Station Buildings are considered 'Retail'.
Electricity Emission Factors
CO2 CH4 N2OPurchased Electricity 681.01 0.0283 0.00623
Notes:1. Emission factors from U.S. EPA eGRID2010 Version 1.0 (2007 data) for the WECC California subregion.2. Emission factors are not available for future years. As a result, the available emission factors were applied to 2035 operations.
Emission Factor (lb/MWh) 1, 2
Emissions (tpy)
Emission SourceBuilding Size
(sqft)
Electricity Usage Rate
(kWh/sqft/year) 1
This tab estimates operational emissions from employee and visitor commutes to the Merced Train Station. The operation of area sources and electricity consumption required for operating the Merced Train Station are also considered.
1. Emissions calculated in URBEMIS2007 using the General Light Industry land use category.
Emissions (tpy)
Emission Source
Vehicle TypeVehicle Emission Factor (g/mile) 1
Emission Source 1
Number of Round Trips
per DayRound Trip
Distance (miles)
Emissions (tpy) 1
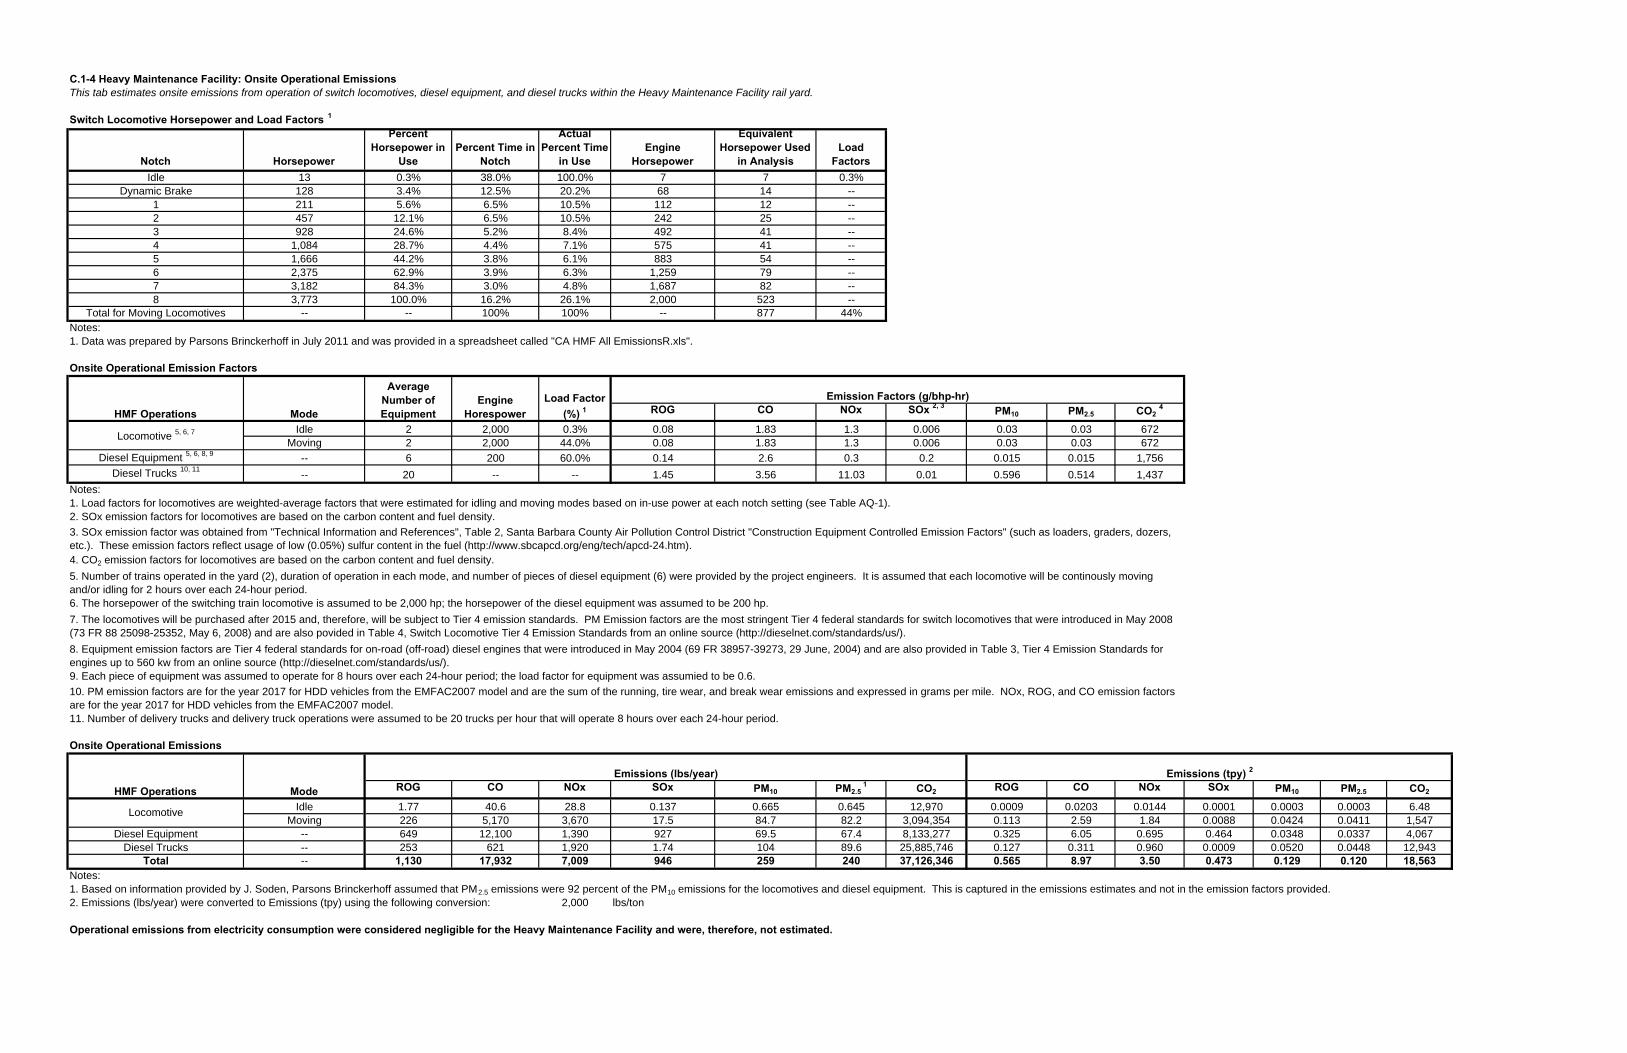
C.1-4 Heavy Maintenance Facility: Onsite Operational Emissions
Switch Locomotive Horsepower and Load Factors 1
Notch Horsepower
Percent Horsepower in
UsePercent Time in
Notch
Actual Percent Time
in UseEngine
Horsepower
Equivalent Horsepower Used
in AnalysisLoad
FactorsIdle 13 0.3% 38.0% 100.0% 7 7 0.3%
Dynamic Brake 128 3.4% 12.5% 20.2% 68 14 --1 211 5.6% 6.5% 10.5% 112 12 --2 457 12.1% 6.5% 10.5% 242 25 --3 928 24.6% 5.2% 8.4% 492 41 --4 1,084 28.7% 4.4% 7.1% 575 41 --5 1,666 44.2% 3.8% 6.1% 883 54 --6 2,375 62.9% 3.9% 6.3% 1,259 79 --7 3,182 84.3% 3.0% 4.8% 1,687 82 --8 3,773 100.0% 16.2% 26.1% 2,000 523 --
Total for Moving Locomotives -- -- 100% 100% -- 877 44%Notes:1. Data was prepared by Parsons Brinckerhoff in July 2011 and was provided in a spreadsheet called "CA HMF All EmissionsR.xls".
Onsite Operational Emission Factors
ROG CO NOx SOx 2, 3 PM10 PM2.5 CO2 4
Idle 2 2,000 0.3% 0.08 1.83 1.3 0.006 0.03 0.03 672Moving 2 2,000 44.0% 0.08 1.83 1.3 0.006 0.03 0.03 672
Diesel Equipment 5, 6, 8, 9 -- 6 200 60.0% 0.14 2.6 0.3 0.2 0.015 0.015 1,756
Diesel Trucks 10, 11-- 20 -- -- 1.45 3.56 11.03 0.01 0.596 0.514 1,437
Notes:1. Load factors for locomotives are weighted-average factors that were estimated for idling and moving modes based on in-use power at each notch setting (see Table AQ-1).2. SOx emission factors for locomotives are based on the carbon content and fuel density.
4. CO2 emission factors for locomotives are based on the carbon content and fuel density.
6. The horsepower of the switching train locomotive is assumed to be 2,000 hp; the horsepower of the diesel equipment was assumed to be 200 hp.
9. Each piece of equipment was assumed to operate for 8 hours over each 24-hour period; the load factor for equipment was assumied to be 0.6.
11. Number of delivery trucks and delivery truck operations were assumed to be 20 trucks per hour that will operate 8 hours over each 24-hour period.
Onsite Operational Emissions
ROG CO NOx SOx PM10 PM2.5 1 CO2 ROG CO NOx SOx PM10 PM2.5 CO2
Idle 1.77 40.6 28.8 0.137 0.665 0.645 12,970 0.0009 0.0203 0.0144 0.0001 0.0003 0.0003 6.48Moving 226 5,170 3,670 17.5 84.7 82.2 3,094,354 0.113 2.59 1.84 0.0088 0.0424 0.0411 1,547
Diesel Equipment -- 649 12,100 1,390 927 69.5 67.4 8,133,277 0.325 6.05 0.695 0.464 0.0348 0.0337 4,067Diesel Trucks -- 253 621 1,920 1.74 104 89.6 25,885,746 0.127 0.311 0.960 0.0009 0.0520 0.0448 12,943
Total -- 1,130 17,932 7,009 946 259 240 37,126,346 0.565 8.97 3.50 0.473 0.129 0.120 18,563Notes:
2. Emissions (lbs/year) were converted to Emissions (tpy) using the following conversion: 2,000 lbs/ton
Operational emissions from electricity consumption were considered negligible for the Heavy Maintenance Facility and were, therefore, not estimated.
This tab estimates onsite emissions from operation of switch locomotives, diesel equipment, and diesel trucks within the Heavy Maintenance Facility rail yard.
HMF Operations Mode
Locomotive
Locomotive 5, 6, 7
Emission Factors (g/bhp-hr)HMF Operations Mode
Average Number of Equipment
Engine Horespower
Load Factor (%) 1
1. Based on information provided by J. Soden, Parsons Brinckerhoff assumed that PM2.5 emissions were 92 percent of the PM10 emissions for the locomotives and diesel equipment. This is captured in the emissions estimates and not in the emission factors provided.
Emissions (lbs/year) Emissions (tpy) 2
3. SOx emission factor was obtained from "Technical Information and References", Table 2, Santa Barbara County Air Pollution Control District "Construction Equipment Controlled Emission Factors" (such as loaders, graders, dozers, etc.). These emission factors reflect usage of low (0.05%) sulfur content in the fuel (http://www.sbcapcd.org/eng/tech/apcd-24.htm).
5. Number of trains operated in the yard (2), duration of operation in each mode, and number of pieces of diesel equipment (6) were provided by the project engineers. It is assumed that each locomotive will be continously moving and/or idling for 2 hours over each 24-hour period.
7. The locomotives will be purchased after 2015 and, therefore, will be subject to Tier 4 emission standards. PM Emission factors are the most stringent Tier 4 federal standards for switch locomotives that were introduced in May 2008 (73 FR 88 25098-25352, May 6, 2008) and are also povided in Table 4, Switch Locomotive Tier 4 Emission Standards from an online source (http://dieselnet.com/standards/us/).
8. Equipment emission factors are Tier 4 federal standards for on-road (off-road) diesel engines that were introduced in May 2004 (69 FR 38957-39273, 29 June, 2004) and are also provided in Table 3, Tier 4 Emission Standards for engines up to 560 kw from an online source (http://dieselnet.com/standards/us/).
10. PM emission factors are for the year 2017 for HDD vehicles from the EMFAC2007 model and are the sum of the running, tire wear, and break wear emissions and expressed in grams per mile. NOx, ROG, and CO emission factors are for the year 2017 for HDD vehicles from the EMFAC2007 model.
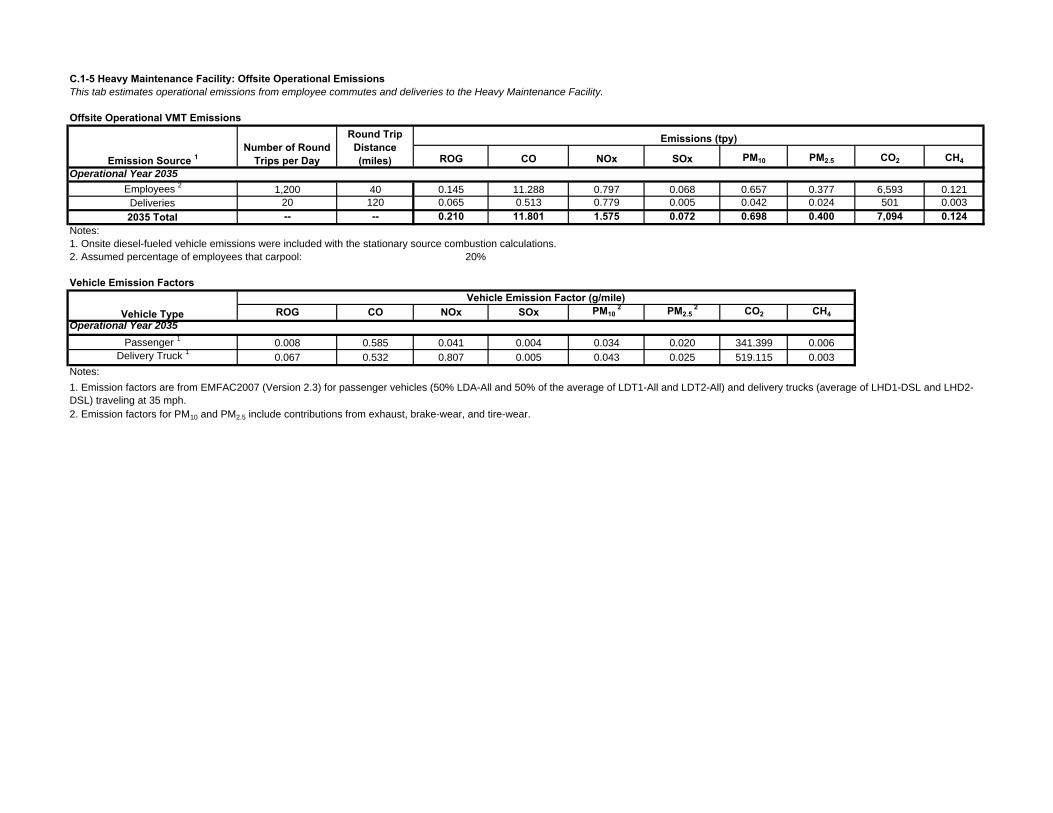
C.1-5 Heavy Maintenance Facility: Offsite Operational EmissionsThis tab estimates operational emissions from employee commutes and deliveries to the Heavy Maintenance Facility.
Offsite Operational VMT Emissions
ROG CO NOx SOx PM10 PM2.5 CO2 CH4
Operational Year 2035
Employees 2 1,200 40 0.145 11.288 0.797 0.068 0.657 0.377 6,593 0.121Deliveries 20 120 0.065 0.513 0.779 0.005 0.042 0.024 501 0.003
2035 Total -- -- 0.210 11.801 1.575 0.072 0.698 0.400 7,094 0.124Notes:1. Onsite diesel-fueled vehicle emissions were included with the stationary source combustion calculations.2. Assumed percentage of employees that carpool: 20%
Vehicle Emission Factors
ROG CO NOx SOx PM10 2 PM2.5
2 CO2 CH4
Operational Year 2035
Passenger 1 0.008 0.585 0.041 0.004 0.034 0.020 341.399 0.006Delivery Truck 1 0.067 0.532 0.807 0.005 0.043 0.025 519.115 0.003
Notes:
2. Emission factors for PM10 and PM2.5 include contributions from exhaust, brake-wear, and tire-wear.
Vehicle Type
1. Emission factors are from EMFAC2007 (Version 2.3) for passenger vehicles (50% LDA-All and 50% of the average of LDT1-All and LDT2-All) and delivery trucks (average of LHD1-DSL and LHD2-DSL) traveling at 35 mph.
Vehicle Emission Factor (g/mile)
Emissions (tpy)
Emission Source 1Number of Round
Trips per Day
Round Trip Distance (miles)
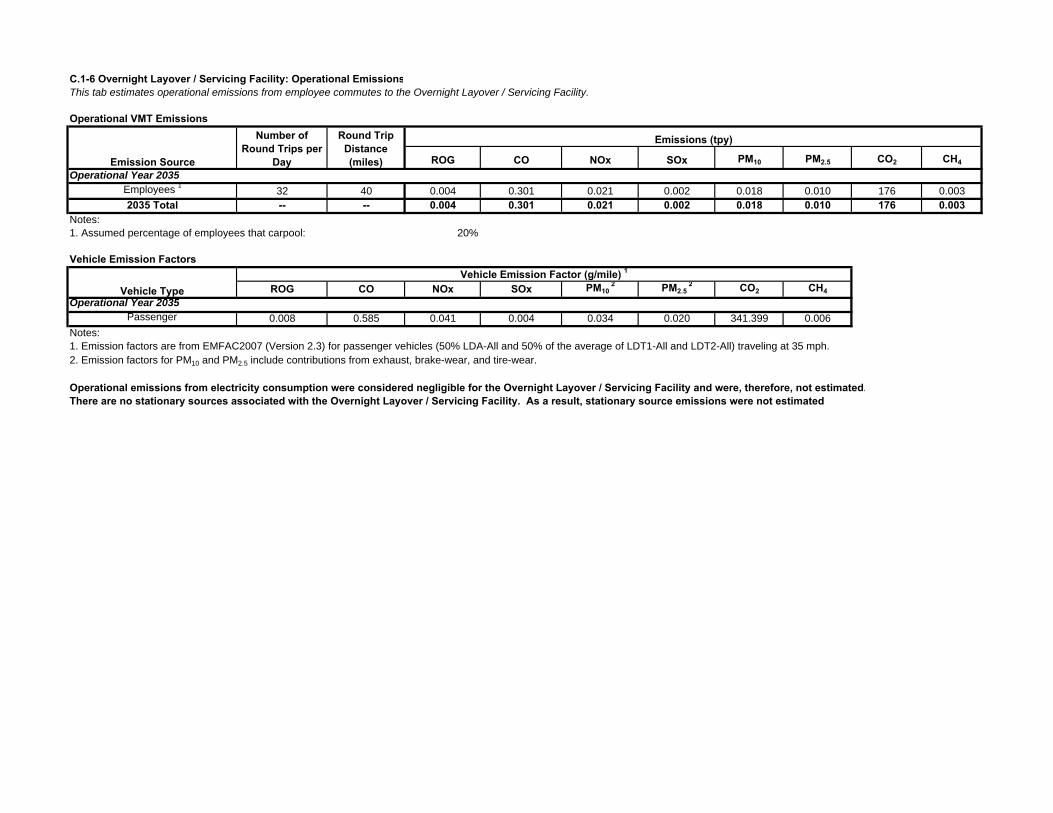
C.1-6 Overnight Layover / Servicing Facility: Operational EmissionsThis tab estimates operational emissions from employee commutes to the Overnight Layover / Servicing Facility.
Operational VMT Emissions
ROG CO NOx SOx PM10 PM2.5 CO2 CH4
Operational Year 2035Employees 1 32 40 0.004 0.301 0.021 0.002 0.018 0.010 176 0.0032035 Total -- -- 0.004 0.301 0.021 0.002 0.018 0.010 176 0.003
Notes:1. Assumed percentage of employees that carpool: 20%
Vehicle Emission Factors
ROG CO NOx SOx PM10 2 PM2.5
2 CO2 CH4
Operational Year 2035Passenger 0.008 0.585 0.041 0.004 0.034 0.020 341.399 0.006
Notes:
2. Emission factors for PM10 and PM2.5 include contributions from exhaust, brake-wear, and tire-wear.
Operational emissions from electricity consumption were considered negligible for the Overnight Layover / Servicing Facility and were, therefore, not estimated.There are no stationary sources associated with the Overnight Layover / Servicing Facility. As a result, stationary source emissions were not estimated.
Emissions (tpy)
Vehicle TypeVehicle Emission Factor (g/mile) 1
1. Emission factors are from EMFAC2007 (Version 2.3) for passenger vehicles (50% LDA-All and 50% of the average of LDT1-All and LDT2-All) traveling at 35 mph.
Emission Source
Number of Round Trips per
Day
Round Trip Distance (miles)
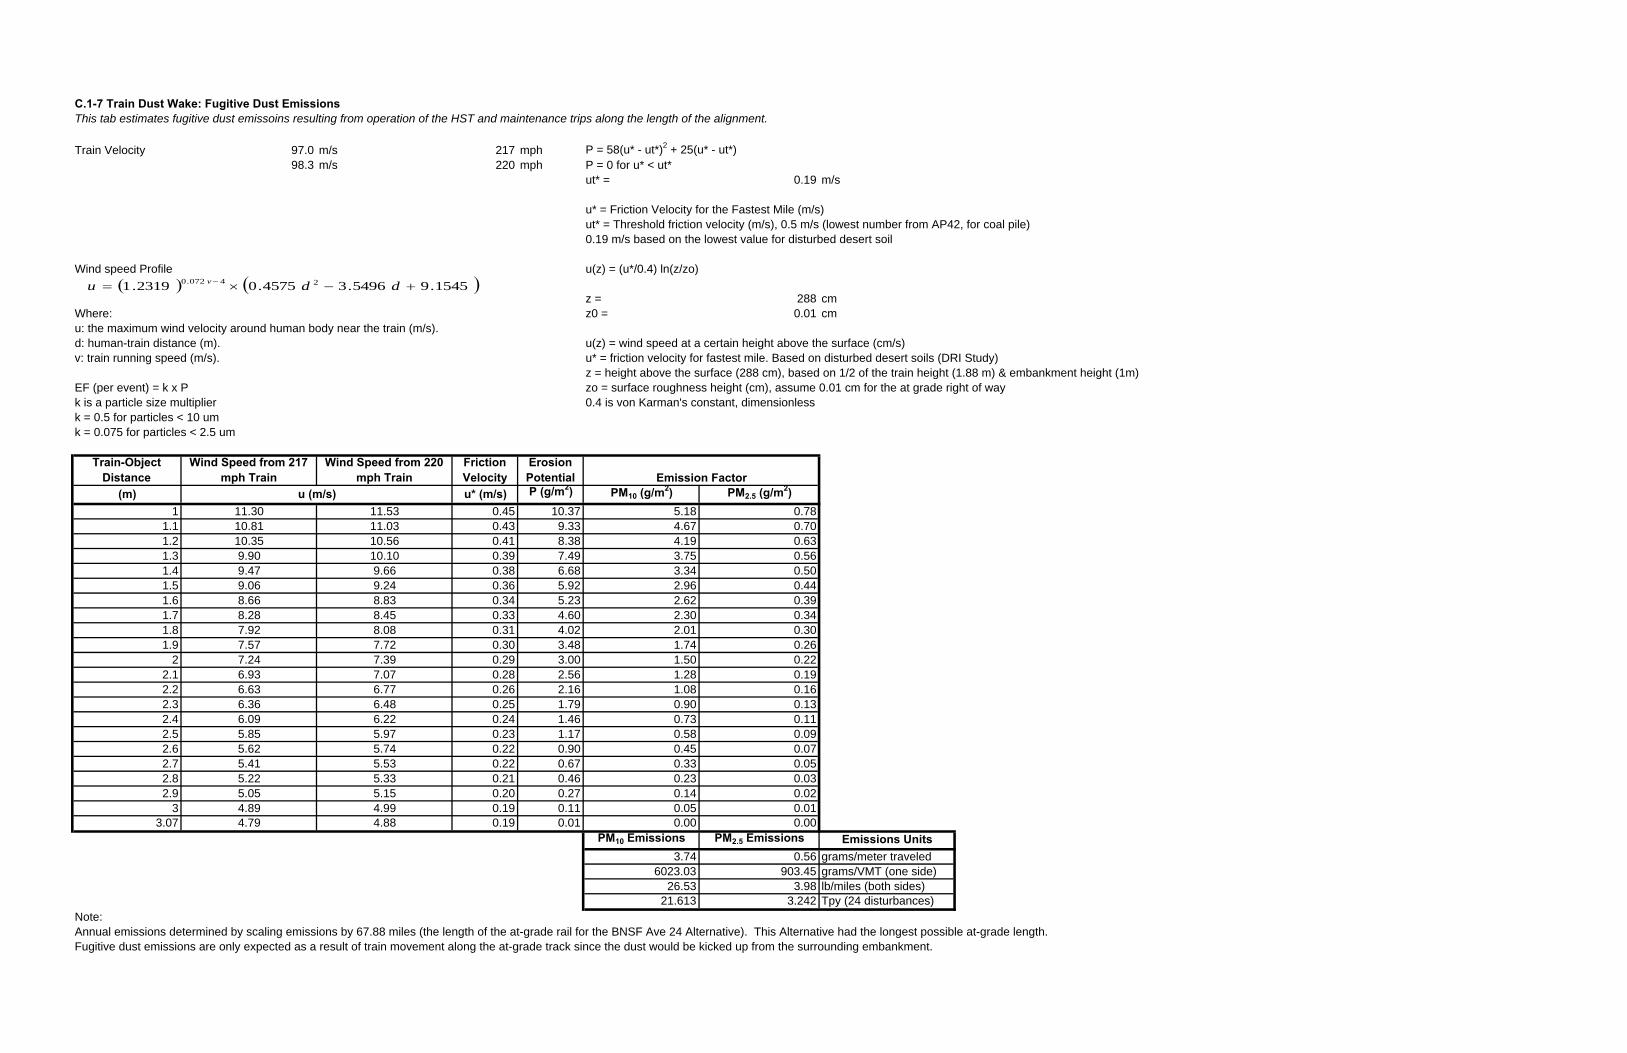
C.1-7 Train Dust Wake: Fugitive Dust EmissionsThis tab estimates fugitive dust emissoins resulting from operation of the HST and maintenance trips along the length of the alignment.
Train Velocity 97.0 m/s 217 mph P = 58(u* - ut*)2 + 25(u* - ut*)98.3 m/s 220 mph P = 0 for u* < ut*
ut* = 0.19 m/s
u* = Friction Velocity for the Fastest Mile (m/s)ut* = Threshold friction velocity (m/s), 0.5 m/s (lowest number from AP42, for coal pile)0.19 m/s based on the lowest value for disturbed desert soil
Wind speed Profile u(z) = (u*/0.4) ln(z/zo)
z = 288 cmWhere: z0 = 0.01 cmu: the maximum wind velocity around human body near the train (m/s).d: human-train distance (m). u(z) = wind speed at a certain height above the surface (cm/s)v: train running speed (m/s). u* = friction velocity for fastest mile. Based on disturbed desert soils (DRI Study)
z = height above the surface (288 cm), based on 1/2 of the train height (1.88 m) & embankment height (1m)EF (per event) = k x P zo = surface roughness height (cm), assume 0.01 cm for the at grade right of wayk is a particle size multiplier 0.4 is von Karman's constant, dimensionlessk = 0.5 for particles < 10 umk = 0.075 for particles < 2.5 um
Train-Object Distance
Wind Speed from 217 mph Train
Wind Speed from 220 mph Train
Friction Velocity
Erosion Potential
(m) u* (m/s) P (g/m2) PM10 (g/m2) PM2.5 (g/m2)1 11.30 11.53 0.45 10.37 5.18 0.78
1.1 10.81 11.03 0.43 9.33 4.67 0.701.2 10.35 10.56 0.41 8.38 4.19 0.631.3 9.90 10.10 0.39 7.49 3.75 0.561.4 9.47 9.66 0.38 6.68 3.34 0.501.5 9.06 9.24 0.36 5.92 2.96 0.441.6 8.66 8.83 0.34 5.23 2.62 0.391.7 8.28 8.45 0.33 4.60 2.30 0.341.8 7.92 8.08 0.31 4.02 2.01 0.301.9 7.57 7.72 0.30 3.48 1.74 0.26
2 7.24 7.39 0.29 3.00 1.50 0.222.1 6.93 7.07 0.28 2.56 1.28 0.192.2 6.63 6.77 0.26 2.16 1.08 0.162.3 6.36 6.48 0.25 1.79 0.90 0.132.4 6.09 6.22 0.24 1.46 0.73 0.112.5 5.85 5.97 0.23 1.17 0.58 0.092.6 5.62 5.74 0.22 0.90 0.45 0.072.7 5.41 5.53 0.22 0.67 0.33 0.052.8 5.22 5.33 0.21 0.46 0.23 0.032.9 5.05 5.15 0.20 0.27 0.14 0.02
3 4.89 4.99 0.19 0.11 0.05 0.013.07 4.79 4.88 0.19 0.01 0.00 0.00
PM10 Emissions PM2.5 Emissions Emissions Units3.74 0.56 grams/meter traveled
6023.03 903.45 grams/VMT (one side)26.53 3.98 lb/miles (both sides)
21.613 3.242 Tpy (24 disturbances)Note: Annual emissions determined by scaling emissions by 67.88 miles (the length of the at-grade rail for the BNSF Ave 24 Alternative). This Alternative had the longest possible at-grade length.Fugitive dust emissions are only expected as a result of train movement along the at-grade track since the dust would be kicked up from the surrounding embankment.
Emission Factoru (m/s)
1545.95496.34575.02319.1 24072.0 ddu v
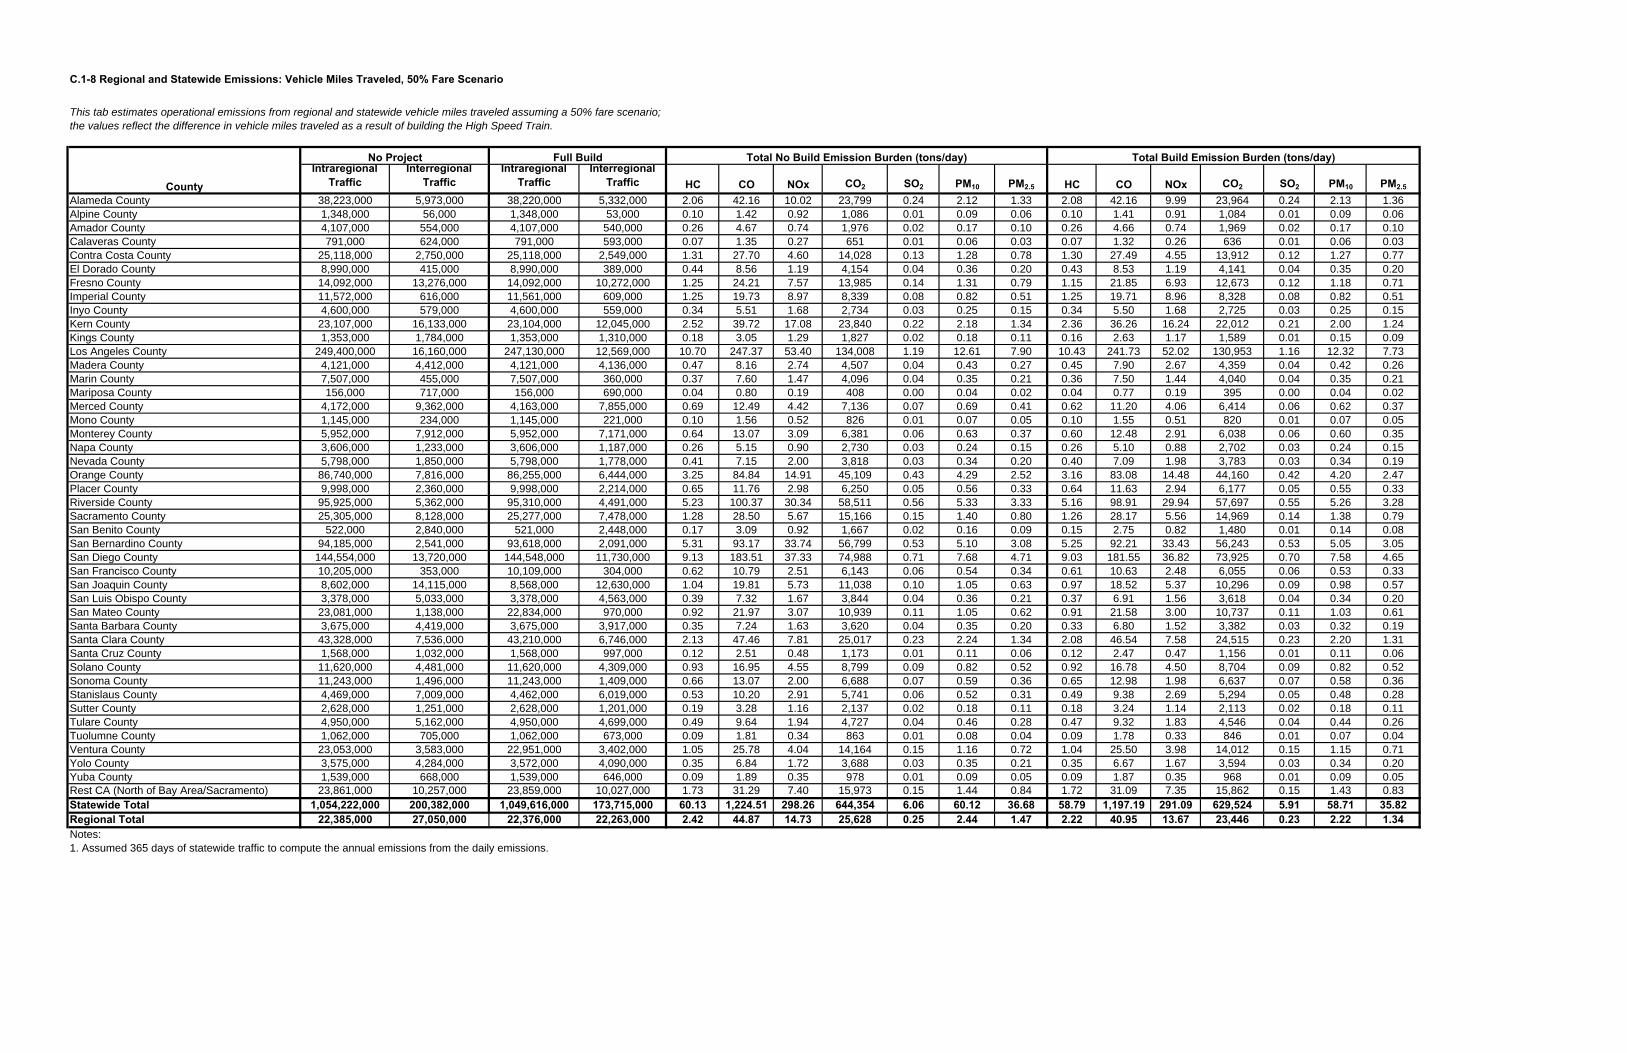
C.1-8 Regional and Statewide Emissions: Vehicle Miles Traveled, 50% Fare Scenario
Intraregional Traffic
Interregional Traffic
Intraregional Traffic
Interregional Traffic HC CO NOx CO2 SO2 PM10 PM2.5 HC CO NOx CO2 SO2 PM10 PM2.5
Alameda County 38,223,000 5,973,000 38,220,000 5,332,000 2.06 42.16 10.02 23,799 0.24 2.12 1.33 2.08 42.16 9.99 23,964 0.24 2.13 1.36Alpine County 1,348,000 56,000 1,348,000 53,000 0.10 1.42 0.92 1,086 0.01 0.09 0.06 0.10 1.41 0.91 1,084 0.01 0.09 0.06Amador County 4,107,000 554,000 4,107,000 540,000 0.26 4.67 0.74 1,976 0.02 0.17 0.10 0.26 4.66 0.74 1,969 0.02 0.17 0.10Calaveras County 791,000 624,000 791,000 593,000 0.07 1.35 0.27 651 0.01 0.06 0.03 0.07 1.32 0.26 636 0.01 0.06 0.03Contra Costa County 25,118,000 2,750,000 25,118,000 2,549,000 1.31 27.70 4.60 14,028 0.13 1.28 0.78 1.30 27.49 4.55 13,912 0.12 1.27 0.77El Dorado County 8,990,000 415,000 8,990,000 389,000 0.44 8.56 1.19 4,154 0.04 0.36 0.20 0.43 8.53 1.19 4,141 0.04 0.35 0.20Fresno County 14,092,000 13,276,000 14,092,000 10,272,000 1.25 24.21 7.57 13,985 0.14 1.31 0.79 1.15 21.85 6.93 12,673 0.12 1.18 0.71Imperial County 11,572,000 616,000 11,561,000 609,000 1.25 19.73 8.97 8,339 0.08 0.82 0.51 1.25 19.71 8.96 8,328 0.08 0.82 0.51Inyo County 4,600,000 579,000 4,600,000 559,000 0.34 5.51 1.68 2,734 0.03 0.25 0.15 0.34 5.50 1.68 2,725 0.03 0.25 0.15Kern County 23,107,000 16,133,000 23,104,000 12,045,000 2.52 39.72 17.08 23,840 0.22 2.18 1.34 2.36 36.26 16.24 22,012 0.21 2.00 1.24Kings County 1,353,000 1,784,000 1,353,000 1,310,000 0.18 3.05 1.29 1,827 0.02 0.18 0.11 0.16 2.63 1.17 1,589 0.01 0.15 0.09Los Angeles County 249,400,000 16,160,000 247,130,000 12,569,000 10.70 247.37 53.40 134,008 1.19 12.61 7.90 10.43 241.73 52.02 130,953 1.16 12.32 7.73Madera County 4,121,000 4,412,000 4,121,000 4,136,000 0.47 8.16 2.74 4,507 0.04 0.43 0.27 0.45 7.90 2.67 4,359 0.04 0.42 0.26Marin County 7,507,000 455,000 7,507,000 360,000 0.37 7.60 1.47 4,096 0.04 0.35 0.21 0.36 7.50 1.44 4,040 0.04 0.35 0.21Mariposa County 156,000 717,000 156,000 690,000 0.04 0.80 0.19 408 0.00 0.04 0.02 0.04 0.77 0.19 395 0.00 0.04 0.02Merced County 4,172,000 9,362,000 4,163,000 7,855,000 0.69 12.49 4.42 7,136 0.07 0.69 0.41 0.62 11.20 4.06 6,414 0.06 0.62 0.37Mono County 1,145,000 234,000 1,145,000 221,000 0.10 1.56 0.52 826 0.01 0.07 0.05 0.10 1.55 0.51 820 0.01 0.07 0.05Monterey County 5,952,000 7,912,000 5,952,000 7,171,000 0.64 13.07 3.09 6,381 0.06 0.63 0.37 0.60 12.48 2.91 6,038 0.06 0.60 0.35Napa County 3,606,000 1,233,000 3,606,000 1,187,000 0.26 5.15 0.90 2,730 0.03 0.24 0.15 0.26 5.10 0.88 2,702 0.03 0.24 0.15Nevada County 5,798,000 1,850,000 5,798,000 1,778,000 0.41 7.15 2.00 3,818 0.03 0.34 0.20 0.40 7.09 1.98 3,783 0.03 0.34 0.19Orange County 86,740,000 7,816,000 86,255,000 6,444,000 3.25 84.84 14.91 45,109 0.43 4.29 2.52 3.16 83.08 14.48 44,160 0.42 4.20 2.47Placer County 9,998,000 2,360,000 9,998,000 2,214,000 0.65 11.76 2.98 6,250 0.05 0.56 0.33 0.64 11.63 2.94 6,177 0.05 0.55 0.33Riverside County 95,925,000 5,362,000 95,310,000 4,491,000 5.23 100.37 30.34 58,511 0.56 5.33 3.33 5.16 98.91 29.94 57,697 0.55 5.26 3.28Sacramento County 25,305,000 8,128,000 25,277,000 7,478,000 1.28 28.50 5.67 15,166 0.15 1.40 0.80 1.26 28.17 5.56 14,969 0.14 1.38 0.79San Benito County 522,000 2,840,000 521,000 2,448,000 0.17 3.09 0.92 1,667 0.02 0.16 0.09 0.15 2.75 0.82 1,480 0.01 0.14 0.08San Bernardino County 94,185,000 2,541,000 93,618,000 2,091,000 5.31 93.17 33.74 56,799 0.53 5.10 3.08 5.25 92.21 33.43 56,243 0.53 5.05 3.05San Diego County 144,554,000 13,720,000 144,548,000 11,730,000 9.13 183.51 37.33 74,988 0.71 7.68 4.71 9.03 181.55 36.82 73,925 0.70 7.58 4.65San Francisco County 10,205,000 353,000 10,109,000 304,000 0.62 10.79 2.51 6,143 0.06 0.54 0.34 0.61 10.63 2.48 6,055 0.06 0.53 0.33San Joaquin County 8,602,000 14,115,000 8,568,000 12,630,000 1.04 19.81 5.73 11,038 0.10 1.05 0.63 0.97 18.52 5.37 10,296 0.09 0.98 0.57San Luis Obispo County 3,378,000 5,033,000 3,378,000 4,563,000 0.39 7.32 1.67 3,844 0.04 0.36 0.21 0.37 6.91 1.56 3,618 0.04 0.34 0.20San Mateo County 23,081,000 1,138,000 22,834,000 970,000 0.92 21.97 3.07 10,939 0.11 1.05 0.62 0.91 21.58 3.00 10,737 0.11 1.03 0.61Santa Barbara County 3,675,000 4,419,000 3,675,000 3,917,000 0.35 7.24 1.63 3,620 0.04 0.35 0.20 0.33 6.80 1.52 3,382 0.03 0.32 0.19Santa Clara County 43,328,000 7,536,000 43,210,000 6,746,000 2.13 47.46 7.81 25,017 0.23 2.24 1.34 2.08 46.54 7.58 24,515 0.23 2.20 1.31Santa Cruz County 1,568,000 1,032,000 1,568,000 997,000 0.12 2.51 0.48 1,173 0.01 0.11 0.06 0.12 2.47 0.47 1,156 0.01 0.11 0.06Solano County 11,620,000 4,481,000 11,620,000 4,309,000 0.93 16.95 4.55 8,799 0.09 0.82 0.52 0.92 16.78 4.50 8,704 0.09 0.82 0.52Sonoma County 11,243,000 1,496,000 11,243,000 1,409,000 0.66 13.07 2.00 6,688 0.07 0.59 0.36 0.65 12.98 1.98 6,637 0.07 0.58 0.36Stanislaus County 4,469,000 7,009,000 4,462,000 6,019,000 0.53 10.20 2.91 5,741 0.06 0.52 0.31 0.49 9.38 2.69 5,294 0.05 0.48 0.28Sutter County 2,628,000 1,251,000 2,628,000 1,201,000 0.19 3.28 1.16 2,137 0.02 0.18 0.11 0.18 3.24 1.14 2,113 0.02 0.18 0.11Tulare County 4,950,000 5,162,000 4,950,000 4,699,000 0.49 9.64 1.94 4,727 0.04 0.46 0.28 0.47 9.32 1.83 4,546 0.04 0.44 0.26Tuolumne County 1,062,000 705,000 1,062,000 673,000 0.09 1.81 0.34 863 0.01 0.08 0.04 0.09 1.78 0.33 846 0.01 0.07 0.04Ventura County 23,053,000 3,583,000 22,951,000 3,402,000 1.05 25.78 4.04 14,164 0.15 1.16 0.72 1.04 25.50 3.98 14,012 0.15 1.15 0.71Yolo County 3,575,000 4,284,000 3,572,000 4,090,000 0.35 6.84 1.72 3,688 0.03 0.35 0.21 0.35 6.67 1.67 3,594 0.03 0.34 0.20Yuba County 1,539,000 668,000 1,539,000 646,000 0.09 1.89 0.35 978 0.01 0.09 0.05 0.09 1.87 0.35 968 0.01 0.09 0.05Rest CA (North of Bay Area/Sacramento) 23,861,000 10,257,000 23,859,000 10,027,000 1.73 31.29 7.40 15,973 0.15 1.44 0.84 1.72 31.09 7.35 15,862 0.15 1.43 0.83Statewide Total 1,054,222,000 200,382,000 1,049,616,000 173,715,000 60.13 1,224.51 298.26 644,354 6.06 60.12 36.68 58.79 1,197.19 291.09 629,524 5.91 58.71 35.82Regional Total 22,385,000 27,050,000 22,376,000 22,263,000 2.42 44.87 14.73 25,628 0.25 2.44 1.47 2.22 40.95 13.67 23,446 0.23 2.22 1.34Notes:
This tab estimates operational emissions from regional and statewide vehicle miles traveled assuming a 50% fare scenario; the values reflect the difference in vehicle miles traveled as a result of building the High Speed Train.
County
1. Assumed 365 days of statewide traffic to compute the annual emissions from the daily emissions.
No Project Full Build Total No Build Emission Burden (tons/day) Total Build Emission Burden (tons/day)
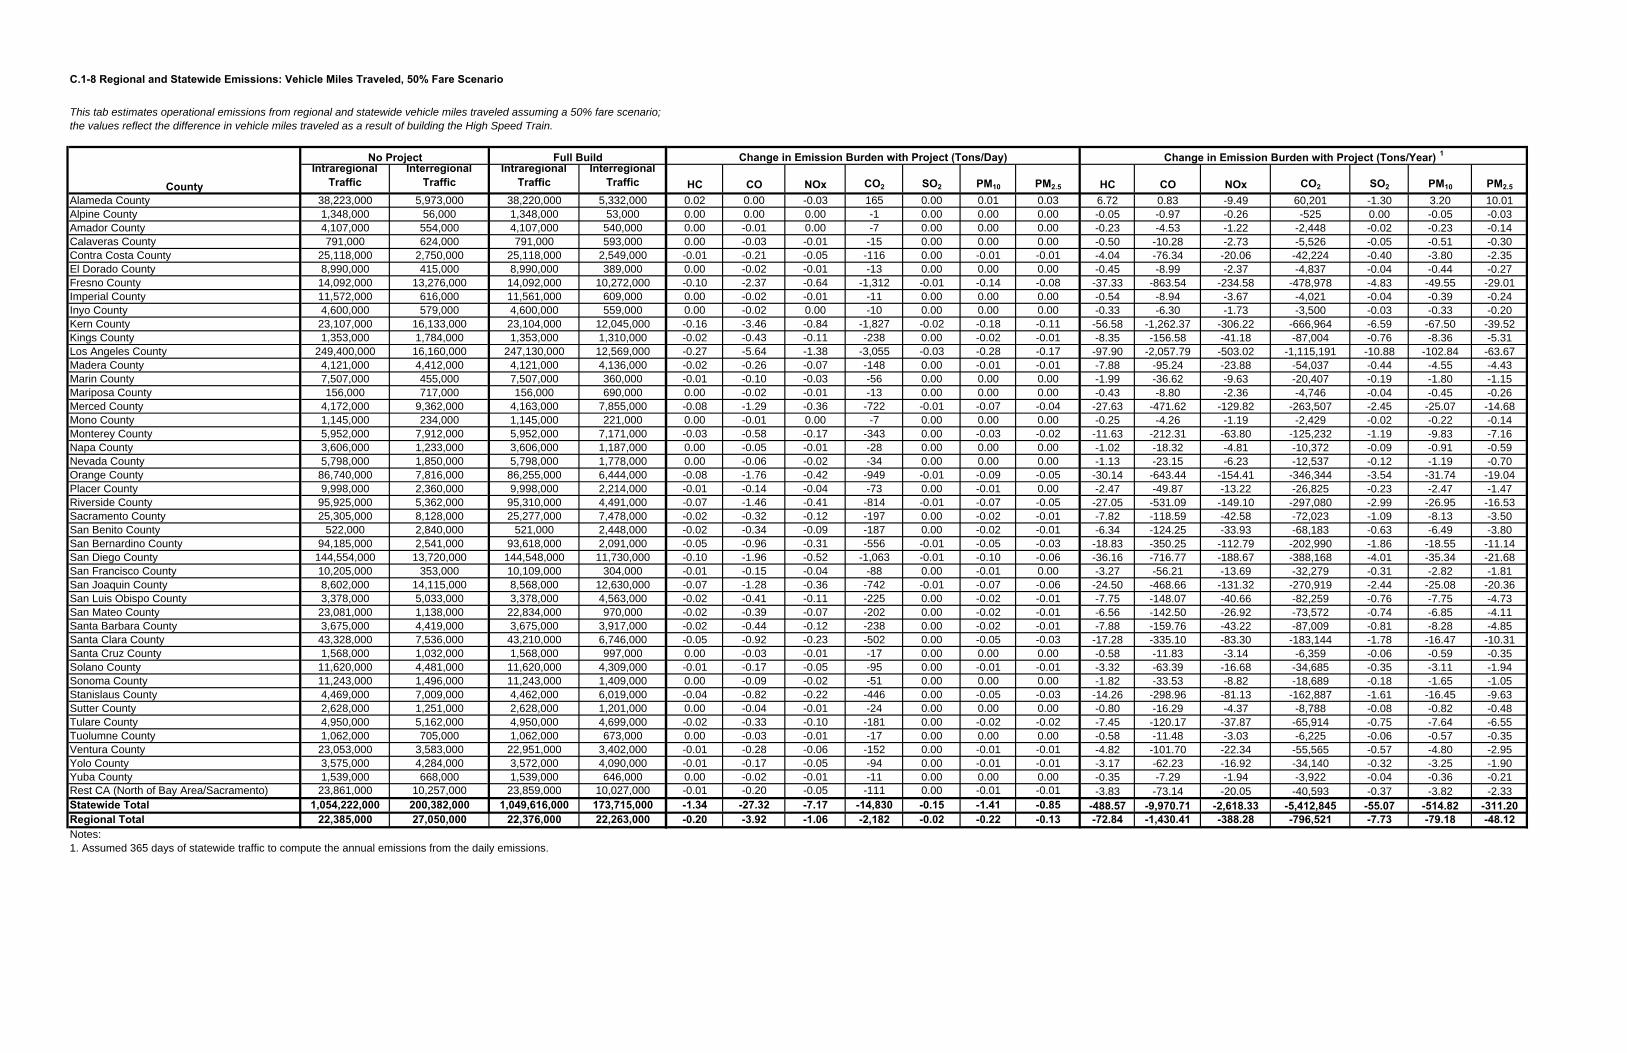
C.1-8 Regional and Statewide Emissions: Vehicle Miles Traveled, 50% Fare Scenario
Intraregional Traffic
Interregional Traffic
Intraregional Traffic
Interregional Traffic
Alameda County 38,223,000 5,973,000 38,220,000 5,332,000Alpine County 1,348,000 56,000 1,348,000 53,000Amador County 4,107,000 554,000 4,107,000 540,000Calaveras County 791,000 624,000 791,000 593,000Contra Costa County 25,118,000 2,750,000 25,118,000 2,549,000El Dorado County 8,990,000 415,000 8,990,000 389,000Fresno County 14,092,000 13,276,000 14,092,000 10,272,000Imperial County 11,572,000 616,000 11,561,000 609,000Inyo County 4,600,000 579,000 4,600,000 559,000Kern County 23,107,000 16,133,000 23,104,000 12,045,000Kings County 1,353,000 1,784,000 1,353,000 1,310,000Los Angeles County 249,400,000 16,160,000 247,130,000 12,569,000Madera County 4,121,000 4,412,000 4,121,000 4,136,000Marin County 7,507,000 455,000 7,507,000 360,000Mariposa County 156,000 717,000 156,000 690,000Merced County 4,172,000 9,362,000 4,163,000 7,855,000Mono County 1,145,000 234,000 1,145,000 221,000Monterey County 5,952,000 7,912,000 5,952,000 7,171,000Napa County 3,606,000 1,233,000 3,606,000 1,187,000Nevada County 5,798,000 1,850,000 5,798,000 1,778,000Orange County 86,740,000 7,816,000 86,255,000 6,444,000Placer County 9,998,000 2,360,000 9,998,000 2,214,000Riverside County 95,925,000 5,362,000 95,310,000 4,491,000Sacramento County 25,305,000 8,128,000 25,277,000 7,478,000San Benito County 522,000 2,840,000 521,000 2,448,000San Bernardino County 94,185,000 2,541,000 93,618,000 2,091,000San Diego County 144,554,000 13,720,000 144,548,000 11,730,000San Francisco County 10,205,000 353,000 10,109,000 304,000San Joaquin County 8,602,000 14,115,000 8,568,000 12,630,000San Luis Obispo County 3,378,000 5,033,000 3,378,000 4,563,000San Mateo County 23,081,000 1,138,000 22,834,000 970,000Santa Barbara County 3,675,000 4,419,000 3,675,000 3,917,000Santa Clara County 43,328,000 7,536,000 43,210,000 6,746,000Santa Cruz County 1,568,000 1,032,000 1,568,000 997,000Solano County 11,620,000 4,481,000 11,620,000 4,309,000Sonoma County 11,243,000 1,496,000 11,243,000 1,409,000Stanislaus County 4,469,000 7,009,000 4,462,000 6,019,000Sutter County 2,628,000 1,251,000 2,628,000 1,201,000Tulare County 4,950,000 5,162,000 4,950,000 4,699,000Tuolumne County 1,062,000 705,000 1,062,000 673,000Ventura County 23,053,000 3,583,000 22,951,000 3,402,000Yolo County 3,575,000 4,284,000 3,572,000 4,090,000Yuba County 1,539,000 668,000 1,539,000 646,000Rest CA (North of Bay Area/Sacramento) 23,861,000 10,257,000 23,859,000 10,027,000Statewide Total 1,054,222,000 200,382,000 1,049,616,000 173,715,000Regional Total 22,385,000 27,050,000 22,376,000 22,263,000Notes:
This tab estimates operational emissions from regional and statewide vehicle miles traveled assuming a 50% fare scenario; the values reflect the difference in vehicle miles traveled as a result of building the High Speed Train.
County
1. Assumed 365 days of statewide traffic to compute the annual emissions from the daily emissions.
No Project Full Build
HC CO NOx CO2 SO2 PM10 PM2.5 HC CO NOx CO2 SO2 PM10 PM2.5
0.02 0.00 -0.03 165 0.00 0.01 0.03 6.72 0.83 -9.49 60,201 -1.30 3.20 10.010.00 0.00 0.00 -1 0.00 0.00 0.00 -0.05 -0.97 -0.26 -525 0.00 -0.05 -0.030.00 -0.01 0.00 -7 0.00 0.00 0.00 -0.23 -4.53 -1.22 -2,448 -0.02 -0.23 -0.140.00 -0.03 -0.01 -15 0.00 0.00 0.00 -0.50 -10.28 -2.73 -5,526 -0.05 -0.51 -0.30-0.01 -0.21 -0.05 -116 0.00 -0.01 -0.01 -4.04 -76.34 -20.06 -42,224 -0.40 -3.80 -2.350.00 -0.02 -0.01 -13 0.00 0.00 0.00 -0.45 -8.99 -2.37 -4,837 -0.04 -0.44 -0.27-0.10 -2.37 -0.64 -1,312 -0.01 -0.14 -0.08 -37.33 -863.54 -234.58 -478,978 -4.83 -49.55 -29.010.00 -0.02 -0.01 -11 0.00 0.00 0.00 -0.54 -8.94 -3.67 -4,021 -0.04 -0.39 -0.240.00 -0.02 0.00 -10 0.00 0.00 0.00 -0.33 -6.30 -1.73 -3,500 -0.03 -0.33 -0.20-0.16 -3.46 -0.84 -1,827 -0.02 -0.18 -0.11 -56.58 -1,262.37 -306.22 -666,964 -6.59 -67.50 -39.52-0.02 -0.43 -0.11 -238 0.00 -0.02 -0.01 -8.35 -156.58 -41.18 -87,004 -0.76 -8.36 -5.31-0.27 -5.64 -1.38 -3,055 -0.03 -0.28 -0.17 -97.90 -2,057.79 -503.02 -1,115,191 -10.88 -102.84 -63.67-0.02 -0.26 -0.07 -148 0.00 -0.01 -0.01 -7.88 -95.24 -23.88 -54,037 -0.44 -4.55 -4.43-0.01 -0.10 -0.03 -56 0.00 0.00 0.00 -1.99 -36.62 -9.63 -20,407 -0.19 -1.80 -1.150.00 -0.02 -0.01 -13 0.00 0.00 0.00 -0.43 -8.80 -2.36 -4,746 -0.04 -0.45 -0.26-0.08 -1.29 -0.36 -722 -0.01 -0.07 -0.04 -27.63 -471.62 -129.82 -263,507 -2.45 -25.07 -14.680.00 -0.01 0.00 -7 0.00 0.00 0.00 -0.25 -4.26 -1.19 -2,429 -0.02 -0.22 -0.14-0.03 -0.58 -0.17 -343 0.00 -0.03 -0.02 -11.63 -212.31 -63.80 -125,232 -1.19 -9.83 -7.160.00 -0.05 -0.01 -28 0.00 0.00 0.00 -1.02 -18.32 -4.81 -10,372 -0.09 -0.91 -0.590.00 -0.06 -0.02 -34 0.00 0.00 0.00 -1.13 -23.15 -6.23 -12,537 -0.12 -1.19 -0.70-0.08 -1.76 -0.42 -949 -0.01 -0.09 -0.05 -30.14 -643.44 -154.41 -346,344 -3.54 -31.74 -19.04-0.01 -0.14 -0.04 -73 0.00 -0.01 0.00 -2.47 -49.87 -13.22 -26,825 -0.23 -2.47 -1.47-0.07 -1.46 -0.41 -814 -0.01 -0.07 -0.05 -27.05 -531.09 -149.10 -297,080 -2.99 -26.95 -16.53-0.02 -0.32 -0.12 -197 0.00 -0.02 -0.01 -7.82 -118.59 -42.58 -72,023 -1.09 -8.13 -3.50-0.02 -0.34 -0.09 -187 0.00 -0.02 -0.01 -6.34 -124.25 -33.93 -68,183 -0.63 -6.49 -3.80-0.05 -0.96 -0.31 -556 -0.01 -0.05 -0.03 -18.83 -350.25 -112.79 -202,990 -1.86 -18.55 -11.14-0.10 -1.96 -0.52 -1,063 -0.01 -0.10 -0.06 -36.16 -716.77 -188.67 -388,168 -4.01 -35.34 -21.68-0.01 -0.15 -0.04 -88 0.00 -0.01 0.00 -3.27 -56.21 -13.69 -32,279 -0.31 -2.82 -1.81-0.07 -1.28 -0.36 -742 -0.01 -0.07 -0.06 -24.50 -468.66 -131.32 -270,919 -2.44 -25.08 -20.36-0.02 -0.41 -0.11 -225 0.00 -0.02 -0.01 -7.75 -148.07 -40.66 -82,259 -0.76 -7.75 -4.73-0.02 -0.39 -0.07 -202 0.00 -0.02 -0.01 -6.56 -142.50 -26.92 -73,572 -0.74 -6.85 -4.11-0.02 -0.44 -0.12 -238 0.00 -0.02 -0.01 -7.88 -159.76 -43.22 -87,009 -0.81 -8.28 -4.85-0.05 -0.92 -0.23 -502 0.00 -0.05 -0.03 -17.28 -335.10 -83.30 -183,144 -1.78 -16.47 -10.310.00 -0.03 -0.01 -17 0.00 0.00 0.00 -0.58 -11.83 -3.14 -6,359 -0.06 -0.59 -0.35-0.01 -0.17 -0.05 -95 0.00 -0.01 -0.01 -3.32 -63.39 -16.68 -34,685 -0.35 -3.11 -1.940.00 -0.09 -0.02 -51 0.00 0.00 0.00 -1.82 -33.53 -8.82 -18,689 -0.18 -1.65 -1.05-0.04 -0.82 -0.22 -446 0.00 -0.05 -0.03 -14.26 -298.96 -81.13 -162,887 -1.61 -16.45 -9.630.00 -0.04 -0.01 -24 0.00 0.00 0.00 -0.80 -16.29 -4.37 -8,788 -0.08 -0.82 -0.48-0.02 -0.33 -0.10 -181 0.00 -0.02 -0.02 -7.45 -120.17 -37.87 -65,914 -0.75 -7.64 -6.550.00 -0.03 -0.01 -17 0.00 0.00 0.00 -0.58 -11.48 -3.03 -6,225 -0.06 -0.57 -0.35-0.01 -0.28 -0.06 -152 0.00 -0.01 -0.01 -4.82 -101.70 -22.34 -55,565 -0.57 -4.80 -2.95-0.01 -0.17 -0.05 -94 0.00 -0.01 -0.01 -3.17 -62.23 -16.92 -34,140 -0.32 -3.25 -1.900.00 -0.02 -0.01 -11 0.00 0.00 0.00 -0.35 -7.29 -1.94 -3,922 -0.04 -0.36 -0.21-0.01 -0.20 -0.05 -111 0.00 -0.01 -0.01 -3.83 -73.14 -20.05 -40,593 -0.37 -3.82 -2.33-1.34 -27.32 -7.17 -14,830 -0.15 -1.41 -0.85 -488.57 -9,970.71 -2,618.33 -5,412,845 -55.07 -514.82 -311.20-0.20 -3.92 -1.06 -2,182 -0.02 -0.22 -0.13 -72.84 -1,430.41 -388.28 -796,521 -7.73 -79.18 -48.12
Change in Emission Burden with Project (Tons/Year) 1Change in Emission Burden with Project (Tons/Day)
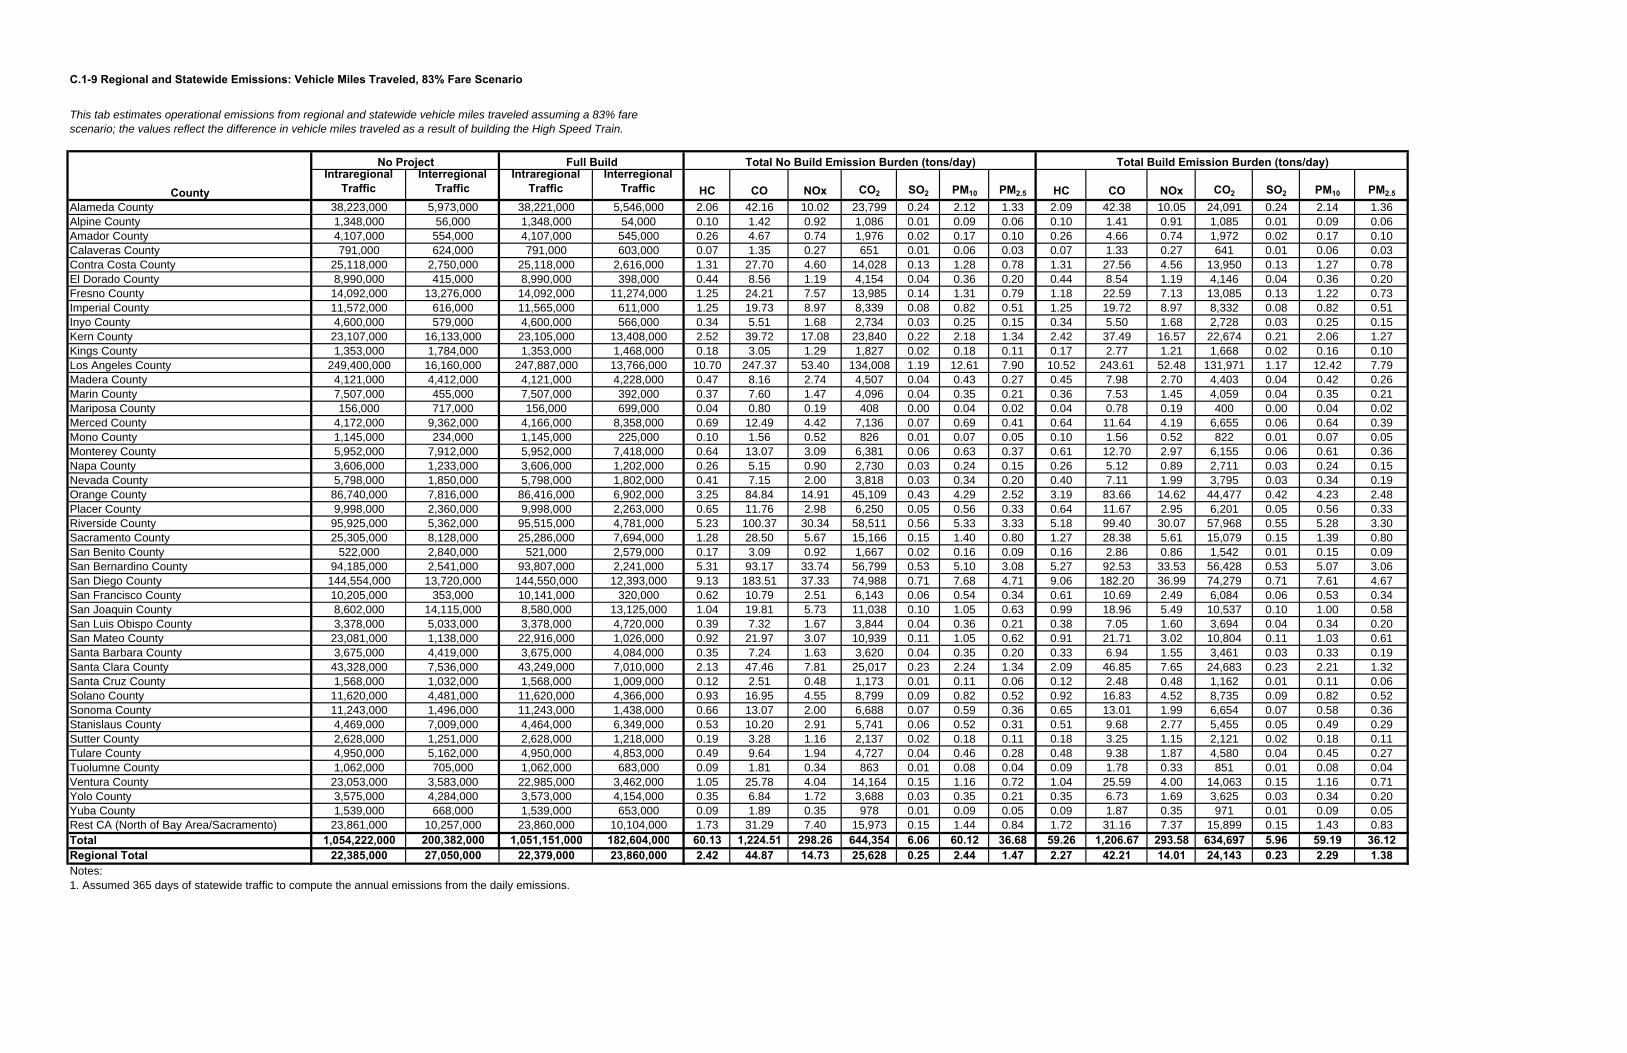
C.1-9 Regional and Statewide Emissions: Vehicle Miles Traveled, 83% Fare Scenario
Intraregional Traffic
Interregional Traffic
Intraregional Traffic
Interregional Traffic HC CO NOx CO2 SO2 PM10 PM2.5 HC CO NOx CO2 SO2 PM10 PM2.5
Alameda County 38,223,000 5,973,000 38,221,000 5,546,000 2.06 42.16 10.02 23,799 0.24 2.12 1.33 2.09 42.38 10.05 24,091 0.24 2.14 1.36Alpine County 1,348,000 56,000 1,348,000 54,000 0.10 1.42 0.92 1,086 0.01 0.09 0.06 0.10 1.41 0.91 1,085 0.01 0.09 0.06Amador County 4,107,000 554,000 4,107,000 545,000 0.26 4.67 0.74 1,976 0.02 0.17 0.10 0.26 4.66 0.74 1,972 0.02 0.17 0.10Calaveras County 791,000 624,000 791,000 603,000 0.07 1.35 0.27 651 0.01 0.06 0.03 0.07 1.33 0.27 641 0.01 0.06 0.03Contra Costa County 25,118,000 2,750,000 25,118,000 2,616,000 1.31 27.70 4.60 14,028 0.13 1.28 0.78 1.31 27.56 4.56 13,950 0.13 1.27 0.78El Dorado County 8,990,000 415,000 8,990,000 398,000 0.44 8.56 1.19 4,154 0.04 0.36 0.20 0.44 8.54 1.19 4,146 0.04 0.36 0.20Fresno County 14,092,000 13,276,000 14,092,000 11,274,000 1.25 24.21 7.57 13,985 0.14 1.31 0.79 1.18 22.59 7.13 13,085 0.13 1.22 0.73Imperial County 11,572,000 616,000 11,565,000 611,000 1.25 19.73 8.97 8,339 0.08 0.82 0.51 1.25 19.72 8.97 8,332 0.08 0.82 0.51Inyo County 4,600,000 579,000 4,600,000 566,000 0.34 5.51 1.68 2,734 0.03 0.25 0.15 0.34 5.50 1.68 2,728 0.03 0.25 0.15Kern County 23,107,000 16,133,000 23,105,000 13,408,000 2.52 39.72 17.08 23,840 0.22 2.18 1.34 2.42 37.49 16.57 22,674 0.21 2.06 1.27Kings County 1,353,000 1,784,000 1,353,000 1,468,000 0.18 3.05 1.29 1,827 0.02 0.18 0.11 0.17 2.77 1.21 1,668 0.02 0.16 0.10Los Angeles County 249,400,000 16,160,000 247,887,000 13,766,000 10.70 247.37 53.40 134,008 1.19 12.61 7.90 10.52 243.61 52.48 131,971 1.17 12.42 7.79Madera County 4,121,000 4,412,000 4,121,000 4,228,000 0.47 8.16 2.74 4,507 0.04 0.43 0.27 0.45 7.98 2.70 4,403 0.04 0.42 0.26Marin County 7,507,000 455,000 7,507,000 392,000 0.37 7.60 1.47 4,096 0.04 0.35 0.21 0.36 7.53 1.45 4,059 0.04 0.35 0.21Mariposa County 156,000 717,000 156,000 699,000 0.04 0.80 0.19 408 0.00 0.04 0.02 0.04 0.78 0.19 400 0.00 0.04 0.02Merced County 4,172,000 9,362,000 4,166,000 8,358,000 0.69 12.49 4.42 7,136 0.07 0.69 0.41 0.64 11.64 4.19 6,655 0.06 0.64 0.39Mono County 1,145,000 234,000 1,145,000 225,000 0.10 1.56 0.52 826 0.01 0.07 0.05 0.10 1.56 0.52 822 0.01 0.07 0.05Monterey County 5,952,000 7,912,000 5,952,000 7,418,000 0.64 13.07 3.09 6,381 0.06 0.63 0.37 0.61 12.70 2.97 6,155 0.06 0.61 0.36Napa County 3,606,000 1,233,000 3,606,000 1,202,000 0.26 5.15 0.90 2,730 0.03 0.24 0.15 0.26 5.12 0.89 2,711 0.03 0.24 0.15Nevada County 5,798,000 1,850,000 5,798,000 1,802,000 0.41 7.15 2.00 3,818 0.03 0.34 0.20 0.40 7.11 1.99 3,795 0.03 0.34 0.19Orange County 86,740,000 7,816,000 86,416,000 6,902,000 3.25 84.84 14.91 45,109 0.43 4.29 2.52 3.19 83.66 14.62 44,477 0.42 4.23 2.48Placer County 9,998,000 2,360,000 9,998,000 2,263,000 0.65 11.76 2.98 6,250 0.05 0.56 0.33 0.64 11.67 2.95 6,201 0.05 0.56 0.33Riverside County 95,925,000 5,362,000 95,515,000 4,781,000 5.23 100.37 30.34 58,511 0.56 5.33 3.33 5.18 99.40 30.07 57,968 0.55 5.28 3.30Sacramento County 25,305,000 8,128,000 25,286,000 7,694,000 1.28 28.50 5.67 15,166 0.15 1.40 0.80 1.27 28.38 5.61 15,079 0.15 1.39 0.80San Benito County 522,000 2,840,000 521,000 2,579,000 0.17 3.09 0.92 1,667 0.02 0.16 0.09 0.16 2.86 0.86 1,542 0.01 0.15 0.09San Bernardino County 94,185,000 2,541,000 93,807,000 2,241,000 5.31 93.17 33.74 56,799 0.53 5.10 3.08 5.27 92.53 33.53 56,428 0.53 5.07 3.06San Diego County 144,554,000 13,720,000 144,550,000 12,393,000 9.13 183.51 37.33 74,988 0.71 7.68 4.71 9.06 182.20 36.99 74,279 0.71 7.61 4.67San Francisco County 10,205,000 353,000 10,141,000 320,000 0.62 10.79 2.51 6,143 0.06 0.54 0.34 0.61 10.69 2.49 6,084 0.06 0.53 0.34San Joaquin County 8,602,000 14,115,000 8,580,000 13,125,000 1.04 19.81 5.73 11,038 0.10 1.05 0.63 0.99 18.96 5.49 10,537 0.10 1.00 0.58San Luis Obispo County 3,378,000 5,033,000 3,378,000 4,720,000 0.39 7.32 1.67 3,844 0.04 0.36 0.21 0.38 7.05 1.60 3,694 0.04 0.34 0.20San Mateo County 23,081,000 1,138,000 22,916,000 1,026,000 0.92 21.97 3.07 10,939 0.11 1.05 0.62 0.91 21.71 3.02 10,804 0.11 1.03 0.61Santa Barbara County 3,675,000 4,419,000 3,675,000 4,084,000 0.35 7.24 1.63 3,620 0.04 0.35 0.20 0.33 6.94 1.55 3,461 0.03 0.33 0.19Santa Clara County 43,328,000 7,536,000 43,249,000 7,010,000 2.13 47.46 7.81 25,017 0.23 2.24 1.34 2.09 46.85 7.65 24,683 0.23 2.21 1.32Santa Cruz County 1,568,000 1,032,000 1,568,000 1,009,000 0.12 2.51 0.48 1,173 0.01 0.11 0.06 0.12 2.48 0.48 1,162 0.01 0.11 0.06Solano County 11,620,000 4,481,000 11,620,000 4,366,000 0.93 16.95 4.55 8,799 0.09 0.82 0.52 0.92 16.83 4.52 8,735 0.09 0.82 0.52Sonoma County 11,243,000 1,496,000 11,243,000 1,438,000 0.66 13.07 2.00 6,688 0.07 0.59 0.36 0.65 13.01 1.99 6,654 0.07 0.58 0.36Stanislaus County 4,469,000 7,009,000 4,464,000 6,349,000 0.53 10.20 2.91 5,741 0.06 0.52 0.31 0.51 9.68 2.77 5,455 0.05 0.49 0.29Sutter County 2,628,000 1,251,000 2,628,000 1,218,000 0.19 3.28 1.16 2,137 0.02 0.18 0.11 0.18 3.25 1.15 2,121 0.02 0.18 0.11Tulare County 4,950,000 5,162,000 4,950,000 4,853,000 0.49 9.64 1.94 4,727 0.04 0.46 0.28 0.48 9.38 1.87 4,580 0.04 0.45 0.27Tuolumne County 1,062,000 705,000 1,062,000 683,000 0.09 1.81 0.34 863 0.01 0.08 0.04 0.09 1.78 0.33 851 0.01 0.08 0.04Ventura County 23,053,000 3,583,000 22,985,000 3,462,000 1.05 25.78 4.04 14,164 0.15 1.16 0.72 1.04 25.59 4.00 14,063 0.15 1.16 0.71Yolo County 3,575,000 4,284,000 3,573,000 4,154,000 0.35 6.84 1.72 3,688 0.03 0.35 0.21 0.35 6.73 1.69 3,625 0.03 0.34 0.20Yuba County 1,539,000 668,000 1,539,000 653,000 0.09 1.89 0.35 978 0.01 0.09 0.05 0.09 1.87 0.35 971 0.01 0.09 0.05Rest CA (North of Bay Area/Sacramento) 23,861,000 10,257,000 23,860,000 10,104,000 1.73 31.29 7.40 15,973 0.15 1.44 0.84 1.72 31.16 7.37 15,899 0.15 1.43 0.83Total 1,054,222,000 200,382,000 1,051,151,000 182,604,000 60.13 1,224.51 298.26 644,354 6.06 60.12 36.68 59.26 1,206.67 293.58 634,697 5.96 59.19 36.12Regional Total 22,385,000 27,050,000 22,379,000 23,860,000 2.42 44.87 14.73 25,628 0.25 2.44 1.47 2.27 42.21 14.01 24,143 0.23 2.29 1.38Notes:
This tab estimates operational emissions from regional and statewide vehicle miles traveled assuming a 83% fare scenario; the values reflect the difference in vehicle miles traveled as a result of building the High Speed Train.
County
1. Assumed 365 days of statewide traffic to compute the annual emissions from the daily emissions.
No Project Full Build Total No Build Emission Burden (tons/day) Total Build Emission Burden (tons/day)
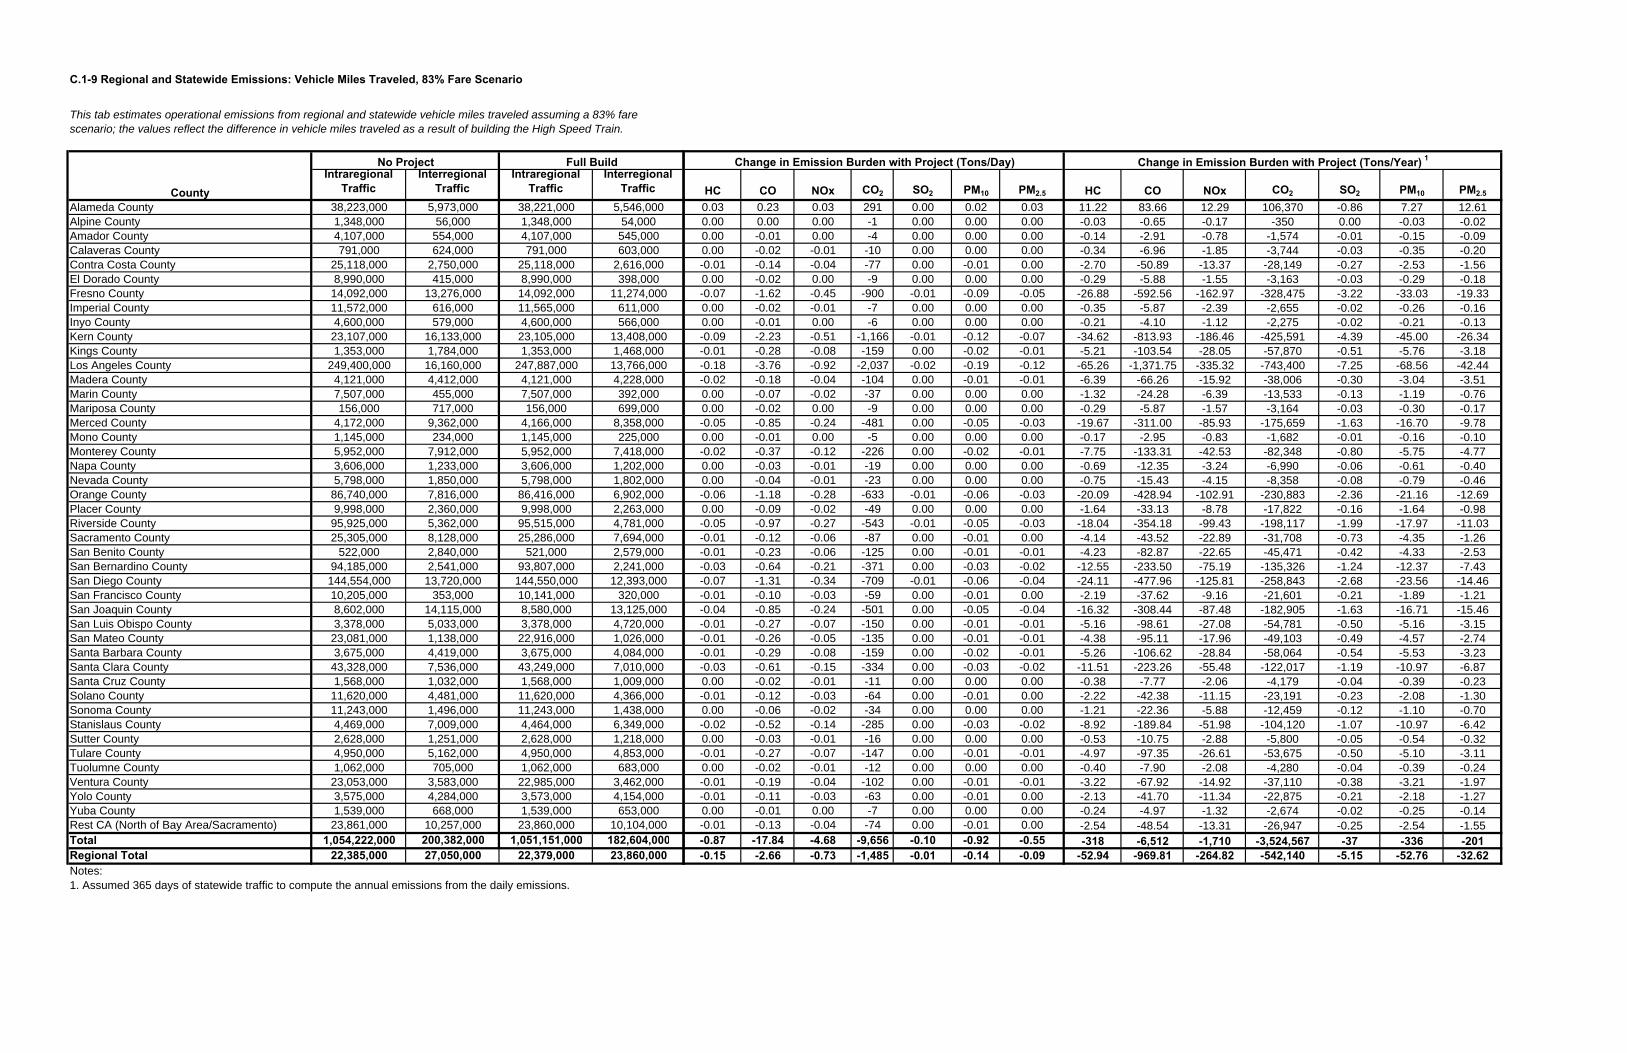
C.1-9 Regional and Statewide Emissions: Vehicle Miles Traveled, 83% Fare Scenario
Intraregional Traffic
Interregional Traffic
Intraregional Traffic
Interregional Traffic
Alameda County 38,223,000 5,973,000 38,221,000 5,546,000Alpine County 1,348,000 56,000 1,348,000 54,000Amador County 4,107,000 554,000 4,107,000 545,000Calaveras County 791,000 624,000 791,000 603,000Contra Costa County 25,118,000 2,750,000 25,118,000 2,616,000El Dorado County 8,990,000 415,000 8,990,000 398,000Fresno County 14,092,000 13,276,000 14,092,000 11,274,000Imperial County 11,572,000 616,000 11,565,000 611,000Inyo County 4,600,000 579,000 4,600,000 566,000Kern County 23,107,000 16,133,000 23,105,000 13,408,000Kings County 1,353,000 1,784,000 1,353,000 1,468,000Los Angeles County 249,400,000 16,160,000 247,887,000 13,766,000Madera County 4,121,000 4,412,000 4,121,000 4,228,000Marin County 7,507,000 455,000 7,507,000 392,000Mariposa County 156,000 717,000 156,000 699,000Merced County 4,172,000 9,362,000 4,166,000 8,358,000Mono County 1,145,000 234,000 1,145,000 225,000Monterey County 5,952,000 7,912,000 5,952,000 7,418,000Napa County 3,606,000 1,233,000 3,606,000 1,202,000Nevada County 5,798,000 1,850,000 5,798,000 1,802,000Orange County 86,740,000 7,816,000 86,416,000 6,902,000Placer County 9,998,000 2,360,000 9,998,000 2,263,000Riverside County 95,925,000 5,362,000 95,515,000 4,781,000Sacramento County 25,305,000 8,128,000 25,286,000 7,694,000San Benito County 522,000 2,840,000 521,000 2,579,000San Bernardino County 94,185,000 2,541,000 93,807,000 2,241,000San Diego County 144,554,000 13,720,000 144,550,000 12,393,000San Francisco County 10,205,000 353,000 10,141,000 320,000San Joaquin County 8,602,000 14,115,000 8,580,000 13,125,000San Luis Obispo County 3,378,000 5,033,000 3,378,000 4,720,000San Mateo County 23,081,000 1,138,000 22,916,000 1,026,000Santa Barbara County 3,675,000 4,419,000 3,675,000 4,084,000Santa Clara County 43,328,000 7,536,000 43,249,000 7,010,000Santa Cruz County 1,568,000 1,032,000 1,568,000 1,009,000Solano County 11,620,000 4,481,000 11,620,000 4,366,000Sonoma County 11,243,000 1,496,000 11,243,000 1,438,000Stanislaus County 4,469,000 7,009,000 4,464,000 6,349,000Sutter County 2,628,000 1,251,000 2,628,000 1,218,000Tulare County 4,950,000 5,162,000 4,950,000 4,853,000Tuolumne County 1,062,000 705,000 1,062,000 683,000Ventura County 23,053,000 3,583,000 22,985,000 3,462,000Yolo County 3,575,000 4,284,000 3,573,000 4,154,000Yuba County 1,539,000 668,000 1,539,000 653,000Rest CA (North of Bay Area/Sacramento) 23,861,000 10,257,000 23,860,000 10,104,000Total 1,054,222,000 200,382,000 1,051,151,000 182,604,000Regional Total 22,385,000 27,050,000 22,379,000 23,860,000Notes:
This tab estimates operational emissions from regional and statewide vehicle miles traveled assuming a 83% fare scenario; the values reflect the difference in vehicle miles traveled as a result of building the High Speed Train.
County
1. Assumed 365 days of statewide traffic to compute the annual emissions from the daily emissions.
No Project Full Build
HC CO NOx CO2 SO2 PM10 PM2.5 HC CO NOx CO2 SO2 PM10 PM2.5
0.03 0.23 0.03 291 0.00 0.02 0.03 11.22 83.66 12.29 106,370 -0.86 7.27 12.610.00 0.00 0.00 -1 0.00 0.00 0.00 -0.03 -0.65 -0.17 -350 0.00 -0.03 -0.020.00 -0.01 0.00 -4 0.00 0.00 0.00 -0.14 -2.91 -0.78 -1,574 -0.01 -0.15 -0.090.00 -0.02 -0.01 -10 0.00 0.00 0.00 -0.34 -6.96 -1.85 -3,744 -0.03 -0.35 -0.20-0.01 -0.14 -0.04 -77 0.00 -0.01 0.00 -2.70 -50.89 -13.37 -28,149 -0.27 -2.53 -1.560.00 -0.02 0.00 -9 0.00 0.00 0.00 -0.29 -5.88 -1.55 -3,163 -0.03 -0.29 -0.18-0.07 -1.62 -0.45 -900 -0.01 -0.09 -0.05 -26.88 -592.56 -162.97 -328,475 -3.22 -33.03 -19.330.00 -0.02 -0.01 -7 0.00 0.00 0.00 -0.35 -5.87 -2.39 -2,655 -0.02 -0.26 -0.160.00 -0.01 0.00 -6 0.00 0.00 0.00 -0.21 -4.10 -1.12 -2,275 -0.02 -0.21 -0.13-0.09 -2.23 -0.51 -1,166 -0.01 -0.12 -0.07 -34.62 -813.93 -186.46 -425,591 -4.39 -45.00 -26.34-0.01 -0.28 -0.08 -159 0.00 -0.02 -0.01 -5.21 -103.54 -28.05 -57,870 -0.51 -5.76 -3.18-0.18 -3.76 -0.92 -2,037 -0.02 -0.19 -0.12 -65.26 -1,371.75 -335.32 -743,400 -7.25 -68.56 -42.44-0.02 -0.18 -0.04 -104 0.00 -0.01 -0.01 -6.39 -66.26 -15.92 -38,006 -0.30 -3.04 -3.510.00 -0.07 -0.02 -37 0.00 0.00 0.00 -1.32 -24.28 -6.39 -13,533 -0.13 -1.19 -0.760.00 -0.02 0.00 -9 0.00 0.00 0.00 -0.29 -5.87 -1.57 -3,164 -0.03 -0.30 -0.17-0.05 -0.85 -0.24 -481 0.00 -0.05 -0.03 -19.67 -311.00 -85.93 -175,659 -1.63 -16.70 -9.780.00 -0.01 0.00 -5 0.00 0.00 0.00 -0.17 -2.95 -0.83 -1,682 -0.01 -0.16 -0.10-0.02 -0.37 -0.12 -226 0.00 -0.02 -0.01 -7.75 -133.31 -42.53 -82,348 -0.80 -5.75 -4.770.00 -0.03 -0.01 -19 0.00 0.00 0.00 -0.69 -12.35 -3.24 -6,990 -0.06 -0.61 -0.400.00 -0.04 -0.01 -23 0.00 0.00 0.00 -0.75 -15.43 -4.15 -8,358 -0.08 -0.79 -0.46-0.06 -1.18 -0.28 -633 -0.01 -0.06 -0.03 -20.09 -428.94 -102.91 -230,883 -2.36 -21.16 -12.690.00 -0.09 -0.02 -49 0.00 0.00 0.00 -1.64 -33.13 -8.78 -17,822 -0.16 -1.64 -0.98-0.05 -0.97 -0.27 -543 -0.01 -0.05 -0.03 -18.04 -354.18 -99.43 -198,117 -1.99 -17.97 -11.03-0.01 -0.12 -0.06 -87 0.00 -0.01 0.00 -4.14 -43.52 -22.89 -31,708 -0.73 -4.35 -1.26-0.01 -0.23 -0.06 -125 0.00 -0.01 -0.01 -4.23 -82.87 -22.65 -45,471 -0.42 -4.33 -2.53-0.03 -0.64 -0.21 -371 0.00 -0.03 -0.02 -12.55 -233.50 -75.19 -135,326 -1.24 -12.37 -7.43-0.07 -1.31 -0.34 -709 -0.01 -0.06 -0.04 -24.11 -477.96 -125.81 -258,843 -2.68 -23.56 -14.46-0.01 -0.10 -0.03 -59 0.00 -0.01 0.00 -2.19 -37.62 -9.16 -21,601 -0.21 -1.89 -1.21-0.04 -0.85 -0.24 -501 0.00 -0.05 -0.04 -16.32 -308.44 -87.48 -182,905 -1.63 -16.71 -15.46-0.01 -0.27 -0.07 -150 0.00 -0.01 -0.01 -5.16 -98.61 -27.08 -54,781 -0.50 -5.16 -3.15-0.01 -0.26 -0.05 -135 0.00 -0.01 -0.01 -4.38 -95.11 -17.96 -49,103 -0.49 -4.57 -2.74-0.01 -0.29 -0.08 -159 0.00 -0.02 -0.01 -5.26 -106.62 -28.84 -58,064 -0.54 -5.53 -3.23-0.03 -0.61 -0.15 -334 0.00 -0.03 -0.02 -11.51 -223.26 -55.48 -122,017 -1.19 -10.97 -6.870.00 -0.02 -0.01 -11 0.00 0.00 0.00 -0.38 -7.77 -2.06 -4,179 -0.04 -0.39 -0.23-0.01 -0.12 -0.03 -64 0.00 -0.01 0.00 -2.22 -42.38 -11.15 -23,191 -0.23 -2.08 -1.300.00 -0.06 -0.02 -34 0.00 0.00 0.00 -1.21 -22.36 -5.88 -12,459 -0.12 -1.10 -0.70-0.02 -0.52 -0.14 -285 0.00 -0.03 -0.02 -8.92 -189.84 -51.98 -104,120 -1.07 -10.97 -6.420.00 -0.03 -0.01 -16 0.00 0.00 0.00 -0.53 -10.75 -2.88 -5,800 -0.05 -0.54 -0.32-0.01 -0.27 -0.07 -147 0.00 -0.01 -0.01 -4.97 -97.35 -26.61 -53,675 -0.50 -5.10 -3.110.00 -0.02 -0.01 -12 0.00 0.00 0.00 -0.40 -7.90 -2.08 -4,280 -0.04 -0.39 -0.24-0.01 -0.19 -0.04 -102 0.00 -0.01 -0.01 -3.22 -67.92 -14.92 -37,110 -0.38 -3.21 -1.97-0.01 -0.11 -0.03 -63 0.00 -0.01 0.00 -2.13 -41.70 -11.34 -22,875 -0.21 -2.18 -1.270.00 -0.01 0.00 -7 0.00 0.00 0.00 -0.24 -4.97 -1.32 -2,674 -0.02 -0.25 -0.14-0.01 -0.13 -0.04 -74 0.00 -0.01 0.00 -2.54 -48.54 -13.31 -26,947 -0.25 -2.54 -1.55-0.87 -17.84 -4.68 -9,656 -0.10 -0.92 -0.55 -318 -6,512 -1,710 -3,524,567 -37 -336 -201-0.15 -2.66 -0.73 -1,485 -0.01 -0.14 -0.09 -52.94 -969.81 -264.82 -542,140 -5.15 -52.76 -32.62
Change in Emission Burden with Project (Tons/Year) 1Change in Emission Burden with Project (Tons/Day)

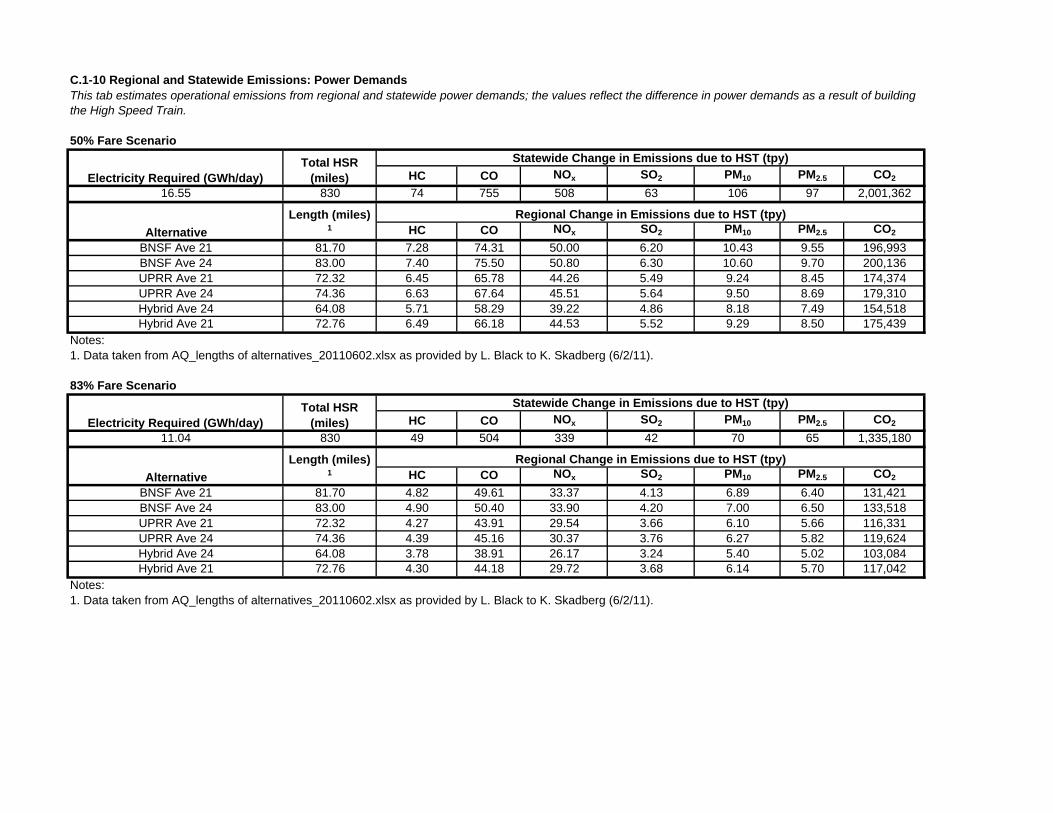
C.1-10 Regional and Statewide Emissions: Power Demands
50% Fare Scenario
HC CO NOx SO2 PM10 PM2.5 CO2
16.55 830 74 755 508 63 106 97 2,001,362
HC CO NOx SO2 PM10 PM2.5 CO2
BNSF Ave 21 81.70 7.28 74.31 50.00 6.20 10.43 9.55 196,993BNSF Ave 24 83.00 7.40 75.50 50.80 6.30 10.60 9.70 200,136UPRR Ave 21 72.32 6.45 65.78 44.26 5.49 9.24 8.45 174,374UPRR Ave 24 74.36 6.63 67.64 45.51 5.64 9.50 8.69 179,310Hybrid Ave 24 64.08 5.71 58.29 39.22 4.86 8.18 7.49 154,518Hybrid Ave 21 72.76 6.49 66.18 44.53 5.52 9.29 8.50 175,439
Notes:1. Data taken from AQ_lengths of alternatives_20110602.xlsx as provided by L. Black to K. Skadberg (6/2/11).
83% Fare Scenario
HC CO NOx SO2 PM10 PM2.5 CO2
11.04 830 49 504 339 42 70 65 1,335,180
HC CO NOx SO2 PM10 PM2.5 CO2
BNSF Ave 21 81.70 4.82 49.61 33.37 4.13 6.89 6.40 131,421BNSF Ave 24 83.00 4.90 50.40 33.90 4.20 7.00 6.50 133,518UPRR Ave 21 72.32 4.27 43.91 29.54 3.66 6.10 5.66 116,331UPRR Ave 24 74.36 4.39 45.16 30.37 3.76 6.27 5.82 119,624Hybrid Ave 24 64.08 3.78 38.91 26.17 3.24 5.40 5.02 103,084Hybrid Ave 21 72.76 4.30 44.18 29.72 3.68 6.14 5.70 117,042
Notes:1. Data taken from AQ_lengths of alternatives_20110602.xlsx as provided by L. Black to K. Skadberg (6/2/11).
This tab estimates operational emissions from regional and statewide power demands; the values reflect the difference in power demands as a result of building the High Speed Train.
Electricity Required (GWh/day)Total HSR
(miles)
Statewide Change in Emissions due to HST (tpy)
Alternative
Length (miles) 1
Regional Change in Emissions due to HST (tpy)
Electricity Required (GWh/day)
Statewide Change in Emissions due to HST (tpy)
Alternative
Length (miles) 1
Regional Change in Emissions due to HST (tpy)
Total HSR (miles)


C.1-11 Regional and Statewide Emissions: Flight DemandsThis tab estimates operational emissions from regional and statewide flight demands; the values reflect the difference in flight demands as a result of building the High Speed Train.
50% Fare Scenario
THC CO NOx SO2 PM10 PM2.5 CO2 THC CO NOx SO2 PM10 PM2.5 CO2
Central Coast -1 0.00 -0.02 -0.02 0.00 0.00 0.00 -4 -0.61 -5.57 -7.45 -0.52 -0.06 -0.06 -1,371Far North -16 -0.03 -0.24 -0.33 -0.02 0.00 0.00 -60 -9.65 -88.27 -118.17 -8.20 -0.95 -0.95 -21,737Fresno/Madera 0 0.00 0.00 0.00 0.00 0.00 0.00 0 -0.15 -1.36 -1.82 -0.13 -0.01 -0.01 -334Kern -16 -0.03 -0.24 -0.33 -0.02 0.00 0.00 -60 -9.56 -87.50 -117.15 -8.13 -0.94 -0.94 -21,549LA Basin_North -43 -0.07 -0.66 -0.88 -0.06 -0.01 -0.01 -161 -26.26 -240.23 -321.62 -22.32 -2.58 -2.57 -59,160LA Basin_South -88 -0.15 -1.34 -1.80 -0.12 -0.01 -0.01 -330 -53.61 -490.56 -656.76 -45.57 -5.28 -5.25 -120,807Merced -1 0.00 -0.02 -0.02 0.00 0.00 0.00 -4 -0.46 -4.22 -5.66 -0.39 -0.05 -0.05 -1,040Monterey Bay -16 -0.03 -0.24 -0.33 -0.02 0.00 0.00 -60 -9.73 -89.01 -119.17 -8.27 -0.96 -0.95 -21,921Sacramento Region -16 -0.03 -0.24 -0.33 -0.02 0.00 0.00 -60 -9.68 -88.56 -118.56 -8.23 -0.95 -0.95 -21,808San Diego Region -47 -0.08 -0.72 -0.96 -0.07 -0.01 -0.01 -177 -28.69 -262.53 -351.47 -24.39 -2.82 -2.81 -64,651San Joaquin -7 -0.01 -0.11 -0.14 -0.01 0.00 0.00 -26 -4.30 -39.31 -52.63 -3.65 -0.42 -0.42 -9,682SF Bay Area -130 -0.22 -1.98 -2.65 -0.18 -0.02 -0.02 -488 -79.19 -724.62 -970.12 -67.31 -7.79 -7.76 -178,446South SJ Valley 0 0.00 0.00 0.00 0.00 0.00 0.00 0 -0.02 -0.15 -0.20 -0.01 0.00 0.00 -38Stanislaus -5 -0.01 -0.08 -0.10 -0.01 0.00 0.00 -19 -3.10 -28.32 -37.91 -2.63 -0.30 -0.30 -6,974W. Sierra Nevada -1 0.00 -0.02 -0.02 0.00 0.00 0.00 -4 -0.40 -3.61 -4.84 -0.34 -0.04 -0.04 -890Statewide Total -387 -0.65 -5.90 -7.90 -0.55 -0.06 -0.06 -1,453 -235.39 -2,153.83 -2,883.55 -200.08 -23.17 -23.06 -530,408Regional Total -1 0.00 -0.02 -0.02 0.00 0.00 0.00 -4 -0.61 -5.58 -7.47 -0.52 -0.06 -0.06 -1,375
83% Fare Scenario
THC CO NOx SO2 PM10 PM2.5 CO2 THC CO NOx SO2 PM10 PM2.5 CO2
Central Coast -1 0.00 -0.02 -0.02 0.00 0.00 0.00 -4 -0.41 -3.74 -5.00 -0.35 -0.04 -0.04 -920Far North -11 -0.02 -0.17 -0.22 -0.02 0.00 0.00 -41 -6.46 -59.14 -79.18 -5.49 -0.64 -0.63 -14,564Fresno/Madera 0 0.00 0.00 0.00 0.00 0.00 0.00 0 -0.10 -0.92 -1.23 -0.09 -0.01 -0.01 -225Kern -11 -0.02 -0.17 -0.22 -0.02 0.00 0.00 -41 -6.41 -58.64 -78.50 -5.45 -0.63 -0.63 -14,440LA Basin_North -29 -0.05 -0.44 -0.59 -0.04 0.00 0.00 -109 -17.59 -160.96 -215.50 -14.95 -1.73 -1.72 -39,639LA Basin_South -59 -0.10 -0.90 -1.20 -0.08 -0.01 -0.01 -222 -35.92 -328.67 -440.02 -30.53 -3.54 -3.52 -80,939Merced 0 0.00 0.00 0.00 0.00 0.00 0.00 0 -0.31 -2.82 -3.78 -0.26 -0.03 -0.03 -695Monterey Bay -11 -0.02 -0.17 -0.22 -0.02 0.00 0.00 -41 -6.52 -59.64 -79.85 -5.54 -0.64 -0.64 -14,688Sacramento Region -11 -0.02 -0.17 -0.22 -0.02 0.00 0.00 -41 -6.49 -59.34 -79.44 -5.51 -0.64 -0.64 -14,613San Diego Region -32 -0.05 -0.49 -0.65 -0.05 -0.01 -0.01 -120 -19.22 -175.89 -235.49 -16.34 -1.89 -1.88 -43,316San Joaquin -5 -0.01 -0.08 -0.10 -0.01 0.00 0.00 -19 -2.88 -26.34 -35.26 -2.45 -0.28 -0.28 -6,486SF Bay Area -87 -0.15 -1.33 -1.78 -0.12 -0.01 -0.01 -327 -53.06 -485.50 -649.99 -45.10 -5.22 -5.20 -119,560South SJ Valley 0 0.00 0.00 0.00 0.00 0.00 0.00 0 -0.01 -0.11 -0.14 -0.01 0.00 0.00 -26Stanislaus -3 -0.01 -0.05 -0.06 0.00 0.00 0.00 -11 -2.07 -18.97 -25.40 -1.76 -0.20 -0.20 -4,672W. Sierra Nevada 0 0.00 0.00 0.00 0.00 0.00 0.00 0 -0.27 -2.42 -3.25 -0.23 -0.03 -0.03 -597Statewide Total -259 -0.43 -3.95 -5.29 -0.37 -0.04 -0.04 -973 -157.71 -1,443.06 -1,931.97 -134.05 -15.52 -15.45 -355,372Regional Total 0 0.00 0.00 0.00 0.00 0.00 0.00 0 -0.41 -3.74 -5.00 -0.35 -0.04 -0.04 -920
OriginNo. of Flights
RemovedChange in Emissions Due to HST (tons/day, saved) Change in Emissions Due to HST (tpy, saved)
Change in Emissions Due to HST (tons/day, saved) Change in Emissions Due to HST (tpy, saved)Origin
No. of Flights Removed

C.2 URBEMIS2007 Output File: Merced Station – Operation 2035


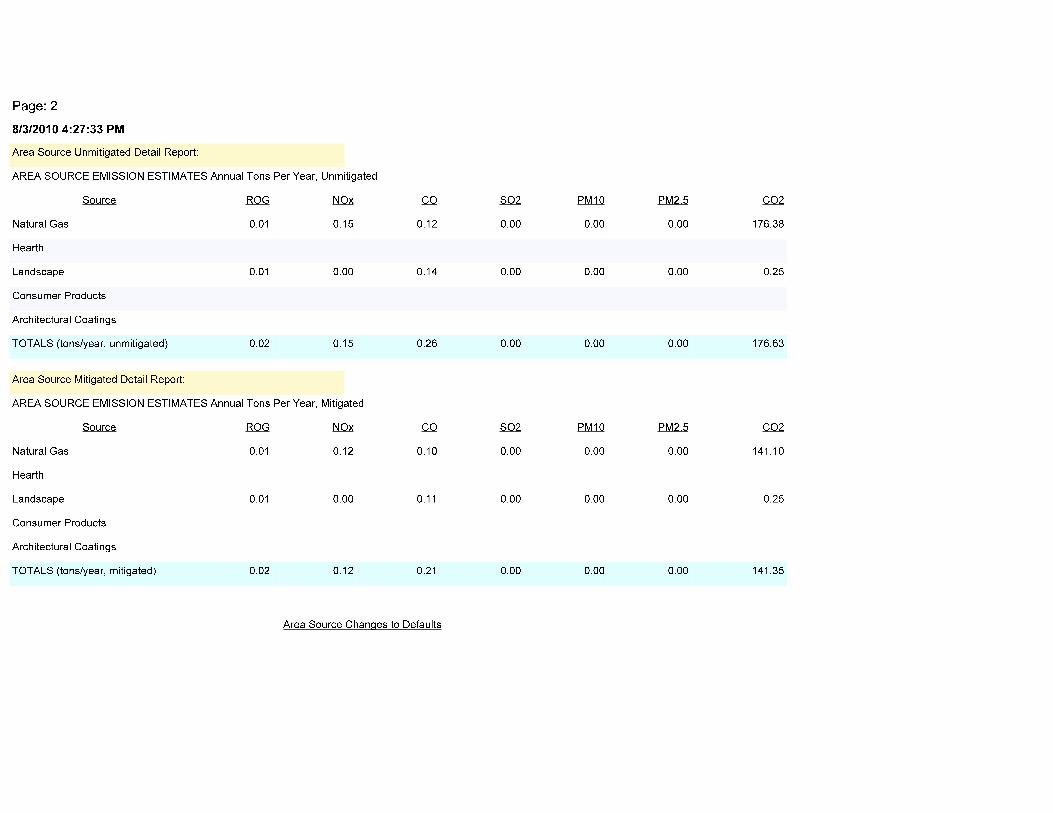

C.3 EMFAC Output

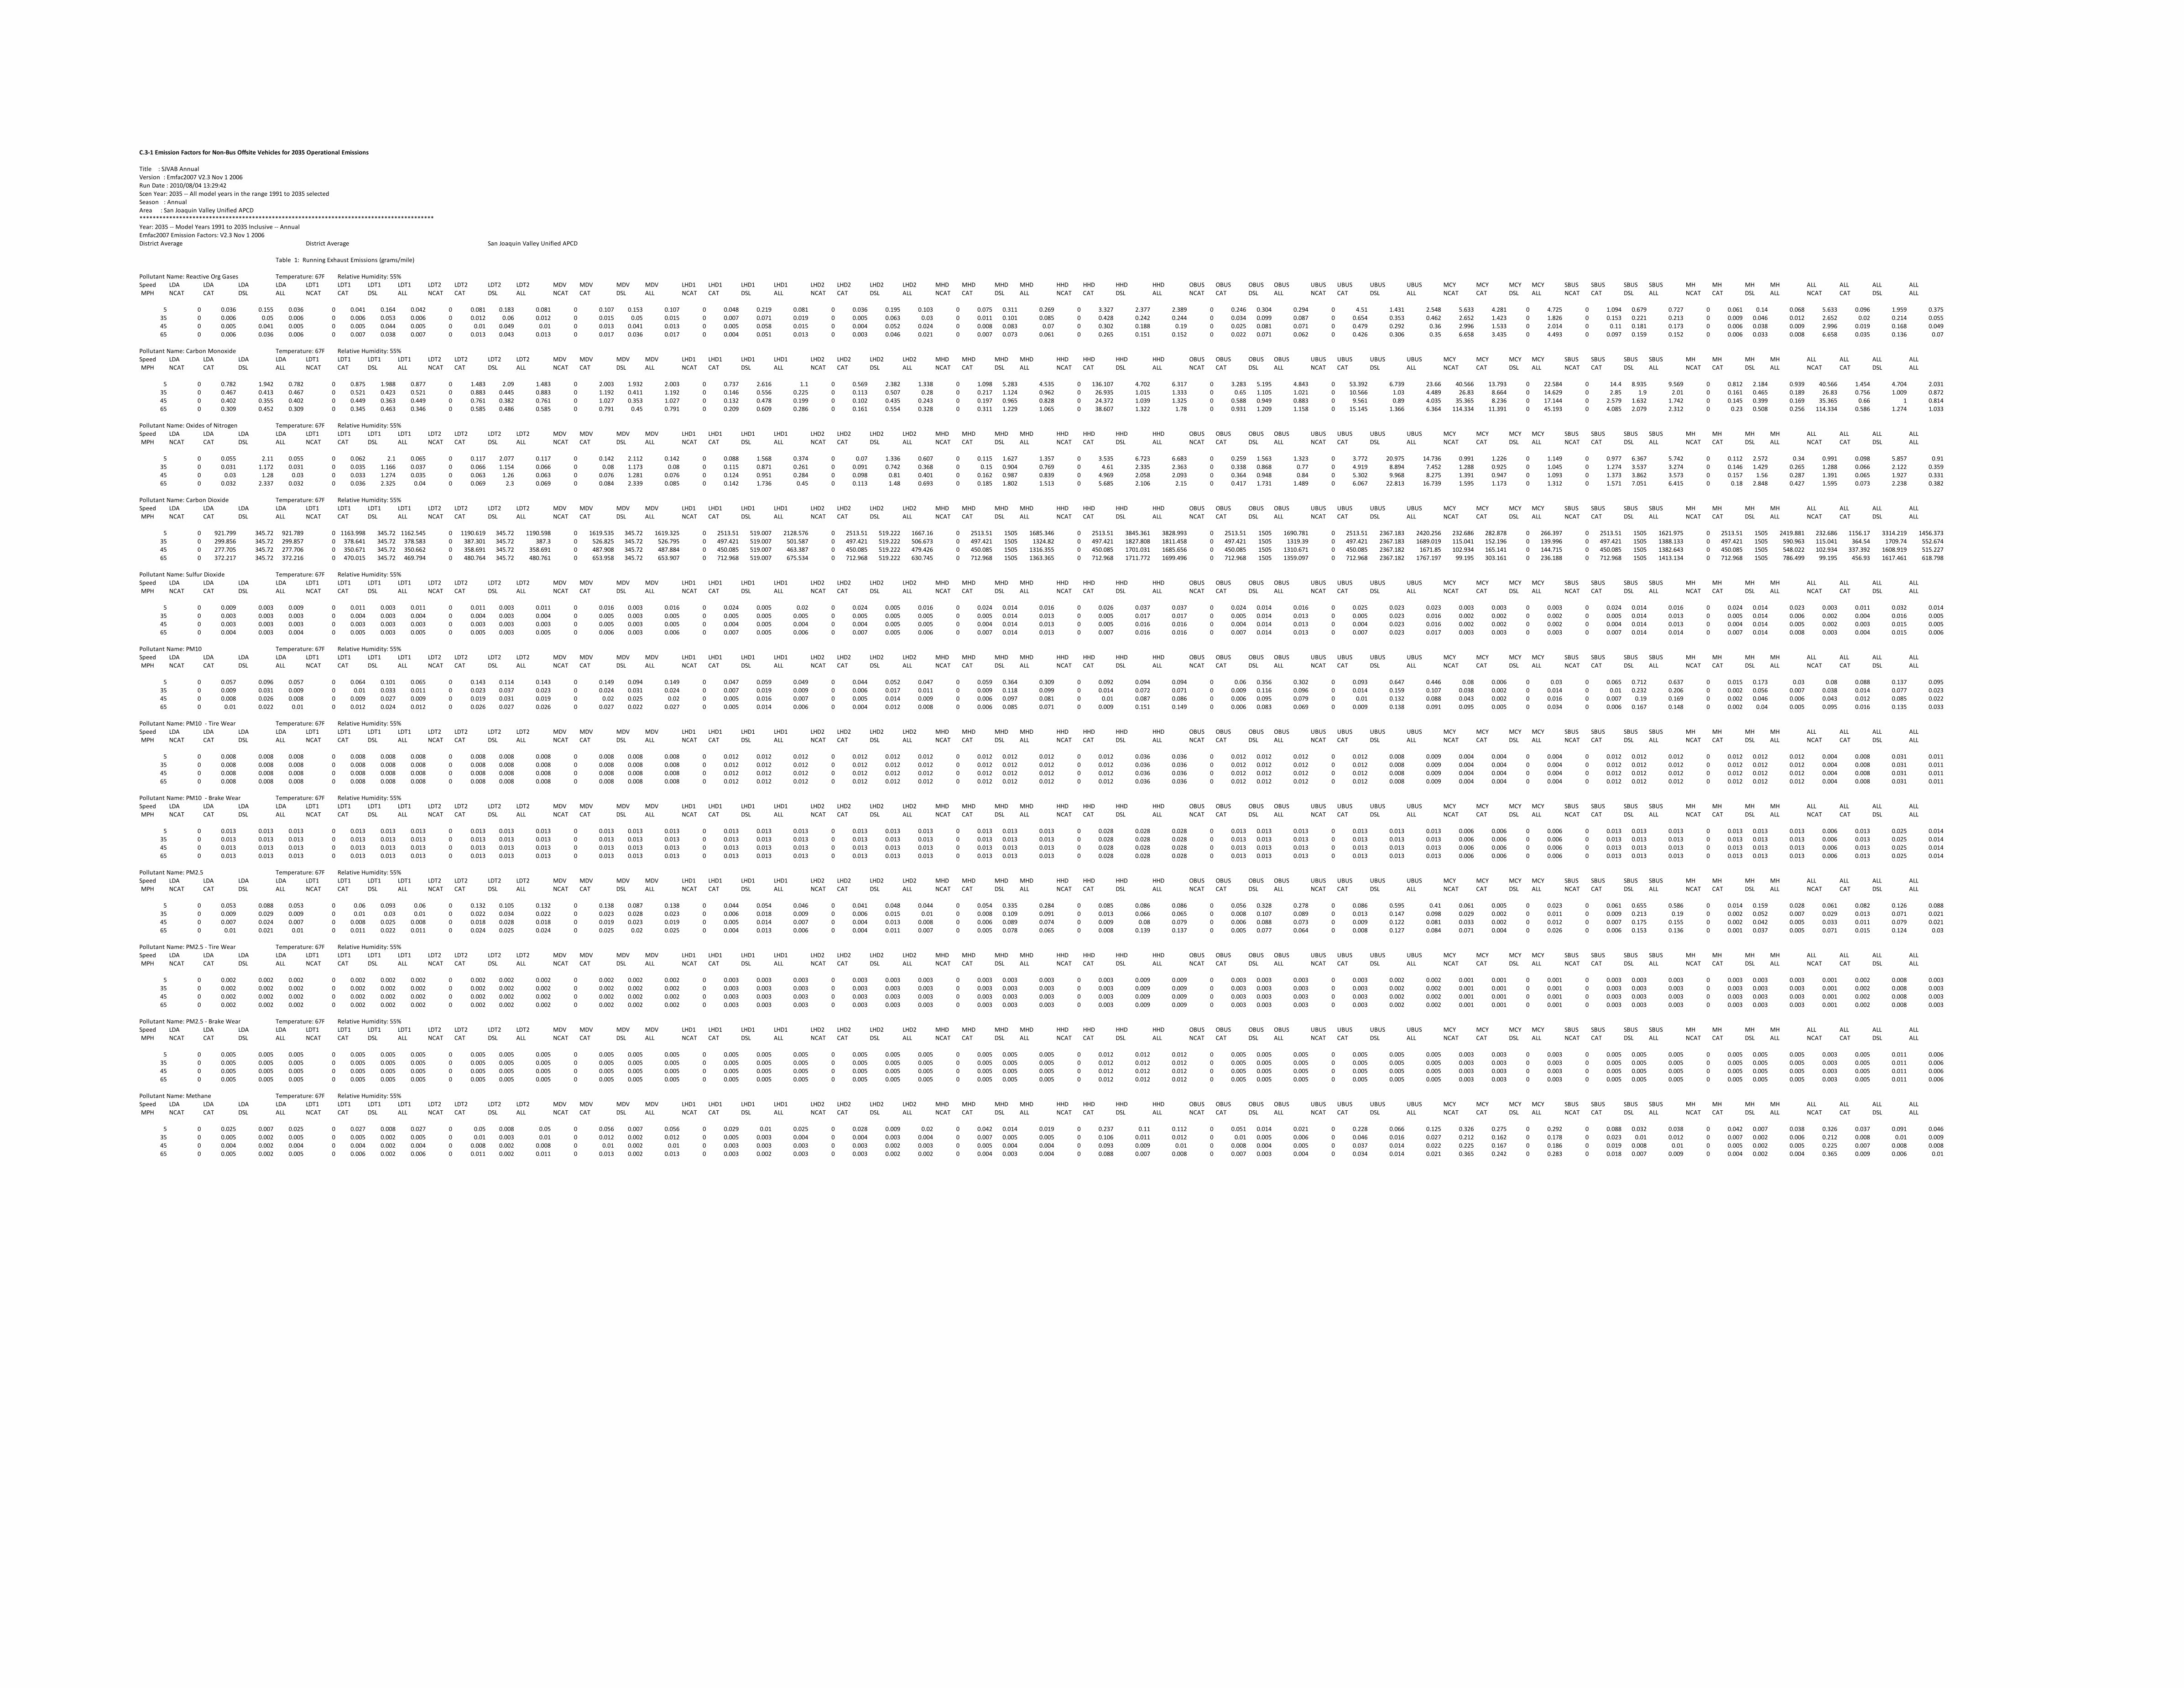
C.3-1 Emission Factors for Non-Bus Offsite Vehicles for 2035 Operational Emissions
Title : SJVAB AnnualVersion : Emfac2007 V2.3 Nov 1 2006Run Date : 2010/08/04 13:29:42Scen Year: 2035 -- All model years in the range 1991 to 2035 selectedSeason : AnnualArea : San Joaquin Valley Unified APCD*****************************************************************************************Year: 2035 -- Model Years 1991 to 2035 Inclusive -- AnnualEmfac2007 Emission Factors: V2.3 Nov 1 2006District Average District Average San Joaquin Valley Unified APCD
Table 1: Running Exhaust Emissions (grams/mile)
Pollutant Name: Reactive Org Gases Temperature: 67F Relative Humidity: 55%Speed LDA LDA LDA LDA LDT1 LDT1 LDT1 LDT1 LDT2 LDT2 LDT2 LDT2 MDV MDV MDV MDV LHD1 LHD1 LHD1 LHD1 LHD2 LHD2 LHD2 LHD2 MHD MHD MHD MHD HHD HHD HHD HHD OBUS OBUS OBUS OBUS UBUS UBUS UBUS UBUS MCY MCY MCY MCY SBUS SBUS SBUS SBUS MH MH MH MH ALL ALL ALL ALL MPH NCAT CAT DSL ALL NCAT CAT DSL ALL NCAT CAT DSL ALL NCAT CAT DSL ALL NCAT CAT DSL ALL NCAT CAT DSL ALL NCAT CAT DSL ALL NCAT CAT DSL ALL NCAT CAT DSL ALL NCAT CAT DSL ALL NCAT CAT DSL ALL NCAT CAT DSL ALL NCAT CAT DSL ALL NCAT CAT DSL ALL
5 0 0.036 0.155 0.036 0 0.041 0.164 0.042 0 0.081 0.183 0.081 0 0.107 0.153 0.107 0 0.048 0.219 0.081 0 0.036 0.195 0.103 0 0.075 0.311 0.269 0 3.327 2.377 2.389 0 0.246 0.304 0.294 0 4.51 1.431 2.548 5.633 4.281 0 4.725 0 1.094 0.679 0.727 0 0.061 0.14 0.068 5.633 0.096 1.959 0.37535 0 0.006 0.05 0.006 0 0.006 0.053 0.006 0 0.012 0.06 0.012 0 0.015 0.05 0.015 0 0.007 0.071 0.019 0 0.005 0.063 0.03 0 0.011 0.101 0.085 0 0.428 0.242 0.244 0 0.034 0.099 0.087 0 0.654 0.353 0.462 2.652 1.423 0 1.826 0 0.153 0.221 0.213 0 0.009 0.046 0.012 2.652 0.02 0.214 0.05545 0 0.005 0.041 0.005 0 0.005 0.044 0.005 0 0.01 0.049 0.01 0 0.013 0.041 0.013 0 0.005 0.058 0.015 0 0.004 0.052 0.024 0 0.008 0.083 0.07 0 0.302 0.188 0.19 0 0.025 0.081 0.071 0 0.479 0.292 0.36 2.996 1.533 0 2.014 0 0.11 0.181 0.173 0 0.006 0.038 0.009 2.996 0.019 0.168 0.04965 0 0.006 0.036 0.006 0 0.007 0.038 0.007 0 0.013 0.043 0.013 0 0.017 0.036 0.017 0 0.004 0.051 0.013 0 0.003 0.046 0.021 0 0.007 0.073 0.061 0 0.265 0.151 0.152 0 0.022 0.071 0.062 0 0.426 0.306 0.35 6.658 3.435 0 4.493 0 0.097 0.159 0.152 0 0.006 0.033 0.008 6.658 0.035 0.136 0.07
Pollutant Name: Carbon Monoxide Temperature: 67F Relative Humidity: 55%Speed LDA LDA LDA LDA LDT1 LDT1 LDT1 LDT1 LDT2 LDT2 LDT2 LDT2 MDV MDV MDV MDV LHD1 LHD1 LHD1 LHD1 LHD2 LHD2 LHD2 LHD2 MHD MHD MHD MHD HHD HHD HHD HHD OBUS OBUS OBUS OBUS UBUS UBUS UBUS UBUS MCY MCY MCY MCY SBUS SBUS SBUS SBUS MH MH MH MH ALL ALL ALL ALL MPH NCAT CAT DSL ALL NCAT CAT DSL ALL NCAT CAT DSL ALL NCAT CAT DSL ALL NCAT CAT DSL ALL NCAT CAT DSL ALL NCAT CAT DSL ALL NCAT CAT DSL ALL NCAT CAT DSL ALL NCAT CAT DSL ALL NCAT CAT DSL ALL NCAT CAT DSL ALL NCAT CAT DSL ALL NCAT CAT DSL ALL
5 0 0.782 1.942 0.782 0 0.875 1.988 0.877 0 1.483 2.09 1.483 0 2.003 1.932 2.003 0 0.737 2.616 1.1 0 0.569 2.382 1.338 0 1.098 5.283 4.535 0 136.107 4.702 6.317 0 3.283 5.195 4.843 0 53.392 6.739 23.66 40.566 13.793 0 22.584 0 14.4 8.935 9.569 0 0.812 2.184 0.939 40.566 1.454 4.704 2.03135 0 0.467 0.413 0.467 0 0.521 0.423 0.521 0 0.883 0.445 0.883 0 1.192 0.411 1.192 0 0.146 0.556 0.225 0 0.113 0.507 0.28 0 0.217 1.124 0.962 0 26.935 1.015 1.333 0 0.65 1.105 1.021 0 10.566 1.03 4.489 26.83 8.664 0 14.629 0 2.85 1.9 2.01 0 0.161 0.465 0.189 26.83 0.756 1.009 0.87245 0 0.402 0.355 0.402 0 0.449 0.363 0.449 0 0.761 0.382 0.761 0 1.027 0.353 1.027 0 0.132 0.478 0.199 0 0.102 0.435 0.243 0 0.197 0.965 0.828 0 24.372 1.039 1.325 0 0.588 0.949 0.883 0 9.561 0.89 4.035 35.365 8.236 0 17.144 0 2.579 1.632 1.742 0 0.145 0.399 0.169 35.365 0.66 1 0.81465 0 0.309 0.452 0.309 0 0.345 0.463 0.346 0 0.585 0.486 0.585 0 0.791 0.45 0.791 0 0.209 0.609 0.286 0 0.161 0.554 0.328 0 0.311 1.229 1.065 0 38.607 1.322 1.78 0 0.931 1.209 1.158 0 15.145 1.366 6.364 114.334 11.391 0 45.193 0 4.085 2.079 2.312 0 0.23 0.508 0.256 114.334 0.586 1.274 1.033
Pollutant Name: Oxides of Nitrogen Temperature: 67F Relative Humidity: 55%Speed LDA LDA LDA LDA LDT1 LDT1 LDT1 LDT1 LDT2 LDT2 LDT2 LDT2 MDV MDV MDV MDV LHD1 LHD1 LHD1 LHD1 LHD2 LHD2 LHD2 LHD2 MHD MHD MHD MHD HHD HHD HHD HHD OBUS OBUS OBUS OBUS UBUS UBUS UBUS UBUS MCY MCY MCY MCY SBUS SBUS SBUS SBUS MH MH MH MH ALL ALL ALL ALL MPH NCAT CAT DSL ALL NCAT CAT DSL ALL NCAT CAT DSL ALL NCAT CAT DSL ALL NCAT CAT DSL ALL NCAT CAT DSL ALL NCAT CAT DSL ALL NCAT CAT DSL ALL NCAT CAT DSL ALL NCAT CAT DSL ALL NCAT CAT DSL ALL NCAT CAT DSL ALL NCAT CAT DSL ALL NCAT CAT DSL ALL
5 0 0.055 2.11 0.055 0 0.062 2.1 0.065 0 0.117 2.077 0.117 0 0.142 2.112 0.142 0 0.088 1.568 0.374 0 0.07 1.336 0.607 0 0.115 1.627 1.357 0 3.535 6.723 6.683 0 0.259 1.563 1.323 0 3.772 20.975 14.736 0.991 1.226 0 1.149 0 0.977 6.367 5.742 0 0.112 2.572 0.34 0.991 0.098 5.857 0.9135 0 0.031 1.172 0.031 0 0.035 1.166 0.037 0 0.066 1.154 0.066 0 0.08 1.173 0.08 0 0.115 0.871 0.261 0 0.091 0.742 0.368 0 0.15 0.904 0.769 0 4.61 2.335 2.363 0 0.338 0.868 0.77 0 4.919 8.894 7.452 1.288 0.925 0 1.045 0 1.274 3.537 3.274 0 0.146 1.429 0.265 1.288 0.066 2.122 0.35945 0 0.03 1.28 0.03 0 0.033 1.274 0.035 0 0.063 1.26 0.063 0 0.076 1.281 0.076 0 0.124 0.951 0.284 0 0.098 0.81 0.401 0 0.162 0.987 0.839 0 4.969 2.058 2.093 0 0.364 0.948 0.84 0 5.302 9.968 8.275 1.391 0.947 0 1.093 0 1.373 3.862 3.573 0 0.157 1.56 0.287 1.391 0.065 1.927 0.33165 0 0.032 2.337 0.032 0 0.036 2.325 0.04 0 0.069 2.3 0.069 0 0.084 2.339 0.085 0 0.142 1.736 0.45 0 0.113 1.48 0.693 0 0.185 1.802 1.513 0 5.685 2.106 2.15 0 0.417 1.731 1.489 0 6.067 22.813 16.739 1.595 1.173 0 1.312 0 1.571 7.051 6.415 0 0.18 2.848 0.427 1.595 0.073 2.238 0.382
Pollutant Name: Carbon Dioxide Temperature: 67F Relative Humidity: 55%Speed LDA LDA LDA LDA LDT1 LDT1 LDT1 LDT1 LDT2 LDT2 LDT2 LDT2 MDV MDV MDV MDV LHD1 LHD1 LHD1 LHD1 LHD2 LHD2 LHD2 LHD2 MHD MHD MHD MHD HHD HHD HHD HHD OBUS OBUS OBUS OBUS UBUS UBUS UBUS UBUS MCY MCY MCY MCY SBUS SBUS SBUS SBUS MH MH MH MH ALL ALL ALL ALL MPH NCAT CAT DSL ALL NCAT CAT DSL ALL NCAT CAT DSL ALL NCAT CAT DSL ALL NCAT CAT DSL ALL NCAT CAT DSL ALL NCAT CAT DSL ALL NCAT CAT DSL ALL NCAT CAT DSL ALL NCAT CAT DSL ALL NCAT CAT DSL ALL NCAT CAT DSL ALL NCAT CAT DSL ALL NCAT CAT DSL ALL
5 0 921.799 345.72 921.789 0 1163.998 345.72 1162.545 0 1190.619 345.72 1190.598 0 1619.535 345.72 1619.325 0 2513.51 519.007 2128.576 0 2513.51 519.222 1667.16 0 2513.51 1505 1685.346 0 2513.51 3845.361 3828.993 0 2513.51 1505 1690.781 0 2513.51 2367.183 2420.256 232.686 282.878 0 266.397 0 2513.51 1505 1621.975 0 2513.51 1505 2419.881 232.686 1156.17 3314.219 1456.37335 0 299.856 345.72 299.857 0 378.641 345.72 378.583 0 387.301 345.72 387.3 0 526.825 345.72 526.795 0 497.421 519.007 501.587 0 497.421 519.222 506.673 0 497.421 1505 1324.82 0 497.421 1827.808 1811.458 0 497.421 1505 1319.39 0 497.421 2367.183 1689.019 115.041 152.196 0 139.996 0 497.421 1505 1388.133 0 497.421 1505 590.963 115.041 364.54 1709.74 552.67445 0 277.705 345.72 277.706 0 350.671 345.72 350.662 0 358.691 345.72 358.691 0 487.908 345.72 487.884 0 450.085 519.007 463.387 0 450.085 519.222 479.426 0 450.085 1505 1316.355 0 450.085 1701.031 1685.656 0 450.085 1505 1310.671 0 450.085 2367.182 1671.85 102.934 165.141 0 144.715 0 450.085 1505 1382.643 0 450.085 1505 548.022 102.934 337.392 1608.919 515.22765 0 372.217 345.72 372.216 0 470.015 345.72 469.794 0 480.764 345.72 480.761 0 653.958 345.72 653.907 0 712.968 519.007 675.534 0 712.968 519.222 630.745 0 712.968 1505 1363.365 0 712.968 1711.772 1699.496 0 712.968 1505 1359.097 0 712.968 2367.182 1767.197 99.195 303.161 0 236.188 0 712.968 1505 1413.134 0 712.968 1505 786.499 99.195 456.93 1617.461 618.798
Pollutant Name: Sulfur Dioxide Temperature: 67F Relative Humidity: 55%Speed LDA LDA LDA LDA LDT1 LDT1 LDT1 LDT1 LDT2 LDT2 LDT2 LDT2 MDV MDV MDV MDV LHD1 LHD1 LHD1 LHD1 LHD2 LHD2 LHD2 LHD2 MHD MHD MHD MHD HHD HHD HHD HHD OBUS OBUS OBUS OBUS UBUS UBUS UBUS UBUS MCY MCY MCY MCY SBUS SBUS SBUS SBUS MH MH MH MH ALL ALL ALL ALL MPH NCAT CAT DSL ALL NCAT CAT DSL ALL NCAT CAT DSL ALL NCAT CAT DSL ALL NCAT CAT DSL ALL NCAT CAT DSL ALL NCAT CAT DSL ALL NCAT CAT DSL ALL NCAT CAT DSL ALL NCAT CAT DSL ALL NCAT CAT DSL ALL NCAT CAT DSL ALL NCAT CAT DSL ALL NCAT CAT DSL ALL
5 0 0.009 0.003 0.009 0 0.011 0.003 0.011 0 0.011 0.003 0.011 0 0.016 0.003 0.016 0 0.024 0.005 0.02 0 0.024 0.005 0.016 0 0.024 0.014 0.016 0 0.026 0.037 0.037 0 0.024 0.014 0.016 0 0.025 0.023 0.023 0.003 0.003 0 0.003 0 0.024 0.014 0.016 0 0.024 0.014 0.023 0.003 0.011 0.032 0.01435 0 0.003 0.003 0.003 0 0.004 0.003 0.004 0 0.004 0.003 0.004 0 0.005 0.003 0.005 0 0.005 0.005 0.005 0 0.005 0.005 0.005 0 0.005 0.014 0.013 0 0.005 0.017 0.017 0 0.005 0.014 0.013 0 0.005 0.023 0.016 0.002 0.002 0 0.002 0 0.005 0.014 0.013 0 0.005 0.014 0.006 0.002 0.004 0.016 0.00545 0 0.003 0.003 0.003 0 0.003 0.003 0.003 0 0.003 0.003 0.003 0 0.005 0.003 0.005 0 0.004 0.005 0.004 0 0.004 0.005 0.005 0 0.004 0.014 0.013 0 0.005 0.016 0.016 0 0.004 0.014 0.013 0 0.004 0.023 0.016 0.002 0.002 0 0.002 0 0.004 0.014 0.013 0 0.004 0.014 0.005 0.002 0.003 0.015 0.00565 0 0.004 0.003 0.004 0 0.005 0.003 0.005 0 0.005 0.003 0.005 0 0.006 0.003 0.006 0 0.007 0.005 0.006 0 0.007 0.005 0.006 0 0.007 0.014 0.013 0 0.007 0.016 0.016 0 0.007 0.014 0.013 0 0.007 0.023 0.017 0.003 0.003 0 0.003 0 0.007 0.014 0.014 0 0.007 0.014 0.008 0.003 0.004 0.015 0.006
Pollutant Name: PM10 Temperature: 67F Relative Humidity: 55%Speed LDA LDA LDA LDA LDT1 LDT1 LDT1 LDT1 LDT2 LDT2 LDT2 LDT2 MDV MDV MDV MDV LHD1 LHD1 LHD1 LHD1 LHD2 LHD2 LHD2 LHD2 MHD MHD MHD MHD HHD HHD HHD HHD OBUS OBUS OBUS OBUS UBUS UBUS UBUS UBUS MCY MCY MCY MCY SBUS SBUS SBUS SBUS MH MH MH MH ALL ALL ALL ALL MPH NCAT CAT DSL ALL NCAT CAT DSL ALL NCAT CAT DSL ALL NCAT CAT DSL ALL NCAT CAT DSL ALL NCAT CAT DSL ALL NCAT CAT DSL ALL NCAT CAT DSL ALL NCAT CAT DSL ALL NCAT CAT DSL ALL NCAT CAT DSL ALL NCAT CAT DSL ALL NCAT CAT DSL ALL NCAT CAT DSL ALL
5 0 0.057 0.096 0.057 0 0.064 0.101 0.065 0 0.143 0.114 0.143 0 0.149 0.094 0.149 0 0.047 0.059 0.049 0 0.044 0.052 0.047 0 0.059 0.364 0.309 0 0.092 0.094 0.094 0 0.06 0.356 0.302 0 0.093 0.647 0.446 0.08 0.006 0 0.03 0 0.065 0.712 0.637 0 0.015 0.173 0.03 0.08 0.088 0.137 0.09535 0 0.009 0.031 0.009 0 0.01 0.033 0.011 0 0.023 0.037 0.023 0 0.024 0.031 0.024 0 0.007 0.019 0.009 0 0.006 0.017 0.011 0 0.009 0.118 0.099 0 0.014 0.072 0.071 0 0.009 0.116 0.096 0 0.014 0.159 0.107 0.038 0.002 0 0.014 0 0.01 0.232 0.206 0 0.002 0.056 0.007 0.038 0.014 0.077 0.02345 0 0.008 0.026 0.008 0 0.009 0.027 0.009 0 0.019 0.031 0.019 0 0.02 0.025 0.02 0 0.005 0.016 0.007 0 0.005 0.014 0.009 0 0.006 0.097 0.081 0 0.01 0.087 0.086 0 0.006 0.095 0.079 0 0.01 0.132 0.088 0.043 0.002 0 0.016 0 0.007 0.19 0.169 0 0.002 0.046 0.006 0.043 0.012 0.085 0.02265 0 0.01 0.022 0.01 0 0.012 0.024 0.012 0 0.026 0.027 0.026 0 0.027 0.022 0.027 0 0.005 0.014 0.006 0 0.004 0.012 0.008 0 0.006 0.085 0.071 0 0.009 0.151 0.149 0 0.006 0.083 0.069 0 0.009 0.138 0.091 0.095 0.005 0 0.034 0 0.006 0.167 0.148 0 0.002 0.04 0.005 0.095 0.016 0.135 0.033
Pollutant Name: PM10 - Tire Wear Temperature: 67F Relative Humidity: 55%Speed LDA LDA LDA LDA LDT1 LDT1 LDT1 LDT1 LDT2 LDT2 LDT2 LDT2 MDV MDV MDV MDV LHD1 LHD1 LHD1 LHD1 LHD2 LHD2 LHD2 LHD2 MHD MHD MHD MHD HHD HHD HHD HHD OBUS OBUS OBUS OBUS UBUS UBUS UBUS UBUS MCY MCY MCY MCY SBUS SBUS SBUS SBUS MH MH MH MH ALL ALL ALL ALL MPH NCAT CAT DSL ALL NCAT CAT DSL ALL NCAT CAT DSL ALL NCAT CAT DSL ALL NCAT CAT DSL ALL NCAT CAT DSL ALL NCAT CAT DSL ALL NCAT CAT DSL ALL NCAT CAT DSL ALL NCAT CAT DSL ALL NCAT CAT DSL ALL NCAT CAT DSL ALL NCAT CAT DSL ALL NCAT CAT DSL ALL
5 0 0.008 0.008 0.008 0 0.008 0.008 0.008 0 0.008 0.008 0.008 0 0.008 0.008 0.008 0 0.012 0.012 0.012 0 0.012 0.012 0.012 0 0.012 0.012 0.012 0 0.012 0.036 0.036 0 0.012 0.012 0.012 0 0.012 0.008 0.009 0.004 0.004 0 0.004 0 0.012 0.012 0.012 0 0.012 0.012 0.012 0.004 0.008 0.031 0.01135 0 0.008 0.008 0.008 0 0.008 0.008 0.008 0 0.008 0.008 0.008 0 0.008 0.008 0.008 0 0.012 0.012 0.012 0 0.012 0.012 0.012 0 0.012 0.012 0.012 0 0.012 0.036 0.036 0 0.012 0.012 0.012 0 0.012 0.008 0.009 0.004 0.004 0 0.004 0 0.012 0.012 0.012 0 0.012 0.012 0.012 0.004 0.008 0.031 0.01145 0 0.008 0.008 0.008 0 0.008 0.008 0.008 0 0.008 0.008 0.008 0 0.008 0.008 0.008 0 0.012 0.012 0.012 0 0.012 0.012 0.012 0 0.012 0.012 0.012 0 0.012 0.036 0.036 0 0.012 0.012 0.012 0 0.012 0.008 0.009 0.004 0.004 0 0.004 0 0.012 0.012 0.012 0 0.012 0.012 0.012 0.004 0.008 0.031 0.01165 0 0.008 0.008 0.008 0 0.008 0.008 0.008 0 0.008 0.008 0.008 0 0.008 0.008 0.008 0 0.012 0.012 0.012 0 0.012 0.012 0.012 0 0.012 0.012 0.012 0 0.012 0.036 0.036 0 0.012 0.012 0.012 0 0.012 0.008 0.009 0.004 0.004 0 0.004 0 0.012 0.012 0.012 0 0.012 0.012 0.012 0.004 0.008 0.031 0.011
Pollutant Name: PM10 - Brake Wear Temperature: 67F Relative Humidity: 55%Speed LDA LDA LDA LDA LDT1 LDT1 LDT1 LDT1 LDT2 LDT2 LDT2 LDT2 MDV MDV MDV MDV LHD1 LHD1 LHD1 LHD1 LHD2 LHD2 LHD2 LHD2 MHD MHD MHD MHD HHD HHD HHD HHD OBUS OBUS OBUS OBUS UBUS UBUS UBUS UBUS MCY MCY MCY MCY SBUS SBUS SBUS SBUS MH MH MH MH ALL ALL ALL ALL MPH NCAT CAT DSL ALL NCAT CAT DSL ALL NCAT CAT DSL ALL NCAT CAT DSL ALL NCAT CAT DSL ALL NCAT CAT DSL ALL NCAT CAT DSL ALL NCAT CAT DSL ALL NCAT CAT DSL ALL NCAT CAT DSL ALL NCAT CAT DSL ALL NCAT CAT DSL ALL NCAT CAT DSL ALL NCAT CAT DSL ALL
5 0 0.013 0.013 0.013 0 0.013 0.013 0.013 0 0.013 0.013 0.013 0 0.013 0.013 0.013 0 0.013 0.013 0.013 0 0.013 0.013 0.013 0 0.013 0.013 0.013 0 0.028 0.028 0.028 0 0.013 0.013 0.013 0 0.013 0.013 0.013 0.006 0.006 0 0.006 0 0.013 0.013 0.013 0 0.013 0.013 0.013 0.006 0.013 0.025 0.01435 0 0.013 0.013 0.013 0 0.013 0.013 0.013 0 0.013 0.013 0.013 0 0.013 0.013 0.013 0 0.013 0.013 0.013 0 0.013 0.013 0.013 0 0.013 0.013 0.013 0 0.028 0.028 0.028 0 0.013 0.013 0.013 0 0.013 0.013 0.013 0.006 0.006 0 0.006 0 0.013 0.013 0.013 0 0.013 0.013 0.013 0.006 0.013 0.025 0.01445 0 0.013 0.013 0.013 0 0.013 0.013 0.013 0 0.013 0.013 0.013 0 0.013 0.013 0.013 0 0.013 0.013 0.013 0 0.013 0.013 0.013 0 0.013 0.013 0.013 0 0.028 0.028 0.028 0 0.013 0.013 0.013 0 0.013 0.013 0.013 0.006 0.006 0 0.006 0 0.013 0.013 0.013 0 0.013 0.013 0.013 0.006 0.013 0.025 0.01465 0 0.013 0.013 0.013 0 0.013 0.013 0.013 0 0.013 0.013 0.013 0 0.013 0.013 0.013 0 0.013 0.013 0.013 0 0.013 0.013 0.013 0 0.013 0.013 0.013 0 0.028 0.028 0.028 0 0.013 0.013 0.013 0 0.013 0.013 0.013 0.006 0.006 0 0.006 0 0.013 0.013 0.013 0 0.013 0.013 0.013 0.006 0.013 0.025 0.014
Pollutant Name: PM2.5 Temperature: 67F Relative Humidity: 55%Speed LDA LDA LDA LDA LDT1 LDT1 LDT1 LDT1 LDT2 LDT2 LDT2 LDT2 MDV MDV MDV MDV LHD1 LHD1 LHD1 LHD1 LHD2 LHD2 LHD2 LHD2 MHD MHD MHD MHD HHD HHD HHD HHD OBUS OBUS OBUS OBUS UBUS UBUS UBUS UBUS MCY MCY MCY MCY SBUS SBUS SBUS SBUS MH MH MH MH ALL ALL ALL ALL MPH NCAT CAT DSL ALL NCAT CAT DSL ALL NCAT CAT DSL ALL NCAT CAT DSL ALL NCAT CAT DSL ALL NCAT CAT DSL ALL NCAT CAT DSL ALL NCAT CAT DSL ALL NCAT CAT DSL ALL NCAT CAT DSL ALL NCAT CAT DSL ALL NCAT CAT DSL ALL NCAT CAT DSL ALL NCAT CAT DSL ALL
5 0 0.053 0.088 0.053 0 0.06 0.093 0.06 0 0.132 0.105 0.132 0 0.138 0.087 0.138 0 0.044 0.054 0.046 0 0.041 0.048 0.044 0 0.054 0.335 0.284 0 0.085 0.086 0.086 0 0.056 0.328 0.278 0 0.086 0.595 0.41 0.061 0.005 0 0.023 0 0.061 0.655 0.586 0 0.014 0.159 0.028 0.061 0.082 0.126 0.08835 0 0.009 0.029 0.009 0 0.01 0.03 0.01 0 0.022 0.034 0.022 0 0.023 0.028 0.023 0 0.006 0.018 0.009 0 0.006 0.015 0.01 0 0.008 0.109 0.091 0 0.013 0.066 0.065 0 0.008 0.107 0.089 0 0.013 0.147 0.098 0.029 0.002 0 0.011 0 0.009 0.213 0.19 0 0.002 0.052 0.007 0.029 0.013 0.071 0.02145 0 0.007 0.024 0.007 0 0.008 0.025 0.008 0 0.018 0.028 0.018 0 0.019 0.023 0.019 0 0.005 0.014 0.007 0 0.004 0.013 0.008 0 0.006 0.089 0.074 0 0.009 0.08 0.079 0 0.006 0.088 0.073 0 0.009 0.122 0.081 0.033 0.002 0 0.012 0 0.007 0.175 0.155 0 0.002 0.042 0.005 0.033 0.011 0.079 0.02165 0 0.01 0.021 0.01 0 0.011 0.022 0.011 0 0.024 0.025 0.024 0 0.025 0.02 0.025 0 0.004 0.013 0.006 0 0.004 0.011 0.007 0 0.005 0.078 0.065 0 0.008 0.139 0.137 0 0.005 0.077 0.064 0 0.008 0.127 0.084 0.071 0.004 0 0.026 0 0.006 0.153 0.136 0 0.001 0.037 0.005 0.071 0.015 0.124 0.03
Pollutant Name: PM2.5 - Tire Wear Temperature: 67F Relative Humidity: 55%Speed LDA LDA LDA LDA LDT1 LDT1 LDT1 LDT1 LDT2 LDT2 LDT2 LDT2 MDV MDV MDV MDV LHD1 LHD1 LHD1 LHD1 LHD2 LHD2 LHD2 LHD2 MHD MHD MHD MHD HHD HHD HHD HHD OBUS OBUS OBUS OBUS UBUS UBUS UBUS UBUS MCY MCY MCY MCY SBUS SBUS SBUS SBUS MH MH MH MH ALL ALL ALL ALL MPH NCAT CAT DSL ALL NCAT CAT DSL ALL NCAT CAT DSL ALL NCAT CAT DSL ALL NCAT CAT DSL ALL NCAT CAT DSL ALL NCAT CAT DSL ALL NCAT CAT DSL ALL NCAT CAT DSL ALL NCAT CAT DSL ALL NCAT CAT DSL ALL NCAT CAT DSL ALL NCAT CAT DSL ALL NCAT CAT DSL ALL
5 0 0.002 0.002 0.002 0 0.002 0.002 0.002 0 0.002 0.002 0.002 0 0.002 0.002 0.002 0 0.003 0.003 0.003 0 0.003 0.003 0.003 0 0.003 0.003 0.003 0 0.003 0.009 0.009 0 0.003 0.003 0.003 0 0.003 0.002 0.002 0.001 0.001 0 0.001 0 0.003 0.003 0.003 0 0.003 0.003 0.003 0.001 0.002 0.008 0.00335 0 0.002 0.002 0.002 0 0.002 0.002 0.002 0 0.002 0.002 0.002 0 0.002 0.002 0.002 0 0.003 0.003 0.003 0 0.003 0.003 0.003 0 0.003 0.003 0.003 0 0.003 0.009 0.009 0 0.003 0.003 0.003 0 0.003 0.002 0.002 0.001 0.001 0 0.001 0 0.003 0.003 0.003 0 0.003 0.003 0.003 0.001 0.002 0.008 0.00345 0 0.002 0.002 0.002 0 0.002 0.002 0.002 0 0.002 0.002 0.002 0 0.002 0.002 0.002 0 0.003 0.003 0.003 0 0.003 0.003 0.003 0 0.003 0.003 0.003 0 0.003 0.009 0.009 0 0.003 0.003 0.003 0 0.003 0.002 0.002 0.001 0.001 0 0.001 0 0.003 0.003 0.003 0 0.003 0.003 0.003 0.001 0.002 0.008 0.00365 0 0.002 0.002 0.002 0 0.002 0.002 0.002 0 0.002 0.002 0.002 0 0.002 0.002 0.002 0 0.003 0.003 0.003 0 0.003 0.003 0.003 0 0.003 0.003 0.003 0 0.003 0.009 0.009 0 0.003 0.003 0.003 0 0.003 0.002 0.002 0.001 0.001 0 0.001 0 0.003 0.003 0.003 0 0.003 0.003 0.003 0.001 0.002 0.008 0.003
Pollutant Name: PM2.5 - Brake Wear Temperature: 67F Relative Humidity: 55%Speed LDA LDA LDA LDA LDT1 LDT1 LDT1 LDT1 LDT2 LDT2 LDT2 LDT2 MDV MDV MDV MDV LHD1 LHD1 LHD1 LHD1 LHD2 LHD2 LHD2 LHD2 MHD MHD MHD MHD HHD HHD HHD HHD OBUS OBUS OBUS OBUS UBUS UBUS UBUS UBUS MCY MCY MCY MCY SBUS SBUS SBUS SBUS MH MH MH MH ALL ALL ALL ALL MPH NCAT CAT DSL ALL NCAT CAT DSL ALL NCAT CAT DSL ALL NCAT CAT DSL ALL NCAT CAT DSL ALL NCAT CAT DSL ALL NCAT CAT DSL ALL NCAT CAT DSL ALL NCAT CAT DSL ALL NCAT CAT DSL ALL NCAT CAT DSL ALL NCAT CAT DSL ALL NCAT CAT DSL ALL NCAT CAT DSL ALL
5 0 0.005 0.005 0.005 0 0.005 0.005 0.005 0 0.005 0.005 0.005 0 0.005 0.005 0.005 0 0.005 0.005 0.005 0 0.005 0.005 0.005 0 0.005 0.005 0.005 0 0.012 0.012 0.012 0 0.005 0.005 0.005 0 0.005 0.005 0.005 0.003 0.003 0 0.003 0 0.005 0.005 0.005 0 0.005 0.005 0.005 0.003 0.005 0.011 0.00635 0 0.005 0.005 0.005 0 0.005 0.005 0.005 0 0.005 0.005 0.005 0 0.005 0.005 0.005 0 0.005 0.005 0.005 0 0.005 0.005 0.005 0 0.005 0.005 0.005 0 0.012 0.012 0.012 0 0.005 0.005 0.005 0 0.005 0.005 0.005 0.003 0.003 0 0.003 0 0.005 0.005 0.005 0 0.005 0.005 0.005 0.003 0.005 0.011 0.00645 0 0.005 0.005 0.005 0 0.005 0.005 0.005 0 0.005 0.005 0.005 0 0.005 0.005 0.005 0 0.005 0.005 0.005 0 0.005 0.005 0.005 0 0.005 0.005 0.005 0 0.012 0.012 0.012 0 0.005 0.005 0.005 0 0.005 0.005 0.005 0.003 0.003 0 0.003 0 0.005 0.005 0.005 0 0.005 0.005 0.005 0.003 0.005 0.011 0.00665 0 0.005 0.005 0.005 0 0.005 0.005 0.005 0 0.005 0.005 0.005 0 0.005 0.005 0.005 0 0.005 0.005 0.005 0 0.005 0.005 0.005 0 0.005 0.005 0.005 0 0.012 0.012 0.012 0 0.005 0.005 0.005 0 0.005 0.005 0.005 0.003 0.003 0 0.003 0 0.005 0.005 0.005 0 0.005 0.005 0.005 0.003 0.005 0.011 0.006
Pollutant Name: Methane Temperature: 67F Relative Humidity: 55%Speed LDA LDA LDA LDA LDT1 LDT1 LDT1 LDT1 LDT2 LDT2 LDT2 LDT2 MDV MDV MDV MDV LHD1 LHD1 LHD1 LHD1 LHD2 LHD2 LHD2 LHD2 MHD MHD MHD MHD HHD HHD HHD HHD OBUS OBUS OBUS OBUS UBUS UBUS UBUS UBUS MCY MCY MCY MCY SBUS SBUS SBUS SBUS MH MH MH MH ALL ALL ALL ALL MPH NCAT CAT DSL ALL NCAT CAT DSL ALL NCAT CAT DSL ALL NCAT CAT DSL ALL NCAT CAT DSL ALL NCAT CAT DSL ALL NCAT CAT DSL ALL NCAT CAT DSL ALL NCAT CAT DSL ALL NCAT CAT DSL ALL NCAT CAT DSL ALL NCAT CAT DSL ALL NCAT CAT DSL ALL NCAT CAT DSL ALL
5 0 0.025 0.007 0.025 0 0.027 0.008 0.027 0 0.05 0.008 0.05 0 0.056 0.007 0.056 0 0.029 0.01 0.025 0 0.028 0.009 0.02 0 0.042 0.014 0.019 0 0.237 0.11 0.112 0 0.051 0.014 0.021 0 0.228 0.066 0.125 0.326 0.275 0 0.292 0 0.088 0.032 0.038 0 0.042 0.007 0.038 0.326 0.037 0.091 0.04635 0 0.005 0.002 0.005 0 0.005 0.002 0.005 0 0.01 0.003 0.01 0 0.012 0.002 0.012 0 0.005 0.003 0.004 0 0.004 0.003 0.004 0 0.007 0.005 0.005 0 0.106 0.011 0.012 0 0.01 0.005 0.006 0 0.046 0.016 0.027 0.212 0.162 0 0.178 0 0.023 0.01 0.012 0 0.007 0.002 0.006 0.212 0.008 0.01 0.00945 0 0.004 0.002 0.004 0 0.004 0.002 0.004 0 0.008 0.002 0.008 0 0.01 0.002 0.01 0 0.003 0.003 0.003 0 0.003 0.002 0.003 0 0.005 0.004 0.004 0 0.093 0.009 0.01 0 0.008 0.004 0.005 0 0.037 0.014 0.022 0.225 0.167 0 0.186 0 0.019 0.008 0.01 0 0.005 0.002 0.005 0.225 0.007 0.008 0.00865 0 0.005 0.002 0.005 0 0.006 0.002 0.006 0 0.011 0.002 0.011 0 0.013 0.002 0.013 0 0.003 0.002 0.003 0 0.003 0.002 0.002 0 0.004 0.003 0.004 0 0.088 0.007 0.008 0 0.007 0.003 0.004 0 0.034 0.014 0.021 0.365 0.242 0 0.283 0 0.018 0.007 0.009 0 0.004 0.002 0.004 0.365 0.009 0.006 0.01

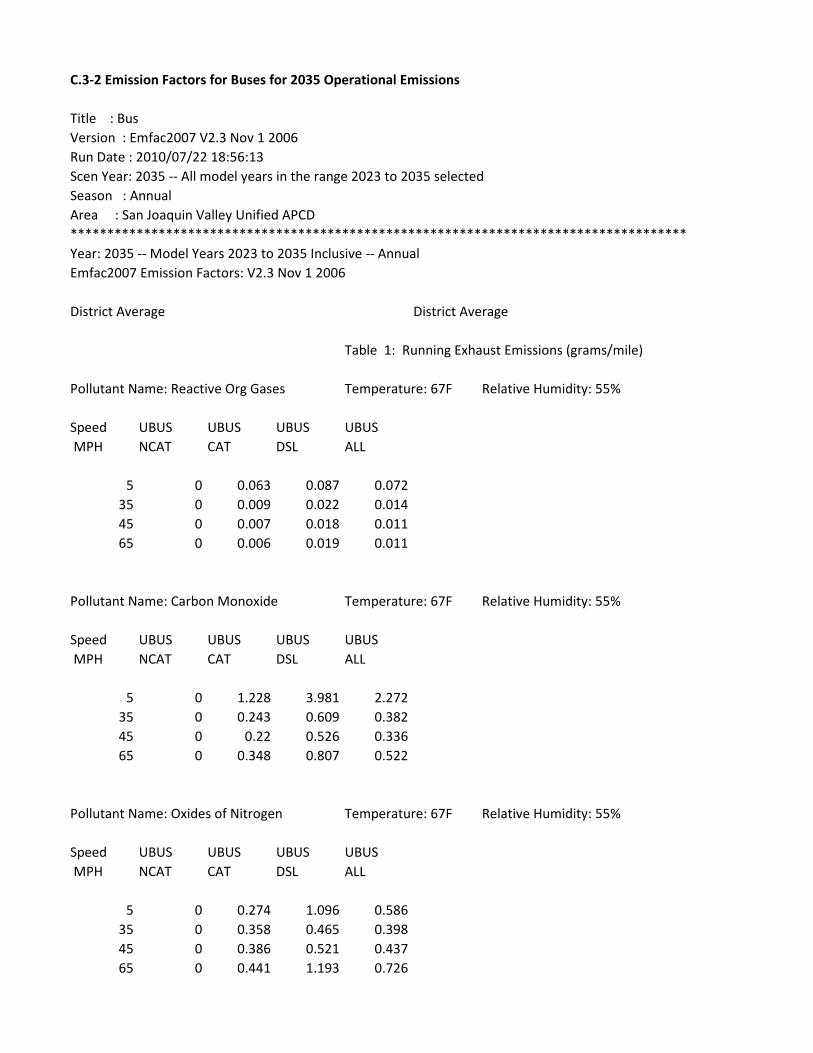
C.3-2 Emission Factors for Buses for 2035 Operational Emissions
Title : BusVersion : Emfac2007 V2.3 Nov 1 2006Run Date : 2010/07/22 18:56:13Scen Year: 2035 -- All model years in the range 2023 to 2035 selectedSeason : AnnualArea : San Joaquin Valley Unified APCD************************************************************************************Year: 2035 -- Model Years 2023 to 2035 Inclusive -- AnnualEmfac2007 Emission Factors: V2.3 Nov 1 2006
District Average District Average
Table 1: Running Exhaust Emissions (grams/mile)
Pollutant Name: Reactive Org Gases Temperature: 67F Relative Humidity: 55%
Speed UBUS UBUS UBUS UBUS MPH NCAT CAT DSL ALL
5 0 0.063 0.087 0.07235 0 0.009 0.022 0.01445 0 0.007 0.018 0.01165 0 0.006 0.019 0.011
Pollutant Name: Carbon Monoxide Temperature: 67F Relative Humidity: 55%
Speed UBUS UBUS UBUS UBUS MPH NCAT CAT DSL ALL
5 0 1.228 3.981 2.27235 0 0.243 0.609 0.38245 0 0.22 0.526 0.33665 0 0.348 0.807 0.522
Pollutant Name: Oxides of Nitrogen Temperature: 67F Relative Humidity: 55%
Speed UBUS UBUS UBUS UBUS MPH NCAT CAT DSL ALL
5 0 0.274 1.096 0.58635 0 0.358 0.465 0.39845 0 0.386 0.521 0.43765 0 0.441 1.193 0.726
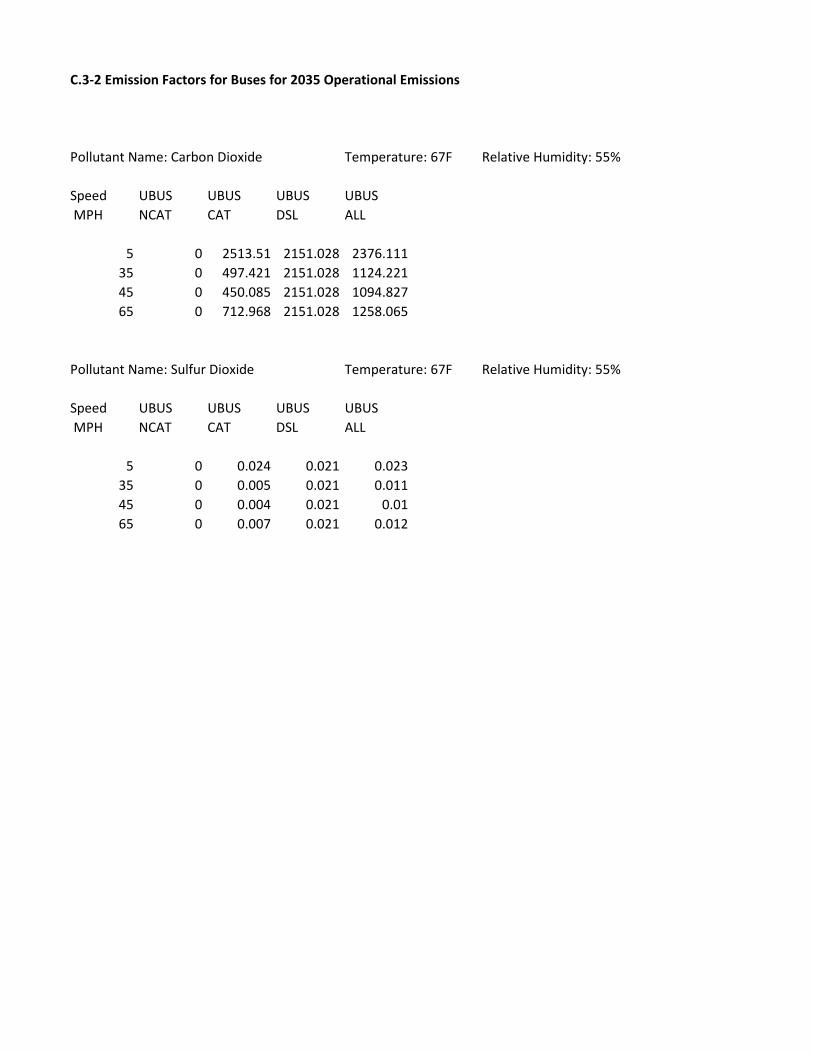
C.3-2 Emission Factors for Buses for 2035 Operational Emissions
Pollutant Name: Carbon Dioxide Temperature: 67F Relative Humidity: 55%
Speed UBUS UBUS UBUS UBUS MPH NCAT CAT DSL ALL
5 0 2513.51 2151.028 2376.11135 0 497.421 2151.028 1124.22145 0 450.085 2151.028 1094.82765 0 712.968 2151.028 1258.065
Pollutant Name: Sulfur Dioxide Temperature: 67F Relative Humidity: 55%
Speed UBUS UBUS UBUS UBUS MPH NCAT CAT DSL ALL
5 0 0.024 0.021 0.02335 0 0.005 0.021 0.01145 0 0.004 0.021 0.0165 0 0.007 0.021 0.012
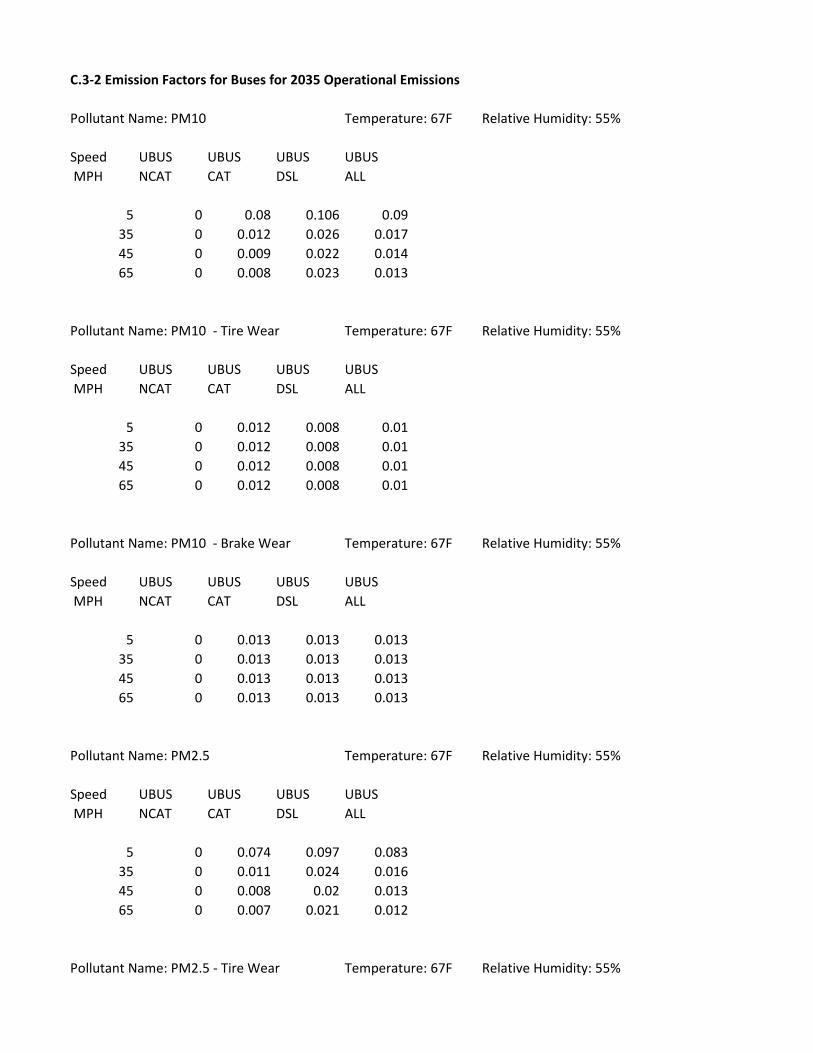
C.3-2 Emission Factors for Buses for 2035 Operational Emissions
Pollutant Name: PM10 Temperature: 67F Relative Humidity: 55%
Speed UBUS UBUS UBUS UBUS MPH NCAT CAT DSL ALL
5 0 0.08 0.106 0.0935 0 0.012 0.026 0.01745 0 0.009 0.022 0.01465 0 0.008 0.023 0.013
Pollutant Name: PM10 - Tire Wear Temperature: 67F Relative Humidity: 55%
Speed UBUS UBUS UBUS UBUS MPH NCAT CAT DSL ALL
5 0 0.012 0.008 0.0135 0 0.012 0.008 0.0145 0 0.012 0.008 0.0165 0 0.012 0.008 0.01
Pollutant Name: PM10 - Brake Wear Temperature: 67F Relative Humidity: 55%
Speed UBUS UBUS UBUS UBUS MPH NCAT CAT DSL ALL
5 0 0.013 0.013 0.01335 0 0.013 0.013 0.01345 0 0.013 0.013 0.01365 0 0.013 0.013 0.013
Pollutant Name: PM2.5 Temperature: 67F Relative Humidity: 55%
Speed UBUS UBUS UBUS UBUS MPH NCAT CAT DSL ALL
5 0 0.074 0.097 0.08335 0 0.011 0.024 0.01645 0 0.008 0.02 0.01365 0 0.007 0.021 0.012
Pollutant Name: PM2.5 - Tire Wear Temperature: 67F Relative Humidity: 55%
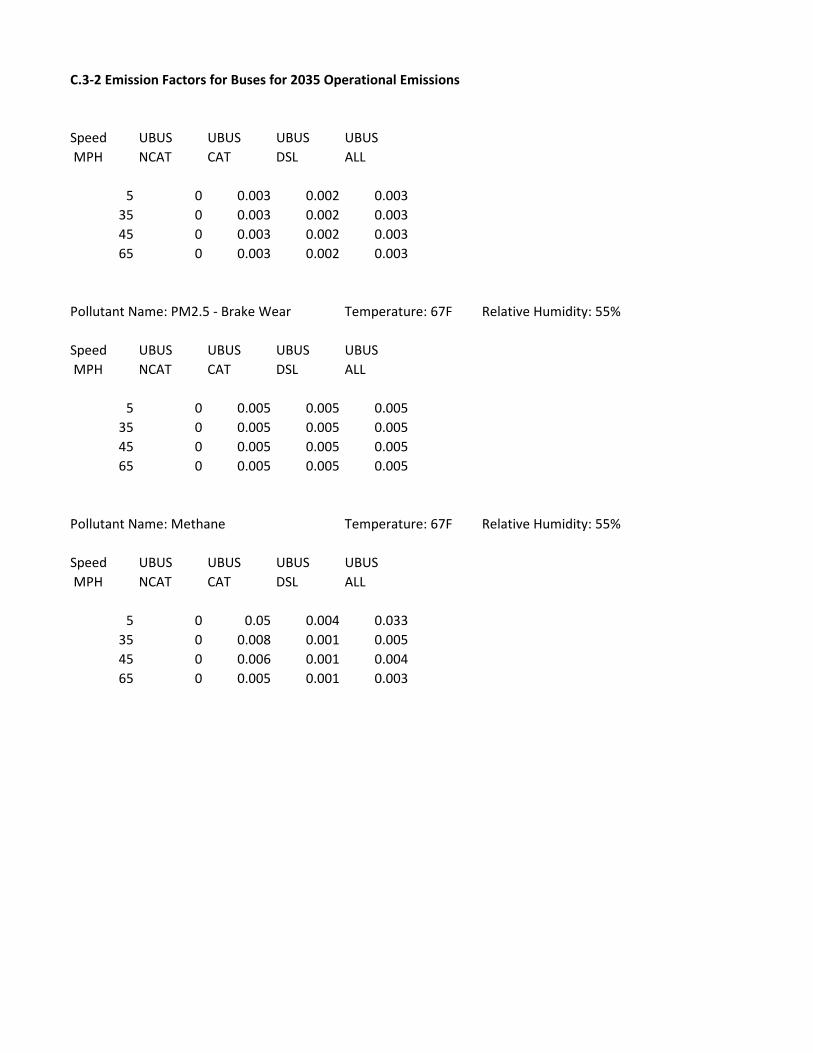
C.3-2 Emission Factors for Buses for 2035 Operational Emissions
Speed UBUS UBUS UBUS UBUS MPH NCAT CAT DSL ALL
5 0 0.003 0.002 0.00335 0 0.003 0.002 0.00345 0 0.003 0.002 0.00365 0 0.003 0.002 0.003
Pollutant Name: PM2.5 - Brake Wear Temperature: 67F Relative Humidity: 55%
Speed UBUS UBUS UBUS UBUS MPH NCAT CAT DSL ALL
5 0 0.005 0.005 0.00535 0 0.005 0.005 0.00545 0 0.005 0.005 0.00565 0 0.005 0.005 0.005
Pollutant Name: Methane Temperature: 67F Relative Humidity: 55%
Speed UBUS UBUS UBUS UBUS MPH NCAT CAT DSL ALL
5 0 0.05 0.004 0.03335 0 0.008 0.001 0.00545 0 0.006 0.001 0.00465 0 0.005 0.001 0.003
APPENDIX D
Microscale CO Analysis

CALIFORNIA HIGH-SPEED TRAIN PROGRAM AIR QUALITY TECHNICAL REPORT MERCED TO FRESNO SECTION PROJECT EIR/EIS APPENDIX D
Page i
Contents D.1 LOS and Traffic Summary File D.1-1 Castle Commerce Center HMF Site D.1-2 Merced HST Station D.1-3 Herndon Ave and Shaw Ave Area D.1-4 SR-99 Realignment Area D.1-5 Roeding Park Area D.2 EMFAC Runs D.2-1 2009 EMFAC Runs D.2-2 2035 EMFAC Runs

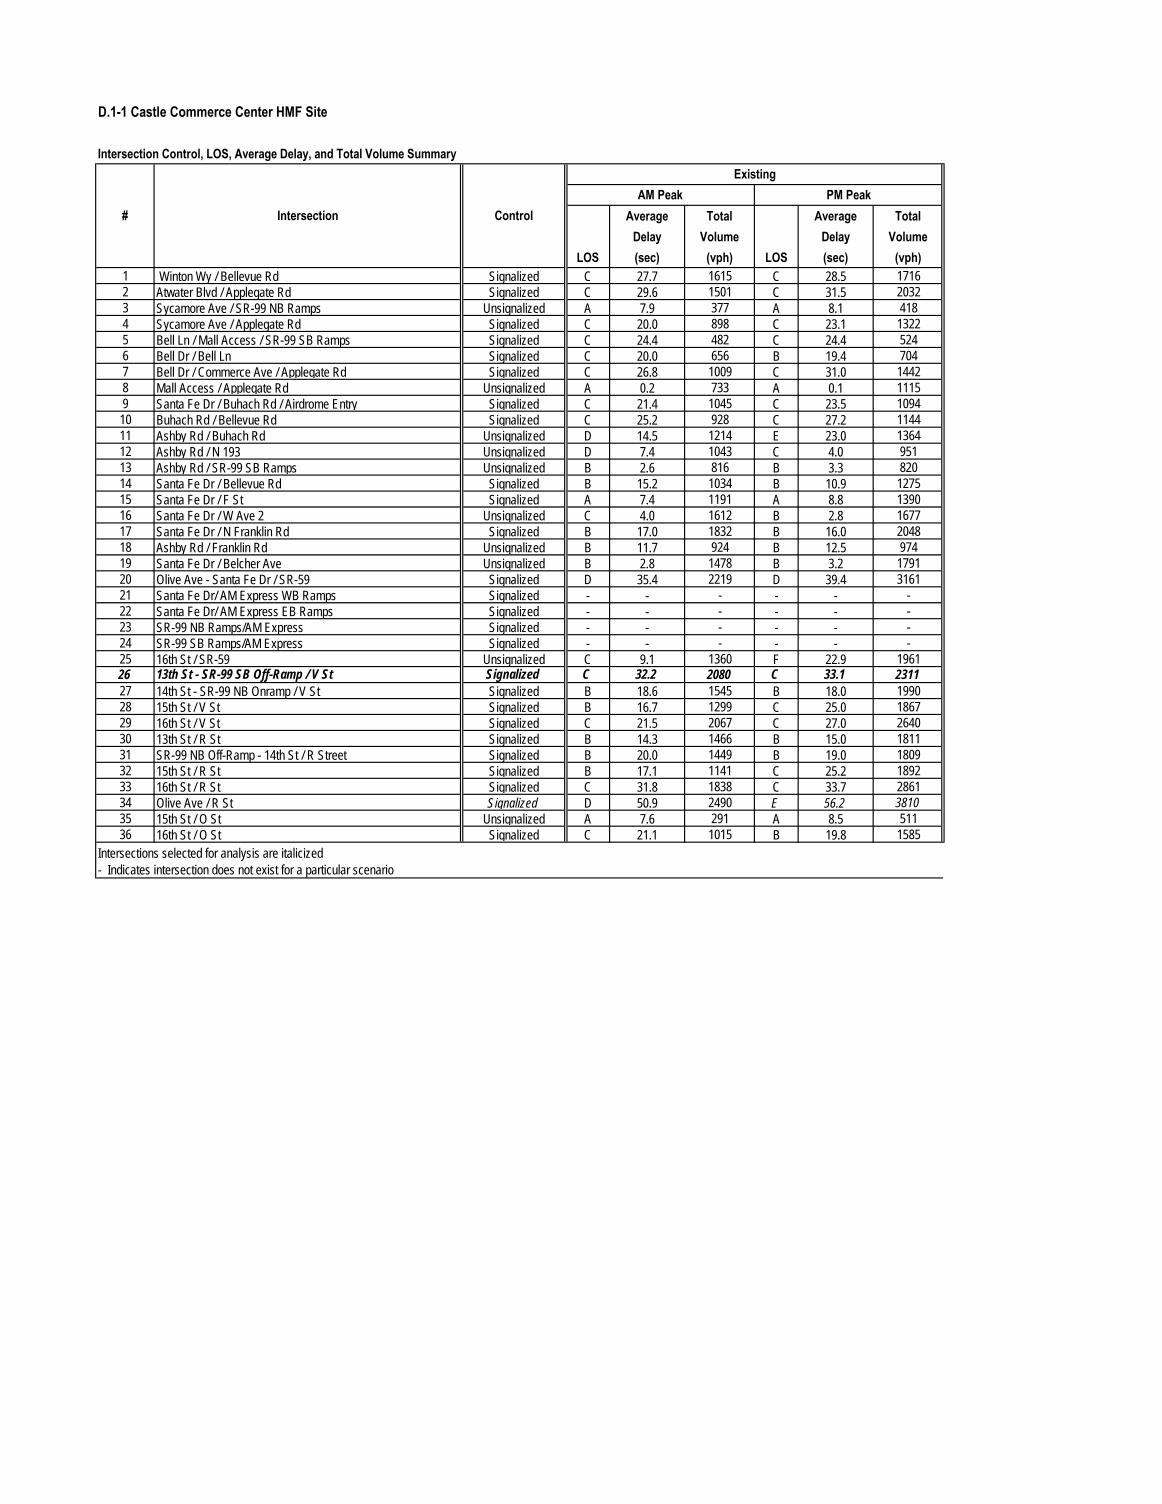
D.1-1 Castle Commerce Center HMF Site
Intersection Control, LOS, Average Delay, and Total Volume Summary
Average Total Average TotalDelay Volume Delay Volume
LOS (sec) (vph) LOS (sec) (vph)1 Winton Wy / Bellevue Rd Signalized C 27.7 1615 C 28.5 17162 Atwater Blvd / Applegate Rd Signalized C 29.6 1501 C 31.5 20323 Sycamore Ave / SR-99 NB Ramps Unsignalized A 7.9 377 A 8.1 4184 Sycamore Ave / Applegate Rd Signalized C 20.0 898 C 23.1 13225 Bell Ln / Mall Access / SR-99 SB Ramps Signalized C 24.4 482 C 24.4 5246 Bell Dr / Bell Ln Signalized C 20.0 656 B 19.4 7047 Bell Dr / Commerce Ave / Applegate Rd Signalized C 26.8 1009 C 31.0 14428 Mall Access / Applegate Rd Unsignalized A 0.2 733 A 0.1 11159 Santa Fe Dr / Buhach Rd / Airdrome Entry Signalized C 21.4 1045 C 23.5 109410 Buhach Rd / Bellevue Rd Signalized C 25.2 928 C 27.2 114411 Ashby Rd / Buhach Rd Unsignalized D 14.5 1214 E 23.0 136412 Ashby Rd / N 193 Unsignalized D 7.4 1043 C 4.0 95113 Ashby Rd / SR-99 SB Ramps Unsignalized B 2.6 816 B 3.3 82014 Santa Fe Dr / Bellevue Rd Signalized B 15.2 1034 B 10.9 127515 Santa Fe Dr / F St Signalized A 7.4 1191 A 8.8 139016 Santa Fe Dr / W Ave 2 Unsignalized C 4.0 1612 B 2.8 167717 Santa Fe Dr / N Franklin Rd Signalized B 17.0 1832 B 16.0 204818 Ashby Rd / Franklin Rd Unsignalized B 11.7 924 B 12.5 97419 Santa Fe Dr / Belcher Ave Unsignalized B 2.8 1478 B 3.2 179120 Olive Ave - Santa Fe Dr / SR-59 Signalized D 35.4 2219 D 39.4 316121 Santa Fe Dr/ AM Express WB Ramps Signalized - - - - - -22 Santa Fe Dr/ AM Express EB Ramps Signalized - - - - - -23 SR-99 NB Ramps/AM Express Signalized - - - - - -24 SR-99 SB Ramps/AM Express Signalized - - - - - -25 16th St / SR-59 Unsignalized C 9.1 1360 F 22.9 196126 13th St - SR-99 SB Off-Ramp / V St Signalized C 32.2 2080 C 33.1 231127 14th St - SR-99 NB Onramp / V St Signalized B 18.6 1545 B 18.0 199028 15th St / V St Signalized B 16.7 1299 C 25.0 186729 16th St / V St Signalized C 21.5 2067 C 27.0 264030 13th St / R St Signalized B 14.3 1466 B 15.0 181131 SR-99 NB Off-Ramp - 14th St / R Street Signalized B 20.0 1449 B 19.0 180932 15th St / R St Signalized B 17.1 1141 C 25.2 189233 16th St / R St Signalized C 31.8 1838 C 33.7 286134 Olive Ave / R St Signalized D 50.9 2490 E 56.2 381035 15th St / O St Unsignalized A 7.6 291 A 8.5 51136 16th St / O St Signalized C 21.1 1015 B 19.8 1585
Intersections selected for analysis are italicized- Indicates intersection does not exist for a particular scenario
# Intersection Control
ExistingAM Peak PM Peak

Intersection Control, LOS, Average Delay, and Total Volume Summary
Average Total Average TotalDelay Volume Delay Volume
LOS (sec) (vph) LOS (sec) (vph)
# Intersection Control
ExistingAM Peak PM Peak
37 15th St / M St Unsignalized B 11.0 822 B 12.7 99238 16th St / M St Signalized C 32.9 1570 C 33.7 229739 Olive Ave / M St Signalized D 54.5 3042 E 58.6 397140 2nd St / Grogan Ave / Northwest Ave Unsignalized A 9.8 581 B 10.0 64041 Childs Ave / Martin Luther King Wy Signalized D 39.2 1231 D 41.2 151642 13th St / Martin Luther King Wy Signalized C 25.7 1149 C 27.4 149543 SR-99 SB Ramps / Martin Luther King Wy Unsignalized C 5.6 1138 C 3.8 126444 SR-99 NB Ramps / Martin Luther King Wy Unsignalized C 3.8 1104 C 3.1 132545 14th St / Martin Luther King Wy Unsignalized C 1.4 871 C 2.2 125446 15th St / Martin Luther King Wy Signalized B 12.4 856 B 14.8 130647 16th St / Martin Luther King Wy Signalized C 29.1 1337 C 31.2 201548 13th St / G St Signalized B 12.9 1021 C 15.4 121949 SR-99 - 14th St / G St Unsignalized B 1.3 869 B 1.1 99050 16th St / G Street Signalized C 31.4 1917 C 32.8 237451 Olive Ave / G St Signalized D 46.8 3187 D 48.0 366652 SR-99 SB On-Ramp / Yosemite Pkwy (SR-140) Unsignalized B 6.0 810 D 7.1 100353 SR-99 SB Off-Ramp / Yosemite Pkwy (SR-140) Unsignalized E 19.1 1069 F 30.8 117054 SR-99 NB Off-Ramp / Yosemite Pkwy (SR-140) Unsignalized D 3.1 1536 F 11.3 168955 Motel Dr / Glen Ave / Yosemite Pkwy (SR-140) Unsignalized D 42.6 1630 D 36.9 168556 14th St / O St Unsignalized A 2.6 164 B 3.8 29657 13th St / M St Unsignalized B 12.7 955 C 15.8 110658 14th St / M St Unsignalized B 0.9 664 C 1.7 76259 Main St / M St Signalized A 9.7 1566 B 13.2 185860 18th St / M St Signalized B 12.2 1439 B 13.5 155561 15th St / Canal St Unsignalized B 5.1 256 B 7.5 49362 16th St / Canal St Unsignalized C 1.6 1106 C 2.0 144763 11th St / Martin Luther King Wy Unsignalized C 1.9 957 C 3.1 111964 Main St / Martin Luther King Wy Signalized A 9.5 513 A 9.9 81465 18th St / Martin Luther King Wy Unsignalized A 7.7 252 A 8.0 34766 16th St / H St Unsignalized B 0.6 731 B 1.0 98067 Main St / H St Unsignalized A 1.5 252 B 2.1 39868 15th St / G St Unsignalized B 1.6 708 C 3.3 91069 Main St / G St Signalized B 16.8 877 C 20.1 91970 18th St / G St Signalized A 8.5 749 A 4.5 60171 15th St / D St Unsignalized B 8.1 363 B 8.4 36472 16th St / D St Unsignalized A 4.0 670 B 3.4 943
Intersections selected for analysis are italicized- Indicates intersection does not exist for a particular scenario
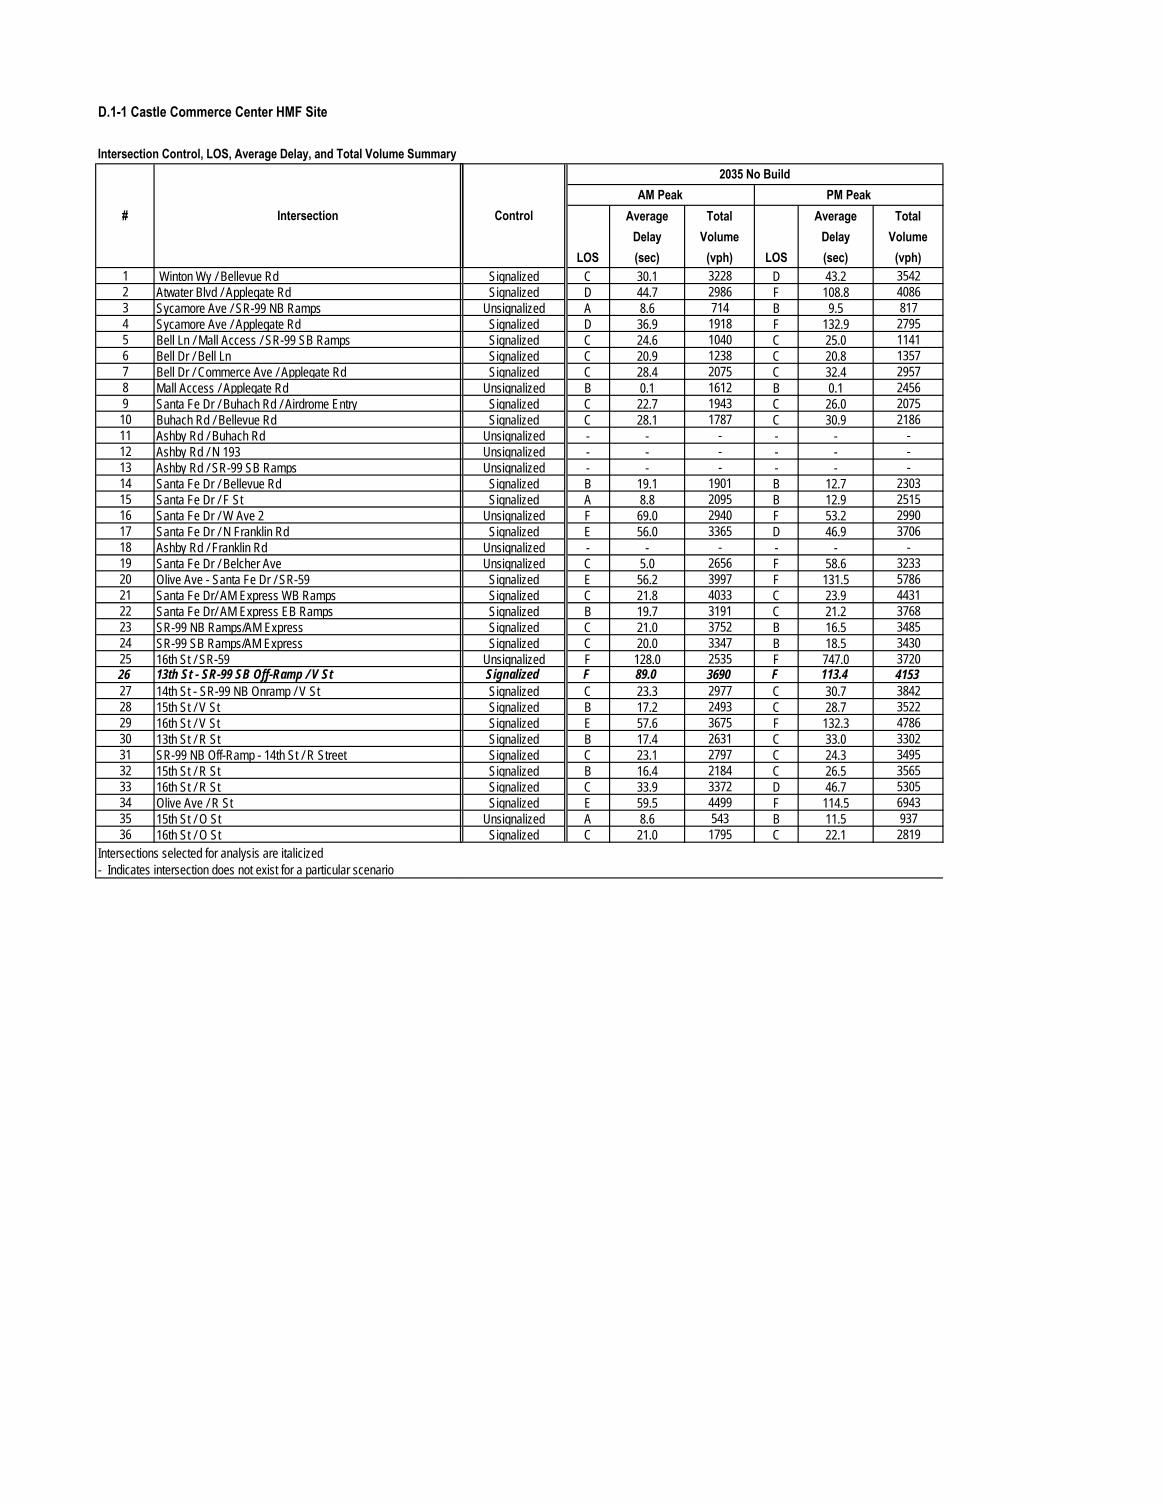
D.1-1 Castle Commerce Center HMF Site
Intersection Control, LOS, Average Delay, and Total Volume Summary
1 Winton Wy / Bellevue Rd2 Atwater Blvd / Applegate Rd3 Sycamore Ave / SR-99 NB Ramps4 Sycamore Ave / Applegate Rd5 Bell Ln / Mall Access / SR-99 SB Ramps6 Bell Dr / Bell Ln7 Bell Dr / Commerce Ave / Applegate Rd8 Mall Access / Applegate Rd9 Santa Fe Dr / Buhach Rd / Airdrome Entry10 Buhach Rd / Bellevue Rd 11 Ashby Rd / Buhach Rd12 Ashby Rd / N 19313 Ashby Rd / SR-99 SB Ramps14 Santa Fe Dr / Bellevue Rd15 Santa Fe Dr / F St16 Santa Fe Dr / W Ave 217 Santa Fe Dr / N Franklin Rd18 Ashby Rd / Franklin Rd19 Santa Fe Dr / Belcher Ave20 Olive Ave - Santa Fe Dr / SR-59 21 Santa Fe Dr/ AM Express WB Ramps22 Santa Fe Dr/ AM Express EB Ramps23 SR-99 NB Ramps/AM Express24 SR-99 SB Ramps/AM Express25 16th St / SR-59 26 13th St - SR-99 SB Off-Ramp / V St27 14th St - SR-99 NB Onramp / V St28 15th St / V St 29 16th St / V St 30 13th St / R St 31 SR-99 NB Off-Ramp - 14th St / R Street32 15th St / R St 33 16th St / R St 34 Olive Ave / R St 35 15th St / O St 36 16th St / O St
Intersections selected for analysis are italicized- Indicates intersection does not exist for a particular scenario
# Intersection Average Total Average TotalDelay Volume Delay Volume
LOS (sec) (vph) LOS (sec) (vph)Signalized C 30.1 3228 D 43.2 3542Signalized D 44.7 2986 F 108.8 4086
Unsignalized A 8.6 714 B 9.5 817Signalized D 36.9 1918 F 132.9 2795Signalized C 24.6 1040 C 25.0 1141Signalized C 20.9 1238 C 20.8 1357Signalized C 28.4 2075 C 32.4 2957
Unsignalized B 0.1 1612 B 0.1 2456Signalized C 22.7 1943 C 26.0 2075Signalized C 28.1 1787 C 30.9 2186
Unsignalized - - - - - -Unsignalized - - - - - -Unsignalized - - - - - -Signalized B 19.1 1901 B 12.7 2303Signalized A 8.8 2095 B 12.9 2515
Unsignalized F 69.0 2940 F 53.2 2990Signalized E 56.0 3365 D 46.9 3706
Unsignalized - - - - - -Unsignalized C 5.0 2656 F 58.6 3233Signalized E 56.2 3997 F 131.5 5786Signalized C 21.8 4033 C 23.9 4431Signalized B 19.7 3191 C 21.2 3768Signalized C 21.0 3752 B 16.5 3485Signalized C 20.0 3347 B 18.5 3430
Unsignalized F 128.0 2535 F 747.0 3720Signalized F 89.0 3690 F 113.4 4153Signalized C 23.3 2977 C 30.7 3842Signalized B 17.2 2493 C 28.7 3522Signalized E 57.6 3675 F 132.3 4786Signalized B 17.4 2631 C 33.0 3302Signalized C 23.1 2797 C 24.3 3495Signalized B 16.4 2184 C 26.5 3565Signalized C 33.9 3372 D 46.7 5305Signalized E 59.5 4499 F 114.5 6943
Unsignalized A 8.6 543 B 11.5 937Signalized C 21.0 1795 C 22.1 2819
2035 No BuildAM Peak PM Peak
Control
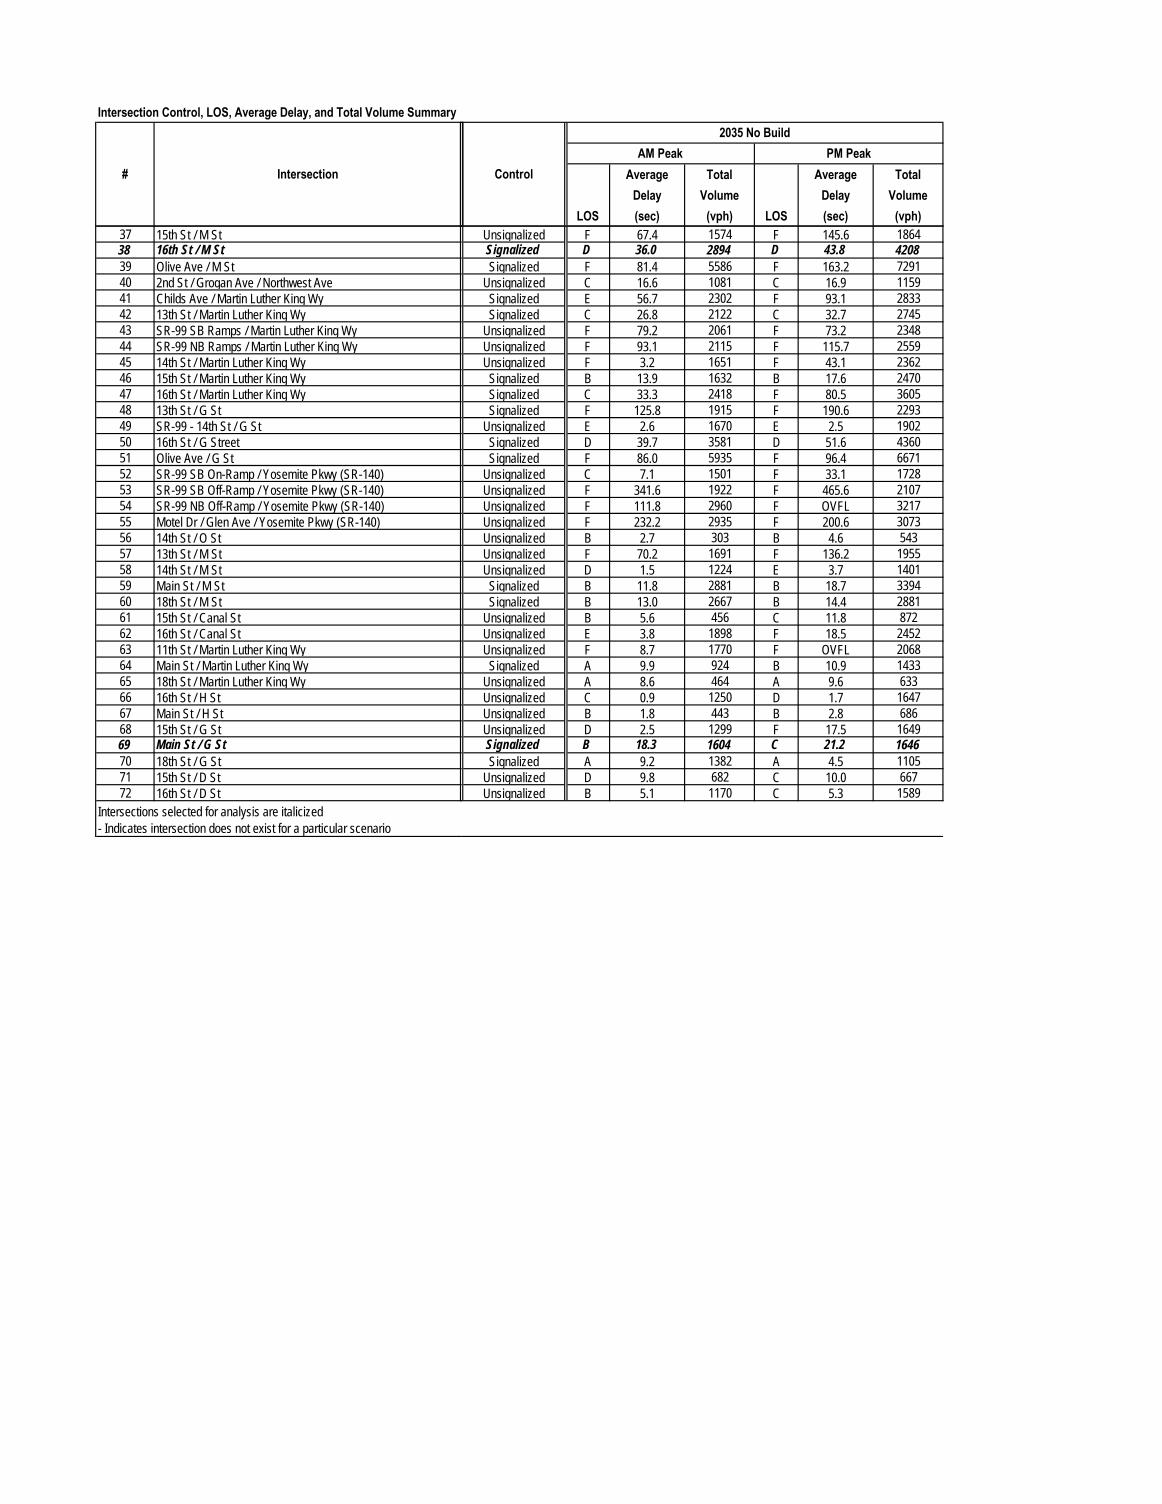
Intersection Control, LOS, Average Delay, and Total Volume Summary
# Intersection
37 15th St / M St 38 16th St / M St 39 Olive Ave / M St 40 2nd St / Grogan Ave / Northwest Ave 41 Childs Ave / Martin Luther King Wy 42 13th St / Martin Luther King Wy 43 SR-99 SB Ramps / Martin Luther King Wy 44 SR-99 NB Ramps / Martin Luther King Wy 45 14th St / Martin Luther King Wy 46 15th St / Martin Luther King Wy 47 16th St / Martin Luther King Wy 48 13th St / G St 49 SR-99 - 14th St / G St 50 16th St / G Street 51 Olive Ave / G St 52 SR-99 SB On-Ramp / Yosemite Pkwy (SR-140) 53 SR-99 SB Off-Ramp / Yosemite Pkwy (SR-140) 54 SR-99 NB Off-Ramp / Yosemite Pkwy (SR-140) 55 Motel Dr / Glen Ave / Yosemite Pkwy (SR-140)56 14th St / O St 57 13th St / M St 58 14th St / M St 59 Main St / M St 60 18th St / M St 61 15th St / Canal St 62 16th St / Canal St 63 11th St / Martin Luther King Wy 64 Main St / Martin Luther King Wy 65 18th St / Martin Luther King Wy 66 16th St / H St 67 Main St / H St 68 15th St / G St 69 Main St / G St 70 18th St / G St 71 15th St / D St 72 16th St / D St
Intersections selected for analysis are italicized- Indicates intersection does not exist for a particular scenario
Average Total Average TotalDelay Volume Delay Volume
LOS (sec) (vph) LOS (sec) (vph)
2035 No BuildAM Peak PM Peak
Control
Unsignalized F 67.4 1574 F 145.6 1864Signalized D 36.0 2894 D 43.8 4208Signalized F 81.4 5586 F 163.2 7291
Unsignalized C 16.6 1081 C 16.9 1159Signalized E 56.7 2302 F 93.1 2833Signalized C 26.8 2122 C 32.7 2745
Unsignalized F 79.2 2061 F 73.2 2348Unsignalized F 93.1 2115 F 115.7 2559Unsignalized F 3.2 1651 F 43.1 2362Signalized B 13.9 1632 B 17.6 2470Signalized C 33.3 2418 F 80.5 3605Signalized F 125.8 1915 F 190.6 2293
Unsignalized E 2.6 1670 E 2.5 1902Signalized D 39.7 3581 D 51.6 4360Signalized F 86.0 5935 F 96.4 6671
Unsignalized C 7.1 1501 F 33.1 1728Unsignalized F 341.6 1922 F 465.6 2107Unsignalized F 111.8 2960 F OVFL 3217Unsignalized F 232.2 2935 F 200.6 3073Unsignalized B 2.7 303 B 4.6 543Unsignalized F 70.2 1691 F 136.2 1955Unsignalized D 1.5 1224 E 3.7 1401Signalized B 11.8 2881 B 18.7 3394Signalized B 13.0 2667 B 14.4 2881
Unsignalized B 5.6 456 C 11.8 872Unsignalized E 3.8 1898 F 18.5 2452Unsignalized F 8.7 1770 F OVFL 2068Signalized A 9.9 924 B 10.9 1433
Unsignalized A 8.6 464 A 9.6 633Unsignalized C 0.9 1250 D 1.7 1647Unsignalized B 1.8 443 B 2.8 686Unsignalized D 2.5 1299 F 17.5 1649Signalized B 18.3 1604 C 21.2 1646Signalized A 9.2 1382 A 4.5 1105
Unsignalized D 9.8 682 C 10.0 667Unsignalized B 5.1 1170 C 5.3 1589

D.1-1 Castle Commerce Center HMF Site
Intersection Control, LOS, Average Delay, and Total Volume Summary
1 Winton Wy / Bellevue Rd2 Atwater Blvd / Applegate Rd3 Sycamore Ave / SR-99 NB Ramps4 Sycamore Ave / Applegate Rd5 Bell Ln / Mall Access / SR-99 SB Ramps6 Bell Dr / Bell Ln7 Bell Dr / Commerce Ave / Applegate Rd8 Mall Access / Applegate Rd9 Santa Fe Dr / Buhach Rd / Airdrome Entry10 Buhach Rd / Bellevue Rd 11 Ashby Rd / Buhach Rd12 Ashby Rd / N 19313 Ashby Rd / SR-99 SB Ramps14 Santa Fe Dr / Bellevue Rd15 Santa Fe Dr / F St16 Santa Fe Dr / W Ave 217 Santa Fe Dr / N Franklin Rd18 Ashby Rd / Franklin Rd19 Santa Fe Dr / Belcher Ave20 Olive Ave - Santa Fe Dr / SR-59 21 Santa Fe Dr/ AM Express WB Ramps22 Santa Fe Dr/ AM Express EB Ramps23 SR-99 NB Ramps/AM Express24 SR-99 SB Ramps/AM Express25 16th St / SR-59 26 13th St - SR-99 SB Off-Ramp / V St27 14th St - SR-99 NB Onramp / V St28 15th St / V St 29 16th St / V St 30 13th St / R St 31 SR-99 NB Off-Ramp - 14th St / R Street32 15th St / R St 33 16th St / R St 34 Olive Ave / R St 35 15th St / O St 36 16th St / O St
Intersections selected for analysis are italicized- Indicates intersection does not exist for a particular scenario
# Intersection Average Total Average TotalDelay Volume Delay Volume
LOS (sec) (vph) LOS (sec) (vph)Signalized C 30.2 3264 D 45.3 3578Signalized D 46.4 3022 F 113.9 4122
Unsignalized A 9.9 727 B 11.3 840Signalized D 38.4 1954 F 140.2 2831Signalized C 24.8 1063 C 25.0 1154Signalized C 21.1 1261 C 20.9 1370Signalized C 29.1 2098 C 32.8 2970
Unsignalized B 10.1 1635 B 11.0 2469Signalized C 28.2 2672 C 30.2 2804Signalized C 28.4 1845 C 31.3 2244
Unsignalized - - - - - -Unsignalized - - - - - -Unsignalized - - - - - -Signalized B 18.2 2536 B 15.5 2938Signalized A 8.5 2730 B 12.0 3150
Unsignalized F 505.0 3575 F 1969.0 3625Signalized E 57.3 3438 D 48.8 3779
All-Way Stop - - - - - -Unsignalized C 22.4 2729 F 380.2 3306Signalized E 57.6 4095 F 136.8 5884Signalized D 44.0 4666 D 38.5 5066Signalized D 41.6 3613 C 29.1 4053Signalized D 37.4 4277 C 20.3 4011Signalized C 20.9 3566 B 18.9 3750
Unsignalized F 377.3 2589 F 3159.0 3779Signalized F 120.7 4049 F 136.9 4368Signalized C 23.6 3185 D 42.3 4220Signalized B 17.1 2551 C 28.7 3580Signalized E 59.4 3787 F 137.2 4903Signalized B 18.9 2942 D 35.3 3464Signalized C 24.1 3016 C 30.6 3800Signalized B 16.2 2289 C 26.6 3633Signalized C 34.6 3551 D 49.3 5487Signalized E 59.6 4515 F 115.2 6959
All-Way Stop A 9.0 612 B 12.5 1013Signalized C 20.1 1966 C 21.8 2991
Control
2035 Build AAM Peak PM Peak
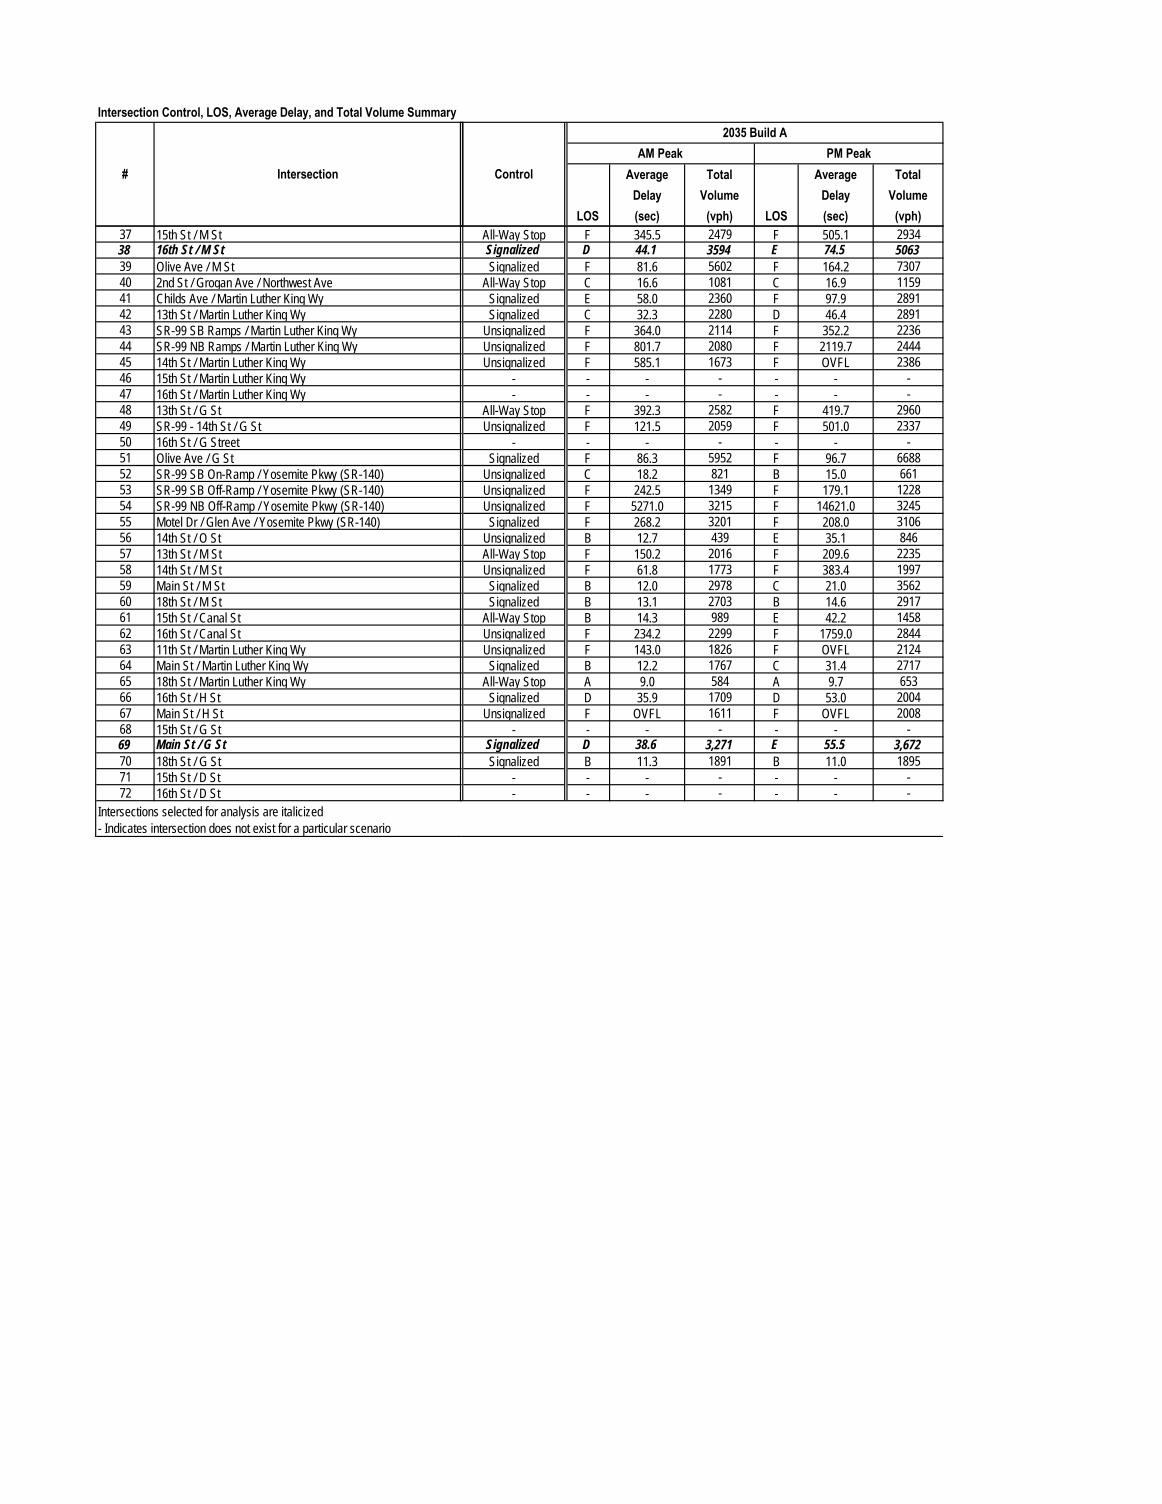
Intersection Control, LOS, Average Delay, and Total Volume Summary
# Intersection
37 15th St / M St 38 16th St / M St 39 Olive Ave / M St 40 2nd St / Grogan Ave / Northwest Ave 41 Childs Ave / Martin Luther King Wy 42 13th St / Martin Luther King Wy 43 SR-99 SB Ramps / Martin Luther King Wy 44 SR-99 NB Ramps / Martin Luther King Wy 45 14th St / Martin Luther King Wy 46 15th St / Martin Luther King Wy 47 16th St / Martin Luther King Wy 48 13th St / G St 49 SR-99 - 14th St / G St 50 16th St / G Street 51 Olive Ave / G St 52 SR-99 SB On-Ramp / Yosemite Pkwy (SR-140) 53 SR-99 SB Off-Ramp / Yosemite Pkwy (SR-140) 54 SR-99 NB Off-Ramp / Yosemite Pkwy (SR-140) 55 Motel Dr / Glen Ave / Yosemite Pkwy (SR-140)56 14th St / O St 57 13th St / M St 58 14th St / M St 59 Main St / M St 60 18th St / M St 61 15th St / Canal St 62 16th St / Canal St 63 11th St / Martin Luther King Wy 64 Main St / Martin Luther King Wy 65 18th St / Martin Luther King Wy 66 16th St / H St 67 Main St / H St 68 15th St / G St 69 Main St / G St 70 18th St / G St 71 15th St / D St 72 16th St / D St
Intersections selected for analysis are italicized- Indicates intersection does not exist for a particular scenario
Average Total Average TotalDelay Volume Delay Volume
LOS (sec) (vph) LOS (sec) (vph)
Control
2035 Build AAM Peak PM Peak
All-Way Stop F 345.5 2479 F 505.1 2934Signalized D 44.1 3594 E 74.5 5063Signalized F 81.6 5602 F 164.2 7307
All-Way Stop C 16.6 1081 C 16.9 1159Signalized E 58.0 2360 F 97.9 2891Signalized C 32.3 2280 D 46.4 2891
Unsignalized F 364.0 2114 F 352.2 2236Unsignalized F 801.7 2080 F 2119.7 2444Unsignalized F 585.1 1673 F OVFL 2386
- - - - - - -- - - - - - -
All-Way Stop F 392.3 2582 F 419.7 2960Unsignalized F 121.5 2059 F 501.0 2337
- - - - - - -Signalized F 86.3 5952 F 96.7 6688
Unsignalized C 18.2 821 B 15.0 661Unsignalized F 242.5 1349 F 179.1 1228Unsignalized F 5271.0 3215 F 14621.0 3245Signalized F 268.2 3201 F 208.0 3106
Unsignalized B 12.7 439 E 35.1 846All-Way Stop F 150.2 2016 F 209.6 2235Unsignalized F 61.8 1773 F 383.4 1997Signalized B 12.0 2978 C 21.0 3562Signalized B 13.1 2703 B 14.6 2917
All-Way Stop B 14.3 989 E 42.2 1458Unsignalized F 234.2 2299 F 1759.0 2844Unsignalized F 143.0 1826 F OVFL 2124Signalized B 12.2 1767 C 31.4 2717
All-Way Stop A 9.0 584 A 9.7 653Signalized D 35.9 1709 D 53.0 2004
Unsignalized F OVFL 1611 F OVFL 2008- - - - - - -
Signalized D 38.6 3,271 E 55.5 3,672Signalized B 11.3 1891 B 11.0 1895
- - - - - - -- - - - - - -
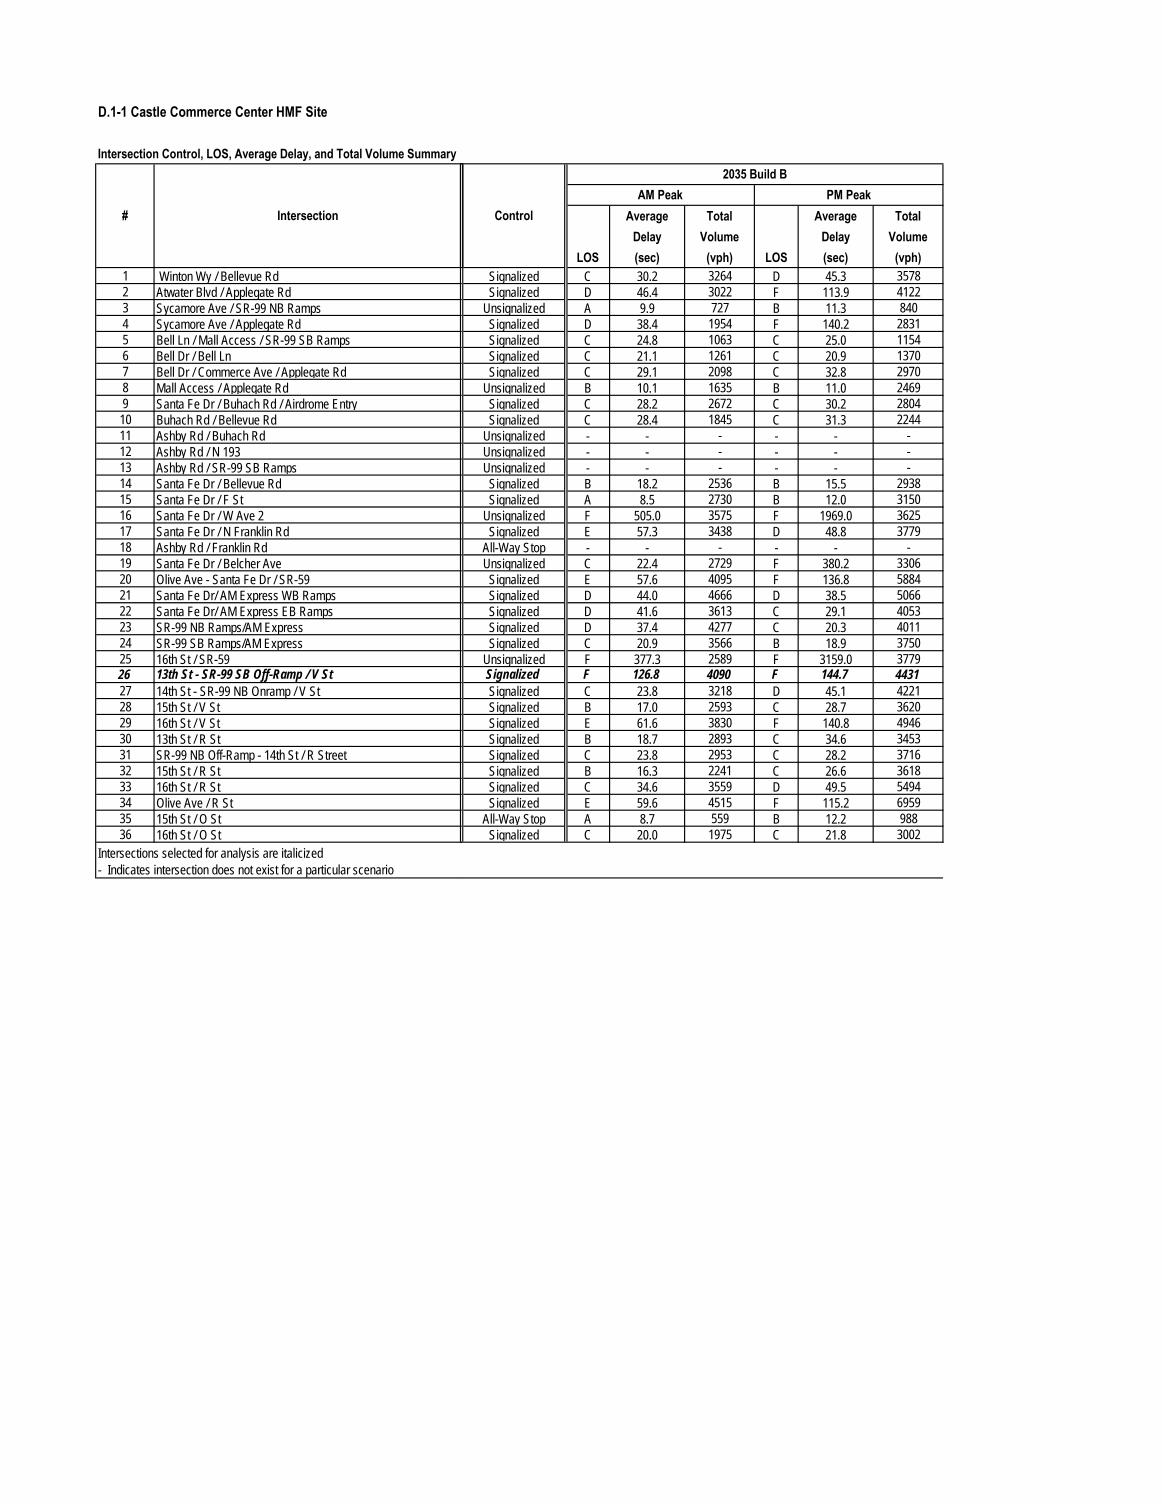
D.1-1 Castle Commerce Center HMF Site
Intersection Control, LOS, Average Delay, and Total Volume Summary
1 Winton Wy / Bellevue Rd2 Atwater Blvd / Applegate Rd3 Sycamore Ave / SR-99 NB Ramps4 Sycamore Ave / Applegate Rd5 Bell Ln / Mall Access / SR-99 SB Ramps6 Bell Dr / Bell Ln7 Bell Dr / Commerce Ave / Applegate Rd8 Mall Access / Applegate Rd9 Santa Fe Dr / Buhach Rd / Airdrome Entry10 Buhach Rd / Bellevue Rd 11 Ashby Rd / Buhach Rd12 Ashby Rd / N 19313 Ashby Rd / SR-99 SB Ramps14 Santa Fe Dr / Bellevue Rd15 Santa Fe Dr / F St16 Santa Fe Dr / W Ave 217 Santa Fe Dr / N Franklin Rd18 Ashby Rd / Franklin Rd19 Santa Fe Dr / Belcher Ave20 Olive Ave - Santa Fe Dr / SR-59 21 Santa Fe Dr/ AM Express WB Ramps22 Santa Fe Dr/ AM Express EB Ramps23 SR-99 NB Ramps/AM Express24 SR-99 SB Ramps/AM Express25 16th St / SR-59 26 13th St - SR-99 SB Off-Ramp / V St27 14th St - SR-99 NB Onramp / V St28 15th St / V St 29 16th St / V St 30 13th St / R St 31 SR-99 NB Off-Ramp - 14th St / R Street32 15th St / R St 33 16th St / R St 34 Olive Ave / R St 35 15th St / O St 36 16th St / O St
Intersections selected for analysis are italicized- Indicates intersection does not exist for a particular scenario
# Intersection Average Total Average TotalDelay Volume Delay Volume
LOS (sec) (vph) LOS (sec) (vph)Signalized C 30.2 3264 D 45.3 3578Signalized D 46.4 3022 F 113.9 4122
Unsignalized A 9.9 727 B 11.3 840Signalized D 38.4 1954 F 140.2 2831Signalized C 24.8 1063 C 25.0 1154Signalized C 21.1 1261 C 20.9 1370Signalized C 29.1 2098 C 32.8 2970
Unsignalized B 10.1 1635 B 11.0 2469Signalized C 28.2 2672 C 30.2 2804Signalized C 28.4 1845 C 31.3 2244
Unsignalized - - - - - -Unsignalized - - - - - -Unsignalized - - - - - -Signalized B 18.2 2536 B 15.5 2938Signalized A 8.5 2730 B 12.0 3150
Unsignalized F 505.0 3575 F 1969.0 3625Signalized E 57.3 3438 D 48.8 3779
All-Way Stop - - - - - -Unsignalized C 22.4 2729 F 380.2 3306Signalized E 57.6 4095 F 136.8 5884Signalized D 44.0 4666 D 38.5 5066Signalized D 41.6 3613 C 29.1 4053Signalized D 37.4 4277 C 20.3 4011Signalized C 20.9 3566 B 18.9 3750
Unsignalized F 377.3 2589 F 3159.0 3779Signalized F 126.8 4090 F 144.7 4431Signalized C 23.8 3218 D 45.1 4221Signalized B 17.0 2593 C 28.7 3620Signalized E 61.6 3830 F 140.8 4946Signalized B 18.7 2893 C 34.6 3453Signalized C 23.8 2953 C 28.2 3716Signalized B 16.3 2241 C 26.6 3618Signalized C 34.6 3559 D 49.5 5494Signalized E 59.6 4515 F 115.2 6959
All-Way Stop A 8.7 559 B 12.2 988Signalized C 20.0 1975 C 21.8 3002
2035 Build BAM Peak PM Peak
Control

Intersection Control, LOS, Average Delay, and Total Volume Summary
# Intersection
37 15th St / M St 38 16th St / M St 39 Olive Ave / M St 40 2nd St / Grogan Ave / Northwest Ave 41 Childs Ave / Martin Luther King Wy 42 13th St / Martin Luther King Wy 43 SR-99 SB Ramps / Martin Luther King Wy 44 SR-99 NB Ramps / Martin Luther King Wy 45 14th St / Martin Luther King Wy 46 15th St / Martin Luther King Wy 47 16th St / Martin Luther King Wy 48 13th St / G St 49 SR-99 - 14th St / G St 50 16th St / G Street 51 Olive Ave / G St 52 SR-99 SB On-Ramp / Yosemite Pkwy (SR-140) 53 SR-99 SB Off-Ramp / Yosemite Pkwy (SR-140) 54 SR-99 NB Off-Ramp / Yosemite Pkwy (SR-140) 55 Motel Dr / Glen Ave / Yosemite Pkwy (SR-140)56 14th St / O St 57 13th St / M St 58 14th St / M St 59 Main St / M St 60 18th St / M St 61 15th St / Canal St 62 16th St / Canal St 63 11th St / Martin Luther King Wy 64 Main St / Martin Luther King Wy 65 18th St / Martin Luther King Wy 66 16th St / H St 67 Main St / H St 68 15th St / G St 69 Main St / G St 70 18th St / G St 71 15th St / D St 72 16th St / D St
Intersections selected for analysis are italicized- Indicates intersection does not exist for a particular scenario
Average Total Average TotalDelay Volume Delay Volume
LOS (sec) (vph) LOS (sec) (vph)
2035 Build BAM Peak PM Peak
Control
All-Way Stop F 266.5 2269 F 479.9 2726Signalized D 43.7 3589 E 74.0 5060Signalized F 81.6 5602 F 164.2 7307
All-Way Stop C 17.5 1166 C 18.7 1244Signalized E 59.0 2366 F 100.2 2897Signalized C 32.2 2354 D 46.9 2958
Unsignalized F 277.5 2111 F 326.1 2288Unsignalized F 742.0 2005 F 3347.4 2438Unsignalized F 134.4 1576 F OVFL 2318
- - - - - - -- - - - - - -
All-Way Stop F 403.2 2609 F 425.3 2985Unsignalized F 116.2 2077 F 506.1 2356
- - - - - - -Signalized F 86.4 5952 F 96.7 6688
Unsignalized C 18.1 812 B 14.7 652Unsignalized F 235.1 1340 F 172.5 1219Unsignalized F 5203.0 3215 F 14424.0 3245Signalized F 268.2 3201 F 208.0 3106
Unsignalized B 12.4 419 C 23.9 761All-Way Stop F 147.9 2006 F 206.6 2228Unsignalized F 51.7 1641 F 115.4 1838Signalized B 12.0 2975 C 21.0 3559Signalized B 13.1 2705 B 14.6 2919
All-Way Stop B 10.4 770 C 18.9 1239Unsignalized F 233.1 2296 F 1740.0 2841Unsignalized F 298.8 1901 F OVFL 2202Signalized B 12.2 1765 C 31.2 2715
All-Way Stop A 9.0 586 A 9.8 655Signalized D 36.0 1706 D 53.6 2000
Unsignalized F OVFL 1614 F OVFL 2011- - - - - - -
Signalized D 39.8 3,289 E 56.7 3,689Signalized B 11.3 1892 B 11.1 1896
- - - - - - -- - - - - - -
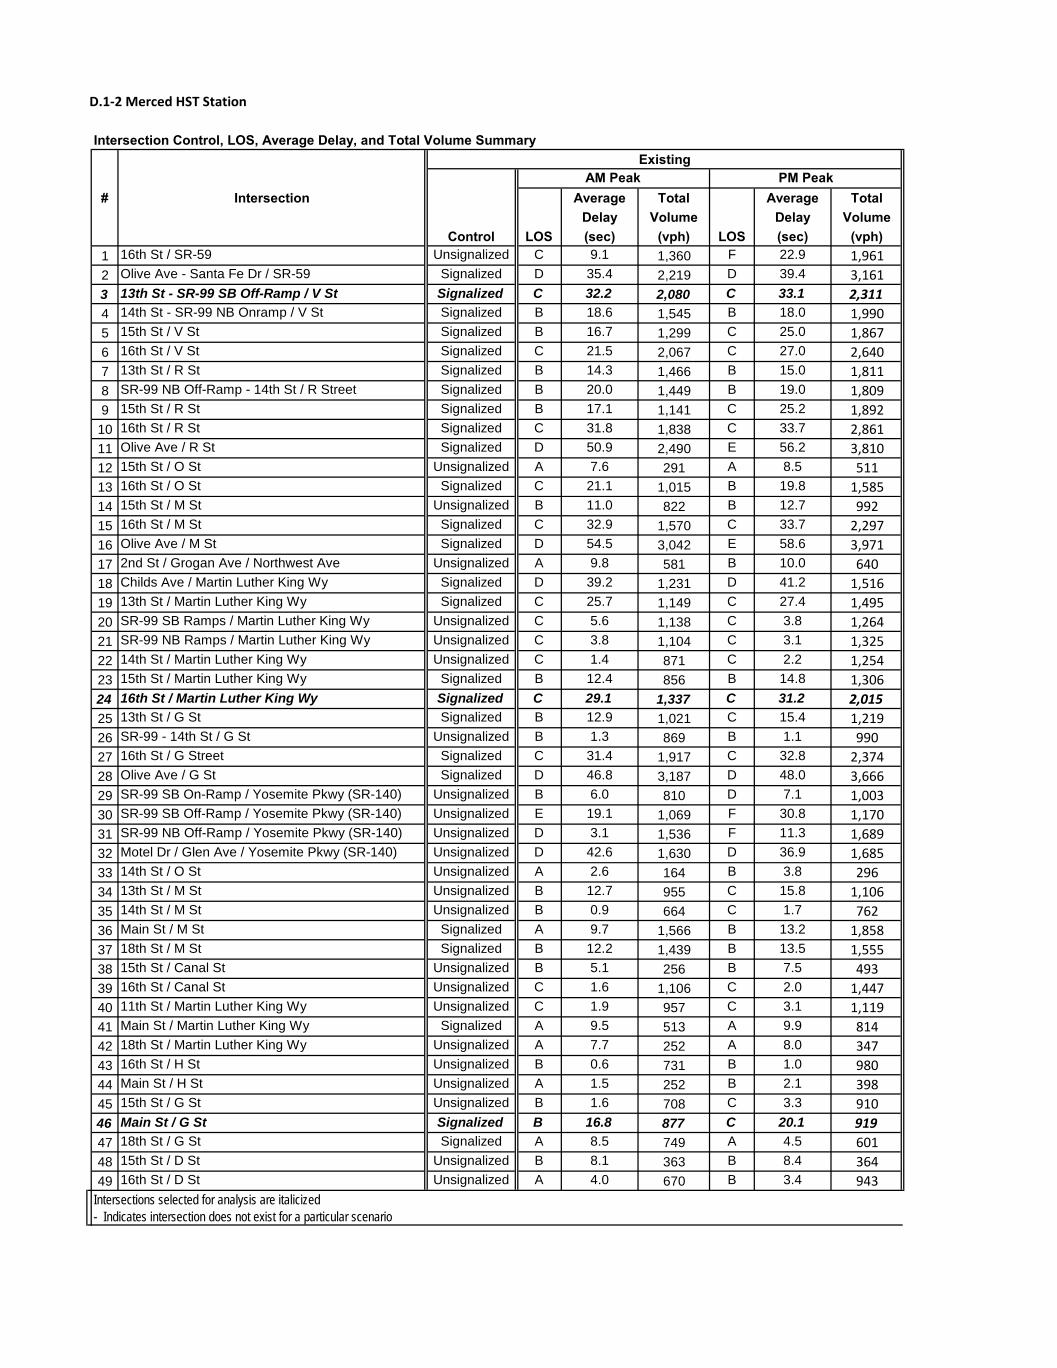
D.1-2 Merced HST Station
Intersection Control, LOS, Average Delay, and Total Volume Summary
# Intersection Average Total Average TotalDelay Volume Delay Volume
Control LOS (sec) (vph) LOS (sec) (vph)1 16th St / SR-59 Unsignalized C 9.1 1,360 F 22.9 1,9612 Olive Ave - Santa Fe Dr / SR-59 Signalized D 35.4 2,219 D 39.4 3,1613 13th St - SR-99 SB Off-Ramp / V St Signalized C 32.2 2,080 C 33.1 2,3114 14th St - SR-99 NB Onramp / V St Signalized B 18.6 1,545 B 18.0 1,9905 15th St / V St Signalized B 16.7 1,299 C 25.0 1,8676 16th St / V St Signalized C 21.5 2,067 C 27.0 2,6407 13th St / R St Signalized B 14.3 1,466 B 15.0 1,8118 SR-99 NB Off-Ramp - 14th St / R Street Signalized B 20.0 1,449 B 19.0 1,8099 15th St / R St Signalized B 17.1 1,141 C 25.2 1,892
10 16th St / R St Signalized C 31.8 1,838 C 33.7 2,86111 Olive Ave / R St Signalized D 50.9 2,490 E 56.2 3,81012 15th St / O St Unsignalized A 7.6 291 A 8.5 51113 16th St / O St Signalized C 21.1 1,015 B 19.8 1,58514 15th St / M St Unsignalized B 11.0 822 B 12.7 99215 16th St / M St Signalized C 32.9 1,570 C 33.7 2,29716 Olive Ave / M St Signalized D 54.5 3,042 E 58.6 3,97117 2nd St / Grogan Ave / Northwest Ave Unsignalized A 9.8 581 B 10.0 64018 Childs Ave / Martin Luther King Wy Signalized D 39.2 1,231 D 41.2 1,51619 13th St / Martin Luther King Wy Signalized C 25.7 1,149 C 27.4 1,49520 SR-99 SB Ramps / Martin Luther King Wy Unsignalized C 5.6 1,138 C 3.8 1,26421 SR-99 NB Ramps / Martin Luther King Wy Unsignalized C 3.8 1,104 C 3.1 1,32522 14th St / Martin Luther King Wy Unsignalized C 1.4 871 C 2.2 1,25423 15th St / Martin Luther King Wy Signalized B 12.4 856 B 14.8 1,30624 16th St / Martin Luther King Wy Signalized C 29.1 1,337 C 31.2 2,01525 13th St / G St Signalized B 12.9 1,021 C 15.4 1,21926 SR-99 - 14th St / G St Unsignalized B 1.3 869 B 1.1 99027 16th St / G Street Signalized C 31.4 1,917 C 32.8 2,37428 Olive Ave / G St Signalized D 46.8 3,187 D 48.0 3,66629 SR-99 SB On-Ramp / Yosemite Pkwy (SR-140) Unsignalized B 6.0 810 D 7.1 1,00330 SR-99 SB Off-Ramp / Yosemite Pkwy (SR-140) Unsignalized E 19.1 1,069 F 30.8 1,17031 SR-99 NB Off-Ramp / Yosemite Pkwy (SR-140) Unsignalized D 3.1 1,536 F 11.3 1,68932 Motel Dr / Glen Ave / Yosemite Pkwy (SR-140) Unsignalized D 42.6 1,630 D 36.9 1,68533 14th St / O St Unsignalized A 2.6 164 B 3.8 29634 13th St / M St Unsignalized B 12.7 955 C 15.8 1,10635 14th St / M St Unsignalized B 0.9 664 C 1.7 76236 Main St / M St Signalized A 9.7 1,566 B 13.2 1,85837 18th St / M St Signalized B 12.2 1,439 B 13.5 1,55538 15th St / Canal St Unsignalized B 5.1 256 B 7.5 49339 16th St / Canal St Unsignalized C 1.6 1,106 C 2.0 1,44740 11th St / Martin Luther King Wy Unsignalized C 1.9 957 C 3.1 1,11941 Main St / Martin Luther King Wy Signalized A 9.5 513 A 9.9 81442 18th St / Martin Luther King Wy Unsignalized A 7.7 252 A 8.0 34743 16th St / H St Unsignalized B 0.6 731 B 1.0 98044 Main St / H St Unsignalized A 1.5 252 B 2.1 39845 15th St / G St Unsignalized B 1.6 708 C 3.3 91046 Main St / G St Signalized B 16.8 877 C 20.1 91947 18th St / G St Signalized A 8.5 749 A 4.5 60148 15th St / D St Unsignalized B 8.1 363 B 8.4 36449 16th St / D St Unsignalized A 4.0 670 B 3.4 943
Existing
Intersections selected for analysis are italicized- Indicates intersection does not exist for a particular scenario
AM Peak PM Peak
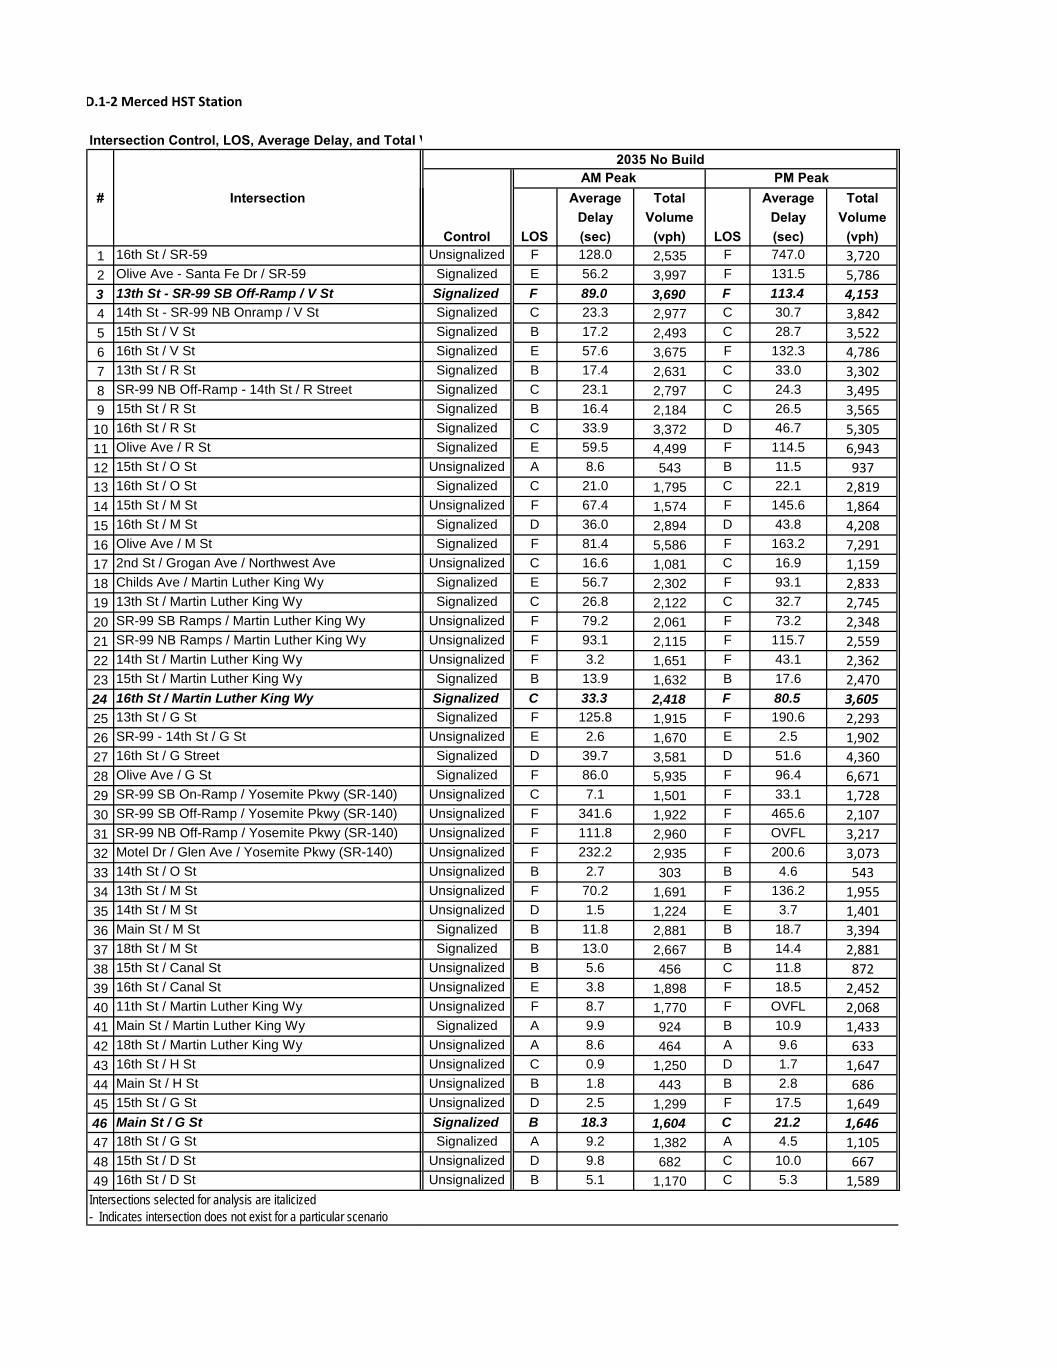
D.1-2 Merced HST Station
Intersection Control, LOS, Average Delay, and Total V
# Intersection
1 16th St / SR-59 2 Olive Ave - Santa Fe Dr / SR-59 3 13th St - SR-99 SB Off-Ramp / V St4 14th St - SR-99 NB Onramp / V St5 15th St / V St 6 16th St / V St 7 13th St / R St 8 SR-99 NB Off-Ramp - 14th St / R Street9 15th St / R St
10 16th St / R St 11 Olive Ave / R St 12 15th St / O St 13 16th St / O St 14 15th St / M St 15 16th St / M St 16 Olive Ave / M St 17 2nd St / Grogan Ave / Northwest Ave 18 Childs Ave / Martin Luther King Wy 19 13th St / Martin Luther King Wy 20 SR-99 SB Ramps / Martin Luther King Wy 21 SR-99 NB Ramps / Martin Luther King Wy 22 14th St / Martin Luther King Wy 23 15th St / Martin Luther King Wy 24 16th St / Martin Luther King Wy 25 13th St / G St 26 SR-99 - 14th St / G St 27 16th St / G Street 28 Olive Ave / G St 29 SR-99 SB On-Ramp / Yosemite Pkwy (SR-140) 30 SR-99 SB Off-Ramp / Yosemite Pkwy (SR-140) 31 SR-99 NB Off-Ramp / Yosemite Pkwy (SR-140) 32 Motel Dr / Glen Ave / Yosemite Pkwy (SR-140)33 14th St / O St 34 13th St / M St 35 14th St / M St 36 Main St / M St 37 18th St / M St 38 15th St / Canal St 39 16th St / Canal St 40 11th St / Martin Luther King Wy 41 Main St / Martin Luther King Wy 42 18th St / Martin Luther King Wy 43 16th St / H St 44 Main St / H St 45 15th St / G St 46 Main St / G St 47 18th St / G St 48 15th St / D St 49 16th St / D St
Intersections selected for analysis are italicized- Indicates intersection does not exist for a particular scenario
Average Total Average TotalDelay Volume Delay Volume
Control LOS (sec) (vph) LOS (sec) (vph)Unsignalized F 128.0 2,535 F 747.0 3,720
Signalized E 56.2 3,997 F 131.5 5,786Signalized F 89.0 3,690 F 113.4 4,153Signalized C 23.3 2,977 C 30.7 3,842Signalized B 17.2 2,493 C 28.7 3,522Signalized E 57.6 3,675 F 132.3 4,786Signalized B 17.4 2,631 C 33.0 3,302Signalized C 23.1 2,797 C 24.3 3,495Signalized B 16.4 2,184 C 26.5 3,565Signalized C 33.9 3,372 D 46.7 5,305Signalized E 59.5 4,499 F 114.5 6,943
Unsignalized A 8.6 543 B 11.5 937Signalized C 21.0 1,795 C 22.1 2,819
Unsignalized F 67.4 1,574 F 145.6 1,864Signalized D 36.0 2,894 D 43.8 4,208Signalized F 81.4 5,586 F 163.2 7,291
Unsignalized C 16.6 1,081 C 16.9 1,159Signalized E 56.7 2,302 F 93.1 2,833Signalized C 26.8 2,122 C 32.7 2,745
Unsignalized F 79.2 2,061 F 73.2 2,348Unsignalized F 93.1 2,115 F 115.7 2,559Unsignalized F 3.2 1,651 F 43.1 2,362
Signalized B 13.9 1,632 B 17.6 2,470Signalized C 33.3 2,418 F 80.5 3,605Signalized F 125.8 1,915 F 190.6 2,293
Unsignalized E 2.6 1,670 E 2.5 1,902Signalized D 39.7 3,581 D 51.6 4,360Signalized F 86.0 5,935 F 96.4 6,671
Unsignalized C 7.1 1,501 F 33.1 1,728Unsignalized F 341.6 1,922 F 465.6 2,107Unsignalized F 111.8 2,960 F OVFL 3,217Unsignalized F 232.2 2,935 F 200.6 3,073Unsignalized B 2.7 303 B 4.6 543Unsignalized F 70.2 1,691 F 136.2 1,955Unsignalized D 1.5 1,224 E 3.7 1,401
Signalized B 11.8 2,881 B 18.7 3,394Signalized B 13.0 2,667 B 14.4 2,881
Unsignalized B 5.6 456 C 11.8 872Unsignalized E 3.8 1,898 F 18.5 2,452Unsignalized F 8.7 1,770 F OVFL 2,068
Signalized A 9.9 924 B 10.9 1,433Unsignalized A 8.6 464 A 9.6 633Unsignalized C 0.9 1,250 D 1.7 1,647Unsignalized B 1.8 443 B 2.8 686Unsignalized D 2.5 1,299 F 17.5 1,649Signalized B 18.3 1,604 C 21.2 1,646Signalized A 9.2 1,382 A 4.5 1,105
Unsignalized D 9.8 682 C 10.0 667Unsignalized B 5.1 1,170 C 5.3 1,589
2035 No Build
AM Peak PM Peak

D.1-2 Merced HST Station
Intersection Control, LOS, Average Delay, and Total V
# Intersection
1 16th St / SR-59 2 Olive Ave - Santa Fe Dr / SR-59 3 13th St - SR-99 SB Off-Ramp / V St4 14th St - SR-99 NB Onramp / V St5 15th St / V St 6 16th St / V St 7 13th St / R St 8 SR-99 NB Off-Ramp - 14th St / R Street9 15th St / R St
10 16th St / R St 11 Olive Ave / R St 12 15th St / O St 13 16th St / O St 14 15th St / M St 15 16th St / M St 16 Olive Ave / M St 17 2nd St / Grogan Ave / Northwest Ave 18 Childs Ave / Martin Luther King Wy 19 13th St / Martin Luther King Wy 20 SR-99 SB Ramps / Martin Luther King Wy 21 SR-99 NB Ramps / Martin Luther King Wy 22 14th St / Martin Luther King Wy 23 15th St / Martin Luther King Wy 24 16th St / Martin Luther King Wy 25 13th St / G St 26 SR-99 - 14th St / G St 27 16th St / G Street 28 Olive Ave / G St 29 SR-99 SB On-Ramp / Yosemite Pkwy (SR-140) 30 SR-99 SB Off-Ramp / Yosemite Pkwy (SR-140) 31 SR-99 NB Off-Ramp / Yosemite Pkwy (SR-140) 32 Motel Dr / Glen Ave / Yosemite Pkwy (SR-140)33 14th St / O St 34 13th St / M St 35 14th St / M St 36 Main St / M St 37 18th St / M St 38 15th St / Canal St 39 16th St / Canal St 40 11th St / Martin Luther King Wy 41 Main St / Martin Luther King Wy 42 18th St / Martin Luther King Wy 43 16th St / H St 44 Main St / H St 45 15th St / G St 46 Main St / G St 47 18th St / G St 48 15th St / D St 49 16th St / D St
Intersections selected for analysis are italicized- Indicates intersection does not exist for a particular scenario
Average Total Average TotalDelay Volume Delay Volume
Control LOS (sec) (vph) LOS (sec) (vph)Unsignalized F 377.3 2,589 F 3159.0 3,779
Signalized E 56.7 4,022 F 132.8 5,811Signalized F 120.7 4,049 F 136.9 4,368Signalized C 23.6 3,185 D 42.3 4,220Signalized B 17.1 2,551 C 28.7 3,580Signalized E 59.4 3,787 F 137.2 4,903Signalized B 18.9 2,942 D 35.3 3,464Signalized C 24.1 3,016 C 30.6 3,800Signalized B 16.2 2,289 C 26.6 3,633Signalized C 34.6 3,551 D 49.3 5,487Signalized E 59.6 4,515 F 115.2 6,959
Unsignalized A 9.0 612 B 12.5 1,013Signalized C 20.1 1,966 C 21.8 2,991
Unsignalized F 251.2 2,195 F 340.5 2,483Signalized D 39.6 3,345 D 52.7 4,659Signalized F 81.6 5,602 F 164.2 7,307
Unsignalized C 16.6 1,081 C 16.9 1,159Signalized E 58.0 2,360 F 97.9 2,891Signalized C 28.6 2,280 D 37.1 2,891
Unsignalized F 496.0 2,272 F 601.3 2,487Unsignalized F 1069.8 2,238 F 6413.6 2,695Unsignalized F 376.0 1,847 F OVFL 2,614
Signalized B 12.5 1,606 B 16.0 2,374Signalized D 37.7 2,827 F 117.9 4,014Signalized F 392.3 2,582 F 419.7 2,960
Unsignalized F 121.5 2,059 F 501.0 2,337- - - - - - -
Signalized F 86.3 5,952 F 96.7 6,688Unsignalized C 18.2 821 B 15.0 661Unsignalized F 242.5 1,349 F 179.1 1,228Unsignalized F 5271.0 3,215 F 14621.0 3,245Unsignalized F 268.2 3,201 F 208.0 3,106Unsignalized B 12.7 439 E 35.1 846Unsignalized F 142.8 1,978 F 183.0 2,140Unsignalized F 55.7 1,735 F 196.0 1,902
Signalized B 11.8 2,921 B 19.1 3,434Signalized B 13.1 2,703 B 14.6 2,917
Unsignalized C 22.2 837 F OVFL 1,253Unsignalized F 265.2 2,307 F 2494.0 2,861Unsignalized F 143.0 1,826 F OVFL 2,124
Signalized A 9.9 928 B 10.9 1,437Unsignalized A 8.7 484 A 9.7 653Unsignalized D 35.9 1,709 D 50.1 2,242Unsignalized F OVFL 1,611 F OVFL 2,008
- - - - - - -Signalized D 38.6 3,271 E 55.5 3,672Signalized B 11.3 1,891 B 11.0 1,895
- - - - - - -- - - - - - -
2035 BuildAM Peak PM Peak
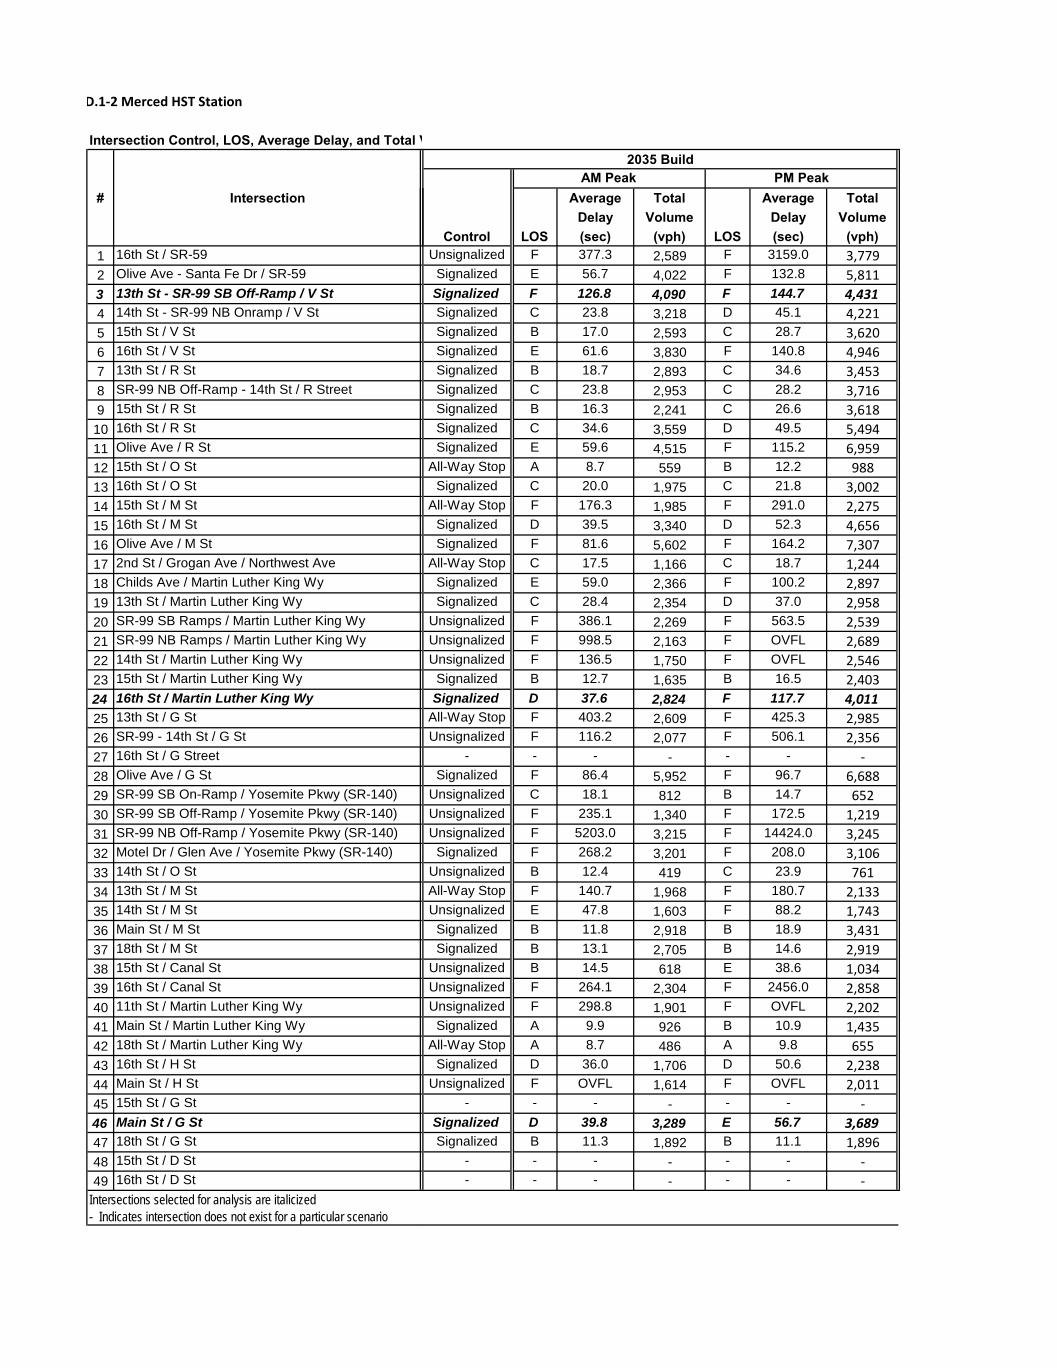
D.1-2 Merced HST Station
Intersection Control, LOS, Average Delay, and Total V
# Intersection
1 16th St / SR-59 2 Olive Ave - Santa Fe Dr / SR-59 3 13th St - SR-99 SB Off-Ramp / V St4 14th St - SR-99 NB Onramp / V St5 15th St / V St 6 16th St / V St 7 13th St / R St 8 SR-99 NB Off-Ramp - 14th St / R Street9 15th St / R St
10 16th St / R St 11 Olive Ave / R St 12 15th St / O St 13 16th St / O St 14 15th St / M St 15 16th St / M St 16 Olive Ave / M St 17 2nd St / Grogan Ave / Northwest Ave 18 Childs Ave / Martin Luther King Wy 19 13th St / Martin Luther King Wy 20 SR-99 SB Ramps / Martin Luther King Wy 21 SR-99 NB Ramps / Martin Luther King Wy 22 14th St / Martin Luther King Wy 23 15th St / Martin Luther King Wy 24 16th St / Martin Luther King Wy 25 13th St / G St 26 SR-99 - 14th St / G St 27 16th St / G Street 28 Olive Ave / G St 29 SR-99 SB On-Ramp / Yosemite Pkwy (SR-140) 30 SR-99 SB Off-Ramp / Yosemite Pkwy (SR-140) 31 SR-99 NB Off-Ramp / Yosemite Pkwy (SR-140) 32 Motel Dr / Glen Ave / Yosemite Pkwy (SR-140)33 14th St / O St 34 13th St / M St 35 14th St / M St 36 Main St / M St 37 18th St / M St 38 15th St / Canal St 39 16th St / Canal St 40 11th St / Martin Luther King Wy 41 Main St / Martin Luther King Wy 42 18th St / Martin Luther King Wy 43 16th St / H St 44 Main St / H St 45 15th St / G St 46 Main St / G St 47 18th St / G St 48 15th St / D St 49 16th St / D St
Intersections selected for analysis are italicized- Indicates intersection does not exist for a particular scenario
Average Total Average TotalDelay Volume Delay Volume
Control LOS (sec) (vph) LOS (sec) (vph)Unsignalized F 377.3 2,589 F 3159.0 3,779
Signalized E 56.7 4,022 F 132.8 5,811Signalized F 126.8 4,090 F 144.7 4,431Signalized C 23.8 3,218 D 45.1 4,221Signalized B 17.0 2,593 C 28.7 3,620Signalized E 61.6 3,830 F 140.8 4,946Signalized B 18.7 2,893 C 34.6 3,453Signalized C 23.8 2,953 C 28.2 3,716Signalized B 16.3 2,241 C 26.6 3,618Signalized C 34.6 3,559 D 49.5 5,494Signalized E 59.6 4,515 F 115.2 6,959
All-Way Stop A 8.7 559 B 12.2 988Signalized C 20.0 1,975 C 21.8 3,002
All-Way Stop F 176.3 1,985 F 291.0 2,275Signalized D 39.5 3,340 D 52.3 4,656Signalized F 81.6 5,602 F 164.2 7,307
All-Way Stop C 17.5 1,166 C 18.7 1,244Signalized E 59.0 2,366 F 100.2 2,897Signalized C 28.4 2,354 D 37.0 2,958
Unsignalized F 386.1 2,269 F 563.5 2,539Unsignalized F 998.5 2,163 F OVFL 2,689Unsignalized F 136.5 1,750 F OVFL 2,546
Signalized B 12.7 1,635 B 16.5 2,403Signalized D 37.6 2,824 F 117.7 4,011
All-Way Stop F 403.2 2,609 F 425.3 2,985Unsignalized F 116.2 2,077 F 506.1 2,356
- - - - - - -Signalized F 86.4 5,952 F 96.7 6,688
Unsignalized C 18.1 812 B 14.7 652Unsignalized F 235.1 1,340 F 172.5 1,219Unsignalized F 5203.0 3,215 F 14424.0 3,245
Signalized F 268.2 3,201 F 208.0 3,106Unsignalized B 12.4 419 C 23.9 761All-Way Stop F 140.7 1,968 F 180.7 2,133Unsignalized E 47.8 1,603 F 88.2 1,743
Signalized B 11.8 2,918 B 18.9 3,431Signalized B 13.1 2,705 B 14.6 2,919
Unsignalized B 14.5 618 E 38.6 1,034Unsignalized F 264.1 2,304 F 2456.0 2,858Unsignalized F 298.8 1,901 F OVFL 2,202
Signalized A 9.9 926 B 10.9 1,435All-Way Stop A 8.7 486 A 9.8 655
Signalized D 36.0 1,706 D 50.6 2,238Unsignalized F OVFL 1,614 F OVFL 2,011
- - - - - - -Signalized D 39.8 3,289 E 56.7 3,689Signalized B 11.3 1,892 B 11.1 1,896
- - - - - - -- - - - - - -
2035 BuildAM Peak PM Peak
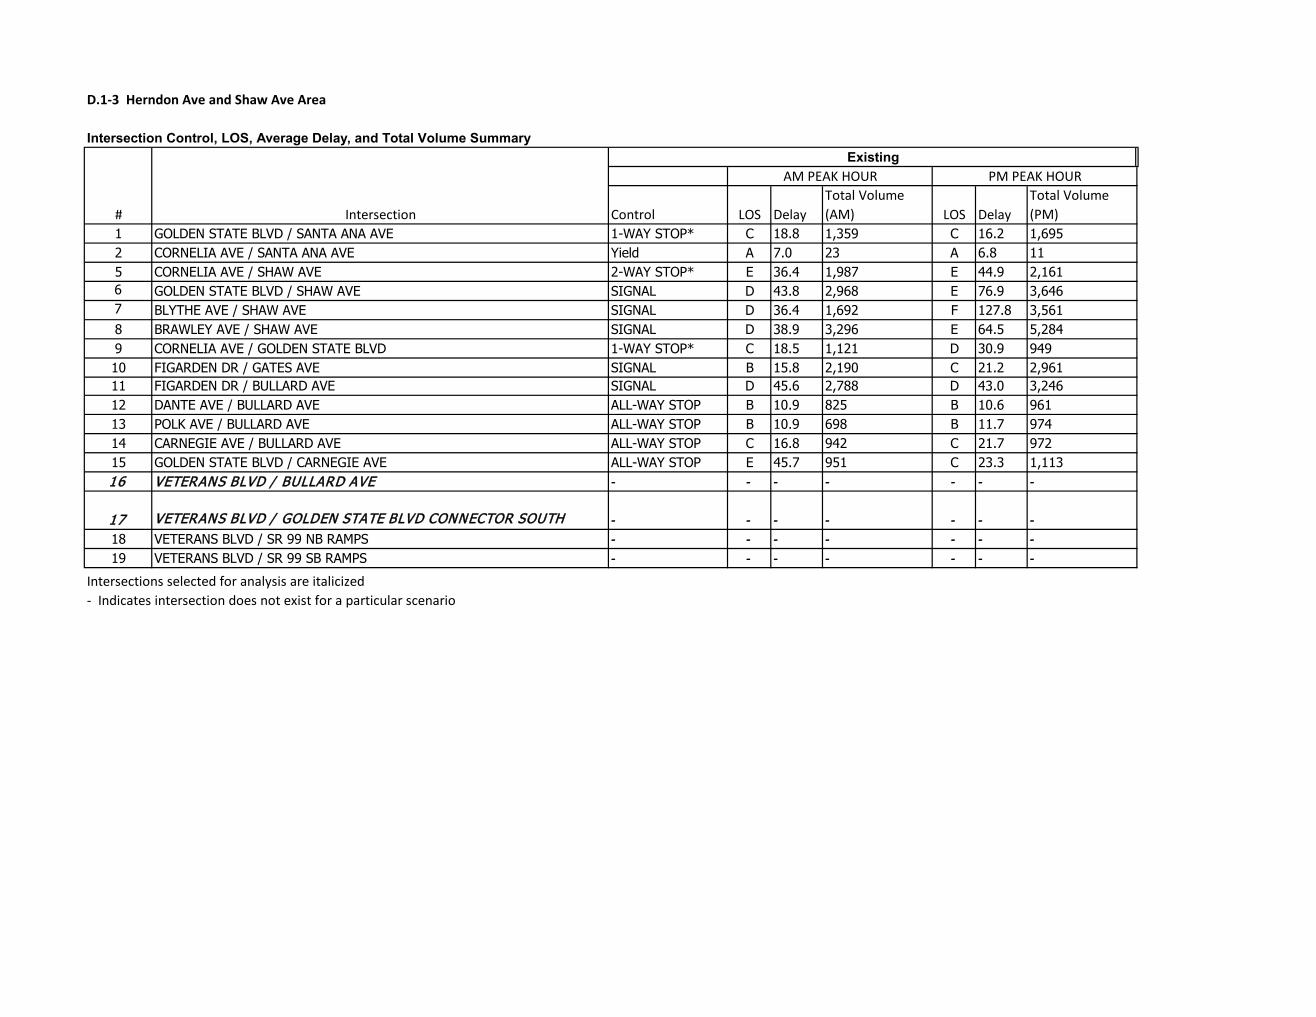
D.1-3 Herndon Ave and Shaw Ave Area
Intersection Control, LOS, Average Delay, and Total Volume Summary
Control LOS DelayTotal Volume (AM) LOS Delay
Total Volume (PM)
1 GOLDEN STATE BLVD / SANTA ANA AVE 1-WAY STOP* C 18.8 1,359 C 16.2 1,6952 CORNELIA AVE / SANTA ANA AVE Yield A 7.0 23 A 6.8 115 CORNELIA AVE / SHAW AVE 2-WAY STOP* E 36.4 1,987 E 44.9 2,1616 GOLDEN STATE BLVD / SHAW AVE SIGNAL D 43.8 2,968 E 76.9 3,6467 BLYTHE AVE / SHAW AVE SIGNAL D 36.4 1,692 F 127.8 3,5618 BRAWLEY AVE / SHAW AVE SIGNAL D 38.9 3,296 E 64.5 5,2849 CORNELIA AVE / GOLDEN STATE BLVD 1-WAY STOP* C 18.5 1,121 D 30.9 94910 FIGARDEN DR / GATES AVE SIGNAL B 15.8 2,190 C 21.2 2,96111 FIGARDEN DR / BULLARD AVE SIGNAL D 45.6 2,788 D 43.0 3,24612 DANTE AVE / BULLARD AVE ALL-WAY STOP B 10.9 825 B 10.6 96113 POLK AVE / BULLARD AVE ALL-WAY STOP B 10.9 698 B 11.7 97414 CARNEGIE AVE / BULLARD AVE ALL-WAY STOP C 16.8 942 C 21.7 97215 GOLDEN STATE BLVD / CARNEGIE AVE ALL-WAY STOP E 45.7 951 C 23.3 1,11316 VETERANS BLVD / BULLARD AVE - - - - - - -
17 VETERANS BLVD / GOLDEN STATE BLVD CONNECTOR SOUTH - - - - - - -18 VETERANS BLVD / SR 99 NB RAMPS - - - - - - -19 VETERANS BLVD / SR 99 SB RAMPS - - - - - - -
Intersections selected for analysis are italicized- Indicates intersection does not exist for a particular scenario
# Intersection
AM PEAK HOUR PM PEAK HOURExisting
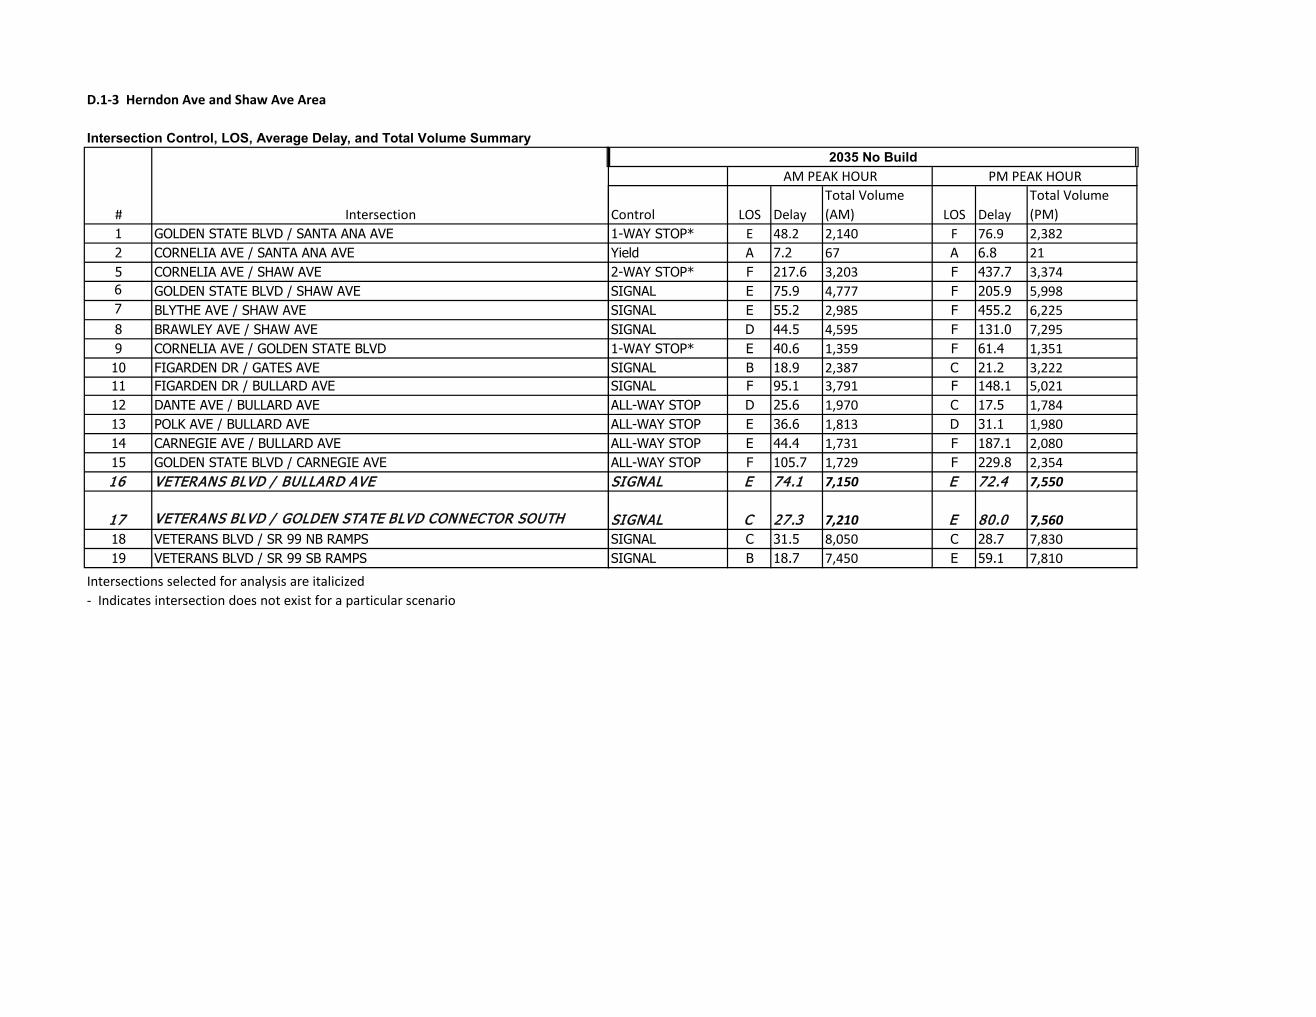
D.1-3 Herndon Ave and Shaw Ave Area
Intersection Control, LOS, Average Delay, and Total Volume Summary
1 GOLDEN STATE BLVD / SANTA ANA AVE2 CORNELIA AVE / SANTA ANA AVE5 CORNELIA AVE / SHAW AVE6 GOLDEN STATE BLVD / SHAW AVE7 BLYTHE AVE / SHAW AVE8 BRAWLEY AVE / SHAW AVE9 CORNELIA AVE / GOLDEN STATE BLVD10 FIGARDEN DR / GATES AVE11 FIGARDEN DR / BULLARD AVE12 DANTE AVE / BULLARD AVE13 POLK AVE / BULLARD AVE14 CARNEGIE AVE / BULLARD AVE15 GOLDEN STATE BLVD / CARNEGIE AVE16 VETERANS BLVD / BULLARD AVE
17 VETERANS BLVD / GOLDEN STATE BLVD CONNECTOR SOUTH18 VETERANS BLVD / SR 99 NB RAMPS19 VETERANS BLVD / SR 99 SB RAMPS
Intersections selected for analysis are italicized- Indicates intersection does not exist for a particular scenario
# Intersection Control LOS DelayTotal Volume (AM) LOS Delay
Total Volume (PM)
1-WAY STOP* E 48.2 2,140 F 76.9 2,382Yield A 7.2 67 A 6.8 212-WAY STOP* F 217.6 3,203 F 437.7 3,374SIGNAL E 75.9 4,777 F 205.9 5,998SIGNAL E 55.2 2,985 F 455.2 6,225SIGNAL D 44.5 4,595 F 131.0 7,2951-WAY STOP* E 40.6 1,359 F 61.4 1,351SIGNAL B 18.9 2,387 C 21.2 3,222SIGNAL F 95.1 3,791 F 148.1 5,021ALL-WAY STOP D 25.6 1,970 C 17.5 1,784ALL-WAY STOP E 36.6 1,813 D 31.1 1,980ALL-WAY STOP E 44.4 1,731 F 187.1 2,080ALL-WAY STOP F 105.7 1,729 F 229.8 2,354SIGNAL E 74.1 7,150 E 72.4 7,550
SIGNAL C 27.3 7,210 E 80.0 7,560SIGNAL C 31.5 8,050 C 28.7 7,830SIGNAL B 18.7 7,450 E 59.1 7,810
AM PEAK HOUR PM PEAK HOUR2035 No Build
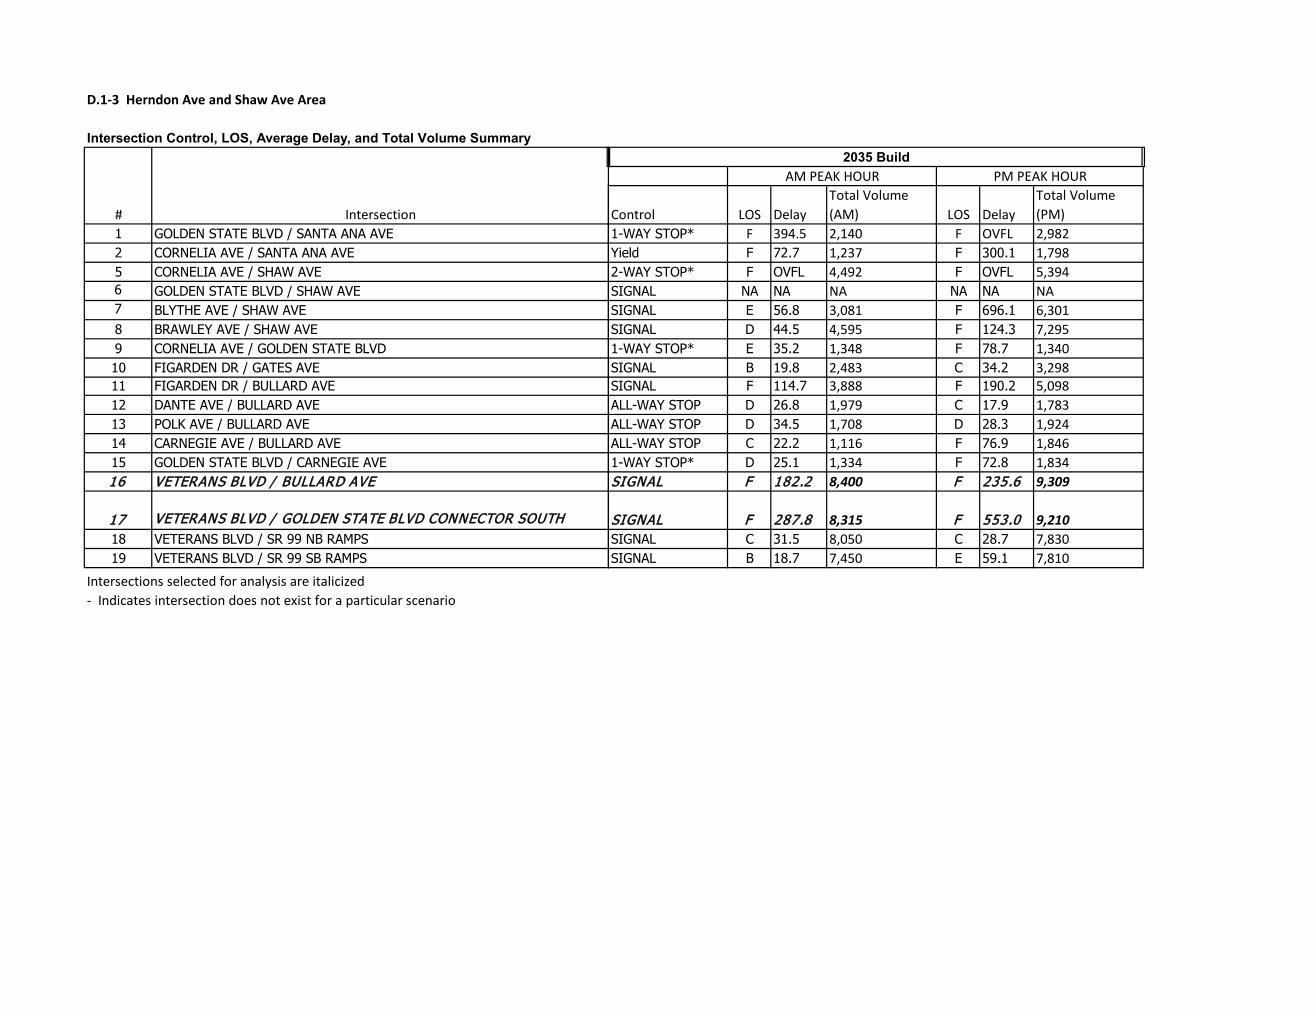
D.1-3 Herndon Ave and Shaw Ave Area
Intersection Control, LOS, Average Delay, and Total Volume Summary
1 GOLDEN STATE BLVD / SANTA ANA AVE2 CORNELIA AVE / SANTA ANA AVE5 CORNELIA AVE / SHAW AVE6 GOLDEN STATE BLVD / SHAW AVE7 BLYTHE AVE / SHAW AVE8 BRAWLEY AVE / SHAW AVE9 CORNELIA AVE / GOLDEN STATE BLVD10 FIGARDEN DR / GATES AVE11 FIGARDEN DR / BULLARD AVE12 DANTE AVE / BULLARD AVE13 POLK AVE / BULLARD AVE14 CARNEGIE AVE / BULLARD AVE15 GOLDEN STATE BLVD / CARNEGIE AVE16 VETERANS BLVD / BULLARD AVE
17 VETERANS BLVD / GOLDEN STATE BLVD CONNECTOR SOUTH18 VETERANS BLVD / SR 99 NB RAMPS19 VETERANS BLVD / SR 99 SB RAMPS
Intersections selected for analysis are italicized- Indicates intersection does not exist for a particular scenario
# Intersection Control LOS DelayTotal Volume (AM) LOS Delay
Total Volume (PM)
1-WAY STOP* F 394.5 2,140 F OVFL 2,982Yield F 72.7 1,237 F 300.1 1,7982-WAY STOP* F OVFL 4,492 F OVFL 5,394SIGNAL NA NA NA NA NA NASIGNAL E 56.8 3,081 F 696.1 6,301SIGNAL D 44.5 4,595 F 124.3 7,2951-WAY STOP* E 35.2 1,348 F 78.7 1,340SIGNAL B 19.8 2,483 C 34.2 3,298SIGNAL F 114.7 3,888 F 190.2 5,098ALL-WAY STOP D 26.8 1,979 C 17.9 1,783ALL-WAY STOP D 34.5 1,708 D 28.3 1,924ALL-WAY STOP C 22.2 1,116 F 76.9 1,8461-WAY STOP* D 25.1 1,334 F 72.8 1,834SIGNAL F 182.2 8,400 F 235.6 9,309
SIGNAL F 287.8 8,315 F 553.0 9,210SIGNAL C 31.5 8,050 C 28.7 7,830SIGNAL B 18.7 7,450 E 59.1 7,810
2035 BuildAM PEAK HOUR PM PEAK HOUR
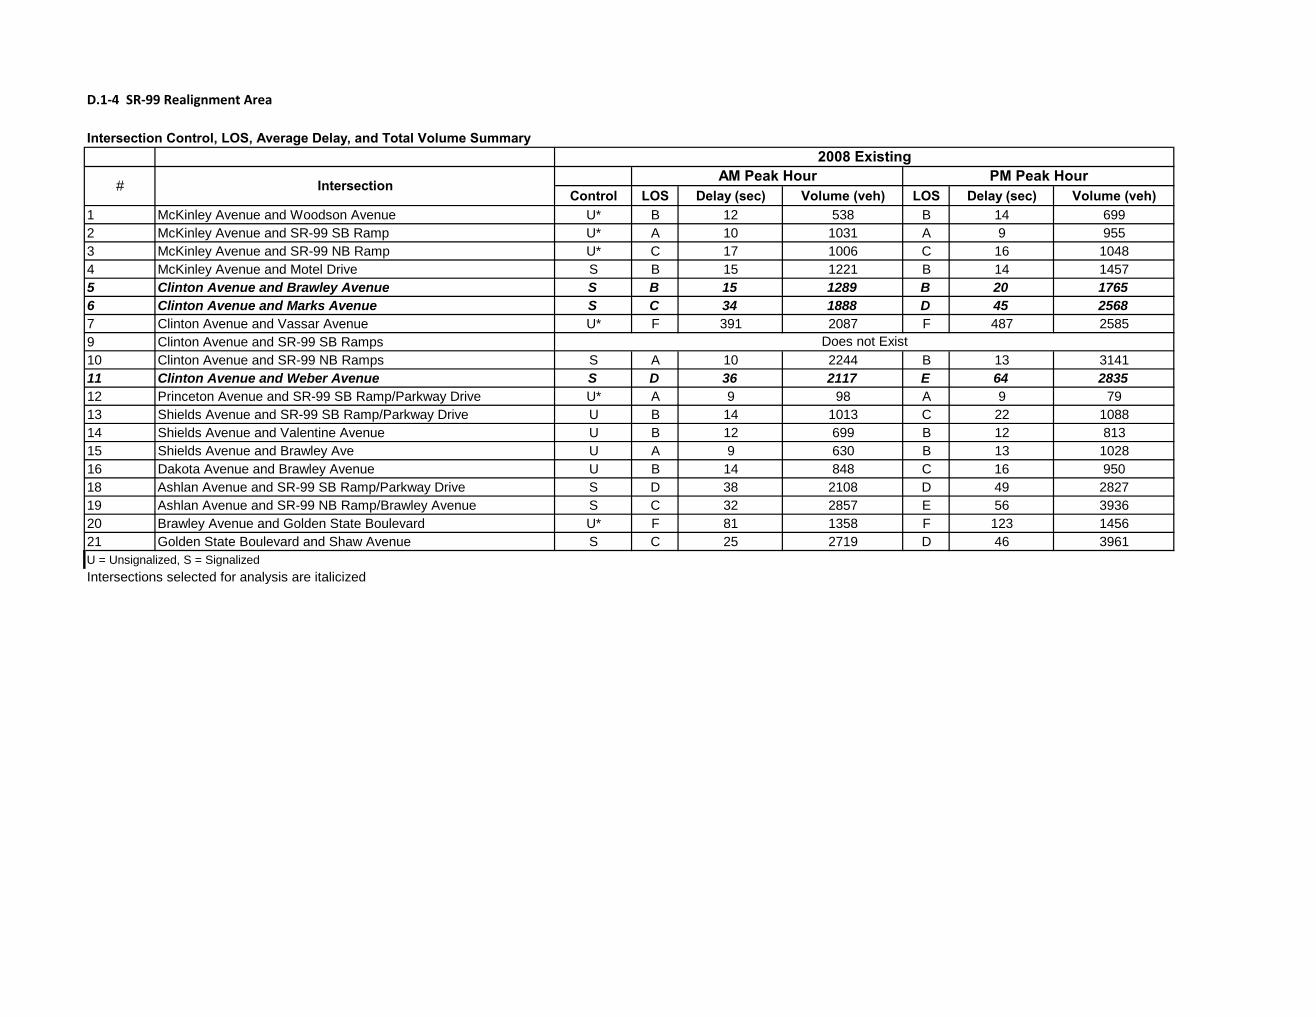
D.1-4 SR-99 Realignment Area
Intersection Control, LOS, Average Delay, and Total Volume Summary
Control LOS Delay (sec) Volume (veh) LOS Delay (sec) Volume (veh)1 McKinley Avenue and Woodson Avenue U* B 12 538 B 14 6992 McKinley Avenue and SR-99 SB Ramp U* A 10 1031 A 9 9553 McKinley Avenue and SR-99 NB Ramp U* C 17 1006 C 16 10484 McKinley Avenue and Motel Drive S B 15 1221 B 14 14575 Clinton Avenue and Brawley Avenue S B 15 1289 B 20 17656 Clinton Avenue and Marks Avenue S C 34 1888 D 45 25687 Clinton Avenue and Vassar Avenue U* F 391 2087 F 487 25859 Clinton Avenue and SR-99 SB Ramps10 Clinton Avenue and SR-99 NB Ramps S A 10 2244 B 13 314111 Clinton Avenue and Weber Avenue S D 36 2117 E 64 283512 Princeton Avenue and SR-99 SB Ramp/Parkway Drive U* A 9 98 A 9 7913 Shields Avenue and SR-99 SB Ramp/Parkway Drive U B 14 1013 C 22 108814 Shields Avenue and Valentine Avenue U B 12 699 B 12 81315 Shields Avenue and Brawley Ave U A 9 630 B 13 102816 Dakota Avenue and Brawley Avenue U B 14 848 C 16 95018 Ashlan Avenue and SR-99 SB Ramp/Parkway Drive S D 38 2108 D 49 282719 Ashlan Avenue and SR-99 NB Ramp/Brawley Avenue S C 32 2857 E 56 393620 Brawley Avenue and Golden State Boulevard U* F 81 1358 F 123 145621 Golden State Boulevard and Shaw Avenue S C 25 2719 D 46 3961U = Unsignalized, S = SignalizedIntersections selected for analysis are italicized
Does not Exist
# Intersection
2008 ExistingAM Peak Hour PM Peak Hour
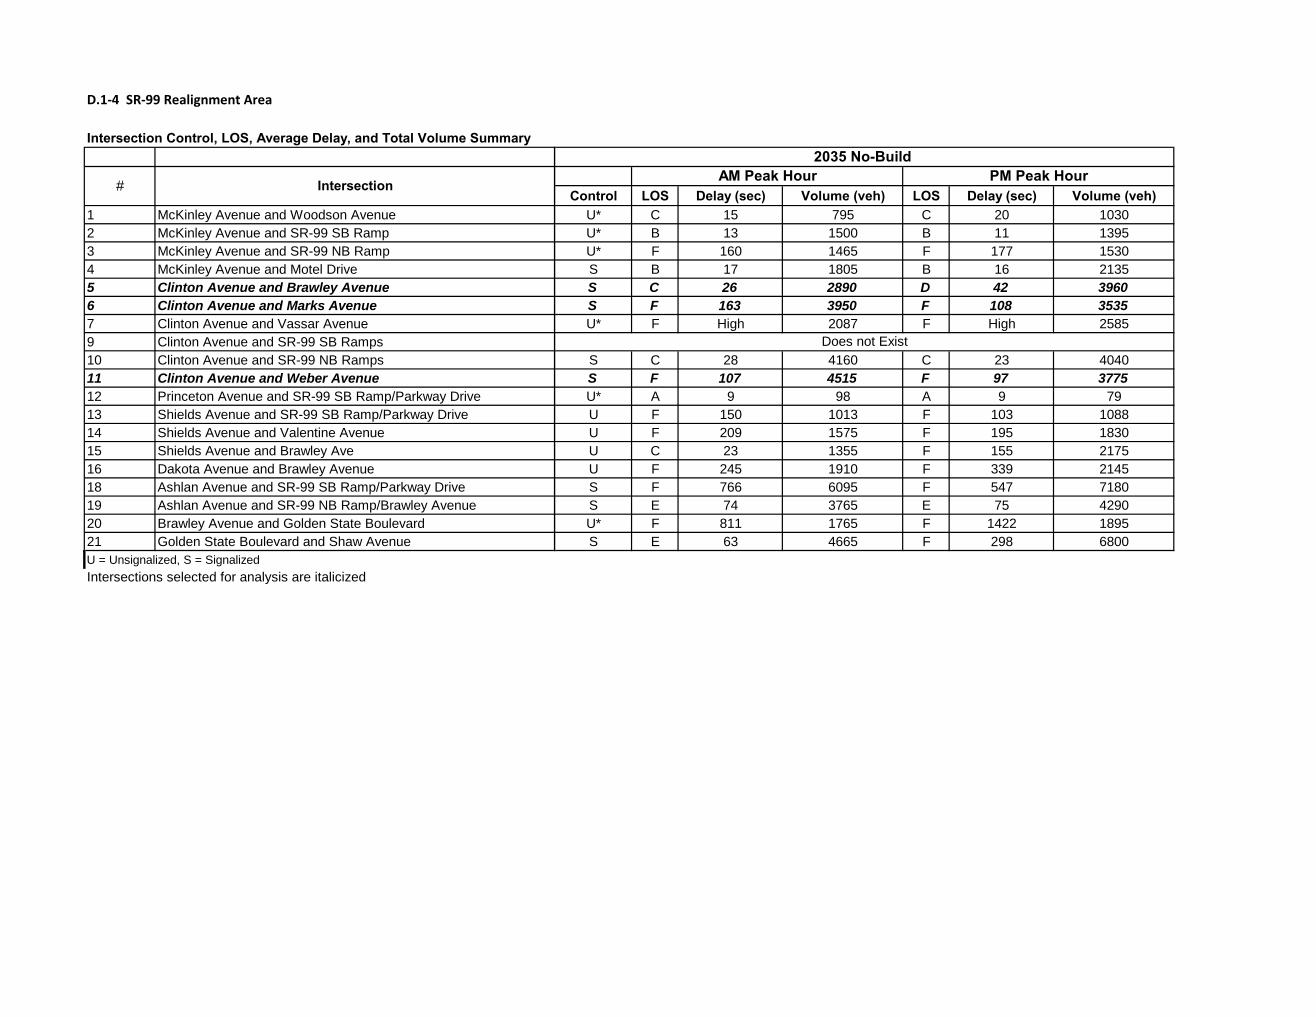
D.1-4 SR-99 Realignment Area
Intersection Control, LOS, Average Delay, and Total Volume Summary
1 McKinley Avenue and Woodson Avenue2 McKinley Avenue and SR-99 SB Ramp3 McKinley Avenue and SR-99 NB Ramp4 McKinley Avenue and Motel Drive5 Clinton Avenue and Brawley Avenue6 Clinton Avenue and Marks Avenue7 Clinton Avenue and Vassar Avenue9 Clinton Avenue and SR-99 SB Ramps10 Clinton Avenue and SR-99 NB Ramps11 Clinton Avenue and Weber Avenue12 Princeton Avenue and SR-99 SB Ramp/Parkway Drive13 Shields Avenue and SR-99 SB Ramp/Parkway Drive14 Shields Avenue and Valentine Avenue15 Shields Avenue and Brawley Ave16 Dakota Avenue and Brawley Avenue18 Ashlan Avenue and SR-99 SB Ramp/Parkway Drive19 Ashlan Avenue and SR-99 NB Ramp/Brawley Avenue20 Brawley Avenue and Golden State Boulevard21 Golden State Boulevard and Shaw AvenueU = Unsignalized, S = SignalizedIntersections selected for analysis are italicized
# IntersectionControl LOS Delay (sec) Volume (veh) LOS Delay (sec) Volume (veh)
U* C 15 795 C 20 1030U* B 13 1500 B 11 1395U* F 160 1465 F 177 1530S B 17 1805 B 16 2135S C 26 2890 D 42 3960S F 163 3950 F 108 3535U* F High 2087 F High 2585
S C 28 4160 C 23 4040S F 107 4515 F 97 3775U* A 9 98 A 9 79U F 150 1013 F 103 1088U F 209 1575 F 195 1830U C 23 1355 F 155 2175U F 245 1910 F 339 2145S F 766 6095 F 547 7180S E 74 3765 E 75 4290U* F 811 1765 F 1422 1895S E 63 4665 F 298 6800
2035 No-Build
Does not Exist
AM Peak Hour PM Peak Hour
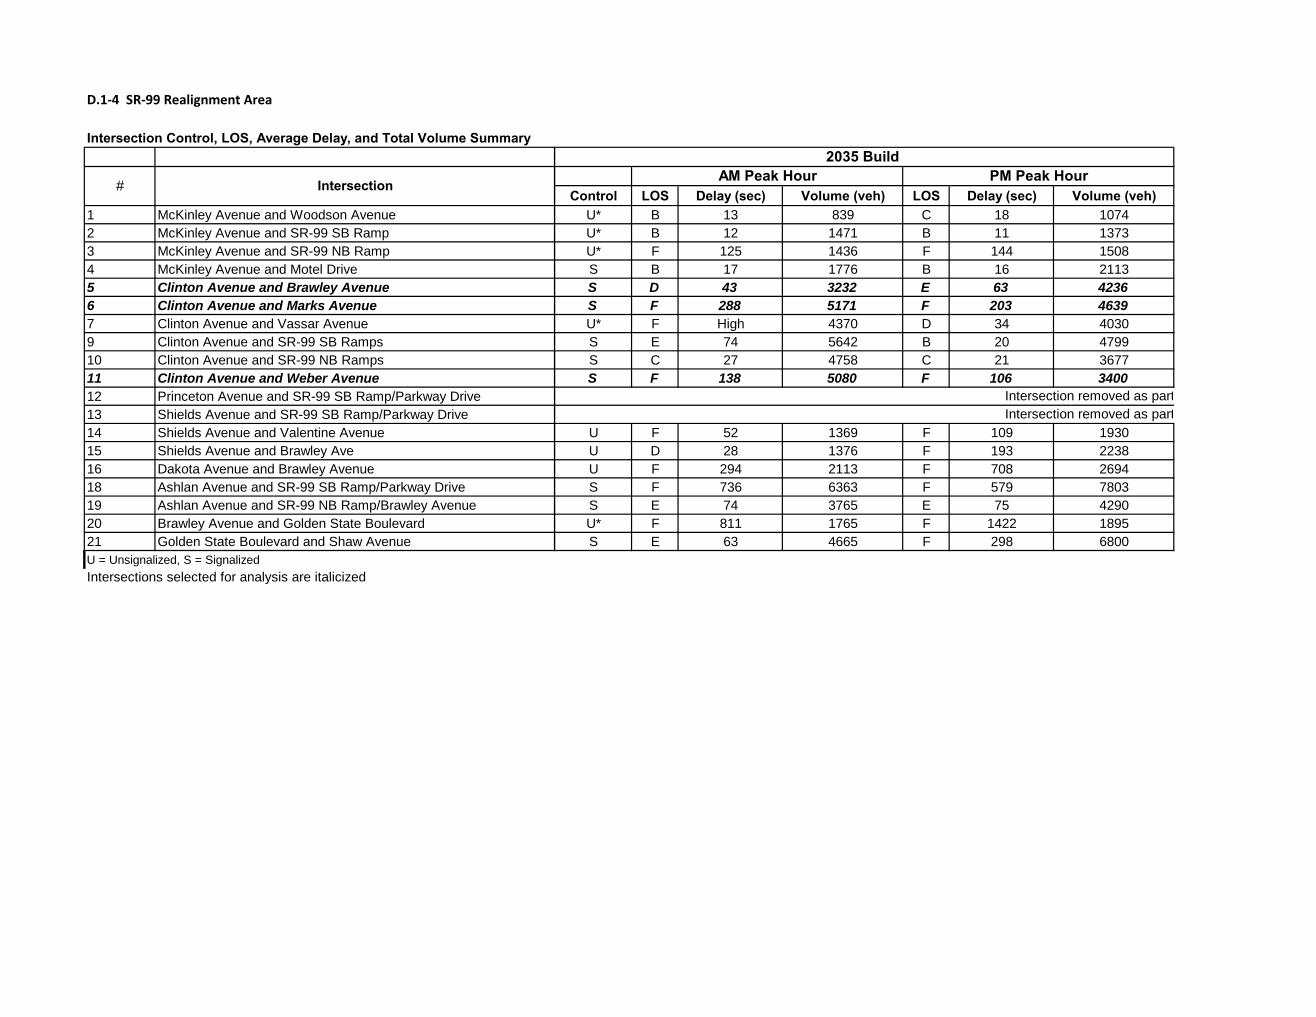
D.1-4 SR-99 Realignment Area
Intersection Control, LOS, Average Delay, and Total Volume Summary
1 McKinley Avenue and Woodson Avenue2 McKinley Avenue and SR-99 SB Ramp3 McKinley Avenue and SR-99 NB Ramp4 McKinley Avenue and Motel Drive5 Clinton Avenue and Brawley Avenue6 Clinton Avenue and Marks Avenue7 Clinton Avenue and Vassar Avenue9 Clinton Avenue and SR-99 SB Ramps10 Clinton Avenue and SR-99 NB Ramps11 Clinton Avenue and Weber Avenue12 Princeton Avenue and SR-99 SB Ramp/Parkway Drive13 Shields Avenue and SR-99 SB Ramp/Parkway Drive14 Shields Avenue and Valentine Avenue15 Shields Avenue and Brawley Ave16 Dakota Avenue and Brawley Avenue18 Ashlan Avenue and SR-99 SB Ramp/Parkway Drive19 Ashlan Avenue and SR-99 NB Ramp/Brawley Avenue20 Brawley Avenue and Golden State Boulevard21 Golden State Boulevard and Shaw AvenueU = Unsignalized, S = SignalizedIntersections selected for analysis are italicized
# IntersectionControl LOS Delay (sec) Volume (veh) LOS Delay (sec) Volume (veh)
U* B 13 839 C 18 1074U* B 12 1471 B 11 1373U* F 125 1436 F 144 1508S B 17 1776 B 16 2113S D 43 3232 E 63 4236S F 288 5171 F 203 4639U* F High 4370 D 34 4030S E 74 5642 B 20 4799S C 27 4758 C 21 3677S F 138 5080 F 106 3400
U F 52 1369 F 109 1930U D 28 1376 F 193 2238U F 294 2113 F 708 2694S F 736 6363 F 579 7803S E 74 3765 E 75 4290U* F 811 1765 F 1422 1895S E 63 4665 F 298 6800
Intersection removed as part Intersection removed as part
AM Peak Hour PM Peak Hour2035 Build
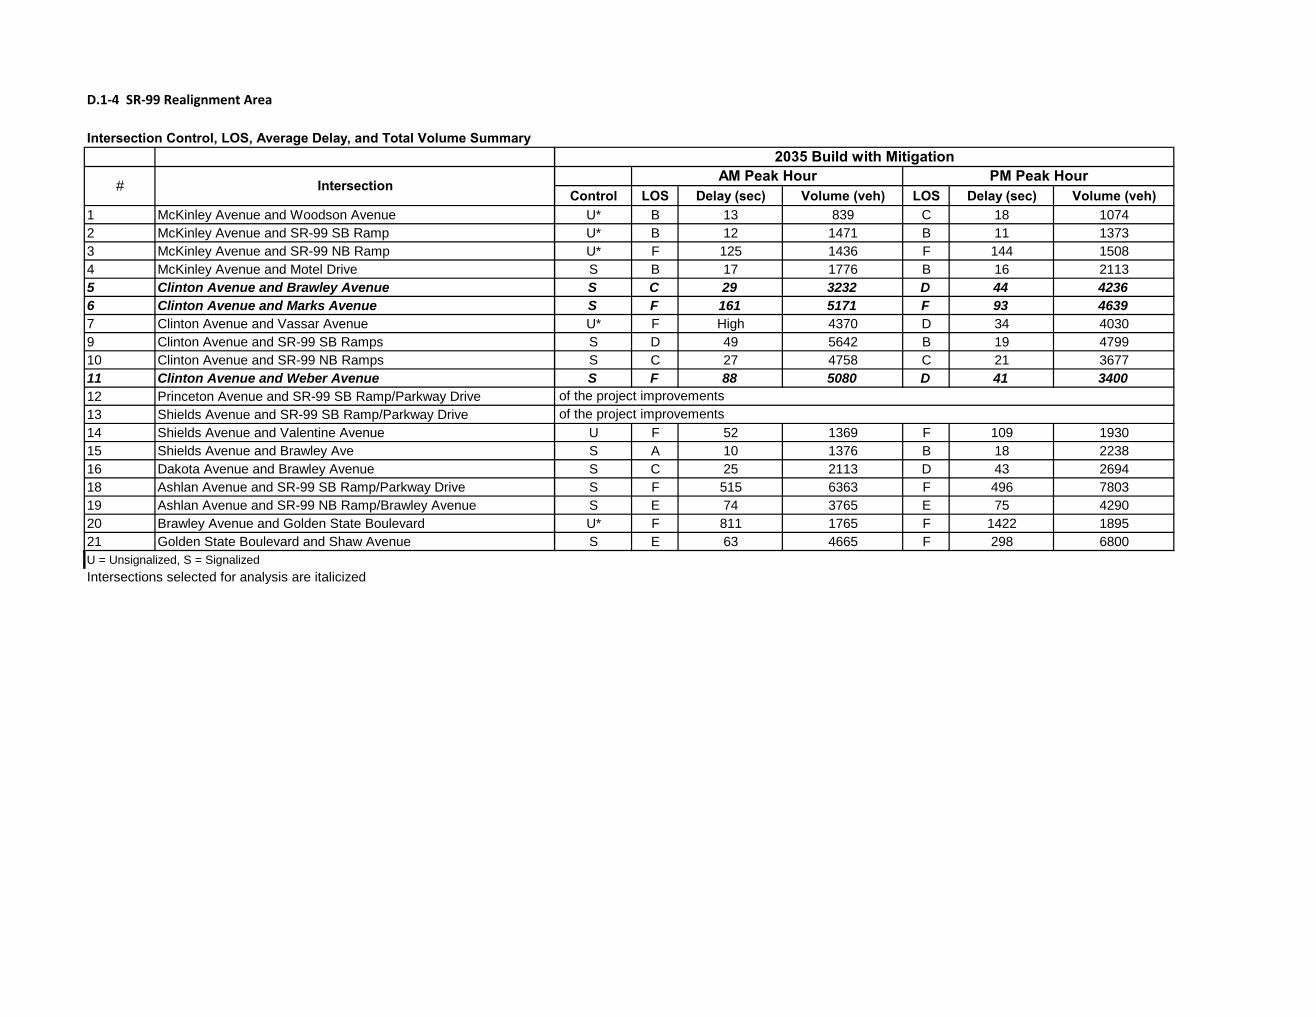
D.1-4 SR-99 Realignment Area
Intersection Control, LOS, Average Delay, and Total Volume Summary
1 McKinley Avenue and Woodson Avenue2 McKinley Avenue and SR-99 SB Ramp3 McKinley Avenue and SR-99 NB Ramp4 McKinley Avenue and Motel Drive5 Clinton Avenue and Brawley Avenue6 Clinton Avenue and Marks Avenue7 Clinton Avenue and Vassar Avenue9 Clinton Avenue and SR-99 SB Ramps10 Clinton Avenue and SR-99 NB Ramps11 Clinton Avenue and Weber Avenue12 Princeton Avenue and SR-99 SB Ramp/Parkway Drive13 Shields Avenue and SR-99 SB Ramp/Parkway Drive14 Shields Avenue and Valentine Avenue15 Shields Avenue and Brawley Ave16 Dakota Avenue and Brawley Avenue18 Ashlan Avenue and SR-99 SB Ramp/Parkway Drive19 Ashlan Avenue and SR-99 NB Ramp/Brawley Avenue20 Brawley Avenue and Golden State Boulevard21 Golden State Boulevard and Shaw AvenueU = Unsignalized, S = SignalizedIntersections selected for analysis are italicized
# IntersectionControl LOS Delay (sec) Volume (veh) LOS Delay (sec) Volume (veh)
U* B 13 839 C 18 1074U* B 12 1471 B 11 1373U* F 125 1436 F 144 1508S B 17 1776 B 16 2113S C 29 3232 D 44 4236S F 161 5171 F 93 4639U* F High 4370 D 34 4030S D 49 5642 B 19 4799S C 27 4758 C 21 3677S F 88 5080 D 41 3400
U F 52 1369 F 109 1930S A 10 1376 B 18 2238S C 25 2113 D 43 2694S F 515 6363 F 496 7803S E 74 3765 E 75 4290U* F 811 1765 F 1422 1895S E 63 4665 F 298 6800
2035 Build with Mitigation
t of the project improvements t of the project improvements
AM Peak Hour PM Peak Hour
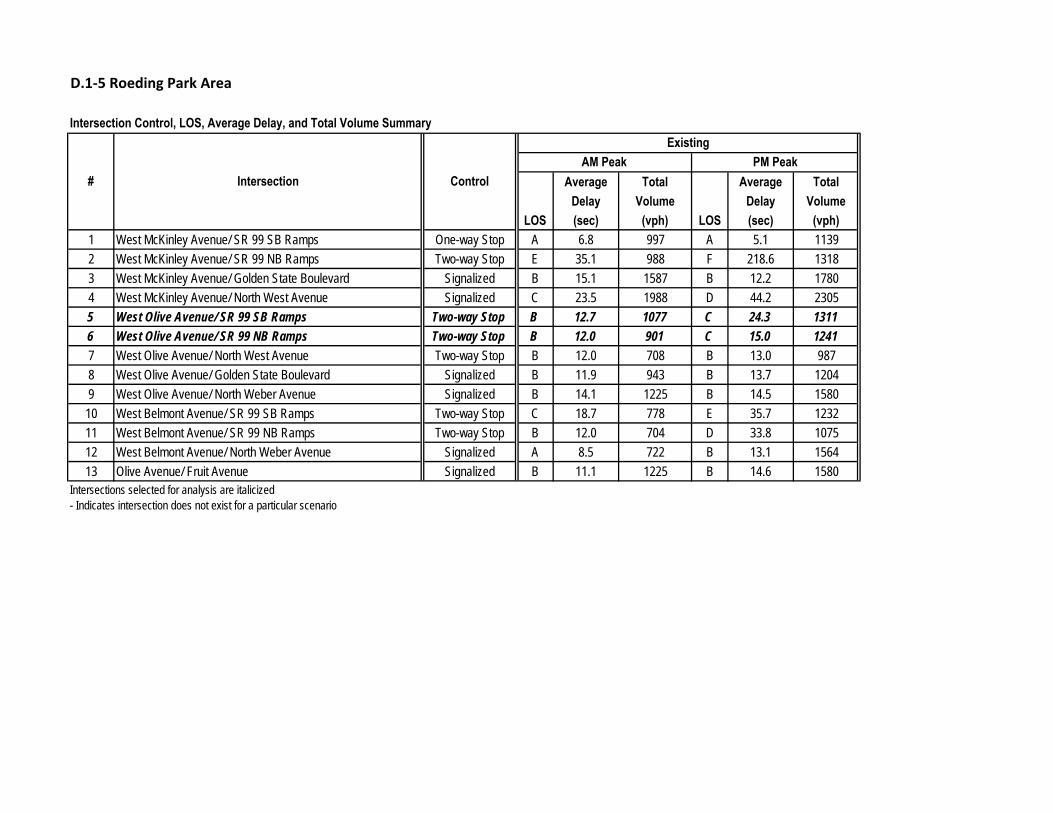
D.1‐5 Roeding Park Area
Intersection Control, LOS, Average Delay, and Total Volume Summary
Average Total Average TotalDelay Volume Delay Volume
LOS (sec) (vph) LOS (sec) (vph)1 West McKinley Avenue/ SR 99 SB Ramps One-way Stop A 6.8 997 A 5.1 11392 West McKinley Avenue/ SR 99 NB Ramps Two-way Stop E 35.1 988 F 218.6 13183 West McKinley Avenue/ Golden State Boulevard Signalized B 15.1 1587 B 12.2 17804 West McKinley Avenue/ North West Avenue Signalized C 23.5 1988 D 44.2 23055 West Olive Avenue/ SR 99 SB Ramps Two-way Stop B 12.7 1077 C 24.3 1311
6 West Olive Avenue/ SR 99 NB Ramps Two-way Stop B 12.0 901 C 15.0 1241
7 West Olive Avenue/ North West Avenue Two-way Stop B 12.0 708 B 13.0 9878 West Olive Avenue/ Golden State Boulevard Signalized B 11.9 943 B 13.7 12049 West Olive Avenue/ North Weber Avenue Signalized B 14.1 1225 B 14.5 1580
10 West Belmont Avenue/ SR 99 SB Ramps Two-way Stop C 18.7 778 E 35.7 123211 West Belmont Avenue/ SR 99 NB Ramps Two-way Stop B 12.0 704 D 33.8 107512 West Belmont Avenue/ North Weber Avenue Signalized A 8.5 722 B 13.1 156413 Olive Avenue/ Fruit Avenue Signalized B 11.1 1225 B 14.6 1580
Intersections selected for analysis are italicized- Indicates intersection does not exist for a particular scenario
# Intersection Control
ExistingAM Peak PM Peak
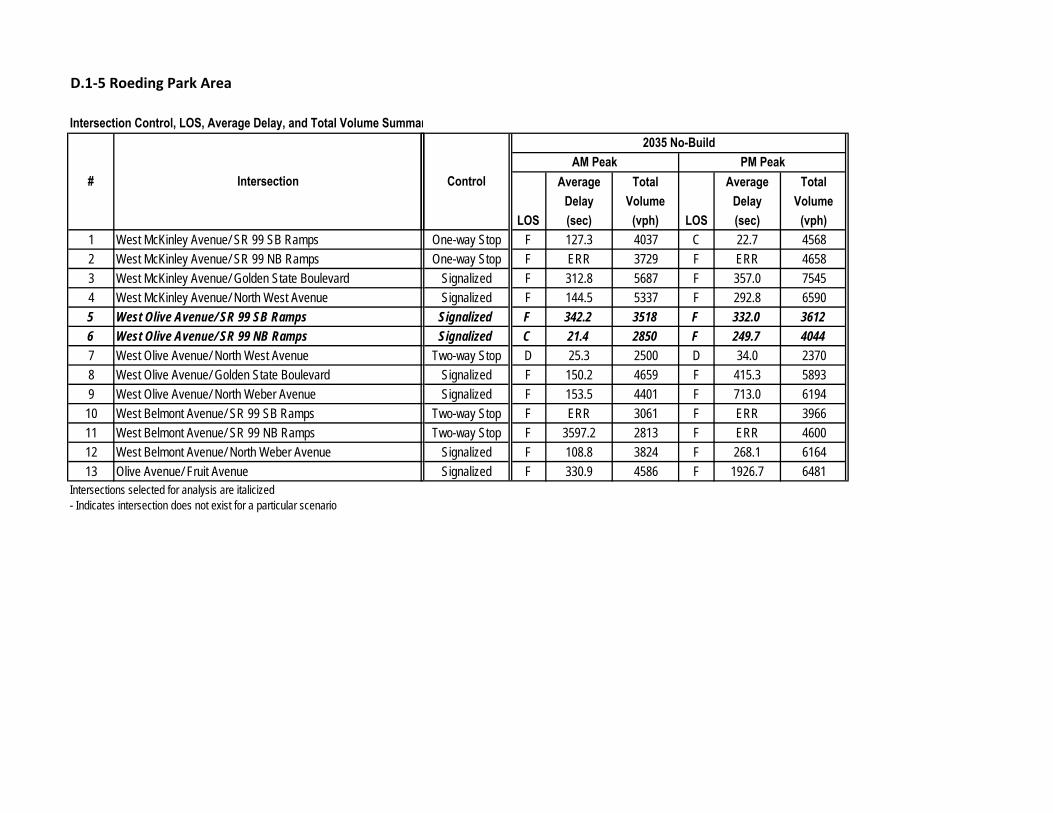
D.1‐5 Roeding Park Area
Intersection Control, LOS, Average Delay, and Total Volume Summar
1 West McKinley Avenue/ SR 99 SB Ramps2 West McKinley Avenue/ SR 99 NB Ramps3 West McKinley Avenue/ Golden State Boulevard4 West McKinley Avenue/ North West Avenue5 West Olive Avenue/ SR 99 SB Ramps
6 West Olive Avenue/ SR 99 NB Ramps
7 West Olive Avenue/ North West Avenue8 West Olive Avenue/ Golden State Boulevard9 West Olive Avenue/ North Weber Avenue
10 West Belmont Avenue/ SR 99 SB Ramps11 West Belmont Avenue/ SR 99 NB Ramps12 West Belmont Avenue/ North Weber Avenue13 Olive Avenue/ Fruit Avenue
Intersections selected for analysis are italicized- Indicates intersection does not exist for a particular scenario
# Intersection Average Total Average TotalDelay Volume Delay Volume
LOS (sec) (vph) LOS (sec) (vph)One-way Stop F 127.3 4037 C 22.7 4568One-way Stop F ERR 3729 F ERR 4658
Signalized F 312.8 5687 F 357.0 7545Signalized F 144.5 5337 F 292.8 6590
Signalized F 342.2 3518 F 332.0 3612
Signalized C 21.4 2850 F 249.7 4044
Two-way Stop D 25.3 2500 D 34.0 2370Signalized F 150.2 4659 F 415.3 5893Signalized F 153.5 4401 F 713.0 6194
Two-way Stop F ERR 3061 F ERR 3966Two-way Stop F 3597.2 2813 F ERR 4600
Signalized F 108.8 3824 F 268.1 6164Signalized F 330.9 4586 F 1926.7 6481
AM Peak PM PeakControl
2035 No-Build
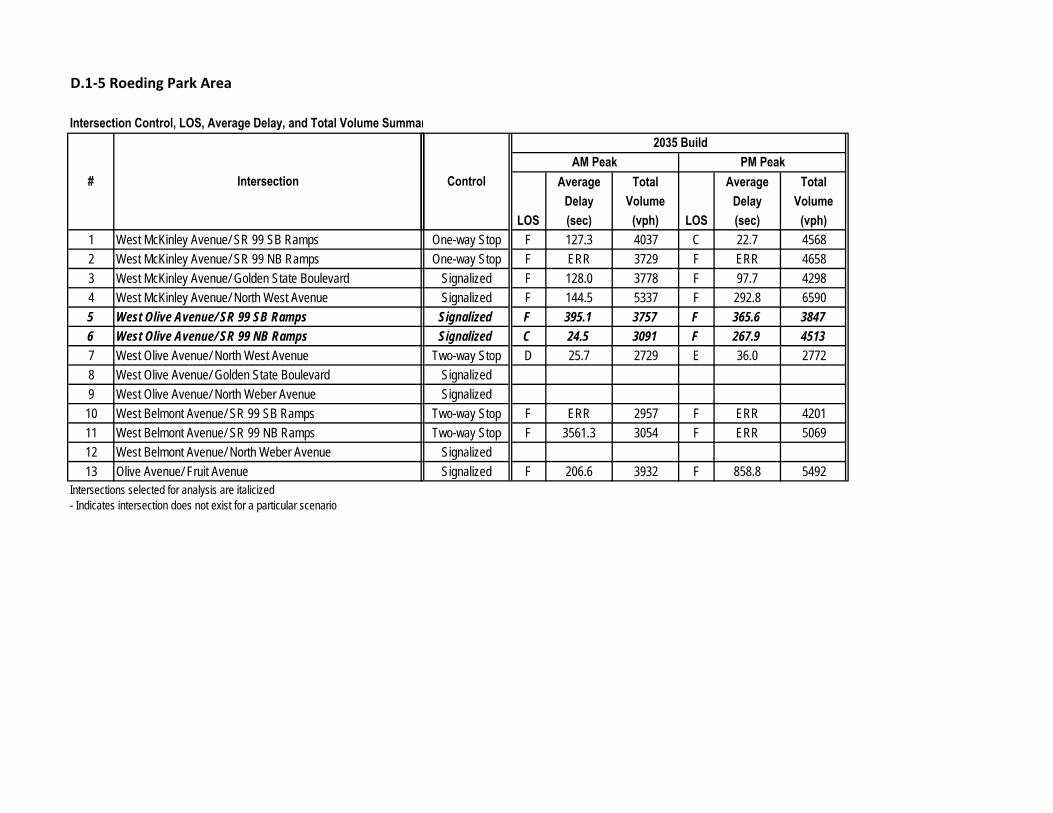
D.1‐5 Roeding Park Area
Intersection Control, LOS, Average Delay, and Total Volume Summar
1 West McKinley Avenue/ SR 99 SB Ramps2 West McKinley Avenue/ SR 99 NB Ramps3 West McKinley Avenue/ Golden State Boulevard4 West McKinley Avenue/ North West Avenue5 West Olive Avenue/ SR 99 SB Ramps
6 West Olive Avenue/ SR 99 NB Ramps
7 West Olive Avenue/ North West Avenue8 West Olive Avenue/ Golden State Boulevard9 West Olive Avenue/ North Weber Avenue
10 West Belmont Avenue/ SR 99 SB Ramps11 West Belmont Avenue/ SR 99 NB Ramps12 West Belmont Avenue/ North Weber Avenue13 Olive Avenue/ Fruit Avenue
Intersections selected for analysis are italicized- Indicates intersection does not exist for a particular scenario
# Intersection Average Total Average TotalDelay Volume Delay Volume
LOS (sec) (vph) LOS (sec) (vph)One-way Stop F 127.3 4037 C 22.7 4568One-way Stop F ERR 3729 F ERR 4658
Signalized F 128.0 3778 F 97.7 4298Signalized F 144.5 5337 F 292.8 6590
Signalized F 395.1 3757 F 365.6 3847
Signalized C 24.5 3091 F 267.9 4513
Two-way Stop D 25.7 2729 E 36.0 2772SignalizedSignalized
Two-way Stop F ERR 2957 F ERR 4201Two-way Stop F 3561.3 3054 F ERR 5069
SignalizedSignalized F 206.6 3932 F 858.8 5492
AM Peak PM Peak 2035 Build
Control
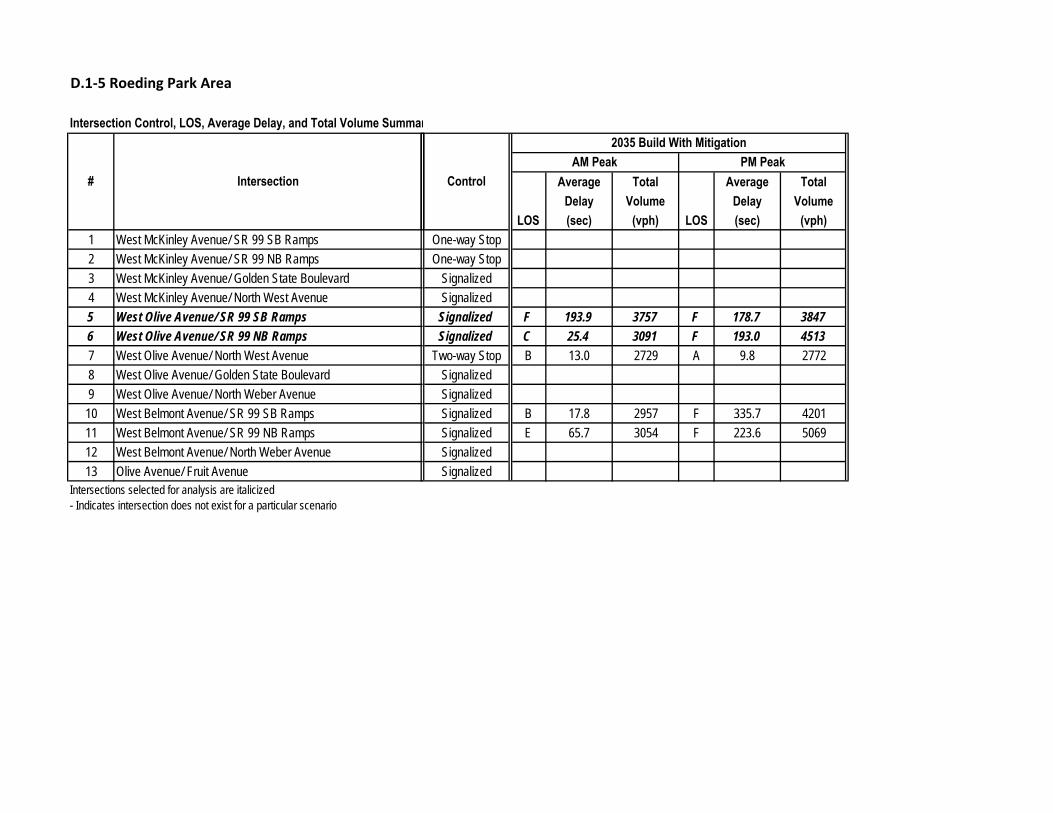
D.1‐5 Roeding Park Area
Intersection Control, LOS, Average Delay, and Total Volume Summar
1 West McKinley Avenue/ SR 99 SB Ramps2 West McKinley Avenue/ SR 99 NB Ramps3 West McKinley Avenue/ Golden State Boulevard4 West McKinley Avenue/ North West Avenue5 West Olive Avenue/ SR 99 SB Ramps
6 West Olive Avenue/ SR 99 NB Ramps
7 West Olive Avenue/ North West Avenue8 West Olive Avenue/ Golden State Boulevard9 West Olive Avenue/ North Weber Avenue
10 West Belmont Avenue/ SR 99 SB Ramps11 West Belmont Avenue/ SR 99 NB Ramps12 West Belmont Avenue/ North Weber Avenue13 Olive Avenue/ Fruit Avenue
Intersections selected for analysis are italicized- Indicates intersection does not exist for a particular scenario
# Intersection Average Total Average TotalDelay Volume Delay Volume
LOS (sec) (vph) LOS (sec) (vph)One-way StopOne-way Stop
SignalizedSignalized
Signalized F 193.9 3757 F 178.7 3847
Signalized C 25.4 3091 F 193.0 4513
Two-way Stop B 13.0 2729 A 9.8 2772SignalizedSignalizedSignalized B 17.8 2957 F 335.7 4201Signalized E 65.7 3054 F 223.6 5069SignalizedSignalized
Control
2035 Build With MitigationAM Peak PM Peak

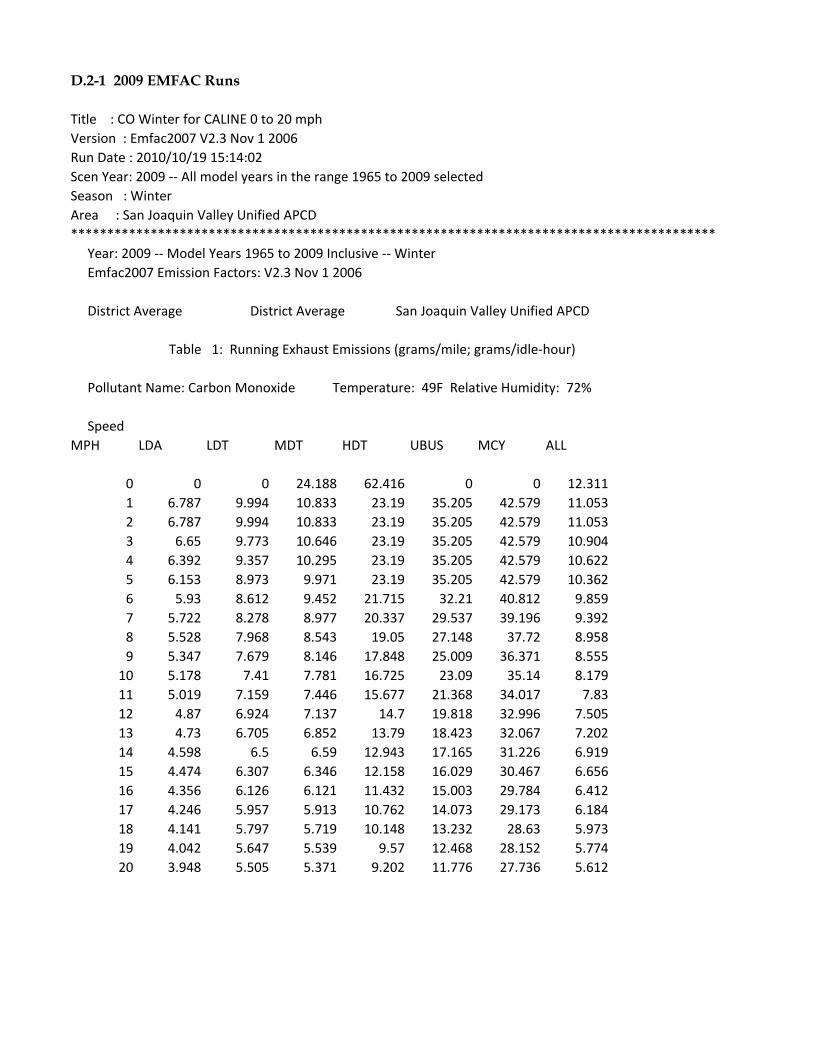
D.2-1 2009 EMFAC Runs
Title : CO Winter for CALINE 0 to 20 mphVersion : Emfac2007 V2.3 Nov 1 2006Run Date : 2010/10/19 15:14:02Scen Year: 2009 -- All model years in the range 1965 to 2009 selectedSeason : WinterArea : San Joaquin Valley Unified APCD***************************************************************************************** Year: 2009 -- Model Years 1965 to 2009 Inclusive -- Winter Emfac2007 Emission Factors: V2.3 Nov 1 2006
District Average District Average San Joaquin Valley Unified APCD
Table 1: Running Exhaust Emissions (grams/mile; grams/idle-hour)
Pollutant Name: Carbon Monoxide Temperature: 49F Relative Humidity: 72%
SpeedMPH LDA LDT MDT HDT UBUS MCY ALL
0 0 0 24.188 62.416 0 0 12.3111 6.787 9.994 10.833 23.19 35.205 42.579 11.0532 6.787 9.994 10.833 23.19 35.205 42.579 11.0533 6.65 9.773 10.646 23.19 35.205 42.579 10.9044 6.392 9.357 10.295 23.19 35.205 42.579 10.6225 6.153 8.973 9.971 23.19 35.205 42.579 10.3626 5.93 8.612 9.452 21.715 32.21 40.812 9.8597 5.722 8.278 8.977 20.337 29.537 39.196 9.3928 5.528 7.968 8.543 19.05 27.148 37.72 8.9589 5.347 7.679 8.146 17.848 25.009 36.371 8.555
10 5.178 7.41 7.781 16.725 23.09 35.14 8.17911 5.019 7.159 7.446 15.677 21.368 34.017 7.8312 4.87 6.924 7.137 14.7 19.818 32.996 7.50513 4.73 6.705 6.852 13.79 18.423 32.067 7.20214 4.598 6.5 6.59 12.943 17.165 31.226 6.91915 4.474 6.307 6.346 12.158 16.029 30.467 6.65616 4.356 6.126 6.121 11.432 15.003 29.784 6.41217 4.246 5.957 5.913 10.762 14.073 29.173 6.18418 4.141 5.797 5.719 10.148 13.232 28.63 5.97319 4.042 5.647 5.539 9.57 12.468 28.152 5.77420 3.948 5.505 5.371 9.202 11.776 27.736 5.612
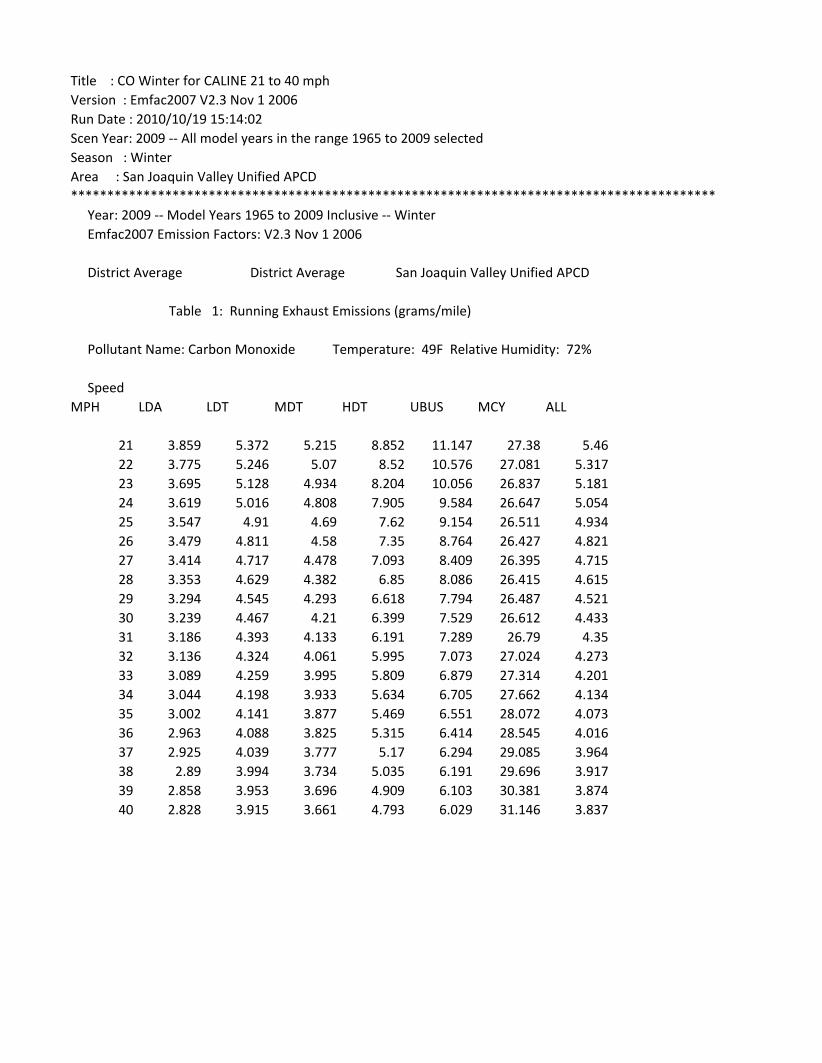
Title : CO Winter for CALINE 21 to 40 mphVersion : Emfac2007 V2.3 Nov 1 2006Run Date : 2010/10/19 15:14:02Scen Year: 2009 -- All model years in the range 1965 to 2009 selectedSeason : WinterArea : San Joaquin Valley Unified APCD***************************************************************************************** Year: 2009 -- Model Years 1965 to 2009 Inclusive -- Winter Emfac2007 Emission Factors: V2.3 Nov 1 2006
District Average District Average San Joaquin Valley Unified APCD
Table 1: Running Exhaust Emissions (grams/mile)
Pollutant Name: Carbon Monoxide Temperature: 49F Relative Humidity: 72%
SpeedMPH LDA LDT MDT HDT UBUS MCY ALL
21 3.859 5.372 5.215 8.852 11.147 27.38 5.4622 3.775 5.246 5.07 8.52 10.576 27.081 5.31723 3.695 5.128 4.934 8.204 10.056 26.837 5.18124 3.619 5.016 4.808 7.905 9.584 26.647 5.05425 3.547 4.91 4.69 7.62 9.154 26.511 4.93426 3.479 4.811 4.58 7.35 8.764 26.427 4.82127 3.414 4.717 4.478 7.093 8.409 26.395 4.71528 3.353 4.629 4.382 6.85 8.086 26.415 4.61529 3.294 4.545 4.293 6.618 7.794 26.487 4.52130 3.239 4.467 4.21 6.399 7.529 26.612 4.43331 3.186 4.393 4.133 6.191 7.289 26.79 4.3532 3.136 4.324 4.061 5.995 7.073 27.024 4.27333 3.089 4.259 3.995 5.809 6.879 27.314 4.20134 3.044 4.198 3.933 5.634 6.705 27.662 4.13435 3.002 4.141 3.877 5.469 6.551 28.072 4.07336 2.963 4.088 3.825 5.315 6.414 28.545 4.01637 2.925 4.039 3.777 5.17 6.294 29.085 3.96438 2.89 3.994 3.734 5.035 6.191 29.696 3.91739 2.858 3.953 3.696 4.909 6.103 30.381 3.87440 2.828 3.915 3.661 4.793 6.029 31.146 3.837
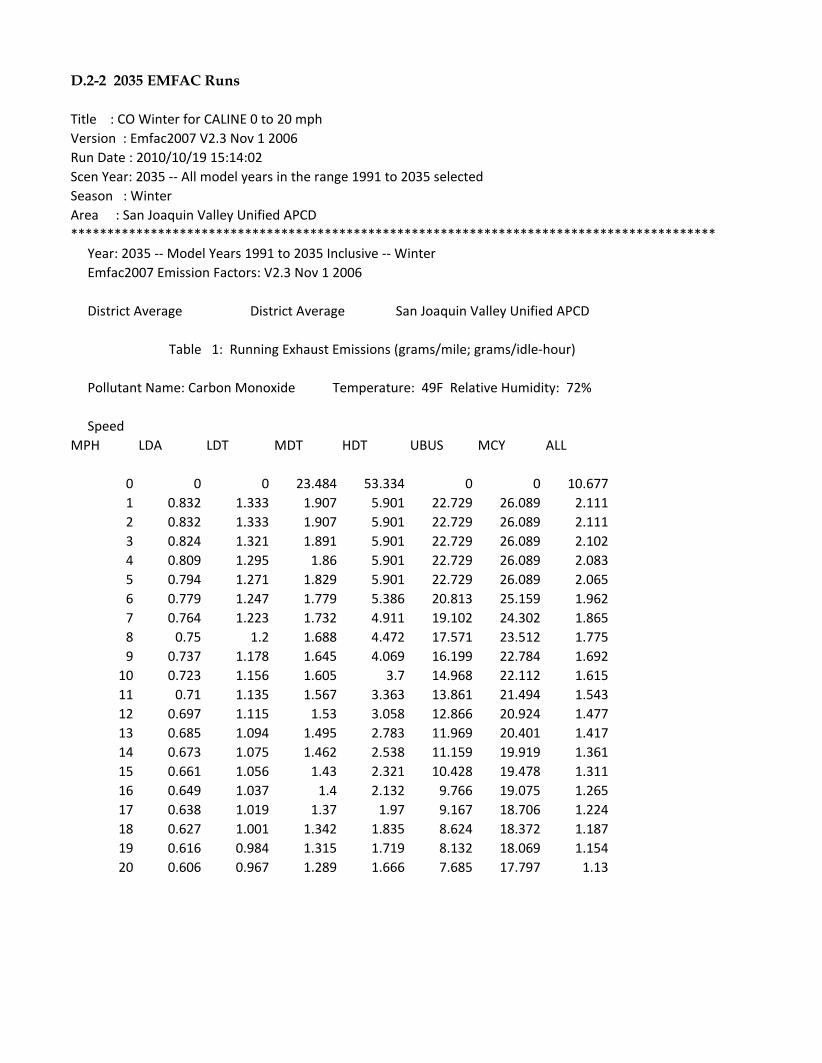
D.2-2 2035 EMFAC Runs
Title : CO Winter for CALINE 0 to 20 mphVersion : Emfac2007 V2.3 Nov 1 2006Run Date : 2010/10/19 15:14:02Scen Year: 2035 -- All model years in the range 1991 to 2035 selectedSeason : WinterArea : San Joaquin Valley Unified APCD***************************************************************************************** Year: 2035 -- Model Years 1991 to 2035 Inclusive -- Winter Emfac2007 Emission Factors: V2.3 Nov 1 2006
District Average District Average San Joaquin Valley Unified APCD
Table 1: Running Exhaust Emissions (grams/mile; grams/idle-hour)
Pollutant Name: Carbon Monoxide Temperature: 49F Relative Humidity: 72%
SpeedMPH LDA LDT MDT HDT UBUS MCY ALL
0 0 0 23.484 53.334 0 0 10.6771 0.832 1.333 1.907 5.901 22.729 26.089 2.1112 0.832 1.333 1.907 5.901 22.729 26.089 2.1113 0.824 1.321 1.891 5.901 22.729 26.089 2.1024 0.809 1.295 1.86 5.901 22.729 26.089 2.0835 0.794 1.271 1.829 5.901 22.729 26.089 2.0656 0.779 1.247 1.779 5.386 20.813 25.159 1.9627 0.764 1.223 1.732 4.911 19.102 24.302 1.8658 0.75 1.2 1.688 4.472 17.571 23.512 1.7759 0.737 1.178 1.645 4.069 16.199 22.784 1.692
10 0.723 1.156 1.605 3.7 14.968 22.112 1.61511 0.71 1.135 1.567 3.363 13.861 21.494 1.54312 0.697 1.115 1.53 3.058 12.866 20.924 1.47713 0.685 1.094 1.495 2.783 11.969 20.401 1.41714 0.673 1.075 1.462 2.538 11.159 19.919 1.36115 0.661 1.056 1.43 2.321 10.428 19.478 1.31116 0.649 1.037 1.4 2.132 9.766 19.075 1.26517 0.638 1.019 1.37 1.97 9.167 18.706 1.22418 0.627 1.001 1.342 1.835 8.624 18.372 1.18719 0.616 0.984 1.315 1.719 8.132 18.069 1.15420 0.606 0.967 1.289 1.666 7.685 17.797 1.13
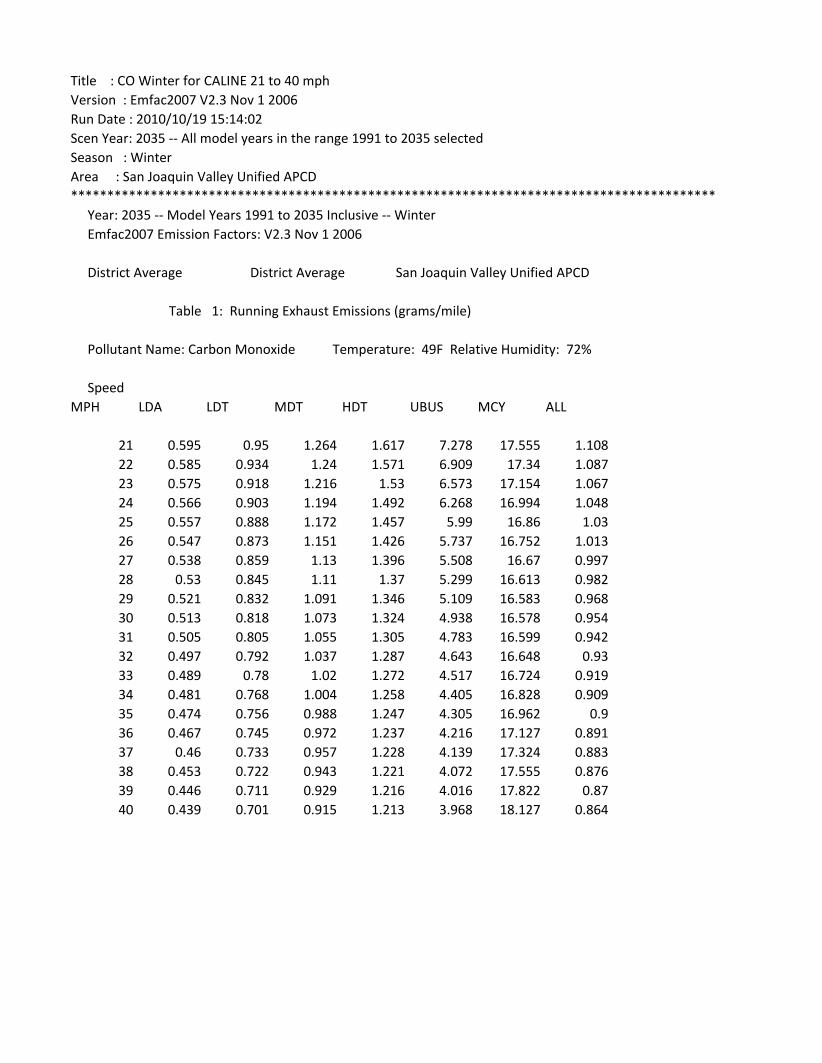
Title : CO Winter for CALINE 21 to 40 mphVersion : Emfac2007 V2.3 Nov 1 2006Run Date : 2010/10/19 15:14:02Scen Year: 2035 -- All model years in the range 1991 to 2035 selectedSeason : WinterArea : San Joaquin Valley Unified APCD***************************************************************************************** Year: 2035 -- Model Years 1991 to 2035 Inclusive -- Winter Emfac2007 Emission Factors: V2.3 Nov 1 2006
District Average District Average San Joaquin Valley Unified APCD
Table 1: Running Exhaust Emissions (grams/mile)
Pollutant Name: Carbon Monoxide Temperature: 49F Relative Humidity: 72%
SpeedMPH LDA LDT MDT HDT UBUS MCY ALL
21 0.595 0.95 1.264 1.617 7.278 17.555 1.10822 0.585 0.934 1.24 1.571 6.909 17.34 1.08723 0.575 0.918 1.216 1.53 6.573 17.154 1.06724 0.566 0.903 1.194 1.492 6.268 16.994 1.04825 0.557 0.888 1.172 1.457 5.99 16.86 1.0326 0.547 0.873 1.151 1.426 5.737 16.752 1.01327 0.538 0.859 1.13 1.396 5.508 16.67 0.99728 0.53 0.845 1.11 1.37 5.299 16.613 0.98229 0.521 0.832 1.091 1.346 5.109 16.583 0.96830 0.513 0.818 1.073 1.324 4.938 16.578 0.95431 0.505 0.805 1.055 1.305 4.783 16.599 0.94232 0.497 0.792 1.037 1.287 4.643 16.648 0.9333 0.489 0.78 1.02 1.272 4.517 16.724 0.91934 0.481 0.768 1.004 1.258 4.405 16.828 0.90935 0.474 0.756 0.988 1.247 4.305 16.962 0.936 0.467 0.745 0.972 1.237 4.216 17.127 0.89137 0.46 0.733 0.957 1.228 4.139 17.324 0.88338 0.453 0.722 0.943 1.221 4.072 17.555 0.87639 0.446 0.711 0.929 1.216 4.016 17.822 0.8740 0.439 0.701 0.915 1.213 3.968 18.127 0.864
APPENDIX E
Existing Conditions

CALIFORNIA HIGH-SPEED TRAIN PROGRAM AIR QUALITY TECHNICAL REPORT MERCED TO FRESNO SECTION PROJECT EIR/EIS APPENDIX E
Page i
Contents E.1 HST 2009 Operational Emissions Summary File
E.1-1 Summary of Operation-Related GHG Emissions E.1-2 Summary of Operational Emissions E.1-3 Merced Train Station: Operational Emissions E.1-4 Heavy Maintenance Facility: Onsite Operational Emissions E.1-5 Heavy Maintenance Facility: Offsite Operational Emissions E.1-6 Overnight Layover / Servicing Facility: Operational Emissions E.1-7 Train Dust Wake: Fugitive Dust Emissions E.1-8 Regional and Statewide Emissions: Vehicle Miles Traveled E.1-9 Regional and Statewide Emissions: Power Demands E.1-10 Regional and Statewide Emissions: Flight Demands
E.2 URBEMIS2007 Output File: Merced Station – Operation 2009
E.3 Emission Factors for Offsite Vehicles for 2009 Operational Emissions
E.4 Microscale CO Analysis LOS and Traffic Summary Files E.4-1 Castle Commerce Center HMF Site E.4-2 Merced HST Station E.4-3 Herndon Ave and Shaw Ave Area E.4-4 SR-99 Realignment Area E.4-5 Roeding Park Area

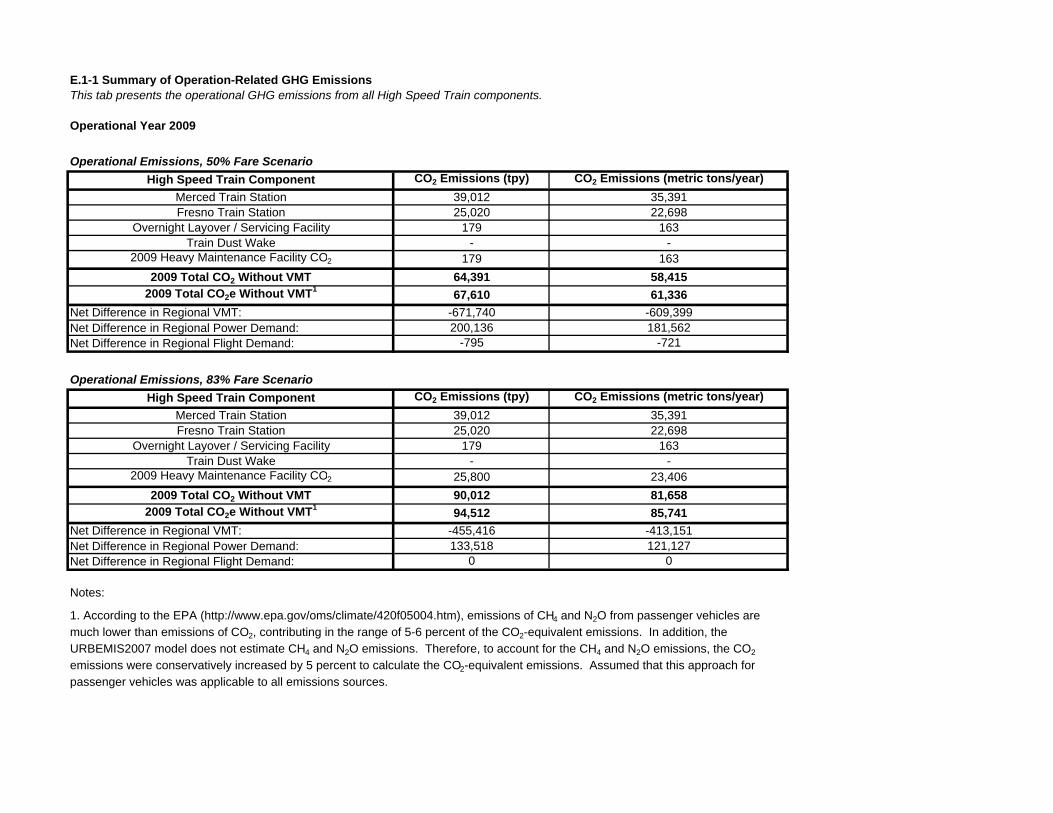
E.1-1 Summary of Operation-Related GHG EmissionsThis tab presents the operational GHG emissions from all High Speed Train components.
Operational Year 2009
Operational Emissions, 50% Fare Scenario
High Speed Train Component CO2 Emissions (tpy) CO2 Emissions (metric tons/year)
Merced Train Station 39,012 35,391Fresno Train Station 25,020 22,698
Overnight Layover / Servicing Facility 179 163Train Dust Wake - -
2009 Heavy Maintenance Facility CO2 179 163
2009 Total CO2 Without VMT 64,391 58,4152009 Total CO2e Without VMT1
67,610 61,336
Net Difference in Regional VMT: -671,740 -609,399Net Difference in Regional Power Demand: 200,136 181,562Net Difference in Regional Flight Demand: -795 -721
Operational Emissions, 83% Fare Scenario
High Speed Train Component CO2 Emissions (tpy) CO2 Emissions (metric tons/year)
Merced Train Station 39,012 35,391Fresno Train Station 25,020 22,698
Overnight Layover / Servicing Facility 179 163Train Dust Wake - -
2009 Heavy Maintenance Facility CO2 25,800 23,406
2009 Total CO2 Without VMT 90,012 81,6582009 Total CO2e Without VMT1
94,512 85,741
Net Difference in Regional VMT: -455,416 -413,151Net Difference in Regional Power Demand: 133,518 121,127Net Difference in Regional Flight Demand: 0 0
Notes:
1. According to the EPA (http://www.epa.gov/oms/climate/420f05004.htm), emissions of CH4 and N2O from passenger vehicles are much lower than emissions of CO2, contributing in the range of 5-6 percent of the CO2-equivalent emissions. In addition, the URBEMIS2007 model does not estimate CH4 and N2O emissions. Therefore, to account for the CH4 and N2O emissions, the CO2
emissions were conservatively increased by 5 percent to calculate the CO2-equivalent emissions. Assumed that this approach for passenger vehicles was applicable to all emissions sources.
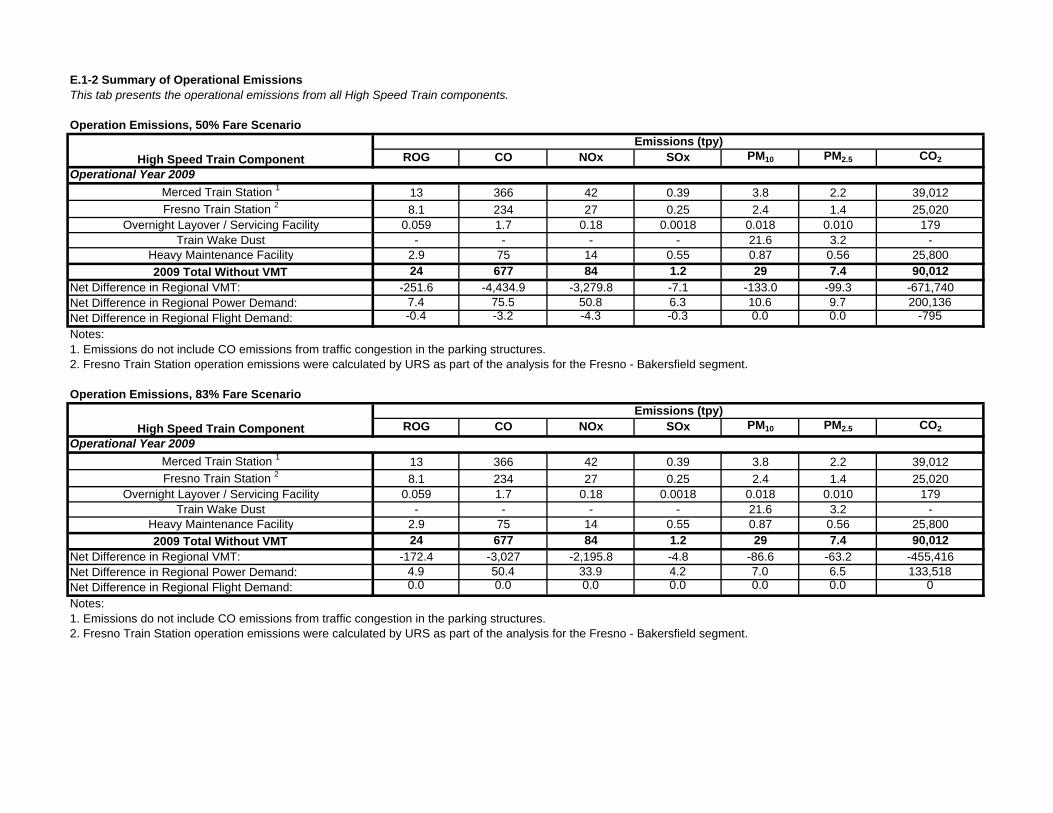
E.1-2 Summary of Operational Emissions This tab presents the operational emissions from all High Speed Train components.
Operation Emissions, 50% Fare Scenario
ROG CO NOx SOx PM10 PM2.5 CO2
Operational Year 2009
Merced Train Station 1 13 366 42 0.39 3.8 2.2 39,012
Fresno Train Station 2 8.1 234 27 0.25 2.4 1.4 25,020Overnight Layover / Servicing Facility 0.059 1.7 0.18 0.0018 0.018 0.010 179
Train Wake Dust - - - - 21.6 3.2 -Heavy Maintenance Facility 2.9 75 14 0.55 0.87 0.56 25,800
2009 Total Without VMT 24 677 84 1.2 29 7.4 90,012Net Difference in Regional VMT: -251.6 -4,434.9 -3,279.8 -7.1 -133.0 -99.3 -671,740Net Difference in Regional Power Demand: 7.4 75.5 50.8 6.3 10.6 9.7 200,136Net Difference in Regional Flight Demand: -0.4 -3.2 -4.3 -0.3 0.0 0.0 -795
Notes:1. Emissions do not include CO emissions from traffic congestion in the parking structures.
Operation Emissions, 83% Fare Scenario
ROG CO NOx SOx PM10 PM2.5 CO2
Operational Year 2009
Merced Train Station 1 13 366 42 0.39 3.8 2.2 39,012
Fresno Train Station 2 8.1 234 27 0.25 2.4 1.4 25,020Overnight Layover / Servicing Facility 0.059 1.7 0.18 0.0018 0.018 0.010 179
Train Wake Dust - - - - 21.6 3.2 -Heavy Maintenance Facility 2.9 75 14 0.55 0.87 0.56 25,800
2009 Total Without VMT 24 677 84 1.2 29 7.4 90,012Net Difference in Regional VMT: -172.4 -3,027 -2,195.8 -4.8 -86.6 -63.2 -455,416Net Difference in Regional Power Demand: 4.9 50.4 33.9 4.2 7.0 6.5 133,518Net Difference in Regional Flight Demand: 0.0 0.0 0.0 0.0 0.0 0.0 0
Notes:1. Emissions do not include CO emissions from traffic congestion in the parking structures.2. Fresno Train Station operation emissions were calculated by URS as part of the analysis for the Fresno - Bakersfield segment.
High Speed Train Component
Emissions (tpy)
2. Fresno Train Station operation emissions were calculated by URS as part of the analysis for the Fresno - Bakersfield segment.
High Speed Train Component
Emissions (tpy)
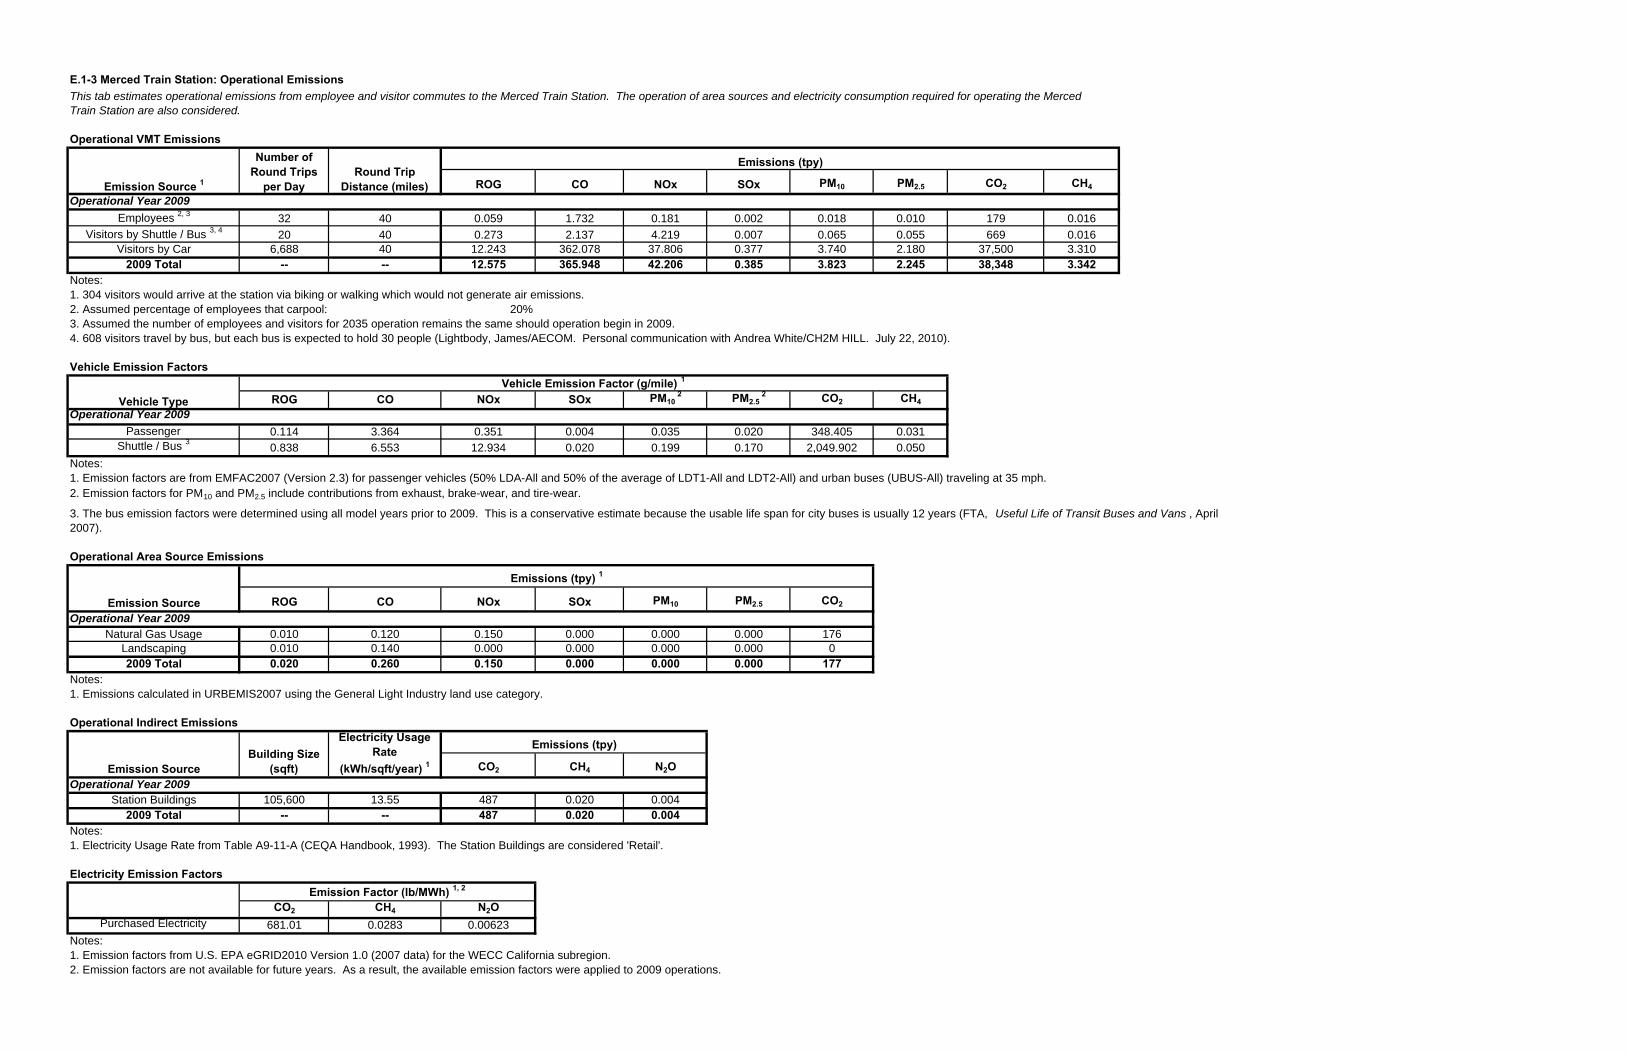
E.1-3 Merced Train Station: Operational Emissions
Operational VMT Emissions
ROG CO NOx SOx PM10 PM2.5 CO2 CH4
Operational Year 2009
Employees 2, 3 32 40 0.059 1.732 0.181 0.002 0.018 0.010 179 0.016Visitors by Shuttle / Bus 3, 4 20 40 0.273 2.137 4.219 0.007 0.065 0.055 669 0.016
Visitors by Car 6,688 40 12.243 362.078 37.806 0.377 3.740 2.180 37,500 3.3102009 Total -- -- 12.575 365.948 42.206 0.385 3.823 2.245 38,348 3.342
Notes:1. 304 visitors would arrive at the station via biking or walking which would not generate air emissions.2. Assumed percentage of employees that carpool: 20%3. Assumed the number of employees and visitors for 2035 operation remains the same should operation begin in 2009.4. 608 visitors travel by bus, but each bus is expected to hold 30 people (Lightbody, James/AECOM. Personal communication with Andrea White/CH2M HILL. July 22, 2010).
Vehicle Emission Factors
ROG CO NOx SOx PM10 2 PM2.5
2 CO2 CH4
Operational Year 2009
Passenger 0.114 3.364 0.351 0.004 0.035 0.020 348.405 0.031Shuttle / Bus 3
0.838 6.553 12.934 0.020 0.199 0.170 2,049.902 0.050Notes:
2. Emission factors for PM10 and PM2.5 include contributions from exhaust, brake-wear, and tire-wear.
Operational Area Source Emissions
ROG CO NOx SOx PM10 PM2.5 CO2
Operational Year 2009Natural Gas Usage 0.010 0.120 0.150 0.000 0.000 0.000 176
Landscaping 0.010 0.140 0.000 0.000 0.000 0.000 02009 Total 0.020 0.260 0.150 0.000 0.000 0.000 177
Notes:
Operational Indirect Emissions
CO2 CH4 N2OOperational Year 2009
Station Buildings 105,600 13.55 487 0.020 0.0042009 Total -- -- 487 0.020 0.004
Notes:1. Electricity Usage Rate from Table A9-11-A (CEQA Handbook, 1993). The Station Buildings are considered 'Retail'.
Electricity Emission Factors
CO2 CH4 N2OPurchased Electricity 681.01 0.0283 0.00623
Notes:1. Emission factors from U.S. EPA eGRID2010 Version 1.0 (2007 data) for the WECC California subregion.2. Emission factors are not available for future years. As a result, the available emission factors were applied to 2009 operations.
Emission Factor (lb/MWh) 1, 2
Emissions (tpy)
Emission SourceBuilding Size
(sqft)
Electricity Usage Rate
(kWh/sqft/year) 1
This tab estimates operational emissions from employee and visitor commutes to the Merced Train Station. The operation of area sources and electricity consumption required for operating the Merced Train Station are also considered.
1. Emissions calculated in URBEMIS2007 using the General Light Industry land use category.
Emissions (tpy)
Emission Source
Vehicle TypeVehicle Emission Factor (g/mile) 1
1. Emission factors are from EMFAC2007 (Version 2.3) for passenger vehicles (50% LDA-All and 50% of the average of LDT1-All and LDT2-All) and urban buses (UBUS-All) traveling at 35 mph.
Emission Source 1
Number of Round Trips
per DayRound Trip
Distance (miles)
Emissions (tpy) 1
3. The bus emission factors were determined using all model years prior to 2009. This is a conservative estimate because the usable life span for city buses is usually 12 years (FTA, Useful Life of Transit Buses and Vans , April 2007).
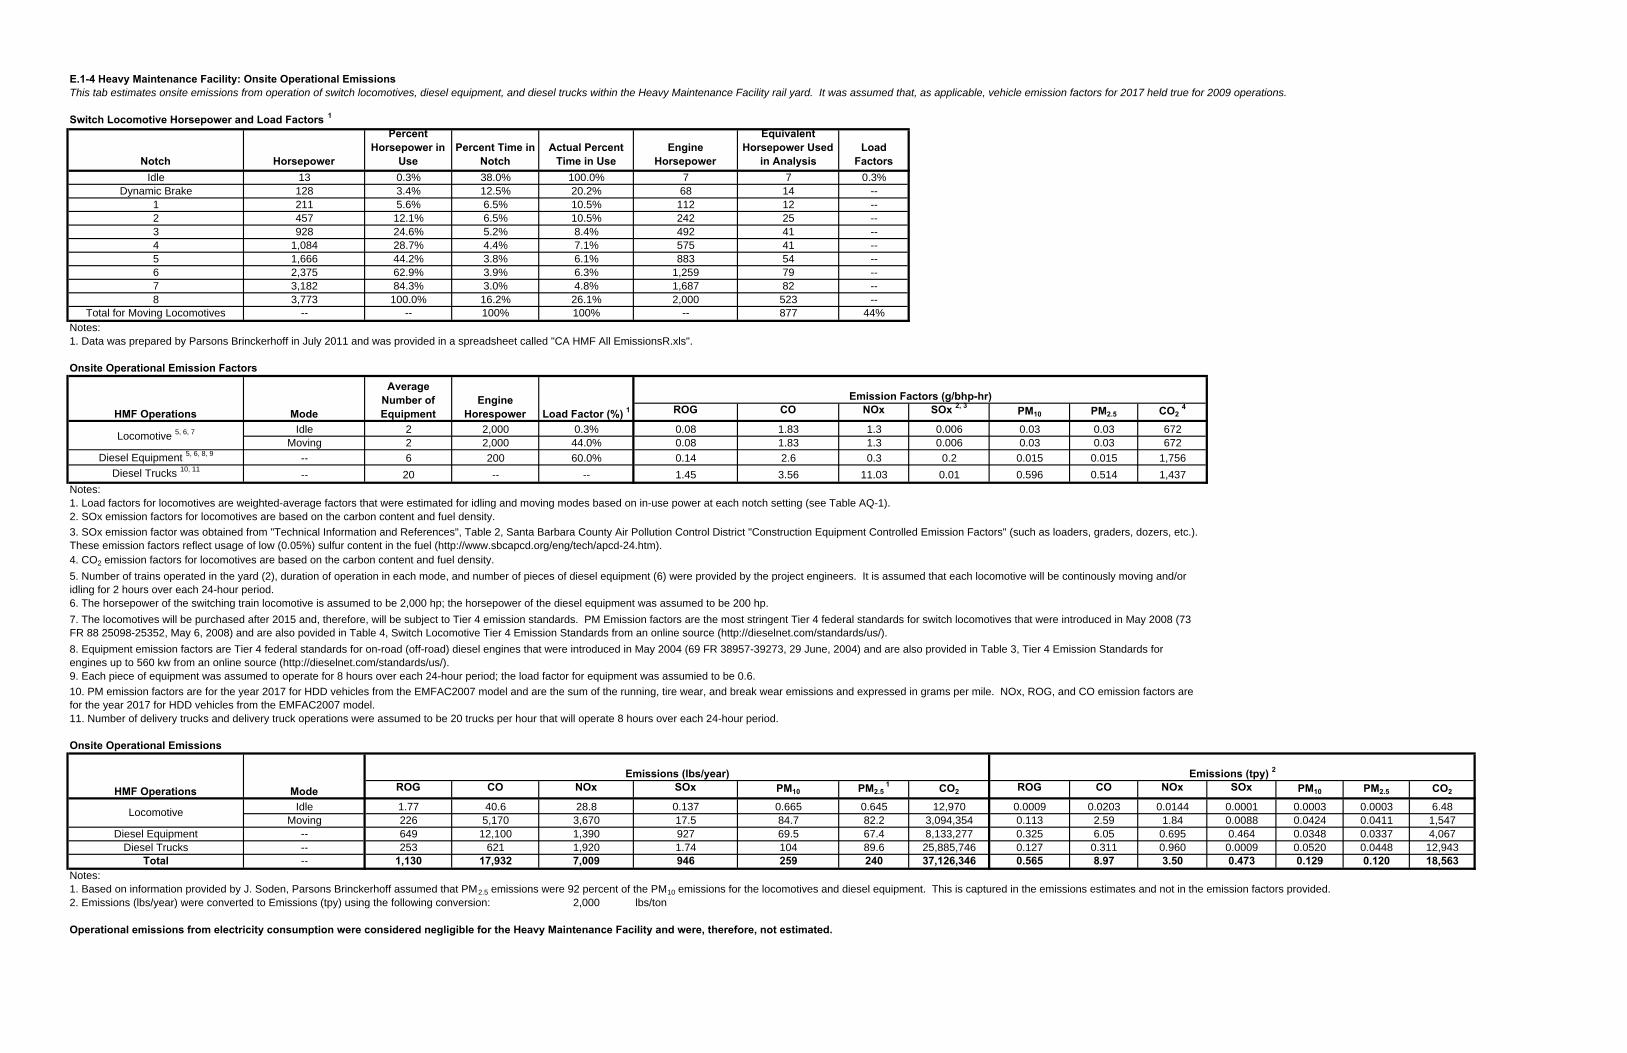
E.1-4 Heavy Maintenance Facility: Onsite Operational EmissionsThis tab estimates onsite emissions from operation of switch locomotives, diesel equipment, and diesel trucks within the Heavy Maintenance Facility rail yard. It was assumed that, as applicable, vehicle emission factors for 2017 held true for 2009 operations.
Switch Locomotive Horsepower and Load Factors 1
Notch Horsepower
Percent Horsepower in
UsePercent Time in
NotchActual Percent
Time in UseEngine
Horsepower
Equivalent Horsepower Used
in AnalysisLoad
FactorsIdle 13 0.3% 38.0% 100.0% 7 7 0.3%
Dynamic Brake 128 3.4% 12.5% 20.2% 68 14 --1 211 5.6% 6.5% 10.5% 112 12 --2 457 12.1% 6.5% 10.5% 242 25 --3 928 24.6% 5.2% 8.4% 492 41 --4 1,084 28.7% 4.4% 7.1% 575 41 --5 1,666 44.2% 3.8% 6.1% 883 54 --6 2,375 62.9% 3.9% 6.3% 1,259 79 --7 3,182 84.3% 3.0% 4.8% 1,687 82 --8 3,773 100.0% 16.2% 26.1% 2,000 523 --
Total for Moving Locomotives -- -- 100% 100% -- 877 44%Notes:1. Data was prepared by Parsons Brinckerhoff in July 2011 and was provided in a spreadsheet called "CA HMF All EmissionsR.xls".
Onsite Operational Emission Factors
ROG CO NOx SOx 2, 3 PM10 PM2.5 CO2 4
Idle 2 2,000 0.3% 0.08 1.83 1.3 0.006 0.03 0.03 672Moving 2 2,000 44.0% 0.08 1.83 1.3 0.006 0.03 0.03 672
Diesel Equipment 5, 6, 8, 9 -- 6 200 60.0% 0.14 2.6 0.3 0.2 0.015 0.015 1,756
Diesel Trucks 10, 11-- 20 -- -- 1.45 3.56 11.03 0.01 0.596 0.514 1,437
Notes:1. Load factors for locomotives are weighted-average factors that were estimated for idling and moving modes based on in-use power at each notch setting (see Table AQ-1).2. SOx emission factors for locomotives are based on the carbon content and fuel density.
4. CO2 emission factors for locomotives are based on the carbon content and fuel density.
6. The horsepower of the switching train locomotive is assumed to be 2,000 hp; the horsepower of the diesel equipment was assumed to be 200 hp.
9. Each piece of equipment was assumed to operate for 8 hours over each 24-hour period; the load factor for equipment was assumied to be 0.6.
11. Number of delivery trucks and delivery truck operations were assumed to be 20 trucks per hour that will operate 8 hours over each 24-hour period.
Onsite Operational Emissions
ROG CO NOx SOx PM10 PM2.5 1 CO2 ROG CO NOx SOx PM10 PM2.5 CO2
Idle 1.77 40.6 28.8 0.137 0.665 0.645 12,970 0.0009 0.0203 0.0144 0.0001 0.0003 0.0003 6.48Moving 226 5,170 3,670 17.5 84.7 82.2 3,094,354 0.113 2.59 1.84 0.0088 0.0424 0.0411 1,547
Diesel Equipment -- 649 12,100 1,390 927 69.5 67.4 8,133,277 0.325 6.05 0.695 0.464 0.0348 0.0337 4,067Diesel Trucks -- 253 621 1,920 1.74 104 89.6 25,885,746 0.127 0.311 0.960 0.0009 0.0520 0.0448 12,943
Total -- 1,130 17,932 7,009 946 259 240 37,126,346 0.565 8.97 3.50 0.473 0.129 0.120 18,563Notes:
2. Emissions (lbs/year) were converted to Emissions (tpy) using the following conversion: 2,000 lbs/ton
Operational emissions from electricity consumption were considered negligible for the Heavy Maintenance Facility and were, therefore, not estimated.
Emission Factors (g/bhp-hr)
Locomotive 5, 6, 7
3. SOx emission factor was obtained from "Technical Information and References", Table 2, Santa Barbara County Air Pollution Control District "Construction Equipment Controlled Emission Factors" (such as loaders, graders, dozers, etc.). These emission factors reflect usage of low (0.05%) sulfur content in the fuel (http://www.sbcapcd.org/eng/tech/apcd-24.htm).
5. Number of trains operated in the yard (2), duration of operation in each mode, and number of pieces of diesel equipment (6) were provided by the project engineers. It is assumed that each locomotive will be continously moving and/or idling for 2 hours over each 24-hour period.
7. The locomotives will be purchased after 2015 and, therefore, will be subject to Tier 4 emission standards. PM Emission factors are the most stringent Tier 4 federal standards for switch locomotives that were introduced in May 2008 (73 FR 88 25098-25352, May 6, 2008) and are also povided in Table 4, Switch Locomotive Tier 4 Emission Standards from an online source (http://dieselnet.com/standards/us/).
HMF Operations Mode
Average Number of Equipment
Engine Horespower Load Factor (%) 1
Locomotive
1. Based on information provided by J. Soden, Parsons Brinckerhoff assumed that PM2.5 emissions were 92 percent of the PM10 emissions for the locomotives and diesel equipment. This is captured in the emissions estimates and not in the emission factors provided.
8. Equipment emission factors are Tier 4 federal standards for on-road (off-road) diesel engines that were introduced in May 2004 (69 FR 38957-39273, 29 June, 2004) and are also provided in Table 3, Tier 4 Emission Standards for engines up to 560 kw from an online source (http://dieselnet.com/standards/us/).
10. PM emission factors are for the year 2017 for HDD vehicles from the EMFAC2007 model and are the sum of the running, tire wear, and break wear emissions and expressed in grams per mile. NOx, ROG, and CO emission factors are for the year 2017 for HDD vehicles from the EMFAC2007 model.
HMF Operations ModeEmissions (lbs/year) Emissions (tpy) 2
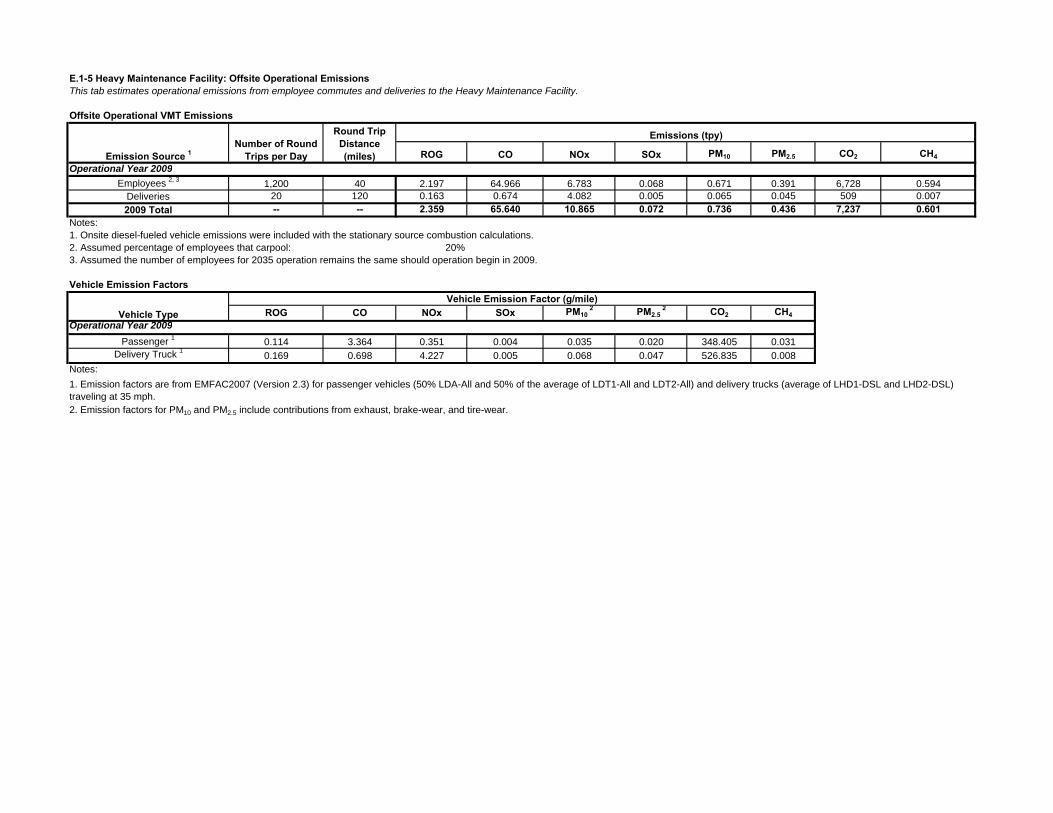
E.1-5 Heavy Maintenance Facility: Offsite Operational EmissionsThis tab estimates operational emissions from employee commutes and deliveries to the Heavy Maintenance Facility.
Offsite Operational VMT Emissions
ROG CO NOx SOx PM10 PM2.5 CO2 CH4
Operational Year 2009
Employees 2, 3 1,200 40 2.197 64.966 6.783 0.068 0.671 0.391 6,728 0.594Deliveries 20 120 0.163 0.674 4.082 0.005 0.065 0.045 509 0.007
2009 Total -- -- 2.359 65.640 10.865 0.072 0.736 0.436 7,237 0.601Notes:1. Onsite diesel-fueled vehicle emissions were included with the stationary source combustion calculations.2. Assumed percentage of employees that carpool: 20%3. Assumed the number of employees for 2035 operation remains the same should operation begin in 2009.
Vehicle Emission Factors
ROG CO NOx SOx PM10 2 PM2.5
2 CO2 CH4
Operational Year 2009
Passenger 1 0.114 3.364 0.351 0.004 0.035 0.020 348.405 0.031Delivery Truck 1 0.169 0.698 4.227 0.005 0.068 0.047 526.835 0.008
Notes:
2. Emission factors for PM10 and PM2.5 include contributions from exhaust, brake-wear, and tire-wear.
Vehicle Type
1. Emission factors are from EMFAC2007 (Version 2.3) for passenger vehicles (50% LDA-All and 50% of the average of LDT1-All and LDT2-All) and delivery trucks (average of LHD1-DSL and LHD2-DSL) traveling at 35 mph.
Vehicle Emission Factor (g/mile)
Emissions (tpy)
Emission Source 1Number of Round
Trips per Day
Round Trip Distance (miles)
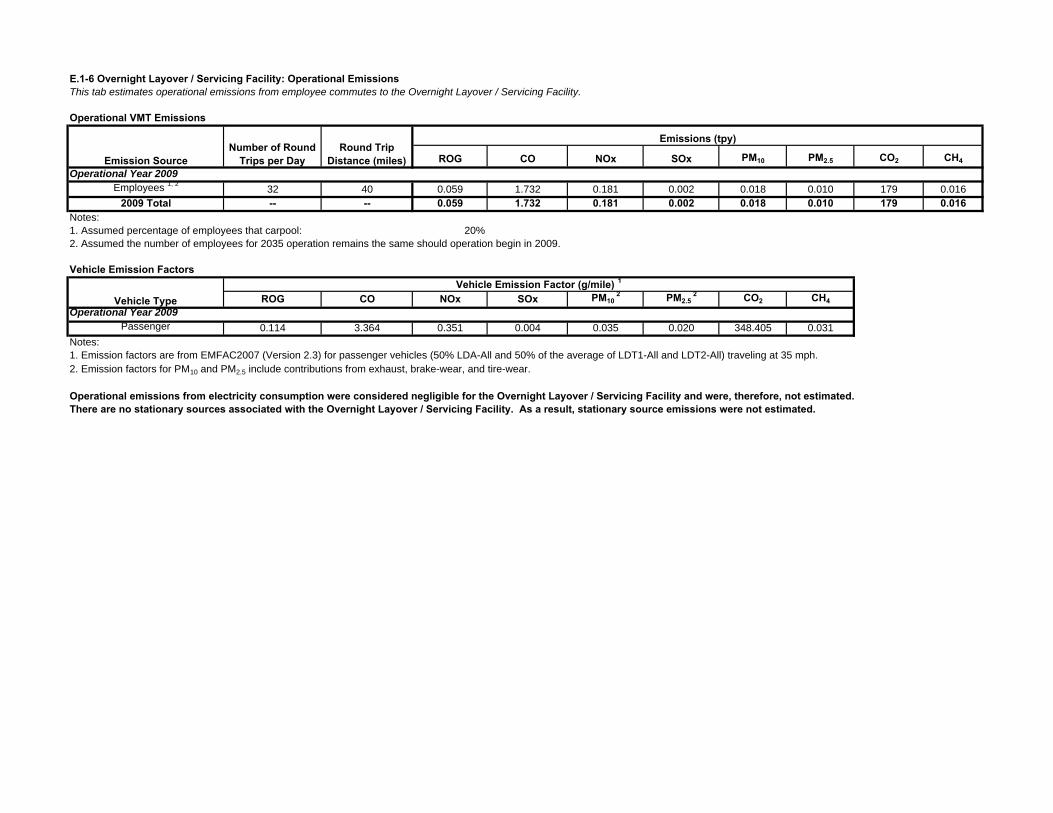
E.1-6 Overnight Layover / Servicing Facility: Operational EmissionsThis tab estimates operational emissions from employee commutes to the Overnight Layover / Servicing Facility.
Operational VMT Emissions
ROG CO NOx SOx PM10 PM2.5 CO2 CH4
Operational Year 2009Employees 1, 2
32 40 0.059 1.732 0.181 0.002 0.018 0.010 179 0.0162009 Total -- -- 0.059 1.732 0.181 0.002 0.018 0.010 179 0.016
Notes:1. Assumed percentage of employees that carpool: 20%2. Assumed the number of employees for 2035 operation remains the same should operation begin in 2009.
Vehicle Emission Factors
ROG CO NOx SOx PM10 2 PM2.5
2 CO2 CH4
Operational Year 2009Passenger 0.114 3.364 0.351 0.004 0.035 0.020 348.405 0.031
Notes:
2. Emission factors for PM10 and PM2.5 include contributions from exhaust, brake-wear, and tire-wear.
Operational emissions from electricity consumption were considered negligible for the Overnight Layover / Servicing Facility and were, therefore, not estimated.There are no stationary sources associated with the Overnight Layover / Servicing Facility. As a result, stationary source emissions were not estimated.
Emissions (tpy)
Vehicle TypeVehicle Emission Factor (g/mile) 1
1. Emission factors are from EMFAC2007 (Version 2.3) for passenger vehicles (50% LDA-All and 50% of the average of LDT1-All and LDT2-All) traveling at 35 mph.
Emission SourceNumber of Round
Trips per DayRound Trip
Distance (miles)
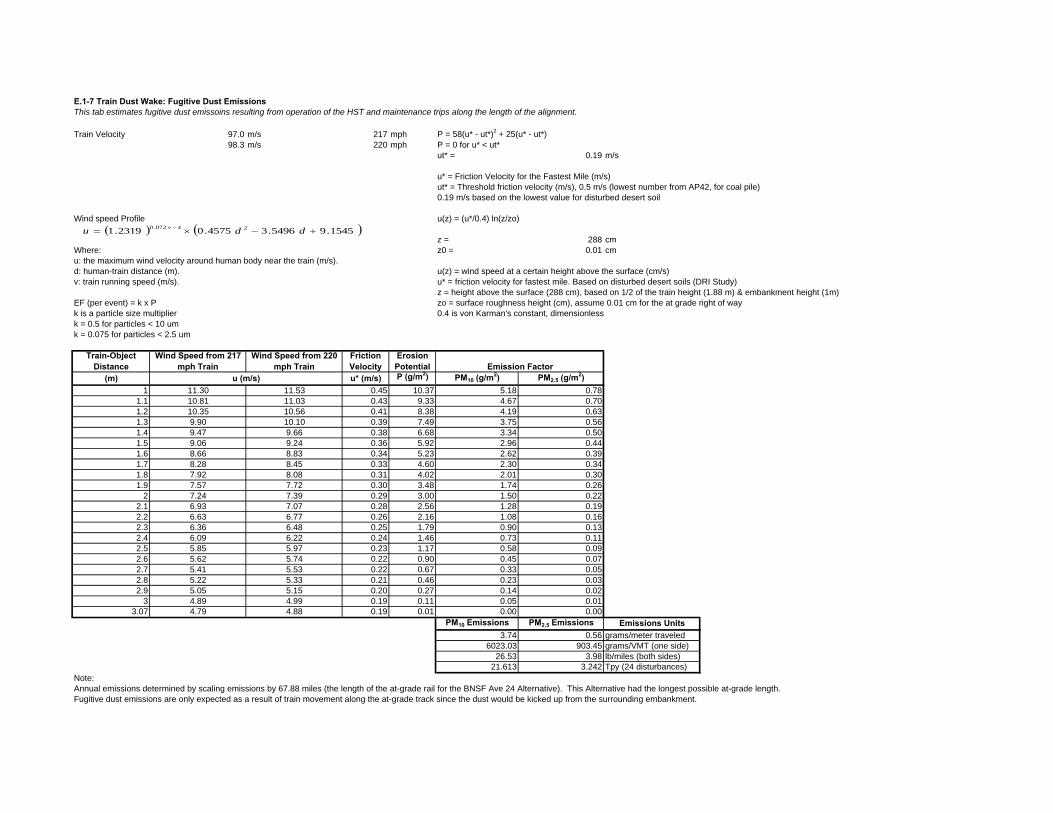
E.1-7 Train Dust Wake: Fugitive Dust EmissionsThis tab estimates fugitive dust emissoins resulting from operation of the HST and maintenance trips along the length of the alignment.
Train Velocity 97.0 m/s 217 mph P = 58(u* - ut*)2 + 25(u* - ut*)98.3 m/s 220 mph P = 0 for u* < ut*
ut* = 0.19 m/s
u* = Friction Velocity for the Fastest Mile (m/s)ut* = Threshold friction velocity (m/s), 0.5 m/s (lowest number from AP42, for coal pile)0.19 m/s based on the lowest value for disturbed desert soil
Wind speed Profile u(z) = (u*/0.4) ln(z/zo)
z = 288 cmWhere: z0 = 0.01 cmu: the maximum wind velocity around human body near the train (m/s).d: human-train distance (m). u(z) = wind speed at a certain height above the surface (cm/s)v: train running speed (m/s). u* = friction velocity for fastest mile. Based on disturbed desert soils (DRI Study)
z = height above the surface (288 cm), based on 1/2 of the train height (1.88 m) & embankment height (1m)EF (per event) = k x P zo = surface roughness height (cm), assume 0.01 cm for the at grade right of wayk is a particle size multiplier 0.4 is von Karman's constant, dimensionlessk = 0.5 for particles < 10 umk = 0.075 for particles < 2.5 um
Train-Object Distance
Wind Speed from 217 mph Train
Wind Speed from 220 mph Train
Friction Velocity
Erosion Potential
(m) u* (m/s) P (g/m2) PM10 (g/m2) PM2.5 (g/m2)1 11.30 11.53 0.45 10.37 5.18 0.78
1.1 10.81 11.03 0.43 9.33 4.67 0.701.2 10.35 10.56 0.41 8.38 4.19 0.631.3 9.90 10.10 0.39 7.49 3.75 0.561.4 9.47 9.66 0.38 6.68 3.34 0.501.5 9.06 9.24 0.36 5.92 2.96 0.441.6 8.66 8.83 0.34 5.23 2.62 0.391.7 8.28 8.45 0.33 4.60 2.30 0.341.8 7.92 8.08 0.31 4.02 2.01 0.301.9 7.57 7.72 0.30 3.48 1.74 0.26
2 7.24 7.39 0.29 3.00 1.50 0.222.1 6.93 7.07 0.28 2.56 1.28 0.192.2 6.63 6.77 0.26 2.16 1.08 0.162.3 6.36 6.48 0.25 1.79 0.90 0.132.4 6.09 6.22 0.24 1.46 0.73 0.112.5 5.85 5.97 0.23 1.17 0.58 0.092.6 5.62 5.74 0.22 0.90 0.45 0.072.7 5.41 5.53 0.22 0.67 0.33 0.052.8 5.22 5.33 0.21 0.46 0.23 0.032.9 5.05 5.15 0.20 0.27 0.14 0.02
3 4.89 4.99 0.19 0.11 0.05 0.013.07 4.79 4.88 0.19 0.01 0.00 0.00
PM10 Emissions PM2.5 Emissions Emissions Units3.74 0.56 grams/meter traveled
6023.03 903.45 grams/VMT (one side)26.53 3.98 lb/miles (both sides)
21.613 3.242 Tpy (24 disturbances)Note: Annual emissions determined by scaling emissions by 67.88 miles (the length of the at-grade rail for the BNSF Ave 24 Alternative). This Alternative had the longest possible at-grade length.Fugitive dust emissions are only expected as a result of train movement along the at-grade track since the dust would be kicked up from the surrounding embankment.
Emission Factoru (m/s)
1545.95496.34575.02319.1 24072.0 ddu v
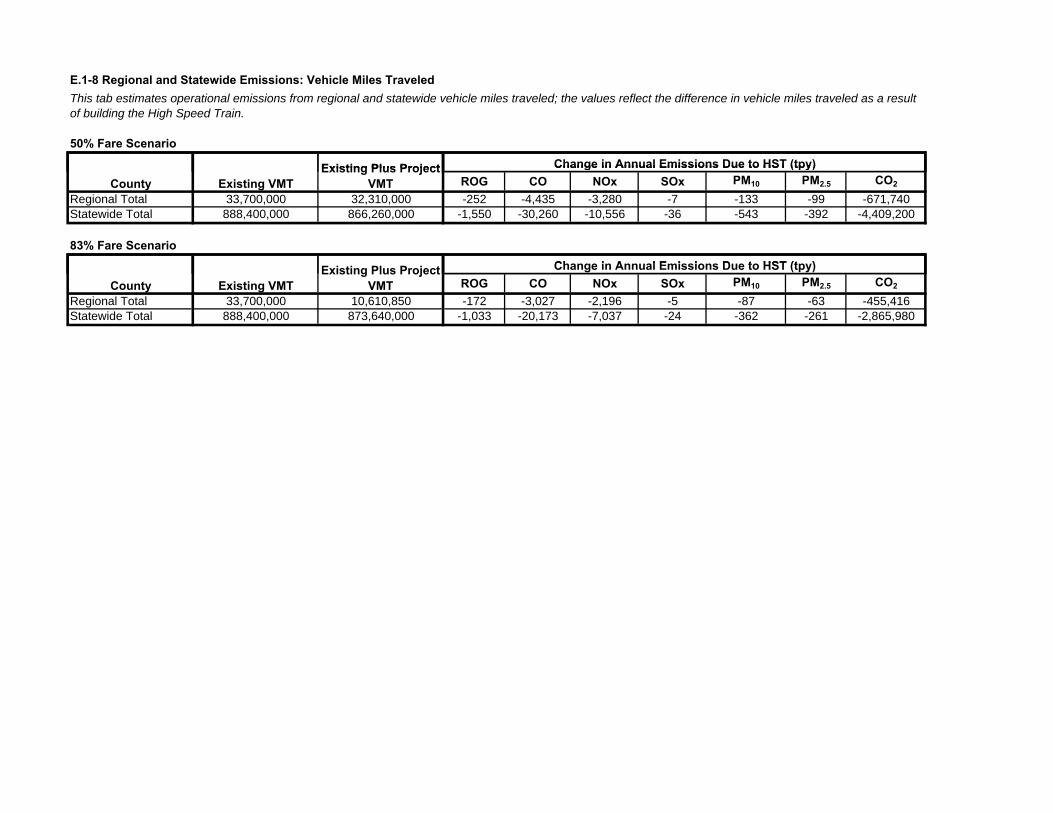
E.1-8 Regional and Statewide Emissions: Vehicle Miles Traveled
50% Fare Scenario
This tab estimates operational emissions from regional and statewide vehicle miles traveled; the values reflect the difference in vehicle miles traveled as a result of building the High Speed Train.
Existing Plus Project Change in Annual Emissions Due to HST (tpy)ROG CO NOx SOx PM10 PM2.5 CO2
Regional Total 33,700,000 32,310,000 -252 -4,435 -3,280 -7 -133 -99 -671,740Statewide Total 888,400,000 866,260,000 -1,550 -30,260 -10,556 -36 -543 -392 -4,409,200
83% Fare ScenarioCh i A l E i i D t HST (t )
Existing VMTExisting Plus Project
VMTChange in Annual Emissions Due to HST (tpy)
County
ROG CO NOx SOx PM10 PM2.5 CO2
Regional Total 33,700,000 10,610,850 -172 -3,027 -2,196 -5 -87 -63 -455,416Statewide Total 888,400,000 873,640,000 -1,033 -20,173 -7,037 -24 -362 -261 -2,865,980
County Existing VMTExisting Plus Project
VMTChange in Annual Emissions Due to HST (tpy)
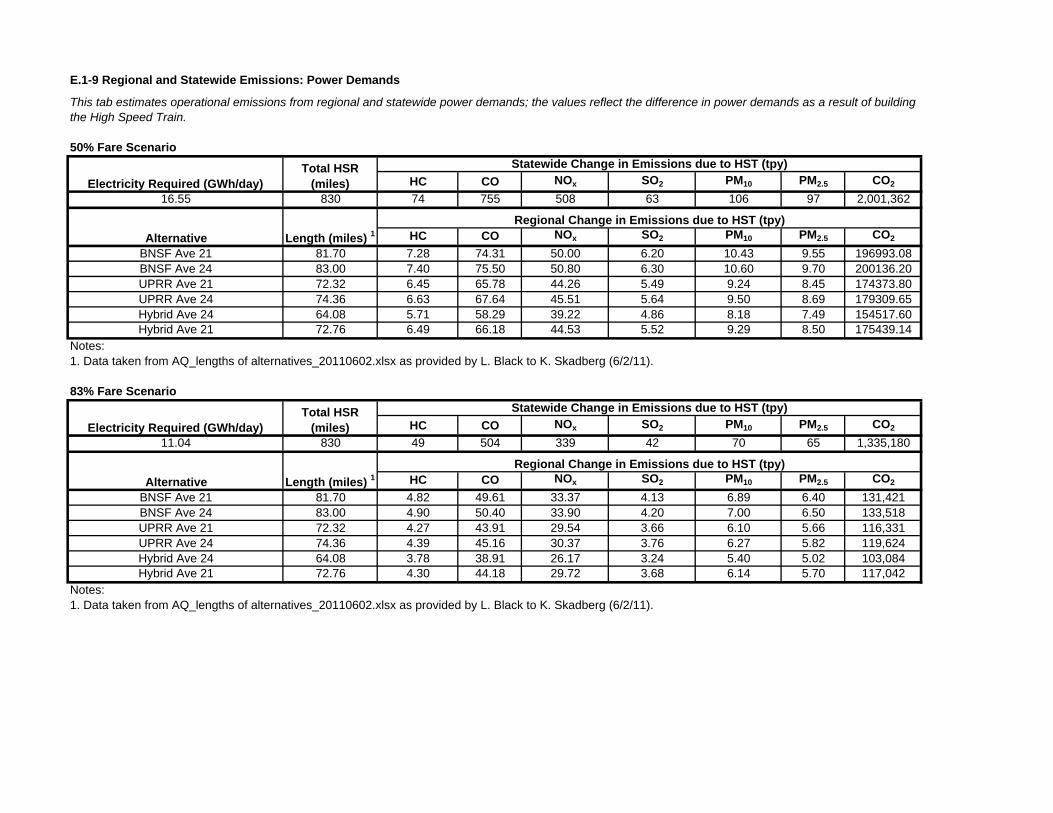
E.1-9 Regional and Statewide Emissions: Power Demands
50% Fare Scenario
HC CO NOx SO2 PM10 PM2.5 CO2
16.55 830 74 755 508 63 106 97 2,001,362
HC CO NOx SO2 PM10 PM2.5 CO2
BNSF Ave 21 81.70 7.28 74.31 50.00 6.20 10.43 9.55 196993.08BNSF Ave 24 83.00 7.40 75.50 50.80 6.30 10.60 9.70 200136.20UPRR Ave 21 72.32 6.45 65.78 44.26 5.49 9.24 8.45 174373.80UPRR Ave 24 74.36 6.63 67.64 45.51 5.64 9.50 8.69 179309.65Hybrid Ave 24 64.08 5.71 58.29 39.22 4.86 8.18 7.49 154517.60Hybrid Ave 21 72.76 6.49 66.18 44.53 5.52 9.29 8.50 175439.14
Notes:1. Data taken from AQ_lengths of alternatives_20110602.xlsx as provided by L. Black to K. Skadberg (6/2/11).
83% Fare Scenario
HC CO NOx SO2 PM10 PM2.5 CO2
11.04 830 49 504 339 42 70 65 1,335,180
HC CO NOx SO2 PM10 PM2.5 CO2
BNSF Ave 21 81.70 4.82 49.61 33.37 4.13 6.89 6.40 131,421BNSF Ave 24 83.00 4.90 50.40 33.90 4.20 7.00 6.50 133,518UPRR Ave 21 72.32 4.27 43.91 29.54 3.66 6.10 5.66 116,331UPRR Ave 24 74.36 4.39 45.16 30.37 3.76 6.27 5.82 119,624Hybrid Ave 24 64.08 3.78 38.91 26.17 3.24 5.40 5.02 103,084Hybrid Ave 21 72.76 4.30 44.18 29.72 3.68 6.14 5.70 117,042
Notes:1. Data taken from AQ_lengths of alternatives_20110602.xlsx as provided by L. Black to K. Skadberg (6/2/11).
Alternative Length (miles) 1Regional Change in Emissions due to HST (tpy)
This tab estimates operational emissions from regional and statewide power demands; the values reflect the difference in power demands as a result of building the High Speed Train.
Total HSR (miles)Electricity Required (GWh/day)
Statewide Change in Emissions due to HST (tpy)
Regional Change in Emissions due to HST (tpy)
Alternative Length (miles) 1
Electricity Required (GWh/day)Total HSR
(miles)
Statewide Change in Emissions due to HST (tpy)

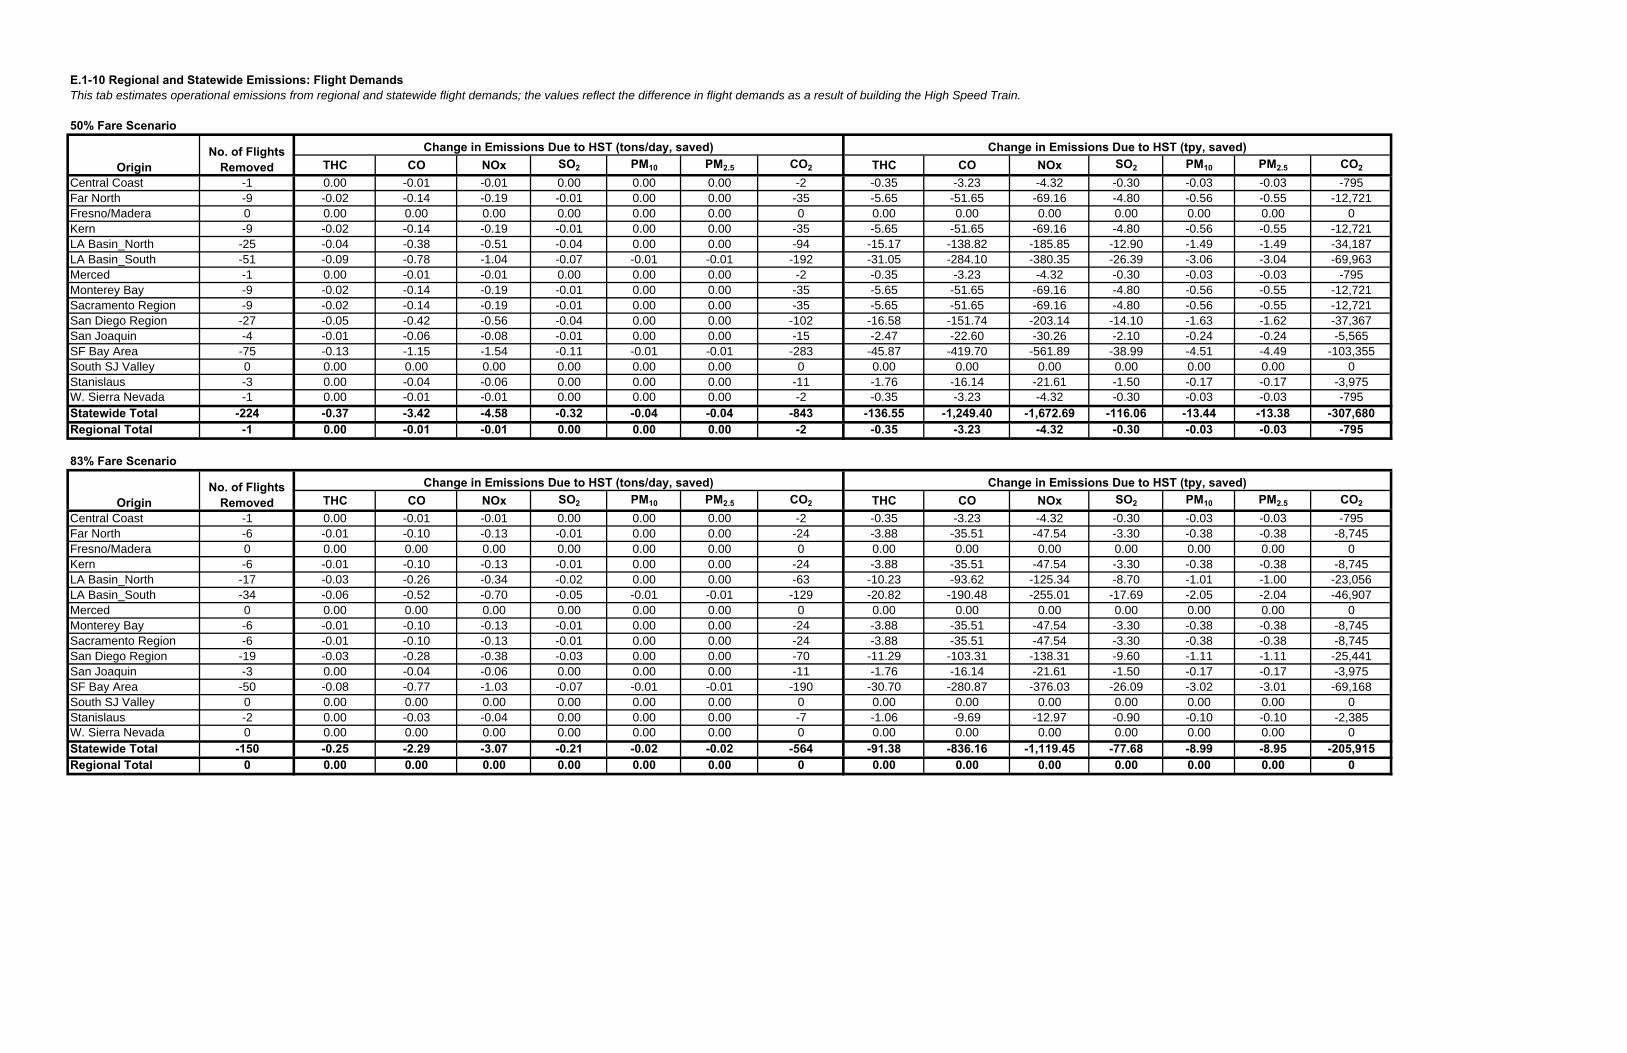
E.1-10 Regional and Statewide Emissions: Flight DemandsThis tab estimates operational emissions from regional and statewide flight demands; the values reflect the difference in flight demands as a result of building the High Speed Train.
50% Fare Scenario
THC CO NOx SO2 PM10 PM2.5 CO2 THC CO NOx SO2 PM10 PM2.5 CO2
Central Coast -1 0.00 -0.01 -0.01 0.00 0.00 0.00 -2 -0.35 -3.23 -4.32 -0.30 -0.03 -0.03 -795Far North -9 -0.02 -0.14 -0.19 -0.01 0.00 0.00 -35 -5.65 -51.65 -69.16 -4.80 -0.56 -0.55 -12,721Fresno/Madera 0 0.00 0.00 0.00 0.00 0.00 0.00 0 0.00 0.00 0.00 0.00 0.00 0.00 0Kern -9 -0.02 -0.14 -0.19 -0.01 0.00 0.00 -35 -5.65 -51.65 -69.16 -4.80 -0.56 -0.55 -12,721LA Basin_North -25 -0.04 -0.38 -0.51 -0.04 0.00 0.00 -94 -15.17 -138.82 -185.85 -12.90 -1.49 -1.49 -34,187LA Basin_South -51 -0.09 -0.78 -1.04 -0.07 -0.01 -0.01 -192 -31.05 -284.10 -380.35 -26.39 -3.06 -3.04 -69,963Merced -1 0.00 -0.01 -0.01 0.00 0.00 0.00 -2 -0.35 -3.23 -4.32 -0.30 -0.03 -0.03 -795Monterey Bay -9 -0.02 -0.14 -0.19 -0.01 0.00 0.00 -35 -5.65 -51.65 -69.16 -4.80 -0.56 -0.55 -12,721Sacramento Region -9 -0.02 -0.14 -0.19 -0.01 0.00 0.00 -35 -5.65 -51.65 -69.16 -4.80 -0.56 -0.55 -12,721San Diego Region -27 -0.05 -0.42 -0.56 -0.04 0.00 0.00 -102 -16.58 -151.74 -203.14 -14.10 -1.63 -1.62 -37,367San Joaquin -4 -0.01 -0.06 -0.08 -0.01 0.00 0.00 -15 -2.47 -22.60 -30.26 -2.10 -0.24 -0.24 -5,565SF Bay Area -75 -0.13 -1.15 -1.54 -0.11 -0.01 -0.01 -283 -45.87 -419.70 -561.89 -38.99 -4.51 -4.49 -103,355South SJ Valley 0 0.00 0.00 0.00 0.00 0.00 0.00 0 0.00 0.00 0.00 0.00 0.00 0.00 0Stanislaus -3 0.00 -0.04 -0.06 0.00 0.00 0.00 -11 -1.76 -16.14 -21.61 -1.50 -0.17 -0.17 -3,975W. Sierra Nevada -1 0.00 -0.01 -0.01 0.00 0.00 0.00 -2 -0.35 -3.23 -4.32 -0.30 -0.03 -0.03 -795Statewide Total -224 -0.37 -3.42 -4.58 -0.32 -0.04 -0.04 -843 -136.55 -1,249.40 -1,672.69 -116.06 -13.44 -13.38 -307,680Regional Total -1 0.00 -0.01 -0.01 0.00 0.00 0.00 -2 -0.35 -3.23 -4.32 -0.30 -0.03 -0.03 -795
83% Fare Scenario
THC CO NOx SO2 PM10 PM2.5 CO2 THC CO NOx SO2 PM10 PM2.5 CO2
Central Coast -1 0.00 -0.01 -0.01 0.00 0.00 0.00 -2 -0.35 -3.23 -4.32 -0.30 -0.03 -0.03 -795Far North -6 -0.01 -0.10 -0.13 -0.01 0.00 0.00 -24 -3.88 -35.51 -47.54 -3.30 -0.38 -0.38 -8,745Fresno/Madera 0 0.00 0.00 0.00 0.00 0.00 0.00 0 0.00 0.00 0.00 0.00 0.00 0.00 0Kern -6 -0.01 -0.10 -0.13 -0.01 0.00 0.00 -24 -3.88 -35.51 -47.54 -3.30 -0.38 -0.38 -8,745LA Basin_North -17 -0.03 -0.26 -0.34 -0.02 0.00 0.00 -63 -10.23 -93.62 -125.34 -8.70 -1.01 -1.00 -23,056LA Basin_South -34 -0.06 -0.52 -0.70 -0.05 -0.01 -0.01 -129 -20.82 -190.48 -255.01 -17.69 -2.05 -2.04 -46,907Merced 0 0.00 0.00 0.00 0.00 0.00 0.00 0 0.00 0.00 0.00 0.00 0.00 0.00 0Monterey Bay -6 -0.01 -0.10 -0.13 -0.01 0.00 0.00 -24 -3.88 -35.51 -47.54 -3.30 -0.38 -0.38 -8,745Sacramento Region -6 -0.01 -0.10 -0.13 -0.01 0.00 0.00 -24 -3.88 -35.51 -47.54 -3.30 -0.38 -0.38 -8,745San Diego Region -19 -0.03 -0.28 -0.38 -0.03 0.00 0.00 -70 -11.29 -103.31 -138.31 -9.60 -1.11 -1.11 -25,441San Joaquin -3 0.00 -0.04 -0.06 0.00 0.00 0.00 -11 -1.76 -16.14 -21.61 -1.50 -0.17 -0.17 -3,975SF Bay Area -50 -0.08 -0.77 -1.03 -0.07 -0.01 -0.01 -190 -30.70 -280.87 -376.03 -26.09 -3.02 -3.01 -69,168South SJ Valley 0 0.00 0.00 0.00 0.00 0.00 0.00 0 0.00 0.00 0.00 0.00 0.00 0.00 0Stanislaus -2 0.00 -0.03 -0.04 0.00 0.00 0.00 -7 -1.06 -9.69 -12.97 -0.90 -0.10 -0.10 -2,385W. Sierra Nevada 0 0.00 0.00 0.00 0.00 0.00 0.00 0 0.00 0.00 0.00 0.00 0.00 0.00 0Statewide Total -150 -0.25 -2.29 -3.07 -0.21 -0.02 -0.02 -564 -91.38 -836.16 -1,119.45 -77.68 -8.99 -8.95 -205,915Regional Total 0 0.00 0.00 0.00 0.00 0.00 0.00 0 0.00 0.00 0.00 0.00 0.00 0.00 0
OriginNo. of Flights
RemovedChange in Emissions Due to HST (tons/day, saved) Change in Emissions Due to HST (tpy, saved)
OriginNo. of Flights
RemovedChange in Emissions Due to HST (tons/day, saved) Change in Emissions Due to HST (tpy, saved)

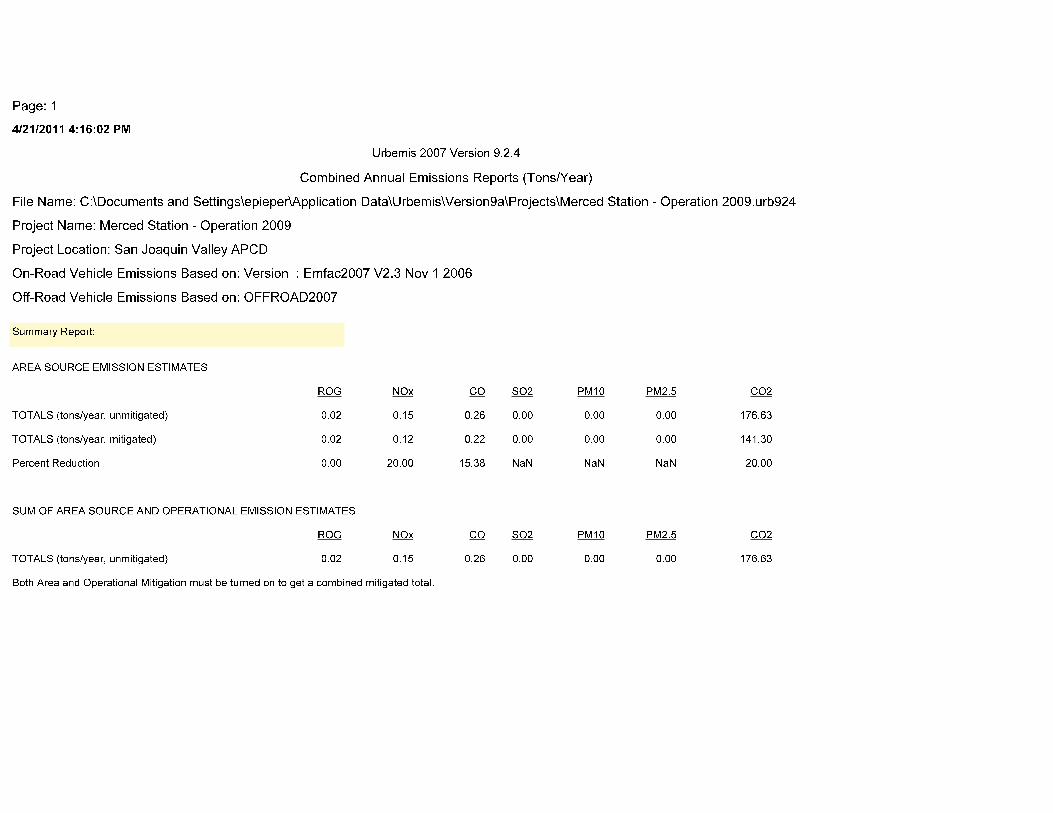
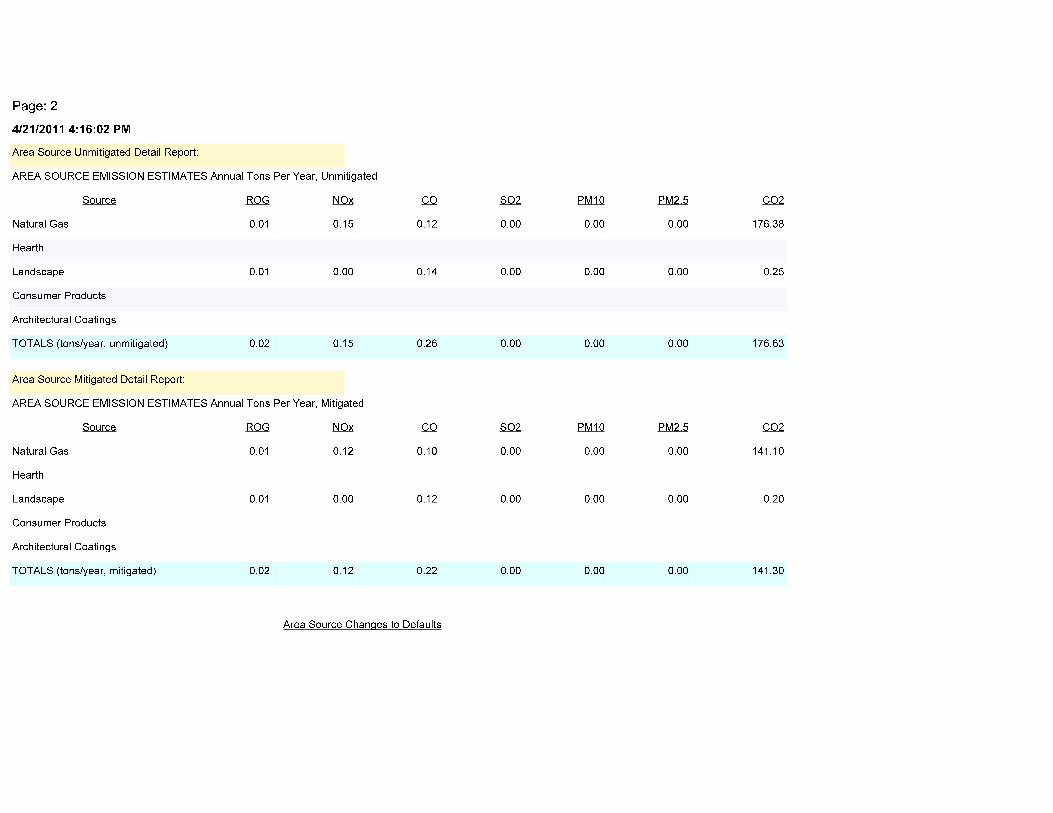
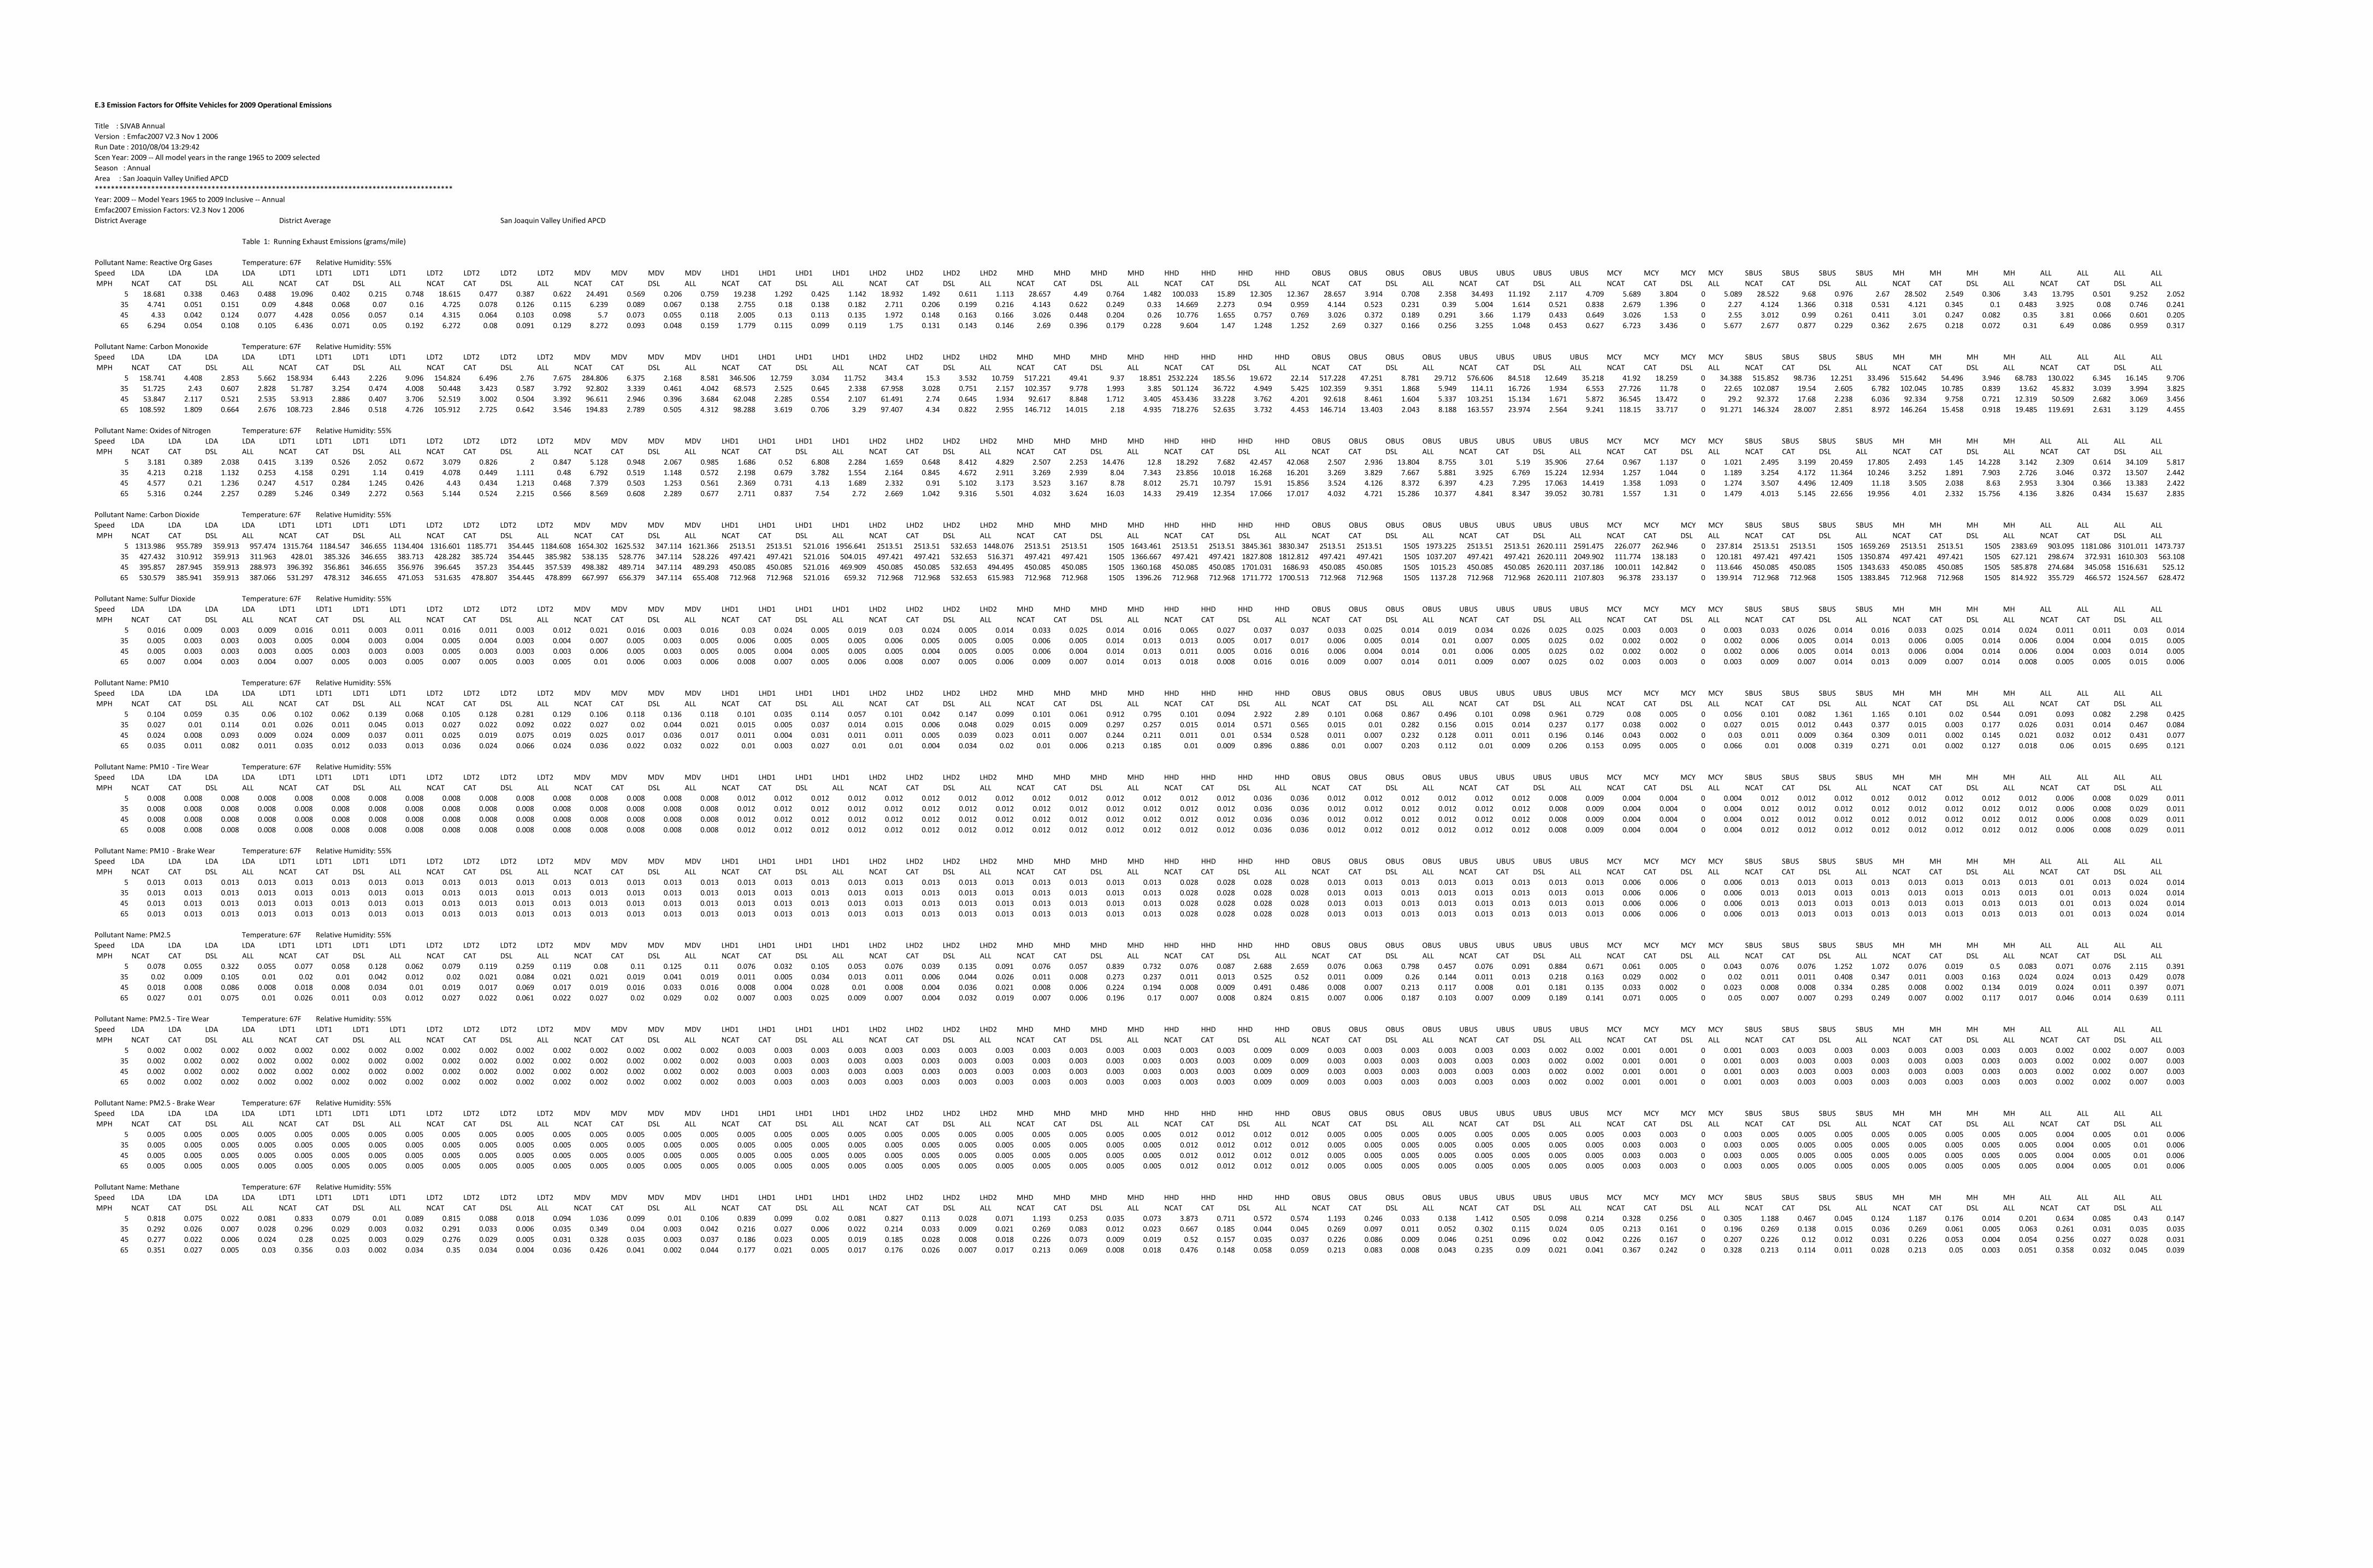
E.3 Emission Factors for Offsite Vehicles for 2009 Operational Emissions
Title : SJVAB Annual Version : Emfac2007 V2.3 Nov 1 2006Run Date : 2010/08/04 13:29:42Scen Year: 2009 -- All model years in the range 1965 to 2009 selectedSeason : AnnualArea : San Joaquin Valley Unified APCD*****************************************************************************************Year: 2009 -- Model Years 1965 to 2009 Inclusive -- AnnualEmfac2007 Emission Factors: V2.3 Nov 1 2006District Average District Average San Joaquin Valley Unified APCD
Table 1: Running Exhaust Emissions (grams/mile)
Pollutant Name: Reactive Org Gases Temperature: 67F Relative Humidity: 55%Speed LDA LDA LDA LDA LDT1 LDT1 LDT1 LDT1 LDT2 LDT2 LDT2 LDT2 MDV MDV MDV MDV LHD1 LHD1 LHD1 LHD1 LHD2 LHD2 LHD2 LHD2 MHD MHD MHD MHD HHD HHD HHD HHD OBUS OBUS OBUS OBUS UBUS UBUS UBUS UBUS MCY MCY MCY MCY SBUS SBUS SBUS SBUS MH MH MH MH ALL ALL ALL ALL MPH NCAT CAT DSL ALL NCAT CAT DSL ALL NCAT CAT DSL ALL NCAT CAT DSL ALL NCAT CAT DSL ALL NCAT CAT DSL ALL NCAT CAT DSL ALL NCAT CAT DSL ALL NCAT CAT DSL ALL NCAT CAT DSL ALL NCAT CAT DSL ALL NCAT CAT DSL ALL NCAT CAT DSL ALL NCAT CAT DSL ALL
5 18.681 0.338 0.463 0.488 19.096 0.402 0.215 0.748 18.615 0.477 0.387 0.622 24.491 0.569 0.206 0.759 19.238 1.292 0.425 1.142 18.932 1.492 0.611 1.113 28.657 4.49 0.764 1.482 100.033 15.89 12.305 12.367 28.657 3.914 0.708 2.358 34.493 11.192 2.117 4.709 5.689 3.804 0 5.089 28.522 9.68 0.976 2.67 28.502 2.549 0.306 3.43 13.795 0.501 9.252 2.05235 4.741 0.051 0.151 0.09 4.848 0.068 0.07 0.16 4.725 0.078 0.126 0.115 6.239 0.089 0.067 0.138 2.755 0.18 0.138 0.182 2.711 0.206 0.199 0.216 4.143 0.622 0.249 0.33 14.669 2.273 0.94 0.959 4.144 0.523 0.231 0.39 5.004 1.614 0.521 0.838 2.679 1.396 0 2.27 4.124 1.366 0.318 0.531 4.121 0.345 0.1 0.483 3.925 0.08 0.746 0.24145 4.33 0.042 0.124 0.077 4.428 0.056 0.057 0.14 4.315 0.064 0.103 0.098 5.7 0.073 0.055 0.118 2.005 0.13 0.113 0.135 1.972 0.148 0.163 0.166 3.026 0.448 0.204 0.26 10.776 1.655 0.757 0.769 3.026 0.372 0.189 0.291 3.66 1.179 0.433 0.649 3.026 1.53 0 2.55 3.012 0.99 0.261 0.411 3.01 0.247 0.082 0.35 3.81 0.066 0.601 0.20565 6.294 0.054 0.108 0.105 6.436 0.071 0.05 0.192 6.272 0.08 0.091 0.129 8.272 0.093 0.048 0.159 1.779 0.115 0.099 0.119 1.75 0.131 0.143 0.146 2.69 0.396 0.179 0.228 9.604 1.47 1.248 1.252 2.69 0.327 0.166 0.256 3.255 1.048 0.453 0.627 6.723 3.436 0 5.677 2.677 0.877 0.229 0.362 2.675 0.218 0.072 0.31 6.49 0.086 0.959 0.317
Pollutant Name: Carbon Monoxide Temperature: 67F Relative Humidity: 55%Speed LDA LDA LDA LDA LDT1 LDT1 LDT1 LDT1 LDT2 LDT2 LDT2 LDT2 MDV MDV MDV MDV LHD1 LHD1 LHD1 LHD1 LHD2 LHD2 LHD2 LHD2 MHD MHD MHD MHD HHD HHD HHD HHD OBUS OBUS OBUS OBUS UBUS UBUS UBUS UBUS MCY MCY MCY MCY SBUS SBUS SBUS SBUS MH MH MH MH ALL ALL ALL ALL MPH NCAT CAT DSL ALL NCAT CAT DSL ALL NCAT CAT DSL ALL NCAT CAT DSL ALL NCAT CAT DSL ALL NCAT CAT DSL ALL NCAT CAT DSL ALL NCAT CAT DSL ALL NCAT CAT DSL ALL NCAT CAT DSL ALL NCAT CAT DSL ALL NCAT CAT DSL ALL NCAT CAT DSL ALL NCAT CAT DSL ALL
5 158.741 4.408 2.853 5.662 158.934 6.443 2.226 9.096 154.824 6.496 2.76 7.675 284.806 6.375 2.168 8.581 346.506 12.759 3.034 11.752 343.4 15.3 3.532 10.759 517.221 49.41 9.37 18.851 2532.224 185.56 19.672 22.14 517.228 47.251 8.781 29.712 576.606 84.518 12.649 35.218 41.92 18.259 0 34.388 515.852 98.736 12.251 33.496 515.642 54.496 3.946 68.783 130.022 6.345 16.145 9.70635 51.725 2.43 0.607 2.828 51.787 3.254 0.474 4.008 50.448 3.423 0.587 3.792 92.802 3.339 0.461 4.042 68.573 2.525 0.645 2.338 67.958 3.028 0.751 2.157 102.357 9.778 1.993 3.85 501.124 36.722 4.949 5.425 102.359 9.351 1.868 5.949 114.11 16.726 1.934 6.553 27.726 11.78 0 22.65 102.087 19.54 2.605 6.782 102.045 10.785 0.839 13.62 45.832 3.039 3.994 3.82545 53.847 2.117 0.521 2.535 53.913 2.886 0.407 3.706 52.519 3.002 0.504 3.392 96.611 2.946 0.396 3.684 62.048 2.285 0.554 2.107 61.491 2.74 0.645 1.934 92.617 8.848 1.712 3.405 453.436 33.228 3.762 4.201 92.618 8.461 1.604 5.337 103.251 15.134 1.671 5.872 36.545 13.472 0 29.2 92.372 17.68 2.238 6.036 92.334 9.758 0.721 12.319 50.509 2.682 3.069 3.45665 108.592 1.809 0.664 2.676 108.723 2.846 0.518 4.726 105.912 2.725 0.642 3.546 194.83 2.789 0.505 4.312 98.288 3.619 0.706 3.29 97.407 4.34 0.822 2.955 146.712 14.015 2.18 4.935 718.276 52.635 3.732 4.453 146.714 13.403 2.043 8.188 163.557 23.974 2.564 9.241 118.15 33.717 0 91.271 146.324 28.007 2.851 8.972 146.264 15.458 0.918 19.485 119.691 2.631 3.129 4.455
Pollutant Name: Oxides of Nitrogen Temperature: 67F Relative Humidity: 55%Speed LDA LDA LDA LDA LDT1 LDT1 LDT1 LDT1 LDT2 LDT2 LDT2 LDT2 MDV MDV MDV MDV LHD1 LHD1 LHD1 LHD1 LHD2 LHD2 LHD2 LHD2 MHD MHD MHD MHD HHD HHD HHD HHD OBUS OBUS OBUS OBUS UBUS UBUS UBUS UBUS MCY MCY MCY MCY SBUS SBUS SBUS SBUS MH MH MH MH ALL ALL ALL ALL MPH NCAT CAT DSL ALL NCAT CAT DSL ALL NCAT CAT DSL ALL NCAT CAT DSL ALL NCAT CAT DSL ALL NCAT CAT DSL ALL NCAT CAT DSL ALL NCAT CAT DSL ALL NCAT CAT DSL ALL NCAT CAT DSL ALL NCAT CAT DSL ALL NCAT CAT DSL ALL NCAT CAT DSL ALL NCAT CAT DSL ALL
5 3.181 0.389 2.038 0.415 3.139 0.526 2.052 0.672 3.079 0.826 2 0.847 5.128 0.948 2.067 0.985 1.686 0.52 6.808 2.284 1.659 0.648 8.412 4.829 2.507 2.253 14.476 12.8 18.292 7.682 42.457 42.068 2.507 2.936 13.804 8.755 3.01 5.19 35.906 27.64 0.967 1.137 0 1.021 2.495 3.199 20.459 17.805 2.493 1.45 14.228 3.142 2.309 0.614 34.109 5.81735 4.213 0.218 1.132 0.253 4.158 0.291 1.14 0.419 4.078 0.449 1.111 0.48 6.792 0.519 1.148 0.572 2.198 0.679 3.782 1.554 2.164 0.845 4.672 2.911 3.269 2.939 8.04 7.343 23.856 10.018 16.268 16.201 3.269 3.829 7.667 5.881 3.925 6.769 15.224 12.934 1.257 1.044 0 1.189 3.254 4.172 11.364 10.246 3.252 1.891 7.903 2.726 3.046 0.372 13.507 2.44245 4.577 0.21 1.236 0.247 4.517 0.284 1.245 0.426 4.43 0.434 1.213 0.468 7.379 0.503 1.253 0.561 2.369 0.731 4.13 1.689 2.332 0.91 5.102 3.173 3.523 3.167 8.78 8.012 25.71 10.797 15.91 15.856 3.524 4.126 8.372 6.397 4.23 7.295 17.063 14.419 1.358 1.093 0 1.274 3.507 4.496 12.409 11.18 3.505 2.038 8.63 2.953 3.304 0.366 13.383 2.42265 5.316 0.244 2.257 0.289 5.246 0.349 2.272 0.563 5.144 0.524 2.215 0.566 8.569 0.608 2.289 0.677 2.711 0.837 7.54 2.72 2.669 1.042 9.316 5.501 4.032 3.624 16.03 14.33 29.419 12.354 17.066 17.017 4.032 4.721 15.286 10.377 4.841 8.347 39.052 30.781 1.557 1.31 0 1.479 4.013 5.145 22.656 19.956 4.01 2.332 15.756 4.136 3.826 0.434 15.637 2.835
Pollutant Name: Carbon Dioxide Temperature: 67F Relative Humidity: 55%Speed LDA LDA LDA LDA LDT1 LDT1 LDT1 LDT1 LDT2 LDT2 LDT2 LDT2 MDV MDV MDV MDV LHD1 LHD1 LHD1 LHD1 LHD2 LHD2 LHD2 LHD2 MHD MHD MHD MHD HHD HHD HHD HHD OBUS OBUS OBUS OBUS UBUS UBUS UBUS UBUS MCY MCY MCY MCY SBUS SBUS SBUS SBUS MH MH MH MH ALL ALL ALL ALL MPH NCAT CAT DSL ALL NCAT CAT DSL ALL NCAT CAT DSL ALL NCAT CAT DSL ALL NCAT CAT DSL ALL NCAT CAT DSL ALL NCAT CAT DSL ALL NCAT CAT DSL ALL NCAT CAT DSL ALL NCAT CAT DSL ALL NCAT CAT DSL ALL NCAT CAT DSL ALL NCAT CAT DSL ALL NCAT CAT DSL ALL
5 1313.986 955.789 359.913 957.474 1315.764 1184.547 346.655 1134.404 1316.601 1185.771 354.445 1184.608 1654.302 1625.532 347.114 1621.366 2513.51 2513.51 521.016 1956.641 2513.51 2513.51 532.653 1448.076 2513.51 2513.51 1505 1643.461 2513.51 2513.51 3845.361 3830.347 2513.51 2513.51 1505 1973.225 2513.51 2513.51 2620.111 2591.475 226.077 262.946 0 237.814 2513.51 2513.51 1505 1659.269 2513.51 2513.51 1505 2383.69 903.095 1181.086 3101.011 1473.73735 427.432 310.912 359.913 311.963 428.01 385.326 346.655 383.713 428.282 385.724 354.445 385.982 538.135 528.776 347.114 528.226 497.421 497.421 521.016 504.015 497.421 497.421 532.653 516.371 497.421 497.421 1505 1366.667 497.421 497.421 1827.808 1812.812 497.421 497.421 1505 1037.207 497.421 497.421 2620.111 2049.902 111.774 138.183 0 120.181 497.421 497.421 1505 1350.874 497.421 497.421 1505 627.121 298.674 372.931 1610.303 563.10845 395.857 287.945 359.913 288.973 396.392 356.861 346.655 356.976 396.645 357.23 354.445 357.539 498.382 489.714 347.114 489.293 450.085 450.085 521.016 469.909 450.085 450.085 532.653 494.495 450.085 450.085 1505 1360.168 450.085 450.085 1701.031 1686.93 450.085 450.085 1505 1015.23 450.085 450.085 2620.111 2037.186 100.011 142.842 0 113.646 450.085 450.085 1505 1343.633 450.085 450.085 1505 585.878 274.684 345.058 1516.631 525.1265 530.579 385.941 359.913 387.066 531.297 478.312 346.655 471.053 531.635 478.807 354.445 478.899 667.997 656.379 347.114 655.408 712.968 712.968 521.016 659.32 712.968 712.968 532.653 615.983 712.968 712.968 1505 1396.26 712.968 712.968 1711.772 1700.513 712.968 712.968 1505 1137.28 712.968 712.968 2620.111 2107.803 96.378 233.137 0 139.914 712.968 712.968 1505 1383.845 712.968 712.968 1505 814.922 355.729 466.572 1524.567 628.472
Pollutant Name: Sulfur Dioxide Temperature: 67F Relative Humidity: 55%Speed LDA LDA LDA LDA LDT1 LDT1 LDT1 LDT1 LDT2 LDT2 LDT2 LDT2 MDV MDV MDV MDV LHD1 LHD1 LHD1 LHD1 LHD2 LHD2 LHD2 LHD2 MHD MHD MHD MHD HHD HHD HHD HHD OBUS OBUS OBUS OBUS UBUS UBUS UBUS UBUS MCY MCY MCY MCY SBUS SBUS SBUS SBUS MH MH MH MH ALL ALL ALL ALL MPH NCAT CAT DSL ALL NCAT CAT DSL ALL NCAT CAT DSL ALL NCAT CAT DSL ALL NCAT CAT DSL ALL NCAT CAT DSL ALL NCAT CAT DSL ALL NCAT CAT DSL ALL NCAT CAT DSL ALL NCAT CAT DSL ALL NCAT CAT DSL ALL NCAT CAT DSL ALL NCAT CAT DSL ALL NCAT CAT DSL ALL
5 0.016 0.009 0.003 0.009 0.016 0.011 0.003 0.011 0.016 0.011 0.003 0.012 0.021 0.016 0.003 0.016 0.03 0.024 0.005 0.019 0.03 0.024 0.005 0.014 0.033 0.025 0.014 0.016 0.065 0.027 0.037 0.037 0.033 0.025 0.014 0.019 0.034 0.026 0.025 0.025 0.003 0.003 0 0.003 0.033 0.026 0.014 0.016 0.033 0.025 0.014 0.024 0.011 0.011 0.03 0.01435 0.005 0.003 0.003 0.003 0.005 0.004 0.003 0.004 0.005 0.004 0.003 0.004 0.007 0.005 0.003 0.005 0.006 0.005 0.005 0.005 0.006 0.005 0.005 0.005 0.006 0.005 0.014 0.013 0.013 0.005 0.017 0.017 0.006 0.005 0.014 0.01 0.007 0.005 0.025 0.02 0.002 0.002 0 0.002 0.006 0.005 0.014 0.013 0.006 0.005 0.014 0.006 0.004 0.004 0.015 0.00545 0.005 0.003 0.003 0.003 0.005 0.003 0.003 0.003 0.005 0.003 0.003 0.003 0.006 0.005 0.003 0.005 0.005 0.004 0.005 0.005 0.005 0.004 0.005 0.005 0.006 0.004 0.014 0.013 0.011 0.005 0.016 0.016 0.006 0.004 0.014 0.01 0.006 0.005 0.025 0.02 0.002 0.002 0 0.002 0.006 0.005 0.014 0.013 0.006 0.004 0.014 0.006 0.004 0.003 0.014 0.00565 0.007 0.004 0.003 0.004 0.007 0.005 0.003 0.005 0.007 0.005 0.003 0.005 0.01 0.006 0.003 0.006 0.008 0.007 0.005 0.006 0.008 0.007 0.005 0.006 0.009 0.007 0.014 0.013 0.018 0.008 0.016 0.016 0.009 0.007 0.014 0.011 0.009 0.007 0.025 0.02 0.003 0.003 0 0.003 0.009 0.007 0.014 0.013 0.009 0.007 0.014 0.008 0.005 0.005 0.015 0.006
Pollutant Name: PM10 Temperature: 67F Relative Humidity: 55%Speed LDA LDA LDA LDA LDT1 LDT1 LDT1 LDT1 LDT2 LDT2 LDT2 LDT2 MDV MDV MDV MDV LHD1 LHD1 LHD1 LHD1 LHD2 LHD2 LHD2 LHD2 MHD MHD MHD MHD HHD HHD HHD HHD OBUS OBUS OBUS OBUS UBUS UBUS UBUS UBUS MCY MCY MCY MCY SBUS SBUS SBUS SBUS MH MH MH MH ALL ALL ALL ALL MPH NCAT CAT DSL ALL NCAT CAT DSL ALL NCAT CAT DSL ALL NCAT CAT DSL ALL NCAT CAT DSL ALL NCAT CAT DSL ALL NCAT CAT DSL ALL NCAT CAT DSL ALL NCAT CAT DSL ALL NCAT CAT DSL ALL NCAT CAT DSL ALL NCAT CAT DSL ALL NCAT CAT DSL ALL NCAT CAT DSL ALL
5 0.104 0.059 0.35 0.06 0.102 0.062 0.139 0.068 0.105 0.128 0.281 0.129 0.106 0.118 0.136 0.118 0.101 0.035 0.114 0.057 0.101 0.042 0.147 0.099 0.101 0.061 0.912 0.795 0.101 0.094 2.922 2.89 0.101 0.068 0.867 0.496 0.101 0.098 0.961 0.729 0.08 0.005 0 0.056 0.101 0.082 1.361 1.165 0.101 0.02 0.544 0.091 0.093 0.082 2.298 0.42535 0.027 0.01 0.114 0.01 0.026 0.011 0.045 0.013 0.027 0.022 0.092 0.022 0.027 0.02 0.044 0.021 0.015 0.005 0.037 0.014 0.015 0.006 0.048 0.029 0.015 0.009 0.297 0.257 0.015 0.014 0.571 0.565 0.015 0.01 0.282 0.156 0.015 0.014 0.237 0.177 0.038 0.002 0 0.027 0.015 0.012 0.443 0.377 0.015 0.003 0.177 0.026 0.031 0.014 0.467 0.08445 0.024 0.008 0.093 0.009 0.024 0.009 0.037 0.011 0.025 0.019 0.075 0.019 0.025 0.017 0.036 0.017 0.011 0.004 0.031 0.011 0.011 0.005 0.039 0.023 0.011 0.007 0.244 0.211 0.011 0.01 0.534 0.528 0.011 0.007 0.232 0.128 0.011 0.011 0.196 0.146 0.043 0.002 0 0.03 0.011 0.009 0.364 0.309 0.011 0.002 0.145 0.021 0.032 0.012 0.431 0.07765 0.035 0.011 0.082 0.011 0.035 0.012 0.033 0.013 0.036 0.024 0.066 0.024 0.036 0.022 0.032 0.022 0.01 0.003 0.027 0.01 0.01 0.004 0.034 0.02 0.01 0.006 0.213 0.185 0.01 0.009 0.896 0.886 0.01 0.007 0.203 0.112 0.01 0.009 0.206 0.153 0.095 0.005 0 0.066 0.01 0.008 0.319 0.271 0.01 0.002 0.127 0.018 0.06 0.015 0.695 0.121
Pollutant Name: PM10 - Tire Wear Temperature: 67F Relative Humidity: 55%Speed LDA LDA LDA LDA LDT1 LDT1 LDT1 LDT1 LDT2 LDT2 LDT2 LDT2 MDV MDV MDV MDV LHD1 LHD1 LHD1 LHD1 LHD2 LHD2 LHD2 LHD2 MHD MHD MHD MHD HHD HHD HHD HHD OBUS OBUS OBUS OBUS UBUS UBUS UBUS UBUS MCY MCY MCY MCY SBUS SBUS SBUS SBUS MH MH MH MH ALL ALL ALL ALL MPH NCAT CAT DSL ALL NCAT CAT DSL ALL NCAT CAT DSL ALL NCAT CAT DSL ALL NCAT CAT DSL ALL NCAT CAT DSL ALL NCAT CAT DSL ALL NCAT CAT DSL ALL NCAT CAT DSL ALL NCAT CAT DSL ALL NCAT CAT DSL ALL NCAT CAT DSL ALL NCAT CAT DSL ALL NCAT CAT DSL ALL
5 0.008 0.008 0.008 0.008 0.008 0.008 0.008 0.008 0.008 0.008 0.008 0.008 0.008 0.008 0.008 0.008 0.012 0.012 0.012 0.012 0.012 0.012 0.012 0.012 0.012 0.012 0.012 0.012 0.012 0.012 0.036 0.036 0.012 0.012 0.012 0.012 0.012 0.012 0.008 0.009 0.004 0.004 0 0.004 0.012 0.012 0.012 0.012 0.012 0.012 0.012 0.012 0.006 0.008 0.029 0.01135 0.008 0.008 0.008 0.008 0.008 0.008 0.008 0.008 0.008 0.008 0.008 0.008 0.008 0.008 0.008 0.008 0.012 0.012 0.012 0.012 0.012 0.012 0.012 0.012 0.012 0.012 0.012 0.012 0.012 0.012 0.036 0.036 0.012 0.012 0.012 0.012 0.012 0.012 0.008 0.009 0.004 0.004 0 0.004 0.012 0.012 0.012 0.012 0.012 0.012 0.012 0.012 0.006 0.008 0.029 0.01145 0.008 0.008 0.008 0.008 0.008 0.008 0.008 0.008 0.008 0.008 0.008 0.008 0.008 0.008 0.008 0.008 0.012 0.012 0.012 0.012 0.012 0.012 0.012 0.012 0.012 0.012 0.012 0.012 0.012 0.012 0.036 0.036 0.012 0.012 0.012 0.012 0.012 0.012 0.008 0.009 0.004 0.004 0 0.004 0.012 0.012 0.012 0.012 0.012 0.012 0.012 0.012 0.006 0.008 0.029 0.01165 0.008 0.008 0.008 0.008 0.008 0.008 0.008 0.008 0.008 0.008 0.008 0.008 0.008 0.008 0.008 0.008 0.012 0.012 0.012 0.012 0.012 0.012 0.012 0.012 0.012 0.012 0.012 0.012 0.012 0.012 0.036 0.036 0.012 0.012 0.012 0.012 0.012 0.012 0.008 0.009 0.004 0.004 0 0.004 0.012 0.012 0.012 0.012 0.012 0.012 0.012 0.012 0.006 0.008 0.029 0.011
Pollutant Name: PM10 - Brake Wear Temperature: 67F Relative Humidity: 55%Speed LDA LDA LDA LDA LDT1 LDT1 LDT1 LDT1 LDT2 LDT2 LDT2 LDT2 MDV MDV MDV MDV LHD1 LHD1 LHD1 LHD1 LHD2 LHD2 LHD2 LHD2 MHD MHD MHD MHD HHD HHD HHD HHD OBUS OBUS OBUS OBUS UBUS UBUS UBUS UBUS MCY MCY MCY MCY SBUS SBUS SBUS SBUS MH MH MH MH ALL ALL ALL ALL MPH NCAT CAT DSL ALL NCAT CAT DSL ALL NCAT CAT DSL ALL NCAT CAT DSL ALL NCAT CAT DSL ALL NCAT CAT DSL ALL NCAT CAT DSL ALL NCAT CAT DSL ALL NCAT CAT DSL ALL NCAT CAT DSL ALL NCAT CAT DSL ALL NCAT CAT DSL ALL NCAT CAT DSL ALL NCAT CAT DSL ALL
5 0.013 0.013 0.013 0.013 0.013 0.013 0.013 0.013 0.013 0.013 0.013 0.013 0.013 0.013 0.013 0.013 0.013 0.013 0.013 0.013 0.013 0.013 0.013 0.013 0.013 0.013 0.013 0.013 0.028 0.028 0.028 0.028 0.013 0.013 0.013 0.013 0.013 0.013 0.013 0.013 0.006 0.006 0 0.006 0.013 0.013 0.013 0.013 0.013 0.013 0.013 0.013 0.01 0.013 0.024 0.01435 0.013 0.013 0.013 0.013 0.013 0.013 0.013 0.013 0.013 0.013 0.013 0.013 0.013 0.013 0.013 0.013 0.013 0.013 0.013 0.013 0.013 0.013 0.013 0.013 0.013 0.013 0.013 0.013 0.028 0.028 0.028 0.028 0.013 0.013 0.013 0.013 0.013 0.013 0.013 0.013 0.006 0.006 0 0.006 0.013 0.013 0.013 0.013 0.013 0.013 0.013 0.013 0.01 0.013 0.024 0.01445 0.013 0.013 0.013 0.013 0.013 0.013 0.013 0.013 0.013 0.013 0.013 0.013 0.013 0.013 0.013 0.013 0.013 0.013 0.013 0.013 0.013 0.013 0.013 0.013 0.013 0.013 0.013 0.013 0.028 0.028 0.028 0.028 0.013 0.013 0.013 0.013 0.013 0.013 0.013 0.013 0.006 0.006 0 0.006 0.013 0.013 0.013 0.013 0.013 0.013 0.013 0.013 0.01 0.013 0.024 0.01465 0.013 0.013 0.013 0.013 0.013 0.013 0.013 0.013 0.013 0.013 0.013 0.013 0.013 0.013 0.013 0.013 0.013 0.013 0.013 0.013 0.013 0.013 0.013 0.013 0.013 0.013 0.013 0.013 0.028 0.028 0.028 0.028 0.013 0.013 0.013 0.013 0.013 0.013 0.013 0.013 0.006 0.006 0 0.006 0.013 0.013 0.013 0.013 0.013 0.013 0.013 0.013 0.01 0.013 0.024 0.014
Pollutant Name: PM2.5 Temperature: 67F Relative Humidity: 55%Speed LDA LDA LDA LDA LDT1 LDT1 LDT1 LDT1 LDT2 LDT2 LDT2 LDT2 MDV MDV MDV MDV LHD1 LHD1 LHD1 LHD1 LHD2 LHD2 LHD2 LHD2 MHD MHD MHD MHD HHD HHD HHD HHD OBUS OBUS OBUS OBUS UBUS UBUS UBUS UBUS MCY MCY MCY MCY SBUS SBUS SBUS SBUS MH MH MH MH ALL ALL ALL ALL MPH NCAT CAT DSL ALL NCAT CAT DSL ALL NCAT CAT DSL ALL NCAT CAT DSL ALL NCAT CAT DSL ALL NCAT CAT DSL ALL NCAT CAT DSL ALL NCAT CAT DSL ALL NCAT CAT DSL ALL NCAT CAT DSL ALL NCAT CAT DSL ALL NCAT CAT DSL ALL NCAT CAT DSL ALL NCAT CAT DSL ALL
5 0.078 0.055 0.322 0.055 0.077 0.058 0.128 0.062 0.079 0.119 0.259 0.119 0.08 0.11 0.125 0.11 0.076 0.032 0.105 0.053 0.076 0.039 0.135 0.091 0.076 0.057 0.839 0.732 0.076 0.087 2.688 2.659 0.076 0.063 0.798 0.457 0.076 0.091 0.884 0.671 0.061 0.005 0 0.043 0.076 0.076 1.252 1.072 0.076 0.019 0.5 0.083 0.071 0.076 2.115 0.39135 0.02 0.009 0.105 0.01 0.02 0.01 0.042 0.012 0.02 0.021 0.084 0.021 0.021 0.019 0.041 0.019 0.011 0.005 0.034 0.013 0.011 0.006 0.044 0.026 0.011 0.008 0.273 0.237 0.011 0.013 0.525 0.52 0.011 0.009 0.26 0.144 0.011 0.013 0.218 0.163 0.029 0.002 0 0.02 0.011 0.011 0.408 0.347 0.011 0.003 0.163 0.024 0.024 0.013 0.429 0.07845 0.018 0.008 0.086 0.008 0.018 0.008 0.034 0.01 0.019 0.017 0.069 0.017 0.019 0.016 0.033 0.016 0.008 0.004 0.028 0.01 0.008 0.004 0.036 0.021 0.008 0.006 0.224 0.194 0.008 0.009 0.491 0.486 0.008 0.007 0.213 0.117 0.008 0.01 0.181 0.135 0.033 0.002 0 0.023 0.008 0.008 0.334 0.285 0.008 0.002 0.134 0.019 0.024 0.011 0.397 0.07165 0.027 0.01 0.075 0.01 0.026 0.011 0.03 0.012 0.027 0.022 0.061 0.022 0.027 0.02 0.029 0.02 0.007 0.003 0.025 0.009 0.007 0.004 0.032 0.019 0.007 0.006 0.196 0.17 0.007 0.008 0.824 0.815 0.007 0.006 0.187 0.103 0.007 0.009 0.189 0.141 0.071 0.005 0 0.05 0.007 0.007 0.293 0.249 0.007 0.002 0.117 0.017 0.046 0.014 0.639 0.111
Pollutant Name: PM2.5 - Tire Wear Temperature: 67F Relative Humidity: 55%Speed LDA LDA LDA LDA LDT1 LDT1 LDT1 LDT1 LDT2 LDT2 LDT2 LDT2 MDV MDV MDV MDV LHD1 LHD1 LHD1 LHD1 LHD2 LHD2 LHD2 LHD2 MHD MHD MHD MHD HHD HHD HHD HHD OBUS OBUS OBUS OBUS UBUS UBUS UBUS UBUS MCY MCY MCY MCY SBUS SBUS SBUS SBUS MH MH MH MH ALL ALL ALL ALL MPH NCAT CAT DSL ALL NCAT CAT DSL ALL NCAT CAT DSL ALL NCAT CAT DSL ALL NCAT CAT DSL ALL NCAT CAT DSL ALL NCAT CAT DSL ALL NCAT CAT DSL ALL NCAT CAT DSL ALL NCAT CAT DSL ALL NCAT CAT DSL ALL NCAT CAT DSL ALL NCAT CAT DSL ALL NCAT CAT DSL ALL
5 0.002 0.002 0.002 0.002 0.002 0.002 0.002 0.002 0.002 0.002 0.002 0.002 0.002 0.002 0.002 0.002 0.003 0.003 0.003 0.003 0.003 0.003 0.003 0.003 0.003 0.003 0.003 0.003 0.003 0.003 0.009 0.009 0.003 0.003 0.003 0.003 0.003 0.003 0.002 0.002 0.001 0.001 0 0.001 0.003 0.003 0.003 0.003 0.003 0.003 0.003 0.003 0.002 0.002 0.007 0.00335 0.002 0.002 0.002 0.002 0.002 0.002 0.002 0.002 0.002 0.002 0.002 0.002 0.002 0.002 0.002 0.002 0.003 0.003 0.003 0.003 0.003 0.003 0.003 0.003 0.003 0.003 0.003 0.003 0.003 0.003 0.009 0.009 0.003 0.003 0.003 0.003 0.003 0.003 0.002 0.002 0.001 0.001 0 0.001 0.003 0.003 0.003 0.003 0.003 0.003 0.003 0.003 0.002 0.002 0.007 0.00345 0.002 0.002 0.002 0.002 0.002 0.002 0.002 0.002 0.002 0.002 0.002 0.002 0.002 0.002 0.002 0.002 0.003 0.003 0.003 0.003 0.003 0.003 0.003 0.003 0.003 0.003 0.003 0.003 0.003 0.003 0.009 0.009 0.003 0.003 0.003 0.003 0.003 0.003 0.002 0.002 0.001 0.001 0 0.001 0.003 0.003 0.003 0.003 0.003 0.003 0.003 0.003 0.002 0.002 0.007 0.00365 0.002 0.002 0.002 0.002 0.002 0.002 0.002 0.002 0.002 0.002 0.002 0.002 0.002 0.002 0.002 0.002 0.003 0.003 0.003 0.003 0.003 0.003 0.003 0.003 0.003 0.003 0.003 0.003 0.003 0.003 0.009 0.009 0.003 0.003 0.003 0.003 0.003 0.003 0.002 0.002 0.001 0.001 0 0.001 0.003 0.003 0.003 0.003 0.003 0.003 0.003 0.003 0.002 0.002 0.007 0.003
Pollutant Name: PM2.5 - Brake Wear Temperature: 67F Relative Humidity: 55%Speed LDA LDA LDA LDA LDT1 LDT1 LDT1 LDT1 LDT2 LDT2 LDT2 LDT2 MDV MDV MDV MDV LHD1 LHD1 LHD1 LHD1 LHD2 LHD2 LHD2 LHD2 MHD MHD MHD MHD HHD HHD HHD HHD OBUS OBUS OBUS OBUS UBUS UBUS UBUS UBUS MCY MCY MCY MCY SBUS SBUS SBUS SBUS MH MH MH MH ALL ALL ALL ALL MPH NCAT CAT DSL ALL NCAT CAT DSL ALL NCAT CAT DSL ALL NCAT CAT DSL ALL NCAT CAT DSL ALL NCAT CAT DSL ALL NCAT CAT DSL ALL NCAT CAT DSL ALL NCAT CAT DSL ALL NCAT CAT DSL ALL NCAT CAT DSL ALL NCAT CAT DSL ALL NCAT CAT DSL ALL NCAT CAT DSL ALL
5 0.005 0.005 0.005 0.005 0.005 0.005 0.005 0.005 0.005 0.005 0.005 0.005 0.005 0.005 0.005 0.005 0.005 0.005 0.005 0.005 0.005 0.005 0.005 0.005 0.005 0.005 0.005 0.005 0.012 0.012 0.012 0.012 0.005 0.005 0.005 0.005 0.005 0.005 0.005 0.005 0.003 0.003 0 0.003 0.005 0.005 0.005 0.005 0.005 0.005 0.005 0.005 0.004 0.005 0.01 0.00635 0.005 0.005 0.005 0.005 0.005 0.005 0.005 0.005 0.005 0.005 0.005 0.005 0.005 0.005 0.005 0.005 0.005 0.005 0.005 0.005 0.005 0.005 0.005 0.005 0.005 0.005 0.005 0.005 0.012 0.012 0.012 0.012 0.005 0.005 0.005 0.005 0.005 0.005 0.005 0.005 0.003 0.003 0 0.003 0.005 0.005 0.005 0.005 0.005 0.005 0.005 0.005 0.004 0.005 0.01 0.00645 0.005 0.005 0.005 0.005 0.005 0.005 0.005 0.005 0.005 0.005 0.005 0.005 0.005 0.005 0.005 0.005 0.005 0.005 0.005 0.005 0.005 0.005 0.005 0.005 0.005 0.005 0.005 0.005 0.012 0.012 0.012 0.012 0.005 0.005 0.005 0.005 0.005 0.005 0.005 0.005 0.003 0.003 0 0.003 0.005 0.005 0.005 0.005 0.005 0.005 0.005 0.005 0.004 0.005 0.01 0.00665 0.005 0.005 0.005 0.005 0.005 0.005 0.005 0.005 0.005 0.005 0.005 0.005 0.005 0.005 0.005 0.005 0.005 0.005 0.005 0.005 0.005 0.005 0.005 0.005 0.005 0.005 0.005 0.005 0.012 0.012 0.012 0.012 0.005 0.005 0.005 0.005 0.005 0.005 0.005 0.005 0.003 0.003 0 0.003 0.005 0.005 0.005 0.005 0.005 0.005 0.005 0.005 0.004 0.005 0.01 0.006
Pollutant Name: Methane Temperature: 67F Relative Humidity: 55%Speed LDA LDA LDA LDA LDT1 LDT1 LDT1 LDT1 LDT2 LDT2 LDT2 LDT2 MDV MDV MDV MDV LHD1 LHD1 LHD1 LHD1 LHD2 LHD2 LHD2 LHD2 MHD MHD MHD MHD HHD HHD HHD HHD OBUS OBUS OBUS OBUS UBUS UBUS UBUS UBUS MCY MCY MCY MCY SBUS SBUS SBUS SBUS MH MH MH MH ALL ALL ALL ALL MPH NCAT CAT DSL ALL NCAT CAT DSL ALL NCAT CAT DSL ALL NCAT CAT DSL ALL NCAT CAT DSL ALL NCAT CAT DSL ALL NCAT CAT DSL ALL NCAT CAT DSL ALL NCAT CAT DSL ALL NCAT CAT DSL ALL NCAT CAT DSL ALL NCAT CAT DSL ALL NCAT CAT DSL ALL NCAT CAT DSL ALL
5 0.818 0.075 0.022 0.081 0.833 0.079 0.01 0.089 0.815 0.088 0.018 0.094 1.036 0.099 0.01 0.106 0.839 0.099 0.02 0.081 0.827 0.113 0.028 0.071 1.193 0.253 0.035 0.073 3.873 0.711 0.572 0.574 1.193 0.246 0.033 0.138 1.412 0.505 0.098 0.214 0.328 0.256 0 0.305 1.188 0.467 0.045 0.124 1.187 0.176 0.014 0.201 0.634 0.085 0.43 0.14735 0.292 0.026 0.007 0.028 0.296 0.029 0.003 0.032 0.291 0.033 0.006 0.035 0.349 0.04 0.003 0.042 0.216 0.027 0.006 0.022 0.214 0.033 0.009 0.021 0.269 0.083 0.012 0.023 0.667 0.185 0.044 0.045 0.269 0.097 0.011 0.052 0.302 0.115 0.024 0.05 0.213 0.161 0 0.196 0.269 0.138 0.015 0.036 0.269 0.061 0.005 0.063 0.261 0.031 0.035 0.03545 0.277 0.022 0.006 0.024 0.28 0.025 0.003 0.029 0.276 0.029 0.005 0.031 0.328 0.035 0.003 0.037 0.186 0.023 0.005 0.019 0.185 0.028 0.008 0.018 0.226 0.073 0.009 0.019 0.52 0.157 0.035 0.037 0.226 0.086 0.009 0.046 0.251 0.096 0.02 0.042 0.226 0.167 0 0.207 0.226 0.12 0.012 0.031 0.226 0.053 0.004 0.054 0.256 0.027 0.028 0.03165 0.351 0.027 0.005 0.03 0.356 0.03 0.002 0.034 0.35 0.034 0.004 0.036 0.426 0.041 0.002 0.044 0.177 0.021 0.005 0.017 0.176 0.026 0.007 0.017 0.213 0.069 0.008 0.018 0.476 0.148 0.058 0.059 0.213 0.083 0.008 0.043 0.235 0.09 0.021 0.041 0.367 0.242 0 0.328 0.213 0.114 0.011 0.028 0.213 0.05 0.003 0.051 0.358 0.032 0.045 0.039


E.4-1 Castle Commerce Center HMF Site
Intersection Control, LOS, Average Delay, and Total Volume Summary
Average Total Average TotalDelay Volume Delay Volume
LOS (sec) (vph) LOS (sec) (vph)1 Winton Wy / Bellevue Rd Signalized C 27.7 1615 C 28.5 17162 Atwater Blvd / Applegate Rd Signalized C 29.6 1501 C 31.5 20323 Sycamore Ave / SR-99 NB Ramps Unsignalized A 7.9 377 A 8.1 4184 Sycamore Ave / Applegate Rd Signalized C 20.0 898 C 23.1 13225 Bell Ln / Mall Access / SR-99 SB Ramps Signalized C 24.4 482 C 24.4 5246 Bell Dr / Bell Ln Signalized C 20.0 656 B 19.4 7047 Bell Dr / Commerce Ave / Applegate Rd Signalized C 26.8 1009 C 31.0 14428 Mall Access / Applegate Rd Unsignalized A 0.2 733 A 0.1 11159 Santa Fe Dr / Buhach Rd / Airdrome Entry Signalized C 21.4 1045 C 23.5 1094
10 Buhach Rd / Bellevue Rd Signalized C 25.2 928 C 27.2 114411 Ashby Rd / Buhach Rd Unsignalized D 14.5 1214 E 23.0 136412 Ashby Rd / N 193 Unsignalized D 7.4 1043 C 4.0 95113 Ashby Rd / SR-99 SB Ramps Unsignalized B 2.6 816 B 3.3 82014 Santa Fe Dr / Bellevue Rd Signalized B 15.2 1034 B 10.9 127515 Santa Fe Dr / F St Signalized A 7.4 1191 A 8.8 139016 Santa Fe Dr / W Ave 2 Unsignalized C 4.0 1612 B 2.8 167717 Santa Fe Dr / N Franklin Rd Signalized B 17.0 1832 B 16.0 204818 Ashby Rd / Franklin Rd Unsignalized B 11.7 924 B 12.5 97419 Santa Fe Dr / Belcher Ave Unsignalized B 2.8 1478 B 3.2 179120 Olive Ave - Santa Fe Dr / SR-59 Signalized D 35.4 2219 D 39.4 316121 Santa Fe Dr/ AM Express WB Ramps Signalized - - - - - -22 Santa Fe Dr/ AM Express EB Ramps Signalized - - - - - -23 SR-99 NB Ramps/AM Express Signalized - - - - - -24 SR-99 SB Ramps/AM Express Signalized - - - - - -25 16th St / SR-59 Unsignalized C 9.1 1360 F 22.9 196126 13th St - SR-99 SB Off-Ramp / V St Signalized C 32.2 2080 C 33.1 231127 14th St - SR-99 NB Onramp / V St Signalized B 18.6 1545 B 18.0 199028 15th St / V St Signalized B 16.7 1299 C 25.0 186729 16th St / V St Signalized C 21.5 2067 C 27.0 264030 13th St / R St Signalized B 14.3 1466 B 15.0 181131 SR-99 NB Off-Ramp - 14th St / R Street Signalized B 20.0 1449 B 19.0 180932 15th St / R St Signalized B 17.1 1141 C 25.2 189233 16th St / R St Signalized C 31.8 1838 C 33.7 286134 Olive Ave / R St Signalized D 50.9 2490 E 56.2 381035 15th St / O St Unsignalized A 7.6 291 A 8.5 51136 16th St / O St Signalized C 21.1 1015 B 19.8 1585
Intersections selected for analysis are italicized - Indicates intersection does not exist for a particular scenario
Intersection# Control
ExistingAM Peak PM Peak
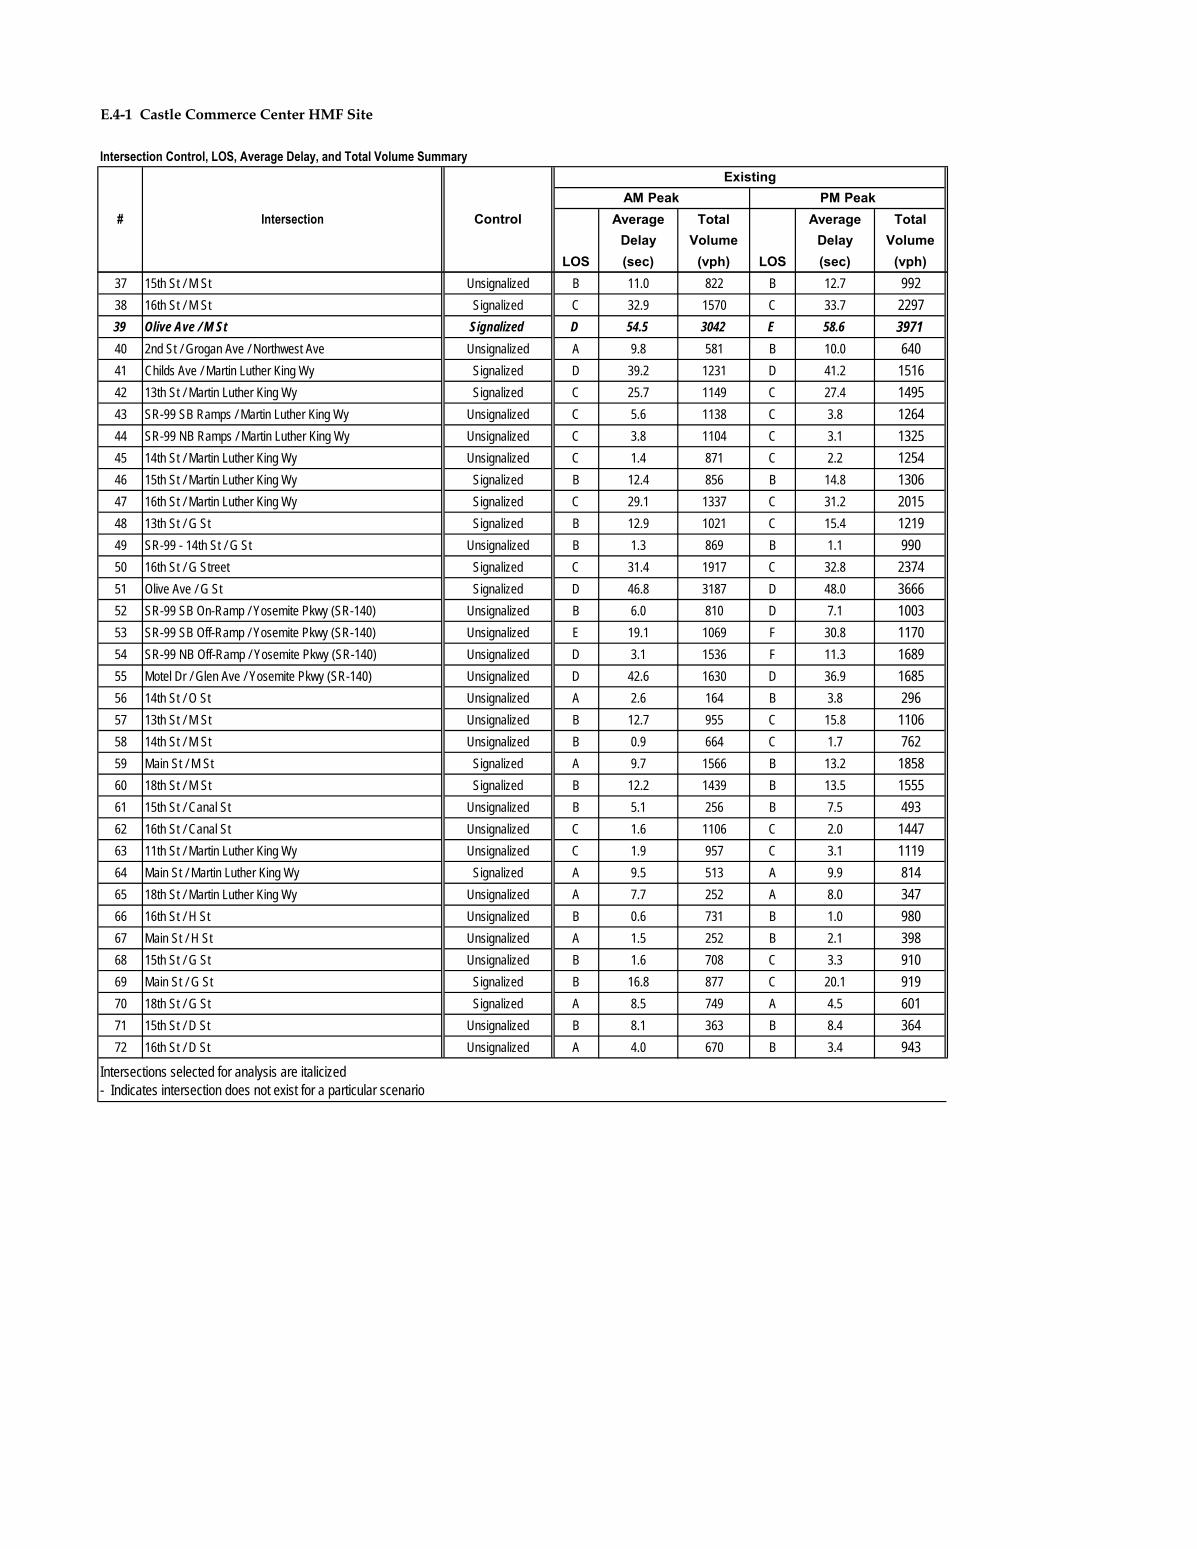
E.4-1 Castle Commerce Center HMF Site
Intersection Control, LOS, Average Delay, and Total Volume Summary
Average Total Average TotalDelay Volume Delay Volume
LOS (sec) (vph) LOS (sec) (vph)
Intersection# Control
ExistingAM Peak PM Peak
37 15th St / M St Unsignalized B 11.0 822 B 12.7 99238 16th St / M St Signalized C 32.9 1570 C 33.7 229739 Olive Ave / M St Signalized D 54.5 3042 E 58.6 397140 2nd St / Grogan Ave / Northwest Ave Unsignalized A 9.8 581 B 10.0 64041 Childs Ave / Martin Luther King Wy Signalized D 39.2 1231 D 41.2 151642 13th St / Martin Luther King Wy Signalized C 25.7 1149 C 27.4 149543 SR-99 SB Ramps / Martin Luther King Wy Unsignalized C 5.6 1138 C 3.8 126444 SR-99 NB Ramps / Martin Luther King Wy Unsignalized C 3.8 1104 C 3.1 132545 14th St / Martin Luther King Wy Unsignalized C 1.4 871 C 2.2 125446 15th St / Martin Luther King Wy Signalized B 12.4 856 B 14.8 130647 16th St / Martin Luther King Wy Signalized C 29.1 1337 C 31.2 201548 13th St / G St Signalized B 12.9 1021 C 15.4 121949 SR-99 - 14th St / G St Unsignalized B 1.3 869 B 1.1 99050 16th St / G Street Signalized C 31.4 1917 C 32.8 237451 Olive Ave / G St Signalized D 46.8 3187 D 48.0 366652 SR-99 SB On-Ramp / Yosemite Pkwy (SR-140) Unsignalized B 6.0 810 D 7.1 100353 SR-99 SB Off-Ramp / Yosemite Pkwy (SR-140) Unsignalized E 19.1 1069 F 30.8 117054 SR-99 NB Off-Ramp / Yosemite Pkwy (SR-140) Unsignalized D 3.1 1536 F 11.3 168955 Motel Dr / Glen Ave / Yosemite Pkwy (SR-140) Unsignalized D 42.6 1630 D 36.9 168556 14th St / O St Unsignalized A 2.6 164 B 3.8 29657 13th St / M St Unsignalized B 12.7 955 C 15.8 110658 14th St / M St Unsignalized B 0.9 664 C 1.7 76259 Main St / M St Signalized A 9.7 1566 B 13.2 185860 18th St / M St Signalized B 12.2 1439 B 13.5 155561 15th St / Canal St Unsignalized B 5.1 256 B 7.5 49362 16th St / Canal St Unsignalized C 1.6 1106 C 2.0 144763 11th St / Martin Luther King Wy Unsignalized C 1.9 957 C 3.1 111964 Main St / Martin Luther King Wy Signalized A 9.5 513 A 9.9 81465 18th St / Martin Luther King Wy Unsignalized A 7.7 252 A 8.0 34766 16th St / H St Unsignalized B 0.6 731 B 1.0 98067 Main St / H St Unsignalized A 1.5 252 B 2.1 39868 15th St / G St Unsignalized B 1.6 708 C 3.3 91069 Main St / G St Signalized B 16.8 877 C 20.1 91970 18th St / G St Signalized A 8.5 749 A 4.5 60171 15th St / D St Unsignalized B 8.1 363 B 8.4 36472 16th St / D St Unsignalized A 4.0 670 B 3.4 943
Intersections selected for analysis are italicized - Indicates intersection does not exist for a particular scenario
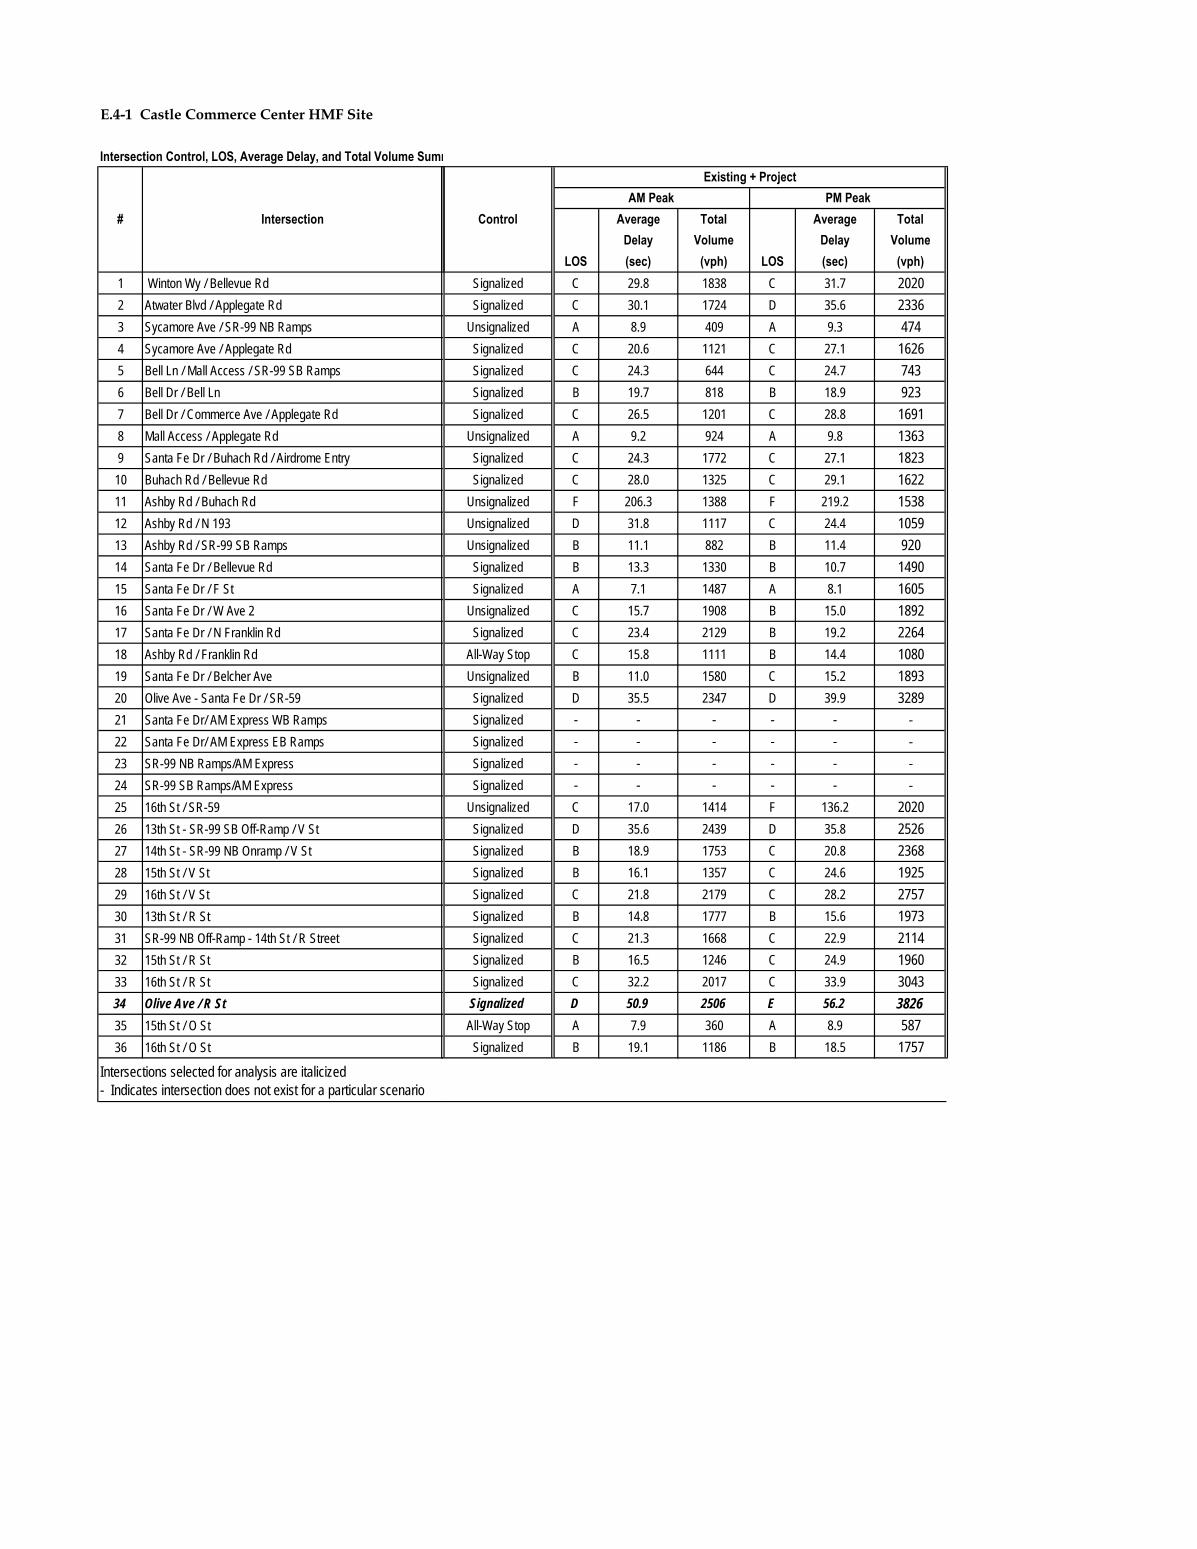
E.4-1 Castle Commerce Center HMF Site
Intersection Control, LOS, Average Delay, and Total Volume Summ
1 Winton Wy / Bellevue Rd2 Atwater Blvd / Applegate Rd3 Sycamore Ave / SR-99 NB Ramps4 Sycamore Ave / Applegate Rd5 Bell Ln / Mall Access / SR-99 SB Ramps6 Bell Dr / Bell Ln7 Bell Dr / Commerce Ave / Applegate Rd8 Mall Access / Applegate Rd9 Santa Fe Dr / Buhach Rd / Airdrome Entry10 Buhach Rd / Bellevue Rd 11 Ashby Rd / Buhach Rd12 Ashby Rd / N 19313 Ashby Rd / SR-99 SB Ramps14 Santa Fe Dr / Bellevue Rd15 Santa Fe Dr / F St16 Santa Fe Dr / W Ave 217 Santa Fe Dr / N Franklin Rd18 Ashby Rd / Franklin Rd19 Santa Fe Dr / Belcher Ave20 Olive Ave - Santa Fe Dr / SR-59 21 Santa Fe Dr/ AM Express WB Ramps22 Santa Fe Dr/ AM Express EB Ramps23 SR-99 NB Ramps/AM Express24 SR-99 SB Ramps/AM Express25 16th St / SR-59 26 13th St - SR-99 SB Off-Ramp / V St27 14th St - SR-99 NB Onramp / V St28 15th St / V St 29 16th St / V St 30 13th St / R St 31 SR-99 NB Off-Ramp - 14th St / R Street32 15th St / R St 33 16th St / R St 34 Olive Ave / R St 35 15th St / O St 36 16th St / O St
Intersections selected for analysis are italicized - Indicates intersection does not exist for a particular scenario
Intersection# Average Total Average TotalDelay Volume Delay Volume
LOS (sec) (vph) LOS (sec) (vph)Signalized C 29.8 1838 C 31.7 2020Signalized C 30.1 1724 D 35.6 2336
Unsignalized A 8.9 409 A 9.3 474Signalized C 20.6 1121 C 27.1 1626Signalized C 24.3 644 C 24.7 743Signalized B 19.7 818 B 18.9 923Signalized C 26.5 1201 C 28.8 1691
Unsignalized A 9.2 924 A 9.8 1363Signalized C 24.3 1772 C 27.1 1823Signalized C 28.0 1325 C 29.1 1622
Unsignalized F 206.3 1388 F 219.2 1538Unsignalized D 31.8 1117 C 24.4 1059Unsignalized B 11.1 882 B 11.4 920
Signalized B 13.3 1330 B 10.7 1490Signalized A 7.1 1487 A 8.1 1605
Unsignalized C 15.7 1908 B 15.0 1892Signalized C 23.4 2129 B 19.2 2264
All-Way Stop C 15.8 1111 B 14.4 1080Unsignalized B 11.0 1580 C 15.2 1893
Signalized D 35.5 2347 D 39.9 3289Signalized - - - - - -Signalized - - - - - -Signalized - - - - - -Signalized - - - - - -
Unsignalized C 17.0 1414 F 136.2 2020Signalized D 35.6 2439 D 35.8 2526Signalized B 18.9 1753 C 20.8 2368Signalized B 16.1 1357 C 24.6 1925Signalized C 21.8 2179 C 28.2 2757Signalized B 14.8 1777 B 15.6 1973Signalized C 21.3 1668 C 22.9 2114Signalized B 16.5 1246 C 24.9 1960Signalized C 32.2 2017 C 33.9 3043
Signalized D 50.9 2506 E 56.2 3826All-Way Stop A 7.9 360 A 8.9 587
Signalized B 19.1 1186 B 18.5 1757
Control
Existing + ProjectAM Peak PM Peak

E.4-1 Castle Commerce Center HMF Site
Intersection Control, LOS, Average Delay, and Total Volume Summ
Intersection#
37 15th St / M St 38 16th St / M St 39 Olive Ave / M St 40 2nd St / Grogan Ave / Northwest Ave 41 Childs Ave / Martin Luther King Wy 42 13th St / Martin Luther King Wy 43 SR-99 SB Ramps / Martin Luther King Wy 44 SR-99 NB Ramps / Martin Luther King Wy 45 14th St / Martin Luther King Wy 46 15th St / Martin Luther King Wy 47 16th St / Martin Luther King Wy 48 13th St / G St 49 SR-99 - 14th St / G St 50 16th St / G Street 51 Olive Ave / G St 52 SR-99 SB On-Ramp / Yosemite Pkwy (SR-140) 53 SR-99 SB Off-Ramp / Yosemite Pkwy (SR-140) 54 SR-99 NB Off-Ramp / Yosemite Pkwy (SR-140) 55 Motel Dr / Glen Ave / Yosemite Pkwy (SR-140)56 14th St / O St 57 13th St / M St 58 14th St / M St 59 Main St / M St 60 18th St / M St 61 15th St / Canal St 62 16th St / Canal St 63 11th St / Martin Luther King Wy 64 Main St / Martin Luther King Wy 65 18th St / Martin Luther King Wy 66 16th St / H St 67 Main St / H St 68 15th St / G St 69 Main St / G St 70 18th St / G St 71 15th St / D St 72 16th St / D St
Intersections selected for analysis are italicized - Indicates intersection does not exist for a particular scenario
Average Total Average TotalDelay Volume Delay Volume
LOS (sec) (vph) LOS (sec) (vph)
Control
Existing + ProjectAM Peak PM Peak
All-Way Stop F 70.5 1595 F 137.2 1851Signalized D 35.4 2155 D 37.1 2964
Signalized D 54.5 3058 E 58.6 3987All-Way Stop A 9.8 581 B 10.0 640
Signalized D 38.3 1289 D 40.8 1574Signalized C 28.8 1248 C 30.4 1591
Unsignalized C 22.9 1205 C 17.0 1216Unsignalized C 21.6 1128 C 21.8 1293Unsignalized C 20.6 974 F 56.6 1394
- - - - - - -- - - - - - -
All-Way Stop E 37.2 1389 F 51.0 1587Unsignalized C 17.7 976 C 21.7 1206
- - - - - - -Signalized D 46.8 3204 D 48.0 3683
Unsignalized A 9.5 298 B 13.0 450Unsignalized B 13.9 619 C 16.9 713Unsignalized F 69.8 1564 F 538.2 1719
Signalized D 45.0 1663 D 38.8 1718Unsignalized B 11.1 300 C 16.7 599All-Way Stop D 28.6 1264 D 29.0 1346Unsignalized C 18.1 1197 C 24.8 1318
Signalized A 9.7 1636 B 13.4 1966Signalized B 12.2 1475 B 13.8 1591
All-Way Stop B 10.6 714 B 13.6 977Unsignalized E 35.5 1512 F 67.0 1848Unsignalized C 17.6 1013 C 21.9 1175
Signalized B 10.2 983 B 11.3 1556All-Way Stop A 7.7 272 A 8.1 367
Signalized C 24.3 980 C 24.1 1313Unsignalized C 21.1 915 E 41.5 1155
- - - - - - -Signalized C 20.8 1614 C 24.9 1963Signalized A 9.9 1015 B 11.2 1042
- - - - - - -- - - - - - -

E.4-1 Castle Commerce Center HMF Site
Intersection Control, LOS, Average Delay, and Total Volume Summ
1 Winton Wy / Bellevue Rd2 Atwater Blvd / Applegate Rd3 Sycamore Ave / SR-99 NB Ramps4 Sycamore Ave / Applegate Rd5 Bell Ln / Mall Access / SR-99 SB Ramps6 Bell Dr / Bell Ln7 Bell Dr / Commerce Ave / Applegate Rd8 Mall Access / Applegate Rd9 Santa Fe Dr / Buhach Rd / Airdrome Entry10 Buhach Rd / Bellevue Rd 11 Ashby Rd / Buhach Rd12 Ashby Rd / N 19313 Ashby Rd / SR-99 SB Ramps14 Santa Fe Dr / Bellevue Rd15 Santa Fe Dr / F St16 Santa Fe Dr / W Ave 217 Santa Fe Dr / N Franklin Rd18 Ashby Rd / Franklin Rd19 Santa Fe Dr / Belcher Ave20 Olive Ave - Santa Fe Dr / SR-59 21 Santa Fe Dr/ AM Express WB Ramps22 Santa Fe Dr/ AM Express EB Ramps23 SR-99 NB Ramps/AM Express24 SR-99 SB Ramps/AM Express25 16th St / SR-59 26 13th St - SR-99 SB Off-Ramp / V St27 14th St - SR-99 NB Onramp / V St28 15th St / V St 29 16th St / V St 30 13th St / R St 31 SR-99 NB Off-Ramp - 14th St / R Street32 15th St / R St 33 16th St / R St 34 Olive Ave / R St 35 15th St / O St 36 16th St / O St
Intersections selected for analysis are italicized - Indicates intersection does not exist for a particular scenario
Intersection# Average Total Average TotalDelay Volume Delay Volume
LOS (sec) (vph) LOS (sec) (vph)Signalized C 29.8 1838 C 31.7 2020Signalized C 30.1 1724 D 35.6 2336
Unsignalized A 8.9 409 A 9.3 474Signalized C 20.6 1121 C 27.1 1626Signalized C 24.3 644 C 24.7 743Signalized B 19.7 818 B 18.9 923Signalized C 26.5 1201 C 28.8 1691
Unsignalized A 9.2 924 A 9.8 1363Signalized C 24.3 1772 C 27.1 1823Signalized C 28.0 1325 C 29.1 1622
Unsignalized F 206.3 1388 F 219.2 1538Unsignalized D 31.8 1117 C 24.4 1059Unsignalized B 11.1 882 B 11.4 920
Signalized B 13.3 1330 B 10.7 1490Signalized A 7.1 1487 A 8.1 1605
Unsignalized C 15.7 1908 B 15.0 1892Signalized C 23.4 2129 B 19.2 2264
All-Way Stop C 15.8 1111 B 14.4 1080Unsignalized B 11.0 1580 C 15.2 1893
Signalized D 35.5 2347 D 39.9 3289Signalized - - - - - -Signalized - - - - - -Signalized - - - - - -Signalized - - - - - -
Unsignalized C 17.0 1414 F 136.2 2020Signalized D 36.4 2480 D 36.7 2589Signalized B 18.8 1786 C 20.9 2369Signalized B 15.8 1399 C 24.3 1965Signalized C 22.1 2222 C 28.7 2800Signalized B 14.8 1728 B 15.6 1962Signalized C 21.2 1605 C 21.9 2030Signalized B 16.8 1198 C 24.9 1945Signalized C 32.2 2025 C 33.9 3050
Signalized D 50.9 2506 E 56.2 3826All-Way Stop A 7.7 307 A 8.8 562
Signalized B 19.0 1195 B 18.4 1768
Control
Existing + ProjectAM Peak PM Peak
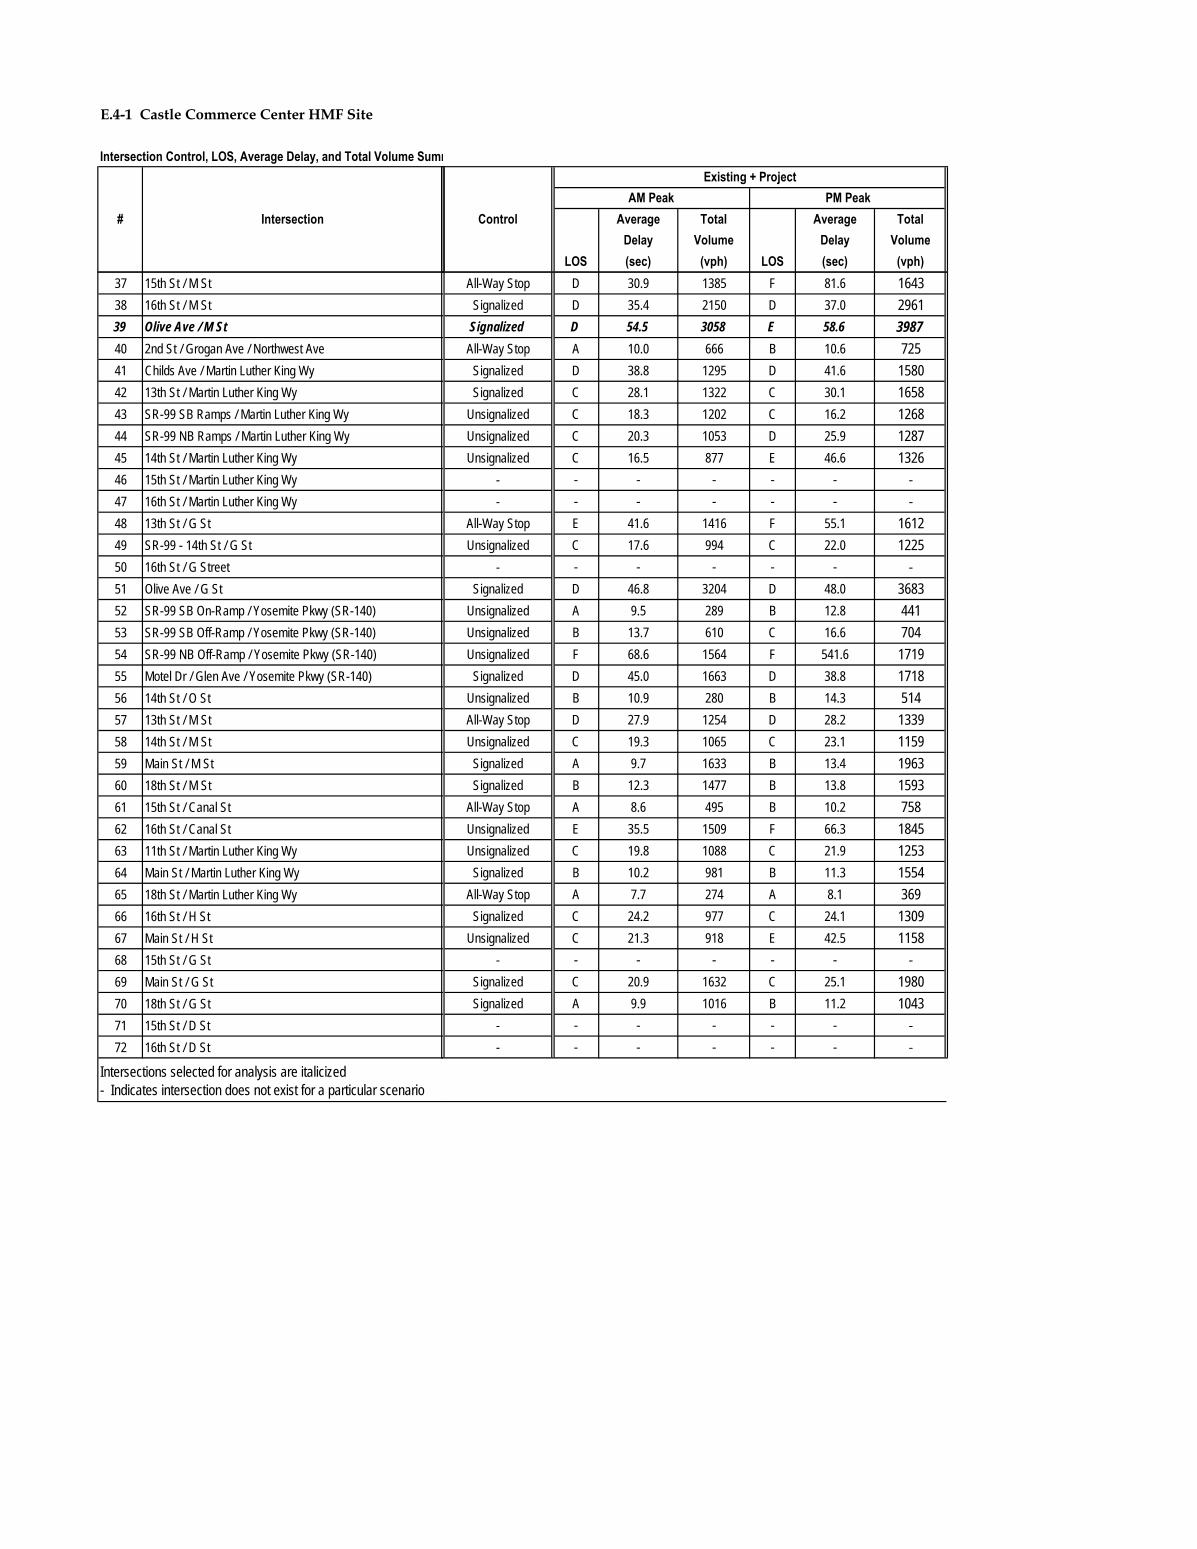
E.4-1 Castle Commerce Center HMF Site
Intersection Control, LOS, Average Delay, and Total Volume Summ
Intersection#
37 15th St / M St 38 16th St / M St 39 Olive Ave / M St 40 2nd St / Grogan Ave / Northwest Ave 41 Childs Ave / Martin Luther King Wy 42 13th St / Martin Luther King Wy 43 SR-99 SB Ramps / Martin Luther King Wy 44 SR-99 NB Ramps / Martin Luther King Wy 45 14th St / Martin Luther King Wy 46 15th St / Martin Luther King Wy 47 16th St / Martin Luther King Wy 48 13th St / G St 49 SR-99 - 14th St / G St 50 16th St / G Street 51 Olive Ave / G St 52 SR-99 SB On-Ramp / Yosemite Pkwy (SR-140) 53 SR-99 SB Off-Ramp / Yosemite Pkwy (SR-140) 54 SR-99 NB Off-Ramp / Yosemite Pkwy (SR-140) 55 Motel Dr / Glen Ave / Yosemite Pkwy (SR-140)56 14th St / O St 57 13th St / M St 58 14th St / M St 59 Main St / M St 60 18th St / M St 61 15th St / Canal St 62 16th St / Canal St 63 11th St / Martin Luther King Wy 64 Main St / Martin Luther King Wy 65 18th St / Martin Luther King Wy 66 16th St / H St 67 Main St / H St 68 15th St / G St 69 Main St / G St 70 18th St / G St 71 15th St / D St 72 16th St / D St
Intersections selected for analysis are italicized - Indicates intersection does not exist for a particular scenario
Average Total Average TotalDelay Volume Delay Volume
LOS (sec) (vph) LOS (sec) (vph)
Control
Existing + ProjectAM Peak PM Peak
All-Way Stop D 30.9 1385 F 81.6 1643Signalized D 35.4 2150 D 37.0 2961
Signalized D 54.5 3058 E 58.6 3987All-Way Stop A 10.0 666 B 10.6 725
Signalized D 38.8 1295 D 41.6 1580Signalized C 28.1 1322 C 30.1 1658
Unsignalized C 18.3 1202 C 16.2 1268Unsignalized C 20.3 1053 D 25.9 1287Unsignalized C 16.5 877 E 46.6 1326
- - - - - - -- - - - - - -
All-Way Stop E 41.6 1416 F 55.1 1612Unsignalized C 17.6 994 C 22.0 1225
- - - - - - -Signalized D 46.8 3204 D 48.0 3683
Unsignalized A 9.5 289 B 12.8 441Unsignalized B 13.7 610 C 16.6 704Unsignalized F 68.6 1564 F 541.6 1719
Signalized D 45.0 1663 D 38.8 1718Unsignalized B 10.9 280 B 14.3 514All-Way Stop D 27.9 1254 D 28.2 1339Unsignalized C 19.3 1065 C 23.1 1159
Signalized A 9.7 1633 B 13.4 1963Signalized B 12.3 1477 B 13.8 1593
All-Way Stop A 8.6 495 B 10.2 758Unsignalized E 35.5 1509 F 66.3 1845Unsignalized C 19.8 1088 C 21.9 1253
Signalized B 10.2 981 B 11.3 1554All-Way Stop A 7.7 274 A 8.1 369
Signalized C 24.2 977 C 24.1 1309Unsignalized C 21.3 918 E 42.5 1158
- - - - - - -Signalized C 20.9 1632 C 25.1 1980Signalized A 9.9 1016 B 11.2 1043
- - - - - - -- - - - - - -
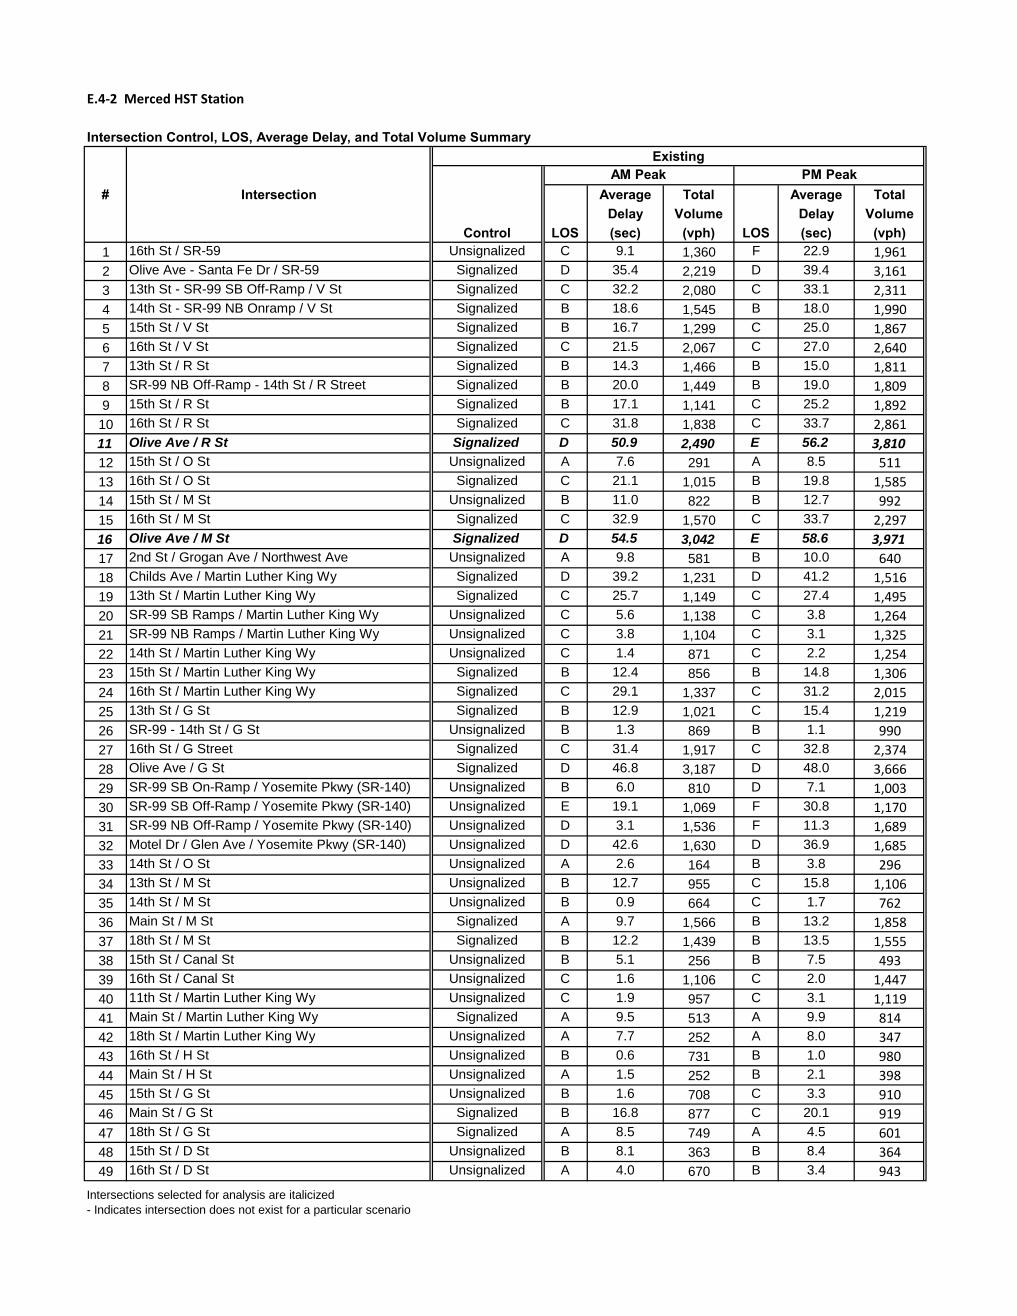
E.4-2 Merced HST Station
Intersection Control, LOS, Average Delay, and Total Volume Summary
# Intersection Average Total Average TotalDelay Volume Delay Volume
Control LOS (sec) (vph) LOS (sec) (vph)1 16th St / SR-59 Unsignalized C 9.1 1,360 F 22.9 1,9612 Olive Ave - Santa Fe Dr / SR-59 Signalized D 35.4 2,219 D 39.4 3,1613 13th St - SR-99 SB Off-Ramp / V St Signalized C 32.2 2,080 C 33.1 2,3114 14th St - SR-99 NB Onramp / V St Signalized B 18.6 1,545 B 18.0 1,9905 15th St / V St Signalized B 16.7 1,299 C 25.0 1,8676 16th St / V St Signalized C 21.5 2,067 C 27.0 2,6407 13th St / R St Signalized B 14.3 1,466 B 15.0 1,8118 SR-99 NB Off-Ramp - 14th St / R Street Signalized B 20.0 1,449 B 19.0 1,8099 15th St / R St Signalized B 17.1 1,141 C 25.2 1,892
10 16th St / R St Signalized C 31.8 1,838 C 33.7 2,86111 Olive Ave / R St Signalized D 50.9 2,490 E 56.2 3,81012 15th St / O St Unsignalized A 7.6 291 A 8.5 51113 16th St / O St Signalized C 21.1 1,015 B 19.8 1,58514 15th St / M St Unsignalized B 11.0 822 B 12.7 99215 16th St / M St Signalized C 32.9 1,570 C 33.7 2,29716 Olive Ave / M St Signalized D 54.5 3,042 E 58.6 3,97117 2nd St / Grogan Ave / Northwest Ave Unsignalized A 9.8 581 B 10.0 64018 Childs Ave / Martin Luther King Wy Signalized D 39.2 1,231 D 41.2 1,51619 13th St / Martin Luther King Wy Signalized C 25.7 1,149 C 27.4 1,49520 SR-99 SB Ramps / Martin Luther King Wy Unsignalized C 5.6 1,138 C 3.8 1,26421 SR-99 NB Ramps / Martin Luther King Wy Unsignalized C 3.8 1,104 C 3.1 1,32522 14th St / Martin Luther King Wy Unsignalized C 1.4 871 C 2.2 1,25423 15th St / Martin Luther King Wy Signalized B 12.4 856 B 14.8 1,30624 16th St / Martin Luther King Wy Signalized C 29.1 1,337 C 31.2 2,01525 13th St / G St Signalized B 12.9 1,021 C 15.4 1,21926 SR-99 - 14th St / G St Unsignalized B 1.3 869 B 1.1 99027 16th St / G Street Signalized C 31.4 1,917 C 32.8 2,37428 Olive Ave / G St Signalized D 46.8 3,187 D 48.0 3,66629 SR-99 SB On-Ramp / Yosemite Pkwy (SR-140) Unsignalized B 6.0 810 D 7.1 1,00330 SR-99 SB Off-Ramp / Yosemite Pkwy (SR-140) Unsignalized E 19.1 1,069 F 30.8 1,17031 SR-99 NB Off-Ramp / Yosemite Pkwy (SR-140) Unsignalized D 3.1 1,536 F 11.3 1,68932 Motel Dr / Glen Ave / Yosemite Pkwy (SR-140) Unsignalized D 42.6 1,630 D 36.9 1,68533 14th St / O St Unsignalized A 2.6 164 B 3.8 29634 13th St / M St Unsignalized B 12.7 955 C 15.8 1,10635 14th St / M St Unsignalized B 0.9 664 C 1.7 76236 Main St / M St Signalized A 9.7 1,566 B 13.2 1,85837 18th St / M St Signalized B 12.2 1,439 B 13.5 1,55538 15th St / Canal St Unsignalized B 5.1 256 B 7.5 49339 16th St / Canal St Unsignalized C 1.6 1,106 C 2.0 1,44740 11th St / Martin Luther King Wy Unsignalized C 1.9 957 C 3.1 1,11941 Main St / Martin Luther King Wy Signalized A 9.5 513 A 9.9 81442 18th St / Martin Luther King Wy Unsignalized A 7.7 252 A 8.0 34743 16th St / H St Unsignalized B 0.6 731 B 1.0 98044 Main St / H St Unsignalized A 1.5 252 B 2.1 39845 15th St / G St Unsignalized B 1.6 708 C 3.3 91046 Main St / G St Signalized B 16.8 877 C 20.1 91947 18th St / G St Signalized A 8.5 749 A 4.5 60148 15th St / D St Unsignalized B 8.1 363 B 8.4 36449 16th St / D St Unsignalized A 4.0 670 B 3.4 943
Intersections selected for analysis are italicized- Indicates intersection does not exist for a particular scenario
AM Peak PM PeakExisting
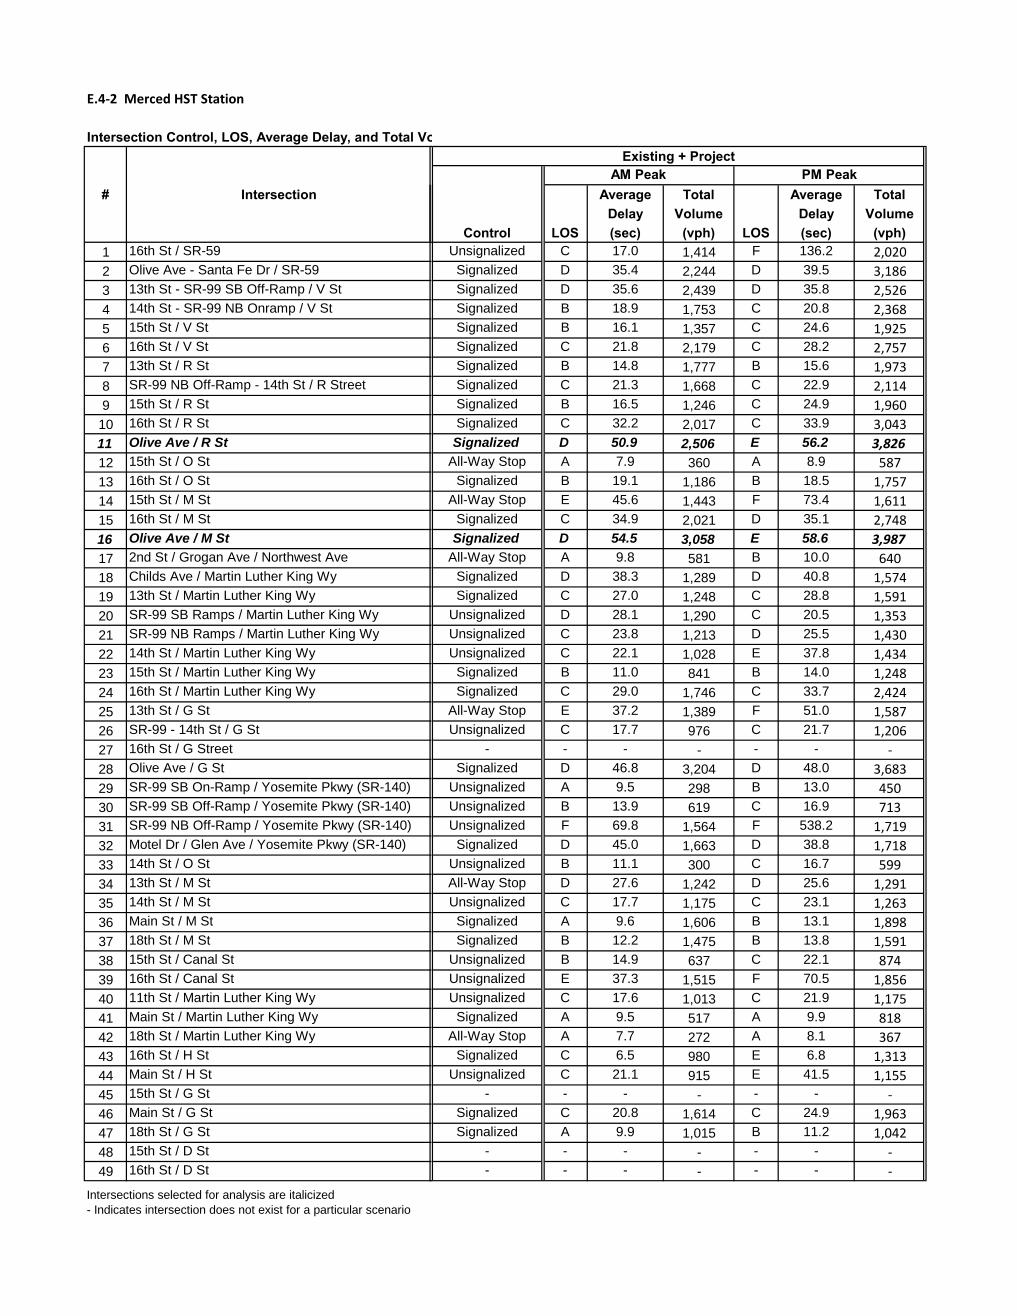
E.4-2 Merced HST Station
Intersection Control, LOS, Average Delay, and Total Vo
# Intersection
1 16th St / SR-59 2 Olive Ave - Santa Fe Dr / SR-59 3 13th St - SR-99 SB Off-Ramp / V St4 14th St - SR-99 NB Onramp / V St5 15th St / V St 6 16th St / V St 7 13th St / R St 8 SR-99 NB Off-Ramp - 14th St / R Street9 15th St / R St
10 16th St / R St 11 Olive Ave / R St 12 15th St / O St 13 16th St / O St 14 15th St / M St 15 16th St / M St 16 Olive Ave / M St 17 2nd St / Grogan Ave / Northwest Ave 18 Childs Ave / Martin Luther King Wy 19 13th St / Martin Luther King Wy 20 SR-99 SB Ramps / Martin Luther King Wy 21 SR-99 NB Ramps / Martin Luther King Wy 22 14th St / Martin Luther King Wy 23 15th St / Martin Luther King Wy 24 16th St / Martin Luther King Wy 25 13th St / G St 26 SR-99 - 14th St / G St 27 16th St / G Street 28 Olive Ave / G St 29 SR-99 SB On-Ramp / Yosemite Pkwy (SR-140) 30 SR-99 SB Off-Ramp / Yosemite Pkwy (SR-140) 31 SR-99 NB Off-Ramp / Yosemite Pkwy (SR-140) 32 Motel Dr / Glen Ave / Yosemite Pkwy (SR-140)33 14th St / O St 34 13th St / M St 35 14th St / M St 36 Main St / M St 37 18th St / M St 38 15th St / Canal St 39 16th St / Canal St 40 11th St / Martin Luther King Wy 41 Main St / Martin Luther King Wy 42 18th St / Martin Luther King Wy 43 16th St / H St 44 Main St / H St 45 15th St / G St 46 Main St / G St 47 18th St / G St 48 15th St / D St 49 16th St / D St
Intersections selected for analysis are italicized- Indicates intersection does not exist for a particular scenario
Average Total Average TotalDelay Volume Delay Volume
Control LOS (sec) (vph) LOS (sec) (vph)Unsignalized C 17.0 1,414 F 136.2 2,020Signalized D 35.4 2,244 D 39.5 3,186Signalized D 35.6 2,439 D 35.8 2,526Signalized B 18.9 1,753 C 20.8 2,368Signalized B 16.1 1,357 C 24.6 1,925Signalized C 21.8 2,179 C 28.2 2,757Signalized B 14.8 1,777 B 15.6 1,973Signalized C 21.3 1,668 C 22.9 2,114Signalized B 16.5 1,246 C 24.9 1,960Signalized C 32.2 2,017 C 33.9 3,043Signalized D 50.9 2,506 E 56.2 3,826
All-Way Stop A 7.9 360 A 8.9 587Signalized B 19.1 1,186 B 18.5 1,757
All-Way Stop E 45.6 1,443 F 73.4 1,611Signalized C 34.9 2,021 D 35.1 2,748Signalized D 54.5 3,058 E 58.6 3,987
All-Way Stop A 9.8 581 B 10.0 640Signalized D 38.3 1,289 D 40.8 1,574Signalized C 27.0 1,248 C 28.8 1,591
Unsignalized D 28.1 1,290 C 20.5 1,353Unsignalized C 23.8 1,213 D 25.5 1,430Unsignalized C 22.1 1,028 E 37.8 1,434Signalized B 11.0 841 B 14.0 1,248Signalized C 29.0 1,746 C 33.7 2,424
All-Way Stop E 37.2 1,389 F 51.0 1,587Unsignalized C 17.7 976 C 21.7 1,206
- - - - - - -Signalized D 46.8 3,204 D 48.0 3,683
Unsignalized A 9.5 298 B 13.0 450Unsignalized B 13.9 619 C 16.9 713Unsignalized F 69.8 1,564 F 538.2 1,719Signalized D 45.0 1,663 D 38.8 1,718
Unsignalized B 11.1 300 C 16.7 599All-Way Stop D 27.6 1,242 D 25.6 1,291Unsignalized C 17.7 1,175 C 23.1 1,263Signalized A 9.6 1,606 B 13.1 1,898Signalized B 12.2 1,475 B 13.8 1,591
Unsignalized B 14.9 637 C 22.1 874Unsignalized E 37.3 1,515 F 70.5 1,856Unsignalized C 17.6 1,013 C 21.9 1,175Signalized A 9.5 517 A 9.9 818
All-Way Stop A 7.7 272 A 8.1 367Signalized C 6.5 980 E 6.8 1,313
Unsignalized C 21.1 915 E 41.5 1,155- - - - - - -
Signalized C 20.8 1,614 C 24.9 1,963Signalized A 9.9 1,015 B 11.2 1,042
- - - - - - -- - - - - - -
Existing + ProjectAM Peak PM Peak

E.4-2 Merced HST Station
Intersection Control, LOS, Average Delay, and Total Vo
# Intersection
1 16th St / SR-59 2 Olive Ave - Santa Fe Dr / SR-59 3 13th St - SR-99 SB Off-Ramp / V St4 14th St - SR-99 NB Onramp / V St5 15th St / V St 6 16th St / V St 7 13th St / R St 8 SR-99 NB Off-Ramp - 14th St / R Street9 15th St / R St
10 16th St / R St 11 Olive Ave / R St 12 15th St / O St 13 16th St / O St 14 15th St / M St 15 16th St / M St 16 Olive Ave / M St 17 2nd St / Grogan Ave / Northwest Ave 18 Childs Ave / Martin Luther King Wy 19 13th St / Martin Luther King Wy 20 SR-99 SB Ramps / Martin Luther King Wy 21 SR-99 NB Ramps / Martin Luther King Wy 22 14th St / Martin Luther King Wy 23 15th St / Martin Luther King Wy 24 16th St / Martin Luther King Wy 25 13th St / G St 26 SR-99 - 14th St / G St 27 16th St / G Street 28 Olive Ave / G St 29 SR-99 SB On-Ramp / Yosemite Pkwy (SR-140) 30 SR-99 SB Off-Ramp / Yosemite Pkwy (SR-140) 31 SR-99 NB Off-Ramp / Yosemite Pkwy (SR-140) 32 Motel Dr / Glen Ave / Yosemite Pkwy (SR-140)33 14th St / O St 34 13th St / M St 35 14th St / M St 36 Main St / M St 37 18th St / M St 38 15th St / Canal St 39 16th St / Canal St 40 11th St / Martin Luther King Wy 41 Main St / Martin Luther King Wy 42 18th St / Martin Luther King Wy 43 16th St / H St 44 Main St / H St 45 15th St / G St 46 Main St / G St 47 18th St / G St 48 15th St / D St 49 16th St / D St
Intersections selected for analysis are italicized- Indicates intersection does not exist for a particular scenario
Average Total Average TotalDelay Volume Delay Volume
Control LOS (sec) (vph) LOS (sec) (vph)Unsignalized C 17.0 1,414 F 136.2 2,020Signalized D 35.4 2,244 D 39.5 3,186Signalized D 36.4 2,480 D 36.7 2,589Signalized B 18.8 1,786 C 20.9 2,369Signalized B 15.8 1,399 C 24.3 1,965Signalized C 22.1 2,222 C 28.7 2,800Signalized B 14.8 1,728 B 15.6 1,962Signalized C 21.2 1,605 C 21.9 2,030Signalized B 16.8 1,198 C 24.9 1,945Signalized C 32.2 2,025 C 33.9 3,050Signalized D 50.9 2,506 E 56.2 3,826
All-Way Stop A 7.7 307 A 8.8 562Signalized B 19.0 1,195 B 18.4 1,768
All-Way Stop C 21.1 1,233 D 32.0 1,403Signalized C 34.8 2,016 C 35.0 2,745Signalized D 54.5 3,058 E 58.6 3,987
All-Way Stop A 10.0 666 B 10.6 725Signalized D 38.8 1,295 D 41.6 1,580Signalized C 26.2 1,322 C 28.1 1,658
Unsignalized C 21.0 1,287 C 19.1 1,405Unsignalized C 22.4 1,138 D 31.2 1,424Unsignalized C 18.6 931 E 40.6 1,366Signalized B 11.5 870 B 14.5 1,277Signalized C 29.0 1,743 C 33.7 2,421
All-Way Stop E 41.6 1,416 F 55.1 1,612Unsignalized B 17.6 994 C 22.0 1,225
- - - - - - -Signalized D 46.8 3,204 D 48.0 3,683
Unsignalized A 9.5 289 B 12.8 441Unsignalized B 13.7 610 C 16.6 704Unsignalized F 68.6 1,564 F 541.6 1,719Signalized D 45.0 1,663 D 38.8 1,718
Unsignalized B 10.9 280 B 14.3 514All-Way Stop D 27.0 1,232 D 25.1 1,284Unsignalized C 18.8 1,043 C 21.6 1,104Signalized A 9.6 1,603 B 13.1 1,895Signalized B 12.3 1,477 B 13.8 1,593
Unsignalized B 11.7 418 B 14.5 655Unsignalized E 37.2 1,512 F 69.8 1,853Unsignalized C 19.8 1,088 C 21.9 1,253Signalized A 9.5 515 A 9.9 816
All-Way Stop A 7.7 274 A 8.1 369Signalized C 6.5 977 E 6.9 1,309
Unsignalized C 21.3 918 E 42.5 1,158- - - - - - -
Signalized C 20.9 1,632 C 25.1 1,980Signalized A 9.9 1,016 B 11.2 1,043
- - - - - - -- - - - - - -
Existing + ProjectAM Peak PM Peak

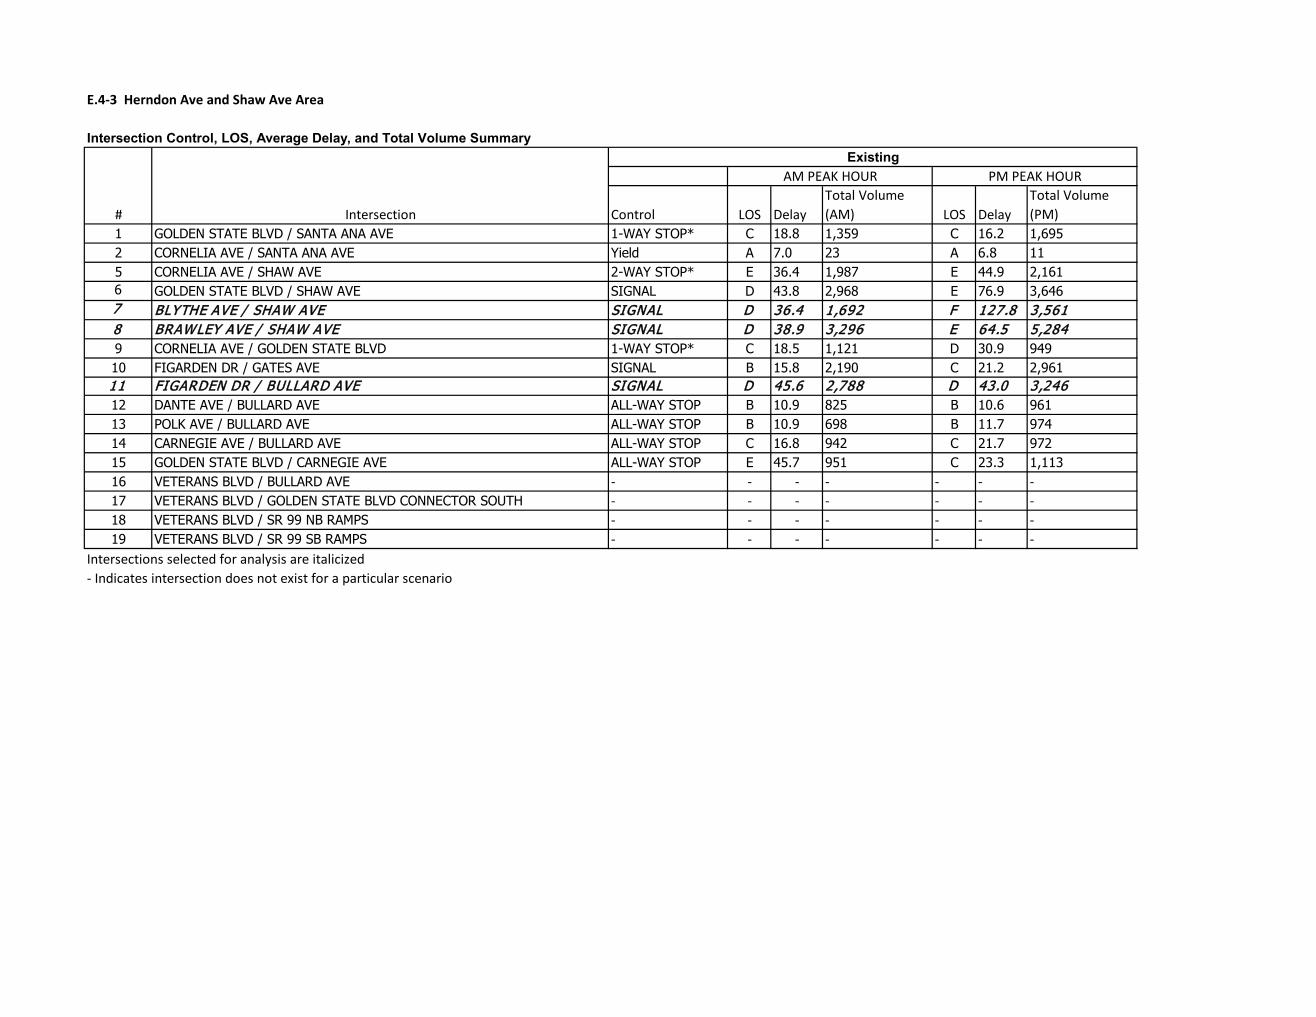
E.4-3 Herndon Ave and Shaw Ave Area
Intersection Control, LOS, Average Delay, and Total Volume Summary
Control LOS DelayTotal Volume (AM) LOS Delay
Total Volume (PM)
1 GOLDEN STATE BLVD / SANTA ANA AVE 1-WAY STOP* C 18.8 1,359 C 16.2 1,6952 CORNELIA AVE / SANTA ANA AVE Yield A 7.0 23 A 6.8 115 CORNELIA AVE / SHAW AVE 2-WAY STOP* E 36.4 1,987 E 44.9 2,1616 GOLDEN STATE BLVD / SHAW AVE SIGNAL D 43.8 2,968 E 76.9 3,6467 BLYTHE AVE / SHAW AVE SIGNAL D 36.4 1,692 F 127.8 3,5618 BRAWLEY AVE / SHAW AVE SIGNAL D 38.9 3,296 E 64.5 5,2849 CORNELIA AVE / GOLDEN STATE BLVD 1-WAY STOP* C 18.5 1,121 D 30.9 94910 FIGARDEN DR / GATES AVE SIGNAL B 15.8 2,190 C 21.2 2,96111 FIGARDEN DR / BULLARD AVE SIGNAL D 45.6 2,788 D 43.0 3,24612 DANTE AVE / BULLARD AVE ALL-WAY STOP B 10.9 825 B 10.6 96113 POLK AVE / BULLARD AVE ALL-WAY STOP B 10.9 698 B 11.7 97414 CARNEGIE AVE / BULLARD AVE ALL-WAY STOP C 16.8 942 C 21.7 97215 GOLDEN STATE BLVD / CARNEGIE AVE ALL-WAY STOP E 45.7 951 C 23.3 1,11316 VETERANS BLVD / BULLARD AVE - - - - - - -17 VETERANS BLVD / GOLDEN STATE BLVD CONNECTOR SOUTH - - - - - - -18 VETERANS BLVD / SR 99 NB RAMPS - - - - - - -19 VETERANS BLVD / SR 99 SB RAMPS - - - - - - -
Intersections selected for analysis are italicized- Indicates intersection does not exist for a particular scenario
# Intersection
AM PEAK HOUR PM PEAK HOURExisting
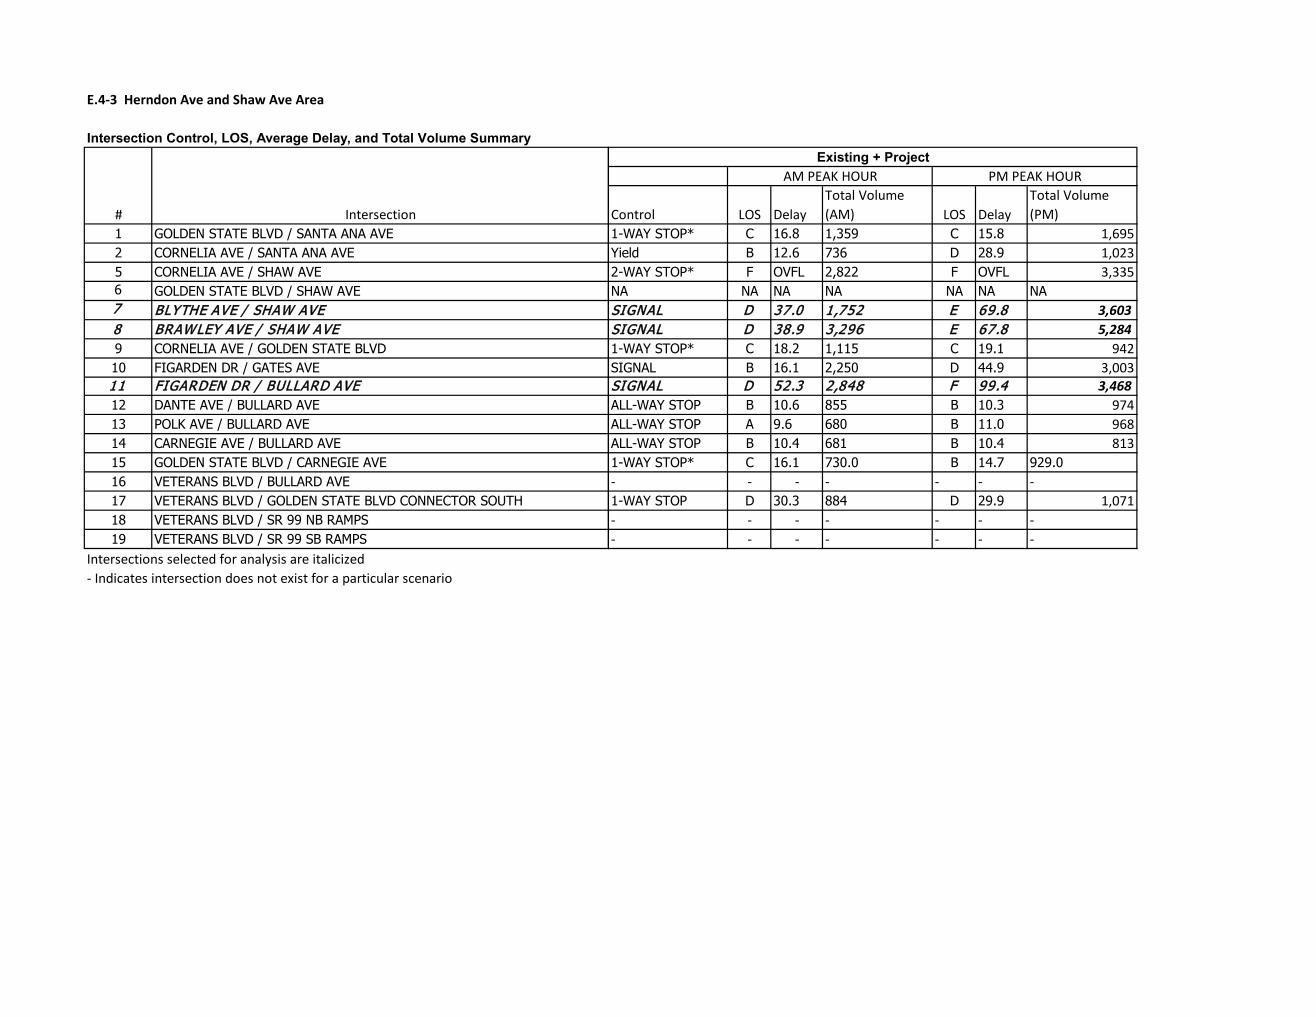
E.4-3 Herndon Ave and Shaw Ave Area
Intersection Control, LOS, Average Delay, and Total Volume Summary
1 GOLDEN STATE BLVD / SANTA ANA AVE2 CORNELIA AVE / SANTA ANA AVE5 CORNELIA AVE / SHAW AVE6 GOLDEN STATE BLVD / SHAW AVE7 BLYTHE AVE / SHAW AVE8 BRAWLEY AVE / SHAW AVE9 CORNELIA AVE / GOLDEN STATE BLVD10 FIGARDEN DR / GATES AVE11 FIGARDEN DR / BULLARD AVE12 DANTE AVE / BULLARD AVE13 POLK AVE / BULLARD AVE14 CARNEGIE AVE / BULLARD AVE15 GOLDEN STATE BLVD / CARNEGIE AVE16 VETERANS BLVD / BULLARD AVE17 VETERANS BLVD / GOLDEN STATE BLVD CONNECTOR SOUTH18 VETERANS BLVD / SR 99 NB RAMPS19 VETERANS BLVD / SR 99 SB RAMPS
Intersections selected for analysis are italicized- Indicates intersection does not exist for a particular scenario
# Intersection Control LOS DelayTotal Volume (AM) LOS Delay
Total Volume (PM)
1-WAY STOP* C 16.8 1,359 C 15.8 1,695Yield B 12.6 736 D 28.9 1,0232-WAY STOP* F OVFL 2,822 F OVFL 3,335NA NA NA NA NA NA NASIGNAL D 37.0 1,752 E 69.8 3,603SIGNAL D 38.9 3,296 E 67.8 5,2841-WAY STOP* C 18.2 1,115 C 19.1 942SIGNAL B 16.1 2,250 D 44.9 3,003SIGNAL D 52.3 2,848 F 99.4 3,468ALL-WAY STOP B 10.6 855 B 10.3 974ALL-WAY STOP A 9.6 680 B 11.0 968ALL-WAY STOP B 10.4 681 B 10.4 8131-WAY STOP* C 16.1 730.0 B 14.7 929.0- - - - - - -1-WAY STOP D 30.3 884 D 29.9 1,071- - - - - - -- - - - - - -
AM PEAK HOUR PM PEAK HOURExisting + Project
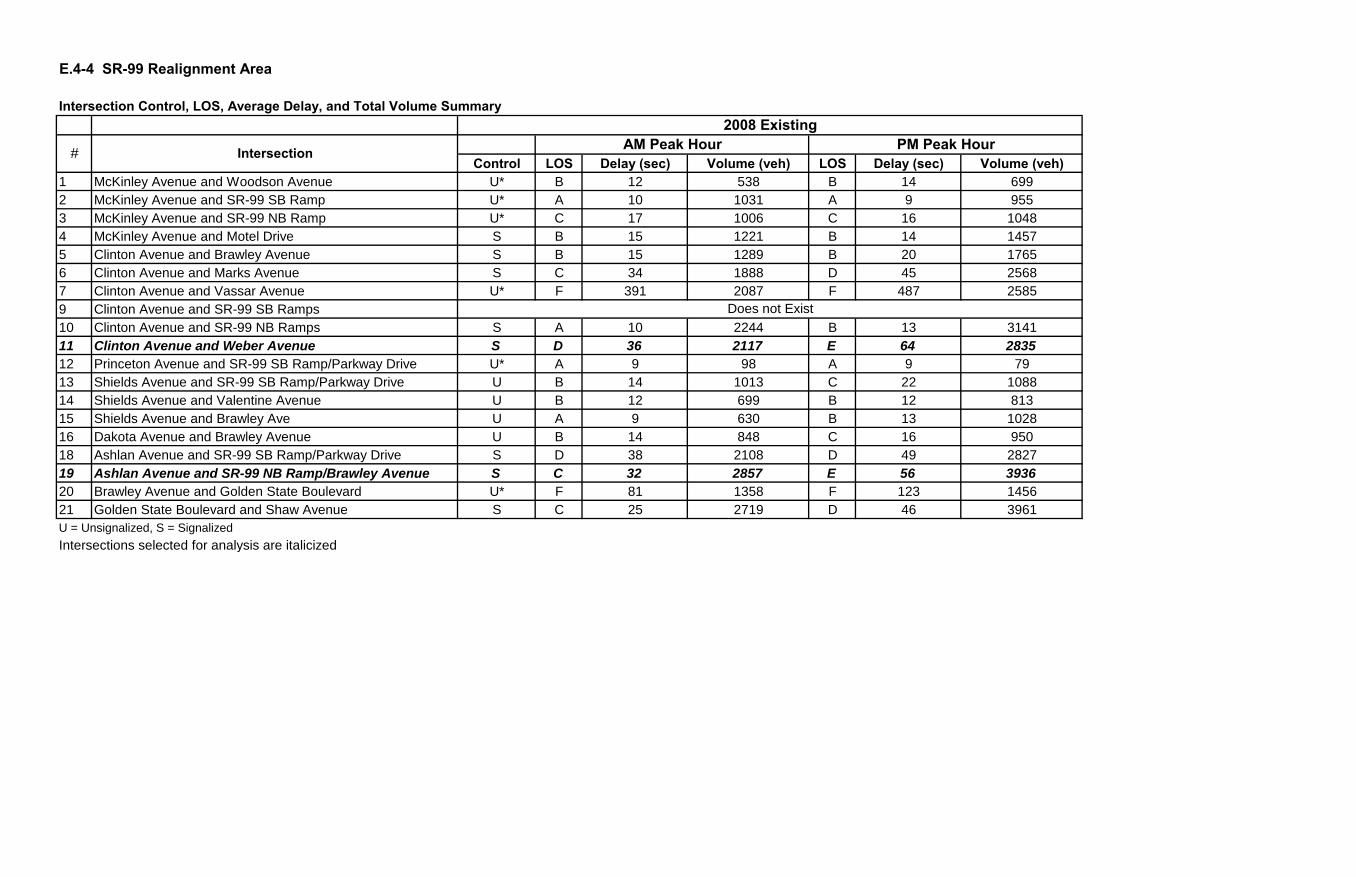
E.4-4 SR-99 Realignment Area
Intersection Control, LOS, Average Delay, and Total Volume Summary
Control LOS Delay (sec) Volume (veh) LOS Delay (sec) Volume (veh)1 McKinley Avenue and Woodson Avenue U* B 12 538 B 14 6992 McKinley Avenue and SR-99 SB Ramp U* A 10 1031 A 9 9553 McKinley Avenue and SR-99 NB Ramp U* C 17 1006 C 16 10484 McKinley Avenue and Motel Drive S B 15 1221 B 14 14575 Clinton Avenue and Brawley Avenue S B 15 1289 B 20 17656 Clinton Avenue and Marks Avenue S C 34 1888 D 45 25687 Clinton Avenue and Vassar Avenue U* F 391 2087 F 487 25859 Clinton Avenue and SR-99 SB Ramps10 Clinton Avenue and SR-99 NB Ramps S A 10 2244 B 13 314111 Clinton Avenue and Weber Avenue S D 36 2117 E 64 283512 Princeton Avenue and SR-99 SB Ramp/Parkway Drive U* A 9 98 A 9 7913 Shields Avenue and SR-99 SB Ramp/Parkway Drive U B 14 1013 C 22 108814 Shields Avenue and Valentine Avenue U B 12 699 B 12 81315 Shields Avenue and Brawley Ave U A 9 630 B 13 102816 Dakota Avenue and Brawley Avenue U B 14 848 C 16 95018 Ashlan Avenue and SR-99 SB Ramp/Parkway Drive S D 38 2108 D 49 282719 Ashlan Avenue and SR-99 NB Ramp/Brawley Avenue S C 32 2857 E 56 393620 Brawley Avenue and Golden State Boulevard U* F 81 1358 F 123 145621 Golden State Boulevard and Shaw Avenue S C 25 2719 D 46 3961U = Unsignalized, S = SignalizedIntersections selected for analysis are italicized
2008 Existing
Intersection# PM Peak HourAM Peak Hour
Does not Exist
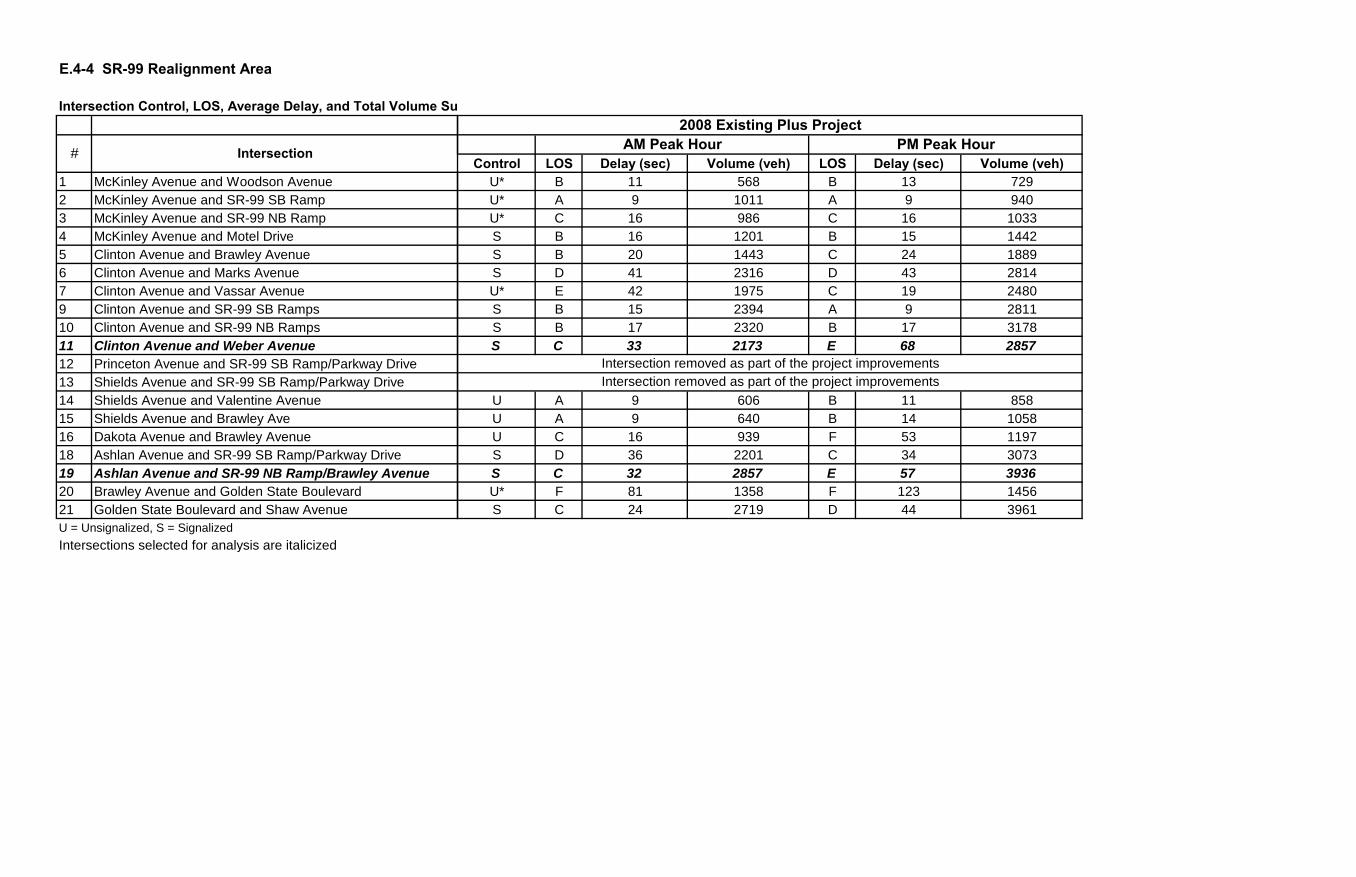
E.4-4 SR-99 Realignment Area
Intersection Control, LOS, Average Delay, and Total Volume Su
1 McKinley Avenue and Woodson Avenue2 McKinley Avenue and SR-99 SB Ramp3 McKinley Avenue and SR-99 NB Ramp4 McKinley Avenue and Motel Drive5 Clinton Avenue and Brawley Avenue6 Clinton Avenue and Marks Avenue7 Clinton Avenue and Vassar Avenue9 Clinton Avenue and SR-99 SB Ramps10 Clinton Avenue and SR-99 NB Ramps11 Clinton Avenue and Weber Avenue12 Princeton Avenue and SR-99 SB Ramp/Parkway Drive13 Shields Avenue and SR-99 SB Ramp/Parkway Drive14 Shields Avenue and Valentine Avenue15 Shields Avenue and Brawley Ave16 Dakota Avenue and Brawley Avenue18 Ashlan Avenue and SR-99 SB Ramp/Parkway Drive19 Ashlan Avenue and SR-99 NB Ramp/Brawley Avenue20 Brawley Avenue and Golden State Boulevard21 Golden State Boulevard and Shaw AvenueU = Unsignalized, S = SignalizedIntersections selected for analysis are italicized
Intersection#Control LOS Delay (sec) Volume (veh) LOS Delay (sec) Volume (veh)
U* B 11 568 B 13 729U* A 9 1011 A 9 940U* C 16 986 C 16 1033S B 16 1201 B 15 1442S B 20 1443 C 24 1889S D 41 2316 D 43 2814U* E 42 1975 C 19 2480S B 15 2394 A 9 2811S B 17 2320 B 17 3178S C 33 2173 E 68 2857
U A 9 606 B 11 858U A 9 640 B 14 1058U C 16 939 F 53 1197S D 36 2201 C 34 3073S C 32 2857 E 57 3936U* F 81 1358 F 123 1456S C 24 2719 D 44 3961
PM Peak HourAM Peak Hour
Intersection removed as part of the project improvementsIntersection removed as part of the project improvements
2008 Existing Plus Project
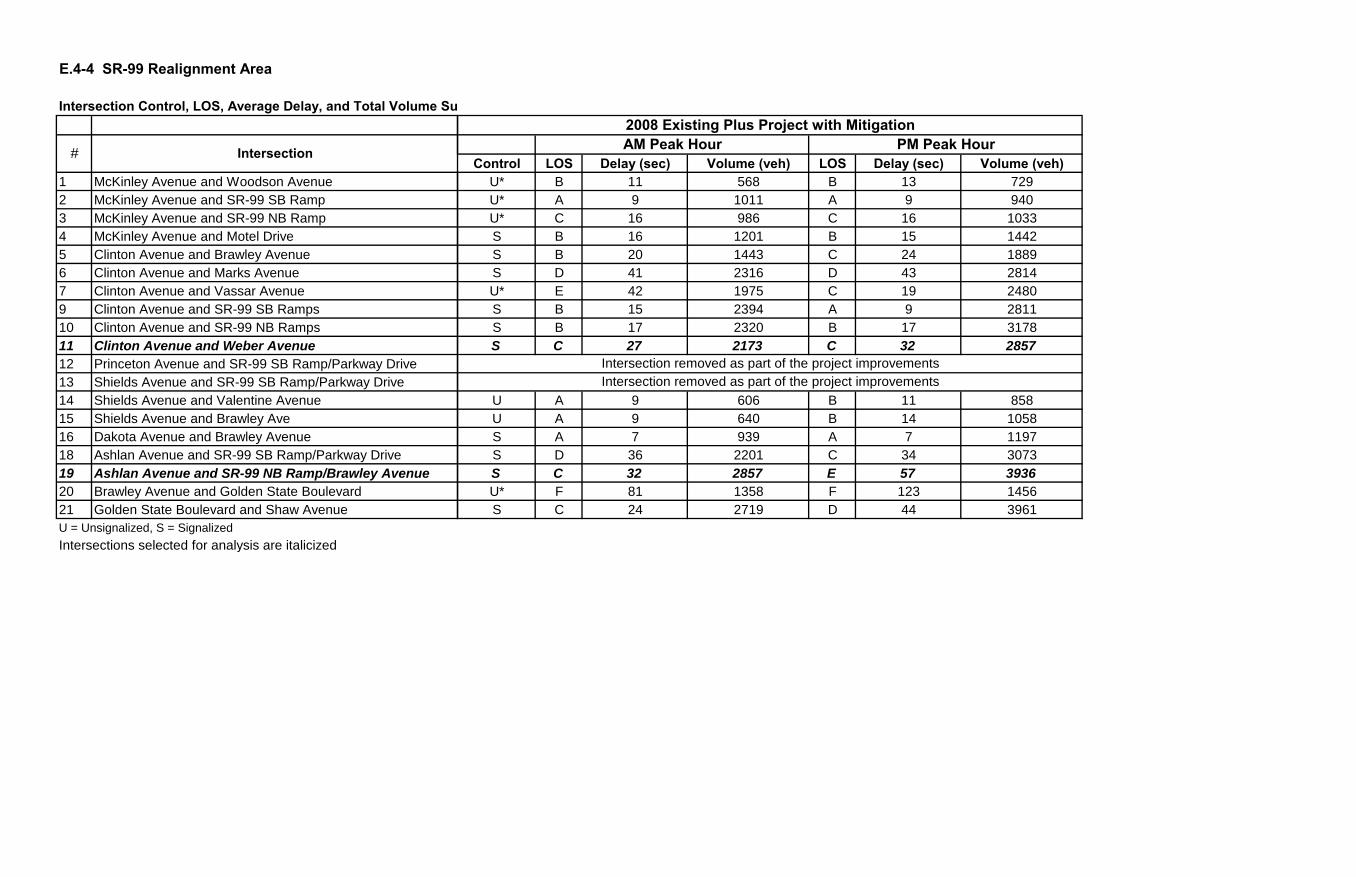
E.4-4 SR-99 Realignment Area
Intersection Control, LOS, Average Delay, and Total Volume Su
1 McKinley Avenue and Woodson Avenue2 McKinley Avenue and SR-99 SB Ramp3 McKinley Avenue and SR-99 NB Ramp4 McKinley Avenue and Motel Drive5 Clinton Avenue and Brawley Avenue6 Clinton Avenue and Marks Avenue7 Clinton Avenue and Vassar Avenue9 Clinton Avenue and SR-99 SB Ramps10 Clinton Avenue and SR-99 NB Ramps11 Clinton Avenue and Weber Avenue12 Princeton Avenue and SR-99 SB Ramp/Parkway Drive13 Shields Avenue and SR-99 SB Ramp/Parkway Drive14 Shields Avenue and Valentine Avenue15 Shields Avenue and Brawley Ave16 Dakota Avenue and Brawley Avenue18 Ashlan Avenue and SR-99 SB Ramp/Parkway Drive19 Ashlan Avenue and SR-99 NB Ramp/Brawley Avenue20 Brawley Avenue and Golden State Boulevard21 Golden State Boulevard and Shaw AvenueU = Unsignalized, S = SignalizedIntersections selected for analysis are italicized
Intersection#Control LOS Delay (sec) Volume (veh) LOS Delay (sec) Volume (veh)
U* B 11 568 B 13 729U* A 9 1011 A 9 940U* C 16 986 C 16 1033S B 16 1201 B 15 1442S B 20 1443 C 24 1889S D 41 2316 D 43 2814U* E 42 1975 C 19 2480S B 15 2394 A 9 2811S B 17 2320 B 17 3178S C 27 2173 C 32 2857
U A 9 606 B 11 858U A 9 640 B 14 1058S A 7 939 A 7 1197S D 36 2201 C 34 3073S C 32 2857 E 57 3936U* F 81 1358 F 123 1456S C 24 2719 D 44 3961
PM Peak HourAM Peak Hour
Intersection removed as part of the project improvementsIntersection removed as part of the project improvements
2008 Existing Plus Project with Mitigation

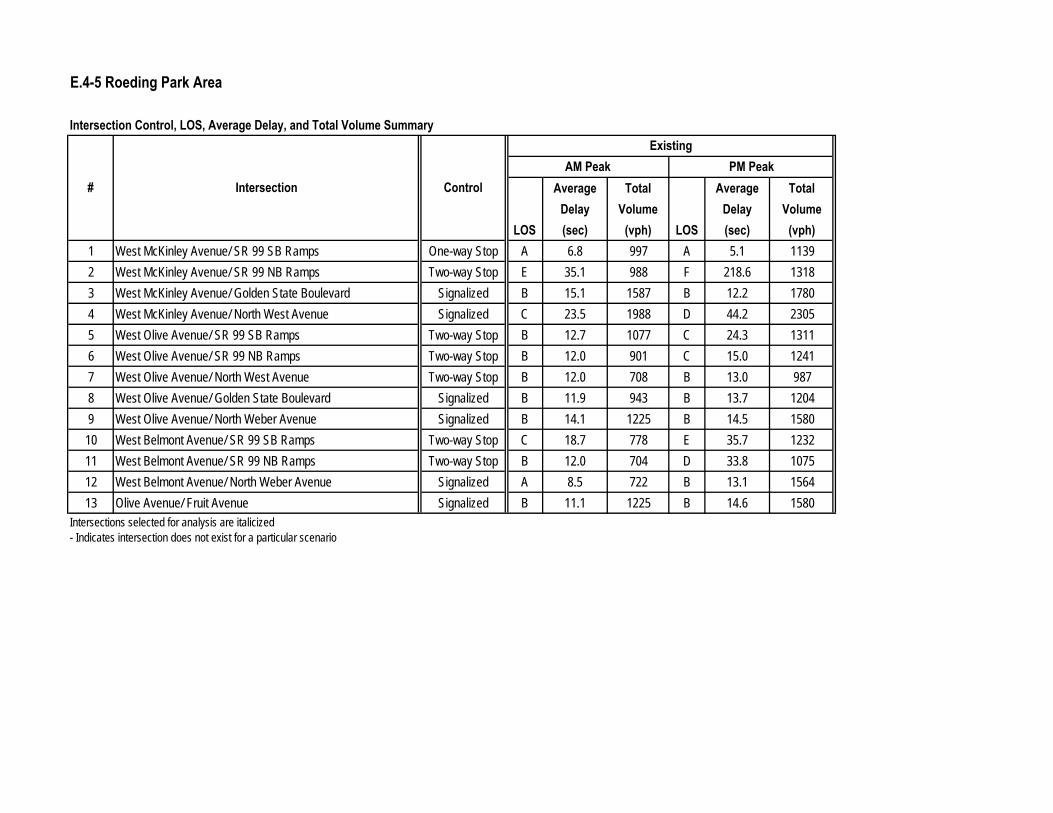
E.4-5 Roeding Park Area
Intersection Control, LOS, Average Delay, and Total Volume Summary
Average Total Average TotalDelay Volume Delay Volume
LOS (sec) (vph) LOS (sec) (vph)1 West McKinley Avenue/ SR 99 SB Ramps One-way Stop A 6.8 997 A 5.1 11392 West McKinley Avenue/ SR 99 NB Ramps Two-way Stop E 35.1 988 F 218.6 13183 West McKinley Avenue/ Golden State Boulevard Signalized B 15.1 1587 B 12.2 17804 West McKinley Avenue/ North West Avenue Signalized C 23.5 1988 D 44.2 23055 West Olive Avenue/ SR 99 SB Ramps Two-way Stop B 12.7 1077 C 24.3 13116 West Olive Avenue/ SR 99 NB Ramps Two-way Stop B 12.0 901 C 15.0 12417 West Olive Avenue/ North West Avenue Two-way Stop B 12.0 708 B 13.0 9878 West Olive Avenue/ Golden State Boulevard Signalized B 11.9 943 B 13.7 12049 West Olive Avenue/ North Weber Avenue Signalized B 14.1 1225 B 14.5 1580
10 West Belmont Avenue/ SR 99 SB Ramps Two-way Stop C 18.7 778 E 35.7 123211 West Belmont Avenue/ SR 99 NB Ramps Two-way Stop B 12.0 704 D 33.8 107512 West Belmont Avenue/ North Weber Avenue Signalized A 8.5 722 B 13.1 156413 Olive Avenue/ Fruit Avenue Signalized B 11.1 1225 B 14.6 1580
Intersections selected for analysis are italicized- Indicates intersection does not exist for a particular scenario
Intersection# Control
ExistingAM Peak PM Peak
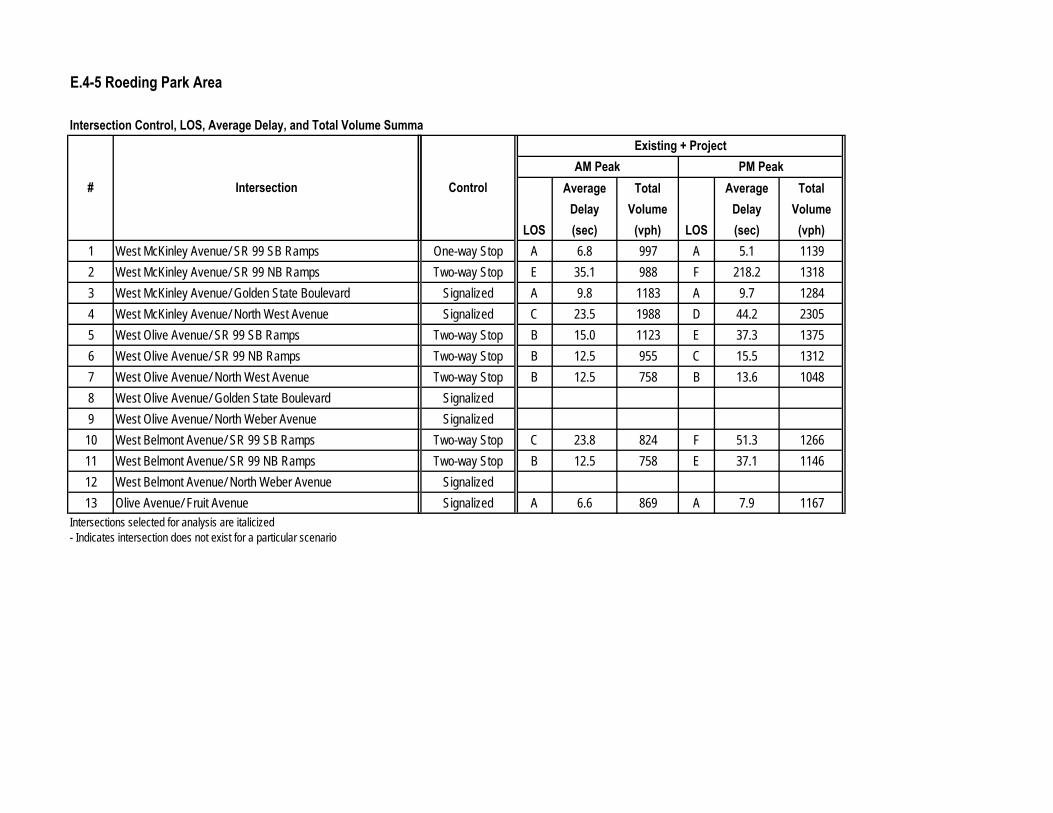
E.4-5 Roeding Park Area
Intersection Control, LOS, Average Delay, and Total Volume Summa
1 West McKinley Avenue/ SR 99 SB Ramps2 West McKinley Avenue/ SR 99 NB Ramps3 West McKinley Avenue/ Golden State Boulevard4 West McKinley Avenue/ North West Avenue5 West Olive Avenue/ SR 99 SB Ramps6 West Olive Avenue/ SR 99 NB Ramps7 West Olive Avenue/ North West Avenue8 West Olive Avenue/ Golden State Boulevard9 West Olive Avenue/ North Weber Avenue
10 West Belmont Avenue/ SR 99 SB Ramps11 West Belmont Avenue/ SR 99 NB Ramps12 West Belmont Avenue/ North Weber Avenue13 Olive Avenue/ Fruit Avenue
Intersections selected for analysis are italicized- Indicates intersection does not exist for a particular scenario
Intersection# Average Total Average TotalDelay Volume Delay Volume
LOS (sec) (vph) LOS (sec) (vph)One-way Stop A 6.8 997 A 5.1 1139Two-way Stop E 35.1 988 F 218.2 1318
Signalized A 9.8 1183 A 9.7 1284Signalized C 23.5 1988 D 44.2 2305
Two-way Stop B 15.0 1123 E 37.3 1375Two-way Stop B 12.5 955 C 15.5 1312Two-way Stop B 12.5 758 B 13.6 1048
SignalizedSignalized
Two-way Stop C 23.8 824 F 51.3 1266Two-way Stop B 12.5 758 E 37.1 1146
SignalizedSignalized A 6.6 869 A 7.9 1167
Control
Existing + ProjectAM Peak PM Peak
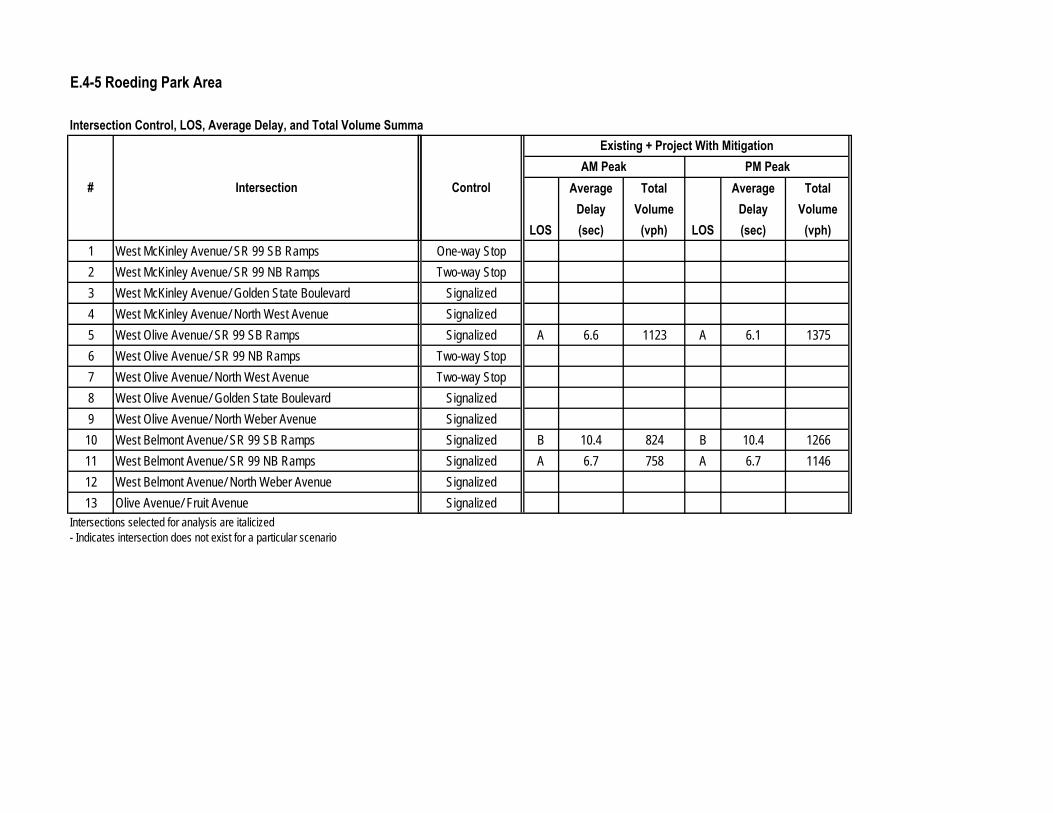
E.4-5 Roeding Park Area
Intersection Control, LOS, Average Delay, and Total Volume Summa
1 West McKinley Avenue/ SR 99 SB Ramps2 West McKinley Avenue/ SR 99 NB Ramps3 West McKinley Avenue/ Golden State Boulevard4 West McKinley Avenue/ North West Avenue5 West Olive Avenue/ SR 99 SB Ramps6 West Olive Avenue/ SR 99 NB Ramps7 West Olive Avenue/ North West Avenue8 West Olive Avenue/ Golden State Boulevard9 West Olive Avenue/ North Weber Avenue
10 West Belmont Avenue/ SR 99 SB Ramps11 West Belmont Avenue/ SR 99 NB Ramps12 West Belmont Avenue/ North Weber Avenue13 Olive Avenue/ Fruit Avenue
Intersections selected for analysis are italicized- Indicates intersection does not exist for a particular scenario
Intersection# Average Total Average TotalDelay Volume Delay Volume
LOS (sec) (vph) LOS (sec) (vph)One-way StopTwo-way Stop
SignalizedSignalizedSignalized A 6.6 1123 A 6.1 1375
Two-way StopTwo-way Stop
SignalizedSignalizedSignalized B 10.4 824 B 10.4 1266Signalized A 6.7 758 A 6.7 1146SignalizedSignalized
Control
Existing + Project With MitigationAM Peak PM Peak

APPENDIX F
Potential Air Quality Impacts of Heavy Maintenance Facility Operations

CALIFORNIA HIGH-SPEED RAIL PROJECT
APPENDIX F
POTENTIAL AIR QUALITY IMPACTS OF HEAVY MAINTENANCE FACILITY (HMF)
OPERATIONS
Parsons Brinckerhoff
August 2011

CALIFORNIA HIGH-SPEED RAIL PROJECT Appendix to Air Quality Chapter
III
TABLE OF CONTENTS
1.0 INTRODUCTION ..................................................................................................................................... 1
2.0 POLLUTANTS OF CONCERN .................................................................................................................... 1
3.0 EMISSION FACTORS AND RATES ............................................................................................................. 2
4.0 DISPERSION MODELING ......................................................................................................................... 7
5.0 HEALTH RISK METHODOLOGY ................................................................................................................ 7
5.1 CANCER RISK .................................................................................................................................................... 7 5.1.1 Daily Breathing Rate (DBR) ...................................................................................................................... 8 5.1.2 Cancer Potency Factor (CP) ...................................................................................................................... 8 5.1.3 Exposure Value Factors ............................................................................................................................ 9
5.2 CHRONIC NONCANCER RISK ................................................................................................................................ 9 5.3 ACUTE HAZARD RISK .......................................................................................................................................... 9
6.0 RESULTS ............................................................................................................................................... 10
6.1 CRITERIA POLLUTANTS ..................................................................................................................................... 10 6.2 TOXIC POLLUTANTS ......................................................................................................................................... 10
6.2.1 Chronic Noncancer Risk.......................................................................................................................... 10 6.2.2 Acute Risk ............................................................................................................................................... 10 6.2.3 Cancer Risks ........................................................................................................................................... 11
7.0 CONCLUSIONS ...................................................................................................................................... 11
TABLES
TABLE 1 SWITCH LOCOMOTIVE HORSE‐POWER AND LOAD FACTORS ............................................................................................ 3 TABLE 2 PM10 EMISSION RATES FOR SWITCH LOCOMOTIVE AND DIESEL EQUIPMENT ...................................................................... 4 TABLE 3 PM2.5 EMISSION RATES FOR SWITCH LOCOMOTIVE AND DIESEL EQUIPMENT ...................................................................... 5 TABLE 4 NO2 EMISSION RATES FOR SWITCH LOCOMOTIVES AND DIESEL EQUIPMENT ...................................................................... 6 TABLE 5 TOTAL ESTIMATED CONCENTRATIONS OF THE CRITERIA POLLUTANTS AT THE PROPERTY LINE ............................................... 10 TABLE 6 CHRONIC NON‐CANCER HAZARD INDEX AT THE HMF PROPERTY LINE ............................................................................ 12 TABLE 7 TOTAL ACUTE HAZARD INDEX AT THE HMF PROPERTY LINE .......................................................................................... 13 TABLE 8 DIESEL PM AND TAC CANCER RISK CALCULATIONS AT THE DISTANCE OF 500 FEET FROM HMF BOUNDARY .......................... 14 TABLE 9 DIESEL PM AND TAC CANCER RISK CALCULATIONS AT THE DISTANCE OF 1,000 FEET FROM HMF BOUNDARY ....................... 15 TABLE 10 DIESEL PM AND TAC CANCER RISK CALCULATIONS AT THE DISTANCE OF 1,300 FEET FROM HMF BOUNDARY ..................... 16 TABLE 11 DIESEL PM AND TAC CANCER RISK CALCULATIONS AT THE DISTANCE OF 2,000 FEET FROM HMF BOUNDARY ..................... 17 TABLE 12 DIESEL PM AND TAC CANCER RISK CALCULATIONS AT THE DISTANCE OF 3,000 FEET FROM HMF BOUNDARY ..................... 18 TABLE 13 DIESEL PM AND TAC CANCER RISK CALCULATIONS AT THE DISTANCE OF 5,000 FEET FROM HMF BOUNDARY ..................... 19

CALIFORNIA HIGH-SPEED RAIL PROJECT Appendix to Air Quality Chapter
1
1.0 Introduction
The HST project will include a heavy maintenance facility (HMF) that would service and repair the rail cars and locomotives. The facility would include locomotives, diesel equipment (e.g., cranes, backhoes, loaders, etc.), heavy-duty diesel trucks, and a spray booth for painting the trains. While measures would be incorporated to minimize atmospheric emissions from these sources, such as the use of electric yard trains to move the rail cars and electric locomotives around the site, the use of diesel-retrofits on heavy-duty diesel engines, etc., the activities at the HMF site would generate emissions that could impact nearby sensitive land uses. The major sources of HMF emissions include:
Switch diesel locomotive activities associated with maintenance of way operations;
Spray booth painting operations;
Diesel equipment; and
Diesel trucks.
While only one HMF will be needed for the HST project, several sites are currently being considered. Some of these may have sensitive land uses located nearby. As no one site has been selected, an air quality analysis was conducted for a prototypical facility (using the current facility design and anticipated activities) to determine whether HMF operations have the potential to significantly impact nearby sensitive land uses.
2.0 Pollutants of Concern
Criteria pollutants (i.e. pollutants for which national ambient air quality standards [NAAQS] have been established), pollutants for which California ambient air quality standards [CAAQS] have been established, and non-criteria toxic air contaminants (TACs) were considered in this analysis of potential localized impacts. The criteria pollutants considered are:
Nitrogen dioxide (NO2) from diesel locomotives, diesel equipment, and trucks; and
Particulate matter smaller than 10 microns (PM10) and particulate matter smaller than 2.5 microns (PM2.5) from diesel locomotives, diesel equipment, trucks, and spray booth operations.
The TACs considered are contaminants identified by the California Air Resources Board (CARB) and the California Office of Environmental Health Hazard Assessment (OEHHA) that may be emitted from HMF operations, including diesel engines and spray booth activities. Of these, the most critical pollutant for determining the potential health effects of the HMF operations is diesel particulate matter (diesel PM), which has been identified by CARB as a TAC based on its potential to cause cancer and other adverse health problems, including respiratory illnesses, and increased risk of heart disease. There are also a number of toxic pollutants (with various toxicities) that are either caricnogenic or non-carconogenic that can also be potentially released from spray booth operations and diesel vehicular exhaust.
Analyses were conducted that considered chronic (long-term) carcinogenic, chronic non-carcinogenic, and acute (short-term) health risks. These analyses were conducted following San Joaquin Valley Air Pollution Control District (SJVAPCD) modeling guidance for a diesel “only” facility, which is defined as a facility where diesel PM is the predominant TAC and where emissions of other toxic pollutants will not contribute significantly (i.e., cancer risk greater than 1 in one million) to the overall risk.
CALIFORNIA HIGH-SPEED RAIL PROJECT Appendix to Air Quality Chapter
2
3.0 Emission Factors and Rates
Emission factors from the locomotives and diesel-powered engines of the equipment and trucks and spray booth operations were estimated as follows:
PM10, PM2.5, and NO2 emissions from switch locomotives were estimated assuming these vehicles would comply with EPA Tier 4 emission standards (which are standards also adopted by CARB) applicable for newly manufactured (after 2015) locomotives (73 FR 88 25098-25352, May 6, 2008) that utilize stringent control technologies and use ultra-low sulfur diesel fuel, and locomotive emission rates were estimated based on locomotive type, notch setting, activity time, and duration;
For other diesel equipment, EPA’s Tier 4 emission standards for non-road diesel engines were used (69 FR 38957-39273, 29 June 2004);
PM10 emission factors were used to represent diesel PM;
Diesel truck emissions were estimated using EMFAC2007, CARB’s latest vehicular emission factor algorithm; and
Volatile organic compounds (VOCs) from paint booth emissions were estimated using conservative volatility rates and paint usage projections assuming that the paint booths would be equipped with conventional filters with 90% control efficiency. Speciation of VOC compounds from these emissions was obtained from CARB’s Organic Speciation Profile for Surface Coating Operations. Speciation of VOC compounds from diesel combustion emissions was obtained from CARB’s Organic Speciation Profile for Diesel Light & Heavy Equipment.
Emission rates for the locomotives, diesel equipment, and trucks were estimated based on the following HMF operating scenario, which was supplied by the project’s design engineers:
Two (2) switch locomotives (for maintenance-of-way operations) and six (6) pieces of diesel-fueled equipment would be operating at the HMF;
Two (2) maintenance-of-way locomotives, which are assumed to be 2,000 horse-power (hp) each, would be idling for 2 hours and moving around the HMF site for 2 hours over a 24-hour period, and the locomotives would go through all notches (gears) when moving (see Table 1 for the hp and load factors used in this analysis);
The diesel equipment, which is assumed to be 200 hp each, would be operating continuously for 8 hours over a 24-hour period; and
Twenty (20) diesel trucks would be operating on the site continuously for 8 hours over each 24-hour period.
Tables 2, 3, and 4 present estimated PM10, PM2.5, and NO2 emission rates estimated for locomotives, diesel equipment, and trucks, respectively, together with the parameters and references used to develop these estimates.
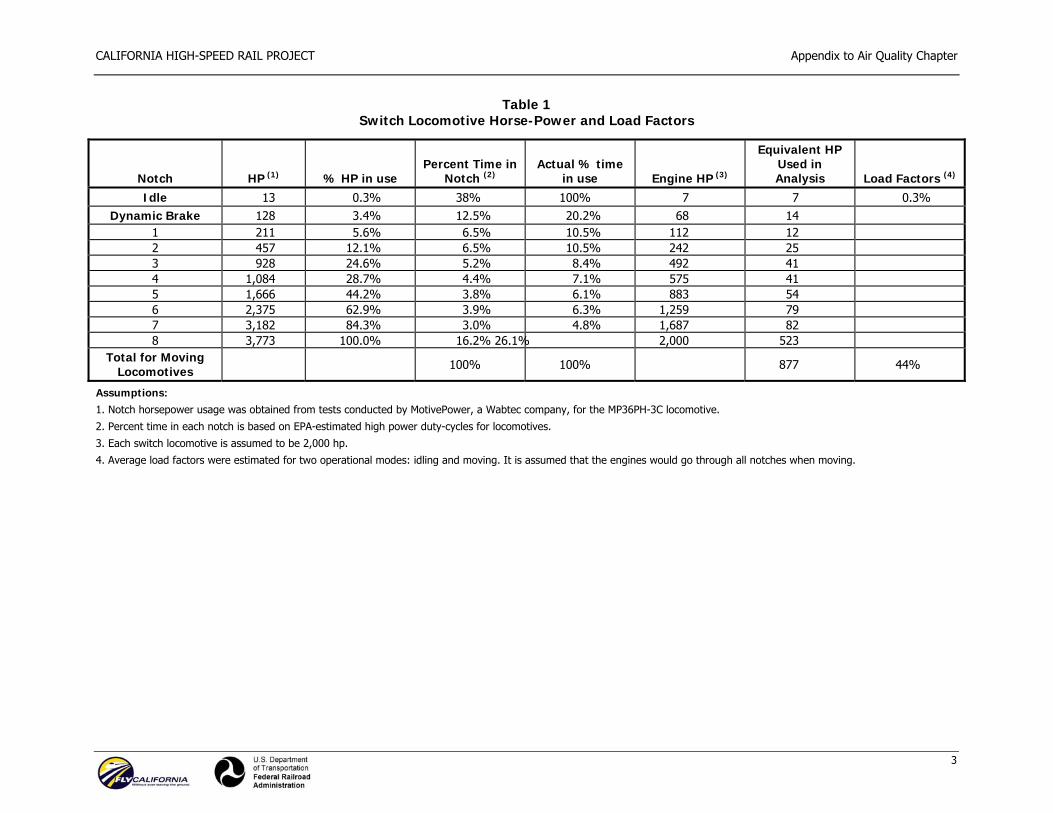
CALIFORNIA HIGH-SPEED RAIL PROJECT Appendix to Air Quality Chapter
3
Table 1 Switch Locomotive Horse-Power and Load Factors
Notch HP (1) % HP in use Percent Time in
Notch (2) Actual % time
in use Engine HP (3)
Equivalent HP Used in Analysis Load Factors (4)
Idle 13 0.3% 38% 100% 7 7 0.3% Dynamic Brake 128 3.4% 12.5% 20.2% 68 14
1 211 5.6% 6.5% 10.5% 112 12 2 457 12.1% 6.5% 10.5% 242 25 3 928 24.6% 5.2% 8.4% 492 41 4 1,084 28.7% 4.4% 7.1% 575 41 5 1,666 44.2% 3.8% 6.1% 883 54 6 2,375 62.9% 3.9% 6.3% 1,259 79 7 3,182 84.3% 3.0% 4.8% 1,687 82 8 3,773 100.0% 16.2% 26.1% 2,000 523
Total for Moving Locomotives 100% 100% 877 44%
Assumptions: 1. Notch horsepower usage was obtained from tests conducted by MotivePower, a Wabtec company, for the MP36PH-3C locomotive.
2. Percent time in each notch is based on EPA-estimated high power duty-cycles for locomotives.
3. Each switch locomotive is assumed to be 2,000 hp.
4. Average load factors were estimated for two operational modes: idling and moving. It is assumed that the engines would go through all notches when moving.
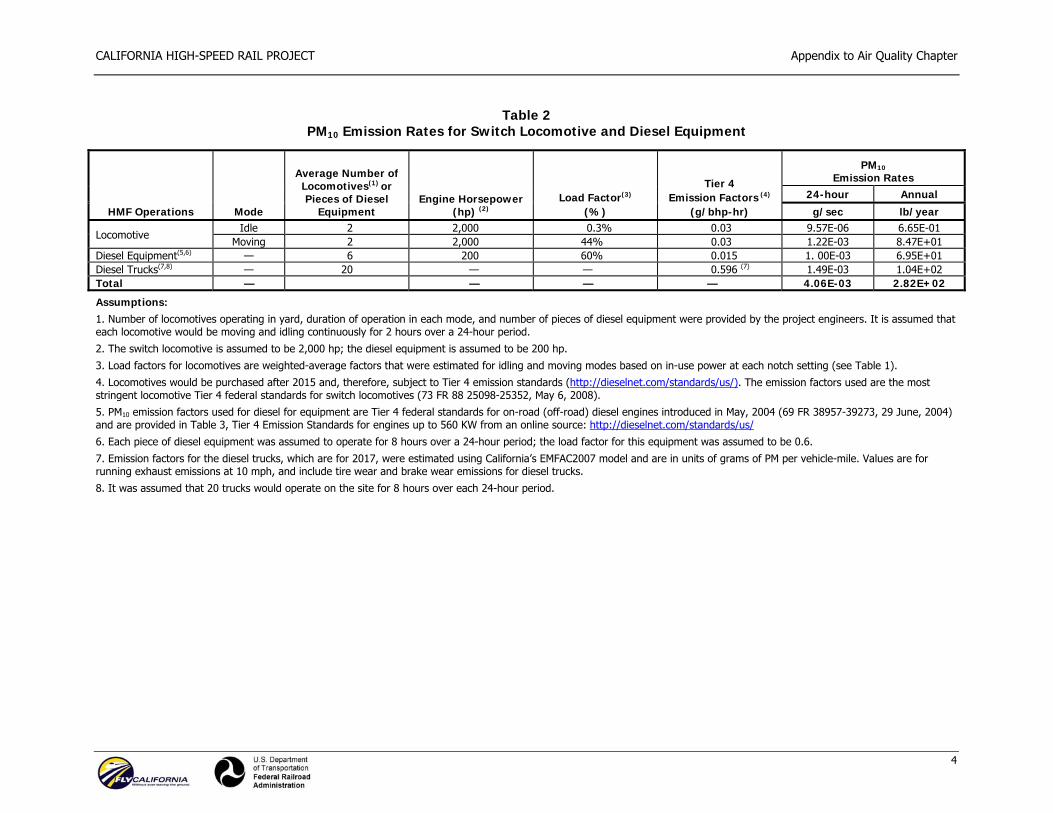
CALIFORNIA HIGH-SPEED RAIL PROJECT Appendix to Air Quality Chapter
4
Table 2 PM10 Emission Rates for Switch Locomotive and Diesel Equipment
Assumptions: 1. Number of locomotives operating in yard, duration of operation in each mode, and number of pieces of diesel equipment were provided by the project engineers. It is assumed that each locomotive would be moving and idling continuously for 2 hours over a 24-hour period.
2. The switch locomotive is assumed to be 2,000 hp; the diesel equipment is assumed to be 200 hp.
3. Load factors for locomotives are weighted-average factors that were estimated for idling and moving modes based on in-use power at each notch setting (see Table 1).
4. Locomotives would be purchased after 2015 and, therefore, subject to Tier 4 emission standards (http://dieselnet.com/standards/us/). The emission factors used are the most stringent locomotive Tier 4 federal standards for switch locomotives (73 FR 88 25098-25352, May 6, 2008).
5. PM10 emission factors used for diesel for equipment are Tier 4 federal standards for on-road (off-road) diesel engines introduced in May, 2004 (69 FR 38957-39273, 29 June, 2004) and are provided in Table 3, Tier 4 Emission Standards for engines up to 560 KW from an online source: http://dieselnet.com/standards/us/
6. Each piece of diesel equipment was assumed to operate for 8 hours over a 24-hour period; the load factor for this equipment was assumed to be 0.6.
7. Emission factors for the diesel trucks, which are for 2017, were estimated using California’s EMFAC2007 model and are in units of grams of PM per vehicle-mile. Values are for running exhaust emissions at 10 mph, and include tire wear and brake wear emissions for diesel trucks.
8. It was assumed that 20 trucks would operate on the site for 8 hours over each 24-hour period.
HMF Operations Mode
Average Number of Locomotives(1) or Pieces of Diesel
Equipment Engine Horsepower
(hp) (2) Load Factor(3)
(%)
Tier 4 Emission Factors (4)
(g/bhp-hr)
PM10 Emission Rates
24-hour Annual
g/sec lb/year
Locomotive Idle 2 2,000 0.3% 0.03 9.57E-06 6.65E-01
Moving 2 2,000 44% 0.03 1.22E-03 8.47E+01 Diesel Equipment(5,6) — 6 200 60% 0.015 1. 00E-03 6.95E+01 Diesel Trucks(7,8) — 20 — — 0.596 (7) 1.49E-03 1.04E+02 Total — — — — 4.06E-03 2.82E+02
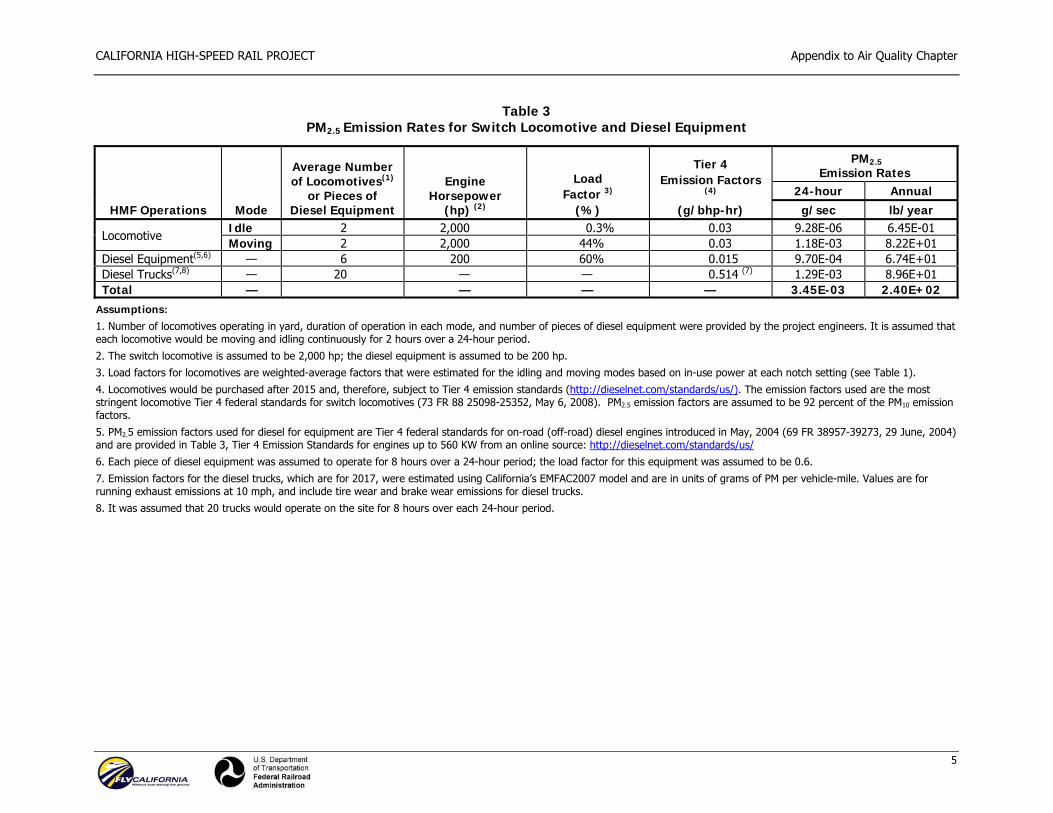
CALIFORNIA HIGH-SPEED RAIL PROJECT Appendix to Air Quality Chapter
5
Table 3 PM2.5 Emission Rates for Switch Locomotive and Diesel Equipment
HMF Operations Mode
Average Number of Locomotives(1)
or Pieces of Diesel Equipment
Engine Horsepower
(hp) (2)
Load Factor 3)
(%)
Tier 4 Emission Factors
(4)
(g/bhp-hr)
PM2.5 Emission Rates
24-hour Annual g/sec lb/year
Locomotive Idle 2 2,000 0.3% 0.03 9.28E-06 6.45E-01 Moving 2 2,000 44% 0.03 1.18E-03 8.22E+01
Diesel Equipment(5,6) — 6 200 60% 0.015 9.70E-04 6.74E+01 Diesel Trucks(7,8) — 20 — — 0.514 (7) 1.29E-03 8.96E+01 Total — — — — 3.45E-03 2.40E+02
Assumptions: 1. Number of locomotives operating in yard, duration of operation in each mode, and number of pieces of diesel equipment were provided by the project engineers. It is assumed that each locomotive would be moving and idling continuously for 2 hours over a 24-hour period.
2. The switch locomotive is assumed to be 2,000 hp; the diesel equipment is assumed to be 200 hp.
3. Load factors for locomotives are weighted-average factors that were estimated for the idling and moving modes based on in-use power at each notch setting (see Table 1).
4. Locomotives would be purchased after 2015 and, therefore, subject to Tier 4 emission standards (http://dieselnet.com/standards/us/). The emission factors used are the most stringent locomotive Tier 4 federal standards for switch locomotives (73 FR 88 25098-25352, May 6, 2008). PM2.5 emission factors are assumed to be 92 percent of the PM10 emission factors.
5. PM2.5 emission factors used for diesel for equipment are Tier 4 federal standards for on-road (off-road) diesel engines introduced in May, 2004 (69 FR 38957-39273, 29 June, 2004) and are provided in Table 3, Tier 4 Emission Standards for engines up to 560 KW from an online source: http://dieselnet.com/standards/us/
6. Each piece of diesel equipment was assumed to operate for 8 hours over a 24-hour period; the load factor for this equipment was assumed to be 0.6.
7. Emission factors for the diesel trucks, which are for 2017, were estimated using California’s EMFAC2007 model and are in units of grams of PM per vehicle-mile. Values are for running exhaust emissions at 10 mph, and include tire wear and brake wear emissions for diesel trucks.
8. It was assumed that 20 trucks would operate on the site for 8 hours over each 24-hour period.
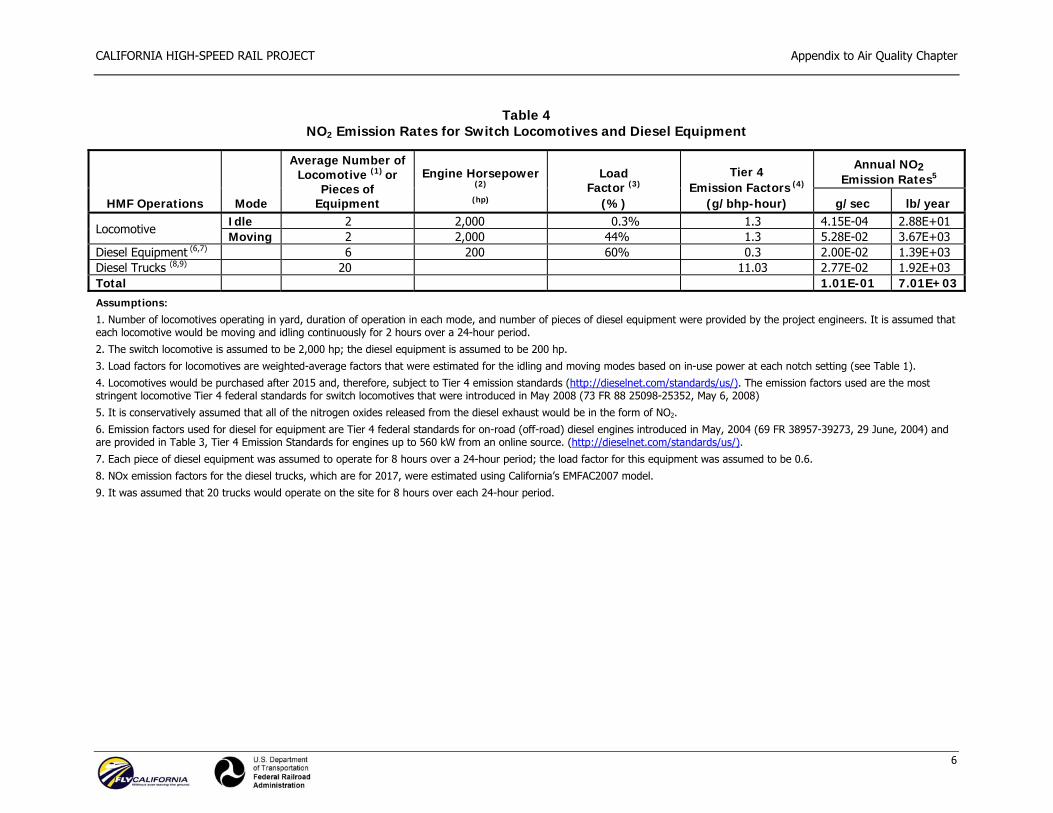
CALIFORNIA HIGH-SPEED RAIL PROJECT Appendix to Air Quality Chapter
6
Table 4 NO2 Emission Rates for Switch Locomotives and Diesel Equipment
HMF Operations Mode
Average Number of Locomotive (1) or
Pieces of Equipment
Engine Horsepower (2)
(hp)
Load Factor (3)
(%)
Tier 4 Emission Factors (4)
(g/bhp-hour)
Annual NO2 Emission Rates5
g/sec lb/year
Locomotive Idle 2 2,000 0.3% 1.3 4.15E-04 2.88E+01 Moving 2 2,000 44% 1.3 5.28E-02 3.67E+03
Diesel Equipment (6,7) 6 200 60% 0.3 2.00E-02 1.39E+03 Diesel Trucks (8,9) 20 11.03 2.77E-02 1.92E+03 Total 1.01E-01 7.01E+03Assumptions: 1. Number of locomotives operating in yard, duration of operation in each mode, and number of pieces of diesel equipment were provided by the project engineers. It is assumed that each locomotive would be moving and idling continuously for 2 hours over a 24-hour period.
2. The switch locomotive is assumed to be 2,000 hp; the diesel equipment is assumed to be 200 hp.
3. Load factors for locomotives are weighted-average factors that were estimated for the idling and moving modes based on in-use power at each notch setting (see Table 1).
4. Locomotives would be purchased after 2015 and, therefore, subject to Tier 4 emission standards (http://dieselnet.com/standards/us/). The emission factors used are the most stringent locomotive Tier 4 federal standards for switch locomotives that were introduced in May 2008 (73 FR 88 25098-25352, May 6, 2008)
5. It is conservatively assumed that all of the nitrogen oxides released from the diesel exhaust would be in the form of NO2.
6. Emission factors used for diesel for equipment are Tier 4 federal standards for on-road (off-road) diesel engines introduced in May, 2004 (69 FR 38957-39273, 29 June, 2004) and are provided in Table 3, Tier 4 Emission Standards for engines up to 560 kW from an online source. (http://dieselnet.com/standards/us/).
7. Each piece of diesel equipment was assumed to operate for 8 hours over a 24-hour period; the load factor for this equipment was assumed to be 0.6.
8. NOx emission factors for the diesel trucks, which are for 2017, were estimated using California’s EMFAC2007 model.
9. It was assumed that 20 trucks would operate on the site for 8 hours over each 24-hour period.
CALIFORNIA HIGH-SPEED RAIL PROJECT Appendix to Air Quality Chapter
7
4.0 Dispersion Modeling
As the operation of the HMF has the potential to cause health impacts on nearby sensitive land uses, detailed dispersion modeling analyses were conducted to determine whether these impacts would be significant. USEPA’s AERMOD atmospheric dispersion model was used to simulate physical conditions and predict pollutant concentrations at the facility’s property line and at specified distances from the boundaries of a prototypical HMF facility.
AERMOD is generally applied to estimate impacts from simple point-source emissions from stacks as well as emissions from volume and area sources. The model accepts actual hourly meteorological observations and directly estimates hourly and average concentrations for various time periods. Regulatory default options and the rural dispersion algorithm of the AERMOD model were conservatvely used in these analyses.
The final site of the HMF has not as yet been selected and there are several potential sites between Merced and Bakersfield that are being considered. As such, site-specific coordinates that include locations of nearby sensitive land uses cannot be considered at this time. Instead, a prototypical site was analyzed (using a conceptual design and anticipated HMF activities), and pollutant concentrations were estimated at the site’s property line and distances of approximately 500, 1,000, 1,300, 3,000, and 5,000 feet from the site boundary. Receptors were located around the property boundary in increments of 25 meters, as specified in SJVAPCD modeling guidance. The maximum concentrations found at any location were used to estimate potential impacts, and these values were compared with applicable federal and state air quality standards and health-related guidelines.
Emissions from all operations were simulated as one area source spread out over the 140 acre prototypical HMF site. An emissions release height was assumed to be 4.5 meters (14.8 feet) to approximate the stack heights of the locomotive engines, diesel trucks, and spray booth stack(s). Five years of meteorological data (i.e., 2004 through 2009) from Merced County Airport, as compiled by SJVAPCD, were used for all analyses.
The results of these analyses were used to estimate worst-case pollutant (criteria and TAC) concentrations for:
Comparison with the NAAQS and CAAQS; and
Input to the health risk analysis.
5.0 Health Risk Methodology
Maximum estimated dispersion modeling concentrations of diesel PM and other representative TACs were used to calculate cancer risks, chronic noncancer health risks, and acute health risks associated with HMF operations. The following methodologies were applied.
5.1 Cancer Risk
From the multiple pollutants that may be emitted from diesel vehicular exhaust, and spray booth operations, six pollutants, are considered by OEHHA as carcinogens for which cancer potency factors (or unit risk factors) were developed. These are diesel PM, benzene, 1, 3-butadiene, acetaldehyde, formaldehyde, and methylene chloride. The maximum individual cancer risk for each pollutant and total incremental cancer risks associated with these pollutant releases were calculated as described below. The 5-year average AERMOD-estimated concentrations were used for these calculations, as recommended by the SJVAPCD. Metal elements bounded to PM from vehicular exhaust, such as arsenic, cadmium, nickel, and others, were considered as part of the diesel PM.
CALIFORNIA HIGH-SPEED RAIL PROJECT Appendix to Air Quality Chapter
8
The cancer risk calculation procedures developed by OEHHA, together with OEHHA/CARB-approved health values for health risk assessments, that were used are based on the following:
Guidance for Air Dispersion Modeling, San Joaquin Valley Air Pollution Control District, Section 2.7 Alternative Modeling Procedures, Diesel "Only" Facilities, Page 81, Calculation of the Diesel PM Adjustment Factor; and
OEHHA Air Toxics Hot Spots Program Risk Assessment Guidelines, OEHHA, 2003, OEHHA/ARB Approved Health Values for Use in Hot Spot Facility Risk Assessments, Appendix L – Table 1, Cancer Risk, Inhalation Cancer Potency Factors and Chronic Inhalation REL and Acute REL values.
The detailed procedures and equations used in these calculations are as follows:
Inhalation Dose = Cair x DBR x A x EF x ED x 10-6/AT
Where,
Cair = concentration in air (ug/m3)
DBR = Daily Breathing Rate (L/kg body weight-day)
A = Inhalation absorption factor
EF = Exposure frequency (days/year)
ED = Exposure duration (years)
AT = Averaging time period over which exposure is averaged
10-6 = Conversion Factor
Cancer Risk (per million) = CP x Inhalation Dose x 1.0E+06 = URF x Cair
Where,
CP = Cancer potency factor (mg/kg-day)-1
URF = Unit risk factor (cancer risk per ug/m3)
The following are detailed descriptions of some of the parameters used in the health risk assessment:
5.1.1 Daily Breathing Rate (DBR)
Exposure to airborne chemicals occurs through inhalation and subsequent absorption into the body, potentially resulting in adverse health effects depending on toxicological properties of the chemical and concentration in air. The dose of a substance through inhalation is a function of the concentration of the substance and the amount of air inhaled. DBR values used in these procedures, expressed in liters per kilogram-day (L/kg-day), as recommended by SJVAPCD for diesel PM, is 393 L/kg body weight-day. This DBR value was also used for calculations of the cancer risk of other carcinogenic pollutants.
5.1.2 Cancer Potency Factor (CP)
The inhalation cancer potency factor is a measure of the cancer potency of a carcinogen. It is the estimated probability that a person will contract cancer as a result of inhalation of a concentration of 1 milligram of the TAC per kilogram of body weight continuously over a period of 70 years. The inhalation cancer potency factors used in this analysis (see Tables 8-13) were obtained from OEHHA.
CALIFORNIA HIGH-SPEED RAIL PROJECT Appendix to Air Quality Chapter
9
5.1.3 Exposure Value Factors
In order to protect public health, and in accordance with the recommendations of OEHHA, a 70-year lifetime exposure is assumed for all receptor locations. In addition to the 70-year exposure duration (ED) values, exposure values used to calculate cancer risk are exposure frequency (EF), which is the number of days per year of exposure, and the averaging time period in days over which exposure is averaged (AT). For EF, OEHHA and SJVAPCD recommend the use of 350 days/year for residential exposure. For AT, OEHHA and SJVAPCD recommend the use of 25,550 days (70 years x 365 days/year). For ED values used to calculate chronic noncancer risk, EPA recommends the use of 30 years.
5.2 Chronic Noncancer Risk
Calculations for estimating the chronic noncancer hazard index (HQ) are based on the EPA’s Human Health Risk Assessment Protocol (HHRAP, Appendix C, Tables C-2-1 and C-2-2) methodology and equations, as follows:
HQ = EC x 0.001/RfC
Where,
EC = Ca x EF x ED/AT x 365 days/year or EC = Ca x Fc, where
HQ = hazard quotient for direct inhalation of noncarcinogen (unitless)
Ca = annual concentration estimated by the AERMOD, ug/m3
EC = exposure concentration, ug/m3
EF = exposure frequency, days/year, assumed by EPA to be equal 350 days/year
ED = exposure duration is assumed to be 70 years
AT = averaging time, years; AT is assumed by EPA to be equal 30 years
RfC = reference concentration for chronic inhalation exposure, mg/m3 (EPA Integrated Risk Information System (IRIS)
0.001=units conversion factor, mg/ug
5.3 Acute Hazard Risk
Acute hazard index analyses are based on HHRAP methodology and equations (HHRAP, Appendix C, Table C-4-1 and B, Table B-6-1), as follows:
AHQ = Cacute x 0.001/AIEC
Where,
AHQ acute hazard quotient, unitless
Cacute=1-hr estimated concentration, ug/m3
AIEC = acute inhalation exposure criteria, mg/m3. They were obtained from EPA Table 2 “Acute Dose-Response Values for Screening Risk Assessments
0.001= units conversion factor, mg/ug
CALIFORNIA HIGH-SPEED RAIL PROJECT Appendix to Air Quality Chapter
10
REL are OEHHA/ARB approved health values for use in Hot Spot facility Risk Assessment, Acute Reference Exposure Levels and target Organs. Appendix L-Table 2
Diesel PM has no acute health value; therefore, it was not included in acute hazard index calculations.
6.0 Results
6.1 Criteria Pollutants
Total estimated concentrations of the criteria pollutants at the HMF property line are provided in Table 5. In general, HMF emissions of criteria pollutants would not cause an exceedance of a NAAQS or CAAQS at the facility’s property line. However, because ambient values currently being monitored at the Merced, Madera, Drummond, and/or Fresno monitoring stations currently exceed the 24-hour and annual PM2.5 NAAQS and the 24-hour and annual PM10 CAAQS, and may continue to exceed these standards under future No Build conditions, there is a potential that HMF emissions could exacerbate future exceedances even though the maximum estimated project impacts at the property line are minimal.
Table 5 Total Estimated Concentrations of the Criteria Pollutants at the Property Line
Pollutant Time
Period CAAQS
(ug/m3) NAAQS
(ug/m3)
Estimated Impacts (ug/m3)
Background Conc.
(ug/m3)
Total Estimated
Concentrations (ug/m3)
Exceed CAAQS
?
Exceed NAAQS
?
NO2 1-hour 339 188 25.2 81.8 106.9 No No Annual 57 100 2.3 30.1 32.4 No No
PM10 24-hr 50 150 0.44 99.5 99.9 Yes No Annual 20 — 0.15 40.5 40.7 Yes —
PM2.5 24-hr — 35 0.25 81.6 81.8 — Yes Annual 12 15 0.08 15.23 15.3 Yes Yes
6.2 Toxic Pollutants
6.2.1 Chronic Noncancer Risk
The results of hazard chronic noncancer index calculations are summarized in Table 6. Pollutants listed are those for which non-cancer RfC (reference dose concentration) guideline values are available from EPA’s Integrated Risk Information System (IRIS), Prioritized Chronic Dose-Response Values for Screening Risk Assessments (EPA, Table 1, June 2007) and REL (Reference Exposure Limit) values from OEHHA Air Toxics Hot Spots Program Risk Assessment Guidelines, OEHHA, 2003, OEHHA/ARB Approved Health Values for Use in Hot Spot Facility Risk Assessments.
As shown, the total maximum chronic noncancer hazard index at the HMF property line is estimated to be less than 1 – using both EPA and OEHHA health risk values. As such, potential chronic noncancer risks associated with HMF operations are not considered to be significant.
6.2.2 Acute Risk
The results of acute hazard index calculations are summarized in Table 7. Pollutants listed are those for which acute inhalation exposure criteria values are available from the Prioritized Chronic Dose-Response Values for Screening Risk Assessments (EPA, Table 1, June 2007) and acute REL values from OEHHA Air Toxics Hot Spots Program Risk Assessment Guidelines, OEHHA, 2003, OEHHA/ARB Approved Health Values for Use in Hot Spot Facility Risk Assessments.
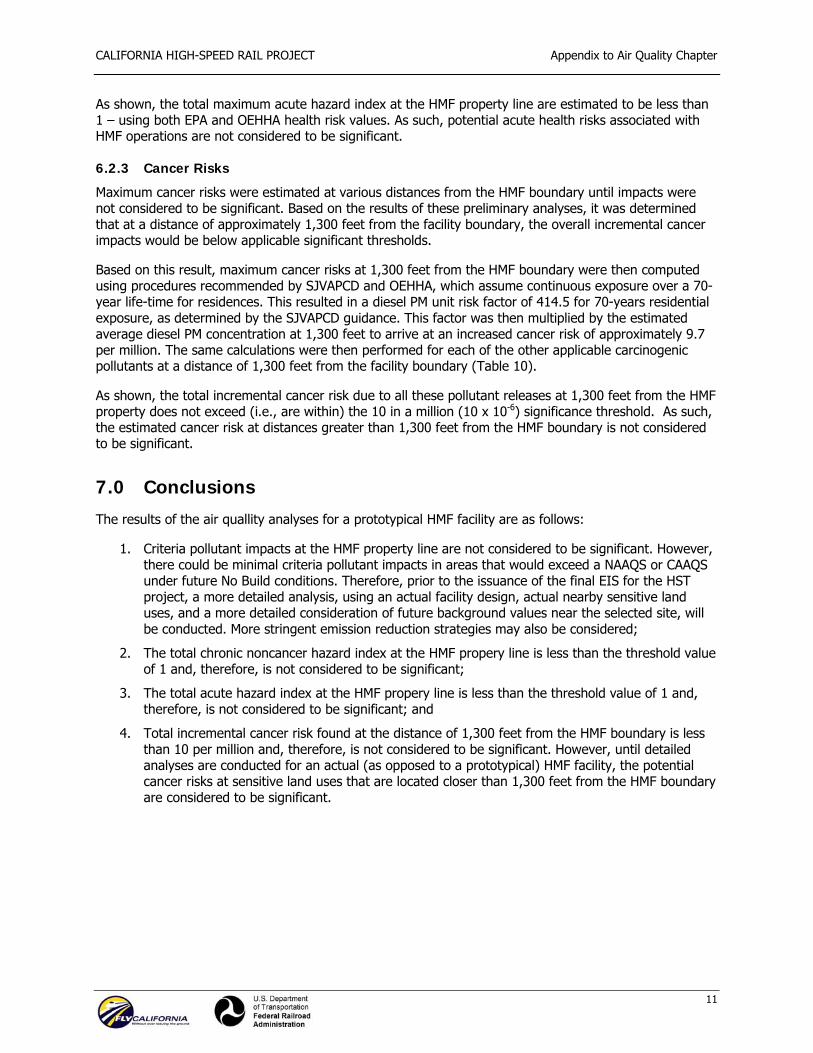
CALIFORNIA HIGH-SPEED RAIL PROJECT Appendix to Air Quality Chapter
11
As shown, the total maximum acute hazard index at the HMF property line are estimated to be less than 1 – using both EPA and OEHHA health risk values. As such, potential acute health risks associated with HMF operations are not considered to be significant.
6.2.3 Cancer Risks
Maximum cancer risks were estimated at various distances from the HMF boundary until impacts were not considered to be significant. Based on the results of these preliminary analyses, it was determined that at a distance of approximately 1,300 feet from the facility boundary, the overall incremental cancer impacts would be below applicable significant thresholds.
Based on this result, maximum cancer risks at 1,300 feet from the HMF boundary were then computed using procedures recommended by SJVAPCD and OEHHA, which assume continuous exposure over a 70-year life-time for residences. This resulted in a diesel PM unit risk factor of 414.5 for 70-years residential exposure, as determined by the SJVAPCD guidance. This factor was then multiplied by the estimated average diesel PM concentration at 1,300 feet to arrive at an increased cancer risk of approximately 9.7 per million. The same calculations were then performed for each of the other applicable carcinogenic pollutants at a distance of 1,300 feet from the facility boundary (Table 10).
As shown, the total incremental cancer risk due to all these pollutant releases at 1,300 feet from the HMF property does not exceed (i.e., are within) the 10 in a million (10 x 10-6) significance threshold. As such, the estimated cancer risk at distances greater than 1,300 feet from the HMF boundary is not considered to be significant.
7.0 Conclusions
The results of the air quallity analyses for a prototypical HMF facility are as follows:
1. Criteria pollutant impacts at the HMF property line are not considered to be significant. However, there could be minimal criteria pollutant impacts in areas that would exceed a NAAQS or CAAQS under future No Build conditions. Therefore, prior to the issuance of the final EIS for the HST project, a more detailed analysis, using an actual facility design, actual nearby sensitive land uses, and a more detailed consideration of future background values near the selected site, will be conducted. More stringent emission reduction strategies may also be considered;
2. The total chronic noncancer hazard index at the HMF propery line is less than the threshold value of 1 and, therefore, is not considered to be significant;
3. The total acute hazard index at the HMF propery line is less than the threshold value of 1 and, therefore, is not considered to be significant; and
4. Total incremental cancer risk found at the distance of 1,300 feet from the HMF boundary is less than 10 per million and, therefore, is not considered to be significant. However, until detailed analyses are conducted for an actual (as opposed to a prototypical) HMF facility, the potential cancer risks at sensitive land uses that are located closer than 1,300 feet from the HMF boundary are considered to be significant.
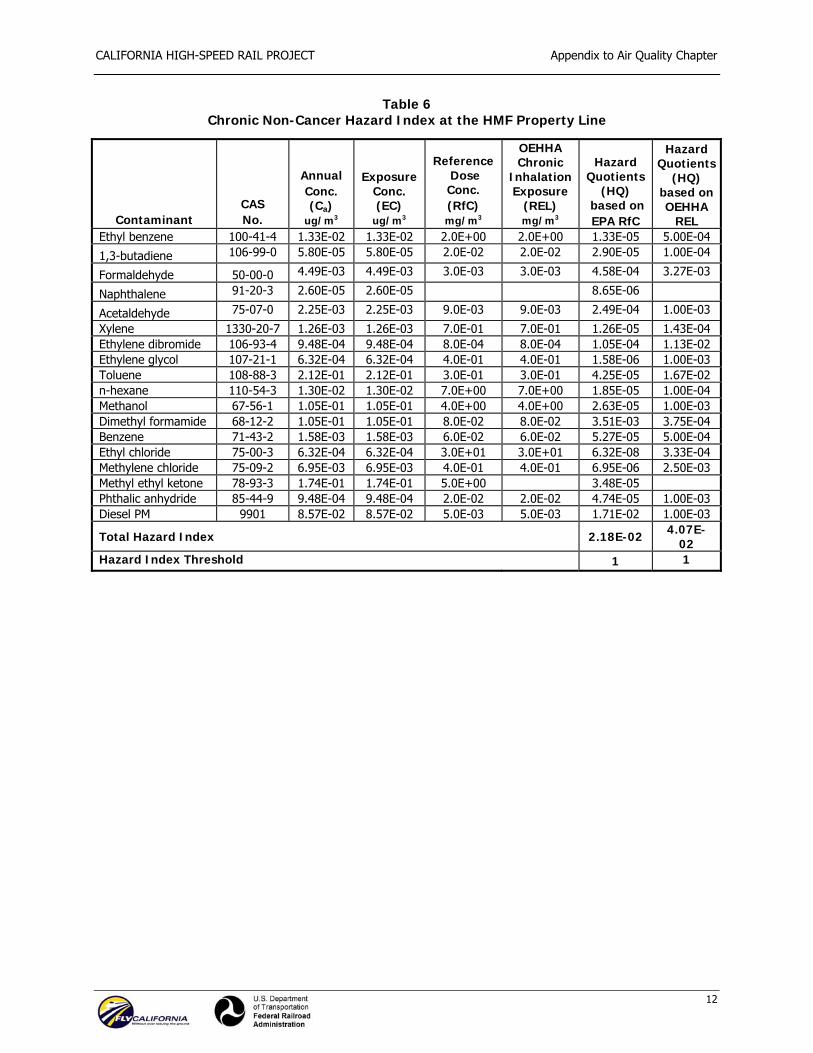
CALIFORNIA HIGH-SPEED RAIL PROJECT Appendix to Air Quality Chapter
12
Table 6 Chronic Non-Cancer Hazard Index at the HMF Property Line
Contaminant CAS No.
Annual Conc. (Ca)
ug/m3
Exposure Conc. (EC)
ug/m3
Reference Dose Conc. (RfC) mg/m3
OEHHA Chronic
Inhalation Exposure
(REL) mg/m3
Hazard Quotients
(HQ) based on EPA RfC
Hazard Quotients
(HQ) based on OEHHA
REL Ethyl benzene 100-41-4 1.33E-02 1.33E-02 2.0E+00 2.0E+00 1.33E-05 5.00E-04
1,3-butadiene 106-99-0 5.80E-05 5.80E-05 2.0E-02 2.0E-02 2.90E-05 1.00E-04
Formaldehyde 50-00-0 4.49E-03 4.49E-03 3.0E-03 3.0E-03 4.58E-04 3.27E-03
Naphthalene 91-20-3 2.60E-05 2.60E-05 8.65E-06
Acetaldehyde 75-07-0 2.25E-03 2.25E-03 9.0E-03 9.0E-03 2.49E-04 1.00E-03
Xylene 1330-20-7 1.26E-03 1.26E-03 7.0E-01 7.0E-01 1.26E-05 1.43E-04 Ethylene dibromide 106-93-4 9.48E-04 9.48E-04 8.0E-04 8.0E-04 1.05E-04 1.13E-02 Ethylene glycol 107-21-1 6.32E-04 6.32E-04 4.0E-01 4.0E-01 1.58E-06 1.00E-03 Toluene 108-88-3 2.12E-01 2.12E-01 3.0E-01 3.0E-01 4.25E-05 1.67E-02 n-hexane 110-54-3 1.30E-02 1.30E-02 7.0E+00 7.0E+00 1.85E-05 1.00E-04 Methanol 67-56-1 1.05E-01 1.05E-01 4.0E+00 4.0E+00 2.63E-05 1.00E-03 Dimethyl formamide 68-12-2 1.05E-01 1.05E-01 8.0E-02 8.0E-02 3.51E-03 3.75E-04 Benzene 71-43-2 1.58E-03 1.58E-03 6.0E-02 6.0E-02 5.27E-05 5.00E-04 Ethyl chloride 75-00-3 6.32E-04 6.32E-04 3.0E+01 3.0E+01 6.32E-08 3.33E-04 Methylene chloride 75-09-2 6.95E-03 6.95E-03 4.0E-01 4.0E-01 6.95E-06 2.50E-03 Methyl ethyl ketone 78-93-3 1.74E-01 1.74E-01 5.0E+00 3.48E-05 Phthalic anhydride 85-44-9 9.48E-04 9.48E-04 2.0E-02 2.0E-02 4.74E-05 1.00E-03 Diesel PM 9901 8.57E-02 8.57E-02 5.0E-03 5.0E-03 1.71E-02 1.00E-03
Total Hazard Index 2.18E-02 4.07E-02
Hazard Index Threshold 1 1
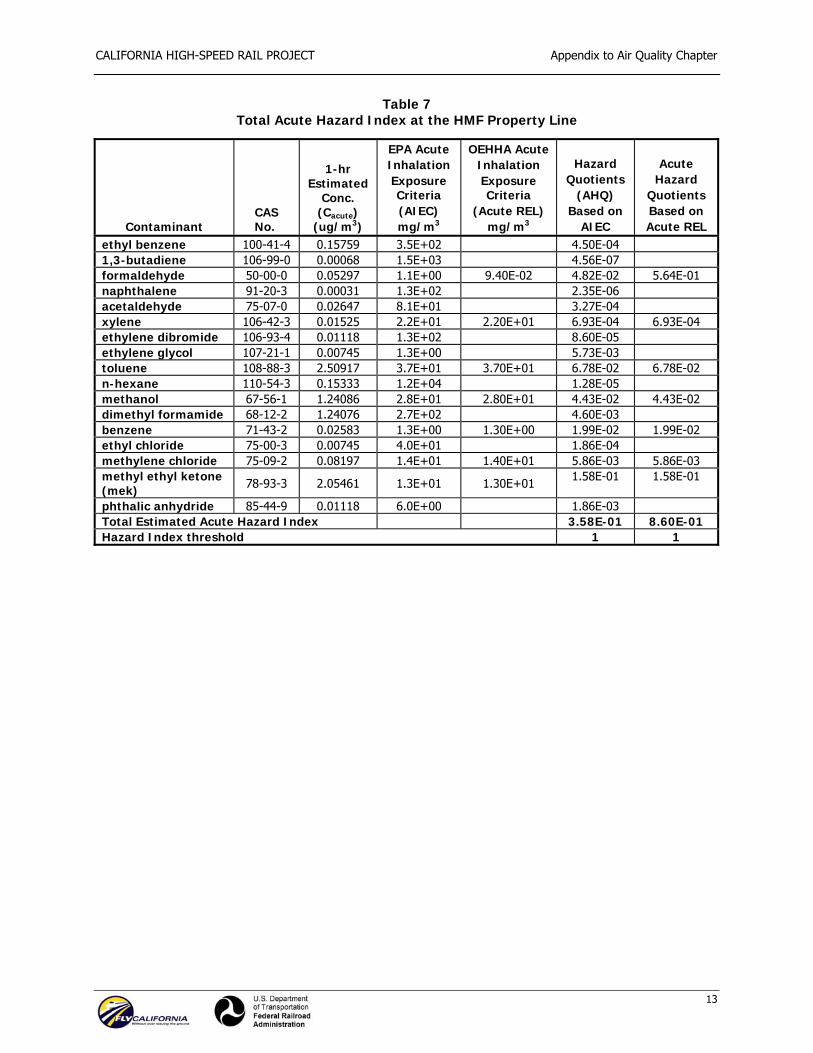
CALIFORNIA HIGH-SPEED RAIL PROJECT Appendix to Air Quality Chapter
13
Table 7 Total Acute Hazard Index at the HMF Property Line
Contaminant CAS No.
1-hr Estimated
Conc. (Cacute)
(ug/m3)
EPA Acute Inhalation Exposure Criteria (AIEC) mg/m3
OEHHA AcuteInhalation Exposure Criteria
(Acute REL) mg/m3
Hazard Quotients
(AHQ) Based on
AIEC
Acute Hazard
Quotients Based on Acute REL
ethyl benzene 100-41-4 0.15759 3.5E+02 4.50E-04 1,3-butadiene 106-99-0 0.00068 1.5E+03 4.56E-07 formaldehyde 50-00-0 0.05297 1.1E+00 9.40E-02 4.82E-02 5.64E-01 naphthalene 91-20-3 0.00031 1.3E+02 2.35E-06 acetaldehyde 75-07-0 0.02647 8.1E+01 3.27E-04 xylene 106-42-3 0.01525 2.2E+01 2.20E+01 6.93E-04 6.93E-04 ethylene dibromide 106-93-4 0.01118 1.3E+02 8.60E-05 ethylene glycol 107-21-1 0.00745 1.3E+00 5.73E-03 toluene 108-88-3 2.50917 3.7E+01 3.70E+01 6.78E-02 6.78E-02 n-hexane 110-54-3 0.15333 1.2E+04 1.28E-05 methanol 67-56-1 1.24086 2.8E+01 2.80E+01 4.43E-02 4.43E-02 dimethyl formamide 68-12-2 1.24076 2.7E+02 4.60E-03 benzene 71-43-2 0.02583 1.3E+00 1.30E+00 1.99E-02 1.99E-02 ethyl chloride 75-00-3 0.00745 4.0E+01 1.86E-04 methylene chloride 75-09-2 0.08197 1.4E+01 1.40E+01 5.86E-03 5.86E-03 methyl ethyl ketone (mek) 78-93-3 2.05461 1.3E+01 1.30E+01 1.58E-01 1.58E-01
phthalic anhydride 85-44-9 0.01118 6.0E+00 1.86E-03 Total Estimated Acute Hazard Index 3.58E-01 8.60E-01 Hazard Index threshold 1 1
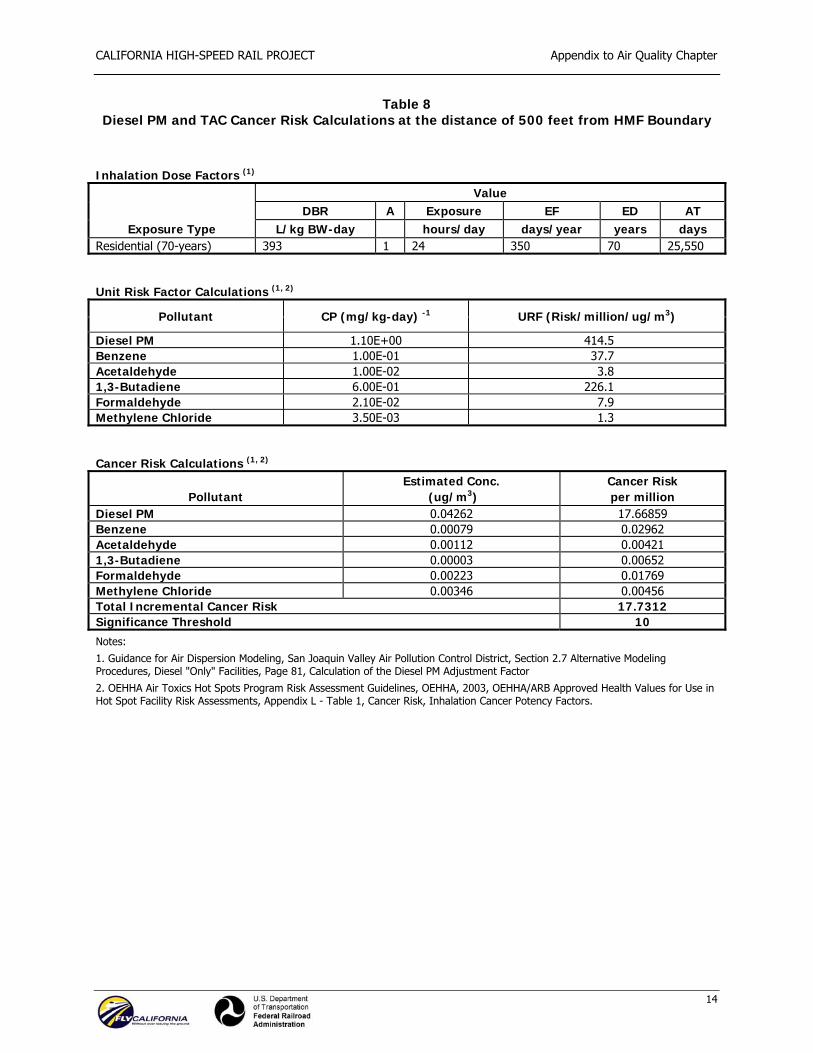
CALIFORNIA HIGH-SPEED RAIL PROJECT Appendix to Air Quality Chapter
14
Table 8 Diesel PM and TAC Cancer Risk Calculations at the distance of 500 feet from HMF Boundary
Inhalation Dose Factors (1)
Exposure Type
Value DBR A Exposure EF ED AT
L/kg BW-day hours/day days/year years days Residential (70-years) 393 1 24 350 70 25,550
Unit Risk Factor Calculations (1, 2)
Pollutant CP (mg/kg-day) -1 URF (Risk/million/ug/m3)
Diesel PM 1.10E+00 414.5 Benzene 1.00E-01 37.7 Acetaldehyde 1.00E-02 3.8 1,3-Butadiene 6.00E-01 226.1 Formaldehyde 2.10E-02 7.9 Methylene Chloride 3.50E-03 1.3
Cancer Risk Calculations (1, 2)
Pollutant Estimated Conc.
(ug/m3) Cancer Risk per million
Diesel PM 0.04262 17.66859 Benzene 0.00079 0.02962 Acetaldehyde 0.00112 0.00421 1,3-Butadiene 0.00003 0.00652 Formaldehyde 0.00223 0.01769 Methylene Chloride 0.00346 0.00456 Total Incremental Cancer Risk 17.7312 Significance Threshold 10 Notes:
1. Guidance for Air Dispersion Modeling, San Joaquin Valley Air Pollution Control District, Section 2.7 Alternative Modeling Procedures, Diesel "Only" Facilities, Page 81, Calculation of the Diesel PM Adjustment Factor
2. OEHHA Air Toxics Hot Spots Program Risk Assessment Guidelines, OEHHA, 2003, OEHHA/ARB Approved Health Values for Use in Hot Spot Facility Risk Assessments, Appendix L - Table 1, Cancer Risk, Inhalation Cancer Potency Factors.

CALIFORNIA HIGH-SPEED RAIL PROJECT Appendix to Air Quality Chapter
15
Table 9 Diesel PM and TAC Cancer Risk Calculations at the distance of 1,000 feet from HMF Boundary
Inhalation Dose Factors (1)
Exposure Type
Value DBR A Exposure EF ED AT
L/kg BW-day hours/day days/year years days Residential (70-years) 393 1 24 350 70 25,550
Unit Risk Factor Calculations (1, 2)
Pollutant CP (mg/kg-day) -1 URF (Risk/million/ug/m3)
Diesel PM 1.10E+00 414.5 Benzene 1.00E-01 37.7 Acetaldehyde 1.00E-02 3.8 1,3-Butadiene 6.00E-01 226.1 Formaldehyde 2.10E-02 7.9 Methylene Chloride 3.50E-03 1.3
Cancer Risk Calculations (1, 2)
Pollutant Estimated Conc.
(ug/m3) Cancer Risk per million
Diesel PM 0.02858 11.84592 Benzene 0.00053 0.01986 Acetaldehyde 0.00075 0.00282 1,3-Butadiene 0.00002 0.00437 Formaldehyde 0.00150 0.01186 Methylene Chloride 0.00232 0.00306 Total Incremental Cancer Risk 11.8879 Significance Threshold 10 Notes:
1. Guidance for Air Dispersion Modeling, San Joaquin Valley Air Pollution Control District, Section 2.7 Alternative Modeling Procedures, Diesel "Only" Facilities, Page 81, Calculation of the Diesel PM Adjustment Factor
2. OEHHA Air Toxics Hot Spots Program Risk Assessment Guidelines, OEHHA, 2003, OEHHA/ARB Approved Health Values for Use in Hot Spot Facility Risk Assessments, Appendix L - Table 1, Cancer Risk, Inhalation Cancer Potency Factors.

CALIFORNIA HIGH-SPEED RAIL PROJECT Appendix to Air Quality Chapter
16
Table 10 Diesel PM and TAC Cancer Risk Calculations at the distance of 1,300 feet from HMF Boundary
Inhalation Dose Factors (1)
Exposure Type
Value DBR A Exposure EF ED AT
L/kg BW-day hours/day days/year years days Residential (70-years) 393 1 24 350 70 25,550
Unit Risk Factor Calculations (1, 2)
Pollutant CP (mg/kg-day) -1 URF (Risk/million/ug/m3)
Diesel PM 1.10E+00 414.5 Benzene 1.00E-01 37.7 Acetaldehyde 1.00E-02 3.8 1,3-Butadiene 6.00E-01 226.1 Formaldehyde 2.10E-02 7.9 Methylene Chloride 3.50E-03 1.3
Cancer Risk Calculations (1, 2)
Pollutant Estimated Conc.
(ug/m3) Cancer Risk per million
Diesel PM 0.02334 9.67366 Benzene 0.00043 0.01622 Acetaldehyde 0.00061 0.00230 1,3-Butadiene 0.00002 0.00357 Formaldehyde 0.00122 0.00968 Methylene Chloride 0.00189 0.00250 Total Incremental Cancer Risk 9.7079 Significance Threshold 10 Notes:
1. Guidance for Air Dispersion Modeling, San Joaquin Valley Air Pollution Control District, Section 2.7 Alternative Modeling Procedures, Diesel "Only" Facilities, Page 81, Calculation of the Diesel PM Adjustment Factor
2. OEHHA Air Toxics Hot Spots Program Risk Assessment Guidelines, OEHHA, 2003, OEHHA/ARB Approved Health Values for Use in Hot Spot Facility Risk Assessments, Appendix L - Table 1, Cancer Risk, Inhalation Cancer Potency Factors.

CALIFORNIA HIGH-SPEED RAIL PROJECT Appendix to Air Quality Chapter
17
Table 11 Diesel PM and TAC Cancer Risk Calculations at the distance of 2,000 feet from HMF Boundary
Inhalation Dose Factors (1)
Exposure Type
Value DBR A Exposure EF ED AT
L/kg BW-day hours/day days/year years days Residential (70-years) 393 1 24 350 70 25,550
Unit Risk Factor Calculations (1, 2)
Pollutant CP (mg/kg-day) -1 URF (Risk/million/ug/m3)
Diesel PM 1.10E+00 414.5 Benzene 1.00E-01 37.7 Acetaldehyde 1.00E-02 3.8 1,3-Butadiene 6.00E-01 226.1 Formaldehyde 2.10E-02 7.9 Methylene Chloride 3.50E-03 1.3
Cancer Risk Calculations (1, 2)
Pollutant Estimated Conc.
(ug/m3) Cancer Risk per million
Diesel PM 0.01640 6.79665 Benzene 0.00030 0.01139 Acetaldehyde 0.00043 0.00162 1,3-Butadiene 0.00001 0.00251 Formaldehyde 0.00086 0.00680 Methylene Chloride 0.00133 0.00175 Total Incremental Cancer Risk 6.8207 Significance Threshold 10 Notes:
1. Guidance for Air Dispersion Modeling, San Joaquin Valley Air Pollution Control District, Section 2.7 Alternative Modeling Procedures, Diesel "Only" Facilities, Page 81, Calculation of the Diesel PM Adjustment Factor
2. OEHHA Air Toxics Hot Spots Program Risk Assessment Guidelines, OEHHA, 2003, OEHHA/ARB Approved Health Values for Use in Hot Spot Facility Risk Assessments, Appendix L - Table 1, Cancer Risk, Inhalation Cancer Potency Factors.

CALIFORNIA HIGH-SPEED RAIL PROJECT Appendix to Air Quality Chapter
18
Table 12 Diesel PM and TAC Cancer Risk Calculations at the distance of 3,000 feet from HMF Boundary
Inhalation Dose Factors (1)
Exposure Type
Value DBR A Exposure EF ED AT
L/kg BW-day hours/day days/year years days Residential (70-years) 393 1 24 350 70 25,550
Unit Risk Factor Calculations (1, 2)
Pollutant CP (mg/kg-day) -1 URF (Risk/million/ug/m3)
Diesel PM 1.10E+00 414.5 Benzene 1.00E-01 37.7 Acetaldehyde 1.00E-02 3.8 1,3-Butadiene 6.00E-01 226.1 Formaldehyde 2.10E-02 7.9 Methylene Chloride 3.50E-03 1.3
Cancer Risk Calculations (1, 2)
Pollutant Estimated Conc.
(ug/m3) Cancer Risk per million
Diesel PM 0.01121 4.64486 Benzene 0.00021 0.00779 Acetaldehyde 0.00029 0.00111 1,3-Butadiene 0.00001 0.00172 Formaldehyde 0.00059 0.00465 Methylene Chloride 0.00091 0.00120 Total Incremental Cancer Risk 4.6613 Significance Threshold 10 Notes:
1. Guidance for Air Dispersion Modeling, San Joaquin Valley Air Pollution Control District, Section 2.7 Alternative Modeling Procedures, Diesel "Only" Facilities, Page 81, Calculation of the Diesel PM Adjustment Factor
2. OEHHA Air Toxics Hot Spots Program Risk Assessment Guidelines, OEHHA, 2003, OEHHA/ARB Approved Health Values for Use in Hot Spot Facility Risk Assessments, Appendix L - Table 1, Cancer Risk, Inhalation Cancer Potency Factors.

CALIFORNIA HIGH-SPEED RAIL PROJECT Appendix to Air Quality Chapter
19
Table 13 Diesel PM and TAC Cancer Risk Calculations at the distance of 5,000 feet from HMF Boundary
Inhalation Dose Factors (1)
Exposure Type
Value DBR A Exposure EF ED AT
L/kg BW-day hours/day days/year years days Residential (70-years) 393 1 24 350 70 25,550
Unit Risk Factor Calculations (1, 2)
Pollutant CP (mg/kg-day) -1 URF (Risk/million/ug/m3)
Diesel PM 1.10E+00 414.5 Benzene 1.00E-01 37.7 Acetaldehyde 1.00E-02 3.8 1,3-Butadiene 6.00E-01 226.1 Formaldehyde 2.10E-02 7.9 Methylene Chloride 3.50E-03 1.3
Cancer Risk Calculations (1, 2)
Pollutant Estimated Conc.
(ug/m3) Cancer Risk per million
Diesel PM 0.00636 2.63653 Benzene 0.00012 0.00442 Acetaldehyde 0.00017 0.00063 1,3-Butadiene 0.00000 0.00097 Formaldehyde 0.00033 0.00264 Methylene Chloride 0.00052 0.00068 Total Incremental Cancer Risk 2.6459 Significance Threshold 10 Notes:
1. Guidance for Air Dispersion Modeling, San Joaquin Valley Air Pollution Control District, Section 2.7 Alternative Modeling Procedures, Diesel "Only" Facilities, Page 81, Calculation of the Diesel PM Adjustment Factor
2. OEHHA Air Toxics Hot Spots Program Risk Assessment Guidelines, OEHHA, 2003, OEHHA/ARB Approved Health Values for Use in Hot Spot Facility Risk Assessments, Appendix L - Table 1, Cancer Risk, Inhalation Cancer Potency Factors.

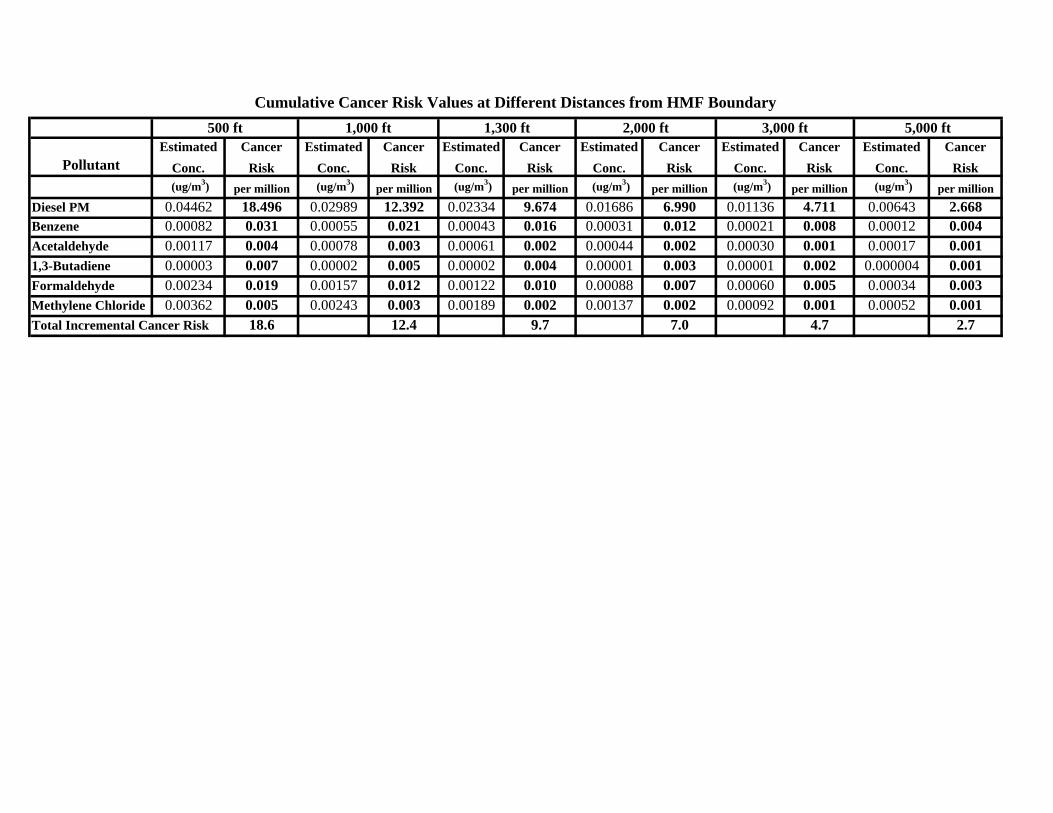
PollutantEstimated
Conc.Cancer
RiskEstimated
Conc.Cancer
RiskEstimated
Conc.Cancer
RiskEstimated
Conc.Cancer
RiskEstimated
Conc.Cancer
RiskEstimated
Conc.Cancer
Risk (ug/m3) per million (ug/m3) per million (ug/m3) per million (ug/m3) per million (ug/m3) per million (ug/m3) per million
Diesel PM 0.04462 18.496 0.02989 12.392 0.02334 9.674 0.01686 6.990 0.01136 4.711 0.00643 2.668Benzene 0.00082 0.031 0.00055 0.021 0.00043 0.016 0.00031 0.012 0.00021 0.008 0.00012 0.004Acetaldehyde 0.00117 0.004 0.00078 0.003 0.00061 0.002 0.00044 0.002 0.00030 0.001 0.00017 0.0011,3-Butadiene 0.00003 0.007 0.00002 0.005 0.00002 0.004 0.00001 0.003 0.00001 0.002 0.000004 0.001Formaldehyde 0.00234 0.019 0.00157 0.012 0.00122 0.010 0.00088 0.007 0.00060 0.005 0.00034 0.003Methylene Chloride 0.00362 0.005 0.00243 0.003 0.00189 0.002 0.00137 0.002 0.00092 0.001 0.00052 0.001Total Incremental Cancer Risk 18.6 12.4 9.7 7.0 4.7 2.7
Cumulative Cancer Risk Values at Different Distances from HMF Boundary3,000 ft 5,000 ft1,000 ft500 ft 1,300 ft 2,000 ft

Cumulative Cancer Risk at 500 feet From HMF Property Line Inhalation Dose Factors
Exposure Type DBR A Exposure EF ED AT
L/kg BW-day hours/day days/year years daysResidential (70-years) 393 1 24 350 70 25,5501. Guidance for Air Dispersion Modeling, San Joaquin Valley Air Pollution Control District, Section 2.7 Alternative Modeling Procedures, Diesel "Only" Facilities,Page 81, Calculation of the Diesel PM Adjustment Factor
Diesel PM 1.10E+00 414.5Benzene 1.00E-01 37.7Acetaldehyde 1.00E-02 3.8 Inhalation Dose = Cair x DBR x A x EF x ED x 10-6/AT 1,3-Butadiene 6.00E-01 226.1 whereFormaldehyde 2.10E-02 7.9 Cair = concentration in air (ug/m3)Methylene Chloride 3.50E-03 1.3 A = Inhalation absorption factor
ED = Exposure duration (years)AT = Averaging time period over which exposure is averaged10-6 = Conversion Factor
Pollutant Estimated Conc. Cancer Risk (ug/m3) per million Cancer Risk (per million) = CP x Inhalation Dose x 1.0E+06 = URF x Cair
Diesel PM 0.0426228 17.669 whereBenzene 0.0007860 0.030 CP = Cancer potency factor (mg/kg-day)-1
Acetaldehyde 0.0011168 0.004 URF = Unit risk factor (cancer risk per ug/m3)1,3-Butadiene 0.0000289 0.007Formaldehyde 0.0022347 0.018Methylene Chloride 0.0034582 0.005Total Incremental Cancer Risk 17.72. OEHHA Air Toxics Hot Spots Program Risk Assessment Guidelines, OEHHA, 2003, OEHHA/ARB Approved Health Values for Use in Hot Spot Facility Risk Assessments, Appendix L - Table 1, Cancer Risk, Inhalation Cancer Potency Factors
Cancer Risk Calculation (1,2)
Cancer Risk Calculations
Value
Pollutant
Cancer Potency and Unit Risk Factor Calculations (1,2)
URF (Risk/million/ug/m3)
CP (mg/kg-day) -1

Cumulative Cancer Risk at 1,000 feet From HMF Property Line Inhalation Dose Factors
Exposure Type DBR A Exposure EF ED AT
L/kg BW-day hours/day days/year years daysResidential (70-years) 393 1 24 350 70 25,5501. Guidance for Air Dispersion Modeling, San Joaquin Valley Air Pollution Control District, Section 2.7 Alternative Modeling Procedures, Diesel "Only" Facilities,Page 81, Calculation of the Diesel PM Adjustment Factor
Diesel PM 1.10E+00 414.5Benzene 1.00E-01 37.7Acetaldehyde 1.00E-02 3.8 Inhalation Dose = Cair x DBR x A x EF x ED x 10-6/AT 1,3-Butadiene 6.00E-01 226.1 whereFormaldehyde 2.10E-02 7.9 Cair = concentration in air (ug/m3)Methylene Chloride 3.50E-03 1.3 A = Inhalation absorption factor
ED = Exposure duration (years)AT = Averaging time period over which exposure is averaged10-6 = Conversion Factor
Pollutant Estimated Conc. Cancer Risk (ug/m3) per million Cancer Risk (per million) = CP x Inhalation Dose x 1.0E+06 = URF x Cair
Diesel PM 0.0285765 11.846 whereBenzene 0.0005269 0.020 CP = Cancer potency factor (mg/kg-day)-1
Acetaldehyde 0.0007487 0.003 URF = Unit risk factor (cancer risk per ug/m3)1,3-Butadiene 0.0000193 0.004Formaldehyde 0.0014983 0.012Methylene Chloride 0.0023185 0.003Total Incremental Cancer Risk 11.92. OEHHA Air Toxics Hot Spots Program Risk Assessment Guidelines, OEHHA, 2003, OEHHA/ARB Approved Health Values for Use in Hot Spot Facility Risk Assessments, Appendix L - Table 1, Cancer Risk, Inhalation Cancer Potency Factors
Cancer Risk Calculation (1,2)
Cancer Risk Calculations
Value
Pollutant
Cancer Potency and Unit Risk Factor Calculations (1,2)
URF (Risk/million/ug/m3)
CP (mg/kg-day) -1
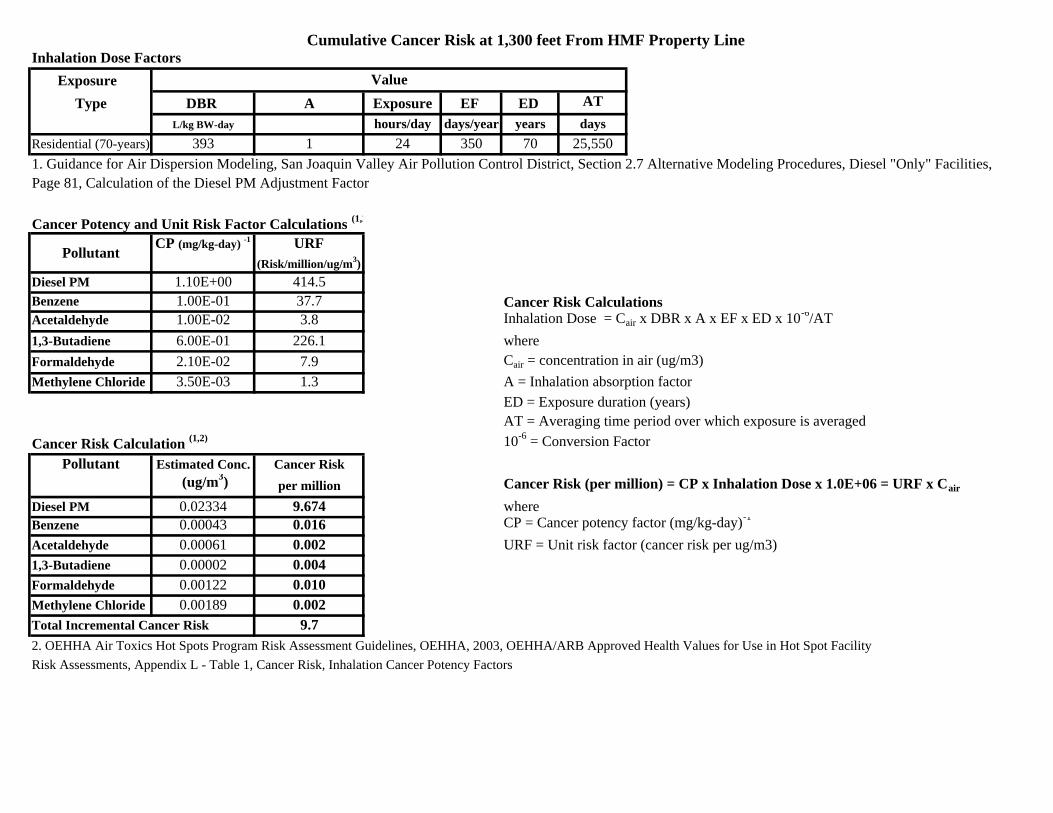
Cumulative Cancer Risk at 1,300 feet From HMF Property Line Inhalation Dose Factors
Exposure Type DBR A Exposure EF ED AT
L/kg BW-day hours/day days/year years daysResidential (70-years) 393 1 24 350 70 25,5501. Guidance for Air Dispersion Modeling, San Joaquin Valley Air Pollution Control District, Section 2.7 Alternative Modeling Procedures, Diesel "Only" Facilities,Page 81, Calculation of the Diesel PM Adjustment Factor
Diesel PM 1.10E+00 414.5Benzene 1.00E-01 37.7Acetaldehyde 1.00E-02 3.8 Inhalation Dose = Cair x DBR x A x EF x ED x 10-6/AT 1,3-Butadiene 6.00E-01 226.1 whereFormaldehyde 2.10E-02 7.9 Cair = concentration in air (ug/m3)Methylene Chloride 3.50E-03 1.3 A = Inhalation absorption factor
ED = Exposure duration (years)AT = Averaging time period over which exposure is averaged10-6 = Conversion Factor
Pollutant Estimated Conc. Cancer Risk (ug/m3) per million Cancer Risk (per million) = CP x Inhalation Dose x 1.0E+06 = URF x Cair
Diesel PM 0.02334 9.674 whereBenzene 0.00043 0.016 CP = Cancer potency factor (mg/kg-day)-1
Acetaldehyde 0.00061 0.002 URF = Unit risk factor (cancer risk per ug/m3)1,3-Butadiene 0.00002 0.004Formaldehyde 0.00122 0.010Methylene Chloride 0.00189 0.002Total Incremental Cancer Risk 9.72. OEHHA Air Toxics Hot Spots Program Risk Assessment Guidelines, OEHHA, 2003, OEHHA/ARB Approved Health Values for Use in Hot Spot Facility Risk Assessments, Appendix L - Table 1, Cancer Risk, Inhalation Cancer Potency Factors
Cancer Risk Calculation (1,2)
Cancer Risk Calculations
Value
Pollutant
Cancer Potency and Unit Risk Factor Calculations (1,2
URF (Risk/million/ug/m3)
CP (mg/kg-day) -1
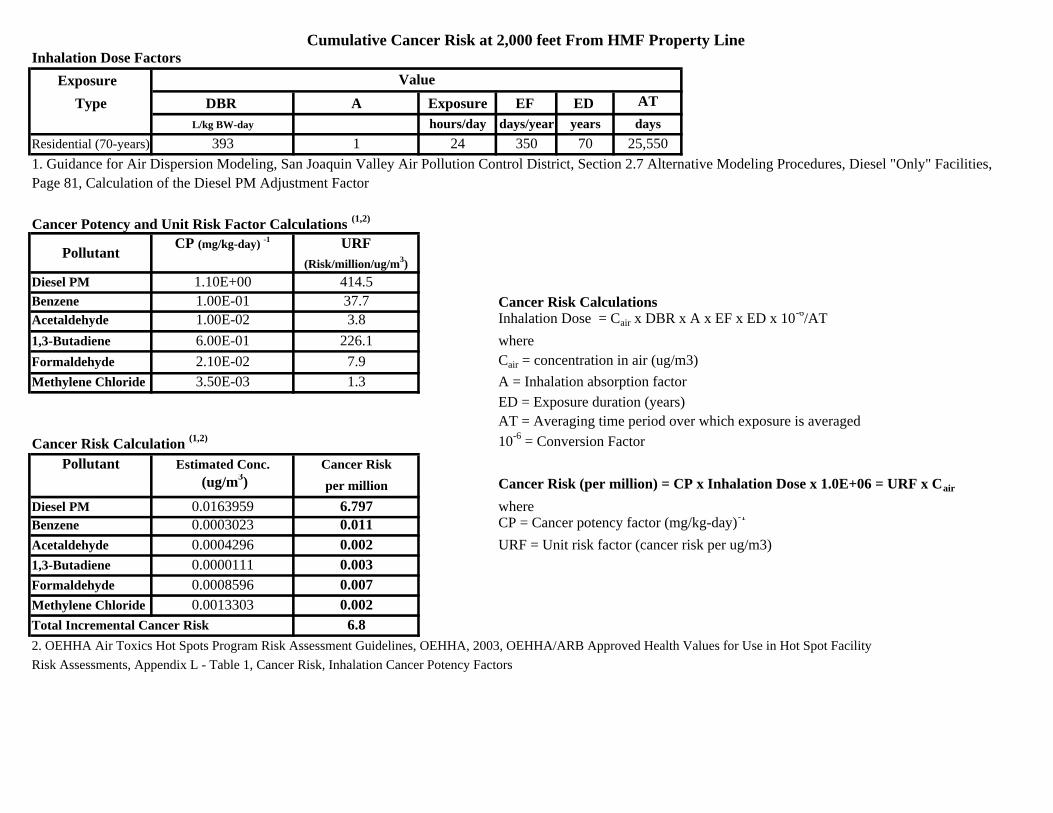
Cumulative Cancer Risk at 2,000 feet From HMF Property Line Inhalation Dose Factors
Exposure Type DBR A Exposure EF ED AT
L/kg BW-day hours/day days/year years daysResidential (70-years) 393 1 24 350 70 25,5501. Guidance for Air Dispersion Modeling, San Joaquin Valley Air Pollution Control District, Section 2.7 Alternative Modeling Procedures, Diesel "Only" Facilities,Page 81, Calculation of the Diesel PM Adjustment Factor
Diesel PM 1.10E+00 414.5Benzene 1.00E-01 37.7Acetaldehyde 1.00E-02 3.8 Inhalation Dose = Cair x DBR x A x EF x ED x 10-6/AT 1,3-Butadiene 6.00E-01 226.1 whereFormaldehyde 2.10E-02 7.9 Cair = concentration in air (ug/m3)Methylene Chloride 3.50E-03 1.3 A = Inhalation absorption factor
ED = Exposure duration (years)AT = Averaging time period over which exposure is averaged10-6 = Conversion Factor
Pollutant Estimated Conc. Cancer Risk (ug/m3) per million Cancer Risk (per million) = CP x Inhalation Dose x 1.0E+06 = URF x Cair
Diesel PM 0.0163959 6.797 whereBenzene 0.0003023 0.011 CP = Cancer potency factor (mg/kg-day)-1
Acetaldehyde 0.0004296 0.002 URF = Unit risk factor (cancer risk per ug/m3)1,3-Butadiene 0.0000111 0.003Formaldehyde 0.0008596 0.007Methylene Chloride 0.0013303 0.002Total Incremental Cancer Risk 6.82. OEHHA Air Toxics Hot Spots Program Risk Assessment Guidelines, OEHHA, 2003, OEHHA/ARB Approved Health Values for Use in Hot Spot Facility Risk Assessments, Appendix L - Table 1, Cancer Risk, Inhalation Cancer Potency Factors
Cancer Risk Calculation (1,2)
Cancer Risk Calculations
Value
Pollutant
Cancer Potency and Unit Risk Factor Calculations (1,2)
URF (Risk/million/ug/m3)
CP (mg/kg-day) -1

Cumulative Cancer Risk at 3,000 feet From HMF Property Line Inhalation Dose Factors
Exposure Type DBR A Exposure EF ED AT
L/kg BW-day hours/day days/year years daysResidential (70-years) 393 1 24 350 70 25,5501. Guidance for Air Dispersion Modeling, San Joaquin Valley Air Pollution Control District, Section 2.7 Alternative Modeling Procedures, Diesel "Only" Facilities,Page 81, Calculation of the Diesel PM Adjustment Factor
Diesel PM 1.10E+00 414.5Benzene 1.00E-01 37.7Acetaldehyde 1.00E-02 3.8 Inhalation Dose = Cair x DBR x A x EF x ED x 10-6/AT 1,3-Butadiene 6.00E-01 226.1 whereFormaldehyde 2.10E-02 7.9 Cair = concentration in air (ug/m3)Methylene Chloride 3.50E-03 1.3 A = Inhalation absorption factor
ED = Exposure duration (years)AT = Averaging time period over which exposure is averaged10-6 = Conversion Factor
Pollutant Estimated Conc. Cancer Risk (ug/m3) per million Cancer Risk (per million) = CP x Inhalation Dose x 1.0E+06 = URF x Cair
Diesel PM 0.0112050 4.645 whereBenzene 0.0002066 0.008 CP = Cancer potency factor (mg/kg-day)-1
Acetaldehyde 0.0002936 0.001 URF = Unit risk factor (cancer risk per ug/m3)1,3-Butadiene 0.0000076 0.002Formaldehyde 0.0005875 0.005Methylene Chloride 0.0009091 0.001Total Incremental Cancer Risk 4.72. OEHHA Air Toxics Hot Spots Program Risk Assessment Guidelines, OEHHA, 2003, OEHHA/ARB Approved Health Values for Use in Hot Spot Facility Risk Assessments, Appendix L - Table 1, Cancer Risk, Inhalation Cancer Potency Factors
Cancer Risk Calculation (1,2)
Cancer Risk Calculations
Value
Pollutant
Cancer Potency and Unit Risk Factor Calculations (1,2)
URF (Risk/million/ug/m3)
CP (mg/kg-day) -1

Cumulative Cancer Risk at 5,000 feet From HMF Property Line Inhalation Dose Factors
Exposure Type DBR A Exposure EF ED AT
L/kg BW-day hours/day days/year years daysResidential (70-years) 393 1 24 350 70 25,5501. Guidance for Air Dispersion Modeling, San Joaquin Valley Air Pollution Control District, Section 2.7 Alternative Modeling Procedures, Diesel "Only" Facilities,Page 81, Calculation of the Diesel PM Adjustment Factor
Diesel PM 1.10E+00 414.5Benzene 1.00E-01 37.7Acetaldehyde 1.00E-02 3.8 Inhalation Dose = Cair x DBR x A x EF x ED x 10-6/AT 1,3-Butadiene 6.00E-01 226.1 whereFormaldehyde 2.10E-02 7.9 Cair = concentration in air (ug/m3)Methylene Chloride 3.50E-03 1.3 A = Inhalation absorption factor
ED = Exposure duration (years)AT = Averaging time period over which exposure is averaged10-6 = Conversion Factor
Pollutant Estimated Conc. Cancer Risk (ug/m3) per million Cancer Risk (per million) = CP x Inhalation Dose x 1.0E+06 = URF x Cair
Diesel PM 0.0063602 2.637 whereBenzene 0.0001173 0.004 CP = Cancer potency factor (mg/kg-day)-1
Acetaldehyde 0.0001666 0.001 URF = Unit risk factor (cancer risk per ug/m3)1,3-Butadiene 0.0000043 0.001Formaldehyde 0.0003335 0.003Methylene Chloride 0.0005160 0.001Total Incremental Cancer Risk 2.62. OEHHA Air Toxics Hot Spots Program Risk Assessment Guidelines, OEHHA, 2003, OEHHA/ARB Approved Health Values for Use in Hot Spot Facility Risk Assessments, Appendix L - Table 1, Cancer Risk, Inhalation Cancer Potency Factors
Cancer Risk Calculation (1,2)
Cancer Risk Calculations
Value
Pollutant
Cancer Potency and Unit Risk Factor Calculations (1,2)
URF (Risk/million/ug/m3)
CP (mg/kg-day) -1


APPENDIX G
Changes in Construction Emissions

California High-Speed Rail Program Management Team
Memorandum
Date: April 4, 2012
Subject: Changes in Construction Emissions since DEIS
Overview
Refined construction data was not available at the time the DEIS analysis was performed. Largely, this was related to the level of engineering, construction planning and property-acquisition planning done at the time DEIS preparation began. Accordingly, analysts used very conservative estimates of the data to ensure the DEIS did not under-predict construction emissions.
Since issuance of the DEIS, more refined construction data (activities, equipment, and scheduling) have been developed, more closely approximating the actual construction activities, equipment and scheduling that will be involved in constructing the MF HST project. The refined data derives from more precise engineering and construction planning as the project approaches bidding and construction (if approved), and design refinements seeking to lower possible footprint impacts to property owners (e.g., avoiding building takes). Because the DEIS was very conservative in its assumptions about construction data, the revised construction emissions estimates are much lower, as compared to the analysis performed for the DEIS.
Modeling modifications also were made after the DEIS based on a comment received from the SJVAPCD and new data released post-DEIS by CARB. On the former, SJVAPCD advised the URBEMIS has a built-in error that applies load factors twice, resulting in artificially low emissions estimates. Our analysts corrected for that, in direct consultation with SJVAPCD. On the latter, CARB released in September updated construction equipment load factor data via its Off-Road 2011 database (these factors represent the latest information regarding construction equipment usage).1 Combined, these modeling changes increase emissions estimates over what they would have been without the modeling changes. The increase is smaller, however, than the large decrease that resulted from the revised construction data discussed in the paragraph above. FEIS emissions estimates, therefore, are lower than DEIS estimates.
The discussion below explains the major changes that were applied to the construction assumptions and to the construction phases from the DEIS to the FEIS. These changes directly affect the construction emission rates.
Mobilization
The duration of the site mobilization task was reduced by approximately 50% from the DEIS assump-tions. In addition, equipment quantities were revised, and revised utilization rates were applied to the equipment. The new utilization rates account for the fact that most equipment will not be operating for a full 8 hours per day. The DEIS analysis conservatively assumed that each piece of equipment would op-erate nonstop for 8 hours each day. Applying refined factors from the project construction engineers
1 See http://www.arb.ca.gov/msei/categories.htm#offroad_motor_vehicles (Table D-7 of ARB’s Appendix D at this website). These factors represent the latest information regarding construction equipment usage; the FEIS calculations account for this latest information. The ARB updates also included updates to the average industry equipment age (see pages D-18 to D-25 of ARB’s Appendix D), generally concluding that the average equipment age is newer/cleaner than then-existing ARB databases contained. Because of time pressures and modeling complexities, the construction emissions estimates in the FEIS do not account for the newer/cleaner equipment. Doing so would reduce the emission levels presented by a small amount, likely under 10%.
(which were not available for the DEIS), the FEIS applied utilization rates that reduced this to 2-3 hours per day for most pieces of equipment, reflecting a more realistic approach to the proposed construction activities in this phase.
Site Preparation (including demolition, land clearing and grubbing)
The overall square footage of the structures scheduled to be demolished for the project has been re-duced by more than 75% for all alternatives. This reduction was the result of a refined count of im-pacted buildings, and revised project design post-DEIS that sought to reduce the number of impacted buildings based on public comment on the DEIS. Furthermore, the hours of operation of equipment were changed based on updated engineering/construction planning, and utilization rates were applied, as pre-viously discussed, to reflect a more realistic approach to the activities in this phase.
Earth-Moving
Based on updated engineering/construction planning, the duration of earth moving activities, particularly cut and fill activities, was greatly reduced and revised utilization rates were applied to the equipment to account for the fact that most equipment will not be operating all day, as was previously assumed.
Track laying – elevated, at-grade and retained fill
Based on updated engineering/construction planning, the alignment width was reduced by approximately 15%. The duration of construction for track laying was greatly reduced as well, and revised utilization rates were applied to the equipment. In addition, specific equipment was assigned to each type of track laying operation.
Traction Power, Switching & Supply Stations
Based on updated engineering/construction planning, the estimated time for construction for each of these stations was reduced by approximately 40%.
Heavy Maintenance Facility
The duration of construction for the HMF was revised and split into two phases to reflect updated engi-neering/construction planning (construction of the facility itself, and construction of the track within the facility). The new schedule of construction also included revised equipment lists and utilization rates.
Merced & Fresno Stations
Based on updated engineering/construction planning, the duration of construction for the stations was greatly reduced, equipment quantities were revised, and revised utilization rates were applied.
Demobilization
The duration of demobilization was greatly reduced, from over two years in the DEIS to approximately two months in the FEIS, based on updated engineering/construction planning. Furthermore, the DEIS assumed a full 8 hours of operation for all construction equipment during demobilization. The refined FEIS analysis applied utilization rates to each specific type of equipment, revising the operating hours down to 2-4 hours per day for most equipment.
Hauling emissions
Based on updated engineering/construction planning, hauling emissions were revised to account for the use of concrete slabs and ballast. It was determined that sub-ballast material would be delivered to the project area by traditional means rather than brought in by a special unit train from areas outside of the air basin.
APPENDIX H
Estimated Emissions from Hauling Ballast Material Memorandum

URS/HMM/Arup Joint Venture
1333 Broadway St. Suite 800 Oakland, CA 94612
Tel: 510 893 3600 Fax: 510 874 3268
______________________________________________________________________________ To: Rebecca Kohlstrand/PMT; Bryan Porter/PMT From: Jonathan Tamimi /URS/HMM/Arup; Avanti Tamhane /URS/HMM/Arup Date: 03/23/2012 Subject: Estimated Emissions from Hauling Ballast Material – Merced to Fresno and
Fresno to Bakersfield Sections of the California High-Speed Train Project ______________________________________________________________________________ Analysis of pollutant emissions that are associated with hauling railway ballast material needed for the Merced to Fresno and Fresno to Bakersfield Sections of the California High-Speed Train Project are included in the air quality analysis section in Chapter 3 of the California High-Speed Train Project Environmental Impact Report/Environmental Impact Statement. Since the construction period for the Merced to Fresno Section and the Fresno to Bakersfield would overlap, the total amount of material and the associated emissions for both sections are analyzed in this memorandum. Air emissions were proportioned based on the material requirement for each section and were then compared to the General Conformity de minimis thresholds as well as the CEQA thresholds. The analysis presented in this memorandum assumes that the rail will be constructed using a combination of ballast, sub-ballast, and slab track. The analysis assumes that sub-ballast and the material necessary for concrete manufacture will be available within the SJVAB. Also, worst case emissions for one year are shown. This corresponds to hauling in the years of 2014, 2015, and 2016, while the remaining years would have emissions less than presented in this memo. Over the course of the construction period, the Merced to Fresno and Fresno to Bakersfield Sections will require about 2 million cubic yards (cy) of ballast material for alignment construction, however, this total amount is not currently available within San Joaquin Valley Air Basin (SJVAB), and there would be a need to haul it from quarries located in other air basins. If project material is hauled through other air basins, the associated emissions must be analyzed with respect to pollutant thresholds in the air basins traversed. This memorandum describes the analysis performed to determine (1) the potential amount of railroad ballast material available from California quarries for the Merced to Fresno and Fresno to Bakersfield Sections of the California High-Speed Train Project and (2) pollutant emissions associated with hauling the materials to the SJVAB boundary. Quarries Evaluated The Office of Mine Reclamation (California Department of Conservation [CDC]) provided a list of quarries within the state of California (CDC 2010). The list was screened for active rock quarries with 200 or more acres of permitted area because they are considered to be of sufficient size to serve the demand effectively. Quarries that are in the planning stage and have not
MEMORANDUM
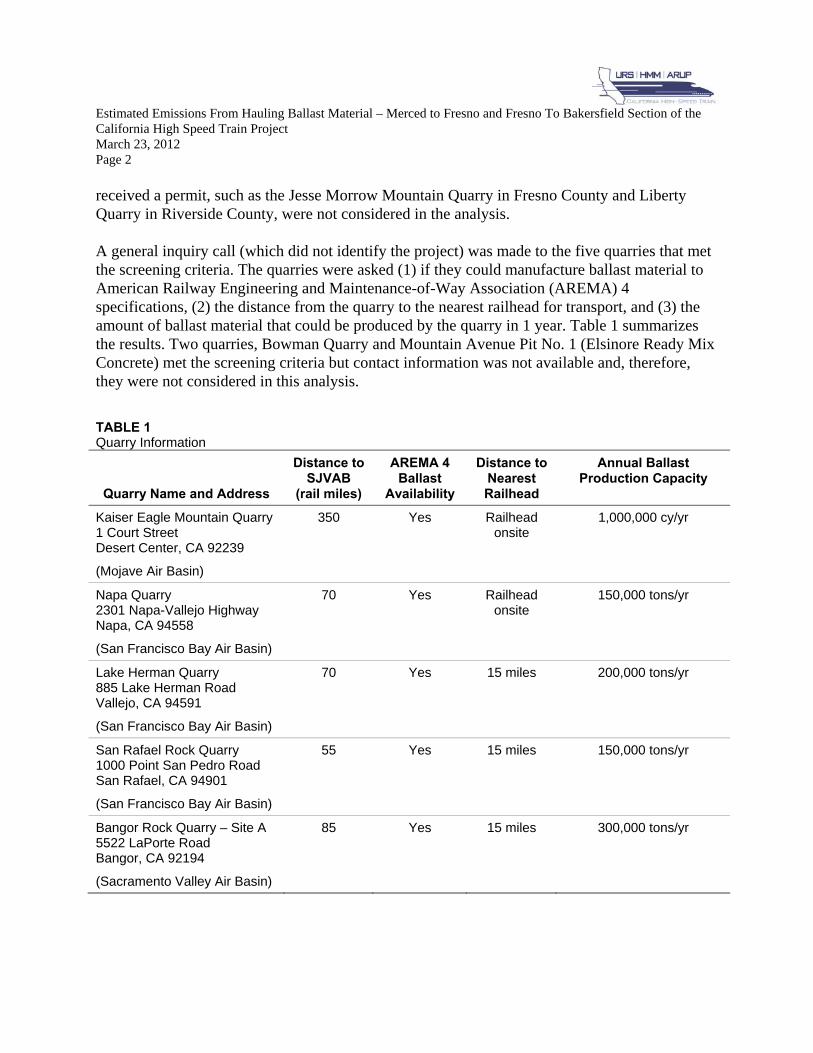
Estimated Emissions From Hauling Ballast Material – Merced to Fresno and Fresno To Bakersfield Section of the California High Speed Train Project March 23, 2012 Page 2 received a permit, such as the Jesse Morrow Mountain Quarry in Fresno County and Liberty Quarry in Riverside County, were not considered in the analysis. A general inquiry call (which did not identify the project) was made to the five quarries that met the screening criteria. The quarries were asked (1) if they could manufacture ballast material to American Railway Engineering and Maintenance-of-Way Association (AREMA) 4 specifications, (2) the distance from the quarry to the nearest railhead for transport, and (3) the amount of ballast material that could be produced by the quarry in 1 year. Table 1 summarizes the results. Two quarries, Bowman Quarry and Mountain Avenue Pit No. 1 (Elsinore Ready Mix Concrete) met the screening criteria but contact information was not available and, therefore, they were not considered in this analysis.
TABLE 1 Quarry Information
Quarry Name and Address
Distance to SJVAB
(rail miles)
AREMA 4 Ballast
Availability
Distance to Nearest Railhead
Annual Ballast Production Capacity
Kaiser Eagle Mountain Quarry 1 Court Street Desert Center, CA 92239
(Mojave Air Basin)
350 Yes Railhead onsite
1,000,000 cy/yr
Napa Quarry 2301 Napa-Vallejo Highway Napa, CA 94558
(San Francisco Bay Air Basin)
70 Yes Railhead onsite
150,000 tons/yr
Lake Herman Quarry 885 Lake Herman Road Vallejo, CA 94591
(San Francisco Bay Air Basin)
70 Yes 15 miles 200,000 tons/yr
San Rafael Rock Quarry 1000 Point San Pedro Road San Rafael, CA 94901
(San Francisco Bay Air Basin)
55 Yes 15 miles 150,000 tons/yr
Bangor Rock Quarry – Site A 5522 LaPorte Road Bangor, CA 92194
(Sacramento Valley Air Basin)
85 Yes 15 miles 300,000 tons/yr
Estimated Emissions From Hauling Ballast Material – Merced to Fresno and Fresno To Bakersfield Section of the California High Speed Train Project March 23, 2012 Page 3 Methodology for Estimating Pollutant Emissions from Hauling Ballast to the Project Site As the construction schedules of the Merced to Fresno and Fresno to Bakersfield Sections of the California High Speed Train Project overlap, the ballast material hauling analysis took into account the requirements for both sections to ensure realistic emission estimates. Five scenarios were developed for hauling ballast materials from quarries listed in Table 1 to the boundary of SJVAB to develop a range of emission estimates (the actual hauling scenario during construction is uncertain). The scenarios represent a range of combinations of supply from the different quarries and different methods of hauling (either by truck to the nearest railhead and railway the remainder of the distance, or by truck the entire distance). The scenarios include the following: Scenario 1: All Ballast Hauled from Kaiser Eagle Mountain Quarry by Rail Only – Haul all
of the ballast material, for both sites, via rail from the Kaiser Eagle Mountain Quarry (the longest hauling distance).
Scenario 2: Ballast from Quarries Nearest to the Project by Truck and Rail and Balance from Kaiser Eagle Mountain Quarry by Truck and Rail - Haul all of the ballast material from the quarries closest to the project site (Napa Quarry, Lake Herman Quarry, and San Rafael Rock Quarry) via truck to the nearest railhead, then by railway the remainder of the distance and the balance from Bangor Rock Quarry by truck and rail.
Scenario 3: Ballast from Quarries Nearest to the Project by Truck and Rail and Balance from Bangor Rock Quarry and Kaiser Eagle Mountain Quarry - Haul the maximum amount of ballast available from the quarries closest to the project site (Napa Quarry, Lake Herman Quarry, and San Rafael Rock Quarry), the maximum amount from Bangor Rock Quarry – Site A (which is closer than Kaiser Eagle Mountain Quarry) up to ballast production limits; and then the balance from Kaiser Eagle Mountain Quarry. Haul ballast by truck to the nearest railhead, then by rail the remainder of the distance.
Scenario 4: Maximum Ballast from Quarries Nearest to the Project and Balance from Bangor Rock Quarry and Kaiser Eagle Mountain Quarry by Truck Only – Haul the maximum amount of ballast from the quarries closest to the project site (Napa Quarry, Lake Herman Quarry, and San Rafael Rock Quarry), and obtain the balance of material needed from Bangor Rock Quarry – Site A (closer than Kaiser Eagle Mountain Quarry) and Kaiser Eagle Mountain Quarry, transported by truck for the entire distance.
Scenario 5: – Maximum Ballast from Quarries Nearest Project and Balance from Kaiser Eagle Mountain Quarry by Truck Only - Haul the maximum amount of ballast up to emission threshold limits from the quarries closest to the project site (Napa Quarry, Lake Herman Quarry, and San Rafael Rock Quarry), and obtain the balance of material needed from Kaiser Eagle Mountain Quarry transported by truck the entire distance.
For each scenario, emissions were calculated using year 2014 emission factors. Year 2014 would be the first year that ballast is required for the project, and emission factors for that year are the
Estimated Emissions From Hauling Ballast Material – Merced to Fresno and Fresno To Bakersfield Section of the California High Speed Train Project March 23, 2012 Page 4 most conservative within the project schedule because they are expected to decrease each year as vehicle technology improves. Table 2 provides the emission factors used in the analysis. For unmitigated truck emissions, emission factors were based on a fleet composed of the last 45 model years (1969-2014). Mitigated haul truck emission factors are for a fleet composed of model year 2010 and newer trucks.
Estimated Emissions From Hauling Ballast Material – Merced to Fresno and Fresno To Bakersfield Section of the California High Speed Train Project March 23, 2012 Page 5 TABLE 2 Ballast Hauling Emission Factors
Emission Source
Emission Factors
CO NOx PM2.5 PM10 SO2 VOC CO2
Unmitigated Haul Trucks (grams/mile)a 2.76 7.89 0.313 0.34 0.015 0.423
1561
Mitigated Haul Trucks (grams/mile)a 1.02 1.18 0.063 0.068 0.015 0.096 1600
Large Haul Rail (grams/ton-mile)b 0.055 0.28 0.0072 0.0074 0.0002 0.013 21.1
a Truck emission factors were developed using the EMFAC2007 emissions model and statewide average emission factors. b Railway emission factors were developed using the Emission Factors for Locomotives (EPA 2009)
Notes: CO = carbon monoxide NOx = nitrogen oxide PM2.5 = particulate matter less than 2.5 micrometers in aerodynamic diameter PM10 = particulate matter less than 10 micrometers in aerodynamic diameter SO2 = sulfur dioxide VOC = volatile organic compound
For each scenario, emissions were calculated by multiplying the emission factor by the distance traveled and the amount of material hauled per trip for each hauling method. The following pollutant emissions were calculated: CO, NOx, PM2.5, PM10, SO2, and VOC. Greenhouse gas (GHG) emissions were also estimated. Emissions were calculated separately for each federal nonattainment or maintenance area through which the materials would be hauled (reference Attachment A). The results were compared to the General Conformity (GC) de minimis values to determine if an exceedance would occur. Emissions were also calculated for each air quality management district (AQMD) that the material was hauled through and compared to daily and annual CEQA significance threshold values for each of the air districts (reference Attachment B). Although the quantity of ballast material being considered was the combined amounts from both sections to ensure plausible scenarios, the emissions for each section were calculated by proportioning out the total air emissions based on the material requirements for each section. For each scenario, the maximum material hauled in one year was used to estimate the annual emissions. The daily emissions calculations were estimated by assuming that the annual material requirements would be hauled by trucks that would operate 260 days per year and trains that would run twice weekly from each of the railheads to the SJVAB. Estimated Pollutant Emissions from Hauling Ballast to the Project Site Tables 3 shows the amounts of material hauled from the quarries for each scenario in cubic yards (cy) per year. For daily emissions calculations, it was assumed trucks would operate 260 days per year and that trains would run twice weekly from each of the railheads to the SJVAB.
Estimated Emissions From Hauling Ballast Material – Merced to Fresno and Fresno To Bakersfield Section of the California High Speed Train Project March 23, 2012 Page 6 TABLE 3 Amount of Material Hauled from Each Quarry Under Scenarios 1-5
Scenario 1 (cy/yr)
2 (cy/yr)
3 (cy/yr)
4 (cy/yr)
5 (cy/yr) Quarry Name
Kaiser Eagle Mountain Quarry 491,219 253,124 110,267 110,267 253,124
Napa Quarry 0 71,429 71,429 71,429 71,429
Lake Herman Quarry 0 95,238 95,238 95,238 95,238
San Rafael Rock Quarry 0 71,429 71,429 71,429 71,429
Bangor Rock Quarry – Site A 0 0 142,857 142,857 0
Tables C-1 through C-10 (reference Attachment C) show the estimated unmitigated emissions for the five scenarios relative to the GC de minimis thresholds for the air basins traversed. Tables D-1 through D-20 (reference Attachment D) show the estimated unmitigated emissions relative to CEQA significance thresholds for the AQMDs traversed. Tables E-1 through E-8 (reference Attachment E) show estimated mitigated emissions for scenarios 2 through 5 relative to GC de minimis thresholds for the air basins traversed. Tables F-1 through F-16 (reference Attachment F) show the estimated mitigated emissions for scenarios 2 through 5 relative to CEQA significance thresholds for the AQMDs traversed. Scenario 1 did not change under the mitigated scenario since tall the material was transported by rail. Please note that a particular air basin could be under the jurisdiction of more than one AQMD. Scenarios one and five both exceed GC de minimis thresholds for NOx for both the Merced to Fresno and Fresno to Bakersfield sections in the South Coast Air Basin. Scenario one, for the Fresno to Bakersfield section, also exceeds GC de minimis thresholds for NOx in the Salton Sea Air Basin. No other pollutants for any scenarios exceed their respective GC de minimis threshold. With a mitigation measure to use a fleet of model year 2010 and newer trucks, Scenario 5 no longer exceed any de minimis thresholds in any air basin for either section. Annual CEQA emission threshold limits would not be exceeded by any of the scenarios for either section. Daily CEQA thresholds for NOX would be exceeded under Scenario 1 in the South Coast AQMD for both sections, and the Fresno to Bakersfield section would also exceed daily CEQA threshold limits for Mojave Desert and East Kern AQMDs. Emissions from Scenarios 2 and 3 would exceed the daily CEQA threshold limits for NOX in the Bay Area and South Coast AQMDs for both sections. Emissions from Scenarios 4 would not exceed any daily CEQA limits for the Merced to Fresno section, but would exceed daily CEQA threshold limits for NOX in the Bay Area Air Basin for the Fresno to Bakersfield section. Scenario 5 would exceed daily CEQA threshold limits for NOX in the South Coast AQMD for both sections, and the Fresno to Bakersfield section would also exceed daily CEQA threshold limits for NOX in the Bay Area Air Basin. With the proposed mitigation for haul trucks, Scenarios 4 and 5 would no longer exceed any daily CEQA threshold limits for both sections.
Estimated Emissions From Hauling Ballast Material – Merced to Fresno and Fresno To Bakersfield Section of the California High Speed Train Project March 23, 2012 Page 7 GHG emissions (in units of CO2e) from ballast hauling range were calculated by assuming methane and nitrogen dioxide impacts were 5% of the total CO2 impacts. Total CO2e impacts ranged from 3,665 to 12,355 metric tons annually, depending on the chosen scenario. The total statewide emissions in 2008 of CO2e was 477,740,000 metric tons. Material hauling for this project will have a negligible impact (less than 0.1%) on statewide greenhouse gas emissions. Conclusion According to this analysis, sufficient ballast material of the type needed for the project is available from quarries within the state of California. General Conformity de minimis pollutant thresholds in nonattainment areas for NOX would be exceeded in some air basin for scenarios 1 and 5 without mitigation. With mitigation, scenario 5 no longer exceed GC de minimis threshold limits for any pollutant for either section. Annual CEQA threshold limits would not be exceeded for either section in any scenario. Daily CEQA NOX thresholds would be exceeded for certain AQMDs for every scenario for both sections without mitigation, except scenario 4 for the Merced to Fresno section. With mitigation, Scenarios 4 and 5 would no longer exceed daily CEQA NOX thresholds for either section. Additionally, material hauling for this project will have a negligible impact on statewide greenhouse gas emissions.
Estimated Emissions From Hauling Ballast Material – Merced to Fresno and Fresno To Bakersfield Section of the California High Speed Train Project March 23, 2012 Page 8 References California Department of Conservation. 2010. Email from Candace Mapel in the Office of Mine Reclamation including spreadsheet with permitted mines in the State of California. April 8, 2010. Campbell, Ross. 2011. San Rafael Rock Quarry. Personal communication via telephone regarding production capabilities of San Rafael Rock Quarry, with Kirstin Skadberg/ CH2M HILL. June 15, 2011. Roberts, Jan. 2011. Kaiser Eagle Mountain Quarry. Personal communication via telephone regarding production capabilities of Kaiser Eagle Mountain Rock Quarry, with Kirstin Skadberg/CH2M HILL. June 15, 2011. Thomas, Scott. 2011. Sylar Industries. Personal communication via telephone regarding production capabilities of Lake Herman Napa Rock Quarries, with Kirstin Skadberg/ CH2M HILL. June 15, 2011. U.S. Environmental Protection Agency (EPA). 2009. Emission Factors for Locomotives. Available at http://www.epa.gov/nonroad/locomotv/420f09025.pdf. Washington, DC. April 2009. Weisswasswer, Barry. 2011. Ladd Construction. Personal communication via telephone regarding production capabilities of Bangor Rock Quarry, with Kirstin Skadberg/CH2M HILL. June 15, 2011.
Attachment A Air Basins and Nonattainment/Maintenance Areas
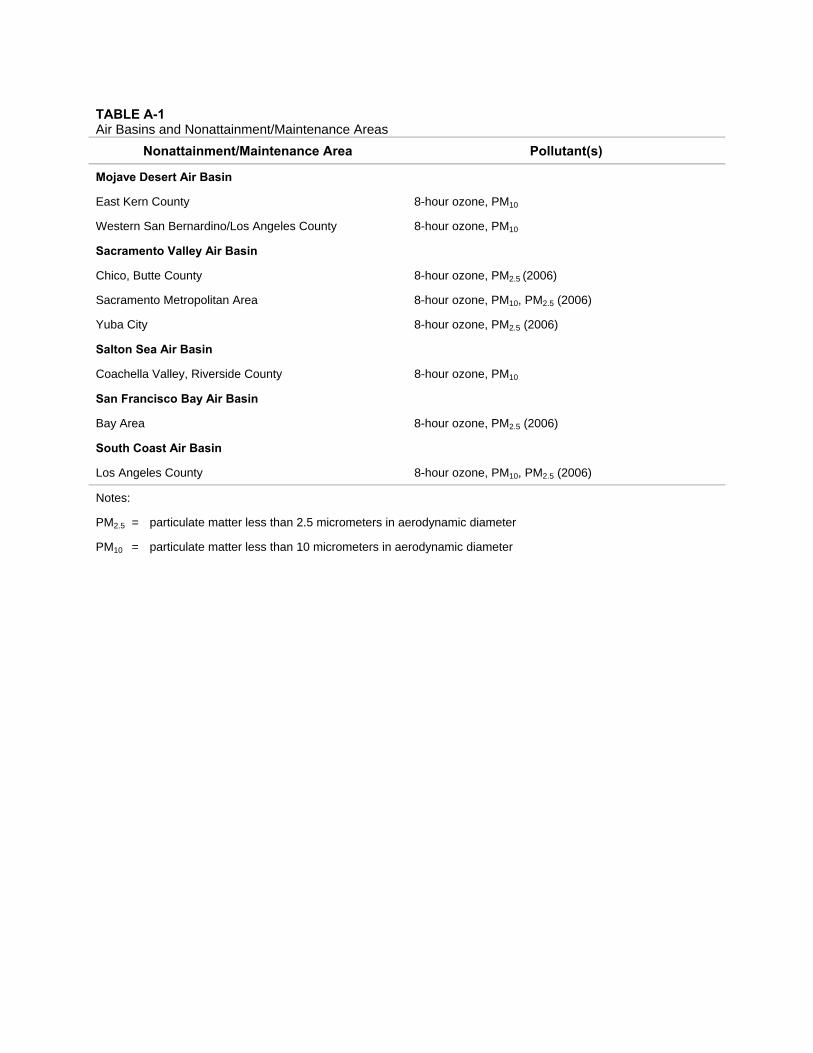
TABLE A-1 Air Basins and Nonattainment/Maintenance Areas
Nonattainment/Maintenance Area Pollutant(s)
Mojave Desert Air Basin
East Kern County 8-hour ozone, PM10
Western San Bernardino/Los Angeles County 8-hour ozone, PM10
Sacramento Valley Air Basin
Chico, Butte County 8-hour ozone, PM2.5 (2006)
Sacramento Metropolitan Area 8-hour ozone, PM10, PM2.5 (2006)
Yuba City 8-hour ozone, PM2.5 (2006)
Salton Sea Air Basin
Coachella Valley, Riverside County 8-hour ozone, PM10
San Francisco Bay Air Basin
Bay Area 8-hour ozone, PM2.5 (2006)
South Coast Air Basin
Los Angeles County 8-hour ozone, PM10, PM2.5 (2006)
Notes:
PM2.5 = particulate matter less than 2.5 micrometers in aerodynamic diameter
PM10 = particulate matter less than 10 micrometers in aerodynamic diameter
Attachment B Air Quality Management Districts and CEQA
Thresholds
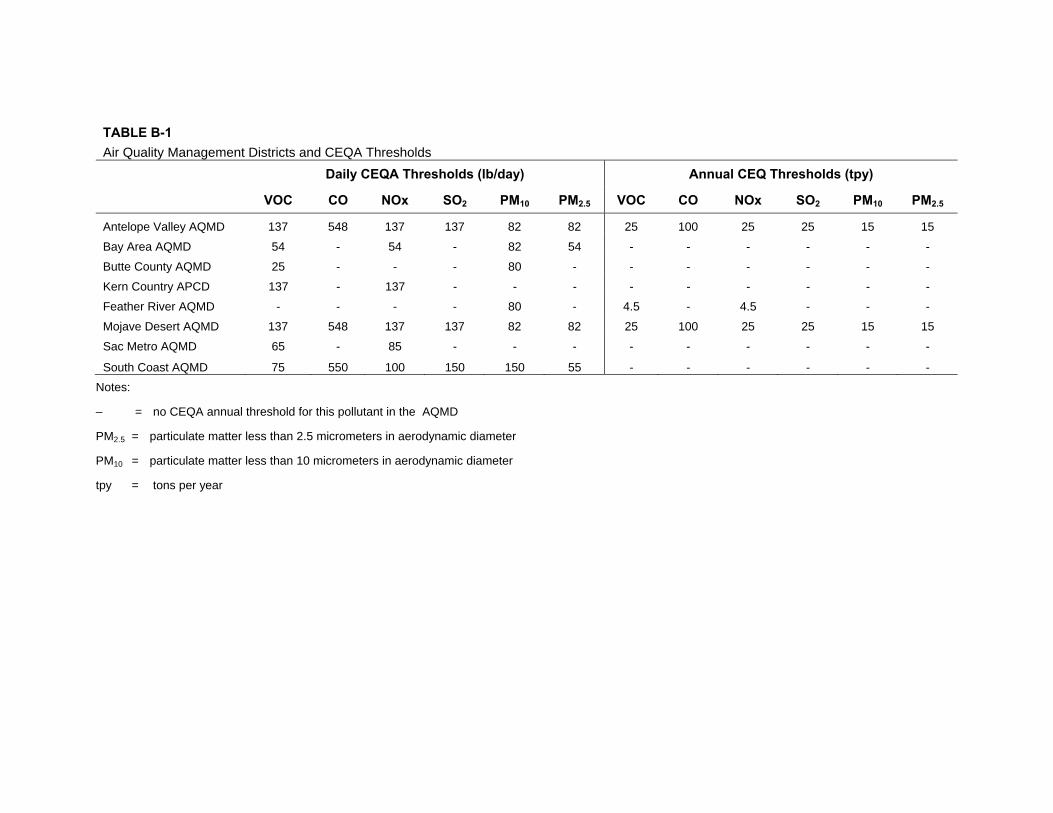
TABLE B-1 Air Quality Management Districts and CEQA Thresholds
Daily CEQA Thresholds (lb/day) Annual CEQ Thresholds (tpy)
VOC CO NOx SO2 PM10 PM2.5 VOC CO NOx SO2 PM10 PM2.5
Antelope Valley AQMD 137 548 137 137 82 82 25 100 25 25 15 15
Bay Area AQMD 54 - 54 - 82 54 - - - - - -
Butte County AQMD 25 - - - 80 - - - - - - -
Kern Country APCD 137 - 137 - - - - - - - - -
Feather River AQMD - - - - 80 - 4.5 - 4.5 - - -
Mojave Desert AQMD 137 548 137 137 82 82 25 100 25 25 15 15
Sac Metro AQMD 65 - 85 - - - - - - - - -
South Coast AQMD 75 550 100 150 150 55 - - - - - -
Notes:
– = no CEQA annual threshold for this pollutant in the AQMD
PM2.5 = particulate matter less than 2.5 micrometers in aerodynamic diameter
PM10 = particulate matter less than 10 micrometers in aerodynamic diameter
tpy = tons per year

Attachment C Emission Calculations for Scenarios Compared to GC
de minimis Thresholds
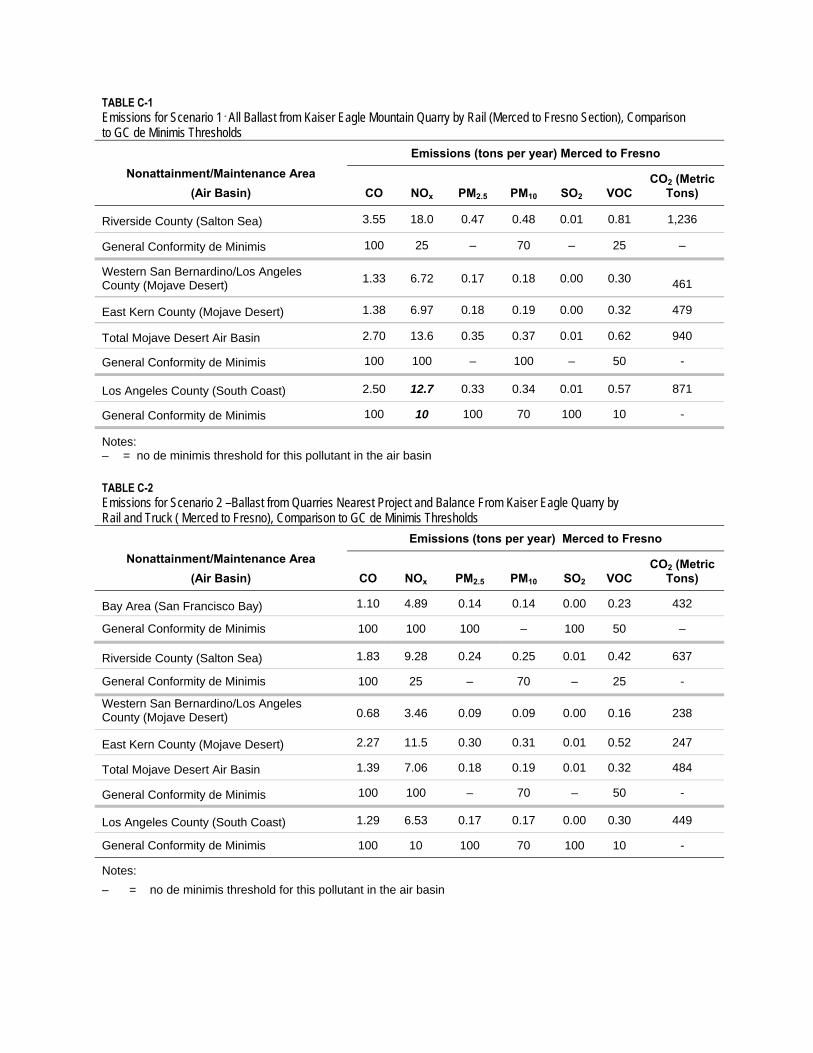
Riverside County (Salton Sea) 1.83 9.28 0.24 0.25 0.01 0.42 637
General Conformity de Minimis 100 25 – 70 – 25 -
Western San Bernardino/Los Angeles County (Mojave Desert) 0.68 3.46 0.09 0.09 0.00 0.16 238
East Kern County (Mojave Desert) 2.27 11.5 0.30 0.31 0.01 0.52 247
Total Mojave Desert Air Basin 1.39 7.06 0.18 0.19 0.01 0.32 484
General Conformity de Minimis 100 100 – 70 – 50 -
Los Angeles County (South Coast) 1.29 6.53 0.17 0.17 0.00 0.30 449
General Conformity de Minimis 100 10 100 70 100 10 -
Notes:
– = no de minimis threshold for this pollutant in the air basin
TABLE C-1 Emissions for Scenario 1 - All Ballast from Kaiser Eagle Mountain Quarry by Rail (Merced to Fresno Section), Comparison to GC de Minimis Thresholds
Nonattainment/Maintenance Area (Air Basin)
Emissions (tons per year) Merced to Fresno
CO NOx PM2.5 PM10 SO2 VOC CO2 (Metric
Tons)
Riverside County (Salton Sea) 3.55 18.0 0.47 0.48 0.01 0.81 1,236
General Conformity de Minimis 100 25 – 70 – 25 –
Western San Bernardino/Los Angeles County (Mojave Desert)
1.33 6.72 0.17 0.18 0.00 0.30 461
East Kern County (Mojave Desert) 1.38 6.97 0.18 0.19 0.00 0.32 479
Total Mojave Desert Air Basin 2.70 13.6 0.35 0.37 0.01 0.62 940
General Conformity de Minimis 100 100 – 100 – 50 -
Los Angeles County (South Coast) 2.50 12.7 0.33 0.34 0.01 0.57 871
General Conformity de Minimis 100 10 100 70 100 10 -
Notes: – = no de minimis threshold for this pollutant in the air basin
TABLE C-2 Emissions for Scenario 2 –Ballast from Quarries Nearest Project and Balance From Kaiser Eagle Quarry by Rail and Truck ( Merced to Fresno), Comparison to GC de Minimis Thresholds
Nonattainment/Maintenance Area (Air Basin)
Emissions (tons per year) Merced to Fresno
CO NOx PM2.5 PM10 SO2 VOC CO2 (Metric
Tons)
Bay Area (San Francisco Bay) 1.10 4.89 0.14 0.14 0.00 0.23 432
General Conformity de Minimis 100 100 100 – 100 50 –
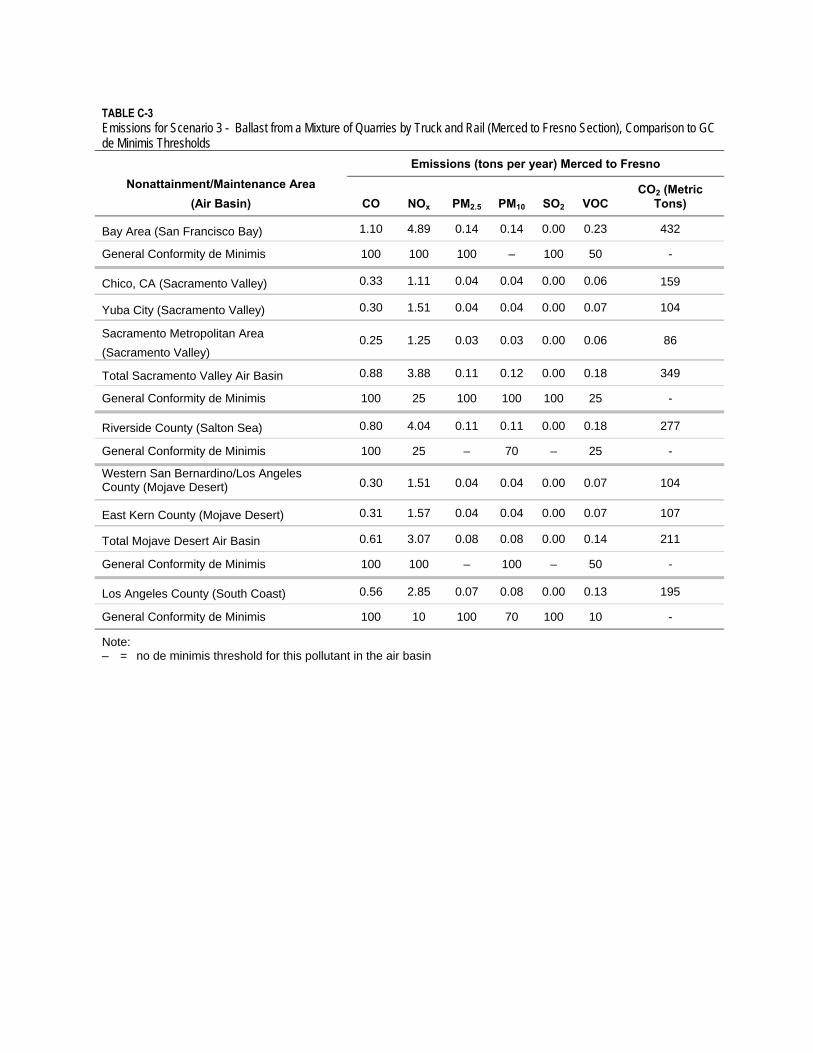
TABLE C-3 Emissions for Scenario 3 - Ballast from a Mixture of Quarries by Truck and Rail (Merced to Fresno Section), Comparison to GC de Minimis Thresholds
Nonattainment/Maintenance Area (Air Basin)
Emissions (tons per year) Merced to Fresno
CO NOx PM2.5 PM10 SO2 VOC CO2 (Metric
Tons)
Bay Area (San Francisco Bay) 1.10 4.89 0.14 0.14 0.00 0.23 432
General Conformity de Minimis 100 100 100 – 100 50 -
Chico, CA (Sacramento Valley) 0.33 1.11 0.04 0.04 0.00 0.06 159
Yuba City (Sacramento Valley) 0.30 1.51 0.04 0.04 0.00 0.07 104
Sacramento Metropolitan Area
(Sacramento Valley) 0.25 1.25 0.03 0.03 0.00 0.06 86
Total Sacramento Valley Air Basin 0.88 3.88 0.11 0.12 0.00 0.18 349
General Conformity de Minimis 100 25 100 100 100 25 -
Riverside County (Salton Sea) 0.80 4.04 0.11 0.11 0.00 0.18 277
General Conformity de Minimis 100 25 – 70 – 25 -
Western San Bernardino/Los Angeles County (Mojave Desert) 0.30 1.51 0.04 0.04 0.00 0.07 104
East Kern County (Mojave Desert) 0.31 1.57 0.04 0.04 0.00 0.07 107
Total Mojave Desert Air Basin 0.61 3.07 0.08 0.08 0.00 0.14 211
General Conformity de Minimis 100 100 – 100 – 50 -
Los Angeles County (South Coast) 0.56 2.85 0.07 0.08 0.00 0.13 195
General Conformity de Minimis 100 10 100 70 100 10 -
Note: – = no de minimis threshold for this pollutant in the air basin
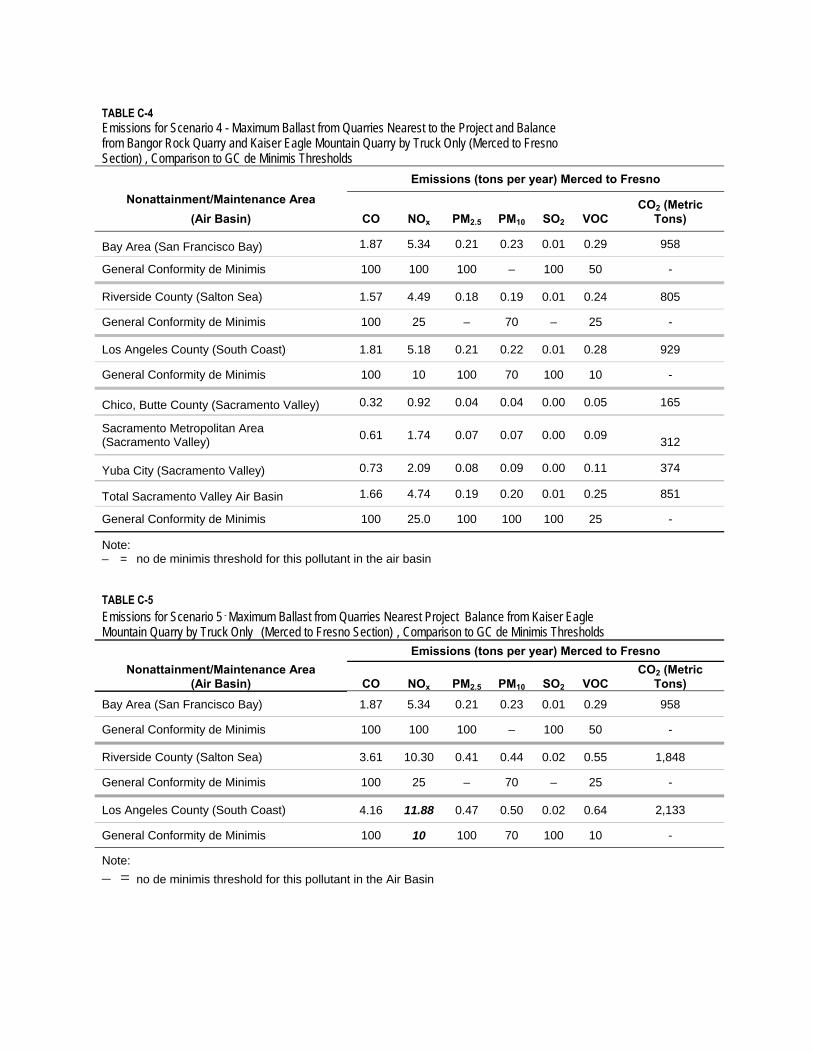
TABLE C-4 Emissions for Scenario 4 - Maximum Ballast from Quarries Nearest to the Project and Balance from Bangor Rock Quarry and Kaiser Eagle Mountain Quarry by Truck Only (Merced to Fresno Section) , Comparison to GC de Minimis Thresholds
Nonattainment/Maintenance Area (Air Basin)
Emissions (tons per year) Merced to Fresno
CO NOx PM2.5 PM10 SO2 VOC CO2 (Metric
Tons)
Bay Area (San Francisco Bay) 1.87 5.34 0.21 0.23 0.01 0.29 958
General Conformity de Minimis 100 100 100 – 100 50 -
Riverside County (Salton Sea) 1.57 4.49 0.18 0.19 0.01 0.24 805
General Conformity de Minimis 100 25 – 70 – 25 -
Los Angeles County (South Coast) 1.81 5.18 0.21 0.22 0.01 0.28 929
General Conformity de Minimis 100 10 100 70 100 10 -
Chico, Butte County (Sacramento Valley) 0.32 0.92 0.04 0.04 0.00 0.05 165
Sacramento Metropolitan Area (Sacramento Valley)
0.61 1.74 0.07 0.07 0.00 0.09 312
Yuba City (Sacramento Valley) 0.73 2.09 0.08 0.09 0.00 0.11 374
Total Sacramento Valley Air Basin 1.66 4.74 0.19 0.20 0.01 0.25 851
General Conformity de Minimis 100 25.0 100 100 100 25 -
Note: – = no de minimis threshold for this pollutant in the air basin
TABLE C-5 Emissions for Scenario 5 - Maximum Ballast from Quarries Nearest Project Balance from Kaiser Eagle Mountain Quarry by Truck Only (Merced to Fresno Section) , Comparison to GC de Minimis Thresholds
Nonattainment/Maintenance Area (Air Basin)
Emissions (tons per year) Merced to Fresno
CO NOx PM2.5 PM10 SO2 VOC CO2 (Metric
Tons) Bay Area (San Francisco Bay) 1.87 5.34 0.21 0.23 0.01 0.29 958
General Conformity de Minimis 100 100 100 – 100 50 -
Riverside County (Salton Sea) 3.61 10.30 0.41 0.44 0.02 0.55 1,848
General Conformity de Minimis 100 25 – 70 – 25 -
Los Angeles County (South Coast) 4.16 11.88 0.47 0.50 0.02 0.64 2,133
General Conformity de Minimis 100 10 100 70 100 10 -
Note:
– = no de minimis threshold for this pollutant in the Air Basin
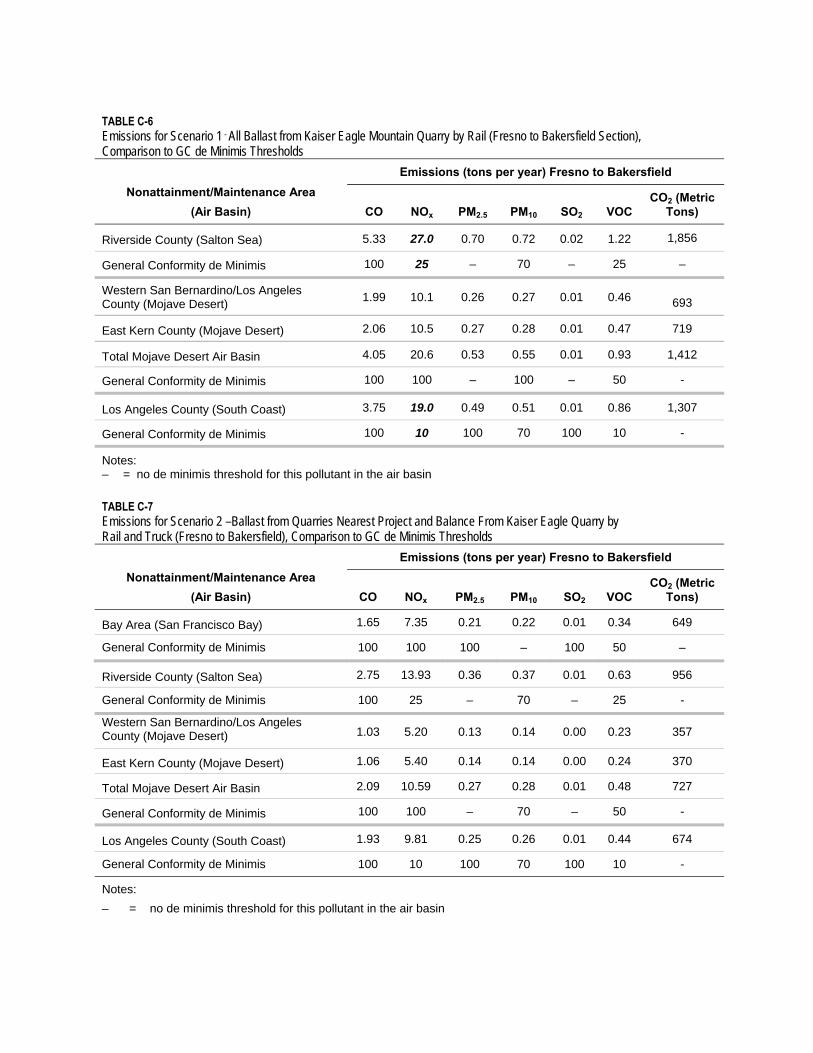
Riverside County (Salton Sea) 2.75 13.93 0.36 0.37 0.01 0.63 956
General Conformity de Minimis 100 25 – 70 – 25 -
Western San Bernardino/Los Angeles County (Mojave Desert) 1.03 5.20 0.13 0.14 0.00 0.23 357
East Kern County (Mojave Desert) 1.06 5.40 0.14 0.14 0.00 0.24 370
Total Mojave Desert Air Basin 2.09 10.59 0.27 0.28 0.01 0.48 727
General Conformity de Minimis 100 100 – 70 – 50 -
Los Angeles County (South Coast) 1.93 9.81 0.25 0.26 0.01 0.44 674
General Conformity de Minimis 100 10 100 70 100 10 -
Notes:
– = no de minimis threshold for this pollutant in the air basin
TABLE C-6 Emissions for Scenario 1 - All Ballast from Kaiser Eagle Mountain Quarry by Rail (Fresno to Bakersfield Section), Comparison to GC de Minimis Thresholds
Nonattainment/Maintenance Area (Air Basin)
Emissions (tons per year) Fresno to Bakersfield
CO NOx PM2.5 PM10 SO2 VOC CO2 (Metric
Tons)
Riverside County (Salton Sea) 5.33 27.0 0.70 0.72 0.02 1.22 1,856
General Conformity de Minimis 100 25 – 70 – 25 –
Western San Bernardino/Los Angeles County (Mojave Desert)
1.99 10.1 0.26 0.27 0.01 0.46 693
East Kern County (Mojave Desert) 2.06 10.5 0.27 0.28 0.01 0.47 719
Total Mojave Desert Air Basin 4.05 20.6 0.53 0.55 0.01 0.93 1,412
General Conformity de Minimis 100 100 – 100 – 50 -
Los Angeles County (South Coast) 3.75 19.0 0.49 0.51 0.01 0.86 1,307
General Conformity de Minimis 100 10 100 70 100 10 -
Notes: – = no de minimis threshold for this pollutant in the air basin
TABLE C-7 Emissions for Scenario 2 –Ballast from Quarries Nearest Project and Balance From Kaiser Eagle Quarry by Rail and Truck (Fresno to Bakersfield), Comparison to GC de Minimis Thresholds
Nonattainment/Maintenance Area (Air Basin)
Emissions (tons per year) Fresno to Bakersfield
CO NOx PM2.5 PM10 SO2 VOC CO2 (Metric
Tons)
Bay Area (San Francisco Bay) 1.65 7.35 0.21 0.22 0.01 0.34 649
General Conformity de Minimis 100 100 100 – 100 50 –

TABLE C-8 Emissions for Scenario 3 - Ballast from a Mixture of Quarries by Truck and Rail (Fresno to Bakersfield Section), Comparison to GC de Minimis Thresholds
Nonattainment/Maintenance Area (Air Basin)
Emissions (tons per year) Fresno to Bakersfield
CO NOx PM2.5 PM10 SO2 VOC CO2 (Metric
Tons)
Bay Area (San Francisco Bay) 1.65 7.35 0.21 0.22 0.01 0.34 649
General Conformity de Minimis 100 100 100 – 100 50 -
Chico, CA (Sacramento Valley) 0.50 1.67 0.06 0.06 0.00 0.08 239
Yuba City (Sacramento Valley) 0.45 2.27 0.06 0.06 0.00 0.10 156
Sacramento Metropolitan Area
(Sacramento Valley) 0.37 1.88 0.05 0.05 0.00 0.09 129
Total Sacramento Valley Air Basin 1.32 5.82 0.17 0.17 0.01 0.27 524
General Conformity de Minimis 100 25 100 100 100 25 -
Riverside County (Salton Sea) 1.20 6.07 0.16 0.16 0.00 0.27 417
General Conformity de Minimis 100 25 – 70 – 25 -
Western San Bernardino/Los Angeles County (Mojave Desert) 0.45 2.26 0.06 0.06 0.00 0.10 156
East Kern County (Mojave Desert) 0.46 2.35 0.06 0.06 0.00 0.11 161
Total Mojave Desert Air Basin 0.91 4.62 0.12 0.12 0.00 0.21 317
General Conformity de Minimis 100 100 – 100 – 50 -
Los Angeles County (South Coast) 0.84 4.27 0.11 0.11 0.00 0.19 293
General Conformity de Minimis 100 10 100 70 100 10 -
Note: – = no de minimis threshold for this pollutant in the air basin
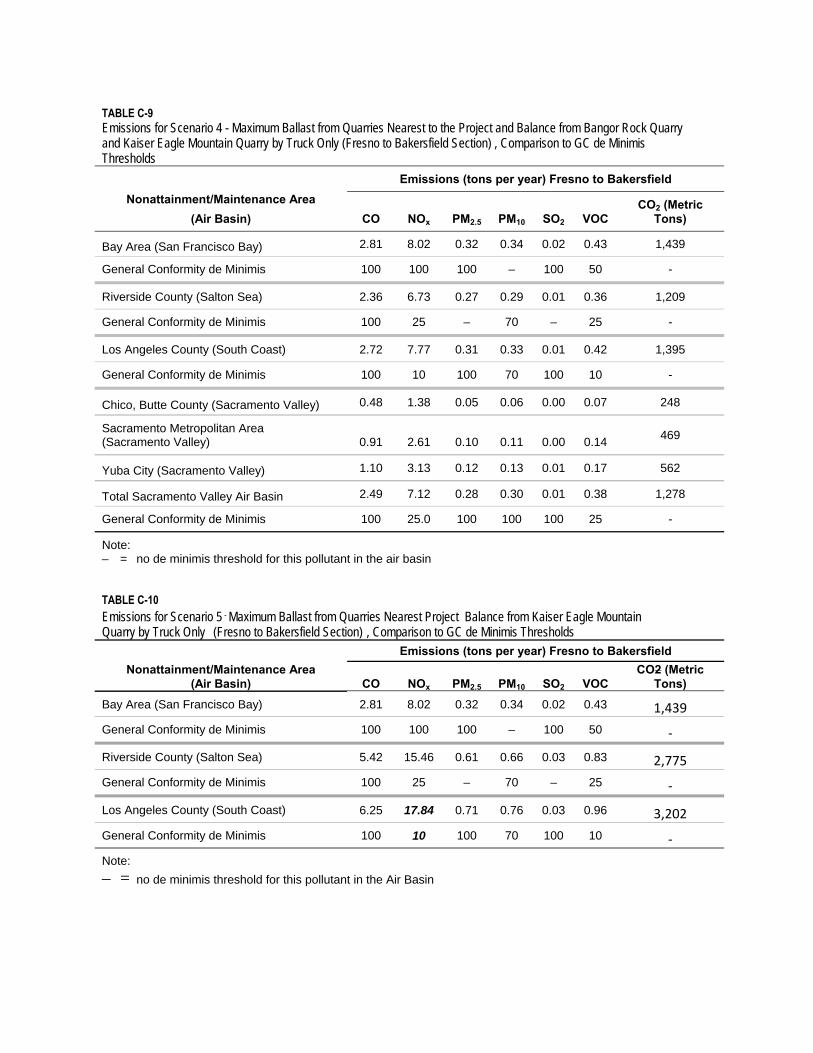
TABLE C-9 Emissions for Scenario 4 - Maximum Ballast from Quarries Nearest to the Project and Balance from Bangor Rock Quarry and Kaiser Eagle Mountain Quarry by Truck Only (Fresno to Bakersfield Section) , Comparison to GC de Minimis Thresholds
Nonattainment/Maintenance Area (Air Basin)
Emissions (tons per year) Fresno to Bakersfield
CO NOx PM2.5 PM10 SO2 VOC CO2 (Metric
Tons)
Bay Area (San Francisco Bay) 2.81 8.02 0.32 0.34 0.02 0.43 1,439
General Conformity de Minimis 100 100 100 – 100 50 -
Riverside County (Salton Sea) 2.36 6.73 0.27 0.29 0.01 0.36 1,209
General Conformity de Minimis 100 25 – 70 – 25 -
Los Angeles County (South Coast) 2.72 7.77 0.31 0.33 0.01 0.42 1,395
General Conformity de Minimis 100 10 100 70 100 10 -
Chico, Butte County (Sacramento Valley) 0.48 1.38 0.05 0.06 0.00 0.07 248
Sacramento Metropolitan Area (Sacramento Valley) 0.91 2.61 0.10 0.11 0.00 0.14
469
Yuba City (Sacramento Valley) 1.10 3.13 0.12 0.13 0.01 0.17 562
Total Sacramento Valley Air Basin 2.49 7.12 0.28 0.30 0.01 0.38 1,278
General Conformity de Minimis 100 25.0 100 100 100 25 -
Note: – = no de minimis threshold for this pollutant in the air basin
TABLE C-10 Emissions for Scenario 5 - Maximum Ballast from Quarries Nearest Project Balance from Kaiser Eagle Mountain Quarry by Truck Only (Fresno to Bakersfield Section) , Comparison to GC de Minimis Thresholds
Nonattainment/Maintenance Area (Air Basin)
Emissions (tons per year) Fresno to Bakersfield
CO NOx PM2.5 PM10 SO2 VOC CO2 (Metric
Tons) Bay Area (San Francisco Bay) 2.81 8.02 0.32 0.34 0.02 0.43 1,439
General Conformity de Minimis 100 100 100 – 100 50 ‐
Riverside County (Salton Sea) 5.42 15.46 0.61 0.66 0.03 0.83 2,775
General Conformity de Minimis 100 25 – 70 – 25 ‐
Los Angeles County (South Coast) 6.25 17.84 0.71 0.76 0.03 0.96 3,202
General Conformity de Minimis 100 10 100 70 100 10 ‐
Note:
– = no de minimis threshold for this pollutant in the Air Basin
Attachment D Emission Calculations for Scenarios Compared to
CEQA Thresholds
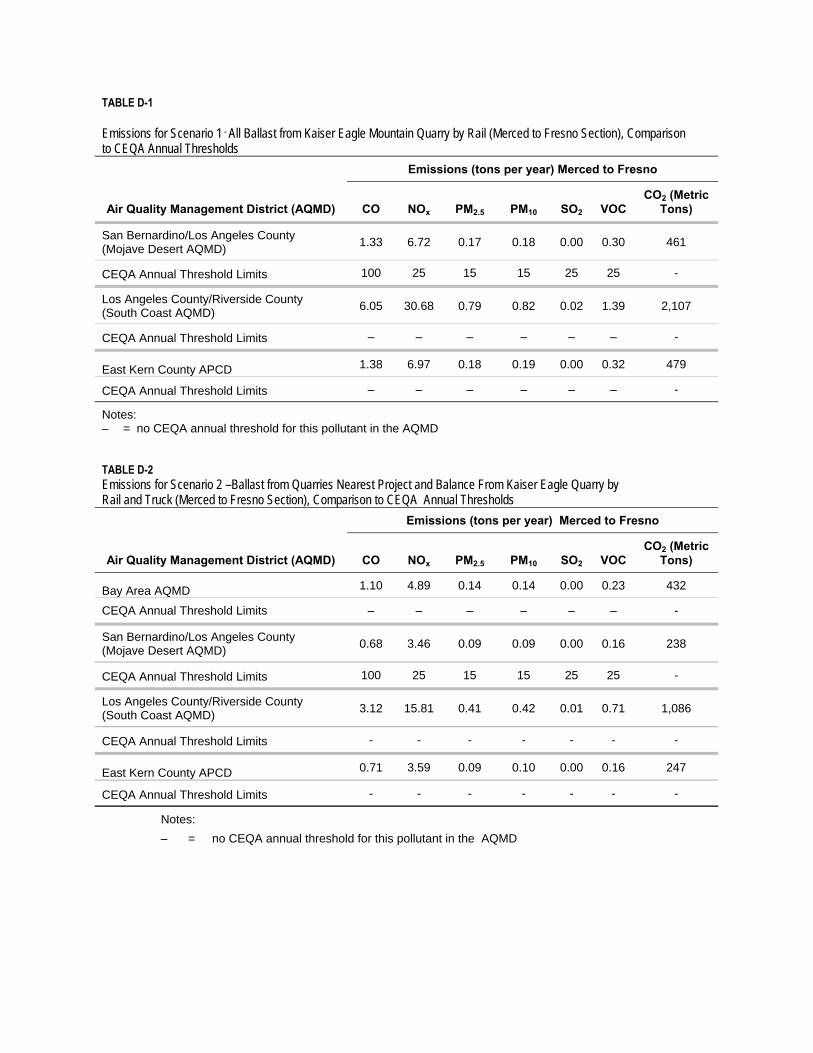
TABLE D-1
Emissions for Scenario 1 - All Ballast from Kaiser Eagle Mountain Quarry by Rail (Merced to Fresno Section), Comparison to CEQA Annual Thresholds
Air Quality Management District (AQMD)
Emissions (tons per year) Merced to Fresno
CO NOx PM2.5 PM10 SO2 VOC CO2 (Metric
Tons)
San Bernardino/Los Angeles County (Mojave Desert AQMD)
1.33 6.72 0.17 0.18 0.00 0.30 461
CEQA Annual Threshold Limits 100 25 15 15 25 25 -
Los Angeles County/Riverside County (South Coast AQMD)
6.05 30.68 0.79 0.82 0.02 1.39 2,107
CEQA Annual Threshold Limits – – – – – – -
East Kern County APCD 1.38 6.97 0.18 0.19 0.00 0.32 479
CEQA Annual Threshold Limits – – – – – – -
Notes: – = no CEQA annual threshold for this pollutant in the AQMD TABLE D-2 Emissions for Scenario 2 –Ballast from Quarries Nearest Project and Balance From Kaiser Eagle Quarry by Rail and Truck (Merced to Fresno Section), Comparison to CEQA Annual Thresholds
Air Quality Management District (AQMD)
Emissions (tons per year) Merced to Fresno
CO NOx PM2.5 PM10 SO2 VOC CO2 (Metric
Tons)
Bay Area AQMD 1.10 4.89 0.14 0.14 0.00 0.23 432
CEQA Annual Threshold Limits – – – – – – -
San Bernardino/Los Angeles County (Mojave Desert AQMD)
0.68 3.46 0.09 0.09 0.00 0.16 238
CEQA Annual Threshold Limits 100 25 15 15 25 25 -
Los Angeles County/Riverside County (South Coast AQMD)
3.12 15.81 0.41 0.42 0.01 0.71 1,086
CEQA Annual Threshold Limits - - - - - - -
East Kern County APCD 0.71 3.59 0.09 0.10 0.00 0.16 247
CEQA Annual Threshold Limits - - - - - - -
Notes:
– = no CEQA annual threshold for this pollutant in the AQMD
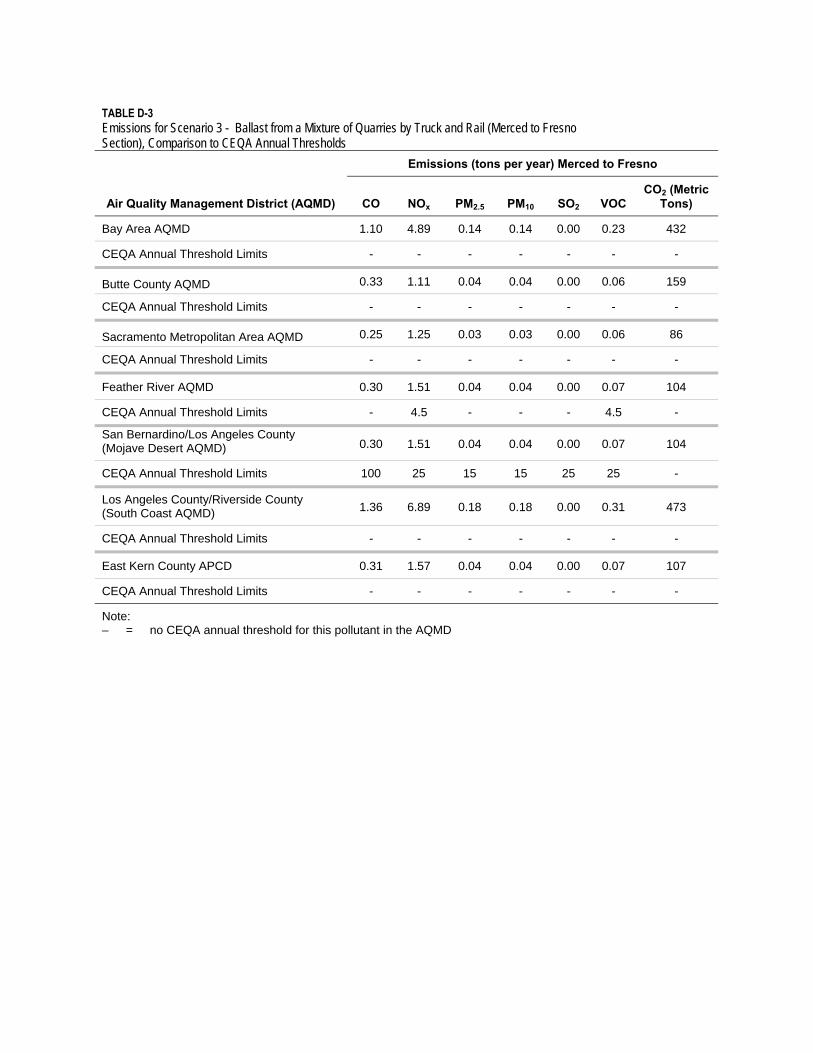
TABLE D-3 Emissions for Scenario 3 - Ballast from a Mixture of Quarries by Truck and Rail (Merced to Fresno Section), Comparison to CEQA Annual Thresholds
Air Quality Management District (AQMD)
Emissions (tons per year) Merced to Fresno
CO NOx PM2.5 PM10 SO2 VOC CO2 (Metric
Tons)
Bay Area AQMD 1.10 4.89 0.14 0.14 0.00 0.23 432
CEQA Annual Threshold Limits - - - - - - -
Butte County AQMD 0.33 1.11 0.04 0.04 0.00 0.06 159
CEQA Annual Threshold Limits - - - - - - -
Sacramento Metropolitan Area AQMD 0.25 1.25 0.03 0.03 0.00 0.06 86
CEQA Annual Threshold Limits - - - - - - -
Feather River AQMD 0.30 1.51 0.04 0.04 0.00 0.07 104
CEQA Annual Threshold Limits - 4.5 - - - 4.5 -
San Bernardino/Los Angeles County (Mojave Desert AQMD) 0.30 1.51 0.04 0.04 0.00 0.07 104
CEQA Annual Threshold Limits 100 25 15 15 25 25 -
Los Angeles County/Riverside County (South Coast AQMD) 1.36 6.89 0.18 0.18 0.00 0.31 473
CEQA Annual Threshold Limits - - - - - - -
East Kern County APCD 0.31 1.57 0.04 0.04 0.00 0.07 107
CEQA Annual Threshold Limits - - - - - - -
Note: – = no CEQA annual threshold for this pollutant in the AQMD
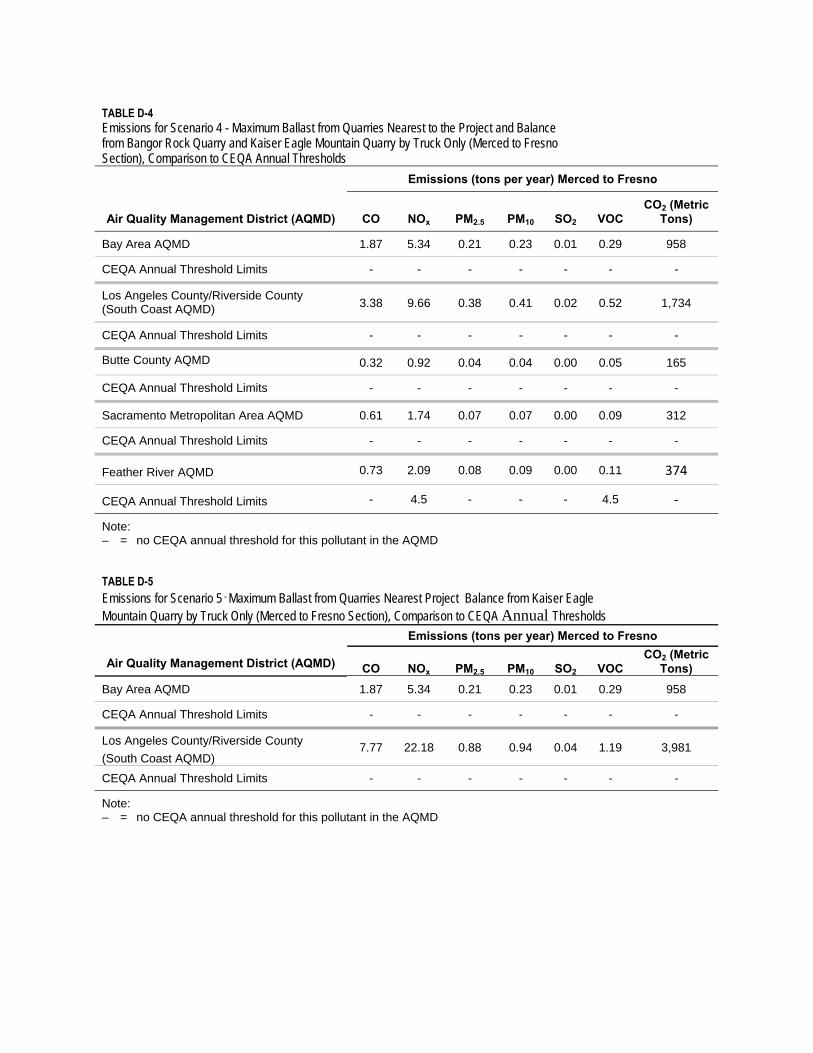
TABLE D-4 Emissions for Scenario 4 - Maximum Ballast from Quarries Nearest to the Project and Balance from Bangor Rock Quarry and Kaiser Eagle Mountain Quarry by Truck Only (Merced to Fresno Section), Comparison to CEQA Annual Thresholds
Air Quality Management District (AQMD)
Emissions (tons per year) Merced to Fresno
CO NOx PM2.5 PM10 SO2 VOC CO2 (Metric
Tons)
Bay Area AQMD 1.87 5.34 0.21 0.23 0.01 0.29 958
CEQA Annual Threshold Limits - - - - - - -
Los Angeles County/Riverside County (South Coast AQMD) 3.38 9.66 0.38 0.41 0.02 0.52 1,734
CEQA Annual Threshold Limits - - - - - - -
Butte County AQMD 0.32 0.92 0.04 0.04 0.00 0.05 165
CEQA Annual Threshold Limits - - - - - - -
Sacramento Metropolitan Area AQMD 0.61 1.74 0.07 0.07 0.00 0.09 312
CEQA Annual Threshold Limits - - - - - - -
Feather River AQMD 0.73 2.09 0.08 0.09 0.00 0.11 374
CEQA Annual Threshold Limits - 4.5 - - - 4.5 ‐
Note: – = no CEQA annual threshold for this pollutant in the AQMD
TABLE D-5 Emissions for Scenario 5 - Maximum Ballast from Quarries Nearest Project Balance from Kaiser Eagle Mountain Quarry by Truck Only (Merced to Fresno Section), Comparison to CEQA Annual Thresholds
Air Quality Management District (AQMD)
Emissions (tons per year) Merced to Fresno
CO NOx PM2.5 PM10 SO2 VOC CO2 (Metric
Tons) Bay Area AQMD 1.87 5.34 0.21 0.23 0.01 0.29 958
CEQA Annual Threshold Limits - - - - - - -
Los Angeles County/Riverside County
(South Coast AQMD) 7.77 22.18 0.88 0.94 0.04 1.19 3,981
CEQA Annual Threshold Limits - - - - - - -
Note: – = no CEQA annual threshold for this pollutant in the AQMD
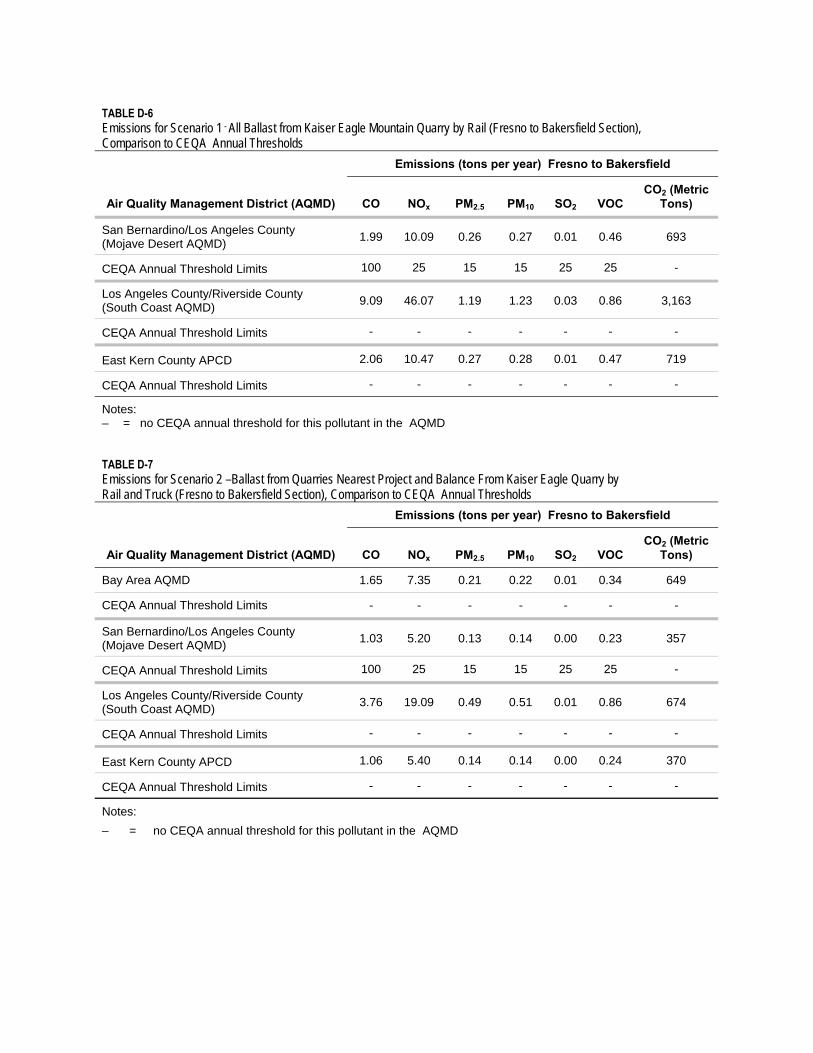
TABLE D-6 Emissions for Scenario 1 - All Ballast from Kaiser Eagle Mountain Quarry by Rail (Fresno to Bakersfield Section), Comparison to CEQA Annual Thresholds
Air Quality Management District (AQMD)
Emissions (tons per year) Fresno to Bakersfield
CO NOx PM2.5 PM10 SO2 VOC CO2 (Metric
Tons)
San Bernardino/Los Angeles County (Mojave Desert AQMD)
1.99 10.09 0.26 0.27 0.01 0.46 693
CEQA Annual Threshold Limits 100 25 15 15 25 25 -
Los Angeles County/Riverside County (South Coast AQMD)
9.09 46.07 1.19 1.23 0.03 0.86 3,163
CEQA Annual Threshold Limits - - - - - - -
East Kern County APCD 2.06 10.47 0.27 0.28 0.01 0.47 719
CEQA Annual Threshold Limits - - - - - - -
Notes: – = no CEQA annual threshold for this pollutant in the AQMD TABLE D-7 Emissions for Scenario 2 –Ballast from Quarries Nearest Project and Balance From Kaiser Eagle Quarry by Rail and Truck (Fresno to Bakersfield Section), Comparison to CEQA Annual Thresholds
Air Quality Management District (AQMD)
Emissions (tons per year) Fresno to Bakersfield
CO NOx PM2.5 PM10 SO2 VOC CO2 (Metric
Tons)
Bay Area AQMD 1.65 7.35 0.21 0.22 0.01 0.34 649
CEQA Annual Threshold Limits - - - - - - -
San Bernardino/Los Angeles County (Mojave Desert AQMD)
1.03 5.20 0.13 0.14 0.00 0.23 357
CEQA Annual Threshold Limits 100 25 15 15 25 25 -
Los Angeles County/Riverside County (South Coast AQMD)
3.76 19.09 0.49 0.51 0.01 0.86 674
CEQA Annual Threshold Limits - - - - - - -
East Kern County APCD 1.06 5.40 0.14 0.14 0.00 0.24 370
CEQA Annual Threshold Limits - - - - - - -
Notes:
– = no CEQA annual threshold for this pollutant in the AQMD
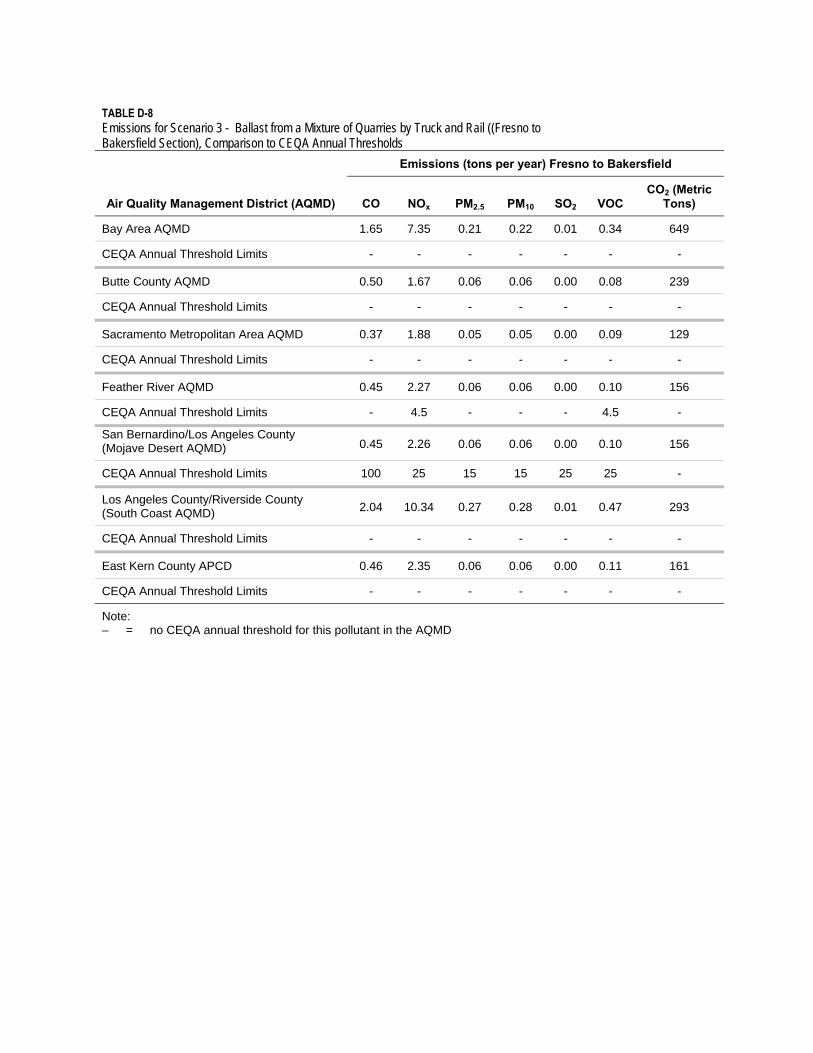
TABLE D-8 Emissions for Scenario 3 - Ballast from a Mixture of Quarries by Truck and Rail ((Fresno to Bakersfield Section), Comparison to CEQA Annual Thresholds
Air Quality Management District (AQMD)
Emissions (tons per year) Fresno to Bakersfield
CO NOx PM2.5 PM10 SO2 VOC CO2 (Metric
Tons)
Bay Area AQMD 1.65 7.35 0.21 0.22 0.01 0.34 649
CEQA Annual Threshold Limits - - - - - - -
Butte County AQMD 0.50 1.67 0.06 0.06 0.00 0.08 239
CEQA Annual Threshold Limits - - - - - - -
Sacramento Metropolitan Area AQMD 0.37 1.88 0.05 0.05 0.00 0.09 129
CEQA Annual Threshold Limits - - - - - - -
Feather River AQMD 0.45 2.27 0.06 0.06 0.00 0.10 156
CEQA Annual Threshold Limits - 4.5 - - - 4.5 -
San Bernardino/Los Angeles County (Mojave Desert AQMD) 0.45 2.26 0.06 0.06 0.00 0.10 156
CEQA Annual Threshold Limits 100 25 15 15 25 25 -
Los Angeles County/Riverside County (South Coast AQMD) 2.04 10.34 0.27 0.28 0.01 0.47 293
CEQA Annual Threshold Limits - - - - - - -
East Kern County APCD 0.46 2.35 0.06 0.06 0.00 0.11 161
CEQA Annual Threshold Limits - - - - - - -
Note: – = no CEQA annual threshold for this pollutant in the AQMD
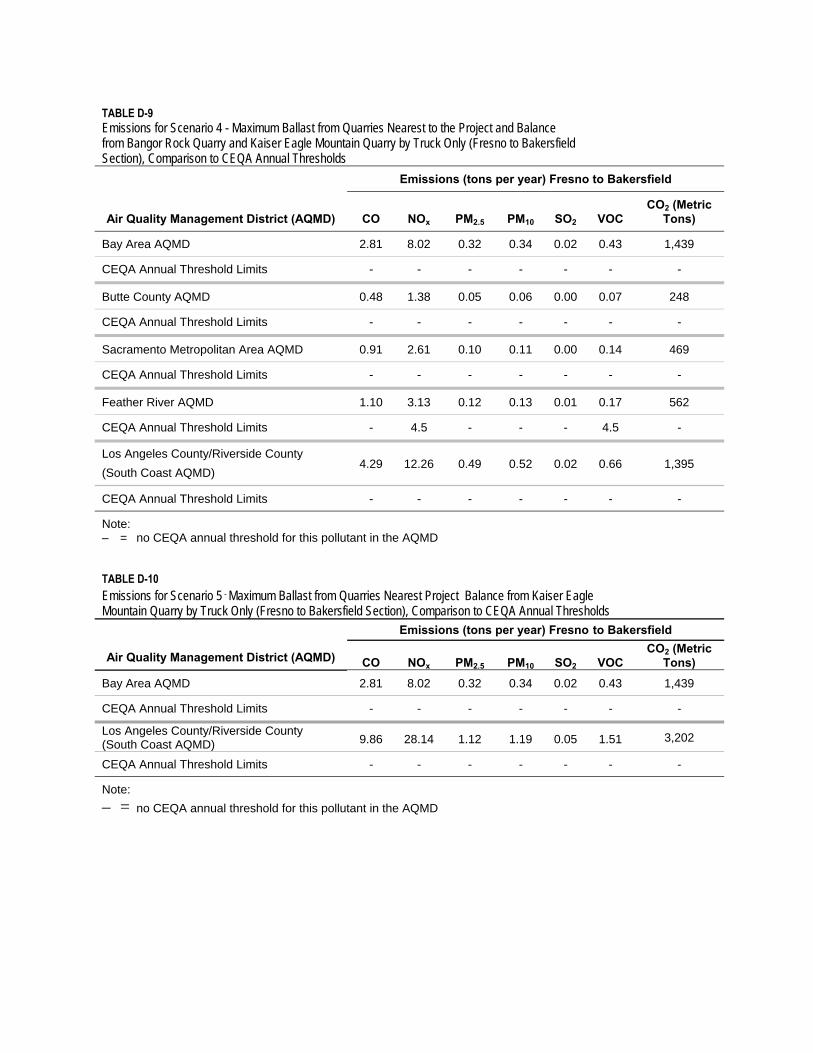
TABLE D-9 Emissions for Scenario 4 - Maximum Ballast from Quarries Nearest to the Project and Balance from Bangor Rock Quarry and Kaiser Eagle Mountain Quarry by Truck Only (Fresno to Bakersfield Section), Comparison to CEQA Annual Thresholds
Air Quality Management District (AQMD)
Emissions (tons per year) Fresno to Bakersfield
CO NOx PM2.5 PM10 SO2 VOC CO2 (Metric
Tons)
Bay Area AQMD 2.81 8.02 0.32 0.34 0.02 0.43 1,439
CEQA Annual Threshold Limits - - - - - - -
Butte County AQMD 0.48 1.38 0.05 0.06 0.00 0.07 248
CEQA Annual Threshold Limits - - - - - - -
Sacramento Metropolitan Area AQMD 0.91 2.61 0.10 0.11 0.00 0.14 469
CEQA Annual Threshold Limits - - - - - - -
Feather River AQMD 1.10 3.13 0.12 0.13 0.01 0.17 562
CEQA Annual Threshold Limits - 4.5 - - - 4.5 -
Los Angeles County/Riverside County
(South Coast AQMD) 4.29 12.26 0.49 0.52 0.02 0.66 1,395
CEQA Annual Threshold Limits - - - - - - -
Note: – = no CEQA annual threshold for this pollutant in the AQMD
TABLE D-10 Emissions for Scenario 5 - Maximum Ballast from Quarries Nearest Project Balance from Kaiser Eagle Mountain Quarry by Truck Only (Fresno to Bakersfield Section), Comparison to CEQA Annual Thresholds
Air Quality Management District (AQMD)
Emissions (tons per year) Fresno to Bakersfield
CO NOx PM2.5 PM10 SO2 VOC CO2 (Metric
Tons) Bay Area AQMD 2.81 8.02 0.32 0.34 0.02 0.43 1,439
CEQA Annual Threshold Limits - - - - - - -
Los Angeles County/Riverside County (South Coast AQMD) 9.86 28.14 1.12 1.19 0.05 1.51 3,202
CEQA Annual Threshold Limits - - - - - - -
Note:
– = no CEQA annual threshold for this pollutant in the AQMD
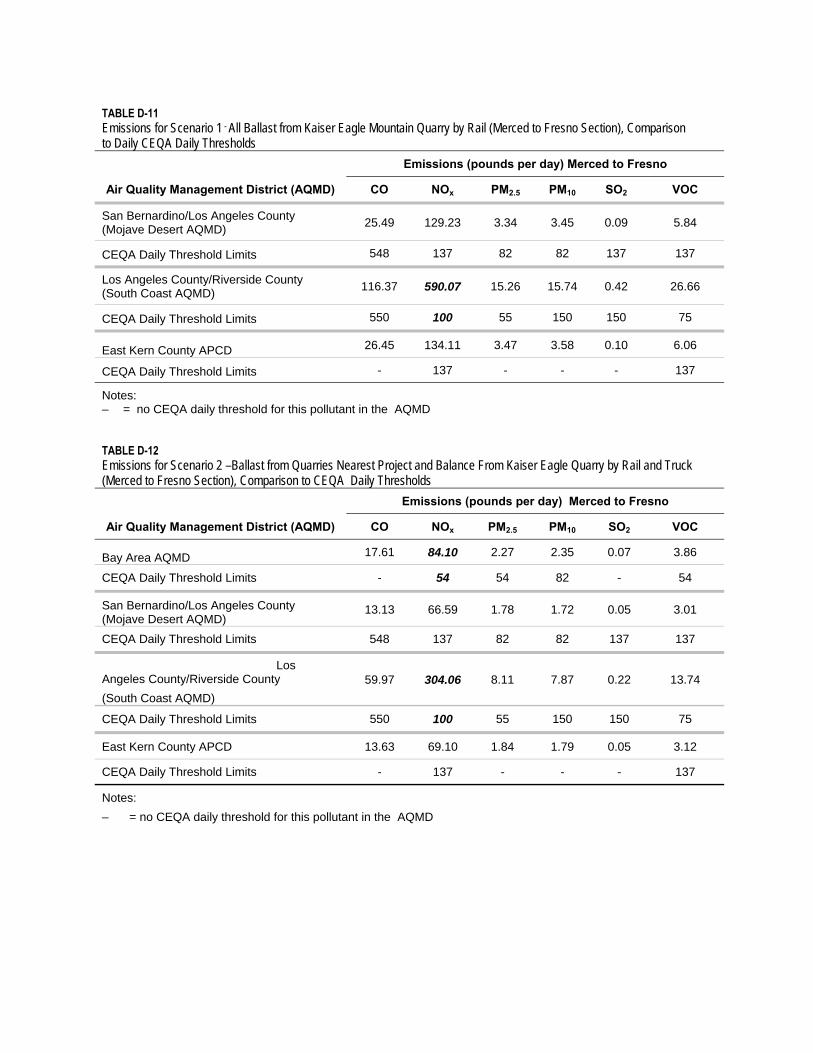
TABLE D-11 Emissions for Scenario 1 - All Ballast from Kaiser Eagle Mountain Quarry by Rail (Merced to Fresno Section), Comparison to Daily CEQA Daily Thresholds
Air Quality Management District (AQMD)
Emissions (pounds per day) Merced to Fresno
CO NOx PM2.5 PM10 SO2 VOC
San Bernardino/Los Angeles County (Mojave Desert AQMD)
25.49 129.23 3.34 3.45 0.09 5.84
CEQA Daily Threshold Limits 548 137 82 82 137 137
Los Angeles County/Riverside County (South Coast AQMD)
116.37 590.07 15.26 15.74 0.42 26.66
CEQA Daily Threshold Limits 550 100 55 150 150 75
East Kern County APCD 26.45 134.11 3.47 3.58 0.10 6.06
CEQA Daily Threshold Limits - 137 - - - 137
Notes: – = no CEQA daily threshold for this pollutant in the AQMD TABLE D-12 Emissions for Scenario 2 –Ballast from Quarries Nearest Project and Balance From Kaiser Eagle Quarry by Rail and Truck (Merced to Fresno Section), Comparison to CEQA Daily Thresholds
Air Quality Management District (AQMD)
Emissions (pounds per day) Merced to Fresno
CO NOx PM2.5 PM10 SO2 VOC
Bay Area AQMD 17.61 84.10 2.27 2.35 0.07 3.86
CEQA Daily Threshold Limits - 54 54 82 - 54
San Bernardino/Los Angeles County (Mojave Desert AQMD)
13.13 66.59 1.78 1.72 0.05 3.01
CEQA Daily Threshold Limits 548 137 82 82 137 137
Los Angeles County/Riverside County
(South Coast AQMD)
59.97 304.06 8.11 7.87 0.22 13.74
CEQA Daily Threshold Limits 550 100 55 150 150 75
East Kern County APCD 13.63 69.10 1.84 1.79 0.05 3.12
CEQA Daily Threshold Limits - 137 - - - 137
Notes:
– = no CEQA daily threshold for this pollutant in the AQMD
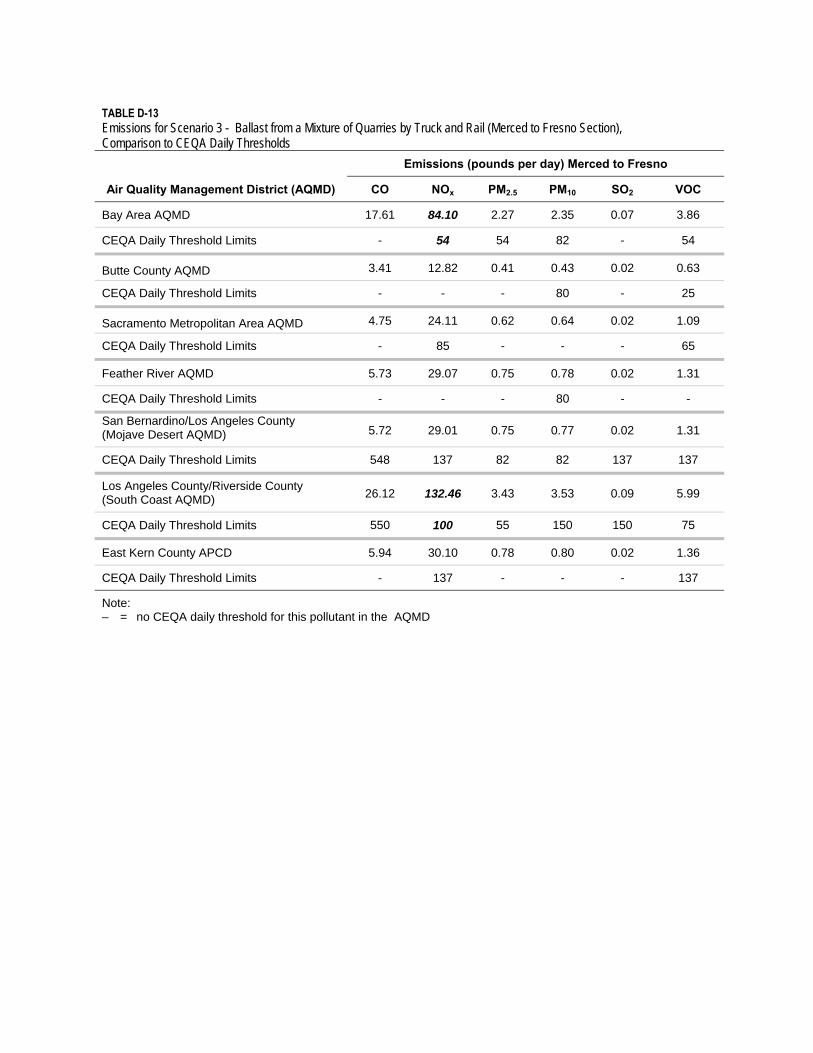
TABLE D-13 Emissions for Scenario 3 - Ballast from a Mixture of Quarries by Truck and Rail (Merced to Fresno Section), Comparison to CEQA Daily Thresholds
Air Quality Management District (AQMD)
Emissions (pounds per day) Merced to Fresno
CO NOx PM2.5 PM10 SO2 VOC
Bay Area AQMD 17.61 84.10 2.27 2.35 0.07 3.86
CEQA Daily Threshold Limits - 54 54 82 - 54
Butte County AQMD 3.41 12.82 0.41 0.43 0.02 0.63
CEQA Daily Threshold Limits - - - 80 - 25
Sacramento Metropolitan Area AQMD 4.75 24.11 0.62 0.64 0.02 1.09
CEQA Daily Threshold Limits - 85 - - - 65
Feather River AQMD 5.73 29.07 0.75 0.78 0.02 1.31
CEQA Daily Threshold Limits - - - 80 - -
San Bernardino/Los Angeles County (Mojave Desert AQMD) 5.72 29.01 0.75 0.77 0.02 1.31
CEQA Daily Threshold Limits 548 137 82 82 137 137
Los Angeles County/Riverside County (South Coast AQMD) 26.12 132.46 3.43 3.53 0.09 5.99
CEQA Daily Threshold Limits 550 100 55 150 150 75
East Kern County APCD 5.94 30.10 0.78 0.80 0.02 1.36
CEQA Daily Threshold Limits - 137 - - - 137
Note: – = no CEQA daily threshold for this pollutant in the AQMD
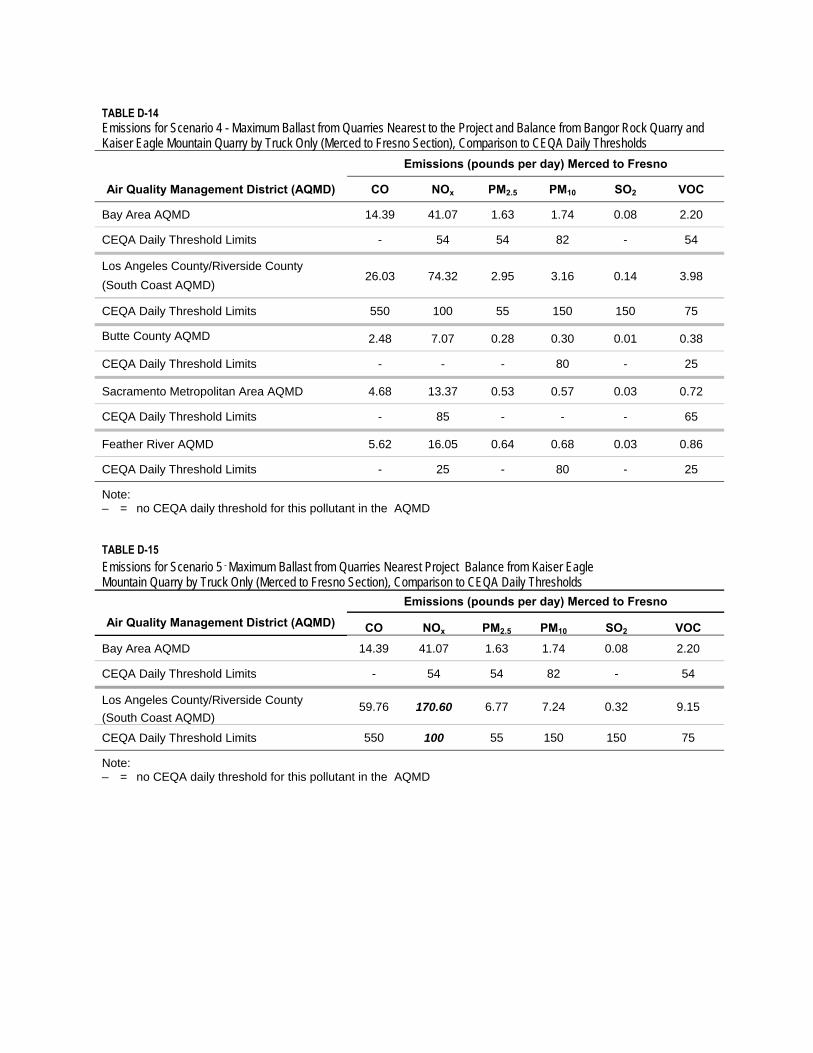
TABLE D-14 Emissions for Scenario 4 - Maximum Ballast from Quarries Nearest to the Project and Balance from Bangor Rock Quarry and Kaiser Eagle Mountain Quarry by Truck Only (Merced to Fresno Section), Comparison to CEQA Daily Thresholds
Air Quality Management District (AQMD)
Emissions (pounds per day) Merced to Fresno
CO NOx PM2.5 PM10 SO2 VOC
Bay Area AQMD 14.39 41.07 1.63 1.74 0.08 2.20
CEQA Daily Threshold Limits - 54 54 82 - 54
Los Angeles County/Riverside County
(South Coast AQMD) 26.03 74.32 2.95 3.16 0.14 3.98
CEQA Daily Threshold Limits 550 100 55 150 150 75
Butte County AQMD 2.48 7.07 0.28 0.30 0.01 0.38
CEQA Daily Threshold Limits - - - 80 - 25
Sacramento Metropolitan Area AQMD 4.68 13.37 0.53 0.57 0.03 0.72
CEQA Daily Threshold Limits - 85 - - - 65
Feather River AQMD 5.62 16.05 0.64 0.68 0.03 0.86
CEQA Daily Threshold Limits - 25 - 80 - 25
Note: – = no CEQA daily threshold for this pollutant in the AQMD
TABLE D-15 Emissions for Scenario 5 - Maximum Ballast from Quarries Nearest Project Balance from Kaiser Eagle Mountain Quarry by Truck Only (Merced to Fresno Section), Comparison to CEQA Daily Thresholds
Air Quality Management District (AQMD)
Emissions (pounds per day) Merced to Fresno
CO NOx PM2.5 PM10 SO2 VOC Bay Area AQMD 14.39 41.07 1.63 1.74 0.08 2.20
CEQA Daily Threshold Limits - 54 54 82 - 54
Los Angeles County/Riverside County
(South Coast AQMD) 59.76 170.60 6.77 7.24 0.32 9.15
CEQA Daily Threshold Limits 550 100 55 150 150 75
Note: – = no CEQA daily threshold for this pollutant in the AQMD
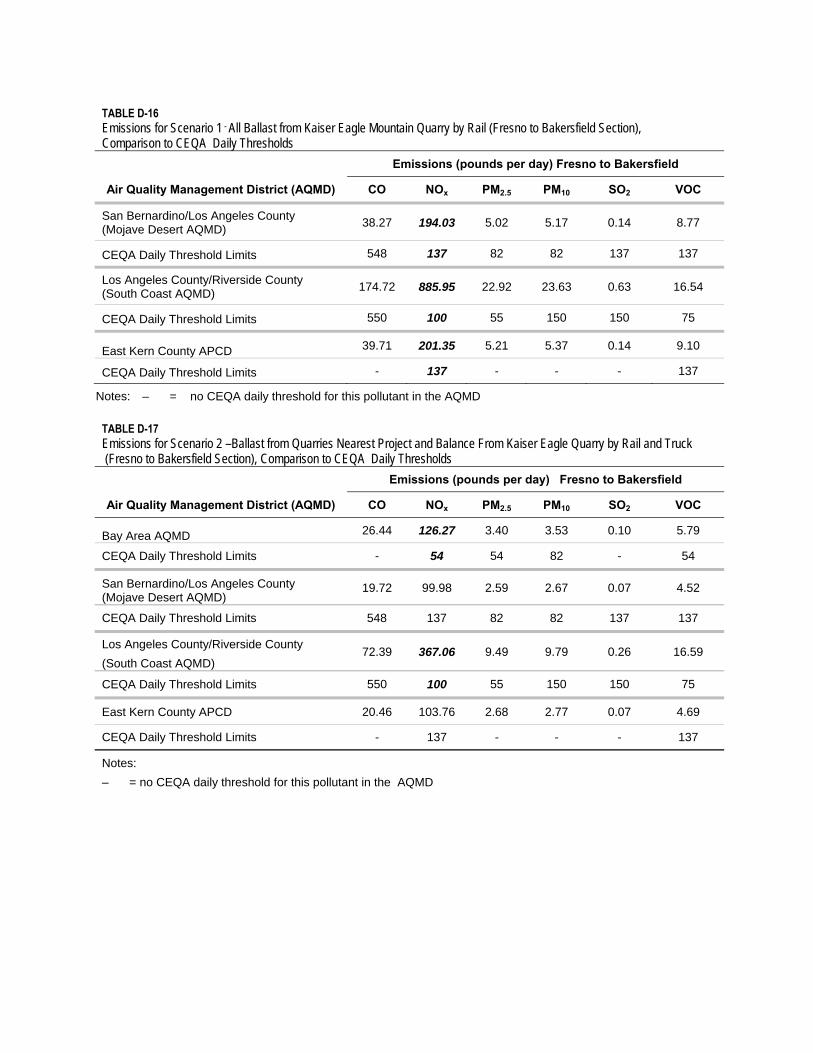
– = no CEQA daily threshold for this pollutant in the AQMD
TABLE D-16 Emissions for Scenario 1 - All Ballast from Kaiser Eagle Mountain Quarry by Rail (Fresno to Bakersfield Section), Comparison to CEQA Daily Thresholds
Air Quality Management District (AQMD)
Emissions (pounds per day) Fresno to Bakersfield
CO NOx PM2.5 PM10 SO2 VOC
San Bernardino/Los Angeles County (Mojave Desert AQMD)
38.27 194.03 5.02 5.17 0.14 8.77
CEQA Daily Threshold Limits 548 137 82 82 137 137
Los Angeles County/Riverside County (South Coast AQMD)
174.72 885.95 22.92 23.63 0.63 16.54
CEQA Daily Threshold Limits 550 100 55 150 150 75
East Kern County APCD 39.71 201.35 5.21 5.37 0.14 9.10
CEQA Daily Threshold Limits - 137 - - - 137
Notes:
TABLE D-17 Emissions for Scenario 2 –Ballast from Quarries Nearest Project and Balance From Kaiser Eagle Quarry by Rail and Truck (Fresno to Bakersfield Section), Comparison to CEQA Daily Thresholds
Air Quality Management District (AQMD)
Emissions (pounds per day) Fresno to Bakersfield
CO NOx PM2.5 PM10 SO2 VOC
Bay Area AQMD 26.44 126.27 3.40 3.53 0.10 5.79
CEQA Daily Threshold Limits - 54 54 82 - 54
San Bernardino/Los Angeles County (Mojave Desert AQMD)
19.72 99.98 2.59 2.67 0.07 4.52
CEQA Daily Threshold Limits 548 137 82 82 137 137
Los Angeles County/Riverside County
(South Coast AQMD) 72.39 367.06 9.49 9.79 0.26 16.59
CEQA Daily Threshold Limits 550 100 55 150 150 75
East Kern County APCD 20.46 103.76 2.68 2.77 0.07 4.69
CEQA Daily Threshold Limits - 137 - - - 137
Notes:
– = no CEQA daily threshold for this pollutant in the AQMD
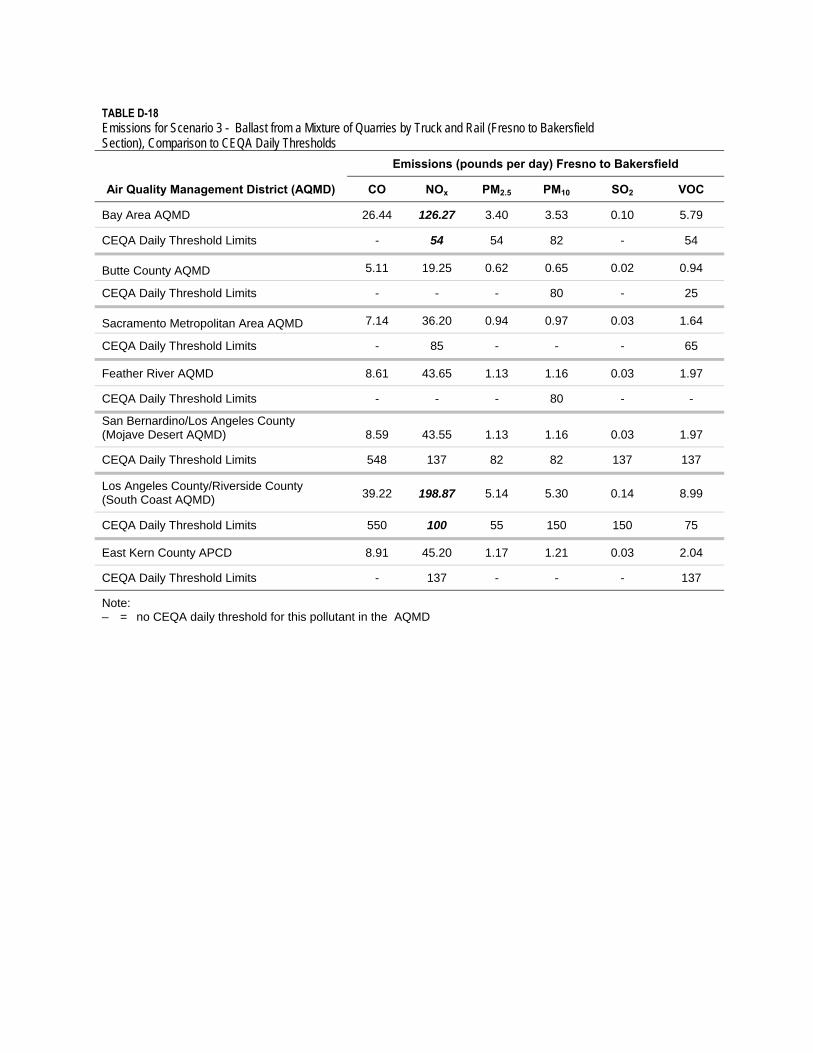
TABLE D-18 Emissions for Scenario 3 - Ballast from a Mixture of Quarries by Truck and Rail (Fresno to Bakersfield Section), Comparison to CEQA Daily Thresholds
Air Quality Management District (AQMD)
Emissions (pounds per day) Fresno to Bakersfield
CO NOx PM2.5 PM10 SO2 VOC
Bay Area AQMD 26.44 126.27 3.40 3.53 0.10 5.79
CEQA Daily Threshold Limits - 54 54 82 - 54
Butte County AQMD 5.11 19.25 0.62 0.65 0.02 0.94
CEQA Daily Threshold Limits - - - 80 - 25
Sacramento Metropolitan Area AQMD 7.14 36.20 0.94 0.97 0.03 1.64
CEQA Daily Threshold Limits - 85 - - - 65
Feather River AQMD 8.61 43.65 1.13 1.16 0.03 1.97
CEQA Daily Threshold Limits - - - 80 - -
San Bernardino/Los Angeles County (Mojave Desert AQMD) 8.59 43.55 1.13 1.16 0.03 1.97
CEQA Daily Threshold Limits 548 137 82 82 137 137
Los Angeles County/Riverside County (South Coast AQMD) 39.22 198.87 5.14 5.30 0.14 8.99
CEQA Daily Threshold Limits 550 100 55 150 150 75
East Kern County APCD 8.91 45.20 1.17 1.21 0.03 2.04
CEQA Daily Threshold Limits - 137 - - - 137
Note: – = no CEQA daily threshold for this pollutant in the AQMD
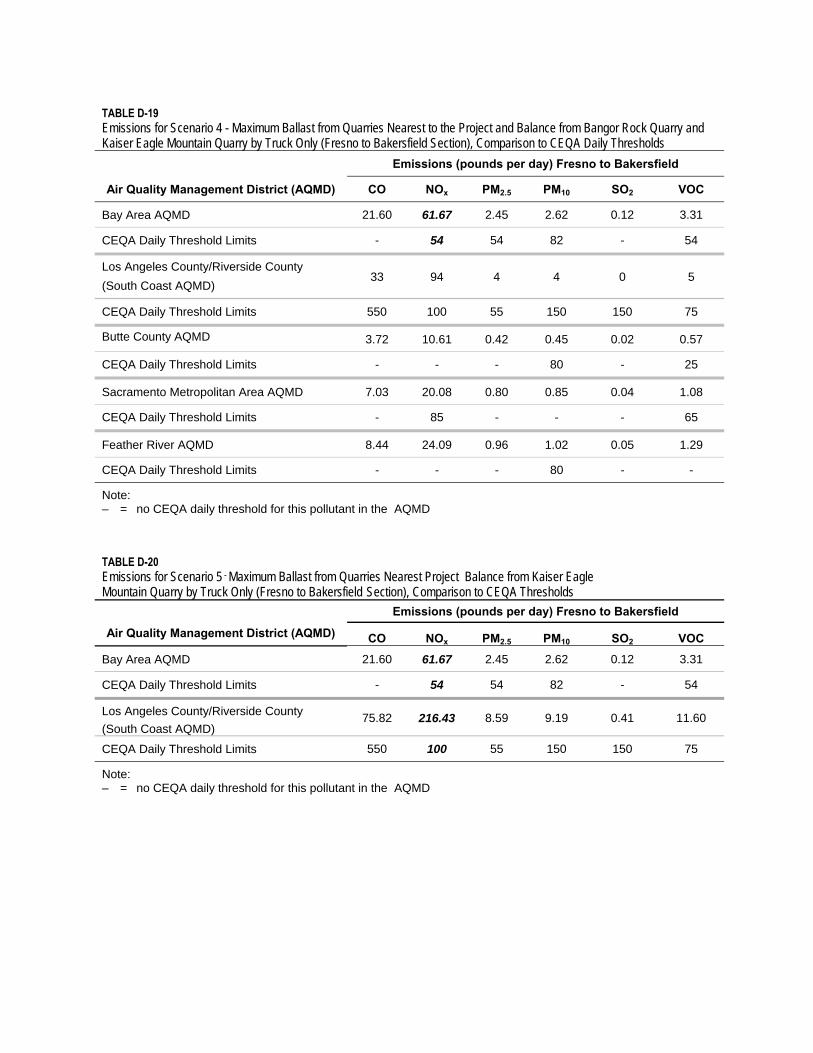
TABLE D-19 Emissions for Scenario 4 - Maximum Ballast from Quarries Nearest to the Project and Balance from Bangor Rock Quarry and Kaiser Eagle Mountain Quarry by Truck Only (Fresno to Bakersfield Section), Comparison to CEQA Daily Thresholds
Air Quality Management District (AQMD)
Emissions (pounds per day) Fresno to Bakersfield
CO NOx PM2.5 PM10 SO2 VOC
Bay Area AQMD 21.60 61.67 2.45 2.62 0.12 3.31
CEQA Daily Threshold Limits - 54 54 82 - 54
Los Angeles County/Riverside County
(South Coast AQMD) 33 94 4 4 0 5
CEQA Daily Threshold Limits 550 100 55 150 150 75
Butte County AQMD 3.72 10.61 0.42 0.45 0.02 0.57
CEQA Daily Threshold Limits - - - 80 - 25
Sacramento Metropolitan Area AQMD 7.03 20.08 0.80 0.85 0.04 1.08
CEQA Daily Threshold Limits - 85 - - - 65
Feather River AQMD 8.44 24.09 0.96 1.02 0.05 1.29
CEQA Daily Threshold Limits - - - 80 - -
Note: – = no CEQA daily threshold for this pollutant in the AQMD
TABLE D-20
Emissions for Scenario 5 - Maximum Ballast from Quarries Nearest Project Balance from Kaiser Eagle Mountain Quarry by Truck Only (Fresno to Bakersfield Section), Comparison to CEQA Thresholds
Air Quality Management District (AQMD)
Emissions (pounds per day) Fresno to Bakersfield
CO NOx PM2.5 PM10 SO2 VOC
Bay Area AQMD 21.60 61.67 2.45 2.62 0.12 3.31
CEQA Daily Threshold Limits - 54 54 82 - 54
Los Angeles County/Riverside County
(South Coast AQMD) 75.82 216.43 8.59 9.19 0.41 11.60
CEQA Daily Threshold Limits 550 100 55 150 150 75
Note: – = no CEQA daily threshold for this pollutant in the AQMD
Attachment E Mitigated Emission Calculations for Scenarios
Compared to GCR de minimis Thresholds
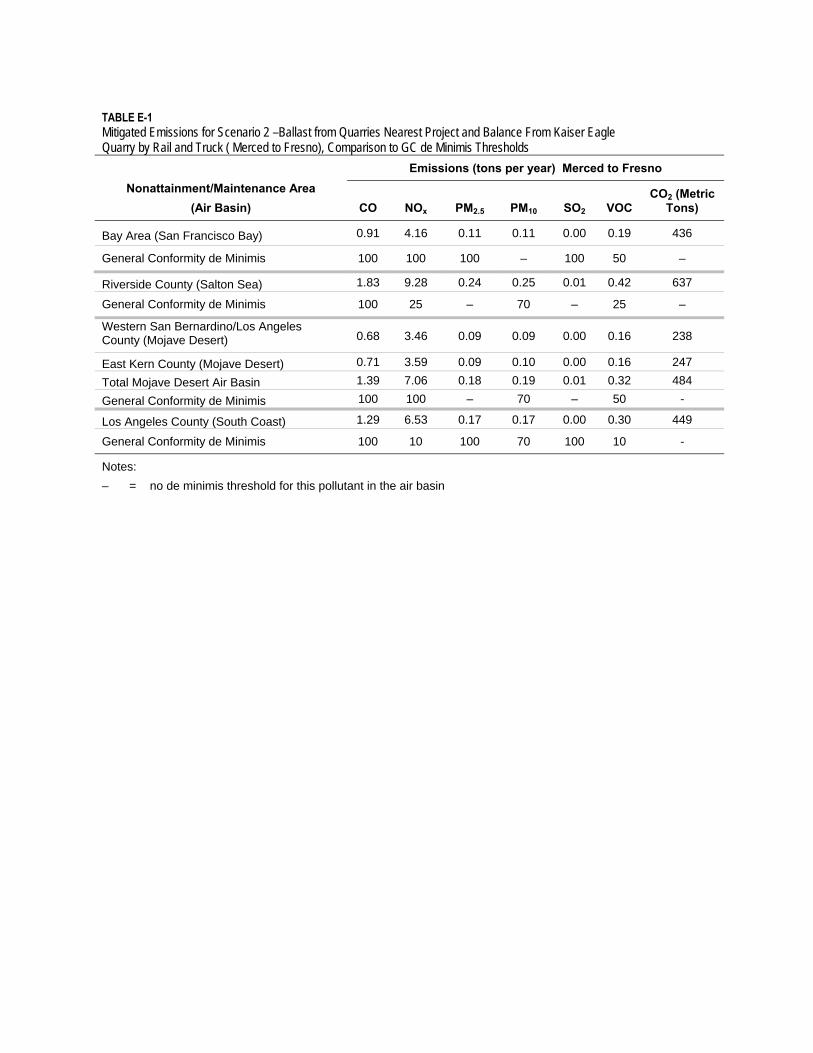
Riverside County (Salton Sea) 1.83 9.28 0.24 0.25 0.01 0.42 637
General Conformity de Minimis 100 25 – 70 – 25 –
Western San Bernardino/Los Angeles County (Mojave Desert) 0.68 3.46 0.09 0.09 0.00 0.16 238
East Kern County (Mojave Desert) 0.71 3.59 0.09 0.10 0.00 0.16 247
Total Mojave Desert Air Basin 1.39 7.06 0.18 0.19 0.01 0.32 484
General Conformity de Minimis 100 100 – 70 – 50 -
Los Angeles County (South Coast) 1.29 6.53 0.17 0.17 0.00 0.30 449
General Conformity de Minimis 100 10 100 70 100 10 -
Notes:
– = no de minimis threshold for this pollutant in the air basin
TABLE E-1 Mitigated Emissions for Scenario 2 –Ballast from Quarries Nearest Project and Balance From Kaiser Eagle Quarry by Rail and Truck ( Merced to Fresno), Comparison to GC de Minimis Thresholds
Nonattainment/Maintenance Area (Air Basin)
Emissions (tons per year) Merced to Fresno
CO NOx PM2.5 PM10 SO2 VOC CO2 (Metric
Tons)
Bay Area (San Francisco Bay) 0.91 4.16 0.11 0.11 0.00 0.19 436
General Conformity de Minimis 100 100 100 – 100 50 –
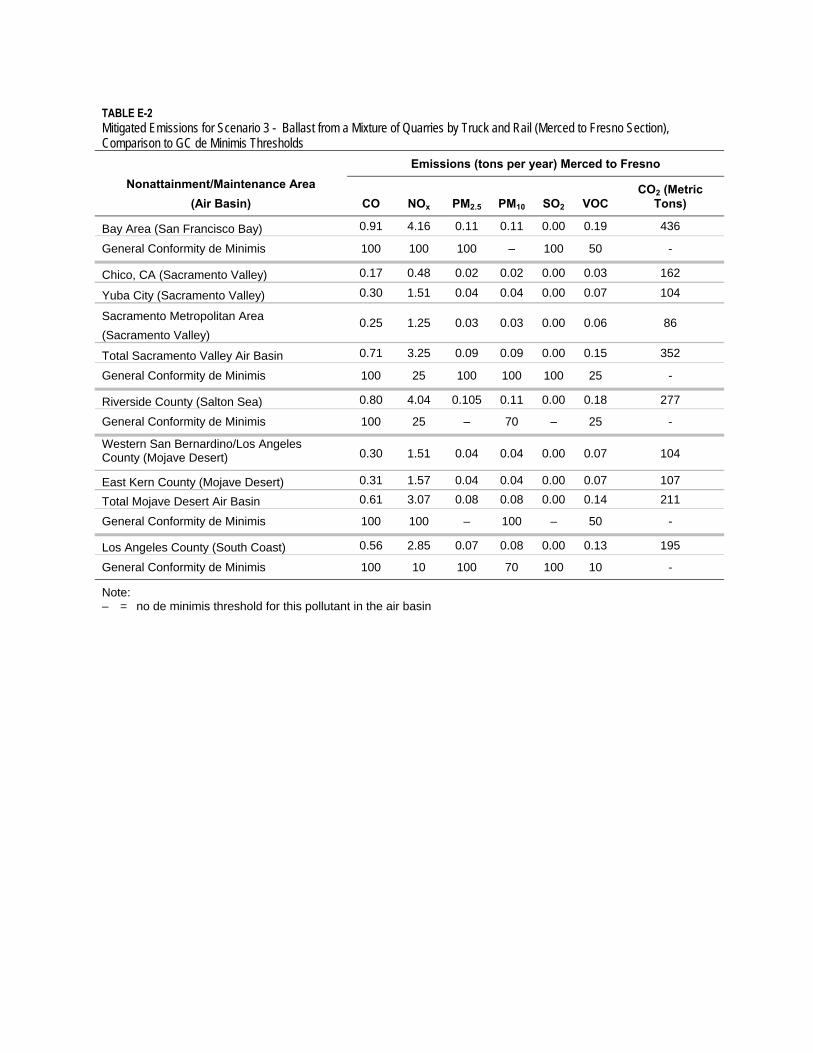
TABLE E-2 Mitigated Emissions for Scenario 3 - Ballast from a Mixture of Quarries by Truck and Rail (Merced to Fresno Section), Comparison to GC de Minimis Thresholds
Nonattainment/Maintenance Area (Air Basin)
Emissions (tons per year) Merced to Fresno
CO NOx PM2.5 PM10 SO2 VOC CO2 (Metric
Tons)
Bay Area (San Francisco Bay) 0.91 4.16 0.11 0.11 0.00 0.19 436
General Conformity de Minimis 100 100 100 – 100 50 -
Chico, CA (Sacramento Valley) 0.17 0.48 0.02 0.02 0.00 0.03 162
Yuba City (Sacramento Valley) 0.30 1.51 0.04 0.04 0.00 0.07 104
Sacramento Metropolitan Area
(Sacramento Valley) 0.25 1.25 0.03 0.03 0.00 0.06 86
Total Sacramento Valley Air Basin 0.71 3.25 0.09 0.09 0.00 0.15 352
General Conformity de Minimis 100 25 100 100 100 25 -
Riverside County (Salton Sea) 0.80 4.04 0.105 0.11 0.00 0.18 277
General Conformity de Minimis 100 25 – 70 – 25 -
Western San Bernardino/Los Angeles County (Mojave Desert) 0.30 1.51 0.04 0.04 0.00 0.07 104
East Kern County (Mojave Desert) 0.31 1.57 0.04 0.04 0.00 0.07 107
Total Mojave Desert Air Basin 0.61 3.07 0.08 0.08 0.00 0.14 211
General Conformity de Minimis 100 100 – 100 – 50 -
Los Angeles County (South Coast) 0.56 2.85 0.07 0.08 0.00 0.13 195
General Conformity de Minimis 100 10 100 70 100 10 -
Note: – = no de minimis threshold for this pollutant in the air basin
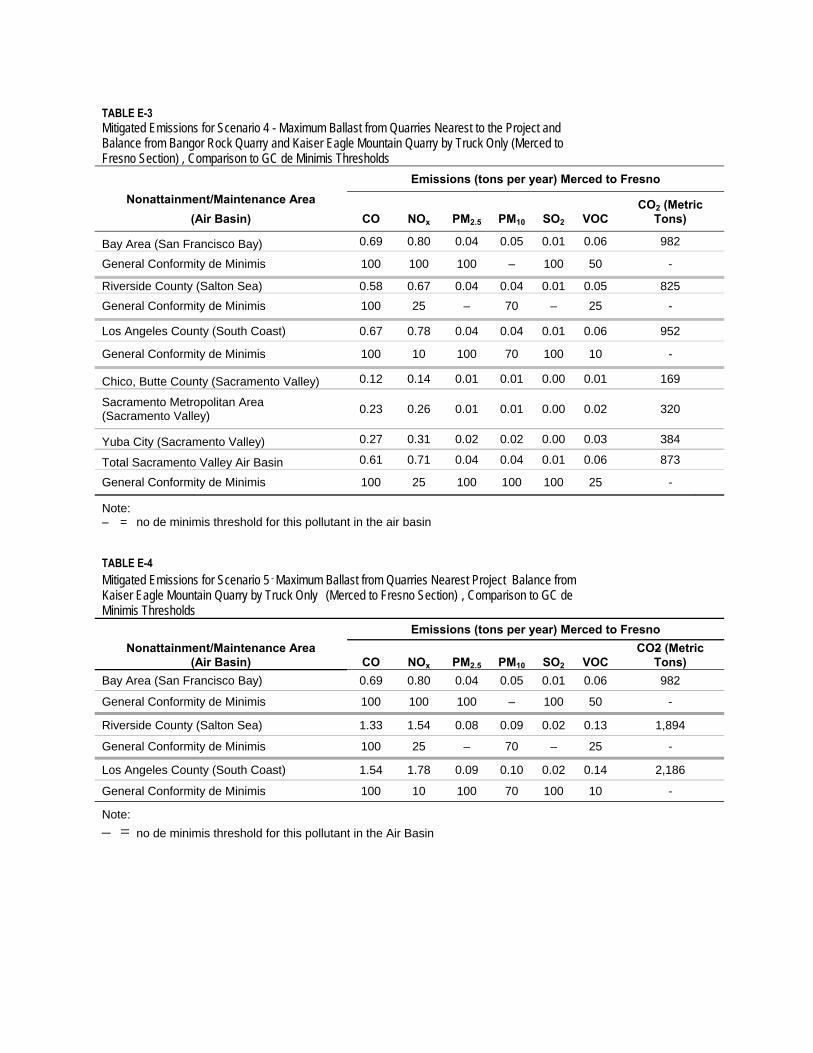
TABLE E-3 Mitigated Emissions for Scenario 4 - Maximum Ballast from Quarries Nearest to the Project and Balance from Bangor Rock Quarry and Kaiser Eagle Mountain Quarry by Truck Only (Merced to Fresno Section) , Comparison to GC de Minimis Thresholds
Nonattainment/Maintenance Area (Air Basin)
Emissions (tons per year) Merced to Fresno
CO NOx PM2.5 PM10 SO2 VOC CO2 (Metric
Tons)
Bay Area (San Francisco Bay) 0.69 0.80 0.04 0.05 0.01 0.06 982
General Conformity de Minimis 100 100 100 – 100 50 -
Riverside County (Salton Sea) 0.58 0.67 0.04 0.04 0.01 0.05 825
General Conformity de Minimis 100 25 – 70 – 25 -
Los Angeles County (South Coast) 0.67 0.78 0.04 0.04 0.01 0.06 952
General Conformity de Minimis 100 10 100 70 100 10 -
Chico, Butte County (Sacramento Valley) 0.12 0.14 0.01 0.01 0.00 0.01 169
Sacramento Metropolitan Area (Sacramento Valley)
0.23 0.26 0.01 0.01 0.00 0.02 320
Yuba City (Sacramento Valley) 0.27 0.31 0.02 0.02 0.00 0.03 384
Total Sacramento Valley Air Basin 0.61 0.71 0.04 0.04 0.01 0.06 873
General Conformity de Minimis 100 25 100 100 100 25 -
Note: – = no de minimis threshold for this pollutant in the air basin
TABLE E-4 Mitigated Emissions for Scenario 5 - Maximum Ballast from Quarries Nearest Project Balance from Kaiser Eagle Mountain Quarry by Truck Only (Merced to Fresno Section) , Comparison to GC de Minimis Thresholds
Nonattainment/Maintenance Area (Air Basin)
Emissions (tons per year) Merced to Fresno
CO NOx PM2.5 PM10 SO2 VOC CO2 (Metric
Tons) Bay Area (San Francisco Bay) 0.69 0.80 0.04 0.05 0.01 0.06 982
General Conformity de Minimis 100 100 100 – 100 50 -
Riverside County (Salton Sea) 1.33 1.54 0.08 0.09 0.02 0.13 1,894
General Conformity de Minimis 100 25 – 70 – 25 -
Los Angeles County (South Coast) 1.54 1.78 0.09 0.10 0.02 0.14 2,186
General Conformity de Minimis 100 10 100 70 100 10 -
Note:
– = no de minimis threshold for this pollutant in the Air Basin
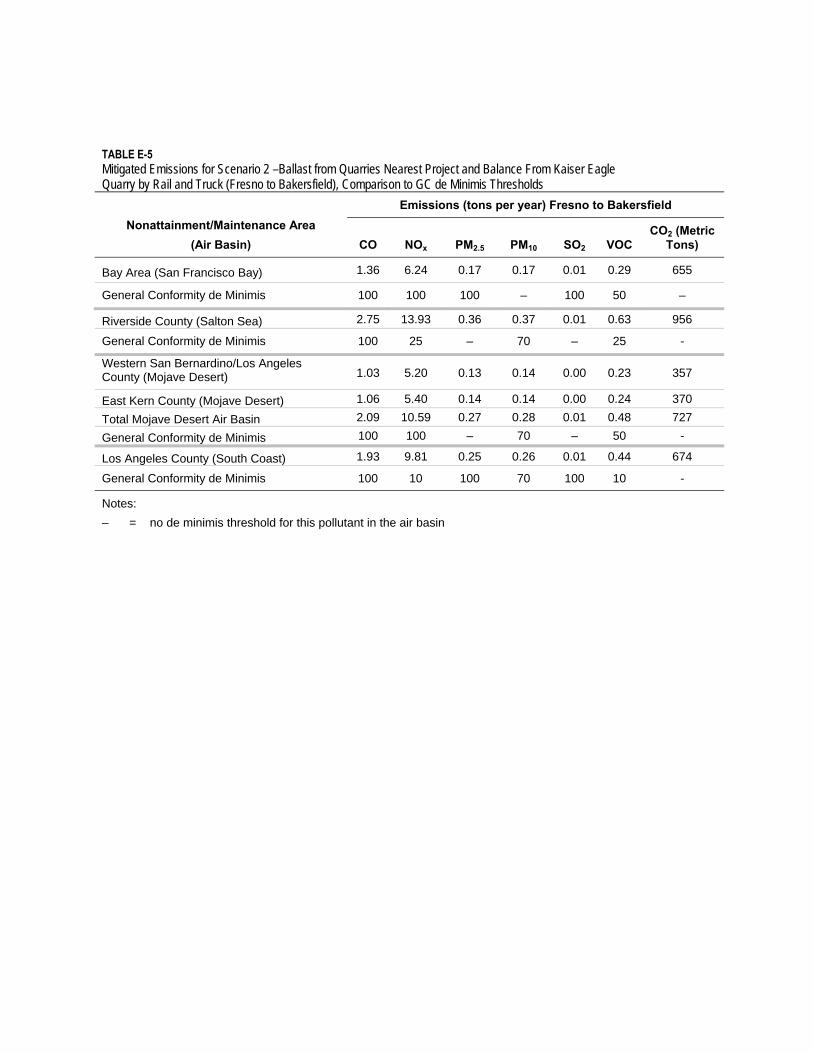
Riverside County (Salton Sea) 2.75 13.93 0.36 0.37 0.01 0.63 956
General Conformity de Minimis 100 25 – 70 – 25 -
Western San Bernardino/Los Angeles County (Mojave Desert) 1.03 5.20 0.13 0.14 0.00 0.23 357
East Kern County (Mojave Desert) 1.06 5.40 0.14 0.14 0.00 0.24 370
Total Mojave Desert Air Basin 2.09 10.59 0.27 0.28 0.01 0.48 727
General Conformity de Minimis 100 100 – 70 – 50 -
Los Angeles County (South Coast) 1.93 9.81 0.25 0.26 0.01 0.44 674
General Conformity de Minimis 100 10 100 70 100 10 -
Notes:
– = no de minimis threshold for this pollutant in the air basin
TABLE E-5 Mitigated Emissions for Scenario 2 –Ballast from Quarries Nearest Project and Balance From Kaiser Eagle Quarry by Rail and Truck (Fresno to Bakersfield), Comparison to GC de Minimis Thresholds
Nonattainment/Maintenance Area (Air Basin)
Emissions (tons per year) Fresno to Bakersfield
CO NOx PM2.5 PM10 SO2 VOC CO2 (Metric
Tons)
Bay Area (San Francisco Bay) 1.36 6.24 0.17 0.17 0.01 0.29 655
General Conformity de Minimis 100 100 100 – 100 50 –
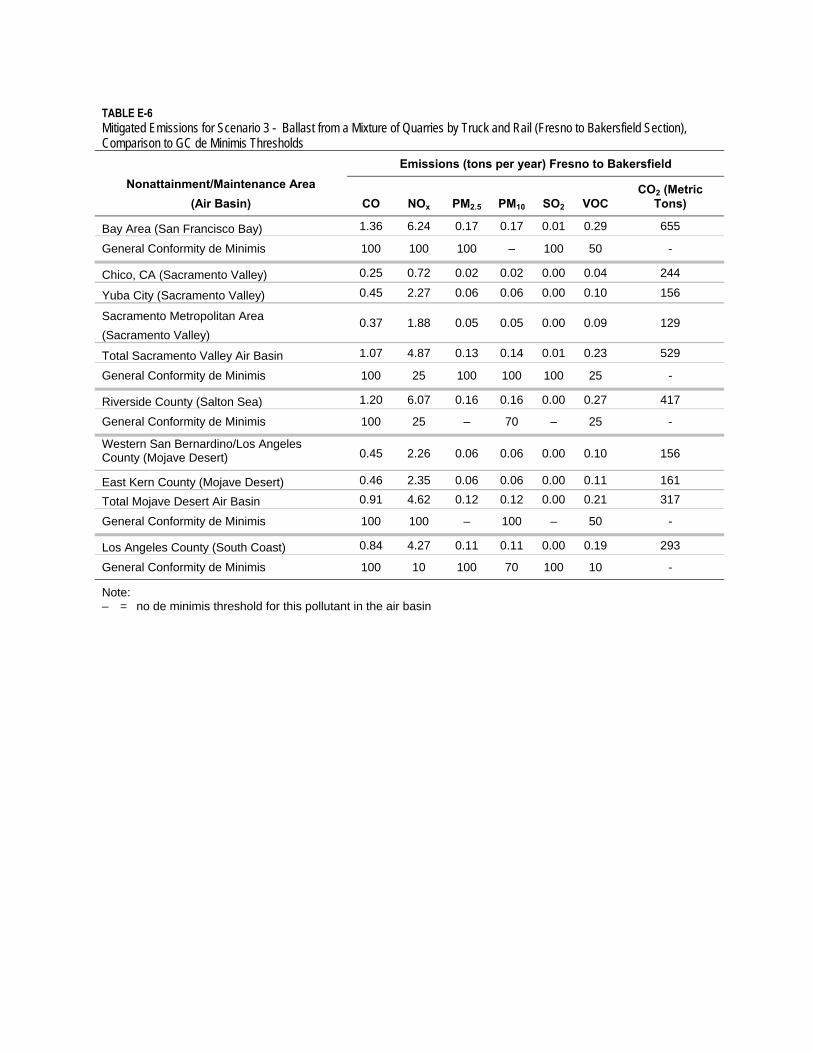
TABLE E-6 Mitigated Emissions for Scenario 3 - Ballast from a Mixture of Quarries by Truck and Rail (Fresno to Bakersfield Section), Comparison to GC de Minimis Thresholds
Nonattainment/Maintenance Area (Air Basin)
Emissions (tons per year) Fresno to Bakersfield
CO NOx PM2.5 PM10 SO2 VOC CO2 (Metric
Tons)
Bay Area (San Francisco Bay) 1.36 6.24 0.17 0.17 0.01 0.29 655
General Conformity de Minimis 100 100 100 – 100 50 -
Chico, CA (Sacramento Valley) 0.25 0.72 0.02 0.02 0.00 0.04 244
Yuba City (Sacramento Valley) 0.45 2.27 0.06 0.06 0.00 0.10 156
Sacramento Metropolitan Area
(Sacramento Valley) 0.37 1.88 0.05 0.05 0.00 0.09 129
Total Sacramento Valley Air Basin 1.07 4.87 0.13 0.14 0.01 0.23 529
General Conformity de Minimis 100 25 100 100 100 25 -
Riverside County (Salton Sea) 1.20 6.07 0.16 0.16 0.00 0.27 417
General Conformity de Minimis 100 25 – 70 – 25 -
Western San Bernardino/Los Angeles County (Mojave Desert) 0.45 2.26 0.06 0.06 0.00 0.10 156
East Kern County (Mojave Desert) 0.46 2.35 0.06 0.06 0.00 0.11 161
Total Mojave Desert Air Basin 0.91 4.62 0.12 0.12 0.00 0.21 317
General Conformity de Minimis 100 100 – 100 – 50 -
Los Angeles County (South Coast) 0.84 4.27 0.11 0.11 0.00 0.19 293
General Conformity de Minimis 100 10 100 70 100 10 -
Note: – = no de minimis threshold for this pollutant in the air basin
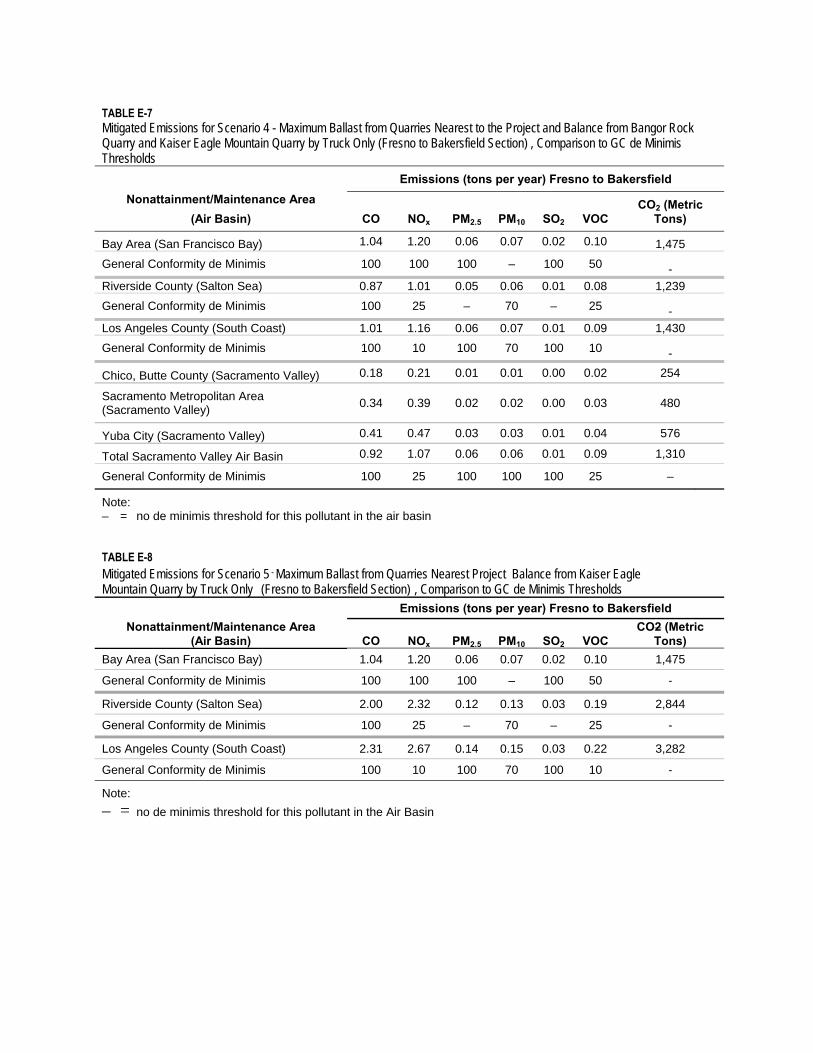
TABLE E-7 Mitigated Emissions for Scenario 4 - Maximum Ballast from Quarries Nearest to the Project and Balance from Bangor Rock Quarry and Kaiser Eagle Mountain Quarry by Truck Only (Fresno to Bakersfield Section) , Comparison to GC de Minimis Thresholds
Nonattainment/Maintenance Area (Air Basin)
Emissions (tons per year) Fresno to Bakersfield
CO NOx PM2.5 PM10 SO2 VOC CO2 (Metric
Tons)
Bay Area (San Francisco Bay) 1.04 1.20 0.06 0.07 0.02 0.10 1,475
General Conformity de Minimis 100 100 100 – 100 50 -
Riverside County (Salton Sea) 0.87 1.01 0.05 0.06 0.01 0.08 1,239
General Conformity de Minimis 100 25 – 70 – 25 -
Los Angeles County (South Coast) 1.01 1.16 0.06 0.07 0.01 0.09 1,430
General Conformity de Minimis 100 10 100 70 100 10 -
Chico, Butte County (Sacramento Valley) 0.18 0.21 0.01 0.01 0.00 0.02 254
Sacramento Metropolitan Area (Sacramento Valley)
0.34 0.39 0.02 0.02 0.00 0.03 480
Yuba City (Sacramento Valley) 0.41 0.47 0.03 0.03 0.01 0.04 576
Total Sacramento Valley Air Basin 0.92 1.07 0.06 0.06 0.01 0.09 1,310
General Conformity de Minimis 100 25 100 100 100 25 –
Note: – = no de minimis threshold for this pollutant in the air basin
TABLE E-8 Mitigated Emissions for Scenario 5 - Maximum Ballast from Quarries Nearest Project Balance from Kaiser Eagle Mountain Quarry by Truck Only (Fresno to Bakersfield Section) , Comparison to GC de Minimis Thresholds
Nonattainment/Maintenance Area (Air Basin)
Emissions (tons per year) Fresno to Bakersfield
CO NOx PM2.5 PM10 SO2 VOC CO2 (Metric
Tons) Bay Area (San Francisco Bay) 1.04 1.20 0.06 0.07 0.02 0.10 1,475
General Conformity de Minimis 100 100 100 – 100 50 -
Riverside County (Salton Sea) 2.00 2.32 0.12 0.13 0.03 0.19 2,844
General Conformity de Minimis 100 25 – 70 – 25 -
Los Angeles County (South Coast) 2.31 2.67 0.14 0.15 0.03 0.22 3,282
General Conformity de Minimis 100 10 100 70 100 10 -
Note:
– = no de minimis threshold for this pollutant in the Air Basin
Attachment F Mitigated Emission Calculations for Scenarios
Compared to CEQA Thresholds
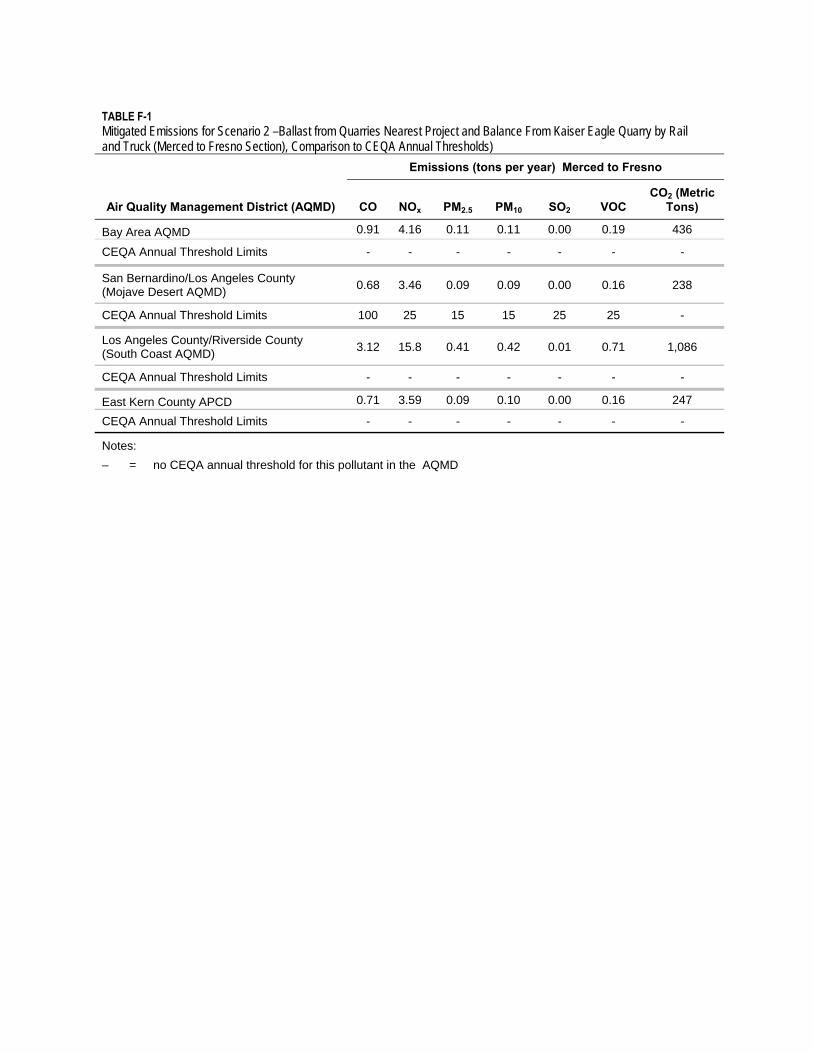
TABLE F-1 Mitigated Emissions for Scenario 2 –Ballast from Quarries Nearest Project and Balance From Kaiser Eagle Quarry by Rail and Truck (Merced to Fresno Section), Comparison to CEQA Annual Thresholds)
Air Quality Management District (AQMD)
Emissions (tons per year) Merced to Fresno
CO NOx PM2.5 PM10 SO2 VOC CO2 (Metric
Tons)
Bay Area AQMD 0.91 4.16 0.11 0.11 0.00 0.19 436
CEQA Annual Threshold Limits - - - - - - -
San Bernardino/Los Angeles County (Mojave Desert AQMD)
0.68 3.46 0.09 0.09 0.00 0.16 238
CEQA Annual Threshold Limits 100 25 15 15 25 25 -
Los Angeles County/Riverside County (South Coast AQMD)
3.12 15.8 0.41 0.42 0.01 0.71 1,086
CEQA Annual Threshold Limits - - - - - - -
East Kern County APCD 0.71 3.59 0.09 0.10 0.00 0.16 247
CEQA Annual Threshold Limits - - - - - - -
Notes:
– = no CEQA annual threshold for this pollutant in the AQMD
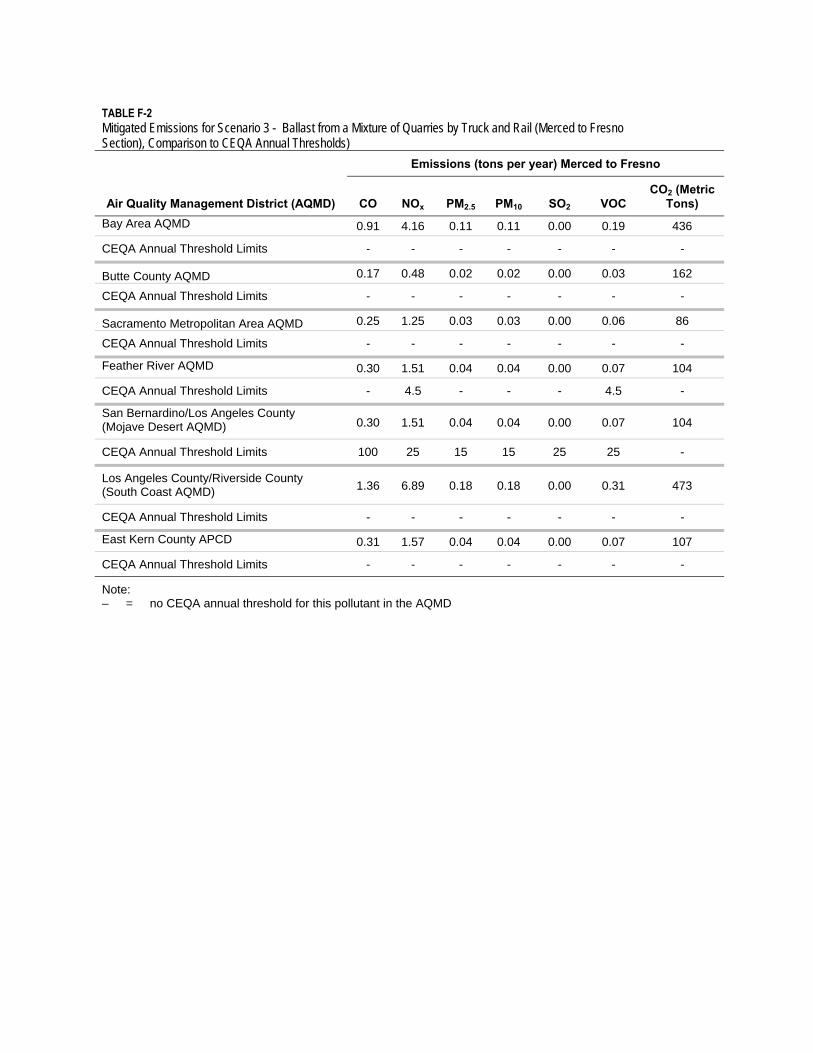
TABLE F-2 Mitigated Emissions for Scenario 3 - Ballast from a Mixture of Quarries by Truck and Rail (Merced to Fresno Section), Comparison to CEQA Annual Thresholds)
Air Quality Management District (AQMD)
Emissions (tons per year) Merced to Fresno
CO NOx PM2.5 PM10 SO2 VOC CO2 (Metric
Tons) Bay Area AQMD 0.91 4.16 0.11 0.11 0.00 0.19 436
CEQA Annual Threshold Limits - - - - - - -
Butte County AQMD 0.17 0.48 0.02 0.02 0.00 0.03 162
CEQA Annual Threshold Limits - - - - - - -
Sacramento Metropolitan Area AQMD 0.25 1.25 0.03 0.03 0.00 0.06 86
CEQA Annual Threshold Limits - - - - - - -
Feather River AQMD 0.30 1.51 0.04 0.04 0.00 0.07 104
CEQA Annual Threshold Limits - 4.5 - - - 4.5 -
San Bernardino/Los Angeles County (Mojave Desert AQMD) 0.30 1.51 0.04 0.04 0.00 0.07 104
CEQA Annual Threshold Limits 100 25 15 15 25 25 -
Los Angeles County/Riverside County (South Coast AQMD) 1.36 6.89 0.18 0.18 0.00 0.31 473
CEQA Annual Threshold Limits - - - - - - -
East Kern County APCD 0.31 1.57 0.04 0.04 0.00 0.07 107
CEQA Annual Threshold Limits - - - - - - -
Note: – = no CEQA annual threshold for this pollutant in the AQMD
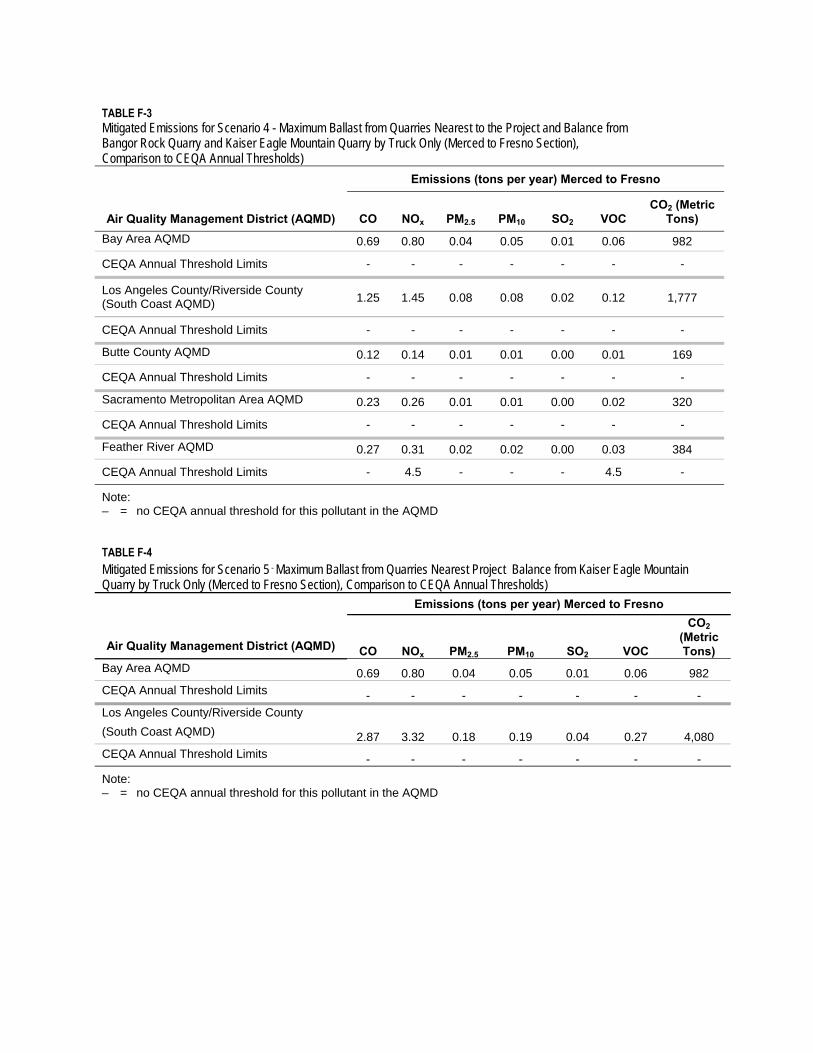
TABLE F-3 Mitigated Emissions for Scenario 4 - Maximum Ballast from Quarries Nearest to the Project and Balance from Bangor Rock Quarry and Kaiser Eagle Mountain Quarry by Truck Only (Merced to Fresno Section), Comparison to CEQA Annual Thresholds)
Air Quality Management District (AQMD)
Emissions (tons per year) Merced to Fresno
CO NOx PM2.5 PM10 SO2 VOC CO2 (Metric
Tons) Bay Area AQMD 0.69 0.80 0.04 0.05 0.01 0.06 982
CEQA Annual Threshold Limits - - - - - - -
Los Angeles County/Riverside County (South Coast AQMD) 1.25 1.45 0.08 0.08 0.02 0.12 1,777
CEQA Annual Threshold Limits - - - - - - -
Butte County AQMD 0.12 0.14 0.01 0.01 0.00 0.01 169
CEQA Annual Threshold Limits - - - - - - -
Sacramento Metropolitan Area AQMD 0.23 0.26 0.01 0.01 0.00 0.02 320
CEQA Annual Threshold Limits - - - - - - -
Feather River AQMD 0.27 0.31 0.02 0.02 0.00 0.03 384
CEQA Annual Threshold Limits - 4.5 - - - 4.5 -
Note: – = no CEQA annual threshold for this pollutant in the AQMD
TABLE F-4 Mitigated Emissions for Scenario 5 - Maximum Ballast from Quarries Nearest Project Balance from Kaiser Eagle Mountain Quarry by Truck Only (Merced to Fresno Section), Comparison to CEQA Annual Thresholds)
Air Quality Management District (AQMD)
Emissions (tons per year) Merced to Fresno
CO NOx PM2.5 PM10 SO2 VOC
CO2 (Metric Tons)
Bay Area AQMD 0.69 0.80 0.04 0.05 0.01 0.06 982
CEQA Annual Threshold Limits - - - - - - -
Los Angeles County/Riverside County
(South Coast AQMD) 2.87 3.32 0.18 0.19 0.04 0.27 4,080
CEQA Annual Threshold Limits - - - - - - -
Note: – = no CEQA annual threshold for this pollutant in the AQMD
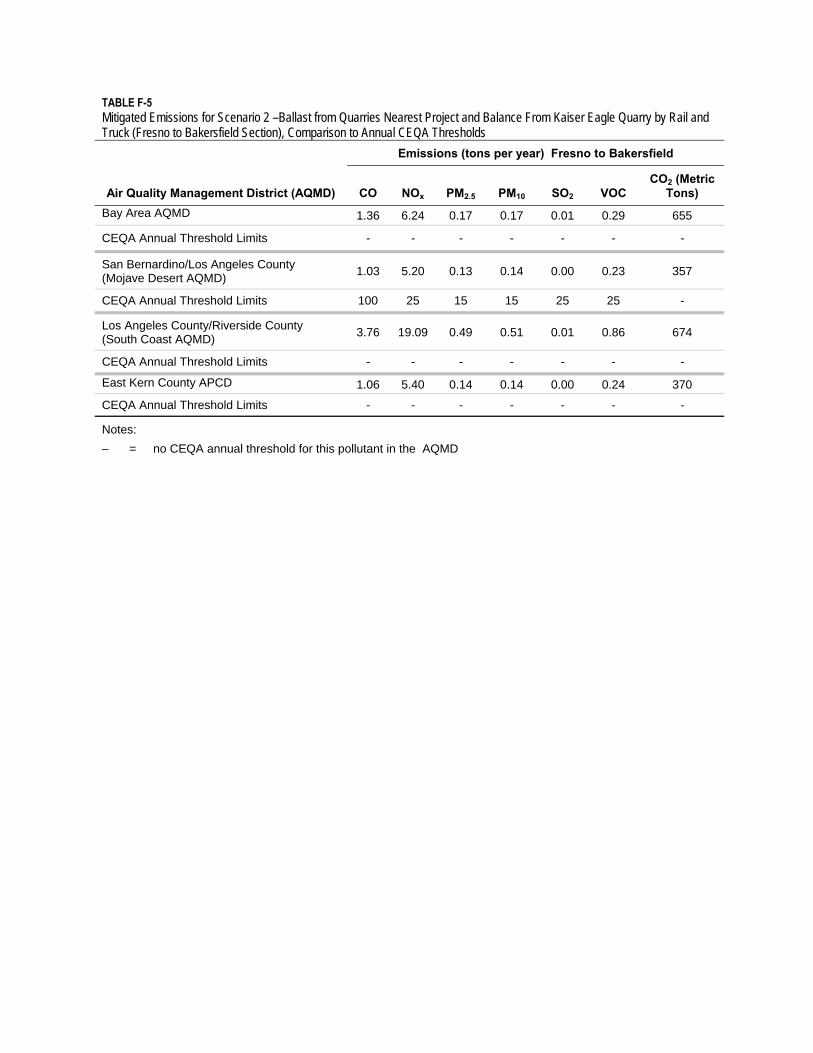
TABLE F-5 Mitigated Emissions for Scenario 2 –Ballast from Quarries Nearest Project and Balance From Kaiser Eagle Quarry by Rail and Truck (Fresno to Bakersfield Section), Comparison to Annual CEQA Thresholds
Air Quality Management District (AQMD)
Emissions (tons per year) Fresno to Bakersfield
CO NOx PM2.5 PM10 SO2 VOC CO2 (Metric
Tons) Bay Area AQMD 1.36 6.24 0.17 0.17 0.01 0.29 655
CEQA Annual Threshold Limits - - - - - - -
San Bernardino/Los Angeles County (Mojave Desert AQMD)
1.03 5.20 0.13 0.14 0.00 0.23 357
CEQA Annual Threshold Limits 100 25 15 15 25 25 -
Los Angeles County/Riverside County (South Coast AQMD)
3.76 19.09 0.49 0.51 0.01 0.86 674
CEQA Annual Threshold Limits - - - - - - -
East Kern County APCD 1.06 5.40 0.14 0.14 0.00 0.24 370
CEQA Annual Threshold Limits - - - - - - -
Notes:
– = no CEQA annual threshold for this pollutant in the AQMD
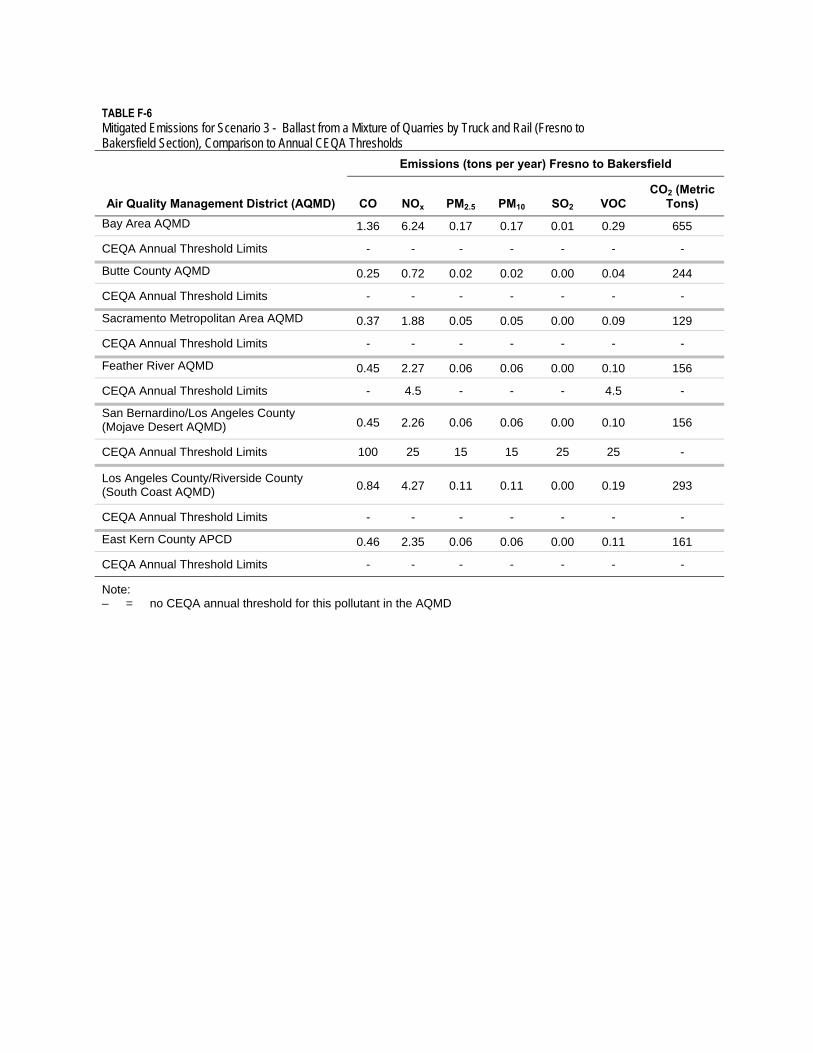
TABLE F-6 Mitigated Emissions for Scenario 3 - Ballast from a Mixture of Quarries by Truck and Rail (Fresno to Bakersfield Section), Comparison to Annual CEQA Thresholds
Air Quality Management District (AQMD)
Emissions (tons per year) Fresno to Bakersfield
CO NOx PM2.5 PM10 SO2 VOC CO2 (Metric
Tons) Bay Area AQMD 1.36 6.24 0.17 0.17 0.01 0.29 655
CEQA Annual Threshold Limits - - - - - - -
Butte County AQMD 0.25 0.72 0.02 0.02 0.00 0.04 244
CEQA Annual Threshold Limits - - - - - - -
Sacramento Metropolitan Area AQMD 0.37 1.88 0.05 0.05 0.00 0.09 129
CEQA Annual Threshold Limits - - - - - - -
Feather River AQMD 0.45 2.27 0.06 0.06 0.00 0.10 156
CEQA Annual Threshold Limits - 4.5 - - - 4.5 -
San Bernardino/Los Angeles County (Mojave Desert AQMD) 0.45 2.26 0.06 0.06 0.00 0.10 156
CEQA Annual Threshold Limits 100 25 15 15 25 25 -
Los Angeles County/Riverside County (South Coast AQMD) 0.84 4.27 0.11 0.11 0.00 0.19 293
CEQA Annual Threshold Limits - - - - - - -
East Kern County APCD 0.46 2.35 0.06 0.06 0.00 0.11 161
CEQA Annual Threshold Limits - - - - - - -
Note: – = no CEQA annual threshold for this pollutant in the AQMD
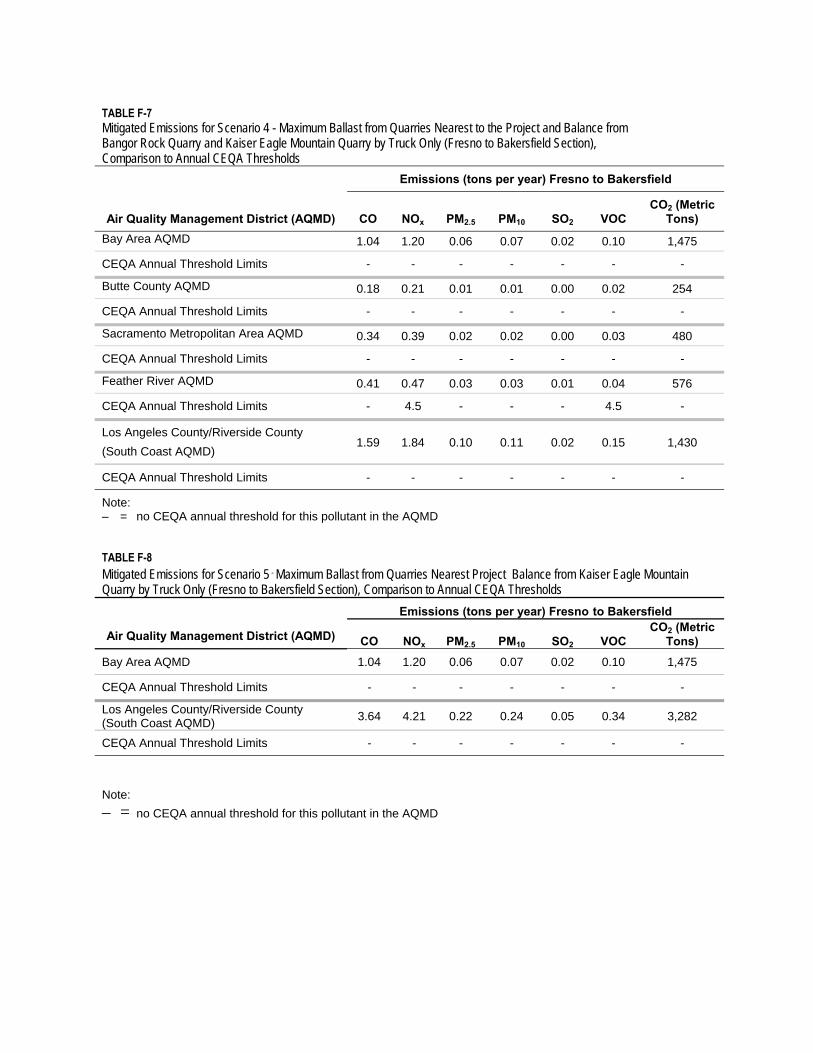
TABLE F-7 Mitigated Emissions for Scenario 4 - Maximum Ballast from Quarries Nearest to the Project and Balance from Bangor Rock Quarry and Kaiser Eagle Mountain Quarry by Truck Only (Fresno to Bakersfield Section), Comparison to Annual CEQA Thresholds
Air Quality Management District (AQMD)
Emissions (tons per year) Fresno to Bakersfield
CO NOx PM2.5 PM10 SO2 VOC CO2 (Metric
Tons) Bay Area AQMD 1.04 1.20 0.06 0.07 0.02 0.10 1,475
CEQA Annual Threshold Limits - - - - - - -
Butte County AQMD 0.18 0.21 0.01 0.01 0.00 0.02 254
CEQA Annual Threshold Limits - - - - - - -
Sacramento Metropolitan Area AQMD 0.34 0.39 0.02 0.02 0.00 0.03 480
CEQA Annual Threshold Limits - - - - - - -
Feather River AQMD 0.41 0.47 0.03 0.03 0.01 0.04 576
CEQA Annual Threshold Limits - 4.5 - - - 4.5 -
Los Angeles County/Riverside County
(South Coast AQMD) 1.59 1.84 0.10 0.11 0.02 0.15 1,430
CEQA Annual Threshold Limits - - - - - - -
Note: – = no CEQA annual threshold for this pollutant in the AQMD
TABLE F-8 Mitigated Emissions for Scenario 5 - Maximum Ballast from Quarries Nearest Project Balance from Kaiser Eagle Mountain Quarry by Truck Only (Fresno to Bakersfield Section), Comparison to Annual CEQA Thresholds
Air Quality Management District (AQMD)
Emissions (tons per year) Fresno to Bakersfield
CO NOx PM2.5 PM10 SO2 VOC CO2 (Metric
Tons) Bay Area AQMD 1.04 1.20 0.06 0.07 0.02 0.10 1,475
CEQA Annual Threshold Limits - - - - - - -
Los Angeles County/Riverside County (South Coast AQMD)
3.64 4.21 0.22 0.24 0.05 0.34 3,282
CEQA Annual Threshold Limits - - - - - - -
Note:
– = no CEQA annual threshold for this pollutant in the AQMD
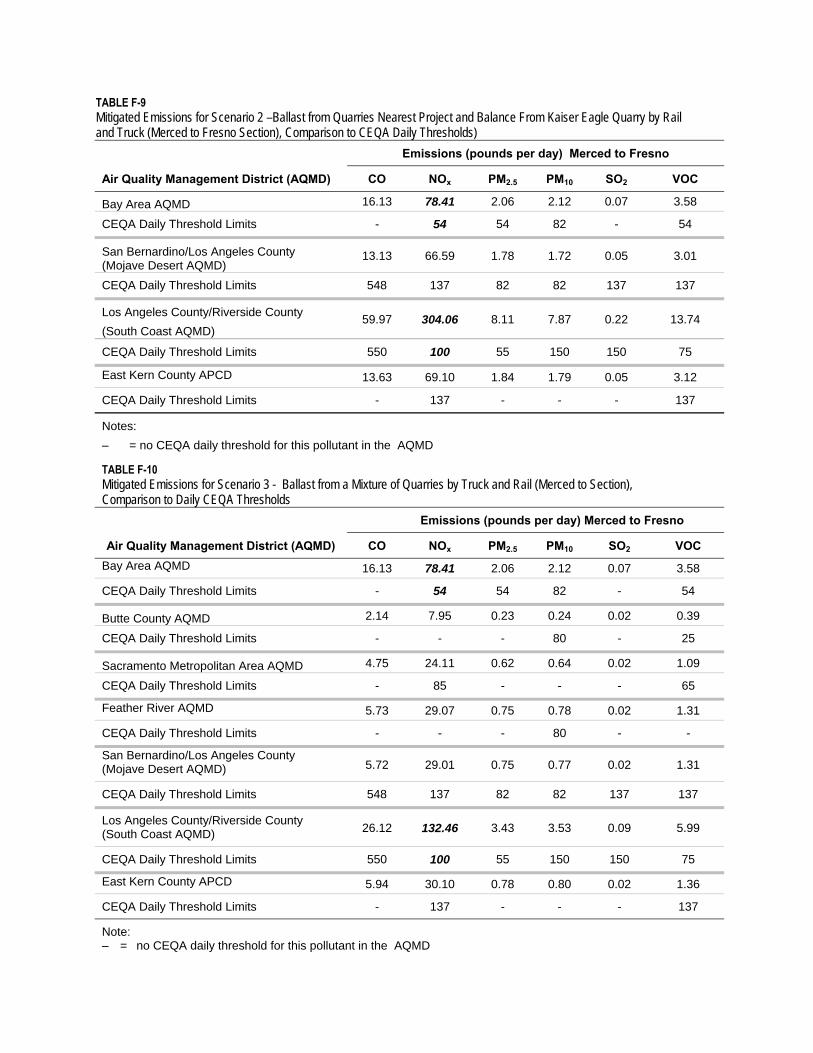
TABLE F-9 Mitigated Emissions for Scenario 2 –Ballast from Quarries Nearest Project and Balance From Kaiser Eagle Quarry by Rail and Truck (Merced to Fresno Section), Comparison to CEQA Daily Thresholds)
TABLE F-10 Mitigated Emissions for Scenario 3 - Ballast from a Mixture of Quarries by Truck and Rail (Merced to Section), Comparison to Daily CEQA Thresholds
Air Quality Management District (AQMD)
Emissions (pounds per day) Merced to Fresno
CO NOx PM2.5 PM10 SO2 VOC Bay Area AQMD 16.13 78.41 2.06 2.12 0.07 3.58
CEQA Daily Threshold Limits - 54 54 82 - 54
Butte County AQMD 2.14 7.95 0.23 0.24 0.02 0.39
CEQA Daily Threshold Limits - - - 80 - 25
Sacramento Metropolitan Area AQMD 4.75 24.11 0.62 0.64 0.02 1.09
CEQA Daily Threshold Limits - 85 - - - 65
Feather River AQMD 5.73 29.07 0.75 0.78 0.02 1.31
CEQA Daily Threshold Limits - - - 80 - -
San Bernardino/Los Angeles County (Mojave Desert AQMD) 5.72 29.01 0.75 0.77 0.02 1.31
CEQA Daily Threshold Limits 548 137 82 82 137 137
Los Angeles County/Riverside County (South Coast AQMD) 26.12 132.46 3.43 3.53 0.09 5.99
CEQA Daily Threshold Limits 550 100 55 150 150 75
East Kern County APCD 5.94 30.10 0.78 0.80 0.02 1.36
CEQA Daily Threshold Limits - 137 - - - 137
Note: – = no CEQA daily threshold for this pollutant in the AQMD
Air Quality Management District (AQMD)
Emissions (pounds per day) Merced to Fresno
CO NOx PM2.5 PM10 SO2 VOC
Bay Area AQMD 16.13 78.41 2.06 2.12 0.07 3.58
CEQA Daily Threshold Limits - 54 54 82 - 54
San Bernardino/Los Angeles County (Mojave Desert AQMD)
13.13 66.59 1.78 1.72 0.05 3.01
CEQA Daily Threshold Limits 548 137 82 82 137 137
Los Angeles County/Riverside County
(South Coast AQMD) 59.97 304.06 8.11 7.87 0.22 13.74
CEQA Daily Threshold Limits 550 100 55 150 150 75
East Kern County APCD 13.63 69.10 1.84 1.79 0.05 3.12
CEQA Daily Threshold Limits - 137 - - - 137
Notes:
– = no CEQA daily threshold for this pollutant in the AQMD
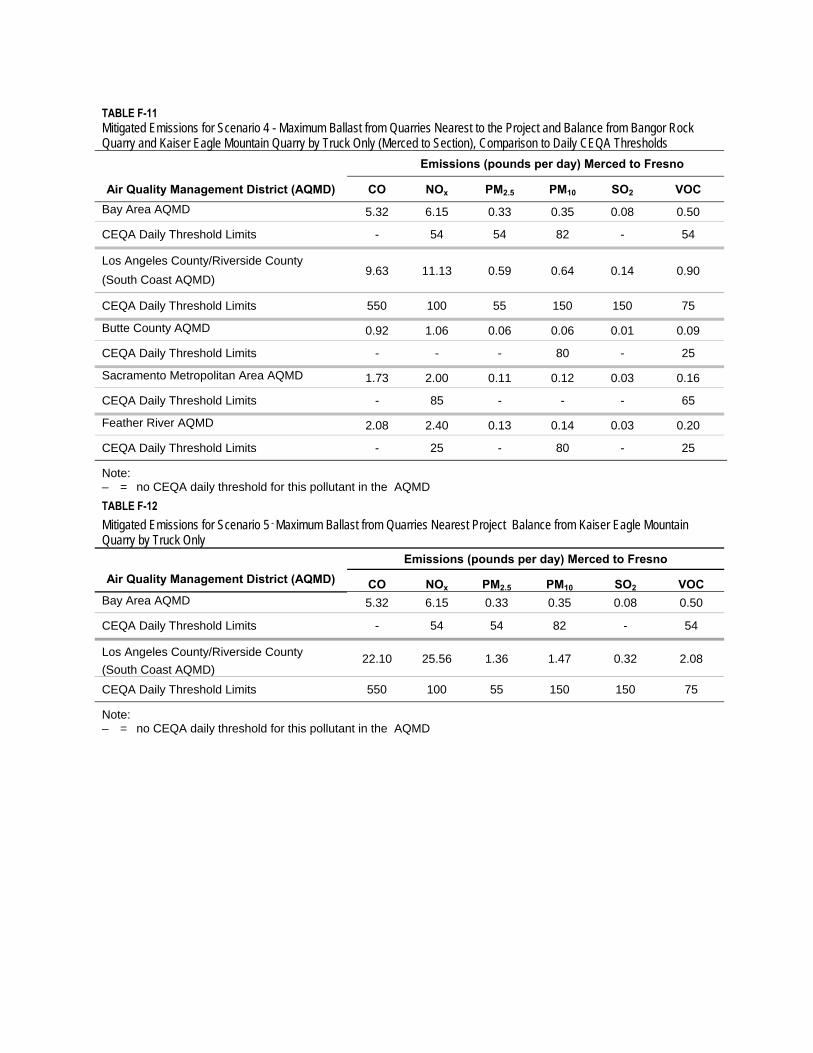
TABLE F-11 Mitigated Emissions for Scenario 4 - Maximum Ballast from Quarries Nearest to the Project and Balance from Bangor Rock Quarry and Kaiser Eagle Mountain Quarry by Truck Only (Merced to Section), Comparison to Daily CEQA Thresholds
Air Quality Management District (AQMD)
Emissions (pounds per day) Merced to Fresno
CO NOx PM2.5 PM10 SO2 VOC Bay Area AQMD 5.32 6.15 0.33 0.35 0.08 0.50
CEQA Daily Threshold Limits - 54 54 82 - 54
Los Angeles County/Riverside County
(South Coast AQMD) 9.63 11.13 0.59 0.64 0.14 0.90
CEQA Daily Threshold Limits 550 100 55 150 150 75
Butte County AQMD 0.92 1.06 0.06 0.06 0.01 0.09
CEQA Daily Threshold Limits - - - 80 - 25
Sacramento Metropolitan Area AQMD 1.73 2.00 0.11 0.12 0.03 0.16
CEQA Daily Threshold Limits - 85 - - - 65
Feather River AQMD 2.08 2.40 0.13 0.14 0.03 0.20
CEQA Daily Threshold Limits - 25 - 80 - 25
Note: – = no CEQA daily threshold for this pollutant in the AQMD
TABLE F-12 Mitigated Emissions for Scenario 5 - Maximum Ballast from Quarries Nearest Project Balance from Kaiser Eagle Mountain Quarry by Truck Only
Air Quality Management District (AQMD) Emissions (pounds per day) Merced to Fresno
CO NOx PM2.5 PM10 SO2 VOC Bay Area AQMD 5.32 6.15 0.33 0.35 0.08 0.50
CEQA Daily Threshold Limits - 54 54 82 - 54
Los Angeles County/Riverside County
(South Coast AQMD) 22.10 25.56 1.36 1.47 0.32 2.08
CEQA Daily Threshold Limits 550 100 55 150 150 75
Note: – = no CEQA daily threshold for this pollutant in the AQMD
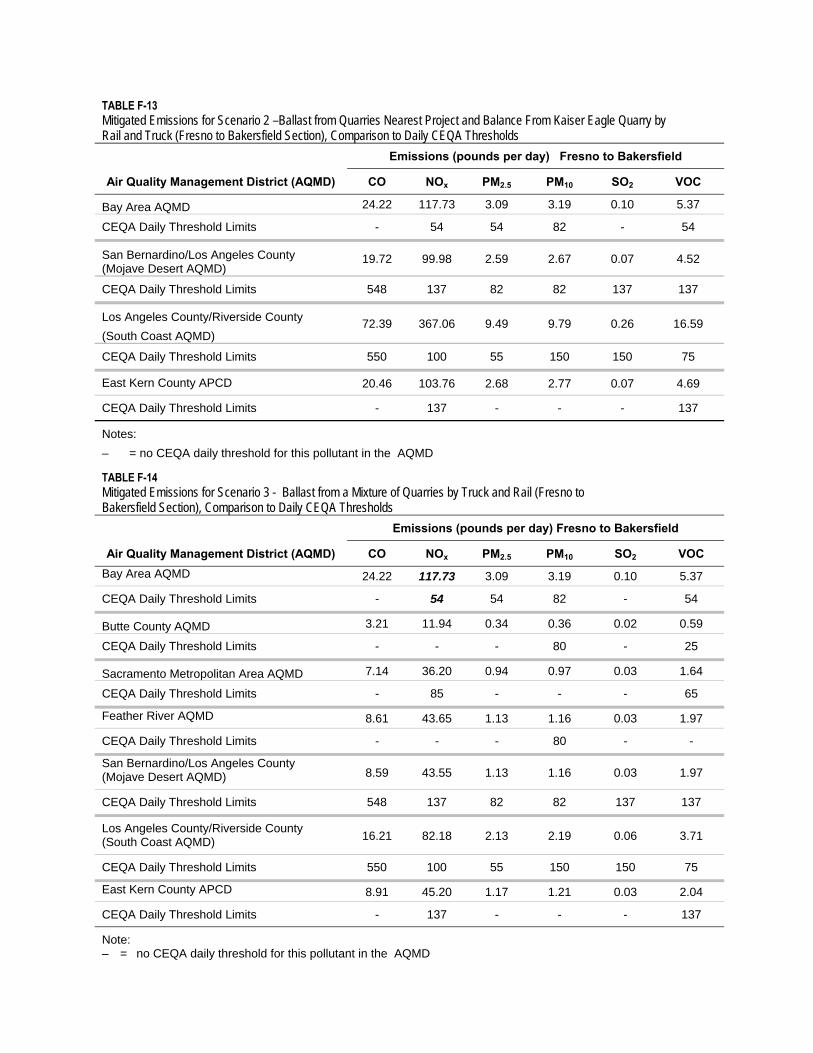
TABLE F-14 Mitigated Emissions for Scenario 3 - Ballast from a Mixture of Quarries by Truck and Rail (Fresno to Bakersfield Section), Comparison to Daily CEQA Thresholds
Air Quality Management District (AQMD)
Emissions (pounds per day) Fresno to Bakersfield
CO NOx PM2.5 PM10 SO2 VOC Bay Area AQMD 24.22 117.73 3.09 3.19 0.10 5.37
CEQA Daily Threshold Limits - 54 54 82 - 54
Butte County AQMD 3.21 11.94 0.34 0.36 0.02 0.59
CEQA Daily Threshold Limits - - - 80 - 25
Sacramento Metropolitan Area AQMD 7.14 36.20 0.94 0.97 0.03 1.64
CEQA Daily Threshold Limits - 85 - - - 65
Feather River AQMD 8.61 43.65 1.13 1.16 0.03 1.97
CEQA Daily Threshold Limits - - - 80 - -
San Bernardino/Los Angeles County (Mojave Desert AQMD) 8.59 43.55 1.13 1.16 0.03 1.97
CEQA Daily Threshold Limits 548 137 82 82 137 137
Los Angeles County/Riverside County (South Coast AQMD) 16.21 82.18 2.13 2.19 0.06 3.71
CEQA Daily Threshold Limits 550 100 55 150 150 75
East Kern County APCD 8.91 45.20 1.17 1.21 0.03 2.04
CEQA Daily Threshold Limits - 137 - - - 137
Note: – = no CEQA daily threshold for this pollutant in the AQMD
TABLE F-13 Mitigated Emissions for Scenario 2 –Ballast from Quarries Nearest Project and Balance From Kaiser Eagle Quarry by Rail and Truck (Fresno to Bakersfield Section), Comparison to Daily CEQA Thresholds
Air Quality Management District (AQMD)
Emissions (pounds per day) Fresno to Bakersfield
CO NOx PM2.5 PM10 SO2 VOC
Bay Area AQMD 24.22 117.73 3.09 3.19 0.10 5.37
CEQA Daily Threshold Limits - 54 54 82 - 54
San Bernardino/Los Angeles County (Mojave Desert AQMD)
19.72 99.98 2.59 2.67 0.07 4.52
CEQA Daily Threshold Limits 548 137 82 82 137 137
Los Angeles County/Riverside County
(South Coast AQMD) 72.39 367.06 9.49 9.79 0.26 16.59
CEQA Daily Threshold Limits 550 100 55 150 150 75
East Kern County APCD 20.46 103.76 2.68 2.77 0.07 4.69
CEQA Daily Threshold Limits - 137 - - - 137
Notes:
– = no CEQA daily threshold for this pollutant in the AQMD
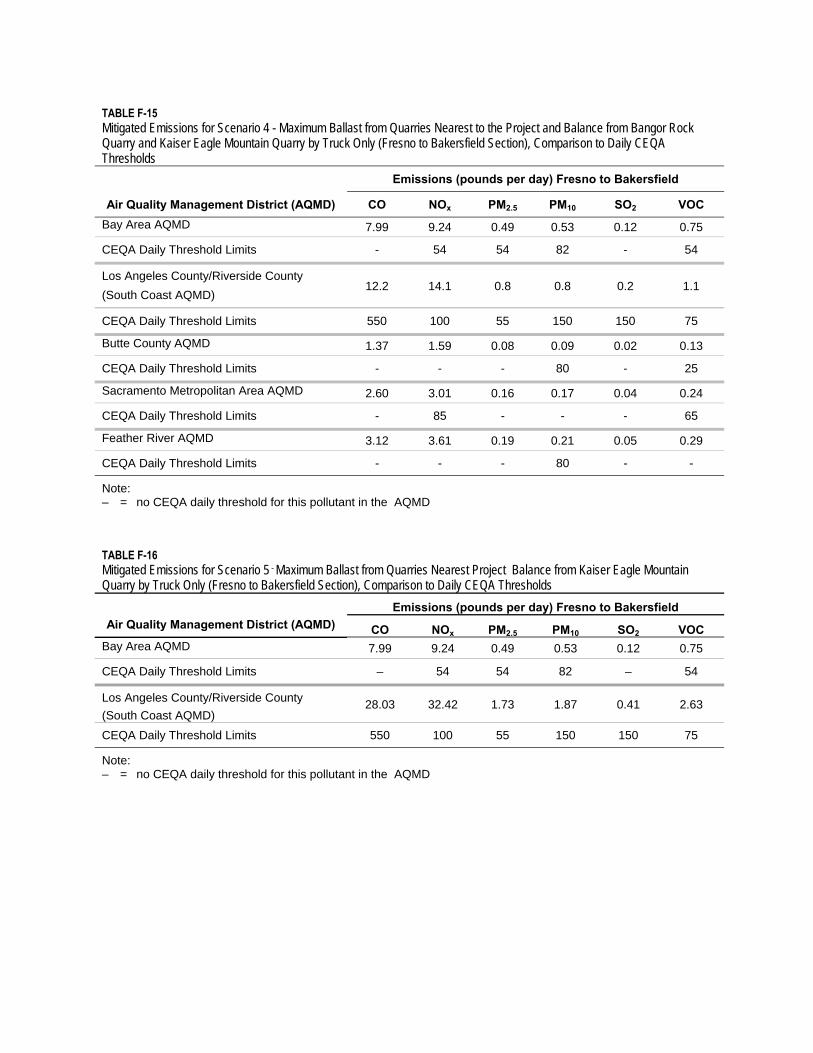
TABLE F-15 Mitigated Emissions for Scenario 4 - Maximum Ballast from Quarries Nearest to the Project and Balance from Bangor Rock Quarry and Kaiser Eagle Mountain Quarry by Truck Only (Fresno to Bakersfield Section), Comparison to Daily CEQA Thresholds
Air Quality Management District (AQMD)
Emissions (pounds per day) Fresno to Bakersfield
CO NOx PM2.5 PM10 SO2 VOC Bay Area AQMD 7.99 9.24 0.49 0.53 0.12 0.75
CEQA Daily Threshold Limits - 54 54 82 - 54
Los Angeles County/Riverside County
(South Coast AQMD) 12.2 14.1 0.8 0.8 0.2 1.1
CEQA Daily Threshold Limits 550 100 55 150 150 75
Butte County AQMD 1.37 1.59 0.08 0.09 0.02 0.13
CEQA Daily Threshold Limits - - - 80 - 25
Sacramento Metropolitan Area AQMD 2.60 3.01 0.16 0.17 0.04 0.24
CEQA Daily Threshold Limits - 85 - - - 65
Feather River AQMD 3.12 3.61 0.19 0.21 0.05 0.29
CEQA Daily Threshold Limits - - - 80 - -
Note: – = no CEQA daily threshold for this pollutant in the AQMD
TABLE F-16
Mitigated Emissions for Scenario 5 - Maximum Ballast from Quarries Nearest Project Balance from Kaiser Eagle Mountain Quarry by Truck Only (Fresno to Bakersfield Section), Comparison to Daily CEQA Thresholds
Air Quality Management District (AQMD) Emissions (pounds per day) Fresno to Bakersfield
CO NOx PM2.5 PM10 SO2 VOC Bay Area AQMD 7.99 9.24 0.49 0.53 0.12 0.75
CEQA Daily Threshold Limits – 54 54 82 – 54
Los Angeles County/Riverside County
(South Coast AQMD) 28.03 32.42 1.73 1.87 0.41 2.63
CEQA Daily Threshold Limits 550 100 55 150 150 75
Note: – = no CEQA daily threshold for this pollutant in the AQMD
APPENDIX I
Potential Impact from Induced Winds

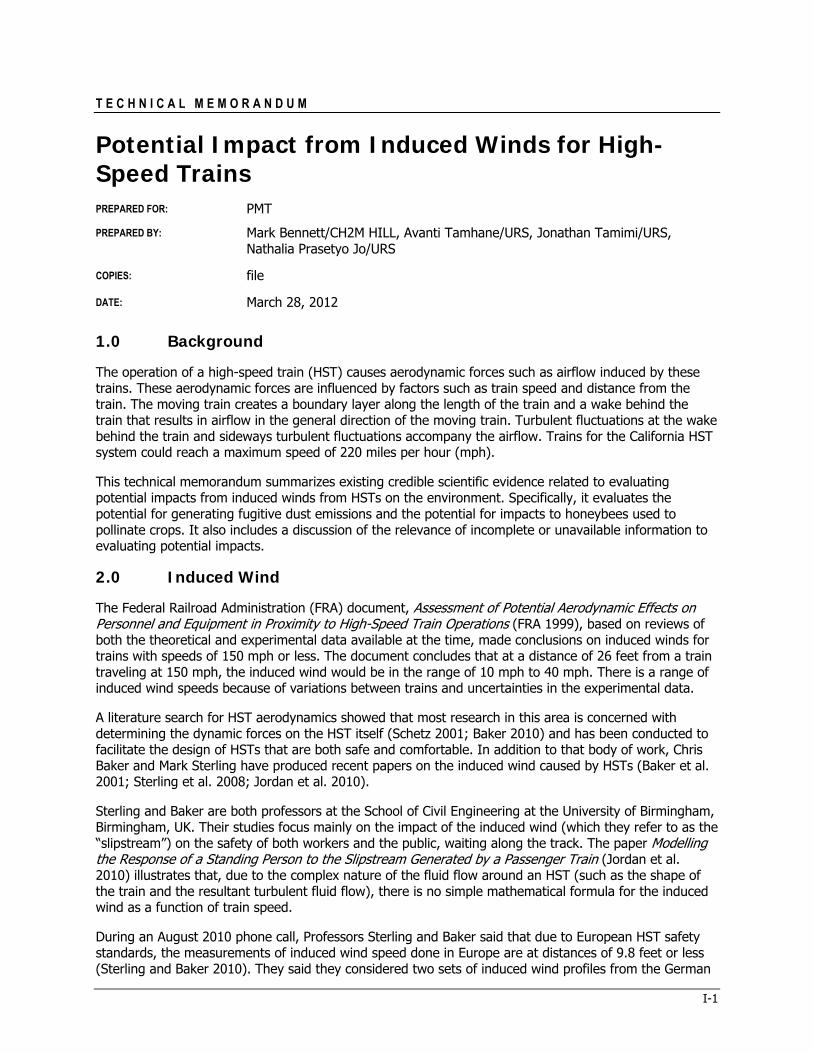
I-1
T E C H N I C A L M E M O R A N D U M
Potential Impact from Induced Winds for High-Speed Trains PREPARED FOR: PMT
PREPARED BY: Mark Bennett/CH2M HILL, Avanti Tamhane/URS, Jonathan Tamimi/URS, Nathalia Prasetyo Jo/URS
COPIES: file
DATE: March 28, 2012
1.0 Background
The operation of a high-speed train (HST) causes aerodynamic forces such as airflow induced by these trains. These aerodynamic forces are influenced by factors such as train speed and distance from the train. The moving train creates a boundary layer along the length of the train and a wake behind the train that results in airflow in the general direction of the moving train. Turbulent fluctuations at the wake behind the train and sideways turbulent fluctuations accompany the airflow. Trains for the California HST system could reach a maximum speed of 220 miles per hour (mph).
This technical memorandum summarizes existing credible scientific evidence related to evaluating potential impacts from induced winds from HSTs on the environment. Specifically, it evaluates the potential for generating fugitive dust emissions and the potential for impacts to honeybees used to pollinate crops. It also includes a discussion of the relevance of incomplete or unavailable information to evaluating potential impacts.
2.0 Induced Wind
The Federal Railroad Administration (FRA) document, Assessment of Potential Aerodynamic Effects on Personnel and Equipment in Proximity to High-Speed Train Operations (FRA 1999), based on reviews of both the theoretical and experimental data available at the time, made conclusions on induced winds for trains with speeds of 150 mph or less. The document concludes that at a distance of 26 feet from a train traveling at 150 mph, the induced wind would be in the range of 10 mph to 40 mph. There is a range of induced wind speeds because of variations between trains and uncertainties in the experimental data.
A literature search for HST aerodynamics showed that most research in this area is concerned with determining the dynamic forces on the HST itself (Schetz 2001; Baker 2010) and has been conducted to facilitate the design of HSTs that are both safe and comfortable. In addition to that body of work, Chris Baker and Mark Sterling have produced recent papers on the induced wind caused by HSTs (Baker et al. 2001; Sterling et al. 2008; Jordan et al. 2010).
Sterling and Baker are both professors at the School of Civil Engineering at the University of Birmingham, Birmingham, UK. Their studies focus mainly on the impact of the induced wind (which they refer to as the “slipstream”) on the safety of both workers and the public, waiting along the track. The paper Modelling the Response of a Standing Person to the Slipstream Generated by a Passenger Train (Jordan et al. 2010) illustrates that, due to the complex nature of the fluid flow around an HST (such as the shape of the train and the resultant turbulent fluid flow), there is no simple mathematical formula for the induced wind as a function of train speed.
During an August 2010 phone call, Professors Sterling and Baker said that due to European HST safety standards, the measurements of induced wind speed done in Europe are at distances of 9.8 feet or less (Sterling and Baker 2010). They said they considered two sets of induced wind profiles from the German
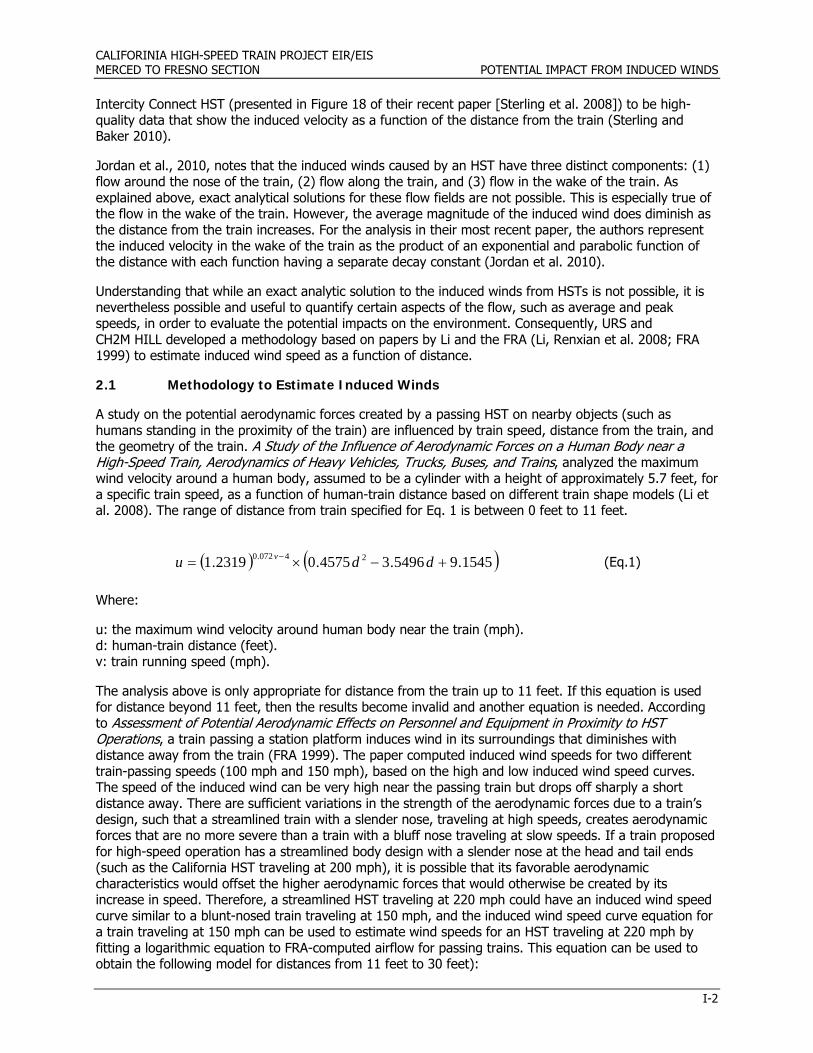
CALIFORINIA HIGH-SPEED TRAIN PROJECT EIR/EIS MERCED TO FRESNO SECTION POTENTIAL IMPACT FROM INDUCED WINDS
I-2
Intercity Connect HST (presented in Figure 18 of their recent paper [Sterling et al. 2008]) to be high-quality data that show the induced velocity as a function of the distance from the train (Sterling and Baker 2010).
Jordan et al., 2010, notes that the induced winds caused by an HST have three distinct components: (1) flow around the nose of the train, (2) flow along the train, and (3) flow in the wake of the train. As explained above, exact analytical solutions for these flow fields are not possible. This is especially true of the flow in the wake of the train. However, the average magnitude of the induced wind does diminish as the distance from the train increases. For the analysis in their most recent paper, the authors represent the induced velocity in the wake of the train as the product of an exponential and parabolic function of the distance with each function having a separate decay constant (Jordan et al. 2010).
Understanding that while an exact analytic solution to the induced winds from HSTs is not possible, it is nevertheless possible and useful to quantify certain aspects of the flow, such as average and peak speeds, in order to evaluate the potential impacts on the environment. Consequently, URS and CH2M HILL developed a methodology based on papers by Li and the FRA (Li, Renxian et al. 2008; FRA 1999) to estimate induced wind speed as a function of distance.
2.1 Methodology to Estimate Induced Winds
A study on the potential aerodynamic forces created by a passing HST on nearby objects (such as humans standing in the proximity of the train) are influenced by train speed, distance from the train, and the geometry of the train. A Study of the Influence of Aerodynamic Forces on a Human Body near a High-Speed Train, Aerodynamics of Heavy Vehicles, Trucks, Buses, and Trains, analyzed the maximum wind velocity around a human body, assumed to be a cylinder with a height of approximately 5.7 feet, for a specific train speed, as a function of human-train distance based on different train shape models (Li et al. 2008). The range of distance from train specified for Eq. 1 is between 0 feet to 11 feet.
1545.95496.34575.02319.1 24072.0 ddu v
(Eq.1) Where:
u: the maximum wind velocity around human body near the train (mph). d: human-train distance (feet). v: train running speed (mph).
The analysis above is only appropriate for distance from the train up to 11 feet. If this equation is used for distance beyond 11 feet, then the results become invalid and another equation is needed. According to Assessment of Potential Aerodynamic Effects on Personnel and Equipment in Proximity to HST Operations, a train passing a station platform induces wind in its surroundings that diminishes with distance away from the train (FRA 1999). The paper computed induced wind speeds for two different train-passing speeds (100 mph and 150 mph), based on the high and low induced wind speed curves. The speed of the induced wind can be very high near the passing train but drops off sharply a short distance away. There are sufficient variations in the strength of the aerodynamic forces due to a train’s design, such that a streamlined train with a slender nose, traveling at high speeds, creates aerodynamic forces that are no more severe than a train with a bluff nose traveling at slow speeds. If a train proposed for high-speed operation has a streamlined body design with a slender nose at the head and tail ends (such as the California HST traveling at 200 mph), it is possible that its favorable aerodynamic characteristics would offset the higher aerodynamic forces that would otherwise be created by its increase in speed. Therefore, a streamlined HST traveling at 220 mph could have an induced wind speed curve similar to a blunt-nosed train traveling at 150 mph, and the induced wind speed curve equation for a train traveling at 150 mph can be used to estimate wind speeds for an HST traveling at 220 mph by fitting a logarithmic equation to FRA-computed airflow for passing trains. This equation can be used to obtain the following model for distances from 11 feet to 30 feet):
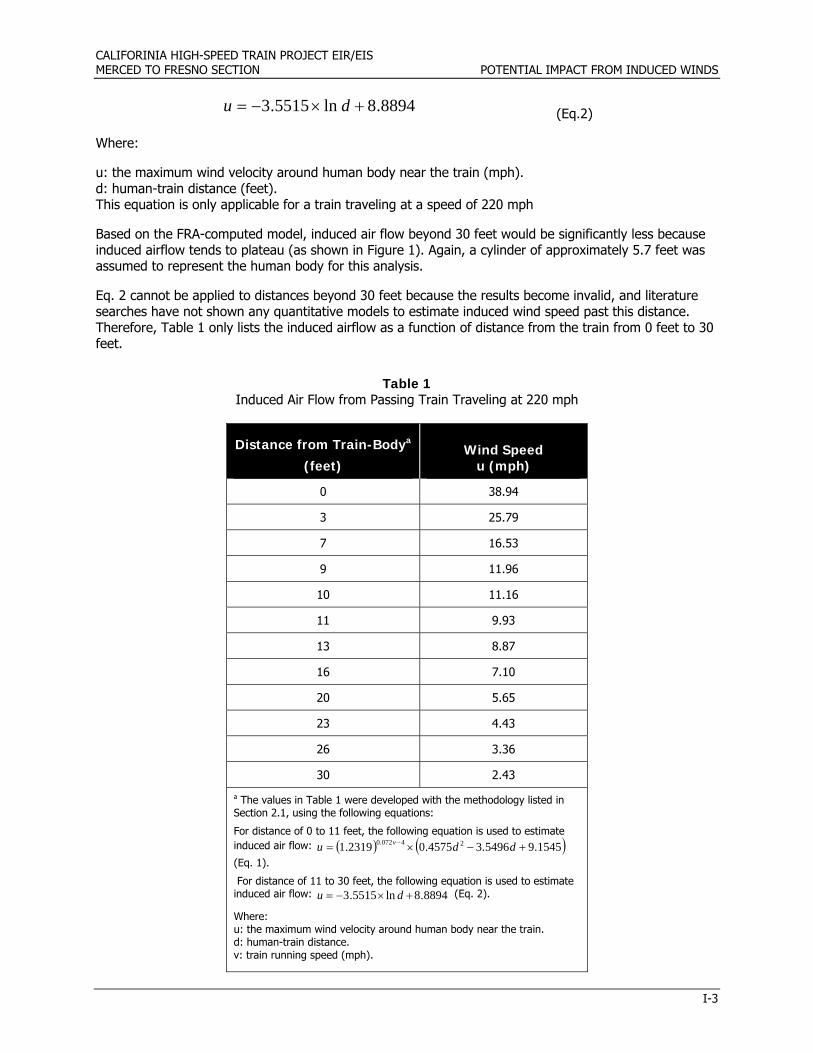
CALIFORINIA HIGH-SPEED TRAIN PROJECT EIR/EIS MERCED TO FRESNO SECTION POTENTIAL IMPACT FROM INDUCED WINDS
I-3
8894.8ln5515.3 du (Eq.2)
Where:
u: the maximum wind velocity around human body near the train (mph). d: human-train distance (feet). This equation is only applicable for a train traveling at a speed of 220 mph
Based on the FRA-computed model, induced air flow beyond 30 feet would be significantly less because induced airflow tends to plateau (as shown in Figure 1). Again, a cylinder of approximately 5.7 feet was assumed to represent the human body for this analysis.
Eq. 2 cannot be applied to distances beyond 30 feet because the results become invalid, and literature searches have not shown any quantitative models to estimate induced wind speed past this distance. Therefore, Table 1 only lists the induced airflow as a function of distance from the train from 0 feet to 30 feet.
Table 1 Induced Air Flow from Passing Train Traveling at 220 mph
Distance from Train-Bodya
(feet) Wind Speed
u (mph)
0 38.94
3 25.79
7 16.53
9 11.96
10 11.16
11 9.93
13 8.87
16 7.10
20 5.65
23 4.43
26 3.36
30 2.43
a The values in Table 1 were developed with the methodology listed in Section 2.1, using the following equations:
For distance of 0 to 11 feet, the following equation is used to estimate induced air flow: 1545.95496.34575.02319.1 24072.0 ddu v
(Eq. 1).
For distance of 11 to 30 feet, the following equation is used to estimate induced air flow: 8894.8ln5515.3 du (Eq. 2).
Where: u: the maximum wind velocity around human body near the train. d: human-train distance. v: train running speed (mph).
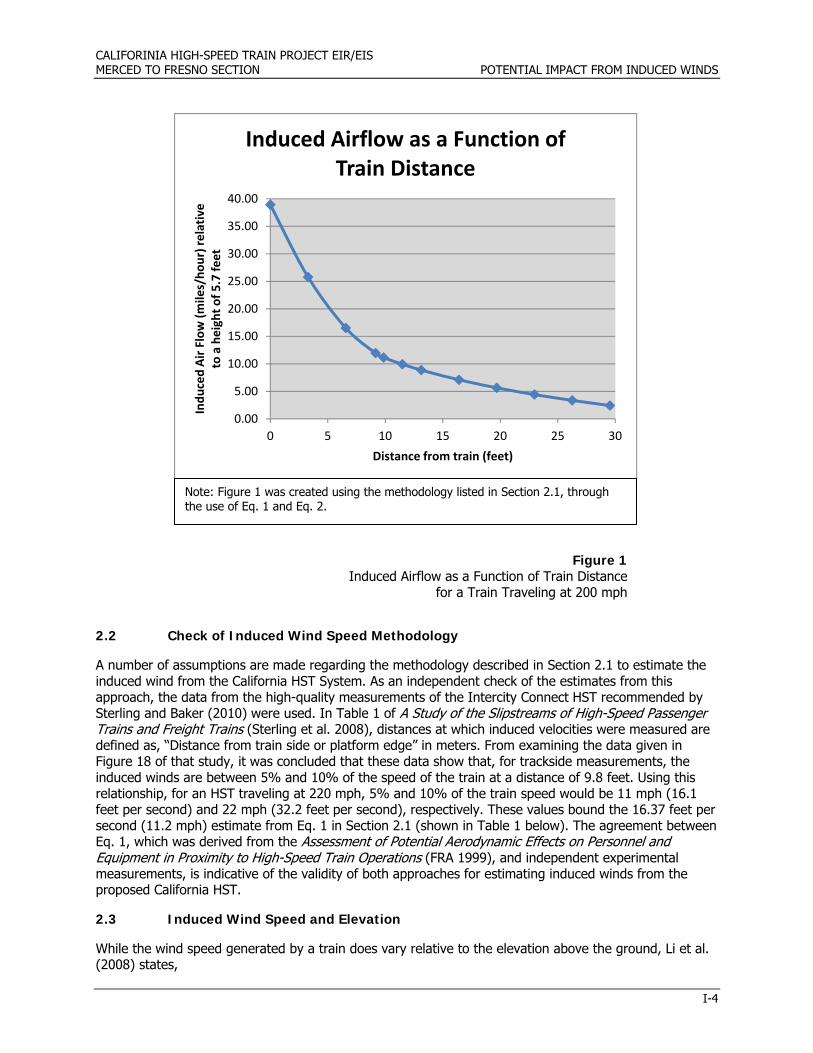
CALIFORINIA HIGH-SPEED TRAIN PROJECT EIR/EIS MERCED TO FRESNO SECTION POTENTIAL IMPACT FROM INDUCED WINDS
I-4
2.2 Check of Induced Wind Speed Methodology
A number of assumptions are made regarding the methodology described in Section 2.1 to estimate the induced wind from the California HST System. As an independent check of the estimates from this approach, the data from the high-quality measurements of the Intercity Connect HST recommended by Sterling and Baker (2010) were used. In Table 1 of A Study of the Slipstreams of High-Speed Passenger Trains and Freight Trains (Sterling et al. 2008), distances at which induced velocities were measured are defined as, “Distance from train side or platform edge” in meters. From examining the data given in Figure 18 of that study, it was concluded that these data show that, for trackside measurements, the induced winds are between 5% and 10% of the speed of the train at a distance of 9.8 feet. Using this relationship, for an HST traveling at 220 mph, 5% and 10% of the train speed would be 11 mph (16.1 feet per second) and 22 mph (32.2 feet per second), respectively. These values bound the 16.37 feet per second (11.2 mph) estimate from Eq. 1 in Section 2.1 (shown in Table 1 below). The agreement between Eq. 1, which was derived from the Assessment of Potential Aerodynamic Effects on Personnel and Equipment in Proximity to High-Speed Train Operations (FRA 1999), and independent experimental measurements, is indicative of the validity of both approaches for estimating induced winds from the proposed California HST.
2.3 Induced Wind Speed and Elevation
While the wind speed generated by a train does vary relative to the elevation above the ground, Li et al. (2008) states,
0.00
5.00
10.00
15.00
20.00
25.00
30.00
35.00
40.00
0 5 10 15 20 25 30
Indu
ced Air Flow (m
iles/ho
ur) relative
to a height o
f 5.7 fe
et
Distance from train (feet)
Induced Airflow as a Function of Train Distance
Note: Figure 1 was created using the methodology listed in Section 2.1, through the use of Eq. 1 and Eq. 2.
Figure 1 Induced Airflow as a Function of Train Distance
for a Train Traveling at 200 mph
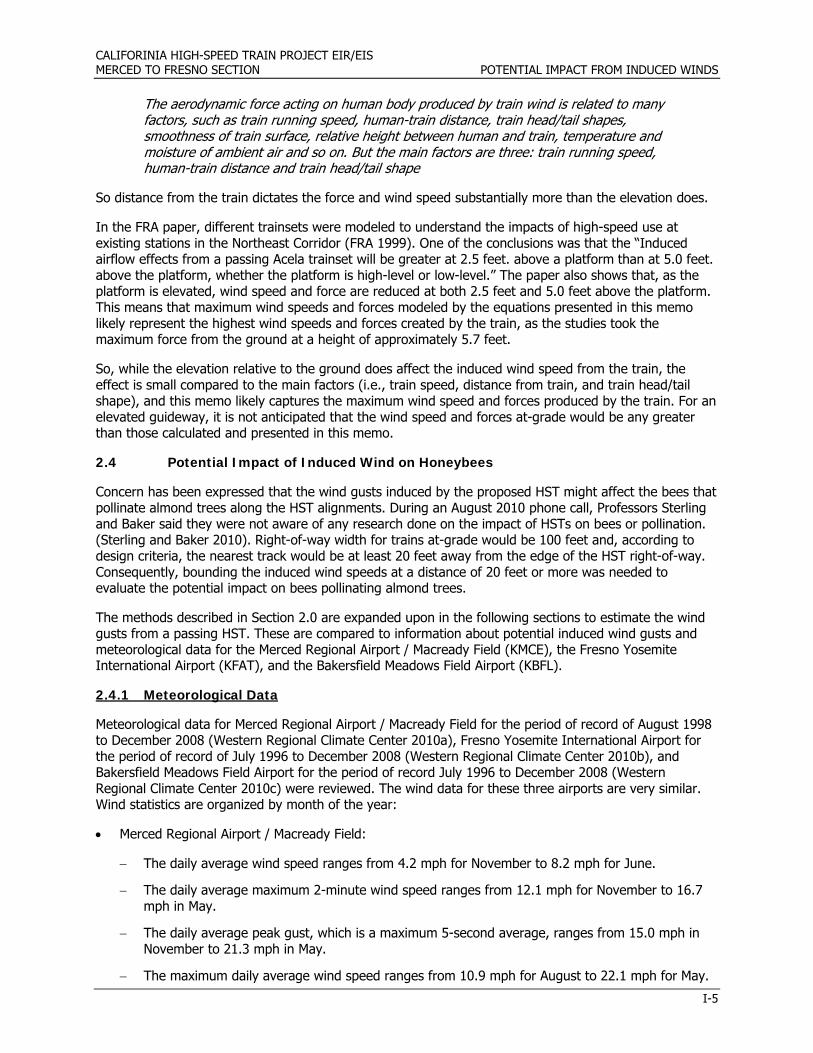
CALIFORINIA HIGH-SPEED TRAIN PROJECT EIR/EIS MERCED TO FRESNO SECTION POTENTIAL IMPACT FROM INDUCED WINDS
I-5
The aerodynamic force acting on human body produced by train wind is related to many factors, such as train running speed, human-train distance, train head/tail shapes, smoothness of train surface, relative height between human and train, temperature and moisture of ambient air and so on. But the main factors are three: train running speed, human-train distance and train head/tail shape
So distance from the train dictates the force and wind speed substantially more than the elevation does.
In the FRA paper, different trainsets were modeled to understand the impacts of high-speed use at existing stations in the Northeast Corridor (FRA 1999). One of the conclusions was that the “Induced airflow effects from a passing Acela trainset will be greater at 2.5 feet. above a platform than at 5.0 feet. above the platform, whether the platform is high-level or low-level.” The paper also shows that, as the platform is elevated, wind speed and force are reduced at both 2.5 feet and 5.0 feet above the platform. This means that maximum wind speeds and forces modeled by the equations presented in this memo likely represent the highest wind speeds and forces created by the train, as the studies took the maximum force from the ground at a height of approximately 5.7 feet.
So, while the elevation relative to the ground does affect the induced wind speed from the train, the effect is small compared to the main factors (i.e., train speed, distance from train, and train head/tail shape), and this memo likely captures the maximum wind speed and forces produced by the train. For an elevated guideway, it is not anticipated that the wind speed and forces at-grade would be any greater than those calculated and presented in this memo.
2.4 Potential Impact of Induced Wind on Honeybees
Concern has been expressed that the wind gusts induced by the proposed HST might affect the bees that pollinate almond trees along the HST alignments. During an August 2010 phone call, Professors Sterling and Baker said they were not aware of any research done on the impact of HSTs on bees or pollination. (Sterling and Baker 2010). Right-of-way width for trains at-grade would be 100 feet and, according to design criteria, the nearest track would be at least 20 feet away from the edge of the HST right-of-way. Consequently, bounding the induced wind speeds at a distance of 20 feet or more was needed to evaluate the potential impact on bees pollinating almond trees.
The methods described in Section 2.0 are expanded upon in the following sections to estimate the wind gusts from a passing HST. These are compared to information about potential induced wind gusts and meteorological data for the Merced Regional Airport / Macready Field (KMCE), the Fresno Yosemite International Airport (KFAT), and the Bakersfield Meadows Field Airport (KBFL).
2.4.1 Meteorological Data
Meteorological data for Merced Regional Airport / Macready Field for the period of record of August 1998 to December 2008 (Western Regional Climate Center 2010a), Fresno Yosemite International Airport for the period of record of July 1996 to December 2008 (Western Regional Climate Center 2010b), and Bakersfield Meadows Field Airport for the period of record July 1996 to December 2008 (Western Regional Climate Center 2010c) were reviewed. The wind data for these three airports are very similar. Wind statistics are organized by month of the year:
Merced Regional Airport / Macready Field:
The daily average wind speed ranges from 4.2 mph for November to 8.2 mph for June.
The daily average maximum 2-minute wind speed ranges from 12.1 mph for November to 16.7 mph in May.
The daily average peak gust, which is a maximum 5-second average, ranges from 15.0 mph in November to 21.3 mph in May.
The maximum daily average wind speed ranges from 10.9 mph for August to 22.1 mph for May.
CALIFORINIA HIGH-SPEED TRAIN PROJECT EIR/EIS MERCED TO FRESNO SECTION POTENTIAL IMPACT FROM INDUCED WINDS
I-6
The maximum 2-minute average wind speed range from 24 mph for September to 43 mph for December.
The maximum peak gust ranges from 29 mph for September to 51 mph for December.
Fresno Yosemite International Airport:
The daily average wind speed ranges from 4.0 mph for December to 8.5 mph for June.
The daily average maximum 2-minute wind speed ranges from 11.5 mph for November to 17.7 mph in May.
The daily average peak gust, which is a maximum 5-second average, ranges from 14.2 mph for both November and December to 21.7 mph in May.
The maximum daily average wind speed ranges from 12.6 mph for July to 19.3 mph for March.
The maximum 2-minute average wind speed range from 25 mph for August to 38 mph for January.
The maximum peak gust ranges from 33 mph for both August and September to 46 mph for January.
Bakersfield Meadows Field Airport (KBFL), CA:
The daily average wind speed ranges from 4.3 mph for November to 7.4 mph for June.
The daily average maximum 2-minute wind speed ranges from 12.4 mph for November to 17.3 mph in April.
The daily average peak gust, which is a maximum 5-second average, ranges from 14.7 mph for November to 21.4 mph in April.
The maximum daily average wind speed ranges from 9.4 mph for November to 22.3 mph for January.
The maximum 2-minute average wind speed range from 28 mph for July to 49 mph for February.
The maximum peak gust ranges from 33 mph for July to 57 mph for February.
2.4.2 Comparison with HST Induced Wind Gusts
Using the relationships from the German Intercity Connect HST data, induced winds from an HST traveling at 220 mph would be expected to range from 11 mph to 22 mph at 9.8 feet from the train. At 50 feet and 100 feet, the induced winds would be significantly less. As shown above in Table 1, at 20 feet the induced wind would be expected to be approximately 6 mph. A 1,400-foot-long train traveling at 220 mph would completely pass by an observer in less than 5 seconds; therefore a comparable wind statistic would be the daily average peak gust, where a peak gust is a maximum 5-second average wind speed. For Merced Regional Airport / Macready Field, Fresno Yosemite International Airport, and KBFL, the daily average peak gusts ranged from 15.0 mph to 21.3 mph, 14.2 mph to 21.7, and 14.7 to 21.4 mph, respectively. These ranges of speed are equivalent to the expected range of speeds of the induced winds at 9.8 feet from the train and two to three times greater than the 6 mph expected at 20 feet. Consequently, at 20 feet, 50 feet, and 100 feet from the train, the magnitude of the speeds of the induced winds would be expected to be less than and indistinguishable from naturally occurring wind gusts. Therefore, no impact on bee pollination from induced winds from the proposed HST would be expected to occur.
CALIFORINIA HIGH-SPEED TRAIN PROJECT EIR/EIS MERCED TO FRESNO SECTION POTENTIAL IMPACT FROM INDUCED WINDS
I-7
3.0 Wind-Generated Fugitive Dust Emissions from a Passing High-Speed Train
Wind erosion occurs when drag forces or shear stresses exerted by the wind exceed the retention forces acting on particles or debris at the surface. Once the minimum wind speed required to initiate particle motion (i.e., threshold friction velocity) has been reached, wind erosion occurs as a function of wind power or wind speed. The strong turbulent airflow along the sides of a moving train and the wake at the rear of the train may resuspend erodible debris and fine particulates from the surface of the surrounding impacted area, similar to particle resuspension from wind erosion. Attachment 1, Wind-Generated Fugitive Dust Emissions from a Passing High-Speed Train (URS 2010), provides more detail regarding methodology and findings.
3.1 Methodology
To estimate the fugitive dust emission from the particle resuspension, the AP-42 guidance Chapter 13.2.5 Industrial Wind Erosion (EPA 2006) was used to quantify the emission factor for wind-generated fugitive particulates emissions from a passing HST. This section presents the approach used to estimate the annual emissions of particulate matter smaller than or equal to 10 and 2.5 microns in diameter (PM10 and PM2.5, respectively) from HST operation, based on the AP-42 guidance and project-specific data such as the impacted area.
Annual wind-generated fugitive dust/particulates emissions from a passing HST are a function of the impacted zone area and the wind erosion emission factor (per unit area). According to the AP-42 guidance, the wind erosion emission factor emission factor (in terms of mass per unit area) is a function of the disturbance frequency (where disturbance is defined as an action that results in the exposure of fresh surface material) in a year and erosion potential (which depends on friction velocity and threshold friction velocity).
3.1.1 Wind Erosion Emission Factor
Based on the AP-42 guidance, the emission factor for wind-generated dust emissions from the surface material of the impacted zone should be calculated as follows:
Emission factor (g/m2):
N
iiPk
1 (Eq. 3)
Where:
k = particle size multiplier N = number of disturbances per year Pi = erosion potential corresponding to the observed (or probable) fastest mile of wind for the ith period between disturbances (grams/feet2).
3.1.2 Particulate Emission Factor
As described in Eq. 3, the emission factor is a function of the disturbance frequency and erosion potential. The disturbance frequencies for various HST alignments were provided by the project engineers and are discussed in the California High-Speed Train Project Merced to Fresno Section Air Quality Technical Report (Authority and FRA 2012).
CALIFORINIA HIGH-SPEED TRAIN PROJECT EIR/EIS MERCED TO FRESNO SECTION POTENTIAL IMPACT FROM INDUCED WINDS
I-8
The erosion potential is the finite availability of erodible material (mass/area) on a surface. The AP-42 equations 1 and 3 for erosion potential were substituted into the Eq. 3 listed above, and the following emission factor (grams/feet2) as a function of induced wind was derived:
i
N
i
k
1
2 0.19 -0.038955u 25 0.19 -0.038955u 58 (Eq.4)
Where:
k = particle size multiplier (0.5 for PM10 and 0.075 for PM2.5). u = induced wind speed at a certain height above the surface (mph)
3.1.2 Induced Wind Speed
As shown in Eq. 4, the emission factor can be expressed as a function of induced wind speed along the side of the train body. The induced wind profile could be estimated using Eq.1 from Section 2.1 of this memo.
3.1.3 Impacted Zone Area
The impacted zone area for the HST is defined as the surface area within both shoulders of the train track or within the right-of-way, at which the maximum friction velocity on the surface material is higher than the threshold friction velocity (i.e., the minimum wind speed required to initiate particle motion). The length of the impacted zone area is equal to the length of the at-grade track, and was obtained from the California High-Speed Train Project Merced to Fresno Section Air Quality Technical Report (Authority and FRA 2012)
3.2 Fugitive Dust Calculation
By integrating the emission factor function in Eq. 4 across the induced wind speed values within the impacted zone boundary area and multiplying the emission factor by the number of disturbance (N) and the particle size multiplier (k), the annual fugitive dust emissions from HST activity can be estimated.
Dust emissions generated by the wake at the rear of the train were not added to this calculation to avoid double counting. The erodible dust is already suspended in the air when the rear end of the train passes through, so additional turbulence or the rear wake will not contribute to more raised dust in the air.
The emission factor profiles over the distance from the train body are presented in Figure 2, and the emission factor over the impacted zone area is summarized in Table 2.
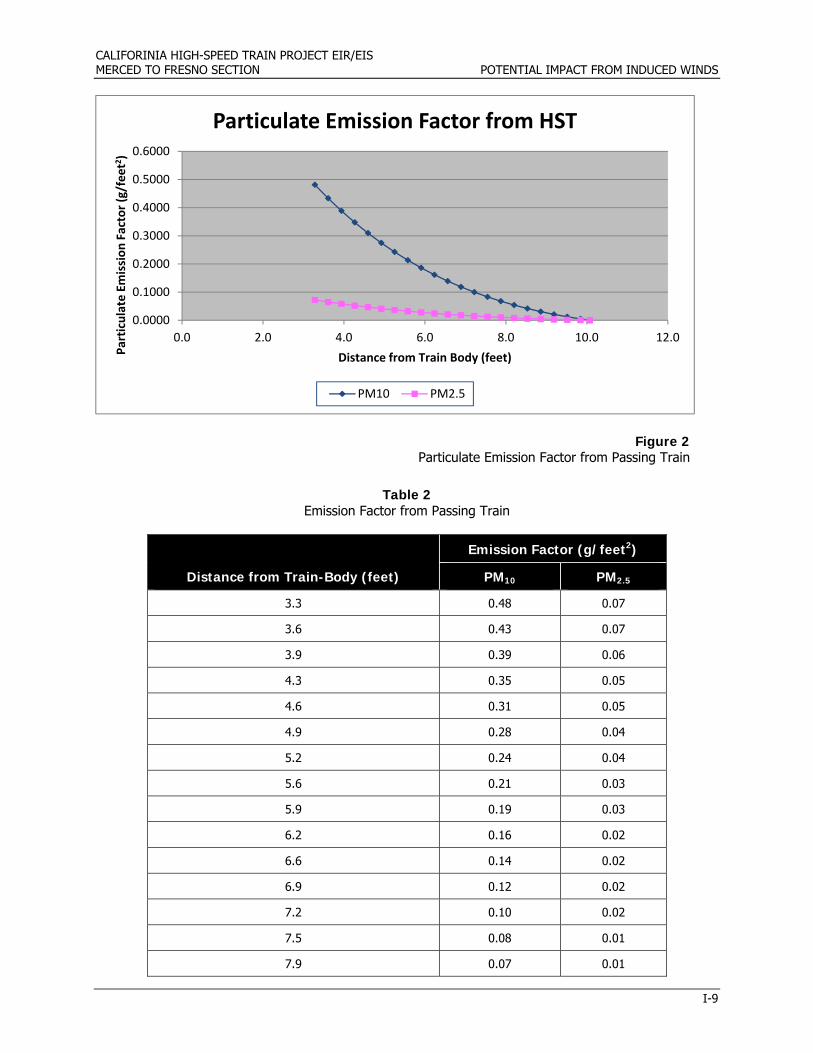
CALIFORINIA HIGH-SPEED TRAIN PROJECT EIR/EIS MERCED TO FRESNO SECTION POTENTIAL IMPACT FROM INDUCED WINDS
I-9
Figure 2 Particulate Emission Factor from Passing Train
Table 2 Emission Factor from Passing Train
Distance from Train-Body (feet)
Emission Factor (g/feet2)
PM10 PM2.5
3.3 0.48 0.07
3.6 0.43 0.07
3.9 0.39 0.06
4.3 0.35 0.05
4.6 0.31 0.05
4.9 0.28 0.04
5.2 0.24 0.04
5.6 0.21 0.03
5.9 0.19 0.03
6.2 0.16 0.02
6.6 0.14 0.02
6.9 0.12 0.02
7.2 0.10 0.02
7.5 0.08 0.01
7.9 0.07 0.01
0.0000
0.1000
0.2000
0.3000
0.4000
0.5000
0.6000
0.0 2.0 4.0 6.0 8.0 10.0 12.0
Particulate Em
ission
Factor (g/feet2)
Distance from Train Body (feet)
Particulate Emission Factor from HST
PM10 PM2.5
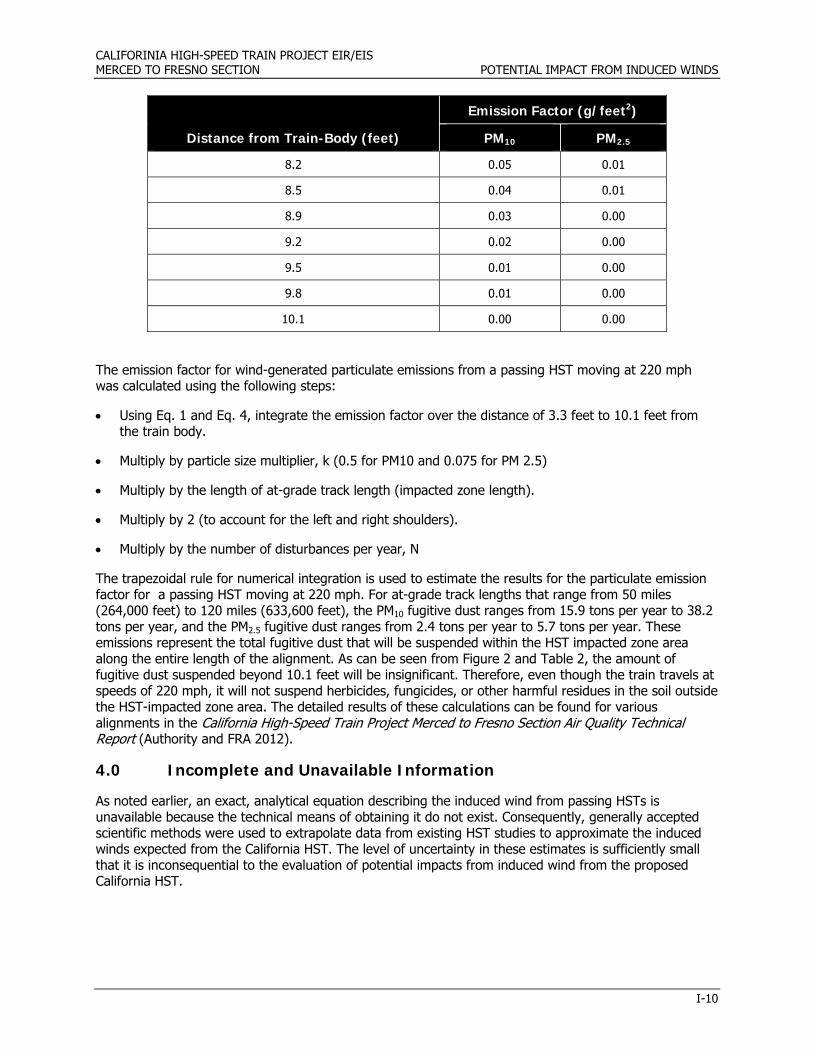
CALIFORINIA HIGH-SPEED TRAIN PROJECT EIR/EIS MERCED TO FRESNO SECTION POTENTIAL IMPACT FROM INDUCED WINDS
I-10
Distance from Train-Body (feet)
Emission Factor (g/feet2)
PM10 PM2.5
8.2 0.05 0.01
8.5 0.04 0.01
8.9 0.03 0.00
9.2 0.02 0.00
9.5 0.01 0.00
9.8 0.01 0.00
10.1 0.00 0.00
The emission factor for wind-generated particulate emissions from a passing HST moving at 220 mph was calculated using the following steps:
Using Eq. 1 and Eq. 4, integrate the emission factor over the distance of 3.3 feet to 10.1 feet from the train body.
Multiply by particle size multiplier, k (0.5 for PM10 and 0.075 for PM 2.5)
Multiply by the length of at-grade track length (impacted zone length).
Multiply by 2 (to account for the left and right shoulders).
Multiply by the number of disturbances per year, N
The trapezoidal rule for numerical integration is used to estimate the results for the particulate emission factor for a passing HST moving at 220 mph. For at-grade track lengths that range from 50 miles (264,000 feet) to 120 miles (633,600 feet), the PM10 fugitive dust ranges from 15.9 tons per year to 38.2 tons per year, and the PM2.5 fugitive dust ranges from 2.4 tons per year to 5.7 tons per year. These emissions represent the total fugitive dust that will be suspended within the HST impacted zone area along the entire length of the alignment. As can be seen from Figure 2 and Table 2, the amount of fugitive dust suspended beyond 10.1 feet will be insignificant. Therefore, even though the train travels at speeds of 220 mph, it will not suspend herbicides, fungicides, or other harmful residues in the soil outside the HST-impacted zone area. The detailed results of these calculations can be found for various alignments in the California High-Speed Train Project Merced to Fresno Section Air Quality Technical Report (Authority and FRA 2012).
4.0 Incomplete and Unavailable Information
As noted earlier, an exact, analytical equation describing the induced wind from passing HSTs is unavailable because the technical means of obtaining it do not exist. Consequently, generally accepted scientific methods were used to extrapolate data from existing HST studies to approximate the induced winds expected from the California HST. The level of uncertainty in these estimates is sufficiently small that it is inconsequential to the evaluation of potential impacts from induced wind from the proposed California HST.
CALIFORINIA HIGH-SPEED TRAIN PROJECT EIR/EIS MERCED TO FRESNO SECTION POTENTIAL IMPACT FROM INDUCED WINDS
I-11
5.0 References
Baker, Chris, 2010. “The Flow Around High Speed Trains.” Journal of Wind Engineering and Industrial Aerodynamics. Volume 98, pages 277–299.
Baker, C.J., Dalley, S.J., Johnson, T., Quinn, A., and Wright, N.G. 2001. “The Slipstream and Wake of a High-Speed Train.” Proc. IMechE, Part F: Journal of Rail and Rapid Transit. 2001, Volume 215, pages 83–99.
California High-Speed Rail Authority and USDOT Federal Railroad Administration (Authority and FRA). 2012. Air Quality Technical Report. Sacramento and Washington, DC: California High-Speed Rail Authority and U.S. Department of Transportation, Federal Railroad Administration. 2012.
Federal Railroad Administration (FRA). 1999. Assessment of Potential Aerodynamic Effects on Personnel and Equipment in Proximity to High-Speed Train Operations: Safety of High-Speed Ground Transportation Systems. DOT-NVTSC-FRA-98-3. Washington, DC. December 1999.
Li, Renxian, Zhao, Jing and Zhang, Shu. 2008. A Study of the Influence of Aerodynamic Forces on a Human Body near a High-Speed Train, Aerodynamics of Heavy Vehicles, Trucks, Buses, and Trains.
Luft, Arnold. 2010. Email correspondence between Thomas Baily (URS) with Arnold Luft (ARUP), regarding disturbances of right-of-way, dated July 6, 2010.
Sterling, M., C.J. Baker, S.C. Jordan, and T. Johnson. 2008. “A Study of the Slipstreams of High-Speed Passenger Trains and Freight Trains,” Proc. IMechE, Part F: Journal of Rail and Rapid Transit. 2008, Volume 222, pages 177–193.
Jordan, S.C., M. Sterling, and C.J. Baker. 2010. “Modelling the Response of a Standing Person to the Slipstream Generated by a Passenger Train,” Proc. IMechE, Part F: Journal of Rail and Rapid Transit. 2010, Volume 223, pages 567–579.
Schetz, Joseph A. 2001. “Aerodynamics of High-Speed Trains.” Annual Review of Fluid Mechanics. Volume 33, pages 371–414.
Sterling, M. and C.J. Baker. 2010. Telephone call from Mark Bennett, CH2M HILL, to Mark Sterling and Chris Baker about induced winds from HSTs. August 23, 2010.
United States Environmental Protection Agency (EPA). 2006. Industrial Wind Erosion. AP 42, Fifth Edition, Volume I. Chapter 13.2.5. November 2006.
URS. 2010. Wind-Generated Fugitive Dust Emissions from a Passing High-Speed Train. Prepared by Prasetyo Jo, Nathalia. July 12, 2010.
Watson, J.G, 1996. Effectiveness Demonstration of Fugitive Dust Control Methods for Public Unpaved Roads and Unpaved Shoulders on Paved Roads. DRI Document No. 685-5200. IF2: August 2, 1996.
Western Regional Climate Center. 2010a. Climatologically summary for the “Merced Muni/Macready FLD APT (KMCE),” for the period of record August 1998 to December 2008. http://www.wrcc.dri.edu/summary/mce.ca.html. Accessed September 1, 2010.
Western Regional Climate Center. 2010b. Climatologically summary for the “Fresno Yosemite International Airport (KFAT),” for the period of record July 1996 to December 2008. http://www.wrcc.dri.edu/summary/fat.ca.html. Accessed September 1, 2010.
Western Regional Climate Center. 2010c. Climatologically summary for the ”Bakersfield Meadows Field Airport (KBFL),” for the period of record July 1996 to December 2008. http://www.wrcc.dri.edu/summary/BFL.CA.HTML. Accessed September 1, 2010.

ATTACHMENT 1
Fugitive Dust Memo
Wind Generated Fugitive Dust July 12, 2010 Page 2
C:\Users\jcrisafu\My Documents\Mail\OL Temp Attachments\Dust Memorandum 071210 (3).docx
URS/HMM/Arup Joint Venture 1333 Broadway St. Suite 800
Oakland, CA 94612 Tel: 510 893 3600 Fax: 510 874 3268
______________________________________________________________________________
To: PMT From: Nathalia Prasetyo Jo (URS) Date: July 12, 2010 Subject: Wind-Generated Fugitive Dust Emissions from a Passing High-Speed Train ______________________________________________________________________________ Wind erosion occurs when drag forces or shear stresses exerted by the wind exceed the retention forces acting on particles or debris at the surface. Once the minimum wind speed required to initiate particle motion (threshold friction velocity) has been reached, wind erosion occurs as a function of wind power or wind speed. Trains traveling at high velocity, such as the High-Speed Train, drag the surrounding air along the side of its body, which induces sideways turbulent fluctuations and rear wake. The strong turbulent airflow along the sides of a moving train and the wake at the rear of the train may resuspend erodible debris and fine particulates from the surface of the surrounding impacted area, similar to particle resuspension from wind erosion. Methodology To estimate the fugitive dust emission from the particle resuspension, the AP42 guidance Chapter 13.2.5 Wind Erosion was used to quantify the emission factor for wind-generated fugitive particulates emissions from a passing High-Speed Train. This memo presents the approach used to estimate the annual PM10 and PM2.5 emissions from the High-Speed Train operation based on the AP42 guidance and current project description (at 15%design). Annual wind-generated fugitive dust/particulates emissions from a passing High-Speed Train are a function of the impacted zone area and the wind erosion emission factor (per unit area). According to the AP42 guidance, the wind erosion emission factor emission factor (in terms of mass per unit area) is a function of the disturbance frequency (where disturbance is defined as an action that results in the exposure of fresh surface material) in a year and erosion potential (which depends on friction velocity and threshold friction velocity). The influencing factors such as the impacted zone area, wind erosion emission factor, disturbance frequency, erosion potential and induced wind speed profile are discussed in detail in the following subsections. Impacted Zone Area The impacted zone area for the High-Speed Train scenario is defined as the surface area within both shoulders of the train track or within the right of way, at which the maximum friction velocity on the surface material is higher than the threshold friction velocity (the minimum wind
MEMORANDUM
Wind Generated Fugitive Dust July 12, 2010 Page 3
C:\Users\jcrisafu\My Documents\Mail\OL Temp Attachments\Dust Memorandum 071210 (3).docx
speed required to initiate particle motion). The length of the impacted zone area is equal to the length of the at-grade track. Along the Fresno to Bakersfield alignment, the length of the at-grade track is approximately 43.56 miles (total track length subtracted by the elevated track section length)1. The width of the impacted zone is twice the distance from the beginning of the right of way area to the point where the corresponding maximum surface friction velocity generated by the induced turbulence is equal to the threshold friction velocity (assumed 0.19 m/s, based on the lowest value available for disturbed desert soil2). In this memo, the width of the impacted zone is referred to in terms of distance from the train body. The doubling of width was to account for the right of way area on the left and right side of the train track. The boundary for the impacted zone is assumed to start at beginning of the right of way area (approximately one meter from the train body) and end at the distance where the corresponding friction velocity is equal to the threshold friction velocity. The surface area from the train body to the beginning of the right of way area was assumed to consist of non-erodible material because that area is within the embankment and rock ballast area. To quantify the fugitive dust emissions generated by a High-Speed train passing at the speed of 220 mph, the emission factor needs to account for the induced wind speed profile and the distance within the impacted zone. Further discussion on the determination of the impacted zone boundary is presented in the induced wind speed section. Wind Erosion Emission Factor Based on the AP42 guidance, the emission factor for wind-generated dust emissions from the surface material of the impacted zone should be calculated as follows:
Emission factor (g/m2):
N
iiPk
1 (Eq.1) Where: k = particle size multiplier N = number of disturbances per year Pi = erosion potential corresponding to the observed (or probable) fastest mile of wind for the ith period between disturbances, g/m2
As described in Eq.1, the emission factor is a function of the disturbance frequency and erosion potential. The approach and assumptions used to determine the disturbance frequency and erosion potential for the High-Speed Train operation scenario are presented as follows: Disturbance Frequency The disturbance is defined as an action that results in the exposure of fresh surface material. The number of disturbances per year during normal High-Speed Train operation is equal to the frequency of right of way access in a year (for maintenance or other purposes). The wind
1 The length of at-grade track was estimated based on the Fresno to Bakersfield HST Alignments Preliminary Draft Map, URS, 2010. 2 Watson, J.G, “Effectiveness Demonstration of Fugitive Dust Control Methods for Public Unpaved Roads and Unpaved Shoulders on Paved Roads”, DRI Document No. 685-5200. IF2: August 2, 1996.
Wind Generated Fugitive Dust July 12, 2010 Page 4
C:\Users\jcrisafu\My Documents\Mail\OL Temp Attachments\Dust Memorandum 071210 (3).docx
generated emission factor is dependent on the disturbance frequency because each time that the right of way surface area is disturbed, its erosion potential is restored. The right of way surface area is currently expected to be disturbed twice monthly for visual inspection based on the operational and maintenance schedule of the High-Speed Train. Therefore, the erosion potential is assumed to be restored twice a month, which translates to 24 disturbances/year or N=243. Erosion Potential The erosion potential (Pi) is the finite availability of erodible material (mass/area) on a surface. For the wind erosion emission factor calculation, Pi is defined as the erosion potential corresponding to the observed fastest mile of wind4 for the ith period between disturbances, and can be calculated as follows: P = 58 (u* - u*t )
2 + 25 (u* - u*t) (Eq.2) P = 0 for u*< u*t ` (Eq.3) Where: u* = friction velocity (m/s) u*t = threshold friction velocity (m/s). Assumed 0.19 m/s, based on the lowest value available for disturbed desert soil. Since there was no documentation for the friction velocity from High-Speed Train operation, induced wind velocity was used to estimate the friction velocity on the right of way surface based on the correlation given by Eq.4.
0
ln4.0
*
z
zuuz (z > zo) (Eq.4)
Where: uz = induced wind speed, m/s u* = friction velocity, m/s z = height above test surface, cm z0 = roughness height, cm 0.4 = von Karman’s constant, dimensionless
By substituting the friction velocity (u*) from Eq.4 into Eq.2 and the erosion potential (Pi) from Eq. 2 into Eq. 1, the emission factor in Eq.1 can be expressed as a function of induced wind speed as shown in Eq. 5
3 Email correspondence between Thomas Baily (URS) with Arnold Luft (ARUP) dated July 6, 2010. 4 Fastest mile is the fastest one minute observed wind speed taken from a multiple register that contains a time record of the passing of each mile of wind
Wind Generated Fugitive Dust July 12, 2010 Page 5
C:\Users\jcrisafu\My Documents\Mail\OL Temp Attachments\Dust Memorandum 071210 (3).docx
Emission factor (g/m2):
i
N
i
k
1
*t
0
z
2
*t
0
z u -
z
zln
u 0.4 25 u -
z
zln
u 0.4 58 (Eq.5)
Where: k = particle size multiplier (0.5 for PM10 and 0.075 for PM2.5). uz = induced wind speed at a certain height above the surface (m/s). Note that emissions are only calculated in area with u*> u*t. Because, when u*< u*t, the erosion potential (P) is equal to zero. u*t = threshold friction velocity. Assumed 0.19 m/s, based on the lowest value available for disturbed desert soil. z = height above the surface (288 cm), based on 1/2 of the train height (1.88 m) and the average embankment height (3ft ~1 meter) with respect to the right of way5. z0 = surface roughness height (cm), assume 0.01 cm for the at grade right of way 0.4 = von Karman’s constant, dimensionless By substituting the assumptions above and other known parameters into Eq. 5, the equation can be simplified to.
Emission factor (g/m2): i
N
i
k
1
z2
z 0.19 - 0.038955u 25 0.19 - 0.038955u 58 (Eq.6)
Where: k = particle size multiplier (0.5 for PM10 and 0.075 for PM2.5). uz = induced wind speed at a certain height above the surface (m/s). Note that emissions are only calculated in area with uz > 4.88 m/s (a substitute for u*> u*t). Because, when u*< u*t, the erosion potential (P) is equal to zero. As shown in Eq. 6, the emission factor can be expressed as a function of induced wind speed along the side of the train body. By integrating the emission factor function in Eq.6 across the induced wind speed values within the impacted zone boundary (uz) area, and multiplying the emission factor by the number of disturbance (24 times per year) and the particle size multiplier (k), the annual fugitive dust emissions from the High-Speed Train activity can be estimated. Dust emissions generated by the wake at the rear of the train were not added to this calculation to avoid double counting. The erodible dust is already suspended in the air when the rear end of the train passes through and therefore additional turbulence or the rear wake will not contribute to more raised dust in the air. Induced Wind Speed Profile The width of the impacted zone is twice the distance from the beginning of the right of way to the point where the corresponding maximum surface friction velocity generated by the induced turbulence is equal to the threshold friction velocity. To determine the distance where the corresponding maximum surface friction velocity generated by the induced turbulence is equal to the threshold friction velocity, a wind speed profile analysis is required. A study on the potential aerodynamic forces created by a passing High-Speed Train on nearby 5 Track related measurements are based on Technical Memorandum, Typical Cross Sections for 15% Design TM 1.1.21 Appendix A: Two Track At-Grade Drawing and Project Description Summary (June 28, 2010)

Wind Generated Fugitive Dust July 12, 2010 Page 6
C:\Users\jcrisafu\My Documents\Mail\OL Temp Attachments\Dust Memorandum 071210 (3).docx
objects (such as humans standing in the proximity of the train) are influenced by train speed, distance from the train, and the geometry of the train6. Li, et. al. analyzed the maximum wind velocity around a human body for a specific train speed as a function of human-train distance based on different train shape models:
1545.95496.34575.02319.1 24072.0 ddu v (Eq.7)
Where: u: the maximum wind velocity around human body near the train (m/s). d: human-train distance (m). v: train running speed (m/s). The range of train speeds specified for Eq. 7 are between 55.56 m/s and 97.22 m/s (between 124 mph and 217 mph) with a human-train distance between 1.0 m and 3.5 m. This raises questions about the validity of this equation to estimate aerodynamic forces from a High Speed train traveling at a speed of 220 mph. An induced wind speed profile comparison was graphed to determine the relative accuracy of using Eq 7 to estimated aerodynamic forces for train speeds of 220 mp compared to 217 mph (the upper bound of the train speed range for Eq 7). Figure 1 shows that Eq. 7 presents a similar trend when a train speed of 220 mph is used as compared to a train speed of 217 mph. Therefore Eq. 7 can be used to determine the induced wind speed profile as a function of distance from train body for train passing at 220 mph.
Induced Wind Speed from Passing Train
0.00
2.00
4.00
6.00
8.00
10.00
12.00
14.00
0 0.5 1 1.5 2 2.5 3 3.5 4Distance from Train Body (meter)
Induced W
ind Speed (m/s)
Train @ 217 mph Train @ 220 mph
Figure 1. Wind Speed Profile Comparison from Train at 220 mph and 217 mph
6 Li, Renxian, et.al, “A Study of the Influence of Aerodynamic Forces on a Human Body near a High-Speed Train, Aerodynamics of Heavy Vehicles”, Trucks, Buses, and Trains, 2008.
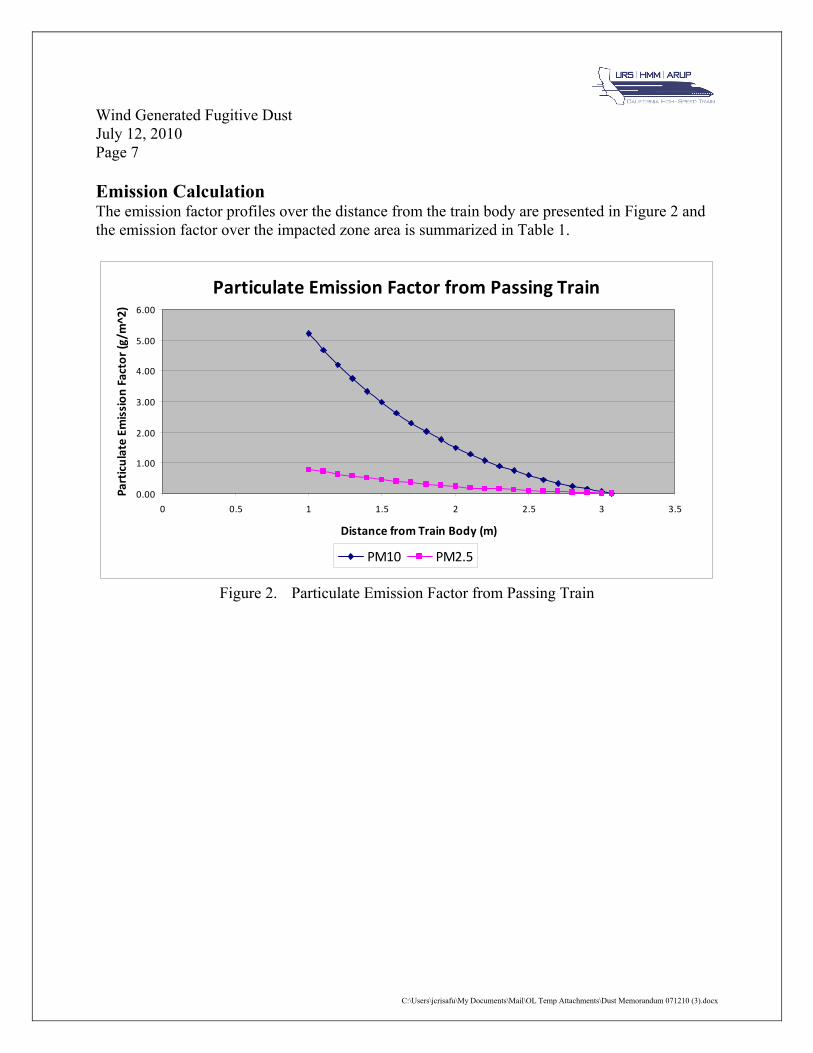
Wind Generated Fugitive Dust July 12, 2010 Page 7
C:\Users\jcrisafu\My Documents\Mail\OL Temp Attachments\Dust Memorandum 071210 (3).docx
Emission Calculation The emission factor profiles over the distance from the train body are presented in Figure 2 and the emission factor over the impacted zone area is summarized in Table 1.
Particulate Emission Factor from Passing Train
0.00
1.00
2.00
3.00
4.00
5.00
6.00
0 0.5 1 1.5 2 2.5 3 3.5
Distance from Train Body (m)
Particulate Emission Factor (g/m
^2)
PM10 PM2.5
Figure 2. Particulate Emission Factor from Passing Train
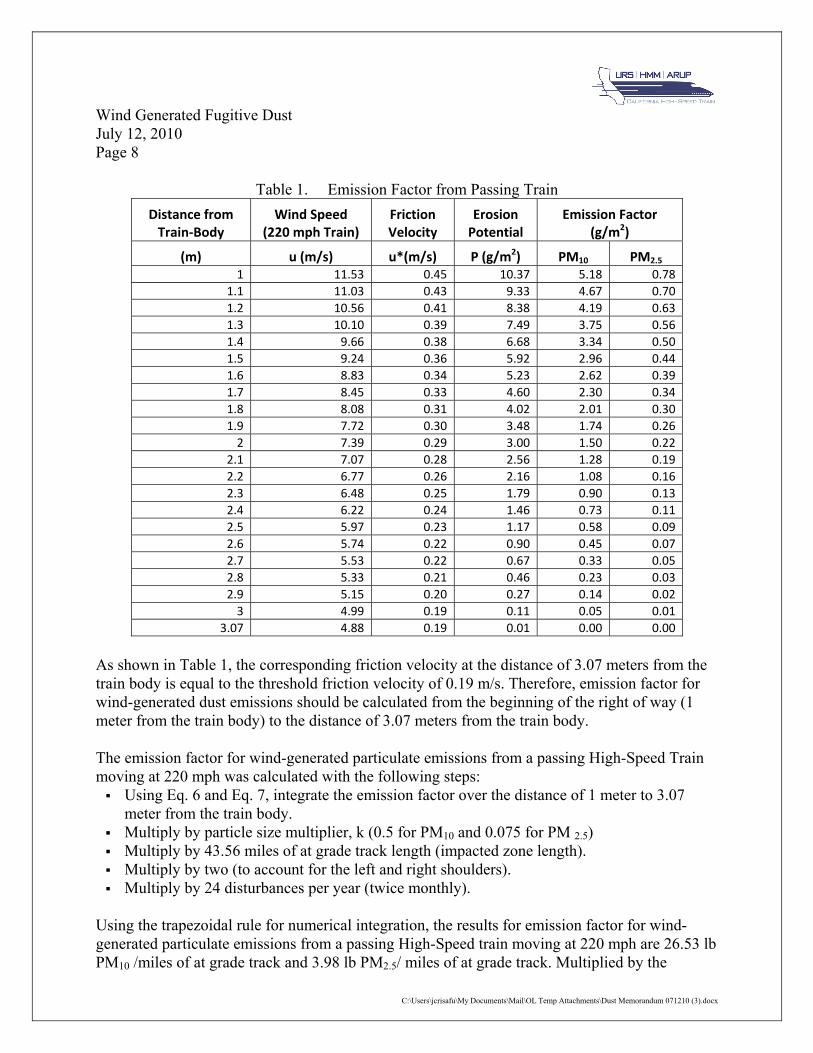
Wind Generated Fugitive Dust July 12, 2010 Page 8
C:\Users\jcrisafu\My Documents\Mail\OL Temp Attachments\Dust Memorandum 071210 (3).docx
Table 1. Emission Factor from Passing Train
Distance from Train‐Body
Wind Speed (220 mph Train)
Friction Velocity
Erosion Potential
Emission Factor (g/m2)
(m) u (m/s) u*(m/s) P (g/m2) PM10 PM2.5 1 11.53 0.45 10.37 5.18 0.78
1.1 11.03 0.43 9.33 4.67 0.70
1.2 10.56 0.41 8.38 4.19 0.63
1.3 10.10 0.39 7.49 3.75 0.56
1.4 9.66 0.38 6.68 3.34 0.50
1.5 9.24 0.36 5.92 2.96 0.44
1.6 8.83 0.34 5.23 2.62 0.39
1.7 8.45 0.33 4.60 2.30 0.34
1.8 8.08 0.31 4.02 2.01 0.30
1.9 7.72 0.30 3.48 1.74 0.26
2 7.39 0.29 3.00 1.50 0.22
2.1 7.07 0.28 2.56 1.28 0.19
2.2 6.77 0.26 2.16 1.08 0.16
2.3 6.48 0.25 1.79 0.90 0.13
2.4 6.22 0.24 1.46 0.73 0.11
2.5 5.97 0.23 1.17 0.58 0.09
2.6 5.74 0.22 0.90 0.45 0.07
2.7 5.53 0.22 0.67 0.33 0.05
2.8 5.33 0.21 0.46 0.23 0.03
2.9 5.15 0.20 0.27 0.14 0.02
3 4.99 0.19 0.11 0.05 0.01
3.07 4.88 0.19 0.01 0.00 0.00
As shown in Table 1, the corresponding friction velocity at the distance of 3.07 meters from the train body is equal to the threshold friction velocity of 0.19 m/s. Therefore, emission factor for wind-generated dust emissions should be calculated from the beginning of the right of way (1 meter from the train body) to the distance of 3.07 meters from the train body. The emission factor for wind-generated particulate emissions from a passing High-Speed Train moving at 220 mph was calculated with the following steps: Using Eq. 6 and Eq. 7, integrate the emission factor over the distance of 1 meter to 3.07
meter from the train body. Multiply by particle size multiplier, k (0.5 for PM10 and 0.075 for PM 2.5) Multiply by 43.56 miles of at grade track length (impacted zone length). Multiply by two (to account for the left and right shoulders). Multiply by 24 disturbances per year (twice monthly).
Using the trapezoidal rule for numerical integration, the results for emission factor for wind-generated particulate emissions from a passing High-Speed train moving at 220 mph are 26.53 lb PM10 /miles of at grade track and 3.98 lb PM2.5/ miles of at grade track. Multiplied by the
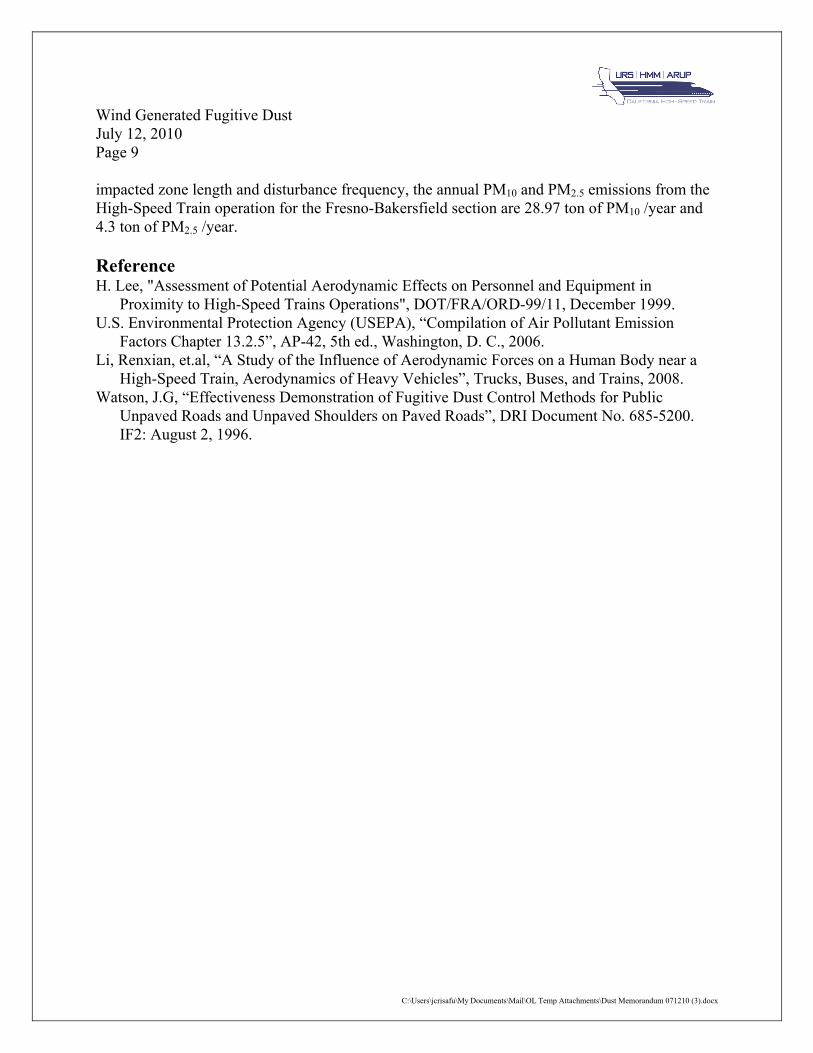
Wind Generated Fugitive Dust July 12, 2010 Page 9
C:\Users\jcrisafu\My Documents\Mail\OL Temp Attachments\Dust Memorandum 071210 (3).docx
impacted zone length and disturbance frequency, the annual PM10 and PM2.5 emissions from the High-Speed Train operation for the Fresno-Bakersfield section are 28.97 ton of PM10 /year and 4.3 ton of PM2.5 /year. Reference H. Lee, "Assessment of Potential Aerodynamic Effects on Personnel and Equipment in
Proximity to High-Speed Trains Operations", DOT/FRA/ORD-99/11, December 1999. U.S. Environmental Protection Agency (USEPA), “Compilation of Air Pollutant Emission
Factors Chapter 13.2.5”, AP-42, 5th ed., Washington, D. C., 2006. Li, Renxian, et.al, “A Study of the Influence of Aerodynamic Forces on a Human Body near a
High-Speed Train, Aerodynamics of Heavy Vehicles”, Trucks, Buses, and Trains, 2008. Watson, J.G, “Effectiveness Demonstration of Fugitive Dust Control Methods for Public
Unpaved Roads and Unpaved Shoulders on Paved Roads”, DRI Document No. 685-5200. IF2: August 2, 1996.