appendix a corrective action plan
TRANSCRIPT

P U B L I C R EV I E W D R AF T I N I T I AL S TU D Y / D R A F T MI TI G A T E D N EG A T I V E D E C L A R A TI O N J U N E 2 0 1 8
1 1 1 0 U N I V E R S I T Y AV E N U E M I X E D- U S E P RO J E C T B E R K E L E Y , C A
T:\CBE1702 1110 University\PRODUCTS\IS-MND\Public\1110 University Public Review.docx (06/14/18) A-1
APPENDIX A
CORRECTIVE ACTION PLAN

1 1 1 0 U N I V E R S I T Y AV E N U E M I X E D- U S E P RO J E C T B E R K E L E Y , C A
P U B L I C R EV I E W D R AF T I N I T I AL S TU D Y / D R A F T MI TI G A T E D N EG A T I V E D E C L A R A TI O N
J U N E 2 0 1 8
T:\CBE1702 1110 University\PRODUCTS\IS-MND\Public\1110 University Public Review.docx (06/14/18) A-2
This page intentionally left blank

Page i
CORRECTIVE ACTION PLAN
1110 UNIVERSITY AVENUE BERKELEY, CALIFORNIA
Prepared for
1110 UNIVERSITY AVENUE, LLC OAKLAND, CALIFORNIA
May 2016

Page ii
CORRECTIVE ACTION PLAN
1110 UNIVERSITY AVENUE BERKELEY, CALIFORNIA
Prepared for:
1110 UNIVERSITY AVENUE, LLC 4096 PIEDMONT AVENUE, UNIT 191
OAKLAND, CALIFORNIA
Prepared by:
STELLAR ENVIRONMENTAL SOLUTIONS, INC. 2198 SIXTH STREET
BERKELEY, CALIFORNIA 94710
May 11, 2016
Project No. 2016-14

Page iii
May 11, 2016
Ms. Jolanta Uchman San Francisco Bay Regional Water Quality Control Board 1515 Clay Street, Suite 1400 Oakland, CA 94612
Subject: Corrective Action Plan (CAP), Tower Cleaners, 1110 University Avenue, Berkeley, California Redevelopment (GeoTracker No. T10000002262; RWQCB File No. 01S0744)
Dear Ms. Uchman:
Stellar Environmental Solutions (Stellar Environmental) is pleased present this Corrective Action Plan (CAP) to the Regional Water Quality Control Board (Water Board) for the Towers Cleaner (Site) located at 1110 University Avenue, Berkeley, California. This CAP integrates data from Site soil, soil-gas, and groundwater investigations conducted since 2003 including a pilot soil vapor extraction remediation test and indoor air sampling conducted in 2015 and addresses comments raised in the Scoping Meeting for the site held at the Water Board offices on February 18, 2015. This CAP is being submitted to the Water Board on behalf of the Site owner, 1110 University, LLC. The property owner is committed to completing whatever remediation is required, given the development plans, to ultimately bring the site to regulatory closure or No-Further Action (NFA) status.
We declare, under penalty of perjury, that the information and/or recommendations contained in the attached document is true and correct to the best of my knowledge. Please call if (510) 644-3123 if you have any questions. Sincerely,
Henry Pietropaoli, PG Project Manager
Richard S. Makdisi, P.G. Principal Geochemist and President
cc: Mr. Stephen Parker, 1110 University, LLC

Page iv
TABLE OF CONTENTS
Section Page
1.0 INTRODUCTION AND BACKGROUND ..................................................................6
CAP Overview, Site Description and Historical Land Use ...........................................6 Site Description ..............................................................................................................7 Planned Redevelopment .................................................................................................7 Regulatory History and Status .......................................................................................8 Historical Site Investigation Work Summary (2003-2015) .........................................12
2.0 SITE CONCEPTUAL MODEL AND DATA GAP SUMMARY ..............................17
Site Conceptual Model .................................................................................................17 Geology and Hydrogeology .........................................................................................18 Potential Human and Ecological Risk .........................................................................19
3.0 CORRECTIVE ACTION EXCAVATION .................................................................21
Corrective Action Feasibility Screening ......................................................................21 Corrective Action Excavation Plan Scope of Work ....................................................21
4.0 SUB-SLAB VENTING SYSTEM (SSVS) .................................................................26
SSVS Objectives ..........................................................................................................26 SSVS Rationale and Design .........................................................................................26 SSVS Installation .........................................................................................................27
5.0 ADDITIONAL CAP ACTIVITIES AND TECHNICAL REPORTING ....................30
Pre- and Post- CAP Groundwater Monitoring Well Sampling ....................................30 Preferential Pathway, Offsite Well and Sensitive Receptor Study ..............................30 Indoor-Air Confirmation Sampling .............................................................................31 Technical Reporting .....................................................................................................32 Team Qualifications .....................................................................................................32
6.0 REFERENCES ............................................................................................................34
Appendices
Appendix A Historical Analytical Tables and Figures Appendix B Supporting Documents and Preliminary Redevelopment Drawings Appendix C SOPs and QA/QC Information
Page v
FIGURES
Figure Page
Figure 1 Site Location Map ................................................................................................10
Figure 2 Site Plan and Adjacent Land Use .........................................................................11
Figure 3 Distribution of Historical Sampling Results .......................................................16
Figure 4 Proposed Corrective Action Excavation ..............................................................25
Figure 5 SSVS Schematic ..................................................................................................29

Page 6
1.0 INTRODUCTION AND BACKGROUND
CAP OVERVIEW, SITE DESCRIPTION AND HISTORICAL LAND USE
Stellar Environmental Solutions, Inc (Stellar Environmental) is providing this Corrective Action Plan (CAP) on behalf of the site owners, 1110 University Avenue, LLC, represented by Mr. Stephen Parker. This CAP summarizes site history and evaluates past investigation findings data which are used to develop an initial site conceptual model for the site contaminants. Existing data gaps in the past work are addressed in this CAP which has the additional objective of conducting a remedial excavation and providing a barrier to prevent vapor intrusion into indoor air, allowing the site to be occupied by a future ground floor commercial and overlying residential tenants in the planned redevelopment of the property.
Objectives of the CAP:
Present and evaluate existing site conditions.
Conduct a remedial excavation of the contaminant source soil.
Collect additional soil and groundwater data to have greater confidence in, or provide data to refine, the preliminary site conceptual model.
Install a passive volatile organic compound barrier (liquid boot) membrane and a sub-slab venting system (SSVS) to prevent vapor intrusion into indoor air to allow near term occupancy of the proposed commercial/residential redevelopments.
Elements of the CAP: To accomplish the objectives stated in the preceding section and to satisfy Water Board requirements, this CAP includes the following elements:
A description of the nature and extent of the contaminants of concern at the site.
Identification of data gaps
The goals to be achieved by filling the stated data gaps.
Conduct a preferential pathway and sensitive receptor survey.
Conduct semi-annual groundwater monitoring of the Site wells.
Evaluation of the functionality of the proposed SSVS.
A description of the recommended implementation plan to allow near term occupancy.

Page 7
SITE DESCRIPTION
The Tower Cleaners is located in a mixed commercial residential area in Berkeley. The property totals approximately 6,700 square feet and is improved with a rectangular two-story building totaling approximately 11,000 square feet. The subject property is occupied by Tower Cleaners, a former dry cleaning facility and one rear residential on the ground floor, and residential apartments occupy the second floor. There is a current laundry business operating within the same space as the former dry cleaner but it operates as a clothes drop-off and pick-up outlet and does not include dry cleaning operations, which were stopped at the property by 2009. The immediately surrounding properties consist of commercial businesses adjacent to the north, a bar adjacent to the east, residential properties adjacent to the south, and donut shop and gymnasium adjacent to the west.
Figure 1 shows the general location of the Site. Figure 2 is a Site Plan showing the site boundaries, the building and other Site improvements, and adjacent land uses.
HISTORIC LAND USE
A 2003 Phase I site assessment conducted by AEI Consultants included the Site and the adjoining areas. The property has apparently been used as a dry cleaning facility for more than 40 years. The property was developed with the current building in the late 1940s. The Phase I reports that prior to being developed in the 1940s, the Site was vacant land.
PLANNED REDEVELOPMENT
The site development is currently in the early conceptual stages but the proposed Site plan provided by the property owner provides a general idea of what is contemplated. The property owner desires to have the redevelopment structure overlie the entire property area. The proposed building and will consist of ground floor commercial/retail units and a podium garage with a car stacker in the southern 1/3 of the property footprint and four floors of overlying residential units. The rear car stacker will be accessed via a 12 foot wide ramp along the western boundary of the property leading from University Ave. The maximum depth of the Site redevelopment will extend approximately 8 feet bgs in the partial basement area (which coincides with the areas of concern for the dry cleaner contamination). The basement floor (and ground level floor) will be underlain by a subslab venting system and liquid-boot (see section 4) to remedy vapor intrusion before being capped with concrete.
The preliminary redevelopment plans are included in Appendix B.

Page 8
REGULATORY HISTORY AND STATUS
Water Board Oversight
The Site investigations that have occurred between 2003 and 2015 have been reviewed by the Water Board (Case No. 01S0744). The Water Board’s concern at this time that the dry cleaning solvent PCE is present in soil, soil gas and groundwater at concentrations in excess of the applicable ESLs which could result in vapor intrusion risk into the planned residential units to be developed if not properly mitigated. Historical investigations have concluded that offsite groundwater impacts have been evaluated for offsite vapor intrusion concerns and are indicated to be of more minimal concern for adjacent or downgradient properties. The CVOC (and specifically the contaminant of concern (COC) PCE vapor intrusion risk to future residual site users’ needs to be mitigated, as addressed in their report.
The conclusion of the February 18, 2016 meeting with the Water Board is that though the MPE was successful in recovering significant contaminant mass, the most practical method to remove the source area contamination is to excavate it out during redevelopment of the property; specifically after the building is demolished and removed to soil grade and access to excavate the soil source area is available before new redevelopment building construction begins.
Regulatory correspondence is included in Appendix B.
Regulatory Liaison and CAP Response
Stellar Environmental understands that as the lead agency, the Water Board will oversee and ultimately make the evaluation for regulatory closure. While this CAP describes the corrective action excavation, data gap collection and installation of a passive SSVS for soil-gas venting that is to allow building occupancy, we recognize the longer term issue of achieving regulatory closure will depend on additional future characterization work, including potential additional groundwater characterization. In addition, we understand there may be some comment or request for additional actions as a result of the Water Boards review of this CAP. Any future site work to this end will be based on input from the Water Board.
Applicable Regulatory Environmental Screening Level Criteria
The proposed redevelopment will consist of ground floor commercial/retail units and a podium garage with four floors of overlying residential units, thus the Water Board commercial environmental screening limits (ESLs) are the applicable criteria to be applied to the Site. The following ESLs (Water Board February 2016) are applicable to the Site redevelopment:
1) The soil ESL for exposure risk at commercial properties is 2.7 mg/kg and 0.42 for residential sites. It should be noted the potential risk of direct exposure to soil will be mitigated by concrete

Page 9
capping installed in the Site redevelopment making soil inaccessible to direct exposure. The most immediate risk of direct exposure to soil is construction trench workers during the earthworking phase of the redevelopment for which the ESL is 33 mg/kg; 2) The potential toxic vapor intrusion into the building air-space is the primary risk to Site users and thus the commercial ESL for PCE of 2,100 µg/m3 in soil-gas and the ESL for indoor air is 2.1µg/m3 must be met; and 3) Groundwater with potential use as drinking water must ultimately meet the ESL, which for PCE is 5.0 µg/L, or demonstrate a decreasing concentration trend.

Figure 1By: MJC APRIL V2016Tower Cleaners
1100 University Ave., Berkeley, CA
SITE LOCATION MAP
�
2013
-12-
01
ProjectlocationProjectlocation
California
SITE

Figure 2By: MJC APRIL 2016Tower Cleaners
1100 University Ave., Berkeley, CA
SITE PLAN
2015
-70-
09
H i s t o r i c a l t r ac e o f S t r a w b e r r y C r e e k
MW-1
Property boundary
Groundwater monitoring wells
FORMER DRYCLEANINGMACHINES
YARD
YARD
LEGEND

Page 12
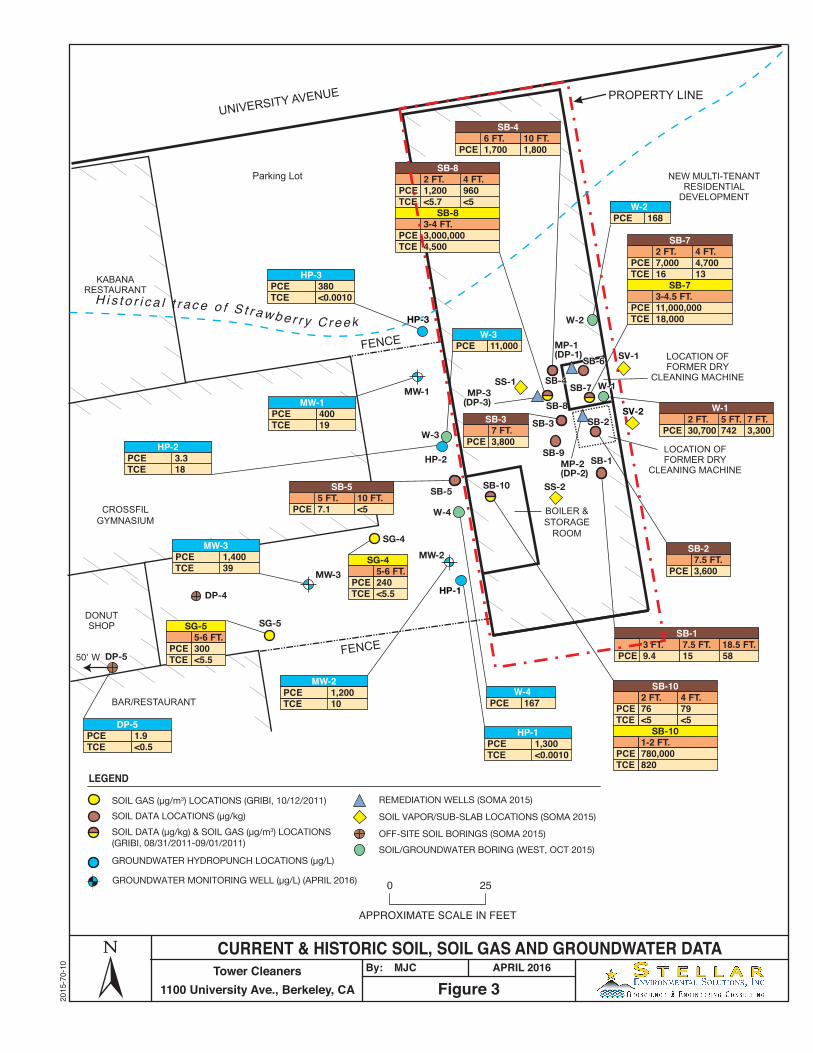
HISTORICAL SITE INVESTIGATION WORK SUMMARY (2003-2015)
AEI Consultants conducted a Phase I Investigation in 2003 that revealed recognized the environmental conditions associated with the Site that required further investigation and recommended a subsurface investigation to determine whether the on-site dry cleaning operations have adversely impacted the subsurface of the subject property.
Since investigation at the former Tower cleaner began in 2003, there have been 19 exploratory bores where soil sample data has been collected. Three groundwater wells installed and five soil-gas samples collection points, three multi-phase extraction (MPE) wells, two soil-gas samples, two sub-slab soil-gas sampling probes, and one indoor air sample. These data have been used to provide an understanding of subsurface conditions, distribution of contamination and a site conceptual model, presented below. Historical site investigation work was completed by AEI (2003), Gribi (2006, 2011), SOMA (2015) and West (2015).
Figure 3 shows the location and analytical data (the most recent 2014 data in the case of the three groundwater wells) at the locations where the data was collected. Historical analytical data and figures are included in Appendix A.
Gribi 2006 and 2011 Soil, Soil-Vapor and Groundwater Sampling Results
The 2006 Gribi report was not available to review. In 2011 investigation reported soil samples collected from source area borings SB-6 through SB-9 showed PCE concentrations ranging from 0.96 milligrams per kilogram (mg/kg) in SB-8 at 4.0 feet in depth to 13 mg/kg in SB-6 at 1.5 feet in depth.
The three indoor soil vapor samples, SB–7-VS, SB-8-VS, and SB-10-VS, showed PCE concentrations ranging from 780,000 micrograms per cubic meter (ug/m3) in SB-10-VS (1.0 - 2.0 feet in depth) to 11,000,000 µg/m3 in SB-7-VS (3.0 - 4.5 feet in depth). Soil vapor samples at outside downgradient locations, SG-4 and SG-5, showed PCE concentrations of 240 µg/m3 and 300 µg/m3, respectively.
Wells MW-1, MW-2 and MW-3 were sited in the general location of previous Gribi Associates soil borings HP-1, HP-2, and HP-3. The wells were set at a total depth of 25 feet bgs and constructed of PVC with 0.020-inch slotted casing placed from approximately 25 feet to 1 0 feet below bgs, with filter sand was placed around to approximately 1 foot above the top of screen, or a depth of approximately 9 feet bgs. Ground water samples co l l ec t ed i n 2010 , from wells MW- 1, MW-2, and MW-3 showed respective PCE concentrations of 490

Page 13
ug/L, 1 ,400 ug/L, and 1 ,1 00 ug/L. Respective TCE concentrations in wells MW-1, MW-2, and MW-3 were reported at 12 ug/L, 7.4 ug/L, and 24 ug/L.
The 2011 investigation concluded that relatively low levels of PCE are present in shallow soils beneath the former dry cleaning areas in the Site building. These low-level soil PCE impacts, together with underlying groundwater PCE impacts and PCE impacts below the building slab, have resulted in elevated PCE vapor impacts in the shallow permeable layers beneath the Site building. This investigation indicates no significant risk to the downgradient indoor air PCE exposure pathway. The majority of the contaminant mass is clearly expressed in the soil vapor data.
2014 to 2015 SOMA Engineers Investigation Activities
Soil and Grab-groundwater Sampling
In December and January 2015, SOMA advanced five soil borings (DP-1 through DP-5). DP-1, DP2 and DP-3 were installed within the source area location of the former dry-cleaning machine. Bore DP-1 extended 17.5 feet bgs and bores DP-3 and DP-2 extended to 15 feet bgs. DP-4 was advanced to 48 feet bgs and DP-5 was advanced to 25 feet bgs. Soil samples were collected every two feet in DP-1 through DP-3 and every five feet in DP-4 and DP-5. Grab groundwater samples were collected from each soil boring.
PCE was either below laboratory-reporting limits or detected below t h e c o m m e r c i a l ESL of 2.70 mg/kg in all soil samples except in DP-2 at 2.0 feet and DP-3 at 2.0 feet at 1.4 mg/kg and 1.2 mg/kg, respectively.
PCE in grab groundwater collected from soil borings advanced in 2014 ranged from 1.90 µg/L in offsite bore DP-5 to 7,300 µg/L in bore DP-2 beneath the Site source area. PCE concentrations in DP-1 through DP-4 were above the ESL of 5 µg/L for commercial land use where groundwater is a current or potential source of drinking water. Bore DP-4 that extended to 48 feet bgs detected a concentration of 22 µg/L PCE in groundwater.
Groundwater Monitoring of Site Wells
On December 24, 2014, the three monitoring wells (MW-1, MW-2, and MW-3) were sampled. PCE concentrations ranged from 460 µg/L in MW-2 to 2,800 µg/L in MW-3 and were above the ESL of 5 µg/L for commercial land use. Since the previous monitoring event (May 2014), PCE increased in MW-3 and decreased in MW-1 and MW-2.

Page 14
Soil-Gas and Sub-Slab Gas Survey
On January 29, 2015, SOMA implemented a soil gas survey on and adjacent to the property boundary to establish if vapor intrusion is a complete exposure pathway. Two soil gas sampling probes (SV-1 and SV-2) were advanced to a depth of 5 feet bgs in the alleyway along the eastern property boundary and two sub-slab sampling probes (SS-1 and SS-2) were advanced inside the site building.
In SV-1 several VOCs were detected. However, all detections were below the ESLs. In SV-2, PCE was detected at 9,100 µg/m3 which is greater than the ESL (2,100 µg/m3); all other VOCs were below laboratory reporting limits. In duplicate sample SV-2D, PCE was detected above the ESL similar as in the original sample. In sub-slab samples SS-1 and SS-2, PCE was detected at 21,000 µg/m3 and 130,000 µg/m3, respectively and all other VOCs were below laboratory reporting limits
Indoor Air Survey
On January 29, 2015, SOMA collected an indoor air sample from inside the building. Prior to the sample collection, SOMA conducted a site inspection to locate areas where chemicals could possibly be released into the environment. An 8-hour sample was collected using 6-liter Summa™ canister. The sample was collected in open area at approximately 3 feet above floor level. The analytical results showed that except for PCE concentrations, all other contaminants were below the indoor air ESLs. PCE was detected at 170 µg/m3 in excess of the commercial ESL = 2.7 µg/m3.
Multi-phase Extraction Pilot Test, Extraction and Mass Removal Rates
SOMA installed three 2-inch diameter Multi-Phase Extraction Wells (MPE-1, MPE-2, and MPE-3), adjacent to borings DP-1, DP2 and DP-3 in the dry cleaning source area. Each of the MPE wells were screened from 3-10 feet bgs. The multi-phase extraction pilot test conducted by SOMA, operated for approximately 95 hours between February 12 to February 20, 2015 removed an estimated total mass of 365.38 lbs. of PCE and TCE, not including contaminant mass contained in an approximately 100 gallons of associated extracted groundwater during the test. Startup maximum vapor extraction at the three vapor extraction wells was 2,510,000 µg/m3 with a reduction to 601,000 µg/m3 at the end of the 95 hour extraction. Mas removal rates went from 41.1 pounds per day to 10.1 µg/m3 pounds per day PCE at the end of the extraction.

Page 15
2015 West Environmental Services
In October 2015, WEST collected soil, soil gas and groundwater samples from four borings (W1 to W-4) to further characterize the Site conditions. Three soil samples were collected from boring W-1 advanced in the source area beneath the concrete floor of the building. The soil samples were collected at 2-feet, 5-feet and 7-feet below the top of the approximately 6-inch thick concrete foundation slab. Analysis of the soil samples collected at approximately 2, 5, and 7-feet bgs from boring W-1, located in the source area, revealed PCE at 30,700 g/kg at 2-feet bgs; 742 g/kg at 5-feet bgs; and 3,300 g/kg at 7-feet bgs exceeding its commercial ESL of 2.7 mg/kg.
A soil-gas sample collected in 2015 from a temporary vapor probe constructed within boring
W-1 revealed VOCs including: PCE at 5,480 g/m3 and TCE at 172 g/m3, but only PCE was
above its commercial ESLs of 2,100 g/m3. Other VOCs were not detected in the soil gas sample above their respective laboratory reporting limits.
Three groundwater samples were collected from three borings, W-2, W-3 and W-4. The groundwater samples were collected at depths of approximately 28.5-feet, 31-feet, and 31.5-feet, respectively. Analysis of the three groundwater samples showed 11,000 g/l PCE in bore W-3 16.8 g/l PCE in W-2 and 167 g/L PCE in bore W-4.
APPROXIMATE SCALE IN FEET
0 25
Figure 3By: MJC APRIL 2016Tower Cleaners
1100 University Ave., Berkeley, CA
CURRENT & HISTORIC SOIL, SOIL GAS AND GROUNDWATER DATA
2015
-70-
10
PROPERTY LINEUNIVERSITY AVENUE
FENCE
FENCE
Parking Lot
KABANARESTAURANT
CROSSFILGYMNASIUM
DONUTSHOP
BAR/RESTAURANT
LOCATION OFFORMER DRY
CLEANING MACHINE
LOCATION OF FORMER DRY
CLEANING MACHINE
NEW MULTI-TENANTRESIDENTIAL
DEVELOPMENT
MW-1
MW-2
MW-3
HP-2
SB-4SB-4
SB-5
SB-3
SB-1
LEGEND
GROUNDWATER MONITORING WELL (µg/L) (APRIL 2016)
REMEDIATION WELLS (SOMA 2015)
SOIL VAPOR/SUB-SLAB LOCATIONS (SOMA 2015)
OFF-SITE SOIL BORINGS (SOMA 2015)SOIL/GROUNDWATER BORING (WEST, OCT 2015)
GROUNDWATER HYDROPUNCH LOCATIONS (µg/L) (GRIBI, 04/2006)
SOIL GAS (µg/m3) LOCATIONS (GRIBI, 10/12/2011)SOIL DATA LOCATIONS (µg/kg) (AEI, 10/2003)
SOIL DATA (µg/kg) & SOIL GAS (µg/m3) LOCATIONS (GRIBI, 08/31/2011-09/01/2011)
HP-2
TCE3.318
PCE
HP-1
<0.0010TCE1,300PCE
HP-3
<0.0010TCE380PCE
MW-3
TCE1,40039
PCE
MW-2
TCE1,20010
PCE
DP-5
TCE1.9<0.5
PCE
MW-1
TCE40019
PCE
5 FT. 10 FT.SB-5
7.1 <5PCE
6 FT. 10 FT.SB-4
1,700 1,800PCE
2 FT. 4 FT.SB-8
1,200 960PCE<5.7 <5TCE
3-4 FT.SB-8
3,000,000PCE4,500TCE 2 FT. 4 FT.
SB-7
7,000 4,700PCE16 13TCE
3-4.5 FT.SB-7
11,000,000PCE18,000TCE
3 FT. 7.5 FT.SB-1
9.418.5 FT.
15 58PCE
7 FT.SB-3
3,800PCE
5-6 FT.SG-5
300PCE<5.5TCE
5-6 FT.SG-4
240PCE<5.5TCE
7.5 FT.SB-2
3,600PCE
2 FT.W-1
30,7005 FT.742
7 FT.3,300PCE
SB-2
2 FT. 4 FT.SB-10
76 79PCE<5 <5TCE
1-2 FT.SB-10
780,000PCE820TCE
W-2 168PCE
W-311,000PCE
W-4167PCE
BOILER &STORAGE
ROOM
HP-1HP-1
SB-10
SB-7
SV-1
W-2
W-3
W-4
SS-1
SS-2
SB-6SB-6
W-1W-1
MP-1(DP-1)MP-1(DP-1)
SG-4
SG-5
DP-4
DP-550' W
SB-8MP-3
(DP-3)
MP-2(DP-2)
SB-9
SV-2SV-2
H i s t o r i c a l t r ac e o f S t r a w b e r r y C r e e k HP-3HP-3
Stellar Environmental Solutions Page 17
2.0 SITE CONCEPTUAL MODEL AND DATA GAP SUMMARY
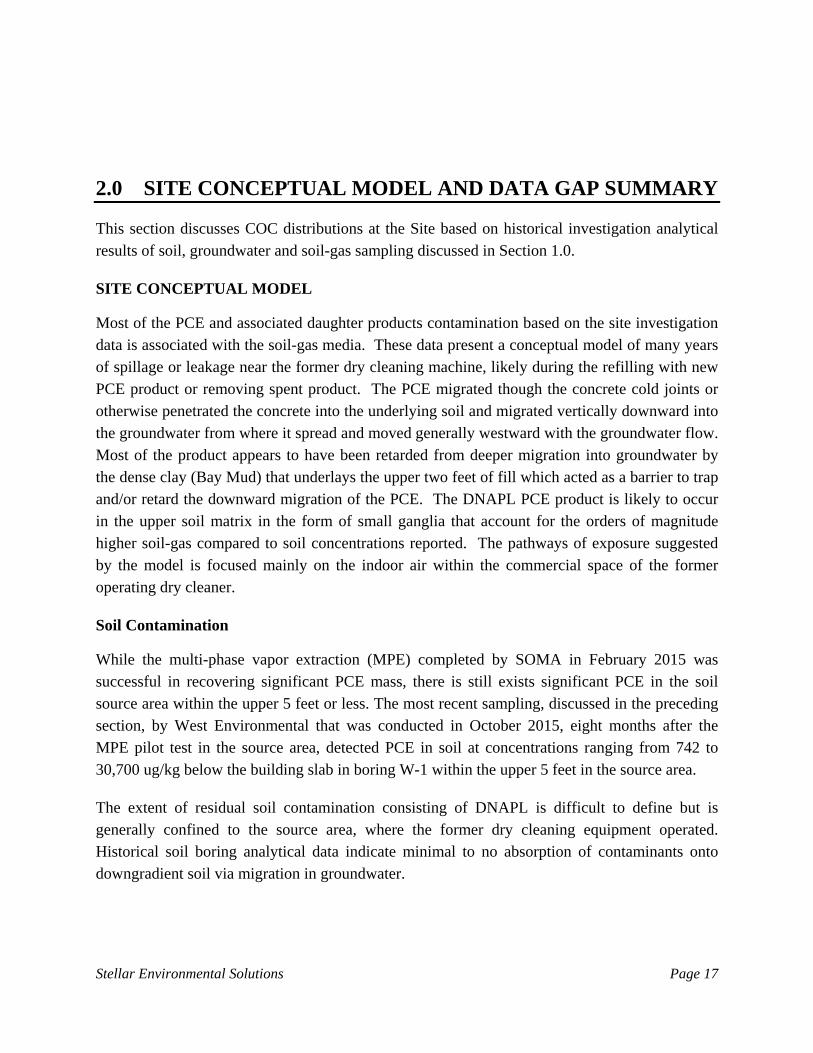
This section discusses COC distributions at the Site based on historical investigation analytical results of soil, groundwater and soil-gas sampling discussed in Section 1.0.
SITE CONCEPTUAL MODEL
Most of the PCE and associated daughter products contamination based on the site investigation data is associated with the soil-gas media. These data present a conceptual model of many years of spillage or leakage near the former dry cleaning machine, likely during the refilling with new PCE product or removing spent product. The PCE migrated though the concrete cold joints or otherwise penetrated the concrete into the underlying soil and migrated vertically downward into the groundwater from where it spread and moved generally westward with the groundwater flow. Most of the product appears to have been retarded from deeper migration into groundwater by the dense clay (Bay Mud) that underlays the upper two feet of fill which acted as a barrier to trap and/or retard the downward migration of the PCE. The DNAPL PCE product is likely to occur in the upper soil matrix in the form of small ganglia that account for the orders of magnitude higher soil-gas compared to soil concentrations reported. The pathways of exposure suggested by the model is focused mainly on the indoor air within the commercial space of the former operating dry cleaner.
Soil Contamination
While the multi-phase vapor extraction (MPE) completed by SOMA in February 2015 was successful in recovering significant PCE mass, there is still exists significant PCE in the soil source area within the upper 5 feet or less. The most recent sampling, discussed in the preceding section, by West Environmental that was conducted in October 2015, eight months after the MPE pilot test in the source area, detected PCE in soil at concentrations ranging from 742 to 30,700 ug/kg below the building slab in boring W-1 within the upper 5 feet in the source area.
The extent of residual soil contamination consisting of DNAPL is difficult to define but is generally confined to the source area, where the former dry cleaning equipment operated. Historical soil boring analytical data indicate minimal to no absorption of contaminants onto downgradient soil via migration in groundwater.

Stellar Environmental Solutions Page 18
Groundwater Contamination Distribution and Origins
A PCE plume is associated with the three groundwater wells has been reported in the historical groundwater monitoring events. The PCE leakage at the source appears to have had limited impact on groundwater due to the dense clay (Bay Mud) that underlays the upper two feet of fill providing a barrier to rapid migration to groundwater. However the most recent groundwater monitoring conducted by Soma Engineers in December 2014 compared to the previous May 2014 monitoring event showed a decrease in PCE concentration in wells MW-1 and MW-2 and an increase in the further downgradient well MW-3, suggesting that the contaminant mass is slowly migrating downgradient. In addition, groundwater collected from bore DP-4 in 2014 detected a concentration of 22 µg/L PCE in groundwater at 48 feet bgs. The width of the PCE groundwater plume has not been fully delineated.
While the concentrations in the groundwater monitoring wells are above the drinking water MCL of 3 µg/L for PCE, the most recent 2015 Soma Engineers grab groundwater data indicate rapid attenuation to only 1.9 µg/L PCE detected within 375 feet downgradient (bore DP-5), suggest groundwater is not as much a concern as addressing the high concentrations in the soil-gas media and shallow soil where Dense Non Aqueous Phase Liquid (DNAPL) likely exists at the source area.
Soil-Gas Contaminants
Historical investigations have determined that potential vapor intrusion, the primary risk to Site users exists. PCE detected in soil-gas and sub-slab in recent January and October 2015 investigation sampling in the source area ranged from 5,480 to 130,000 µg/m3, well above the commercial ESL of 2,100 µg/m3.
Appendix A contains historical soil, groundwater, sub-slab vapor, and indoor air analytical data.
GEOLOGY AND HYDROGEOLOGY
Local Geology
The mean elevation of the site is approximately 55 feet above mean sea level with a general topographic gradient in the Site vicinity toward the west (toward San Francisco Bay).
The S i t e is underlain by Quaternary alluvial fan deposits of gravelly sand, and weakly to moderately consolidated, slightly to deeply weathered, gravelly sand with interbedded silt and clay. Based on 2011 data reported by Gribi, soil encountered in the four deeper borings (SB-7 through SB-10) generally consisted of sandy gravel and gravelly sand (fill materials) down to about two feet in depth, followed by dark grey dense clay (Bay Mud) to at least four feet in

Stellar Environmental Solutions Page 19
depth. In borings SB-7 and SB-8, a gravelly sand to sandy gravel was encountered from approximately four feet to five feet total depth. This sand/gravel unit was not encountered in borings SB-9 and SB-10, which encountered Bay Mud from two feet to five feet total depth. The two outside vapor sample borings, SG-4 and SG-5, encountered Bay Mud clays from about one foot to five feet in depth, followed by tan gravelly silt from five feet to six feet total depth. The Soma 2014 investigation reported multiple interbedded layers of silty lean clays, clayey silts, sandy lean clays, silty sands with gravel and lean clays encountered boring advancement. Historical boring logs are included in Appendix A.
Hydrogeology
The Site is within the East Bay Plain Sub-basin of the Santa Clara Valley Groundwater Basin. The East Bay Plain Sub-basin is a northwest trending alluvial plain bounded on the north by San Pablo Bay, on the east by the contact with Franciscan Basement rock, on the south by the Niles Cone Groundwater Basin. The East Bay Plain Basin extends beneath San Francisco Bay to the west. The East Bay Plain sub-basin aquifer system consists of unconsolidated sediments of Quaternary age.
Based on data obtained during the Soma December 2014 groundwater monitoring event, conducted by Soma Engineers, the depth to groundwater is approximately 7-8 feet below ground surface (bgs) and flows northwesterly at a gradient of 0.021 feet/feet, generally toward San Francisco Bay. Soma reported groundwater was first encountered in borings DP-1 through DP-5 between 20 and 26 feet bgs and equilibrated between 12.68 and 24.03 feet bgs.
Surface Water Bodies
The nearest surface water body is San Francisco Bay, located approximately 4,600 feet west of the site. The 2003 Phase I reported that Strawberry Creek traversed the property from east to west prior to the Site development in the 1940. The creek is currently culverted beneath University Avenue to the north of the Site. Inspection of historical documents indicate the historical trace of the creek was located at least 25 feet north of the historical dry cleaning source area suggesting that the former trace of the creek is unlikely to act as a subsurface preferential pathway for Site contaminant migration.
POTENTIAL HUMAN AND ECOLOGICAL RISK
The Hazardous Waste Control Act establishes the applicable standards for stockpiling, transporting, disposing, and treating hazardous soil during Site corrective excavation remediation activities to ensure minimal human and environmental impact during redevelopment earthwork

Stellar Environmental Solutions, Inc. Page 20
Risk to Humans
Human exposure can occur through three media: soil, groundwater, or gas (vapor). Potential toxic vapor intrusion into the building air-space is the primary risk and exposure through soil or groundwater by ingestion or direct exposure scenario is the least plausible in this case based on both a lack of a likely exposure scenario and the relatively low COC concentrations found in soil. Although the soil is currently beneath the building concrete slab floor, there is potential for site workers to come into contact with the soil during remedial work and/or redevelopment thus, soil exposure is also considered a viable pathway of exposure.
Considering the current state of development and that planned for the proposed redevelopment at the Site (commercial/industrial with a slab-on-grade building), and the lack of any direct exposure to groundwater via ingestion or any other viable exposure, groundwater is not a significant risk to occupants. Groundwater in this area of Berkeley is an unlikely source of drinking water; the site is zoned as commercial/industrial and is located in a groundwater management zone indicated by the East Bay Plains Beneficial Use Study, San Francisco Bay (Water Board, 1999) as an “unlikely drinking water source”. However, the Water Board’s Basin Plan defaults to the most restrictive groundwater use, use of groundwater as drinking water; therefore, this Site uses the MCL for PCE of 3 ug/L as the cleanup goal.
Risk to the Environment
The nearest surface water body is San Francisco Bay located 4,600 feet to the west of the site. Based on this distance and the area of the groundwater plume, it is unlikely that the contaminant source will reach this sensitive receptor, however a sensitive receptor study will be conducted as part of the CAP implementation.

Stellar Environmental Solutions, Inc. Page 21
3.0 CORRECTIVE ACTION EXCAVATION
The historical site investigations have identified the presence of PCE as the chemical of potential concern with concentrations of greatest regulatory concern in soil, soil-gas, indoor air and groundwater at the Site.
CORRECTIVE ACTION FEASIBILITY SCREENING
The options for other feasible corrective action technology are limited by the site constraints and the indication of shallow location of the apparent PCE contamination. While a full Water Board Feasibility Study (FS) is usually completed that includes cost evaluation for each feasible method, in this case, due to both the lack of other viable remedies, and the client’s inability to contract for a fuller Corrective Action Plan format, the preferred alternative is presented below. In brief, the other alternatives eliminated were:
No Action or Monitoring Natural Attenuation (MNA): This is not acceptable because it leaves a viable pathway of exposure to the current building tenants given the concentrations in soil gas reported, and the lack of any source removal inhibits achieving a key regulatory site closure criteria;
Soil Vapor Extraction (SVE): This remedy is problematic at this particular site due to the highest concentrations in soil being in the shallow (< 5 feet) of soil and thus vacuum short-circuiting to the surface is highly probable making the remedy marginally effective; and
In-Situ Biological (Chemical) Treatment: This would be affective for addressing the residual groundwater contamination and deeper soils but not the shallow soil and soil-gas where the majority of the contaminant mass occurs. In-situ treatment would be effective to augment the primary removal remedy by placement of bioremediation product at the base of excavation.
For the above reasons, a program excavation is the preferred remedy, as described below.
CORRECTIVE ACTION EXCAVATION PLAN SCOPE OF WORK
The intention of this CAP is to meet the data requirements to support the proposed residential development plans and ultimately regulatory no-further action. In order to accomplish the work
Stellar Environmental Solutions Page 22 Y:\PROJECTS\2016-Active Projects\2016-14-Tower Cleaner CAP & RMP\REPORTS\Corrective Action Plan-Tower Cleaners -April-2016.doc
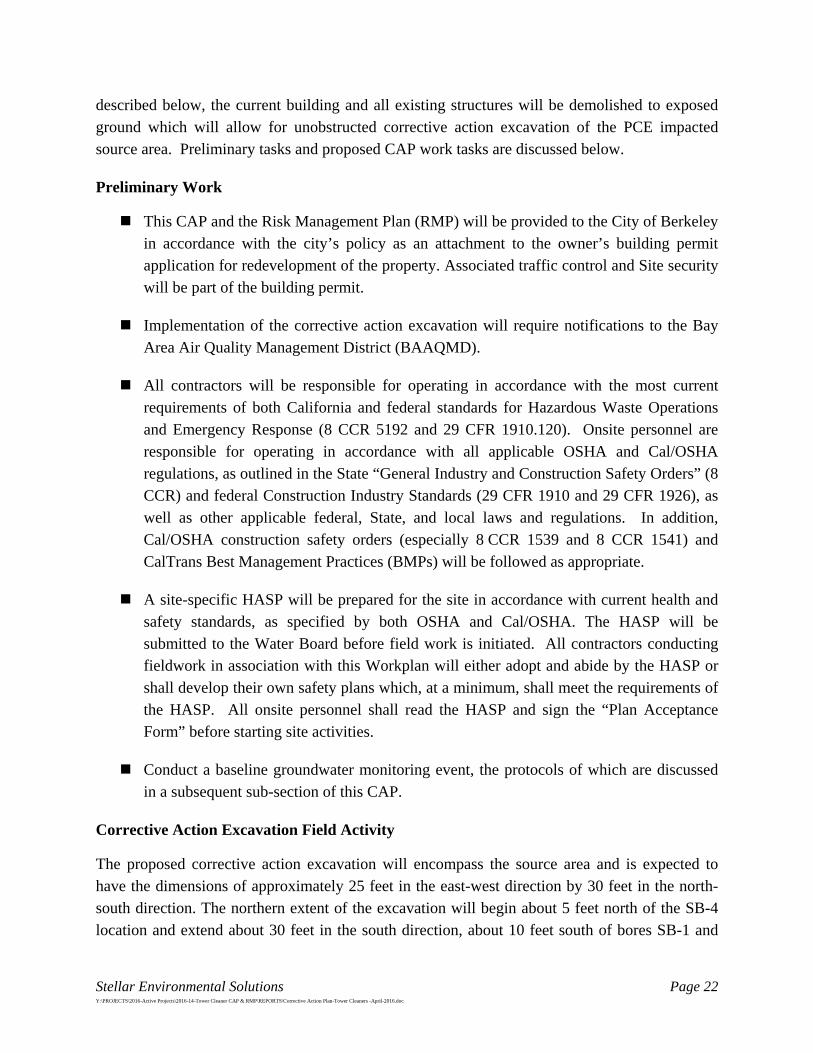
described below, the current building and all existing structures will be demolished to exposed ground which will allow for unobstructed corrective action excavation of the PCE impacted source area. Preliminary tasks and proposed CAP work tasks are discussed below.
Preliminary Work
This CAP and the Risk Management Plan (RMP) will be provided to the City of Berkeley in accordance with the city’s policy as an attachment to the owner’s building permit application for redevelopment of the property. Associated traffic control and Site security will be part of the building permit.
Implementation of the corrective action excavation will require notifications to the Bay Area Air Quality Management District (BAAQMD).
All contractors will be responsible for operating in accordance with the most current requirements of both California and federal standards for Hazardous Waste Operations and Emergency Response (8 CCR 5192 and 29 CFR 1910.120). Onsite personnel are responsible for operating in accordance with all applicable OSHA and Cal/OSHA regulations, as outlined in the State “General Industry and Construction Safety Orders” (8 CCR) and federal Construction Industry Standards (29 CFR 1910 and 29 CFR 1926), as well as other applicable federal, State, and local laws and regulations. In addition, Cal/OSHA construction safety orders (especially 8 CCR 1539 and 8 CCR 1541) and CalTrans Best Management Practices (BMPs) will be followed as appropriate.
A site-specific HASP will be prepared for the site in accordance with current health and safety standards, as specified by both OSHA and Cal/OSHA. The HASP will be submitted to the Water Board before field work is initiated. All contractors conducting fieldwork in association with this Workplan will either adopt and abide by the HASP or shall develop their own safety plans which, at a minimum, shall meet the requirements of the HASP. All onsite personnel shall read the HASP and sign the “Plan Acceptance Form” before starting site activities.
Conduct a baseline groundwater monitoring event, the protocols of which are discussed in a subsequent sub-section of this CAP.
Corrective Action Excavation Field Activity
The proposed corrective action excavation will encompass the source area and is expected to have the dimensions of approximately 25 feet in the east-west direction by 30 feet in the north-south direction. The northern extent of the excavation will begin about 5 feet north of the SB-4 location and extend about 30 feet in the south direction, about 10 feet south of bores SB-1 and

Stellar Environmental Solutions Page 23 Y:\PROJECTS\2016-Active Projects\2016-14-Tower Cleaner CAP & RMP\REPORTS\Corrective Action Plan-Tower Cleaners -April-2016.doc
SB-10. The width of the excavation will extend from the eastern property line to approximately 25 toward the west. A depth of approximately 5 feet bgs is the target depth. Based on a 25-foot wide by 30 foot long excavation that is 5 feet deep, the estimated volume of soil expected to be removed for this discovery/removal action is about 140 cubic yards.
Excavate for offsite disposal an area of PCE contaminated soil extrapolated from historical investigations described in the previous section as being approximately 30-foot by 25-foot by 10-foot-deep area, in the area of the former dry cleaner machine. The excavation is designed to both remove the indicated source area PCE and associated daughter products and create a partial basement for the building as reflected in their plans.
Approximately 278 cubic yards (or an estimated 444 tons using a 1.6 multiplier for CY to tons) of potentially PCE contaminated soil is expected to be generated during the corrective action excavation. More soil than the source area indicated is to be excavated as part of the proposed development but the area mentioned is the area where residual contamination is expected to be. Stellar Environmental will profile the soil for landfill acceptance.
The excavated source spoils will be stockpiled on and covered with 20 mil visqueen plastic or placed in a roll-off bin, and surrounded by wattling or similar erosion and water control barrier and secured pending analysis and off-haul for disposal to a landfill facility. Multiple sampling will be collected from the stockpile for disposal profiling analysis of Site identified contaminants for all soil to be exported from the site.
Health and safety monitoring using a PID will be used to monitor vapor and establish any necessary exclusion zone and other health and safety provisions.
Air and dust monitoring will take place during the excavation stage and appropriate protective personal health and safety equipment (respirators, etc.) and measures used based on air monitoring data;
Complete surface soil-gas survey using a PID and conduct sidewall and base of excavation confirmation sampling to document residual concentrations of PCE and potentially do deeper or lateral spot excavations;
Soil samples will be submitted to an Environmental Laboratory Accreditation Program (ELAP)-certified laboratory and analyzed for VOCs via EPA Method 8260B for EPA 8010 analytes. Soil samples will be collected using an Encore™ sampler or equivalent.

Stellar Environmental Solutions Page 24 Y:\PROJECTS\2016-Active Projects\2016-14-Tower Cleaner CAP & RMP\REPORTS\Corrective Action Plan-Tower Cleaners -April-2016.doc
Potentially place bioremediation compound to enhance reductive dechlorination in the base of the excavation before backfilling to grade with permeable material if indication of significant residual contamination is found at the 9 foot bgs base level;
Stellar Environmental Standard Operating Procedures (SOP’s) describing air and dust monitoring and soil sample collection protocols and procedures are contained in Appendix C.
The area of the proposed corrective action excavation is shown on Figure 4. The preliminary architectural plans for the development are contained in Appendix B.

APPROXIMATE SCALE IN FEET
0 25
Figure 4By: MJC APRIL 2016Tower Cleaners
1100 University Ave., Berkeley, CA
LOCATION OF CORRECTIVE ACTION EXCAVATION
2015
-70-
11
U N I V E R S I T Y A V E N U E
PROPERTYLINE
FENCE
FENCE
Parking Lot
KABANARESTAURANT
CROSSFITGYMNASIUM
DONUTSHOP
BAR/RESTAURANT
LOCATION OFFORMER DRY
CLEANING MACHINE
LOCATION OF FORMER DRY
CLEANING MACHINE
NEW MULTI-TENANTRESIDENTIAL
DEVELOPMENT
MW-1
MW-2
MW-3
HP-2
SB-4SB-4
SB-5
SB-3SB-3
SB-1SB-1
LEGEND
GROUNDWATER MONITORING WELL (µg/L) (2014)
REMEDIATION WELLS (SOMA 2015)
SOIL VAPOR/SUB-SLAB LOCATIONS (SOMA 2015)
OFF-SITE SOIL BORINGS (SOMA 2015)SOIL/GROUNDWATER BORING (WEST, OCT 2015)
PROPOSED CAP EXCAVATION
EQUILIBRATED GROUNDWATER (2014)
GROUNDWATER HYDROPUNCH LOCATIONS (µg/L) (GRIBI, 04/2006)
SOIL GAS (µg/m3) LOCATIONS (GRIBI, 10/12/2011)SOIL DATA LOCATIONS (µg/kg) (AEI, 10/2003)
SOIL DATA (µg/kg) & SOIL GAS (µg/m3) LOCATIONS (GRIBI, 08/31/2011-09/01/2011)
SB-2SB-2
BOILER &STORAGE
ROOM
HP-1HP-1
??
?SB
10
SB9
SB-10
SB-7SB-7
SV-1
W-2
W-3
W-4
SS-1SS-1
SS-2
SB-6SB-6
W-1W-1
MP-1(DP-1)MP-1(DP-1)
SG-4
SG-5
DP-4
DP-550' W
SB-8SB-8MP-3(DP-3)MP-3
(DP-3)
MP-2(DP-2)MP-2(DP-2)
SB-9SB-9
SV-2SV-2
H i s t o r i c a l t ra ce o f S
t r awbe r r y
Cre
ek
HP-3HP-3
ProposedCap Excavation
CL
CL
SW NE
P=PCET=TCE
P 2.4P 2.4
P 7.9P 7.9
SW-NE cross-section through proposed CAP excavation

Stellar Environmental Solutions, Inc. Page 26
4.0 SUB-SLAB VENTING SYSTEM (SSVS)
Upon regulatory approval and completion of the corrective excavation described in the preceding excavation, the redevelopment of the Site will proceed. While the corrective action excavation focuses on resolving the source removal the removal of the foundation slab during the demolition of the building to facilitates identification of any other pertinent data and allows that the redevelopment be completed with an underlying passive sub-slab venting system (SSVS) which will serve to remove the vapor intrusion potential and make the interior space more amenable to residential occupancy. This strategy was discussed during the February 2015 Scoping Meeting with Water Board. The plan is to follow up the interior excavation and any data gap exploration with the installation of sub-slab trenching and associated vent piping with risers prior to the replacement of the redevelopment building slab.
SSVS OBJECTIVES
The approach toward mitigation of intrusion into the site building by PCE-laden vapor from soil sources is based upon the previous investigations. Contaminant flux is trapped in the vadose zone material and undelaying groundwater and slowly partitions/volatilizes into soil-gas. Therefore, the SSVS installation effort is focused on mitigating vapor intrusion into the future Site building. Vapor mitigation is expected to occur through installation of a proposed SSVS described below. This strategy is anticipated to be part of a possible final remedy for the site property. The extent of offsite groundwater contamination and any need to consider active remedies for it is not addressed by the SSVS.
SSVS RATIONALE AND DESIGN
The SSVS installation is being designed to remedy any future PCE vapor intrusion by capturing the VOC vapor beneath the new foundation slab to direct it through risers in the wall and vent it to the outside air. Preliminary assessment of the site data indicated passive venting will be acceptable from the BAAQMD perspective. Addressing the VOC air impacts are expected to allow for the interior space of the new redevelopment to be used productively in a healthy condition. The SSVS, described in more detail below, is to be implemented as part of the replacement of the new redevelopment building slab and involves the installation of trenches for a gravel bed and perforated 3-inch horizontal piping with risers, placement of a chlorinated volatile organic compound (CVOC) barrier (liquid boot) above the SSVS, and replace the concrete slab foundation. The partial basement area will be installed starting approximately 70

Stellar Environmental Solutions Page 27 Y:\PROJECTS\2016-Active Projects\2016-14-Tower Cleaner CAP & RMP\REPORTS\Corrective Action Plan-Tower Cleaners -April-2016.doc
feet south of University Avenue as shown in the site architectural plans in Appendix B. While the focus of the area of concern for residual PCE continuation source is estimated to be focused in the 25 by 30 by 7 foot area the excavation of the partial basement is more extensive than that, covering an area of 80 feet by 40 feet by between 8 to 10 feet in depth. The partial basement area will be completed with a SSVS and have the vent pipes rise up the basement wall to connect to the vent piping beneath the ground floor SSVS. This will result in the capture and venting of soil-gas emanating from residual PCE and related contaminants in the soil and groundwater beneath the new foundation so that it cannot enter the building and impact the indoor air.
SSVS INSTALLATION
Stellar Environmental designed the SSVS which is to be installed by our selected sub-consultant Asbestos Management Group (AMG). AMG has a certified hazardous substances contractor license. The main elements of the SSVS installation included the removal of the existing concrete slab-on-grade foundation, and soil removal within a network of trenches to a depth of 1-foot with the native soil to install the SSVS components. Stellar Environmental will provide installation oversight as described in the tasks below. The proposed location for trenching and installation of the SSVS piping is based upon what is best accommodated by the building layout.
The system is considered passive because the roof-mounted turbines are not activated by electrical motors but by wind. For approximately 9 months out of the year, winds in the San Francisco Bay Area blow predictably during the afternoon and evening hours. During the winter months, winds tend to be more variable, with extended periods of calm conditions interspersed between storm events of varying intensities.
The component parts of the system installation below are laid out in chronological order for the full SSVS installation.
Figure 6 shows the overall SSVS design concept proposed location for trenching and installation of the SSVS piping.
SSVS Piping Installation and Trench Backfilling
The vapor collection/depressurization system will consist of a network of 4-inch perforated (0.02-inch slotted) polyvinyl chloride (PVC) piping placed on a 2- to 3-inch thick bed of ¾-inch gravel (no fines) and to the outside of the building as shown in Figure 6. The piping network will be covered with 4 to 5 inches of the self-compacting gravel. The piping will extend up the building walls in two risers to the roof top. The two risers above the roof will consist of weatherproof pipe fitted with a 22-inch diameter wind-assisted turbines capable of 345 cubic feet per minute (cfm) in a 4-mile-per-hour (mph) wind.

Stellar Environmental Solutions Page 28 Y:\PROJECTS\2016-Active Projects\2016-14-Tower Cleaner CAP & RMP\REPORTS\Corrective Action Plan-Tower Cleaners -April-2016.doc
Spray Applied VOC Barrier Installation
A spray-applied gas-vapor barrier (Liquid boot) product that providing a near gas-tight seal will be placed over the SSVS. The Liquid Boot product will also be applied up the four walls of the basement. The Liquid Boot is designed to provide an impenetrable vapor membrane for water, volatile organic compounds, and methane gas. The barrier application process involves first applying non-woven geotextile fabric over the stone and then spraying a hot emulsified asphalt/latex top covering. This hot material binds to the support fabric and side foundation walls to provide a minimum thickness of 60 dry mil. The total thickness including the support fabric is 73 mil. Once the application process is completed and top emulation has cured, a port in the vapor barrier is accessed and the underside is pressurized by using centrifugal blowers to supply colored indicator smoke. This will identify leaks for repair or enable the installer to certify that there are no leaks. Stellar Environmental will contract with an installer of the product licensed by the manufacturer.
SSVS Performance Monitoring
An SSVS exhaust air sample will be collected using a 6-liter Summa™ canister to evaluate the functionality of the system after its installation. The exhaust sample will be analyzed for PCE and associated compounds by EPA Method TO-15. This sample will be collected at the same time as the indoor-air sampling described below. Airflow measurement and sampling will be conducted via the roof exhaust or a sampling port installed in the riser.

APPROXIMATE SCALE IN FEET
0 25
Figure 5By: MJC APRIL 2016Tower Cleaners
1100 University Ave., Berkeley, CA
LOCATION OF PROPOSED SSVS
2015
-70-
12
PROPERTY LINEUNIVERSITY AVENUE
FENCE
FENCE
Parking Lot
KABANARESTAURANT
CROSSFILGYMNASIUM
DONUTSHOP
BAR/RESTAURANT
LOCATION OFFORMER DRYCLEANING MACHINE
LOCATION OFFORMER DRYCLEANING MACHINE
NEW MULTI-TENANTRESIDENTIAL
DEVELOPMENT
MW-1
MW-2
MW-3
HP-2
SB-4SB-4
SB-5
SB-3SB-3
SB-1SB-1
LEGEND
GROUNDWATER MONITORING WELL (µg/L) (2014)
REMEDIATION WELLS (SOMA 2015)
SOIL VAPOR/SUB-SLAB LOCATIONS (SOMA 2015)
OFF-SITE SOIL BORINGS (SOMA 2015)SOIL/GROUNDWATER BORING (WEST, OCT 2015)
PROPOSED CAP EXCAVATION
GROUNDWATER HYDROPUNCH LOCATIONS (µg/L) (GRIBI, 04/2006)
SOIL GAS (µg/m3) LOCATIONS (GRIBI, 10/12/2011)SOIL DATA LOCATIONS (µg/kg) (AEI, 10/2003)
SOIL DATA (µg/kg) & SOIL GAS (µg/m3) LOCATIONS (GRIBI, 08/31/2011-09/01/2011)
SB-2SB-2
BOILER &STORAGE
ROOMRISERTO ROOF
4-INCH SSVS PERFORATED PIPE
HP-1HP-1
RISERTO ROOF
SSVS RISERTO ROOF
SB-10
SB-7SB-7
SV-1
W-2
W-3
W-4
SS-1SS-1
SS-2
SB-6SB-6
W-1W-1
MP-1(DP-1)MP-1(DP-1)
SG-4
SG-5
DP-4
DP-550' W
SB-8SB-8MP-3(DP-3)MP-3
(DP-3)
MP-2(DP-2)MP-2(DP-2)
SB-9SB-9
SV-2SV-2
H i s t o r i c a l t r ac e o f S t r a w b e r r y C r e e k HP-3HP-3
250
SSVS Cross-section
Base fabric
Liquidboot®
VOCvaporbarrier
4-inchperforatedpipe
3/4" washed drain rock
10"
Concrete slab
Constructionfabric
4"

Stellar Environmental Solutions, Inc. Page 30
5.0 ADDITIONAL CAP ACTIVITIES AND TECHNICAL REPORTING
PRE- AND POST- CAP GROUNDWATER MONITORING WELL SAMPLING
Groundwater monitoring of the three Site wells (actually located adjacent to the Site) will be conducted before and after implementation of the CAP. Groundwater monitoring will consist of water level measurements, purging, sampling, and field analyses following standard methods and protocols for sampling VOC-contaminated groundwater. Groundwater monitoring will be conducted on a semi-annual basis thereafter
Groundwater monitoring will include:
Measuring static water levels with an electric water level indicator
Purging wells to obtain representative formation water (and collecting aquifer stability parameters between each purging)
Collecting post-purge groundwater samples for CVOC laboratory analysis (EPA 8010 analytes by method 8260).
As the first task of the monitoring event, static water levels will measure using an electric water level indicator. Wells will be purged (by bailing and/or pumping) of three wetted casing volumes. Aquifer stability parameters (temperature, pH, and electrical conductivity) were measured after each purged casing volume to ensure that representative formation water would be sampled. To minimize the potential for cross-contamination, new disposable tubing will be used between each well sampling location, and all equipment will be decontaminated between locations. Reporting will include a discussion of water quality data in the context of regulatory ESLs, and an estimation of groundwater flow direction and gradient.
Wastewater from well purging and equipment decontamination rinseate was containerized and stored onsite in a labeled steel 55-gallon drum. Purge water will be accumulated and disposed of offsite at a later date.
PREFERENTIAL PATHWAY, OFFSITE WELL AND SENSITIVE RECEPTOR STUDY
The preferential pathway study will entail a compilation, survey and mapping of underground utilities located downgradient of the subject property that will include but are not limited to: the sanitary sewer, stormwater, drinking water, traffic and street lights, electrical natural gas, and

Stellar Environmental Solutions Page 31 Y:\PROJECTS\2016-Active Projects\2016-14-Tower Cleaner CAP & RMP\REPORTS\Corrective Action Plan-Tower Cleaners -April-2016.doc
communications. As the City of Berkeley is unincorporated, it is expected that most relevant public domain utility records and maps will be found with Alameda County. Various utilities that will be contacted will include AT&T, MCI, Level 3 Communications, and Pacific Gas & Electric City of Berkeley Public Works.
An offsite well survey will be completed. This will entail a formal well survey request to the California Department of Water Resources (DWR), the agency ultimately responsible for permitting water wells and retaining Water Well Driller’s Reports. We will also review the Alameda County Public Works and City of Berkeley databases which essentially duplicates the DWR’s database. Stellar Environmental will also commission an Environmental Database Research Inc. (EDR) search of federal, state, municipal and domestic wells within a 1- mile radius of the subject site.
The findings of the preferential path and sensitive receptor study will be tabulated and compiled into the final documentation report and an evaluation of potential impacts by any groundwater plume evidence discovered as part of the grab-groundwater investigation will be integrated with the preferential pathway analyses. The hydrocarbon contaminant could potentially migrate offsite via groundwater flow and/or along preferential pathway created by utilities and other subsurface anthropogenic features to nearby and downgradient sensitive human and environmental (creeks, groundwater wells, etc.) receptors. The sensitive receptor survey will also include the location of schools, day care, elderly care, medical facilities, basements (if possible), and surface water within ~1/4 mile. The potential risk to such receptors will be assessed.
INDOOR-AIR CONFIRMATION SAMPLING
An indoor air study will be conducted that will entail an 8-hour air sampling test during normal working hours. The indoor air survey will take place approximately 1 month after SSVS operation assuming normal operation of the building roof vent system in the interim. Stellar Environmental personnel will set up the 8-hour test apparatus in an estimated three locations at the subject property at the beginning of the day. Stellar Environmental will then return after the 8-hour of run time to retrieve the sampling apparatus. The 8-hour test will utilize a Summa™ canister with an air intake rate set for an 8-hour test per DTSC procedures and protocols and analyzed for PCE and related chlorinated VOCs via EPA Method TO-15, which includes the contaminant of concern, PCE and related degradation products. Following the collection , the Summa™ canisters will be maintained under ambient conditions and out of direct sunlight and transported to the analytical laboratory the same day under chain-of-custody record. The analyses will be performed by the selected California Environmental Laboratory Accreditation Program (ELAP) -certified laboratory.

Stellar Environmental Solutions Page 32 Y:\PROJECTS\2016-Active Projects\2016-14-Tower Cleaner CAP & RMP\REPORTS\Corrective Action Plan-Tower Cleaners -April-2016.doc
TECHNICAL REPORTING
Stellar Environmental will prepare a comprehensive documentation report summarizing the CAP implementation, SSVS installation, monitoring and confirmation indoor air sampling, assessing the data in the context of regulatory consideration and site occupancy. Regulatory site closure criteria will be discussed, along with any recommended long term action to move the former dry cleaners toward regulatory site closure. Figures showing site features, historic site data, layout of the SSVS, soil, groundwater, SSVS and indoor air sampling results will be included, along with tabulated laboratory analyses, and copies of the original laboratory reports. The report will contain the following elements:
Project Introduction and Background
Objectives and Procedures
Description of the corrective action excavation
Description of the Field Work and Sampling Protocols
Tabulation of all Pertinent Data Compared to Environmental Regulatory Limits
Groundwater Monitoring Data
SSVS Evaluation Data
Site Conceptual Model
Regulatory reporting to the Water Board
Summary, Conclusions and Recommendations
Technical Appendices (such as site photographs, certified analytical reports and chain-of-custody records, field and sampling notes, and data tables)
Copies of the report will be submitted to the client, CA GeoTracker and the Water Board, as required.
TEAM QUALIFICATIONS
Stellar Environmental is currently the property owner’s environmental consultant of record, and should we implement the project remedy we will coordinate the project, perform the site remediation, and complete the documentation reports. Stellar Environmental Solutions, Inc. has completed dozens of similar projects. Our team will consist of:

Stellar Environmental Solutions Page 33 Y:\PROJECTS\2016-Active Projects\2016-14-Tower Cleaner CAP & RMP\REPORTS\Corrective Action Plan-Tower Cleaners -April-2016.doc
Stellar Environmental Solutions, Inc. Owners’ consultant responsible for overall project coordination, sampling, data evaluation, SSVS design, installation and operation, and report certification by a California Professional Geologist.
Asbestos Management Group, Oakland, California (AMG). General and hazardous contractor to conduct the soil removal and to complete the installation of the SSVS under Stellar Environmental supervision.
Gergen Construction. Licensed installer certified by Liquid Boot™ manufacturer.
McCampbell Laboratories or similar analytical laboratory with current State of California ELAP certification to perform the various analytical methods.
Stellar Environmental Solutions, Inc. Page 34
6.0 REFERENCES
AEI Consultants, 2 0 0 2 . Phase I Environmental Site Assessment 1110 University Avenue, Berkeley, California. July 18.
Gribi Associates. 2010. Report of Monitoring Well Installation Activities. Tower Cleaners, 1110 University Avenue, Berkeley, California. September 29.
Gribi Associates. 2011. Soil and Soil Vapor Investigation Report. Tower Cleaners, 1110 University Avenue, Berkeley, California. November 4
SOMA Environmental Engineers. 2016. Additional Investigation, Well Installation, and MPE Pilot Testing Report. March 16.
Stellar Environmental Solutions, Inc. 2014. Semi-annual Groundwater Monitoring Report – 1110 University Avenue, Berkeley, California. June 6.
Regional Water Quality Control Board (Water Board), 2007. Water Quality Control Plan for the San Francisco Bay Basin (Basin Plan). January 18.
Regional Water Quality Control Board (Water Board), 2016. Environmental Screening Levels for Commercial/Industrial Sites Where Groundwater Is and Is Not a Drinking Water Resource. February 22.
West Environmental, 2016. Summary of Investigation, Tower Cleaners, 1110 University Ave, Berkeley, CA. January 27.
APPENDIX A
Historical analytical Data and Figures

TABLES

Table 1SUMMARY OF LABORATORY ANALYTICAL RESULTS
Tower Cleaners, Berkeley, California
SampleID
SampleDate
SampleMatrix
SampleDepth
Concentration
PCE TCE c-1,2-DCE t-1,2-DCE VC Other HVOCs IPA
Soil Samples, Soil Concentrations in milligrams per kilogram (mg/kg)
SB-6-1.5 08/31/11 Soil 1.5 feet 13 0.0059 <0.0050 <0.0050 <0.0050 ALL ND NA
SB-7-2.0 08/31/11 Soil 2.0 feet 7.0 0.016 <0.0050 <0.0050 <0.0050 ALL ND NA
SB-7-4.0 08/31/11 Soil 4.0 feet 4.7 0.013 <0.0041 <0.0041 <0.0041 ALL ND NA
SB-8-2.0 08/31/11 Soil 2.0 feet 1.2 <0.0057 <0.0057 <0.0057 <0.0057 ALL ND NA
SB-8-4.0 08/31/11 Soil 4.0 feet 0.96 <0.0050 <0.0050 <0.0050 <0.0050 ALL ND NA
SB-9-2.0 08/31/11 Soil 2.0 feet 7.9 <0.0044 <0.0044 <0.0044 <0.0044 ALL ND NA
SB-9-4.5 08/31/11 Soil 4.5 feet 2.4 <0.0050 <0.0050 <0.0050 <0.0050 ALL ND NA
SB-10-2.0 08/31/11 Soil 2.0 feet 0.076 <0.0050 0.017 <0.0050 <0.0050 ALL ND NA
SB-10-4.0 08/31/11 Soil 4.0 feet 0.079 <0.0050 <0.0050 <0.0050 <0.0050 ALL ND NAESL, soil, direct exposure, Commercial 0.95 4.1 22 34 0.047 Various --
Vapor Samples, Vapor Concentrations in micrograms per cubic meter (ug/m^3)
SB-7-VS 09/01/11 Vapor 3.0-4.5 feet 11,000,000 18,000 1,800 480 <130 ALL ND 11,000
SB-8-VS 09/01/11 Vapor 3.0-4.0 feet 3,000,000 4,500 <200 <200 <130 ALL ND 12,000
SB-10-VS 09/01/11 Vapor 1.0-2.0 feet 780,000 820 3,400 <200 <130 ALL ND 6,500
SHROUD 09/01/11 Vapor -- 6,100 <270 <200 <200 <130 ALL ND 9,700,000
SG-4 10/12/11 Vapor 5.0-6.0 feet 240 <5.5 <4.0 <4.0 <2.6 Acetone=110 18
SG-5 10/12/11 Vapor 5.0-6.0 feet 300 <5.5 <4.0 <4.0 <2.6 Acetone=55MC=5.7
260
SHROUD 10/12/11 Vapor -- <350 <270 <200 <200 <130 ALL ND 420,000ESL, shallow soil gas, Commercial 1,400 4,100 20,000 41,000 100 Various --
PCE = TetrachloroetheneTCE = Trichloroethenec-1,2-DCE = cis-1,2-Dichloroethenet-1,2-DCE = trans-1,2-DichloroetheneVC = Vinyl ChlorideHVOCs = Halogenated volatile organic compounds. Includes 28
individual HVOC compounds.IPA = Isopropyl alcohol (leak detection compound)<0.0050 = Not detected above the expressed value.NA = Not analyzed for this analyte.Environmental Screening Levels as contained in Table D, Screening for EnvironmentalConcerns at Sites with Soil and Groundwater Contamination, SFBRWQCB, May 2008)

SS-2

TABLE 1SUMMARY OF SOIL SAMPLE ANALYTICAL RESULTS
1110 University AvenueBerkeley, California
PCE TCE cDCE tDCE CE
(ug/kg) (ug/kg) (ug/kg) (ug/kg) (ugk/kg)3 15 <5 <5 <5 <5
11 9.4 <5 <5 <5 <518.5 58 <5 <5 <5 <5
SB-2 10/20/03 7.5 3,600 <5 <5 <5 <5SB-3 10/20/03 7 3,800 <5 <5 <5 <5
6 1,700 <5 <5 <5 <510 1,800 <5 <5 <5 <5
SB-6 8/31/11 1.5 13,000 5.9 <5 <5 <52 7,000 16 <5 <5 <54 4,700 13 <4.1 <4.1 <4.12 1,200 <5.7 <5.7 <5.7 <5.74 960 <5 <5 <5 <52 7,900 <4.4 <4.4 <4.4 <4.4
4.5 2,400 <5 <5 <5 <52 76 <5 17 <5 <54 79 <5 <5 <5 <52 510 <4.8 <4.8 <4.8 <9.64 130 <4.8 <4.8 <4.8 <9.16 34 <4.8 <4.8 <4.8 <9.88 130 <4.8 <4.8 <4.8 <9.5
10 75 <4.8 <4.8 <4.8 <9.517.5 7.2 <4.8 <4.8 <4.8 <9.6
2 1,400 <4.9 <4.9 <4.9 <9.84 470 <4.8 <4.8 <4.8 <9.66 94 <4.7 <4.7 <4.7 <9.38 91 <4.8 <4.8 <4.8 <9.6
10 120 <4.5 <4.5 <4.5 <9.114 370 <4.8 <4.8 <4.8 <9.62 1,200 <4.7 <4.7 <4.7 <9.34 160 <4.9 <4.9 <4.9 <9.76 57 <4.7 <4.7 <4.7 <9.48 7.4 <4.9 <4.9 <4.9 <9.9
10 36 <4.7 <4.7 <4.7 <9.414 67 <5 <5 <5 <9.92 30,700 <195 <195 <195 <1955 742 <20.4 <20.4 <20.4 <20.47 3,300 <38.5 <38.5 <38.5 <38.5
12/15/14
SB-7 8/31/11
8/31/11
8/31/11
8/31/11
12/15/14
SB-10
10/20/03
10/20/03SB-1
SB-4
12/15/14
W-1 10/8/15
DP-2
DP-3
Depth(ft)
DateSample ID
DP-1
SB-8
SB-9
Page 1 of 1

TABLE 2SUMMARY OF SOIL GAS/SUBSLAB SAMPLE ANALYTICAL RESULTS
1110 University AvenueBerkeley, California
PCE TCE cDCE tDCE
(ug/m3) (ug/m3) (ug/m3) (ug/m3)SB-7 9/1/2011 3-4.5 11,000,000 18,000 1,800 480SB-8 9/1/2011 3-4 3,000,000 4,500 <200 <200
SB-10 9/1/2011 1-2 780,000 820 3,400 <200
SV-1 1/29/15 5 490 130 130 130
9,100 <55 <55 <55
7,800 <54 <54 <54
SS-1 1/29/15 1 21,000 <190 <190 <190
SS-2 1/29/15 1 130,000 <1,200 <1,200 <1,200
W-1 10/8/2015 5 5,480 172 <39.7 --
Depth(ft)
DateSample ID
SV-2 1/29/15 5
Page 1 of 1

TABLE 3SUMMARY OF GROUNDWATER SAMPLE ANALYTICAL RESULTS
1110 University AvenueBerkeley, California
PCE TCE cDCE tDCE CE
(ug/l) (ug/l) (ug/l) (ug/l) (ug/l)
HP-1 4/2006 -- 1,300 -- -- -- --
HP-2 4/2006 -- 18 3.3 -- -- --
HP-3 4/2006 -- 380 -- -- -- --
DP-1 12/16/14 -- 2,300 <17 <17 <17 <17
DP-2 12/24/14 -- 7,300 32 <20 <20 <20
DP-3 12/16/14 -- 2,400 <20 <20 <20 <20
W-2 10/8/15 28.5 16.8 0.85 0.65 <0.5 <0.5
W-3 10/8/15 31 11,000 <100 <100 <100 <100
W-4 10/8/15 31.5 167 <2.50 2.75 <2.50 <2.50
Depth(ft)
DateSample ID
Page 1 of 1

Figure __By: MJC FEBRUARY 2016Tower Cleaners
1100 University Ave., Berkeley, CA
SOIL IN UPPER 10 FEET WITH CONCENTRATIONS EXCEEDING THE 0.7 MG/KG ESL
2015
-70-
06
SS-2
1.2MPE-3(DP-3)
1.4MPE-2(DP-2)
SB-613
SB-41.8
SB-23.6
SB-97.9
SB-33.8
SB-81.2 SB-7
7
0.51MPE-1(DP-1)
PCE CONCENTRATIONS IN MG/KG
ISOCONCENTRATIONS IN MG/KG
1.2
W-2
30.7W-3
W-4
10
5
5

Well ID DateID
8/17/2010 54.02 41.57 12.45 490 12 3.5 <1.0 <0.5
10/22/2010 54.02 41.25 12.77 740 9.1 2.3 <1.0 <0.52/14/2011 54.02 42.69 11.33 450 21 4.8 <1.0 <0.55/13/2011 54.02 42.73 11.29 660 26 6.6 <1.0 <0.58/3/2011 54.02 42.3 11.72 750 15 3.1 <1.0 <0.58/29/2012 54.02 41.99 12.03 1,100 8.6 <1.0 <1.0 <0.55/28/2014 54.02 42.39 11.63 970 11 <8.3 <8.3 <8.312/24/2014 54.02 45.87 8.15 610 22 <5.0 <5.0 <5.0
4/12/2016 54.02 44.9 9.12 400 19 <3.6 <3.6 <3.6
8/17/2010 53.76 41.14 12.62 1,400 7.4 11 <1.0 <0.510/22/2010 53.76 40.93 12.83 18,000 5.2 3.9 <1.0 <0.52/14/2011 53.76 42.45 11.31 690 4.7 2.2 <1.0 <0.55/13/2011 53.76 42.09 11.67 360 5.8 6 <1.0 <0.58/3/2011 53.76 42 11.76 760 5.3 5.6 <1.0 <0.58/29/2012 53.76 41.62 12.14 430 3.4 <1.0 <1.0 <0.55/28/2014 53.76 41.72 12.04 860 7.4 <5.0 <5.0 <5.012/24/2014 53.76 46.77 6.99 460 4.7 <3.1 <3.1 <3.1
4/12/2016 53.76 44.28 9.48 1,200 10 <8.3 <8.3 <8.3
8/17/2010 53.94 40.86 13.08 1,100 24 58 <1.0 <0.510/22/2010 53.94 40.67 13.27 1,500 21 53 <1.0 <0.52/14/2011 53.94 42.04 11.9 780 13 27 <1.0 <0.55/13/2011 53.94 41.84 12.1 <1 18 37 <1.0 <0.58/3/2011 53.94 41.42 12.52 990 15 24 <1.0 <0.58/29/2012 53.94 41.34 12.6 1,500 15 24 <1.0 <0.55/28/2014 53.94 41.44 12.5 1,700 33 63 <17 <1712/24/2014 53.94 46.29 7.65 2,800 33 49 <20 <20
4/12/2016 53.94 43.84 10.1 1,400 39 110 <8.3 <8.3
5 5 6 10 0.5
MW-2
MW-3
ESLs (Commercial, Potential Drinking Water)
Groundwater Monitoring Analytical Data1110 University Avenue, Berkeley
Contaminants (µg/L)
cis-1,2- DCETCE
Groundwater Elevation (ft amsl)
Depth to Groundwater
(ft btoc) PCE trans-1,2- DCE VC
Top of Casing
Elevation
MW-1

APPENDIX B
Supporting Documents and Redevelopment Plans


APPENDIX C
Standard Operating Procedures
QA/QC Information

STANDARD FIELD OPERATING PROCEDURES AND SITE SPECIFIC WORKPLAN ADDENDUM FOR, GEOPROBLE DRILLING, SOIL SAMPLING AND GRAB-
GROUNDWATER SAMPLING
GEOPROBE DRILLING
Geoprobe Rig Sampling No definitive plans for geoprobe sampling is anticipated at this time but may occur if such sampling is considered advantageous. The plan is for the building to be demolished/reconstructed before any of the excavation and remediation starts so there will be no impedance to the use of a geoprobe if needed.
SAMPLING METHODS AND PROCEDURES
Pre-Fieldwork Planning, Permitting, and Notification of Subsurface Disturbance
Soil boring and drilling permits has been obtained from Berkeley TMD per local requirements. If drilling or probing below 1 foot is to occur we will mark boring locations in white paint as required for utility locating by Underground Service Alert (USA) prior to any drilling activities. Stellar Environmental also will review site specific utility plans and/or information provided by the property owner.
Decontamination Procedures
Sampling equipment must be decontaminated consistently to ensure the quality of the samples collected. All non-disposable equipment that comes in direct contact with the soil and/or groundwater will be decontaminated prior to use. Disposable equipment intended for one-time use will not be decontaminated but will be packaged and disposed of appropriately.
Between boring locations, downhole drilling equipment will be decontaminated with a steam cleaner. Wastewater will be drummed and properly disposed of when the investigative activities are completed.

Photoionization Detector (PID) Screening Survey
Immediately following the removal of the foundation slab Stellar Environmental will complete a photoionization detector (PID) survey will across a grid pattern of the space. The objective of the PID survey is to provide a qualitative method to identify if there are any hotspots that might be indicative of more PCE in the soil in and around those areas. This PID survey will be used to inform the current site characterization bores and may result in additional bore locations or the movement of currently planned bore to make sure that the areas with the highest PID reading in the soil beneath the foundation have one or more soil bores drilled to characterize that area vertically.
The PID is to be calibrated to 100 PPM Hexane—the calibration gas used for measuring VOC emissions as there is no specific calibration gases for TCE or PCE. All of the soil samples will be collected by Stellar Environmental personnel from approximately 6 inches beneath the base depth, using a simple 5/8th inch diameter steel rod to make a hole in the backfill/soil and insert the probe tip into the hole to collect the reading. The PID survey will use the following sampling protocols:
Grid and mark out locations bores on10-foot centers;
Check operation of Calibrated PID to Hexane;
Bore down to 6 inches below the base grade with a 5/8 inch diameter steel rod;
Withdrawn the driver rod and insert the PID probe into the hole and sealed at the top with the filter unit;
Allow a 30 second equilibration of the PID before recording the PID reading on the Quad A map; and
Move to next bore location and repeat.
The proposed drilling and sampling plan described in the Workplan calls for a minimum of 4 soil sampling locations to coincide with 4 planned grab-groundwater locations. More samples may be collected if the PID readings suggest additional concerns for contamination.
Soil Sampling Procedures
Soil borings will be advanced to an estimated depth of 10 feet bgs which is projected to be a base of the partial basement. At a minimum, base of excavation soil samples will be collected. Sidewall samples may also be collected depending on PID response. The saturated zone is

deeper than the projected excavation. Additional samples may be collected based upon visual observation of contamination (i.e., staining, odors, etc.) and PID readings. The field screening of the bore logs for organic vapors using the PID will occur during immediately after the continuous core acetate sleeve lining area are cut. High responses (above 5 PPMV) will result in additional samples being collected if they are higher than the program sample intervals.
The borings will be logged under the direct supervision of a California-registered professional geologist using the visual method of the Unified Soils Classification System. Soil samples to be analyzed for the hydrocarbon compounds will be collected in the acetate sleeves lining the sampling tube, and then sealed with inert Teflon™ tape and plastic caps. Soil samples to be analyzed for the Volatile Organic Compounds (VOCs) will be collected with an EnCore™ soil sampling apparatus will be employed in accordance with EPA Method 5035 to collect 5 gram soil samples to be analyzed for VOCs. The EnCore™ multi-functional sampling device is designed to act as both a coring tool and airtight storage container. The EnCore™ sampler collects a small subcore of soil directly into the volumetric storage chamber of the device directly from a soil core or soil surface, filling it completely with zero headspace. The storage chamber is then capped to form an airtight seal. The Encore sampling handle will be cleaned between uses with Alconox and clean water. All soil samples will be immediately labeled, placed in a chilled cooler, and transported under chain of custody to the analytical laboratory.
Drilling cuttings will be stored in labeled 55-gallon drums until characterization to facilitate proper disposal.
Grab-Groundwater Sampling
No grab groundwater is currently planned for but it may occur if site data indicates it would be useful to do so. To facilitate groundwater collection, temporary 1-inch diameter PVC cased wells will be installed in the open boreholes used for soil sampling describe above. New PVC casing will be used for each bore hole. Based on our experience at the site, groundwater is generally expected at a depth of 10 o 12 feet bgs. Because, our experience at the site also indicates that a depth of 10 feet bgs is sometimes not sufficiently deep to allow expeditious groundwater sample collection, a target depth of 25 feet bgs is planned for each bore hole as stated above. If this depth is not sufficient to allow adequate groundwater for sampling after a waiting period of 2 hours, an attempt will be made to deepen the hole to 30 feet bgs.
Groundwater will be collected though means of an electrically driven peristaltic pump equipped with new tubing inserted into the temporary PVC well casing. The groundwater will be transferred into the appropriate laboratory-provided container(s). The samples will then be immediately labeled, placed in a chilled cooler, and transported under chain of custody to the analytical laboratory.

Special care will be exercised to prevent contamination of the groundwater and extracted samples during the sampling activities. The two primary ways in which such contamination can occur are: Contamination of a sample through contact with improperly cleaned equipment. Cross-contamination of the groundwater through insufficient cleaning of equipment
between samples.
To prevent such contamination, sampling equipment and sample containers will be thoroughly cleaned before and after field use and between uses at different sampling locations. In addition to the use of properly cleaned equipment, two further precautions will be taken: A clean pair of new, disposable latex (or similar) gloves will be worn each time a
different temporary well is sampled.
Sample collection activities will progress from the suspected least affected (upgradient) area to the most affected (downgradient) area.
Groundwater Sample Containers
Groundwater samples will be collected in laboratory supplied 40 ml VOA bottles preserved with hydrochloric acid. Glass containers and appropriate container lids will be provided by the laboratory. Sample container lids will be sealed so that it will be obvious if the seal has been tampered with or broken. The label will be firmly attached to the container side (not lid). The following information will be legibly and indelibly written on the label: Facility name Sample identification Sample type (groundwater, surface water, etc.) Sampling date Sampling time Preservatives added, and, sample collectors initials
SOIL AND GRAB-GROUNDWATER SAMPLE ANALYTICAL METHODS
As described in the CAP the soil and groundwater samples will be analyzed by a California-certified analytical laboratory using the following laboratory analytical methods:
VOCs by EPA Method 8260B and for Total Petroleum Hydrocarbons – gasoline/diesel/motor oil by EPA Method 8015M.

One groundwater sample will be analyzed for Total Dissolved Solids by EPA Method 160.1.
Soil samples from 5, 10 and 15 feet bgs from one of the boring will be analyzed for Total Organic Carbon by EPA Method 415.3.
All soil and groundwater samples will be submitted to the laboratory the day following collection of the samples with instructions to analyze the samples within one week.
QUALITY ASSURANCE AND QUALITY CONTROL PROCEDURES
Field Sampling Quality Control Procedures
A trip blank sample (distilled water) will be shipped from the laboratory to the facility and will be returned to the laboratory for analysis. The trip blank will not be opened in the field.
Laboratory Quality Control Samples
Internal laboratory QC samples will be analyzed at the frequency specified by the analytical method. These QC samples will include method blanks, matrix spikes, matrix spike duplicates, surrogate analysis for organics, and second source reference standard analysis for metals. For all the methods shown above, McCampbell Analytical Inc., the selected analytical laboratory for this project, one Method Blank (MB), Laboratory Control Sample (LCS), Laboratory Control Sample Duplicate (LCSD), Matrix Spike (MS), and Matrix Spike Duplicate (MSD) will be analyzed per each batch of 20 samples.
BOREHOLE ABANDONMENT PROCEDURES
Boreholes will be abandoned by grouting from the base of the borehole to the ground surface. The grout used to abandon the borehole (with approval of the CCCHSD) will be a mixture of Portland cement (ASTM C150, Type 1 or API-1 OA, Class A), 3 to 5 pounds of sodium bentonite, and not more than 6 gallons of potable water per 94-pound sack of cement. The use of any additives to reduce permeability, increase fluidity, and/or control setting time must be approved by the Berkeley TMD. Grouting below the groundwater level, or deeper than 10 feet below ground surface, will be performed by pumping using a small-diameter tremie pipe positioned several feet above the borehole bottom.
ADDITIONAL CONSIDERATIONS AND PROCEDURES
SUB-SLAB SOIL EXCAVATION STRATEGIES

Approximately the upper 10 to 12 inches of soil will be excavated from the building interior floor area once the concrete slab is removed as part of a passive Sub Slab Venting System (SSVS) installation as outlined in the CAP. During this work, visual observation and frequent screening with a PID of exposed soil will be conducted in order to evaluate for potential “hot spots”. A grid PID survey will be conducted of the excavated area as outlined in the Photoionization Detector (PID) Screening and Soil Sampling description on Page 2. If such hot spots are encountered, an attempt will be made to determine the lateral and vertical extent of contaminated soil through the use of available hand and powered equipment. Deeper explorations and removal of obviously contaminated soils will be conducted within the limitations of the equipment that is possible to get inside the building.
SSVS MONITORING POINTS
The two perimeter sub-slab venting system monitoring points described in the CAP and depicted in Figure 6, will not be installed. SSVS performance monitoring will be conducted using sampling ports on the risers and from the open riser discharge on the roof.
SSVS O&M PLAN AND PERFORMANCE MONITORING
Based on the data collected to date at the subject site and on the design of the SSVS, the system is expected to perform adequately to reduce indoor air VOC concentrations to allow occupancy by the planned commercial restaurant tenant. An O&M plan will be developed that will include the type and frequency of indoor air and vent riser monitoring. Based on the results of that monitoring, consideration can be made with regard to converting the passive SSVS to an active sub slab depressurization system (SSDS) as necessary.
POST CHARACTERIZATION AND SSVS INDOOR AIR MONITORING SURVEY
Following the site characterization described and the SSVS installation Stellar Environmental will complete an indoor air sampling program generally followed the DTSC guidance entitled: the Evaluation and Mitigation of Subsurface Vapor Intrusion to Indoor Air (DTSC, August, 2011). This indoor air survey will collect two samples form the same locations as the previous International Geologic indoor air survey, with one sample being above the former dry cleaner operational machine area and the other toward the back (east) side of the tenant space. As with the previous indoor air survey, one outside control sample will be collected. The new indoor air survey will allow for a comparison of the pre- and post- slab removal and SSVS installation indoor air results.
The indoor air protocols will include:

Samples will be collected for analysis using Environmental Protection Agency (EPA) method TO-15 [used for integrated (greater than a few minutes) sampling events], which will include both the hydrocarbons, carbon tetrachloride, and VOCs contaminants of concern;
The samples were collected using the Department of Toxic Substance Control (DTSC) guidance for indoor air sampling;
The indoor samples were collected in 6-liter Summa® canisters with 8-hour flow regulators designed to collect air at approximately 11.5 milliters per minute;
The indoor samples intake will be positioned approximately 4-5 feet above the building floor to simulate the breathing zone;
The outdoor air sample will be located in front of the buildings at a height of about 10 feet above the ground as a control to document ambient air concentrations;
All of the samples will be collected over the 8-hour period during the average period when the building would typically be occupied, from 8:00 am until 4:00 pm;
The samples will be shipped under chain of custody protocol by courier to McCampbell Analytical Inc., an ELAP certified laboratory for analysis of the contaminants of concern by EPA Method TO-15 and

P U B L I C R EV I E W D R AF T I N I T I AL S TU D Y / D R A F T MI TI G A T E D N EG A T I V E D E C L A R A TI O N J U N E 2 0 1 8
1 1 1 0 U N I V E R S I T Y AV E N U E M I X E D- U S E P RO J E C T B E R K E L E Y , C A
T:\CBE1702 1110 University\PRODUCTS\IS-MND\Public\1110 University Public Review.docx (06/14/18) B-1
APPENDIX B
AIR QUALITY AND GREENHOUSE GAS EMISSIONS DATA

1 1 1 0 U N I V E R S I T Y AV E N U E M I X E D- U S E P RO J E C T B E R K E L E Y , C A
P U B L I C R EV I E W D R AF T I N I T I AL S TU D Y / D R A F T MI TI G A T E D N EG A T I V E D E C L A R A TI O N
J U N E 2 0 1 8
T:\CBE1702 1110 University\PRODUCTS\IS-MND\Public\1110 University Public Review.docx (06/14/18) B-2
This page intentionally left blank

Project Characteristics - CO2 intensity per PG&E, 2015
Land Use - Strip mall includes the retail space and yoga studio
Grading -
Demolition -
Vehicle Trips - Defaults with 30% WBCMP Vehicle Trip Reduction and 34% Retail Pass-by Reduction
1.1 Land Usage
Land Uses Size Metric Lot Acreage Floor Surface Area Population
Apartments Mid Rise 40.00 Dwelling Unit 1.05 40,000.00 114
Strip Mall 2.77 1000sqft 0.06 2,768.00 0
1.2 Other Project Characteristics
Urbanization
Climate Zone
Urban
5
Wind Speed (m/s) Precipitation Freq (Days)2.2 64
1.3 User Entered Comments & Non-Default Data
1.0 Project Characteristics
Utility Company Pacific Gas & Electric Company
2019Operational Year
CO2 Intensity (lb/MWhr)
307 0.029CH4 Intensity (lb/MWhr)
0.006N2O Intensity (lb/MWhr)
1110 University Mixed Use ProjectBay Area AQMD Air District, Annual
CalEEMod Version: CalEEMod.2016.3.2 Date: 11/17/2017 12:40 PMPage 1 of 32
1110 University Mixed Use Project - Bay Area AQMD Air District, Annual

2.0 Emissions Summary
Table Name Column Name Default Value New Value
tblGrading MaterialExported 0.00 278.00
tblProjectCharacteristics CO2IntensityFactor 641.35 307
tblVehicleTrips ST_TR 6.39 2.95
tblVehicleTrips ST_TR 42.04 19.40
tblVehicleTrips SU_TR 5.86 2.71
tblVehicleTrips SU_TR 20.43 9.44
tblVehicleTrips WD_TR 6.65 3.08
tblVehicleTrips WD_TR 44.32 20.30
CalEEMod Version: CalEEMod.2016.3.2 Date: 11/17/2017 12:40 PMPage 2 of 32
1110 University Mixed Use Project - Bay Area AQMD Air District, Annual

2.1 Overall Construction
ROG NOx CO SO2 Fugitive PM10
Exhaust PM10
PM10 Total
Fugitive PM2.5
Exhaust PM2.5
PM2.5 Total
Bio- CO2 NBio- CO2 Total CO2 CH4 N2O CO2e
Year tons/yr MT/yr
2018 0.2018 1.4499 1.1165 1.9500e-003
0.0399 0.0835 0.1234 0.0139 0.0801 0.0940 0.0000 167.5597 167.5597 0.0311 0.0000 168.3363
2019 0.3924 0.6813 0.5990 1.0600e-003
0.0109 0.0378 0.0487 2.9200e-003
0.0364 0.0394 0.0000 89.6004 89.6004 0.0157 0.0000 89.9924
Maximum 0.3924 1.4499 1.1165 1.9500e-003
0.0399 0.0835 0.1234 0.0139 0.0801 0.0940 0.0000 167.5597 167.5597 0.0311 0.0000 168.3363
Unmitigated Construction
ROG NOx CO SO2 Fugitive PM10
Exhaust PM10
PM10 Total
Fugitive PM2.5
Exhaust PM2.5
PM2.5 Total
Bio- CO2 NBio- CO2 Total CO2 CH4 N2O CO2e
Year tons/yr MT/yr
2018 0.2018 1.4499 1.1165 1.9500e-003
0.0399 0.0835 0.1234 0.0139 0.0801 0.0940 0.0000 167.5596 167.5596 0.0311 0.0000 168.3362
2019 0.3924 0.6813 0.5990 1.0600e-003
0.0109 0.0378 0.0487 2.9200e-003
0.0364 0.0394 0.0000 89.6003 89.6003 0.0157 0.0000 89.9923
Maximum 0.3924 1.4499 1.1165 1.9500e-003
0.0399 0.0835 0.1234 0.0139 0.0801 0.0940 0.0000 167.5596 167.5596 0.0311 0.0000 168.3362
Mitigated Construction
ROG NOx CO SO2 Fugitive PM10
Exhaust PM10
PM10 Total
Fugitive PM2.5
Exhaust PM2.5
PM2.5 Total
Bio- CO2 NBio-CO2 Total CO2 CH4 N20 CO2e
Percent Reduction
0.00 0.00 0.00 0.00 0.00 0.00 0.00 0.00 0.00 0.00 0.00 0.00 0.00 0.00 0.00 0.00
CalEEMod Version: CalEEMod.2016.3.2 Date: 11/17/2017 12:40 PMPage 3 of 32
1110 University Mixed Use Project - Bay Area AQMD Air District, Annual

2.2 Overall Operational
ROG NOx CO SO2 Fugitive PM10
Exhaust PM10
PM10 Total
Fugitive PM2.5
Exhaust PM2.5
PM2.5 Total
Bio- CO2 NBio- CO2 Total CO2 CH4 N2O CO2e
Category tons/yr MT/yr
Area 0.2981 5.5800e-003
0.4256 2.7000e-004
0.0198 0.0198 0.0198 0.0198 1.8236 1.2342 3.0578 3.4100e-003
1.2000e-004
3.1786
Energy 1.9500e-003
0.0167 7.3700e-003
1.1000e-004
1.3500e-003
1.3500e-003
1.3500e-003
1.3500e-003
0.0000 46.8715 46.8715 2.9700e-003
8.9000e-004
47.2119
Mobile 0.0529 0.2441 0.5746 1.6800e-003
0.1330 2.1600e-003
0.1352 0.0357 2.0400e-003
0.0378 0.0000 154.0988 154.0988 6.5800e-003
0.0000 154.2634
Waste 0.0000 0.0000 0.0000 0.0000 4.3257 0.0000 4.3257 0.2556 0.0000 10.7168
Water 0.0000 0.0000 0.0000 0.0000 0.8919 2.9804 3.8723 0.0919 2.2200e-003
6.8315
Total 0.3529 0.2664 1.0076 2.0600e-003
0.1330 0.0233 0.1564 0.0357 0.0232 0.0589 7.0412 205.1850 212.2263 0.3605 3.2300e-003
222.2023
Unmitigated Operational
Quarter Start Date End Date Maximum Unmitigated ROG + NOX (tons/quarter) Maximum Mitigated ROG + NOX (tons/quarter)
1 6-4-2018 9-3-2018 0.7546 0.7546
2 9-4-2018 12-3-2018 0.6806 0.6806
3 12-4-2018 3-3-2019 0.6329 0.6329
4 3-4-2019 6-3-2019 0.6509 0.6509
Highest 0.7546 0.7546
CalEEMod Version: CalEEMod.2016.3.2 Date: 11/17/2017 12:40 PMPage 4 of 32
1110 University Mixed Use Project - Bay Area AQMD Air District, Annual

2.2 Overall Operational
ROG NOx CO SO2 Fugitive PM10
Exhaust PM10
PM10 Total
Fugitive PM2.5
Exhaust PM2.5
PM2.5 Total
Bio- CO2 NBio- CO2 Total CO2 CH4 N2O CO2e
Category tons/yr MT/yr
Area 0.2981 5.5800e-003
0.4256 2.7000e-004
0.0198 0.0198 0.0198 0.0198 1.8236 1.2342 3.0578 3.4100e-003
1.2000e-004
3.1786
Energy 1.9500e-003
0.0167 7.3700e-003
1.1000e-004
1.3500e-003
1.3500e-003
1.3500e-003
1.3500e-003
0.0000 46.8715 46.8715 2.9700e-003
8.9000e-004
47.2119
Mobile 0.0529 0.2441 0.5746 1.6800e-003
0.1330 2.1600e-003
0.1352 0.0357 2.0400e-003
0.0378 0.0000 154.0988 154.0988 6.5800e-003
0.0000 154.2634
Waste 0.0000 0.0000 0.0000 0.0000 4.3257 0.0000 4.3257 0.2556 0.0000 10.7168
Water 0.0000 0.0000 0.0000 0.0000 0.8919 2.9804 3.8723 0.0919 2.2200e-003
6.8315
Total 0.3529 0.2664 1.0076 2.0600e-003
0.1330 0.0233 0.1564 0.0357 0.0232 0.0589 7.0412 205.1850 212.2263 0.3605 3.2300e-003
222.2023
Mitigated Operational
3.0 Construction Detail
Construction Phase
ROG NOx CO SO2 Fugitive PM10
Exhaust PM10
PM10 Total
Fugitive PM2.5
Exhaust PM2.5
PM2.5 Total
Bio- CO2 NBio-CO2 Total CO2 CH4 N20 CO2e
Percent Reduction
0.00 0.00 0.00 0.00 0.00 0.00 0.00 0.00 0.00 0.00 0.00 0.00 0.00 0.00 0.00 0.00
CalEEMod Version: CalEEMod.2016.3.2 Date: 11/17/2017 12:40 PMPage 5 of 32
1110 University Mixed Use Project - Bay Area AQMD Air District, Annual

Phase Number
Phase Name Phase Type Start Date End Date Num Days Week
Num Days Phase Description
1 Demolition Demolition 6/4/2018 6/29/2018 5 20
2 Site Preparation Site Preparation 6/30/2018 7/3/2018 5 2
3 Grading Grading 7/4/2018 7/9/2018 5 4
4 Building Construction Building Construction 7/10/2018 4/15/2019 5 200
5 Paving Paving 4/16/2019 4/29/2019 5 10
6 Architectural Coating Architectural Coating 4/30/2019 5/13/2019 5 10
OffRoad Equipment
Residential Indoor: 81,000; Residential Outdoor: 27,000; Non-Residential Indoor: 4,152; Non-Residential Outdoor: 1,384; Striped Parking Area: 0 (Architectural Coating – sqft)
Acres of Grading (Site Preparation Phase): 1
Acres of Grading (Grading Phase): 1.5
Acres of Paving: 0
CalEEMod Version: CalEEMod.2016.3.2 Date: 11/17/2017 12:40 PMPage 6 of 32
1110 University Mixed Use Project - Bay Area AQMD Air District, Annual

Phase Name Offroad Equipment Type Amount Usage Hours Horse Power Load Factor
Architectural Coating Air Compressors 1 6.00 78 0.48
Paving Cement and Mortar Mixers 1 6.00 9 0.56
Demolition Concrete/Industrial Saws 1 8.00 81 0.73
Building Construction Generator Sets 1 8.00 84 0.74
Building Construction Cranes 1 6.00 231 0.29
Building Construction Forklifts 1 6.00 89 0.20
Site Preparation Graders 1 8.00 187 0.41
Paving Pavers 1 6.00 130 0.42
Paving Rollers 1 7.00 80 0.38
Demolition Rubber Tired Dozers 1 8.00 247 0.40
Grading Rubber Tired Dozers 1 6.00 247 0.40
Building Construction Tractors/Loaders/Backhoes 1 6.00 97 0.37
Demolition Tractors/Loaders/Backhoes 3 8.00 97 0.37
Grading Tractors/Loaders/Backhoes 1 7.00 97 0.37
Paving Tractors/Loaders/Backhoes 1 8.00 97 0.37
Site Preparation Tractors/Loaders/Backhoes 1 8.00 97 0.37
Grading Graders 1 6.00 187 0.41
Paving Paving Equipment 1 8.00 132 0.36
Site Preparation Rubber Tired Dozers 1 7.00 247 0.40
Building Construction Welders 3 8.00 46 0.45
Trips and VMT
CalEEMod Version: CalEEMod.2016.3.2 Date: 11/17/2017 12:40 PMPage 7 of 32
1110 University Mixed Use Project - Bay Area AQMD Air District, Annual

3.2 Demolition - 2018
ROG NOx CO SO2 Fugitive PM10
Exhaust PM10
PM10 Total
Fugitive PM2.5
Exhaust PM2.5
PM2.5 Total
Bio- CO2 NBio- CO2 Total CO2 CH4 N2O CO2e
Category tons/yr MT/yr
Fugitive Dust 5.4500e-003
0.0000 5.4500e-003
8.3000e-004
0.0000 8.3000e-004
0.0000 0.0000 0.0000 0.0000 0.0000 0.0000
Off-Road 0.0248 0.2436 0.1511 2.4000e-004
0.0144 0.0144 0.0134 0.0134 0.0000 21.6923 21.6923 5.5000e-003
0.0000 21.8297
Total 0.0248 0.2436 0.1511 2.4000e-004
5.4500e-003
0.0144 0.0198 8.3000e-004
0.0134 0.0143 0.0000 21.6923 21.6923 5.5000e-003
0.0000 21.8297
Unmitigated Construction On-Site
3.1 Mitigation Measures Construction
Phase Name Offroad Equipment Count
Worker Trip Number
Vendor Trip Number
Hauling Trip Number
Worker Trip Length
Vendor Trip Length
Hauling Trip Length
Worker Vehicle Class
Vendor Vehicle Class
Hauling Vehicle Class
Demolition 5 13.00 0.00 50.00 10.80 7.30 20.00 LD_Mix HDT_Mix HHDT
Site Preparation 3 8.00 0.00 0.00 10.80 7.30 20.00 LD_Mix HDT_Mix HHDT
Grading 3 8.00 0.00 35.00 10.80 7.30 20.00 LD_Mix HDT_Mix HHDT
Building Construction 7 30.00 5.00 0.00 10.80 7.30 20.00 LD_Mix HDT_Mix HHDT
Paving 5 13.00 0.00 0.00 10.80 7.30 20.00 LD_Mix HDT_Mix HHDT
Architectural Coating 1 6.00 0.00 0.00 10.80 7.30 20.00 LD_Mix HDT_Mix HHDT
CalEEMod Version: CalEEMod.2016.3.2 Date: 11/17/2017 12:40 PMPage 8 of 32
1110 University Mixed Use Project - Bay Area AQMD Air District, Annual

3.2 Demolition - 2018
ROG NOx CO SO2 Fugitive PM10
Exhaust PM10
PM10 Total
Fugitive PM2.5
Exhaust PM2.5
PM2.5 Total
Bio- CO2 NBio- CO2 Total CO2 CH4 N2O CO2e
Category tons/yr MT/yr
Hauling 2.4000e-004
8.2400e-003
1.5700e-003
2.0000e-005
4.2000e-004
3.0000e-005
4.5000e-004
1.2000e-004
3.0000e-005
1.5000e-004
0.0000 1.9563 1.9563 1.0000e-004
0.0000 1.9589
Vendor 0.0000 0.0000 0.0000 0.0000 0.0000 0.0000 0.0000 0.0000 0.0000 0.0000 0.0000 0.0000 0.0000 0.0000 0.0000 0.0000
Worker 5.2000e-004
4.0000e-004
4.0200e-003
1.0000e-005
1.0300e-003
1.0000e-005
1.0300e-003
2.7000e-004
1.0000e-005
2.8000e-004
0.0000 0.9579 0.9579 3.0000e-005
0.0000 0.9587
Total 7.6000e-004
8.6400e-003
5.5900e-003
3.0000e-005
1.4500e-003
4.0000e-005
1.4800e-003
3.9000e-004
4.0000e-005
4.3000e-004
0.0000 2.9143 2.9143 1.3000e-004
0.0000 2.9176
Unmitigated Construction Off-Site
ROG NOx CO SO2 Fugitive PM10
Exhaust PM10
PM10 Total
Fugitive PM2.5
Exhaust PM2.5
PM2.5 Total
Bio- CO2 NBio- CO2 Total CO2 CH4 N2O CO2e
Category tons/yr MT/yr
Fugitive Dust 5.4500e-003
0.0000 5.4500e-003
8.3000e-004
0.0000 8.3000e-004
0.0000 0.0000 0.0000 0.0000 0.0000 0.0000
Off-Road 0.0248 0.2436 0.1511 2.4000e-004
0.0144 0.0144 0.0134 0.0134 0.0000 21.6923 21.6923 5.5000e-003
0.0000 21.8297
Total 0.0248 0.2436 0.1511 2.4000e-004
5.4500e-003
0.0144 0.0198 8.3000e-004
0.0134 0.0143 0.0000 21.6923 21.6923 5.5000e-003
0.0000 21.8297
Mitigated Construction On-Site
CalEEMod Version: CalEEMod.2016.3.2 Date: 11/17/2017 12:40 PMPage 9 of 32
1110 University Mixed Use Project - Bay Area AQMD Air District, Annual

3.2 Demolition - 2018
ROG NOx CO SO2 Fugitive PM10
Exhaust PM10
PM10 Total
Fugitive PM2.5
Exhaust PM2.5
PM2.5 Total
Bio- CO2 NBio- CO2 Total CO2 CH4 N2O CO2e
Category tons/yr MT/yr
Hauling 2.4000e-004
8.2400e-003
1.5700e-003
2.0000e-005
4.2000e-004
3.0000e-005
4.5000e-004
1.2000e-004
3.0000e-005
1.5000e-004
0.0000 1.9563 1.9563 1.0000e-004
0.0000 1.9589
Vendor 0.0000 0.0000 0.0000 0.0000 0.0000 0.0000 0.0000 0.0000 0.0000 0.0000 0.0000 0.0000 0.0000 0.0000 0.0000 0.0000
Worker 5.2000e-004
4.0000e-004
4.0200e-003
1.0000e-005
1.0300e-003
1.0000e-005
1.0300e-003
2.7000e-004
1.0000e-005
2.8000e-004
0.0000 0.9579 0.9579 3.0000e-005
0.0000 0.9587
Total 7.6000e-004
8.6400e-003
5.5900e-003
3.0000e-005
1.4500e-003
4.0000e-005
1.4800e-003
3.9000e-004
4.0000e-005
4.3000e-004
0.0000 2.9143 2.9143 1.3000e-004
0.0000 2.9176
Mitigated Construction Off-Site
3.3 Site Preparation - 2018
ROG NOx CO SO2 Fugitive PM10
Exhaust PM10
PM10 Total
Fugitive PM2.5
Exhaust PM2.5
PM2.5 Total
Bio- CO2 NBio- CO2 Total CO2 CH4 N2O CO2e
Category tons/yr MT/yr
Fugitive Dust 5.8000e-003
0.0000 5.8000e-003
2.9500e-003
0.0000 2.9500e-003
0.0000 0.0000 0.0000 0.0000 0.0000 0.0000
Off-Road 1.8100e-003
0.0208 8.0800e-003
2.0000e-005
9.5000e-004
9.5000e-004
8.8000e-004
8.8000e-004
0.0000 1.5743 1.5743 4.9000e-004
0.0000 1.5866
Total 1.8100e-003
0.0208 8.0800e-003
2.0000e-005
5.8000e-003
9.5000e-004
6.7500e-003
2.9500e-003
8.8000e-004
3.8300e-003
0.0000 1.5743 1.5743 4.9000e-004
0.0000 1.5866
Unmitigated Construction On-Site
CalEEMod Version: CalEEMod.2016.3.2 Date: 11/17/2017 12:40 PMPage 10 of 32
1110 University Mixed Use Project - Bay Area AQMD Air District, Annual
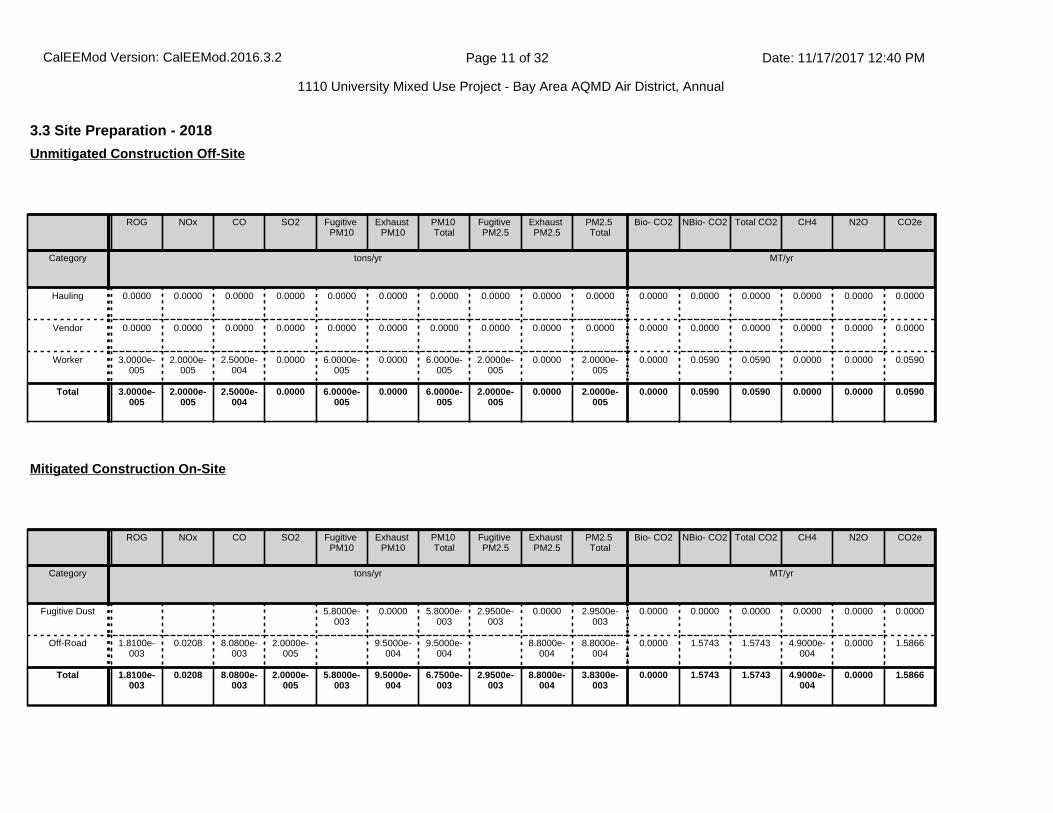
3.3 Site Preparation - 2018
ROG NOx CO SO2 Fugitive PM10
Exhaust PM10
PM10 Total
Fugitive PM2.5
Exhaust PM2.5
PM2.5 Total
Bio- CO2 NBio- CO2 Total CO2 CH4 N2O CO2e
Category tons/yr MT/yr
Hauling 0.0000 0.0000 0.0000 0.0000 0.0000 0.0000 0.0000 0.0000 0.0000 0.0000 0.0000 0.0000 0.0000 0.0000 0.0000 0.0000
Vendor 0.0000 0.0000 0.0000 0.0000 0.0000 0.0000 0.0000 0.0000 0.0000 0.0000 0.0000 0.0000 0.0000 0.0000 0.0000 0.0000
Worker 3.0000e-005
2.0000e-005
2.5000e-004
0.0000 6.0000e-005
0.0000 6.0000e-005
2.0000e-005
0.0000 2.0000e-005
0.0000 0.0590 0.0590 0.0000 0.0000 0.0590
Total 3.0000e-005
2.0000e-005
2.5000e-004
0.0000 6.0000e-005
0.0000 6.0000e-005
2.0000e-005
0.0000 2.0000e-005
0.0000 0.0590 0.0590 0.0000 0.0000 0.0590
Unmitigated Construction Off-Site
ROG NOx CO SO2 Fugitive PM10
Exhaust PM10
PM10 Total
Fugitive PM2.5
Exhaust PM2.5
PM2.5 Total
Bio- CO2 NBio- CO2 Total CO2 CH4 N2O CO2e
Category tons/yr MT/yr
Fugitive Dust 5.8000e-003
0.0000 5.8000e-003
2.9500e-003
0.0000 2.9500e-003
0.0000 0.0000 0.0000 0.0000 0.0000 0.0000
Off-Road 1.8100e-003
0.0208 8.0800e-003
2.0000e-005
9.5000e-004
9.5000e-004
8.8000e-004
8.8000e-004
0.0000 1.5743 1.5743 4.9000e-004
0.0000 1.5866
Total 1.8100e-003
0.0208 8.0800e-003
2.0000e-005
5.8000e-003
9.5000e-004
6.7500e-003
2.9500e-003
8.8000e-004
3.8300e-003
0.0000 1.5743 1.5743 4.9000e-004
0.0000 1.5866
Mitigated Construction On-Site
CalEEMod Version: CalEEMod.2016.3.2 Date: 11/17/2017 12:40 PMPage 11 of 32
1110 University Mixed Use Project - Bay Area AQMD Air District, Annual

3.3 Site Preparation - 2018
ROG NOx CO SO2 Fugitive PM10
Exhaust PM10
PM10 Total
Fugitive PM2.5
Exhaust PM2.5
PM2.5 Total
Bio- CO2 NBio- CO2 Total CO2 CH4 N2O CO2e
Category tons/yr MT/yr
Hauling 0.0000 0.0000 0.0000 0.0000 0.0000 0.0000 0.0000 0.0000 0.0000 0.0000 0.0000 0.0000 0.0000 0.0000 0.0000 0.0000
Vendor 0.0000 0.0000 0.0000 0.0000 0.0000 0.0000 0.0000 0.0000 0.0000 0.0000 0.0000 0.0000 0.0000 0.0000 0.0000 0.0000
Worker 3.0000e-005
2.0000e-005
2.5000e-004
0.0000 6.0000e-005
0.0000 6.0000e-005
2.0000e-005
0.0000 2.0000e-005
0.0000 0.0590 0.0590 0.0000 0.0000 0.0590
Total 3.0000e-005
2.0000e-005
2.5000e-004
0.0000 6.0000e-005
0.0000 6.0000e-005
2.0000e-005
0.0000 2.0000e-005
0.0000 0.0590 0.0590 0.0000 0.0000 0.0590
Mitigated Construction Off-Site
3.4 Grading - 2018
ROG NOx CO SO2 Fugitive PM10
Exhaust PM10
PM10 Total
Fugitive PM2.5
Exhaust PM2.5
PM2.5 Total
Bio- CO2 NBio- CO2 Total CO2 CH4 N2O CO2e
Category tons/yr MT/yr
Fugitive Dust 9.8400e-003
0.0000 9.8400e-003
5.0500e-003
0.0000 5.0500e-003
0.0000 0.0000 0.0000 0.0000 0.0000 0.0000
Off-Road 2.9900e-003
0.0341 0.0135 3.0000e-005
1.5900e-003
1.5900e-003
1.4600e-003
1.4600e-003
0.0000 2.5787 2.5787 8.0000e-004
0.0000 2.5988
Total 2.9900e-003
0.0341 0.0135 3.0000e-005
9.8400e-003
1.5900e-003
0.0114 5.0500e-003
1.4600e-003
6.5100e-003
0.0000 2.5787 2.5787 8.0000e-004
0.0000 2.5988
Unmitigated Construction On-Site
CalEEMod Version: CalEEMod.2016.3.2 Date: 11/17/2017 12:40 PMPage 12 of 32
1110 University Mixed Use Project - Bay Area AQMD Air District, Annual

3.4 Grading - 2018
ROG NOx CO SO2 Fugitive PM10
Exhaust PM10
PM10 Total
Fugitive PM2.5
Exhaust PM2.5
PM2.5 Total
Bio- CO2 NBio- CO2 Total CO2 CH4 N2O CO2e
Category tons/yr MT/yr
Hauling 1.7000e-004
5.7700e-003
1.1000e-003
1.0000e-005
3.0000e-004
2.0000e-005
3.2000e-004
8.0000e-005
2.0000e-005
1.0000e-004
0.0000 1.3694 1.3694 7.0000e-005
0.0000 1.3713
Vendor 0.0000 0.0000 0.0000 0.0000 0.0000 0.0000 0.0000 0.0000 0.0000 0.0000 0.0000 0.0000 0.0000 0.0000 0.0000 0.0000
Worker 6.0000e-005
5.0000e-005
4.9000e-004
0.0000 1.3000e-004
0.0000 1.3000e-004
3.0000e-005
0.0000 3.0000e-005
0.0000 0.1179 0.1179 0.0000 0.0000 0.1180
Total 2.3000e-004
5.8200e-003
1.5900e-003
1.0000e-005
4.3000e-004
2.0000e-005
4.5000e-004
1.1000e-004
2.0000e-005
1.3000e-004
0.0000 1.4873 1.4873 7.0000e-005
0.0000 1.4893
Unmitigated Construction Off-Site
ROG NOx CO SO2 Fugitive PM10
Exhaust PM10
PM10 Total
Fugitive PM2.5
Exhaust PM2.5
PM2.5 Total
Bio- CO2 NBio- CO2 Total CO2 CH4 N2O CO2e
Category tons/yr MT/yr
Fugitive Dust 9.8400e-003
0.0000 9.8400e-003
5.0500e-003
0.0000 5.0500e-003
0.0000 0.0000 0.0000 0.0000 0.0000 0.0000
Off-Road 2.9900e-003
0.0341 0.0135 3.0000e-005
1.5900e-003
1.5900e-003
1.4600e-003
1.4600e-003
0.0000 2.5787 2.5787 8.0000e-004
0.0000 2.5988
Total 2.9900e-003
0.0341 0.0135 3.0000e-005
9.8400e-003
1.5900e-003
0.0114 5.0500e-003
1.4600e-003
6.5100e-003
0.0000 2.5787 2.5787 8.0000e-004
0.0000 2.5988
Mitigated Construction On-Site
CalEEMod Version: CalEEMod.2016.3.2 Date: 11/17/2017 12:40 PMPage 13 of 32
1110 University Mixed Use Project - Bay Area AQMD Air District, Annual

3.4 Grading - 2018
ROG NOx CO SO2 Fugitive PM10
Exhaust PM10
PM10 Total
Fugitive PM2.5
Exhaust PM2.5
PM2.5 Total
Bio- CO2 NBio- CO2 Total CO2 CH4 N2O CO2e
Category tons/yr MT/yr
Hauling 1.7000e-004
5.7700e-003
1.1000e-003
1.0000e-005
3.0000e-004
2.0000e-005
3.2000e-004
8.0000e-005
2.0000e-005
1.0000e-004
0.0000 1.3694 1.3694 7.0000e-005
0.0000 1.3713
Vendor 0.0000 0.0000 0.0000 0.0000 0.0000 0.0000 0.0000 0.0000 0.0000 0.0000 0.0000 0.0000 0.0000 0.0000 0.0000 0.0000
Worker 6.0000e-005
5.0000e-005
4.9000e-004
0.0000 1.3000e-004
0.0000 1.3000e-004
3.0000e-005
0.0000 3.0000e-005
0.0000 0.1179 0.1179 0.0000 0.0000 0.1180
Total 2.3000e-004
5.8200e-003
1.5900e-003
1.0000e-005
4.3000e-004
2.0000e-005
4.5000e-004
1.1000e-004
2.0000e-005
1.3000e-004
0.0000 1.4873 1.4873 7.0000e-005
0.0000 1.4893
Mitigated Construction Off-Site
3.5 Building Construction - 2018
ROG NOx CO SO2 Fugitive PM10
Exhaust PM10
PM10 Total
Fugitive PM2.5
Exhaust PM2.5
PM2.5 Total
Bio- CO2 NBio- CO2 Total CO2 CH4 N2O CO2e
Category tons/yr MT/yr
Off-Road 0.1620 1.0893 0.8673 1.3800e-003
0.0661 0.0661 0.0639 0.0639 0.0000 115.1466 115.1466 0.0232 0.0000 115.7261
Total 0.1620 1.0893 0.8673 1.3800e-003
0.0661 0.0661 0.0639 0.0639 0.0000 115.1466 115.1466 0.0232 0.0000 115.7261
Unmitigated Construction On-Site
CalEEMod Version: CalEEMod.2016.3.2 Date: 11/17/2017 12:40 PMPage 14 of 32
1110 University Mixed Use Project - Bay Area AQMD Air District, Annual

3.5 Building Construction - 2018
ROG NOx CO SO2 Fugitive PM10
Exhaust PM10
PM10 Total
Fugitive PM2.5
Exhaust PM2.5
PM2.5 Total
Bio- CO2 NBio- CO2 Total CO2 CH4 N2O CO2e
Category tons/yr MT/yr
Hauling 0.0000 0.0000 0.0000 0.0000 0.0000 0.0000 0.0000 0.0000 0.0000 0.0000 0.0000 0.0000 0.0000 0.0000 0.0000 0.0000
Vendor 1.6400e-003
0.0419 0.0111 9.0000e-005
2.0500e-003
3.2000e-004
2.3700e-003
5.9000e-004
3.1000e-004
9.0000e-004
0.0000 8.2908 8.2908 4.8000e-004
0.0000 8.3027
Worker 7.5400e-003
5.7500e-003
0.0579 1.5000e-004
0.0148 1.0000e-004
0.0149 3.9400e-003
1.0000e-004
4.0400e-003
0.0000 13.8165 13.8165 4.1000e-004
0.0000 13.8267
Total 9.1800e-003
0.0476 0.0691 2.4000e-004
0.0169 4.2000e-004
0.0173 4.5300e-003
4.1000e-004
4.9400e-003
0.0000 22.1073 22.1073 8.9000e-004
0.0000 22.1294
Unmitigated Construction Off-Site
ROG NOx CO SO2 Fugitive PM10
Exhaust PM10
PM10 Total
Fugitive PM2.5
Exhaust PM2.5
PM2.5 Total
Bio- CO2 NBio- CO2 Total CO2 CH4 N2O CO2e
Category tons/yr MT/yr
Off-Road 0.1620 1.0893 0.8673 1.3800e-003
0.0661 0.0661 0.0639 0.0639 0.0000 115.1465 115.1465 0.0232 0.0000 115.7260
Total 0.1620 1.0893 0.8673 1.3800e-003
0.0661 0.0661 0.0639 0.0639 0.0000 115.1465 115.1465 0.0232 0.0000 115.7260
Mitigated Construction On-Site
CalEEMod Version: CalEEMod.2016.3.2 Date: 11/17/2017 12:40 PMPage 15 of 32
1110 University Mixed Use Project - Bay Area AQMD Air District, Annual

3.5 Building Construction - 2018
ROG NOx CO SO2 Fugitive PM10
Exhaust PM10
PM10 Total
Fugitive PM2.5
Exhaust PM2.5
PM2.5 Total
Bio- CO2 NBio- CO2 Total CO2 CH4 N2O CO2e
Category tons/yr MT/yr
Hauling 0.0000 0.0000 0.0000 0.0000 0.0000 0.0000 0.0000 0.0000 0.0000 0.0000 0.0000 0.0000 0.0000 0.0000 0.0000 0.0000
Vendor 1.6400e-003
0.0419 0.0111 9.0000e-005
2.0500e-003
3.2000e-004
2.3700e-003
5.9000e-004
3.1000e-004
9.0000e-004
0.0000 8.2908 8.2908 4.8000e-004
0.0000 8.3027
Worker 7.5400e-003
5.7500e-003
0.0579 1.5000e-004
0.0148 1.0000e-004
0.0149 3.9400e-003
1.0000e-004
4.0400e-003
0.0000 13.8165 13.8165 4.1000e-004
0.0000 13.8267
Total 9.1800e-003
0.0476 0.0691 2.4000e-004
0.0169 4.2000e-004
0.0173 4.5300e-003
4.1000e-004
4.9400e-003
0.0000 22.1073 22.1073 8.9000e-004
0.0000 22.1294
Mitigated Construction Off-Site
3.5 Building Construction - 2019
ROG NOx CO SO2 Fugitive PM10
Exhaust PM10
PM10 Total
Fugitive PM2.5
Exhaust PM2.5
PM2.5 Total
Bio- CO2 NBio- CO2 Total CO2 CH4 N2O CO2e
Category tons/yr MT/yr
Off-Road 0.0852 0.5993 0.5058 8.3000e-004
0.0343 0.0343 0.0332 0.0332 0.0000 68.6520 68.6520 0.0132 0.0000 68.9819
Total 0.0852 0.5993 0.5058 8.3000e-004
0.0343 0.0343 0.0332 0.0332 0.0000 68.6520 68.6520 0.0132 0.0000 68.9819
Unmitigated Construction On-Site
CalEEMod Version: CalEEMod.2016.3.2 Date: 11/17/2017 12:40 PMPage 16 of 32
1110 University Mixed Use Project - Bay Area AQMD Air District, Annual

3.5 Building Construction - 2019
ROG NOx CO SO2 Fugitive PM10
Exhaust PM10
PM10 Total
Fugitive PM2.5
Exhaust PM2.5
PM2.5 Total
Bio- CO2 NBio- CO2 Total CO2 CH4 N2O CO2e
Category tons/yr MT/yr
Hauling 0.0000 0.0000 0.0000 0.0000 0.0000 0.0000 0.0000 0.0000 0.0000 0.0000 0.0000 0.0000 0.0000 0.0000 0.0000 0.0000
Vendor 8.9000e-004
0.0237 6.0900e-003
5.0000e-005
1.2300e-003
1.6000e-004
1.3900e-003
3.6000e-004
1.6000e-004
5.1000e-004
0.0000 4.9411 4.9411 2.7000e-004
0.0000 4.9479
Worker 4.0800e-003
3.0200e-003
0.0308 9.0000e-005
8.8900e-003
6.0000e-005
8.9500e-003
2.3600e-003
6.0000e-005
2.4200e-003
0.0000 8.0412 8.0412 2.2000e-004
0.0000 8.0466
Total 4.9700e-003
0.0268 0.0369 1.4000e-004
0.0101 2.2000e-004
0.0103 2.7200e-003
2.2000e-004
2.9300e-003
0.0000 12.9823 12.9823 4.9000e-004
0.0000 12.9945
Unmitigated Construction Off-Site
ROG NOx CO SO2 Fugitive PM10
Exhaust PM10
PM10 Total
Fugitive PM2.5
Exhaust PM2.5
PM2.5 Total
Bio- CO2 NBio- CO2 Total CO2 CH4 N2O CO2e
Category tons/yr MT/yr
Off-Road 0.0852 0.5993 0.5058 8.3000e-004
0.0343 0.0343 0.0332 0.0332 0.0000 68.6519 68.6519 0.0132 0.0000 68.9818
Total 0.0852 0.5993 0.5058 8.3000e-004
0.0343 0.0343 0.0332 0.0332 0.0000 68.6519 68.6519 0.0132 0.0000 68.9818
Mitigated Construction On-Site
CalEEMod Version: CalEEMod.2016.3.2 Date: 11/17/2017 12:40 PMPage 17 of 32
1110 University Mixed Use Project - Bay Area AQMD Air District, Annual

3.5 Building Construction - 2019
ROG NOx CO SO2 Fugitive PM10
Exhaust PM10
PM10 Total
Fugitive PM2.5
Exhaust PM2.5
PM2.5 Total
Bio- CO2 NBio- CO2 Total CO2 CH4 N2O CO2e
Category tons/yr MT/yr
Hauling 0.0000 0.0000 0.0000 0.0000 0.0000 0.0000 0.0000 0.0000 0.0000 0.0000 0.0000 0.0000 0.0000 0.0000 0.0000 0.0000
Vendor 8.9000e-004
0.0237 6.0900e-003
5.0000e-005
1.2300e-003
1.6000e-004
1.3900e-003
3.6000e-004
1.6000e-004
5.1000e-004
0.0000 4.9411 4.9411 2.7000e-004
0.0000 4.9479
Worker 4.0800e-003
3.0200e-003
0.0308 9.0000e-005
8.8900e-003
6.0000e-005
8.9500e-003
2.3600e-003
6.0000e-005
2.4200e-003
0.0000 8.0412 8.0412 2.2000e-004
0.0000 8.0466
Total 4.9700e-003
0.0268 0.0369 1.4000e-004
0.0101 2.2000e-004
0.0103 2.7200e-003
2.2000e-004
2.9300e-003
0.0000 12.9823 12.9823 4.9000e-004
0.0000 12.9945
Mitigated Construction Off-Site
3.6 Paving - 2019
ROG NOx CO SO2 Fugitive PM10
Exhaust PM10
PM10 Total
Fugitive PM2.5
Exhaust PM2.5
PM2.5 Total
Bio- CO2 NBio- CO2 Total CO2 CH4 N2O CO2e
Category tons/yr MT/yr
Off-Road 4.5200e-003
0.0459 0.0445 7.0000e-005
2.6100e-003
2.6100e-003
2.4100e-003
2.4100e-003
0.0000 6.0105 6.0105 1.8700e-003
0.0000 6.0572
Paving 0.0000 0.0000 0.0000 0.0000 0.0000 0.0000 0.0000 0.0000 0.0000 0.0000 0.0000
Total 4.5200e-003
0.0459 0.0445 7.0000e-005
2.6100e-003
2.6100e-003
2.4100e-003
2.4100e-003
0.0000 6.0105 6.0105 1.8700e-003
0.0000 6.0572
Unmitigated Construction On-Site
CalEEMod Version: CalEEMod.2016.3.2 Date: 11/17/2017 12:40 PMPage 18 of 32
1110 University Mixed Use Project - Bay Area AQMD Air District, Annual

3.6 Paving - 2019
ROG NOx CO SO2 Fugitive PM10
Exhaust PM10
PM10 Total
Fugitive PM2.5
Exhaust PM2.5
PM2.5 Total
Bio- CO2 NBio- CO2 Total CO2 CH4 N2O CO2e
Category tons/yr MT/yr
Hauling 0.0000 0.0000 0.0000 0.0000 0.0000 0.0000 0.0000 0.0000 0.0000 0.0000 0.0000 0.0000 0.0000 0.0000 0.0000 0.0000
Vendor 0.0000 0.0000 0.0000 0.0000 0.0000 0.0000 0.0000 0.0000 0.0000 0.0000 0.0000 0.0000 0.0000 0.0000 0.0000 0.0000
Worker 2.4000e-004
1.7000e-004
1.7800e-003
1.0000e-005
5.1000e-004
0.0000 5.2000e-004
1.4000e-004
0.0000 1.4000e-004
0.0000 0.4646 0.4646 1.0000e-005
0.0000 0.4649
Total 2.4000e-004
1.7000e-004
1.7800e-003
1.0000e-005
5.1000e-004
0.0000 5.2000e-004
1.4000e-004
0.0000 1.4000e-004
0.0000 0.4646 0.4646 1.0000e-005
0.0000 0.4649
Unmitigated Construction Off-Site
ROG NOx CO SO2 Fugitive PM10
Exhaust PM10
PM10 Total
Fugitive PM2.5
Exhaust PM2.5
PM2.5 Total
Bio- CO2 NBio- CO2 Total CO2 CH4 N2O CO2e
Category tons/yr MT/yr
Off-Road 4.5200e-003
0.0459 0.0445 7.0000e-005
2.6100e-003
2.6100e-003
2.4100e-003
2.4100e-003
0.0000 6.0105 6.0105 1.8700e-003
0.0000 6.0572
Paving 0.0000 0.0000 0.0000 0.0000 0.0000 0.0000 0.0000 0.0000 0.0000 0.0000 0.0000
Total 4.5200e-003
0.0459 0.0445 7.0000e-005
2.6100e-003
2.6100e-003
2.4100e-003
2.4100e-003
0.0000 6.0105 6.0105 1.8700e-003
0.0000 6.0572
Mitigated Construction On-Site
CalEEMod Version: CalEEMod.2016.3.2 Date: 11/17/2017 12:40 PMPage 19 of 32
1110 University Mixed Use Project - Bay Area AQMD Air District, Annual

3.6 Paving - 2019
ROG NOx CO SO2 Fugitive PM10
Exhaust PM10
PM10 Total
Fugitive PM2.5
Exhaust PM2.5
PM2.5 Total
Bio- CO2 NBio- CO2 Total CO2 CH4 N2O CO2e
Category tons/yr MT/yr
Hauling 0.0000 0.0000 0.0000 0.0000 0.0000 0.0000 0.0000 0.0000 0.0000 0.0000 0.0000 0.0000 0.0000 0.0000 0.0000 0.0000
Vendor 0.0000 0.0000 0.0000 0.0000 0.0000 0.0000 0.0000 0.0000 0.0000 0.0000 0.0000 0.0000 0.0000 0.0000 0.0000 0.0000
Worker 2.4000e-004
1.7000e-004
1.7800e-003
1.0000e-005
5.1000e-004
0.0000 5.2000e-004
1.4000e-004
0.0000 1.4000e-004
0.0000 0.4646 0.4646 1.0000e-005
0.0000 0.4649
Total 2.4000e-004
1.7000e-004
1.7800e-003
1.0000e-005
5.1000e-004
0.0000 5.2000e-004
1.4000e-004
0.0000 1.4000e-004
0.0000 0.4646 0.4646 1.0000e-005
0.0000 0.4649
Mitigated Construction Off-Site
3.7 Architectural Coating - 2019
ROG NOx CO SO2 Fugitive PM10
Exhaust PM10
PM10 Total
Fugitive PM2.5
Exhaust PM2.5
PM2.5 Total
Bio- CO2 NBio- CO2 Total CO2 CH4 N2O CO2e
Category tons/yr MT/yr
Archit. Coating 0.2960 0.0000 0.0000 0.0000 0.0000 0.0000 0.0000 0.0000 0.0000 0.0000 0.0000
Off-Road 1.3300e-003
9.1800e-003
9.2100e-003
1.0000e-005
6.4000e-004
6.4000e-004
6.4000e-004
6.4000e-004
0.0000 1.2766 1.2766 1.1000e-004
0.0000 1.2793
Total 0.2973 9.1800e-003
9.2100e-003
1.0000e-005
6.4000e-004
6.4000e-004
6.4000e-004
6.4000e-004
0.0000 1.2766 1.2766 1.1000e-004
0.0000 1.2793
Unmitigated Construction On-Site
CalEEMod Version: CalEEMod.2016.3.2 Date: 11/17/2017 12:40 PMPage 20 of 32
1110 University Mixed Use Project - Bay Area AQMD Air District, Annual

3.7 Architectural Coating - 2019
ROG NOx CO SO2 Fugitive PM10
Exhaust PM10
PM10 Total
Fugitive PM2.5
Exhaust PM2.5
PM2.5 Total
Bio- CO2 NBio- CO2 Total CO2 CH4 N2O CO2e
Category tons/yr MT/yr
Hauling 0.0000 0.0000 0.0000 0.0000 0.0000 0.0000 0.0000 0.0000 0.0000 0.0000 0.0000 0.0000 0.0000 0.0000 0.0000 0.0000
Vendor 0.0000 0.0000 0.0000 0.0000 0.0000 0.0000 0.0000 0.0000 0.0000 0.0000 0.0000 0.0000 0.0000 0.0000 0.0000 0.0000
Worker 1.1000e-004
8.0000e-005
8.2000e-004
0.0000 2.4000e-004
0.0000 2.4000e-004
6.0000e-005
0.0000 6.0000e-005
0.0000 0.2144 0.2144 1.0000e-005
0.0000 0.2146
Total 1.1000e-004
8.0000e-005
8.2000e-004
0.0000 2.4000e-004
0.0000 2.4000e-004
6.0000e-005
0.0000 6.0000e-005
0.0000 0.2144 0.2144 1.0000e-005
0.0000 0.2146
Unmitigated Construction Off-Site
ROG NOx CO SO2 Fugitive PM10
Exhaust PM10
PM10 Total
Fugitive PM2.5
Exhaust PM2.5
PM2.5 Total
Bio- CO2 NBio- CO2 Total CO2 CH4 N2O CO2e
Category tons/yr MT/yr
Archit. Coating 0.2960 0.0000 0.0000 0.0000 0.0000 0.0000 0.0000 0.0000 0.0000 0.0000 0.0000
Off-Road 1.3300e-003
9.1800e-003
9.2100e-003
1.0000e-005
6.4000e-004
6.4000e-004
6.4000e-004
6.4000e-004
0.0000 1.2766 1.2766 1.1000e-004
0.0000 1.2793
Total 0.2973 9.1800e-003
9.2100e-003
1.0000e-005
6.4000e-004
6.4000e-004
6.4000e-004
6.4000e-004
0.0000 1.2766 1.2766 1.1000e-004
0.0000 1.2793
Mitigated Construction On-Site
CalEEMod Version: CalEEMod.2016.3.2 Date: 11/17/2017 12:40 PMPage 21 of 32
1110 University Mixed Use Project - Bay Area AQMD Air District, Annual

4.0 Operational Detail - Mobile
4.1 Mitigation Measures Mobile
3.7 Architectural Coating - 2019
ROG NOx CO SO2 Fugitive PM10
Exhaust PM10
PM10 Total
Fugitive PM2.5
Exhaust PM2.5
PM2.5 Total
Bio- CO2 NBio- CO2 Total CO2 CH4 N2O CO2e
Category tons/yr MT/yr
Hauling 0.0000 0.0000 0.0000 0.0000 0.0000 0.0000 0.0000 0.0000 0.0000 0.0000 0.0000 0.0000 0.0000 0.0000 0.0000 0.0000
Vendor 0.0000 0.0000 0.0000 0.0000 0.0000 0.0000 0.0000 0.0000 0.0000 0.0000 0.0000 0.0000 0.0000 0.0000 0.0000 0.0000
Worker 1.1000e-004
8.0000e-005
8.2000e-004
0.0000 2.4000e-004
0.0000 2.4000e-004
6.0000e-005
0.0000 6.0000e-005
0.0000 0.2144 0.2144 1.0000e-005
0.0000 0.2146
Total 1.1000e-004
8.0000e-005
8.2000e-004
0.0000 2.4000e-004
0.0000 2.4000e-004
6.0000e-005
0.0000 6.0000e-005
0.0000 0.2144 0.2144 1.0000e-005
0.0000 0.2146
Mitigated Construction Off-Site
CalEEMod Version: CalEEMod.2016.3.2 Date: 11/17/2017 12:40 PMPage 22 of 32
1110 University Mixed Use Project - Bay Area AQMD Air District, Annual

ROG NOx CO SO2 Fugitive PM10
Exhaust PM10
PM10 Total
Fugitive PM2.5
Exhaust PM2.5
PM2.5 Total
Bio- CO2 NBio- CO2 Total CO2 CH4 N2O CO2e
Category tons/yr MT/yr
Mitigated 0.0529 0.2441 0.5746 1.6800e-003
0.1330 2.1600e-003
0.1352 0.0357 2.0400e-003
0.0378 0.0000 154.0988 154.0988 6.5800e-003
0.0000 154.2634
Unmitigated 0.0529 0.2441 0.5746 1.6800e-003
0.1330 2.1600e-003
0.1352 0.0357 2.0400e-003
0.0378 0.0000 154.0988 154.0988 6.5800e-003
0.0000 154.2634
4.2 Trip Summary Information
4.3 Trip Type Information
Average Daily Trip Rate Unmitigated Mitigated
Land Use Weekday Saturday Sunday Annual VMT Annual VMT
Apartments Mid Rise 123.20 118.00 108.40 277,945 277,945
Strip Mall 56.19 53.70 26.13 79,374 79,374
Total 179.39 171.70 134.53 357,318 357,318
Miles Trip % Trip Purpose %
Land Use H-W or C-W H-S or C-C H-O or C-NW H-W or C-W H-S or C-C H-O or C-NW Primary Diverted Pass-by
Apartments Mid Rise 10.80 4.80 5.70 31.00 15.00 54.00 86 11 3
Strip Mall 9.50 7.30 7.30 16.60 64.40 19.00 45 40 15
4.4 Fleet Mix
Land Use LDA LDT1 LDT2 MDV LHD1 LHD2 MHD HHD OBUS UBUS MCY SBUS MH
Apartments Mid Rise 0.570523 0.041853 0.194077 0.115893 0.018544 0.005373 0.016909 0.024079 0.002502 0.002562 0.005975 0.000872 0.000837
Strip Mall 0.570523 0.041853 0.194077 0.115893 0.018544 0.005373 0.016909 0.024079 0.002502 0.002562 0.005975 0.000872 0.000837
CalEEMod Version: CalEEMod.2016.3.2 Date: 11/17/2017 12:40 PMPage 23 of 32
1110 University Mixed Use Project - Bay Area AQMD Air District, Annual

5.0 Energy Detail
ROG NOx CO SO2 Fugitive PM10
Exhaust PM10
PM10 Total
Fugitive PM2.5
Exhaust PM2.5
PM2.5 Total
Bio- CO2 NBio- CO2 Total CO2 CH4 N2O CO2e
Category tons/yr MT/yr
Electricity Mitigated
0.0000 0.0000 0.0000 0.0000 0.0000 27.5565 27.5565 2.6000e-003
5.4000e-004
27.7821
Electricity Unmitigated
0.0000 0.0000 0.0000 0.0000 0.0000 27.5565 27.5565 2.6000e-003
5.4000e-004
27.7821
NaturalGas Mitigated
1.9500e-003
0.0167 7.3700e-003
1.1000e-004
1.3500e-003
1.3500e-003
1.3500e-003
1.3500e-003
0.0000 19.3150 19.3150 3.7000e-004
3.5000e-004
19.4298
NaturalGas Unmitigated
1.9500e-003
0.0167 7.3700e-003
1.1000e-004
1.3500e-003
1.3500e-003
1.3500e-003
1.3500e-003
0.0000 19.3150 19.3150 3.7000e-004
3.5000e-004
19.4298
5.1 Mitigation Measures Energy
Historical Energy Use: N
CalEEMod Version: CalEEMod.2016.3.2 Date: 11/17/2017 12:40 PMPage 24 of 32
1110 University Mixed Use Project - Bay Area AQMD Air District, Annual

5.2 Energy by Land Use - NaturalGas
NaturalGas Use
ROG NOx CO SO2 Fugitive PM10
Exhaust PM10
PM10 Total
Fugitive PM2.5
Exhaust PM2.5
PM2.5 Total
Bio- CO2 NBio- CO2 Total CO2 CH4 N2O CO2e
Land Use kBTU/yr tons/yr MT/yr
Apartments Mid Rise
349217 1.8800e-003
0.0161 6.8500e-003
1.0000e-004
1.3000e-003
1.3000e-003
1.3000e-003
1.3000e-003
0.0000 18.6356 18.6356 3.6000e-004
3.4000e-004
18.7463
Strip Mall 12732.8 7.0000e-005
6.2000e-004
5.2000e-004
0.0000 5.0000e-005
5.0000e-005
5.0000e-005
5.0000e-005
0.0000 0.6795 0.6795 1.0000e-005
1.0000e-005
0.6835
Total 1.9500e-003
0.0167 7.3700e-003
1.0000e-004
1.3500e-003
1.3500e-003
1.3500e-003
1.3500e-003
0.0000 19.3150 19.3150 3.7000e-004
3.5000e-004
19.4298
Unmitigated
NaturalGas Use
ROG NOx CO SO2 Fugitive PM10
Exhaust PM10
PM10 Total
Fugitive PM2.5
Exhaust PM2.5
PM2.5 Total
Bio- CO2 NBio- CO2 Total CO2 CH4 N2O CO2e
Land Use kBTU/yr tons/yr MT/yr
Apartments Mid Rise
349217 1.8800e-003
0.0161 6.8500e-003
1.0000e-004
1.3000e-003
1.3000e-003
1.3000e-003
1.3000e-003
0.0000 18.6356 18.6356 3.6000e-004
3.4000e-004
18.7463
Strip Mall 12732.8 7.0000e-005
6.2000e-004
5.2000e-004
0.0000 5.0000e-005
5.0000e-005
5.0000e-005
5.0000e-005
0.0000 0.6795 0.6795 1.0000e-005
1.0000e-005
0.6835
Total 1.9500e-003
0.0167 7.3700e-003
1.0000e-004
1.3500e-003
1.3500e-003
1.3500e-003
1.3500e-003
0.0000 19.3150 19.3150 3.7000e-004
3.5000e-004
19.4298
Mitigated
CalEEMod Version: CalEEMod.2016.3.2 Date: 11/17/2017 12:40 PMPage 25 of 32
1110 University Mixed Use Project - Bay Area AQMD Air District, Annual

6.1 Mitigation Measures Area
6.0 Area Detail
5.3 Energy by Land Use - Electricity
Electricity Use
Total CO2 CH4 N2O CO2e
Land Use kWh/yr MT/yr
Apartments Mid Rise
168880 23.5170 2.2200e-003
4.6000e-004
23.7095
Strip Mall 29008.6 4.0395 3.8000e-004
8.0000e-005
4.0726
Total 27.5565 2.6000e-003
5.4000e-004
27.7821
Unmitigated
Electricity Use
Total CO2 CH4 N2O CO2e
Land Use kWh/yr MT/yr
Apartments Mid Rise
168880 23.5170 2.2200e-003
4.6000e-004
23.7095
Strip Mall 29008.6 4.0395 3.8000e-004
8.0000e-005
4.0726
Total 27.5565 2.6000e-003
5.4000e-004
27.7821
Mitigated
CalEEMod Version: CalEEMod.2016.3.2 Date: 11/17/2017 12:40 PMPage 26 of 32
1110 University Mixed Use Project - Bay Area AQMD Air District, Annual

ROG NOx CO SO2 Fugitive PM10
Exhaust PM10
PM10 Total
Fugitive PM2.5
Exhaust PM2.5
PM2.5 Total
Bio- CO2 NBio- CO2 Total CO2 CH4 N2O CO2e
Category tons/yr MT/yr
Mitigated 0.2981 5.5800e-003
0.4256 2.7000e-004
0.0198 0.0198 0.0198 0.0198 1.8236 1.2342 3.0578 3.4100e-003
1.2000e-004
3.1786
Unmitigated 0.2981 5.5800e-003
0.4256 2.7000e-004
0.0198 0.0198 0.0198 0.0198 1.8236 1.2342 3.0578 3.4100e-003
1.2000e-004
3.1786
6.2 Area by SubCategory
ROG NOx CO SO2 Fugitive PM10
Exhaust PM10
PM10 Total
Fugitive PM2.5
Exhaust PM2.5
PM2.5 Total
Bio- CO2 NBio- CO2 Total CO2 CH4 N2O CO2e
SubCategory tons/yr MT/yr
Architectural Coating
0.0296 0.0000 0.0000 0.0000 0.0000 0.0000 0.0000 0.0000 0.0000 0.0000 0.0000
Consumer Products
0.1670 0.0000 0.0000 0.0000 0.0000 0.0000 0.0000 0.0000 0.0000 0.0000 0.0000
Hearth 0.0923 2.1200e-003
0.1271 2.5000e-004
0.0182 0.0182 0.0182 0.0182 1.8236 0.7490 2.5726 2.9300e-003
1.2000e-004
2.6815
Landscaping 9.1400e-003
3.4600e-003
0.2985 2.0000e-005
1.6400e-003
1.6400e-003
1.6400e-003
1.6400e-003
0.0000 0.4852 0.4852 4.8000e-004
0.0000 0.4971
Total 0.2981 5.5800e-003
0.4256 2.7000e-004
0.0198 0.0198 0.0198 0.0198 1.8236 1.2342 3.0578 3.4100e-003
1.2000e-004
3.1786
Unmitigated
CalEEMod Version: CalEEMod.2016.3.2 Date: 11/17/2017 12:40 PMPage 27 of 32
1110 University Mixed Use Project - Bay Area AQMD Air District, Annual

7.1 Mitigation Measures Water
7.0 Water Detail
6.2 Area by SubCategory
ROG NOx CO SO2 Fugitive PM10
Exhaust PM10
PM10 Total
Fugitive PM2.5
Exhaust PM2.5
PM2.5 Total
Bio- CO2 NBio- CO2 Total CO2 CH4 N2O CO2e
SubCategory tons/yr MT/yr
Architectural Coating
0.0296 0.0000 0.0000 0.0000 0.0000 0.0000 0.0000 0.0000 0.0000 0.0000 0.0000
Consumer Products
0.1670 0.0000 0.0000 0.0000 0.0000 0.0000 0.0000 0.0000 0.0000 0.0000 0.0000
Hearth 0.0923 2.1200e-003
0.1271 2.5000e-004
0.0182 0.0182 0.0182 0.0182 1.8236 0.7490 2.5726 2.9300e-003
1.2000e-004
2.6815
Landscaping 9.1400e-003
3.4600e-003
0.2985 2.0000e-005
1.6400e-003
1.6400e-003
1.6400e-003
1.6400e-003
0.0000 0.4852 0.4852 4.8000e-004
0.0000 0.4971
Total 0.2981 5.5800e-003
0.4256 2.7000e-004
0.0198 0.0198 0.0198 0.0198 1.8236 1.2342 3.0578 3.4100e-003
1.2000e-004
3.1786
Mitigated
CalEEMod Version: CalEEMod.2016.3.2 Date: 11/17/2017 12:40 PMPage 28 of 32
1110 University Mixed Use Project - Bay Area AQMD Air District, Annual
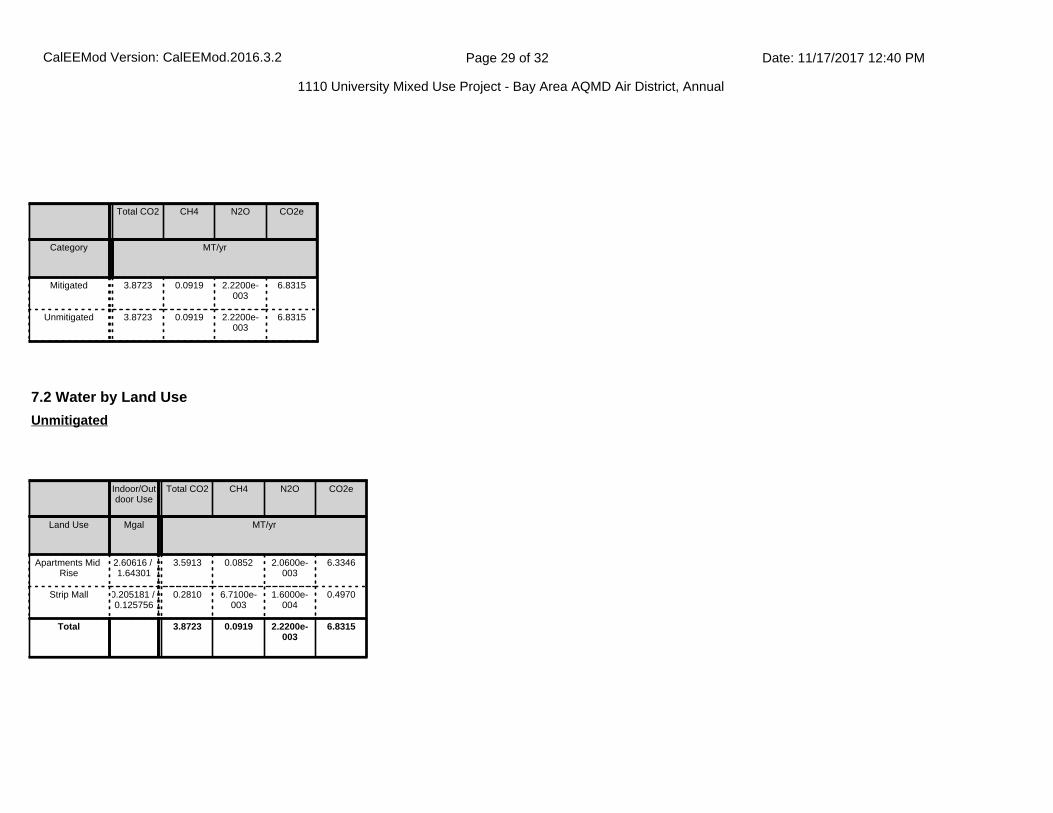
Total CO2 CH4 N2O CO2e
Category MT/yr
Mitigated 3.8723 0.0919 2.2200e-003
6.8315
Unmitigated 3.8723 0.0919 2.2200e-003
6.8315
7.2 Water by Land Use
Indoor/Outdoor Use
Total CO2 CH4 N2O CO2e
Land Use Mgal MT/yr
Apartments Mid Rise
2.60616 / 1.64301
3.5913 0.0852 2.0600e-003
6.3346
Strip Mall 0.205181 / 0.125756
0.2810 6.7100e-003
1.6000e-004
0.4970
Total 3.8723 0.0919 2.2200e-003
6.8315
Unmitigated
CalEEMod Version: CalEEMod.2016.3.2 Date: 11/17/2017 12:40 PMPage 29 of 32
1110 University Mixed Use Project - Bay Area AQMD Air District, Annual

8.1 Mitigation Measures Waste
7.2 Water by Land Use
Indoor/Outdoor Use
Total CO2 CH4 N2O CO2e
Land Use Mgal MT/yr
Apartments Mid Rise
2.60616 / 1.64301
3.5913 0.0852 2.0600e-003
6.3346
Strip Mall 0.205181 / 0.125756
0.2810 6.7100e-003
1.6000e-004
0.4970
Total 3.8723 0.0919 2.2200e-003
6.8315
Mitigated
8.0 Waste Detail
Total CO2 CH4 N2O CO2e
MT/yr
Mitigated 4.3257 0.2556 0.0000 10.7168
Unmitigated 4.3257 0.2556 0.0000 10.7168
Category/Year
CalEEMod Version: CalEEMod.2016.3.2 Date: 11/17/2017 12:40 PMPage 30 of 32
1110 University Mixed Use Project - Bay Area AQMD Air District, Annual

8.2 Waste by Land Use
Waste Disposed
Total CO2 CH4 N2O CO2e
Land Use tons MT/yr
Apartments Mid Rise
18.4 3.7350 0.2207 0.0000 9.2534
Strip Mall 2.91 0.5907 0.0349 0.0000 1.4634
Total 4.3257 0.2556 0.0000 10.7168
Unmitigated
Waste Disposed
Total CO2 CH4 N2O CO2e
Land Use tons MT/yr
Apartments Mid Rise
18.4 3.7350 0.2207 0.0000 9.2534
Strip Mall 2.91 0.5907 0.0349 0.0000 1.4634
Total 4.3257 0.2556 0.0000 10.7168
Mitigated
9.0 Operational Offroad
Equipment Type Number Hours/Day Days/Year Horse Power Load Factor Fuel Type
CalEEMod Version: CalEEMod.2016.3.2 Date: 11/17/2017 12:40 PMPage 31 of 32
1110 University Mixed Use Project - Bay Area AQMD Air District, Annual

11.0 Vegetation
10.0 Stationary Equipment
Fire Pumps and Emergency Generators
Equipment Type Number Hours/Day Hours/Year Horse Power Load Factor Fuel Type
Boilers
Equipment Type Number Heat Input/Day Heat Input/Year Boiler Rating Fuel Type
User Defined Equipment
Equipment Type Number
CalEEMod Version: CalEEMod.2016.3.2 Date: 11/17/2017 12:40 PMPage 32 of 32
1110 University Mixed Use Project - Bay Area AQMD Air District, Annual
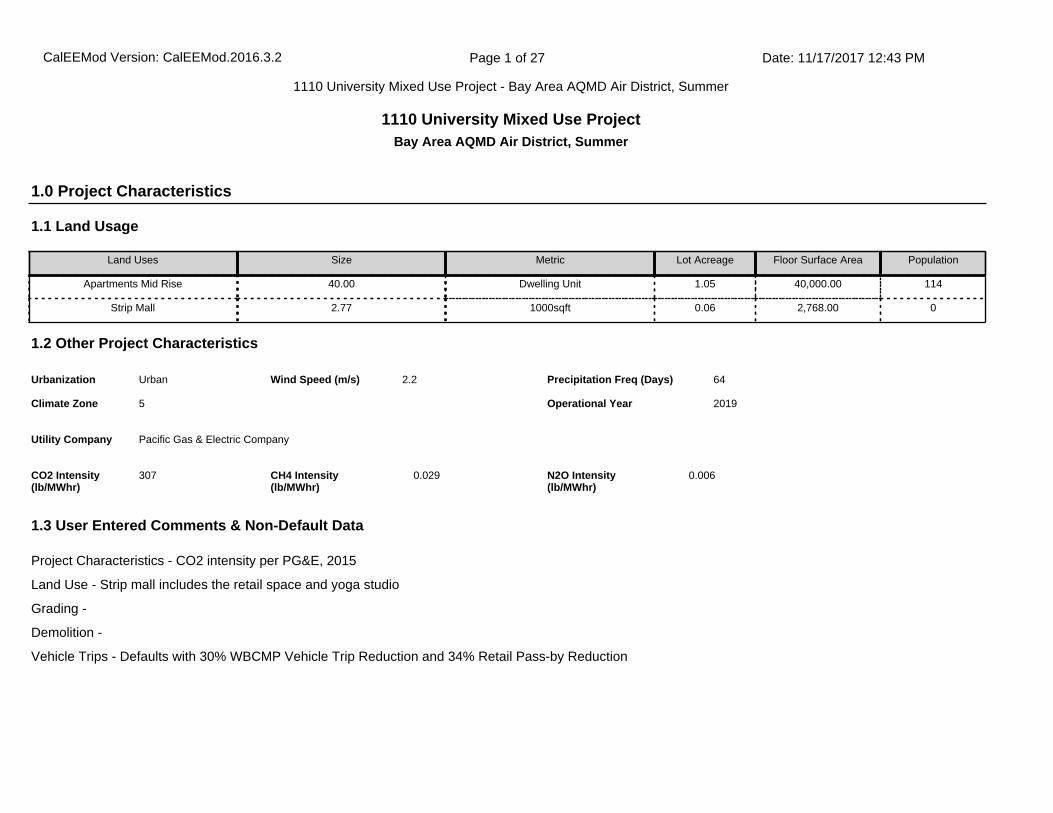
Project Characteristics - CO2 intensity per PG&E, 2015
Land Use - Strip mall includes the retail space and yoga studio
Grading -
Demolition -
Vehicle Trips - Defaults with 30% WBCMP Vehicle Trip Reduction and 34% Retail Pass-by Reduction
1.1 Land Usage
Land Uses Size Metric Lot Acreage Floor Surface Area Population
Apartments Mid Rise 40.00 Dwelling Unit 1.05 40,000.00 114
Strip Mall 2.77 1000sqft 0.06 2,768.00 0
1.2 Other Project Characteristics
Urbanization
Climate Zone
Urban
5
Wind Speed (m/s) Precipitation Freq (Days)2.2 64
1.3 User Entered Comments & Non-Default Data
1.0 Project Characteristics
Utility Company Pacific Gas & Electric Company
2019Operational Year
CO2 Intensity (lb/MWhr)
307 0.029CH4 Intensity (lb/MWhr)
0.006N2O Intensity (lb/MWhr)
1110 University Mixed Use ProjectBay Area AQMD Air District, Summer
CalEEMod Version: CalEEMod.2016.3.2 Date: 11/17/2017 12:43 PMPage 1 of 27
1110 University Mixed Use Project - Bay Area AQMD Air District, Summer

2.0 Emissions Summary
Table Name Column Name Default Value New Value
tblGrading MaterialExported 0.00 278.00
tblProjectCharacteristics CO2IntensityFactor 641.35 307
tblVehicleTrips ST_TR 6.39 2.95
tblVehicleTrips ST_TR 42.04 19.40
tblVehicleTrips SU_TR 5.86 2.71
tblVehicleTrips SU_TR 20.43 9.44
tblVehicleTrips WD_TR 6.65 3.08
tblVehicleTrips WD_TR 44.32 20.30
CalEEMod Version: CalEEMod.2016.3.2 Date: 11/17/2017 12:43 PMPage 2 of 27
1110 University Mixed Use Project - Bay Area AQMD Air District, Summer

2.1 Overall Construction (Maximum Daily Emission)
ROG NOx CO SO2 Fugitive PM10
Exhaust PM10
PM10 Total
Fugitive PM2.5
Exhaust PM2.5
PM2.5 Total
Bio- CO2 NBio- CO2 Total CO2 CH4 N2O CO2e
Year lb/day lb/day
2018 2.7441 25.2065 15.6980 0.0273 5.8653 1.4404 6.8180 2.9711 1.3467 3.8476 0.0000 2,721.8534
2,721.8534
0.6203 0.0000 2,737.3597
2019 59.4912 16.6761 14.5341 0.0260 0.2803 0.9218 1.2021 0.0751 0.8902 0.9653 0.0000 2,419.0253
2,419.0253
0.4141 0.0000 2,429.0869
Maximum 59.4912 25.2065 15.6980 0.0273 5.8653 1.4404 6.8180 2.9711 1.3467 3.8476 0.0000 2,721.8534
2,721.8534
0.6203 0.0000 2,737.3597
Unmitigated Construction
ROG NOx CO SO2 Fugitive PM10
Exhaust PM10
PM10 Total
Fugitive PM2.5
Exhaust PM2.5
PM2.5 Total
Bio- CO2 NBio- CO2 Total CO2 CH4 N2O CO2e
Year lb/day lb/day
2018 2.7441 25.2065 15.6980 0.0273 5.8653 1.4404 6.8180 2.9711 1.3467 3.8476 0.0000 2,721.8534
2,721.8534
0.6203 0.0000 2,737.3597
2019 59.4912 16.6761 14.5341 0.0260 0.2803 0.9218 1.2021 0.0751 0.8902 0.9653 0.0000 2,419.0253
2,419.0253
0.4141 0.0000 2,429.0869
Maximum 59.4912 25.2065 15.6980 0.0273 5.8653 1.4404 6.8180 2.9711 1.3467 3.8476 0.0000 2,721.8534
2,721.8534
0.6203 0.0000 2,737.3597
Mitigated Construction
ROG NOx CO SO2 Fugitive PM10
Exhaust PM10
PM10 Total
Fugitive PM2.5
Exhaust PM2.5
PM2.5 Total
Bio- CO2 NBio-CO2 Total CO2 CH4 N20 CO2e
Percent Reduction
0.00 0.00 0.00 0.00 0.00 0.00 0.00 0.00 0.00 0.00 0.00 0.00 0.00 0.00 0.00 0.00
CalEEMod Version: CalEEMod.2016.3.2 Date: 11/17/2017 12:43 PMPage 3 of 27
1110 University Mixed Use Project - Bay Area AQMD Air District, Summer

2.2 Overall Operational
ROG NOx CO SO2 Fugitive PM10
Exhaust PM10
PM10 Total
Fugitive PM2.5
Exhaust PM2.5
PM2.5 Total
Bio- CO2 NBio- CO2 Total CO2 CH4 N2O CO2e
Category lb/day lb/day
Area 17.6294 0.4021 25.0509 0.0421 3.1037 3.1037 3.1037 3.1037 334.8339 154.1780 489.0118 0.4640 0.0237 507.6655
Energy 0.0107 0.0916 0.0404 5.8000e-004
7.3900e-003
7.3900e-003
7.3900e-003
7.3900e-003
116.6640 116.6640 2.2400e-003
2.1400e-003
117.3573
Mobile 0.3459 1.3492 3.3679 0.0102 0.7887 0.0123 0.8010 0.2111 0.0116 0.2227 1,027.0777
1,027.0777
0.0416 1,028.1179
Total 17.9860 1.8429 28.4592 0.0528 0.7887 3.1234 3.9121 0.2111 3.1227 3.3338 334.8339 1,297.9196
1,632.7535
0.5079 0.0258 1,653.1406
Unmitigated Operational
ROG NOx CO SO2 Fugitive PM10
Exhaust PM10
PM10 Total
Fugitive PM2.5
Exhaust PM2.5
PM2.5 Total
Bio- CO2 NBio- CO2 Total CO2 CH4 N2O CO2e
Category lb/day lb/day
Area 17.6294 0.4021 25.0509 0.0421 3.1037 3.1037 3.1037 3.1037 334.8339 154.1780 489.0118 0.4640 0.0237 507.6655
Energy 0.0107 0.0916 0.0404 5.8000e-004
7.3900e-003
7.3900e-003
7.3900e-003
7.3900e-003
116.6640 116.6640 2.2400e-003
2.1400e-003
117.3573
Mobile 0.3459 1.3492 3.3679 0.0102 0.7887 0.0123 0.8010 0.2111 0.0116 0.2227 1,027.0777
1,027.0777
0.0416 1,028.1179
Total 17.9860 1.8429 28.4592 0.0528 0.7887 3.1234 3.9121 0.2111 3.1227 3.3338 334.8339 1,297.9196
1,632.7535
0.5079 0.0258 1,653.1406
Mitigated Operational
CalEEMod Version: CalEEMod.2016.3.2 Date: 11/17/2017 12:43 PMPage 4 of 27
1110 University Mixed Use Project - Bay Area AQMD Air District, Summer
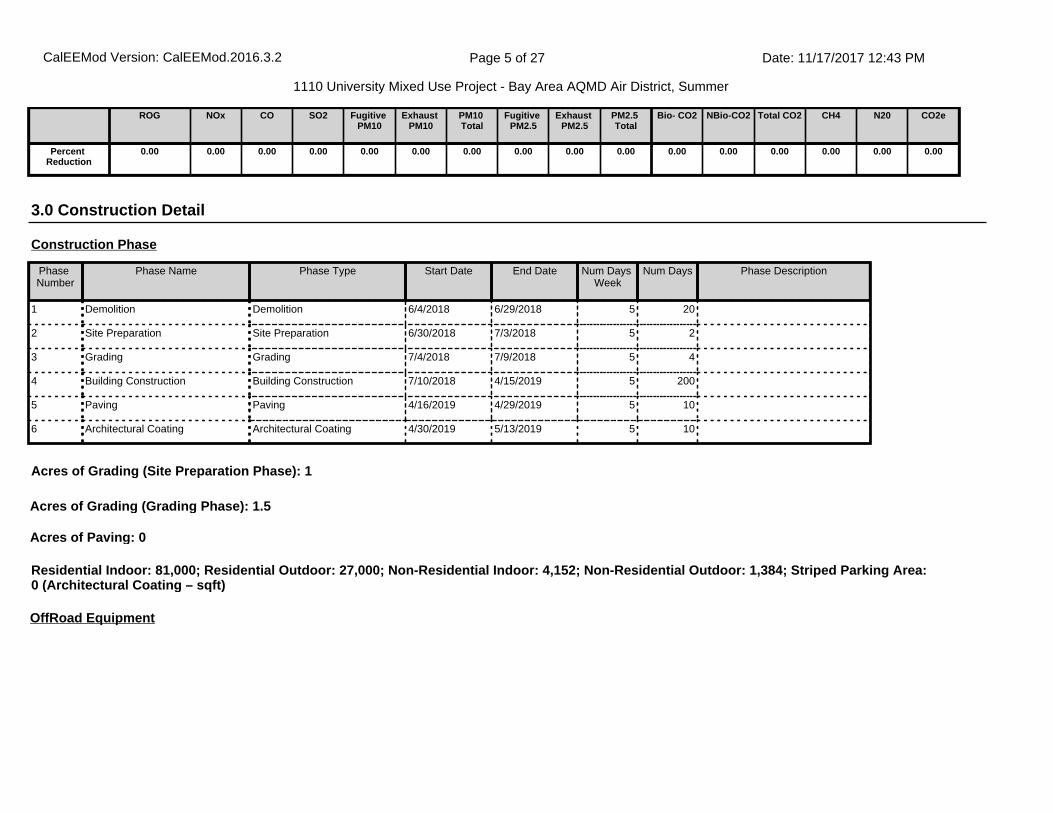
3.0 Construction Detail
Construction Phase
Phase Number
Phase Name Phase Type Start Date End Date Num Days Week
Num Days Phase Description
1 Demolition Demolition 6/4/2018 6/29/2018 5 20
2 Site Preparation Site Preparation 6/30/2018 7/3/2018 5 2
3 Grading Grading 7/4/2018 7/9/2018 5 4
4 Building Construction Building Construction 7/10/2018 4/15/2019 5 200
5 Paving Paving 4/16/2019 4/29/2019 5 10
6 Architectural Coating Architectural Coating 4/30/2019 5/13/2019 5 10
OffRoad Equipment
ROG NOx CO SO2 Fugitive PM10
Exhaust PM10
PM10 Total
Fugitive PM2.5
Exhaust PM2.5
PM2.5 Total
Bio- CO2 NBio-CO2 Total CO2 CH4 N20 CO2e
Percent Reduction
0.00 0.00 0.00 0.00 0.00 0.00 0.00 0.00 0.00 0.00 0.00 0.00 0.00 0.00 0.00 0.00
Residential Indoor: 81,000; Residential Outdoor: 27,000; Non-Residential Indoor: 4,152; Non-Residential Outdoor: 1,384; Striped Parking Area: 0 (Architectural Coating – sqft)
Acres of Grading (Site Preparation Phase): 1
Acres of Grading (Grading Phase): 1.5
Acres of Paving: 0
CalEEMod Version: CalEEMod.2016.3.2 Date: 11/17/2017 12:43 PMPage 5 of 27
1110 University Mixed Use Project - Bay Area AQMD Air District, Summer

Phase Name Offroad Equipment Type Amount Usage Hours Horse Power Load Factor
Architectural Coating Air Compressors 1 6.00 78 0.48
Paving Cement and Mortar Mixers 1 6.00 9 0.56
Demolition Concrete/Industrial Saws 1 8.00 81 0.73
Building Construction Generator Sets 1 8.00 84 0.74
Building Construction Cranes 1 6.00 231 0.29
Building Construction Forklifts 1 6.00 89 0.20
Site Preparation Graders 1 8.00 187 0.41
Paving Pavers 1 6.00 130 0.42
Paving Rollers 1 7.00 80 0.38
Demolition Rubber Tired Dozers 1 8.00 247 0.40
Grading Rubber Tired Dozers 1 6.00 247 0.40
Building Construction Tractors/Loaders/Backhoes 1 6.00 97 0.37
Demolition Tractors/Loaders/Backhoes 3 8.00 97 0.37
Grading Tractors/Loaders/Backhoes 1 7.00 97 0.37
Paving Tractors/Loaders/Backhoes 1 8.00 97 0.37
Site Preparation Tractors/Loaders/Backhoes 1 8.00 97 0.37
Grading Graders 1 6.00 187 0.41
Paving Paving Equipment 1 8.00 132 0.36
Site Preparation Rubber Tired Dozers 1 7.00 247 0.40
Building Construction Welders 3 8.00 46 0.45
Trips and VMT
CalEEMod Version: CalEEMod.2016.3.2 Date: 11/17/2017 12:43 PMPage 6 of 27
1110 University Mixed Use Project - Bay Area AQMD Air District, Summer

3.2 Demolition - 2018
ROG NOx CO SO2 Fugitive PM10
Exhaust PM10
PM10 Total
Fugitive PM2.5
Exhaust PM2.5
PM2.5 Total
Bio- CO2 NBio- CO2 Total CO2 CH4 N2O CO2e
Category lb/day lb/day
Fugitive Dust 0.5451 0.0000 0.5451 0.0825 0.0000 0.0825 0.0000 0.0000
Off-Road 2.4838 24.3641 15.1107 0.0241 1.4365 1.4365 1.3429 1.3429 2,391.1659
2,391.1659
0.6058 2,406.3105
Total 2.4838 24.3641 15.1107 0.0241 0.5451 1.4365 1.9816 0.0825 1.3429 1.4254 2,391.1659
2,391.1659
0.6058 2,406.3105
Unmitigated Construction On-Site
3.1 Mitigation Measures Construction
Phase Name Offroad Equipment Count
Worker Trip Number
Vendor Trip Number
Hauling Trip Number
Worker Trip Length
Vendor Trip Length
Hauling Trip Length
Worker Vehicle Class
Vendor Vehicle Class
Hauling Vehicle Class
Demolition 5 13.00 0.00 50.00 10.80 7.30 20.00 LD_Mix HDT_Mix HHDT
Site Preparation 3 8.00 0.00 0.00 10.80 7.30 20.00 LD_Mix HDT_Mix HHDT
Grading 3 8.00 0.00 35.00 10.80 7.30 20.00 LD_Mix HDT_Mix HHDT
Building Construction 7 30.00 5.00 0.00 10.80 7.30 20.00 LD_Mix HDT_Mix HHDT
Paving 5 13.00 0.00 0.00 10.80 7.30 20.00 LD_Mix HDT_Mix HHDT
Architectural Coating 1 6.00 0.00 0.00 10.80 7.30 20.00 LD_Mix HDT_Mix HHDT
CalEEMod Version: CalEEMod.2016.3.2 Date: 11/17/2017 12:43 PMPage 7 of 27
1110 University Mixed Use Project - Bay Area AQMD Air District, Summer

3.2 Demolition - 2018
ROG NOx CO SO2 Fugitive PM10
Exhaust PM10
PM10 Total
Fugitive PM2.5
Exhaust PM2.5
PM2.5 Total
Bio- CO2 NBio- CO2 Total CO2 CH4 N2O CO2e
Category lb/day lb/day
Hauling 0.0237 0.8070 0.1517 2.0400e-003
0.0437 3.2400e-003
0.0469 0.0120 3.1000e-003
0.0151 217.1242 217.1242 0.0112 217.4030
Vendor 0.0000 0.0000 0.0000 0.0000 0.0000 0.0000 0.0000 0.0000 0.0000 0.0000 0.0000 0.0000 0.0000 0.0000
Worker 0.0548 0.0354 0.4355 1.1400e-003
0.1068 7.2000e-004
0.1075 0.0283 6.6000e-004
0.0290 113.5633 113.5633 3.3200e-003
113.6462
Total 0.0784 0.8424 0.5872 3.1800e-003
0.1505 3.9600e-003
0.1544 0.0403 3.7600e-003
0.0441 330.6875 330.6875 0.0145 331.0492
Unmitigated Construction Off-Site
ROG NOx CO SO2 Fugitive PM10
Exhaust PM10
PM10 Total
Fugitive PM2.5
Exhaust PM2.5
PM2.5 Total
Bio- CO2 NBio- CO2 Total CO2 CH4 N2O CO2e
Category lb/day lb/day
Fugitive Dust 0.5451 0.0000 0.5451 0.0825 0.0000 0.0825 0.0000 0.0000
Off-Road 2.4838 24.3641 15.1107 0.0241 1.4365 1.4365 1.3429 1.3429 0.0000 2,391.1659
2,391.1659
0.6058 2,406.3105
Total 2.4838 24.3641 15.1107 0.0241 0.5451 1.4365 1.9816 0.0825 1.3429 1.4254 0.0000 2,391.1659
2,391.1659
0.6058 2,406.3105
Mitigated Construction On-Site
CalEEMod Version: CalEEMod.2016.3.2 Date: 11/17/2017 12:43 PMPage 8 of 27
1110 University Mixed Use Project - Bay Area AQMD Air District, Summer

3.2 Demolition - 2018
ROG NOx CO SO2 Fugitive PM10
Exhaust PM10
PM10 Total
Fugitive PM2.5
Exhaust PM2.5
PM2.5 Total
Bio- CO2 NBio- CO2 Total CO2 CH4 N2O CO2e
Category lb/day lb/day
Hauling 0.0237 0.8070 0.1517 2.0400e-003
0.0437 3.2400e-003
0.0469 0.0120 3.1000e-003
0.0151 217.1242 217.1242 0.0112 217.4030
Vendor 0.0000 0.0000 0.0000 0.0000 0.0000 0.0000 0.0000 0.0000 0.0000 0.0000 0.0000 0.0000 0.0000 0.0000
Worker 0.0548 0.0354 0.4355 1.1400e-003
0.1068 7.2000e-004
0.1075 0.0283 6.6000e-004
0.0290 113.5633 113.5633 3.3200e-003
113.6462
Total 0.0784 0.8424 0.5872 3.1800e-003
0.1505 3.9600e-003
0.1544 0.0403 3.7600e-003
0.0441 330.6875 330.6875 0.0145 331.0492
Mitigated Construction Off-Site
3.3 Site Preparation - 2018
ROG NOx CO SO2 Fugitive PM10
Exhaust PM10
PM10 Total
Fugitive PM2.5
Exhaust PM2.5
PM2.5 Total
Bio- CO2 NBio- CO2 Total CO2 CH4 N2O CO2e
Category lb/day lb/day
Fugitive Dust 5.7996 0.0000 5.7996 2.9537 0.0000 2.9537 0.0000 0.0000
Off-Road 1.8061 20.7472 8.0808 0.0172 0.9523 0.9523 0.8761 0.8761 1,735.3630
1,735.3630
0.5402 1,748.8690
Total 1.8061 20.7472 8.0808 0.0172 5.7996 0.9523 6.7518 2.9537 0.8761 3.8298 1,735.3630
1,735.3630
0.5402 1,748.8690
Unmitigated Construction On-Site
CalEEMod Version: CalEEMod.2016.3.2 Date: 11/17/2017 12:43 PMPage 9 of 27
1110 University Mixed Use Project - Bay Area AQMD Air District, Summer

3.3 Site Preparation - 2018
ROG NOx CO SO2 Fugitive PM10
Exhaust PM10
PM10 Total
Fugitive PM2.5
Exhaust PM2.5
PM2.5 Total
Bio- CO2 NBio- CO2 Total CO2 CH4 N2O CO2e
Category lb/day lb/day
Hauling 0.0000 0.0000 0.0000 0.0000 0.0000 0.0000 0.0000 0.0000 0.0000 0.0000 0.0000 0.0000 0.0000 0.0000
Vendor 0.0000 0.0000 0.0000 0.0000 0.0000 0.0000 0.0000 0.0000 0.0000 0.0000 0.0000 0.0000 0.0000 0.0000
Worker 0.0337 0.0218 0.2680 7.0000e-004
0.0657 4.4000e-004
0.0662 0.0174 4.1000e-004
0.0178 69.8851 69.8851 2.0400e-003
69.9361
Total 0.0337 0.0218 0.2680 7.0000e-004
0.0657 4.4000e-004
0.0662 0.0174 4.1000e-004
0.0178 69.8851 69.8851 2.0400e-003
69.9361
Unmitigated Construction Off-Site
ROG NOx CO SO2 Fugitive PM10
Exhaust PM10
PM10 Total
Fugitive PM2.5
Exhaust PM2.5
PM2.5 Total
Bio- CO2 NBio- CO2 Total CO2 CH4 N2O CO2e
Category lb/day lb/day
Fugitive Dust 5.7996 0.0000 5.7996 2.9537 0.0000 2.9537 0.0000 0.0000
Off-Road 1.8061 20.7472 8.0808 0.0172 0.9523 0.9523 0.8761 0.8761 0.0000 1,735.3630
1,735.3630
0.5402 1,748.8690
Total 1.8061 20.7472 8.0808 0.0172 5.7996 0.9523 6.7518 2.9537 0.8761 3.8298 0.0000 1,735.3630
1,735.3630
0.5402 1,748.8690
Mitigated Construction On-Site
CalEEMod Version: CalEEMod.2016.3.2 Date: 11/17/2017 12:43 PMPage 10 of 27
1110 University Mixed Use Project - Bay Area AQMD Air District, Summer

3.3 Site Preparation - 2018
ROG NOx CO SO2 Fugitive PM10
Exhaust PM10
PM10 Total
Fugitive PM2.5
Exhaust PM2.5
PM2.5 Total
Bio- CO2 NBio- CO2 Total CO2 CH4 N2O CO2e
Category lb/day lb/day
Hauling 0.0000 0.0000 0.0000 0.0000 0.0000 0.0000 0.0000 0.0000 0.0000 0.0000 0.0000 0.0000 0.0000 0.0000
Vendor 0.0000 0.0000 0.0000 0.0000 0.0000 0.0000 0.0000 0.0000 0.0000 0.0000 0.0000 0.0000 0.0000 0.0000
Worker 0.0337 0.0218 0.2680 7.0000e-004
0.0657 4.4000e-004
0.0662 0.0174 4.1000e-004
0.0178 69.8851 69.8851 2.0400e-003
69.9361
Total 0.0337 0.0218 0.2680 7.0000e-004
0.0657 4.4000e-004
0.0662 0.0174 4.1000e-004
0.0178 69.8851 69.8851 2.0400e-003
69.9361
Mitigated Construction Off-Site
3.4 Grading - 2018
ROG NOx CO SO2 Fugitive PM10
Exhaust PM10
PM10 Total
Fugitive PM2.5
Exhaust PM2.5
PM2.5 Total
Bio- CO2 NBio- CO2 Total CO2 CH4 N2O CO2e
Category lb/day lb/day
Fugitive Dust 4.9221 0.0000 4.9221 2.5268 0.0000 2.5268 0.0000 0.0000
Off-Road 1.4972 17.0666 6.7630 0.0141 0.7947 0.7947 0.7311 0.7311 1,421.2605
1,421.2605
0.4425 1,432.3219
Total 1.4972 17.0666 6.7630 0.0141 4.9221 0.7947 5.7168 2.5268 0.7311 3.2579 1,421.2605
1,421.2605
0.4425 1,432.3219
Unmitigated Construction On-Site
CalEEMod Version: CalEEMod.2016.3.2 Date: 11/17/2017 12:43 PMPage 11 of 27
1110 University Mixed Use Project - Bay Area AQMD Air District, Summer

3.4 Grading - 2018
ROG NOx CO SO2 Fugitive PM10
Exhaust PM10
PM10 Total
Fugitive PM2.5
Exhaust PM2.5
PM2.5 Total
Bio- CO2 NBio- CO2 Total CO2 CH4 N2O CO2e
Category lb/day lb/day
Hauling 0.0829 2.8246 0.5309 7.1200e-003
0.1529 0.0114 0.1642 0.0419 0.0109 0.0528 759.9346 759.9346 0.0390 760.9104
Vendor 0.0000 0.0000 0.0000 0.0000 0.0000 0.0000 0.0000 0.0000 0.0000 0.0000 0.0000 0.0000 0.0000 0.0000
Worker 0.0337 0.0218 0.2680 7.0000e-004
0.0657 4.4000e-004
0.0662 0.0174 4.1000e-004
0.0178 69.8851 69.8851 2.0400e-003
69.9361
Total 0.1166 2.8463 0.7990 7.8200e-003
0.2186 0.0118 0.2304 0.0593 0.0113 0.0706 829.8197 829.8197 0.0411 830.8466
Unmitigated Construction Off-Site
ROG NOx CO SO2 Fugitive PM10
Exhaust PM10
PM10 Total
Fugitive PM2.5
Exhaust PM2.5
PM2.5 Total
Bio- CO2 NBio- CO2 Total CO2 CH4 N2O CO2e
Category lb/day lb/day
Fugitive Dust 4.9221 0.0000 4.9221 2.5268 0.0000 2.5268 0.0000 0.0000
Off-Road 1.4972 17.0666 6.7630 0.0141 0.7947 0.7947 0.7311 0.7311 0.0000 1,421.2605
1,421.2605
0.4425 1,432.3219
Total 1.4972 17.0666 6.7630 0.0141 4.9221 0.7947 5.7168 2.5268 0.7311 3.2579 0.0000 1,421.2605
1,421.2605
0.4425 1,432.3219
Mitigated Construction On-Site
CalEEMod Version: CalEEMod.2016.3.2 Date: 11/17/2017 12:43 PMPage 12 of 27
1110 University Mixed Use Project - Bay Area AQMD Air District, Summer
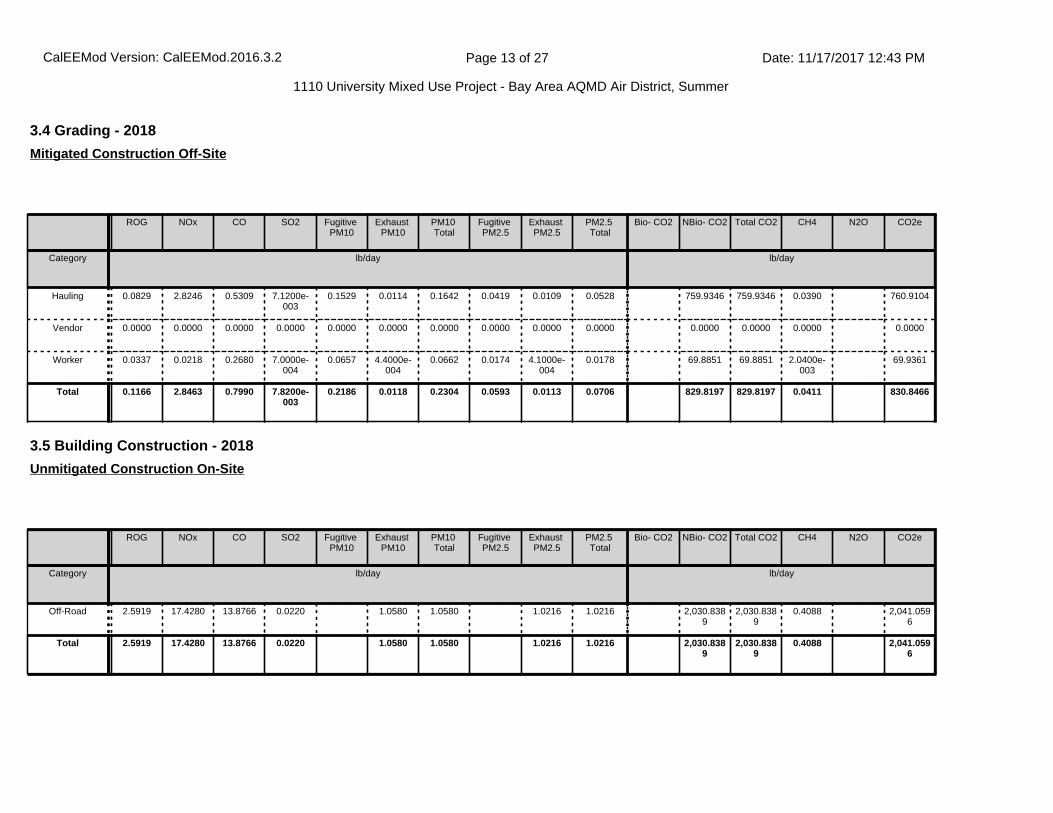
3.4 Grading - 2018
ROG NOx CO SO2 Fugitive PM10
Exhaust PM10
PM10 Total
Fugitive PM2.5
Exhaust PM2.5
PM2.5 Total
Bio- CO2 NBio- CO2 Total CO2 CH4 N2O CO2e
Category lb/day lb/day
Hauling 0.0829 2.8246 0.5309 7.1200e-003
0.1529 0.0114 0.1642 0.0419 0.0109 0.0528 759.9346 759.9346 0.0390 760.9104
Vendor 0.0000 0.0000 0.0000 0.0000 0.0000 0.0000 0.0000 0.0000 0.0000 0.0000 0.0000 0.0000 0.0000 0.0000
Worker 0.0337 0.0218 0.2680 7.0000e-004
0.0657 4.4000e-004
0.0662 0.0174 4.1000e-004
0.0178 69.8851 69.8851 2.0400e-003
69.9361
Total 0.1166 2.8463 0.7990 7.8200e-003
0.2186 0.0118 0.2304 0.0593 0.0113 0.0706 829.8197 829.8197 0.0411 830.8466
Mitigated Construction Off-Site
3.5 Building Construction - 2018
ROG NOx CO SO2 Fugitive PM10
Exhaust PM10
PM10 Total
Fugitive PM2.5
Exhaust PM2.5
PM2.5 Total
Bio- CO2 NBio- CO2 Total CO2 CH4 N2O CO2e
Category lb/day lb/day
Off-Road 2.5919 17.4280 13.8766 0.0220 1.0580 1.0580 1.0216 1.0216 2,030.8389
2,030.8389
0.4088 2,041.0596
Total 2.5919 17.4280 13.8766 0.0220 1.0580 1.0580 1.0216 1.0216 2,030.8389
2,030.8389
0.4088 2,041.0596
Unmitigated Construction On-Site
CalEEMod Version: CalEEMod.2016.3.2 Date: 11/17/2017 12:43 PMPage 13 of 27
1110 University Mixed Use Project - Bay Area AQMD Air District, Summer

3.5 Building Construction - 2018
ROG NOx CO SO2 Fugitive PM10
Exhaust PM10
PM10 Total
Fugitive PM2.5
Exhaust PM2.5
PM2.5 Total
Bio- CO2 NBio- CO2 Total CO2 CH4 N2O CO2e
Category lb/day lb/day
Hauling 0.0000 0.0000 0.0000 0.0000 0.0000 0.0000 0.0000 0.0000 0.0000 0.0000 0.0000 0.0000 0.0000 0.0000
Vendor 0.0258 0.6602 0.1672 1.4000e-003
0.0338 5.1100e-003
0.0390 9.7400e-003
4.8900e-003
0.0146 147.7489 147.7489 8.1200e-003
147.9518
Worker 0.1264 0.0816 1.0051 2.6300e-003
0.2464 1.6600e-003
0.2481 0.0654 1.5300e-003
0.0669 262.0692 262.0692 7.6500e-003
262.2605
Total 0.1522 0.7418 1.1723 4.0300e-003
0.2803 6.7700e-003
0.2871 0.0751 6.4200e-003
0.0815 409.8180 409.8180 0.0158 410.2123
Unmitigated Construction Off-Site
ROG NOx CO SO2 Fugitive PM10
Exhaust PM10
PM10 Total
Fugitive PM2.5
Exhaust PM2.5
PM2.5 Total
Bio- CO2 NBio- CO2 Total CO2 CH4 N2O CO2e
Category lb/day lb/day
Off-Road 2.5919 17.4280 13.8766 0.0220 1.0580 1.0580 1.0216 1.0216 0.0000 2,030.8389
2,030.8389
0.4088 2,041.0596
Total 2.5919 17.4280 13.8766 0.0220 1.0580 1.0580 1.0216 1.0216 0.0000 2,030.8389
2,030.8389
0.4088 2,041.0596
Mitigated Construction On-Site
CalEEMod Version: CalEEMod.2016.3.2 Date: 11/17/2017 12:43 PMPage 14 of 27
1110 University Mixed Use Project - Bay Area AQMD Air District, Summer

3.5 Building Construction - 2018
ROG NOx CO SO2 Fugitive PM10
Exhaust PM10
PM10 Total
Fugitive PM2.5
Exhaust PM2.5
PM2.5 Total
Bio- CO2 NBio- CO2 Total CO2 CH4 N2O CO2e
Category lb/day lb/day
Hauling 0.0000 0.0000 0.0000 0.0000 0.0000 0.0000 0.0000 0.0000 0.0000 0.0000 0.0000 0.0000 0.0000 0.0000
Vendor 0.0258 0.6602 0.1672 1.4000e-003
0.0338 5.1100e-003
0.0390 9.7400e-003
4.8900e-003
0.0146 147.7489 147.7489 8.1200e-003
147.9518
Worker 0.1264 0.0816 1.0051 2.6300e-003
0.2464 1.6600e-003
0.2481 0.0654 1.5300e-003
0.0669 262.0692 262.0692 7.6500e-003
262.2605
Total 0.1522 0.7418 1.1723 4.0300e-003
0.2803 6.7700e-003
0.2871 0.0751 6.4200e-003
0.0815 409.8180 409.8180 0.0158 410.2123
Mitigated Construction Off-Site
3.5 Building Construction - 2019
ROG NOx CO SO2 Fugitive PM10
Exhaust PM10
PM10 Total
Fugitive PM2.5
Exhaust PM2.5
PM2.5 Total
Bio- CO2 NBio- CO2 Total CO2 CH4 N2O CO2e
Category lb/day lb/day
Off-Road 2.2721 15.9802 13.4870 0.0220 0.9158 0.9158 0.8846 0.8846 2,018.0224
2,018.0224
0.3879 2,027.7210
Total 2.2721 15.9802 13.4870 0.0220 0.9158 0.9158 0.8846 0.8846 2,018.0224
2,018.0224
0.3879 2,027.7210
Unmitigated Construction On-Site
CalEEMod Version: CalEEMod.2016.3.2 Date: 11/17/2017 12:43 PMPage 15 of 27
1110 University Mixed Use Project - Bay Area AQMD Air District, Summer

3.5 Building Construction - 2019
ROG NOx CO SO2 Fugitive PM10
Exhaust PM10
PM10 Total
Fugitive PM2.5
Exhaust PM2.5
PM2.5 Total
Bio- CO2 NBio- CO2 Total CO2 CH4 N2O CO2e
Category lb/day lb/day
Hauling 0.0000 0.0000 0.0000 0.0000 0.0000 0.0000 0.0000 0.0000 0.0000 0.0000 0.0000 0.0000 0.0000 0.0000
Vendor 0.0232 0.6245 0.1525 1.3900e-003
0.0338 4.3200e-003
0.0382 9.7400e-003
4.1300e-003
0.0139 146.7775 146.7775 7.7600e-003
146.9716
Worker 0.1141 0.0715 0.8946 2.5500e-003
0.2464 1.6300e-003
0.2481 0.0654 1.5000e-003
0.0669 254.2254 254.2254 6.7600e-003
254.3943
Total 0.1373 0.6959 1.0470 3.9400e-003
0.2803 5.9500e-003
0.2862 0.0751 5.6300e-003
0.0808 401.0029 401.0029 0.0145 401.3659
Unmitigated Construction Off-Site
ROG NOx CO SO2 Fugitive PM10
Exhaust PM10
PM10 Total
Fugitive PM2.5
Exhaust PM2.5
PM2.5 Total
Bio- CO2 NBio- CO2 Total CO2 CH4 N2O CO2e
Category lb/day lb/day
Off-Road 2.2721 15.9802 13.4870 0.0220 0.9158 0.9158 0.8846 0.8846 0.0000 2,018.0224
2,018.0224
0.3879 2,027.7210
Total 2.2721 15.9802 13.4870 0.0220 0.9158 0.9158 0.8846 0.8846 0.0000 2,018.0224
2,018.0224
0.3879 2,027.7210
Mitigated Construction On-Site
CalEEMod Version: CalEEMod.2016.3.2 Date: 11/17/2017 12:43 PMPage 16 of 27
1110 University Mixed Use Project - Bay Area AQMD Air District, Summer

3.5 Building Construction - 2019
ROG NOx CO SO2 Fugitive PM10
Exhaust PM10
PM10 Total
Fugitive PM2.5
Exhaust PM2.5
PM2.5 Total
Bio- CO2 NBio- CO2 Total CO2 CH4 N2O CO2e
Category lb/day lb/day
Hauling 0.0000 0.0000 0.0000 0.0000 0.0000 0.0000 0.0000 0.0000 0.0000 0.0000 0.0000 0.0000 0.0000 0.0000
Vendor 0.0232 0.6245 0.1525 1.3900e-003
0.0338 4.3200e-003
0.0382 9.7400e-003
4.1300e-003
0.0139 146.7775 146.7775 7.7600e-003
146.9716
Worker 0.1141 0.0715 0.8946 2.5500e-003
0.2464 1.6300e-003
0.2481 0.0654 1.5000e-003
0.0669 254.2254 254.2254 6.7600e-003
254.3943
Total 0.1373 0.6959 1.0470 3.9400e-003
0.2803 5.9500e-003
0.2862 0.0751 5.6300e-003
0.0808 401.0029 401.0029 0.0145 401.3659
Mitigated Construction Off-Site
3.6 Paving - 2019
ROG NOx CO SO2 Fugitive PM10
Exhaust PM10
PM10 Total
Fugitive PM2.5
Exhaust PM2.5
PM2.5 Total
Bio- CO2 NBio- CO2 Total CO2 CH4 N2O CO2e
Category lb/day lb/day
Off-Road 0.9038 9.1743 8.9025 0.0135 0.5225 0.5225 0.4815 0.4815 1,325.0953
1,325.0953
0.4112 1,335.3751
Paving 0.0000 0.0000 0.0000 0.0000 0.0000 0.0000 0.0000
Total 0.9038 9.1743 8.9025 0.0135 0.5225 0.5225 0.4815 0.4815 1,325.0953
1,325.0953
0.4112 1,335.3751
Unmitigated Construction On-Site
CalEEMod Version: CalEEMod.2016.3.2 Date: 11/17/2017 12:43 PMPage 17 of 27
1110 University Mixed Use Project - Bay Area AQMD Air District, Summer

3.6 Paving - 2019
ROG NOx CO SO2 Fugitive PM10
Exhaust PM10
PM10 Total
Fugitive PM2.5
Exhaust PM2.5
PM2.5 Total
Bio- CO2 NBio- CO2 Total CO2 CH4 N2O CO2e
Category lb/day lb/day
Hauling 0.0000 0.0000 0.0000 0.0000 0.0000 0.0000 0.0000 0.0000 0.0000 0.0000 0.0000 0.0000 0.0000 0.0000
Vendor 0.0000 0.0000 0.0000 0.0000 0.0000 0.0000 0.0000 0.0000 0.0000 0.0000 0.0000 0.0000 0.0000 0.0000
Worker 0.0494 0.0310 0.3876 1.1100e-003
0.1068 7.1000e-004
0.1075 0.0283 6.5000e-004
0.0290 110.1643 110.1643 2.9300e-003
110.2375
Total 0.0494 0.0310 0.3876 1.1100e-003
0.1068 7.1000e-004
0.1075 0.0283 6.5000e-004
0.0290 110.1643 110.1643 2.9300e-003
110.2375
Unmitigated Construction Off-Site
ROG NOx CO SO2 Fugitive PM10
Exhaust PM10
PM10 Total
Fugitive PM2.5
Exhaust PM2.5
PM2.5 Total
Bio- CO2 NBio- CO2 Total CO2 CH4 N2O CO2e
Category lb/day lb/day
Off-Road 0.9038 9.1743 8.9025 0.0135 0.5225 0.5225 0.4815 0.4815 0.0000 1,325.0953
1,325.0953
0.4112 1,335.3751
Paving 0.0000 0.0000 0.0000 0.0000 0.0000 0.0000 0.0000
Total 0.9038 9.1743 8.9025 0.0135 0.5225 0.5225 0.4815 0.4815 0.0000 1,325.0953
1,325.0953
0.4112 1,335.3751
Mitigated Construction On-Site
CalEEMod Version: CalEEMod.2016.3.2 Date: 11/17/2017 12:43 PMPage 18 of 27
1110 University Mixed Use Project - Bay Area AQMD Air District, Summer

3.6 Paving - 2019
ROG NOx CO SO2 Fugitive PM10
Exhaust PM10
PM10 Total
Fugitive PM2.5
Exhaust PM2.5
PM2.5 Total
Bio- CO2 NBio- CO2 Total CO2 CH4 N2O CO2e
Category lb/day lb/day
Hauling 0.0000 0.0000 0.0000 0.0000 0.0000 0.0000 0.0000 0.0000 0.0000 0.0000 0.0000 0.0000 0.0000 0.0000
Vendor 0.0000 0.0000 0.0000 0.0000 0.0000 0.0000 0.0000 0.0000 0.0000 0.0000 0.0000 0.0000 0.0000 0.0000
Worker 0.0494 0.0310 0.3876 1.1100e-003
0.1068 7.1000e-004
0.1075 0.0283 6.5000e-004
0.0290 110.1643 110.1643 2.9300e-003
110.2375
Total 0.0494 0.0310 0.3876 1.1100e-003
0.1068 7.1000e-004
0.1075 0.0283 6.5000e-004
0.0290 110.1643 110.1643 2.9300e-003
110.2375
Mitigated Construction Off-Site
3.7 Architectural Coating - 2019
ROG NOx CO SO2 Fugitive PM10
Exhaust PM10
PM10 Total
Fugitive PM2.5
Exhaust PM2.5
PM2.5 Total
Bio- CO2 NBio- CO2 Total CO2 CH4 N2O CO2e
Category lb/day lb/day
Archit. Coating 59.2019 0.0000 0.0000 0.0000 0.0000 0.0000 0.0000
Off-Road 0.2664 1.8354 1.8413 2.9700e-003
0.1288 0.1288 0.1288 0.1288 281.4481 281.4481 0.0238 282.0423
Total 59.4684 1.8354 1.8413 2.9700e-003
0.1288 0.1288 0.1288 0.1288 281.4481 281.4481 0.0238 282.0423
Unmitigated Construction On-Site
CalEEMod Version: CalEEMod.2016.3.2 Date: 11/17/2017 12:43 PMPage 19 of 27
1110 University Mixed Use Project - Bay Area AQMD Air District, Summer

3.7 Architectural Coating - 2019
ROG NOx CO SO2 Fugitive PM10
Exhaust PM10
PM10 Total
Fugitive PM2.5
Exhaust PM2.5
PM2.5 Total
Bio- CO2 NBio- CO2 Total CO2 CH4 N2O CO2e
Category lb/day lb/day
Hauling 0.0000 0.0000 0.0000 0.0000 0.0000 0.0000 0.0000 0.0000 0.0000 0.0000 0.0000 0.0000 0.0000 0.0000
Vendor 0.0000 0.0000 0.0000 0.0000 0.0000 0.0000 0.0000 0.0000 0.0000 0.0000 0.0000 0.0000 0.0000 0.0000
Worker 0.0228 0.0143 0.1789 5.1000e-004
0.0493 3.3000e-004
0.0496 0.0131 3.0000e-004
0.0134 50.8451 50.8451 1.3500e-003
50.8789
Total 0.0228 0.0143 0.1789 5.1000e-004
0.0493 3.3000e-004
0.0496 0.0131 3.0000e-004
0.0134 50.8451 50.8451 1.3500e-003
50.8789
Unmitigated Construction Off-Site
ROG NOx CO SO2 Fugitive PM10
Exhaust PM10
PM10 Total
Fugitive PM2.5
Exhaust PM2.5
PM2.5 Total
Bio- CO2 NBio- CO2 Total CO2 CH4 N2O CO2e
Category lb/day lb/day
Archit. Coating 59.2019 0.0000 0.0000 0.0000 0.0000 0.0000 0.0000
Off-Road 0.2664 1.8354 1.8413 2.9700e-003
0.1288 0.1288 0.1288 0.1288 0.0000 281.4481 281.4481 0.0238 282.0423
Total 59.4684 1.8354 1.8413 2.9700e-003
0.1288 0.1288 0.1288 0.1288 0.0000 281.4481 281.4481 0.0238 282.0423
Mitigated Construction On-Site
CalEEMod Version: CalEEMod.2016.3.2 Date: 11/17/2017 12:43 PMPage 20 of 27
1110 University Mixed Use Project - Bay Area AQMD Air District, Summer
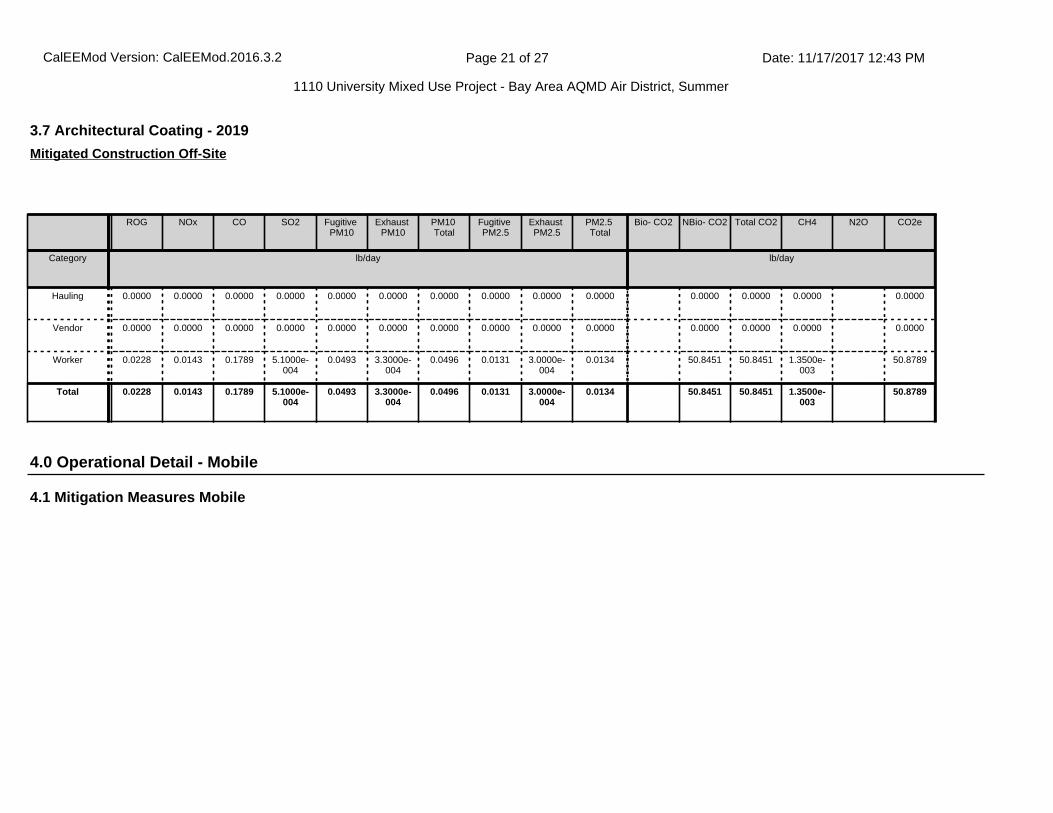
4.0 Operational Detail - Mobile
4.1 Mitigation Measures Mobile
3.7 Architectural Coating - 2019
ROG NOx CO SO2 Fugitive PM10
Exhaust PM10
PM10 Total
Fugitive PM2.5
Exhaust PM2.5
PM2.5 Total
Bio- CO2 NBio- CO2 Total CO2 CH4 N2O CO2e
Category lb/day lb/day
Hauling 0.0000 0.0000 0.0000 0.0000 0.0000 0.0000 0.0000 0.0000 0.0000 0.0000 0.0000 0.0000 0.0000 0.0000
Vendor 0.0000 0.0000 0.0000 0.0000 0.0000 0.0000 0.0000 0.0000 0.0000 0.0000 0.0000 0.0000 0.0000 0.0000
Worker 0.0228 0.0143 0.1789 5.1000e-004
0.0493 3.3000e-004
0.0496 0.0131 3.0000e-004
0.0134 50.8451 50.8451 1.3500e-003
50.8789
Total 0.0228 0.0143 0.1789 5.1000e-004
0.0493 3.3000e-004
0.0496 0.0131 3.0000e-004
0.0134 50.8451 50.8451 1.3500e-003
50.8789
Mitigated Construction Off-Site
CalEEMod Version: CalEEMod.2016.3.2 Date: 11/17/2017 12:43 PMPage 21 of 27
1110 University Mixed Use Project - Bay Area AQMD Air District, Summer

ROG NOx CO SO2 Fugitive PM10
Exhaust PM10
PM10 Total
Fugitive PM2.5
Exhaust PM2.5
PM2.5 Total
Bio- CO2 NBio- CO2 Total CO2 CH4 N2O CO2e
Category lb/day lb/day
Mitigated 0.3459 1.3492 3.3679 0.0102 0.7887 0.0123 0.8010 0.2111 0.0116 0.2227 1,027.0777
1,027.0777
0.0416 1,028.1179
Unmitigated 0.3459 1.3492 3.3679 0.0102 0.7887 0.0123 0.8010 0.2111 0.0116 0.2227 1,027.0777
1,027.0777
0.0416 1,028.1179
4.2 Trip Summary Information
4.3 Trip Type Information
Average Daily Trip Rate Unmitigated Mitigated
Land Use Weekday Saturday Sunday Annual VMT Annual VMT
Apartments Mid Rise 123.20 118.00 108.40 277,945 277,945
Strip Mall 56.19 53.70 26.13 79,374 79,374
Total 179.39 171.70 134.53 357,318 357,318
Miles Trip % Trip Purpose %
Land Use H-W or C-W H-S or C-C H-O or C-NW H-W or C-W H-S or C-C H-O or C-NW Primary Diverted Pass-by
Apartments Mid Rise 10.80 4.80 5.70 31.00 15.00 54.00 86 11 3
Strip Mall 9.50 7.30 7.30 16.60 64.40 19.00 45 40 15
4.4 Fleet Mix
Land Use LDA LDT1 LDT2 MDV LHD1 LHD2 MHD HHD OBUS UBUS MCY SBUS MH
Apartments Mid Rise 0.570523 0.041853 0.194077 0.115893 0.018544 0.005373 0.016909 0.024079 0.002502 0.002562 0.005975 0.000872 0.000837
Strip Mall 0.570523 0.041853 0.194077 0.115893 0.018544 0.005373 0.016909 0.024079 0.002502 0.002562 0.005975 0.000872 0.000837
CalEEMod Version: CalEEMod.2016.3.2 Date: 11/17/2017 12:43 PMPage 22 of 27
1110 University Mixed Use Project - Bay Area AQMD Air District, Summer

5.0 Energy Detail
ROG NOx CO SO2 Fugitive PM10
Exhaust PM10
PM10 Total
Fugitive PM2.5
Exhaust PM2.5
PM2.5 Total
Bio- CO2 NBio- CO2 Total CO2 CH4 N2O CO2e
Category lb/day lb/day
NaturalGas Mitigated
0.0107 0.0916 0.0404 5.8000e-004
7.3900e-003
7.3900e-003
7.3900e-003
7.3900e-003
116.6640 116.6640 2.2400e-003
2.1400e-003
117.3573
NaturalGas Unmitigated
0.0107 0.0916 0.0404 5.8000e-004
7.3900e-003
7.3900e-003
7.3900e-003
7.3900e-003
116.6640 116.6640 2.2400e-003
2.1400e-003
117.3573
5.1 Mitigation Measures Energy
Historical Energy Use: N
CalEEMod Version: CalEEMod.2016.3.2 Date: 11/17/2017 12:43 PMPage 23 of 27
1110 University Mixed Use Project - Bay Area AQMD Air District, Summer

6.1 Mitigation Measures Area
6.0 Area Detail
5.2 Energy by Land Use - NaturalGas
NaturalGas Use
ROG NOx CO SO2 Fugitive PM10
Exhaust PM10
PM10 Total
Fugitive PM2.5
Exhaust PM2.5
PM2.5 Total
Bio- CO2 NBio- CO2 Total CO2 CH4 N2O CO2e
Land Use kBTU/yr lb/day lb/day
Apartments Mid Rise
956.759 0.0103 0.0882 0.0375 5.6000e-004
7.1300e-003
7.1300e-003
7.1300e-003
7.1300e-003
112.5599 112.5599 2.1600e-003
2.0600e-003
113.2288
Strip Mall 34.8844 3.8000e-004
3.4200e-003
2.8700e-003
2.0000e-005
2.6000e-004
2.6000e-004
2.6000e-004
2.6000e-004
4.1041 4.1041 8.0000e-005
8.0000e-005
4.1284
Total 0.0107 0.0916 0.0404 5.8000e-004
7.3900e-003
7.3900e-003
7.3900e-003
7.3900e-003
116.6640 116.6640 2.2400e-003
2.1400e-003
117.3573
Unmitigated
NaturalGas Use
ROG NOx CO SO2 Fugitive PM10
Exhaust PM10
PM10 Total
Fugitive PM2.5
Exhaust PM2.5
PM2.5 Total
Bio- CO2 NBio- CO2 Total CO2 CH4 N2O CO2e
Land Use kBTU/yr lb/day lb/day
Apartments Mid Rise
0.956759 0.0103 0.0882 0.0375 5.6000e-004
7.1300e-003
7.1300e-003
7.1300e-003
7.1300e-003
112.5599 112.5599 2.1600e-003
2.0600e-003
113.2288
Strip Mall 0.0348844 3.8000e-004
3.4200e-003
2.8700e-003
2.0000e-005
2.6000e-004
2.6000e-004
2.6000e-004
2.6000e-004
4.1041 4.1041 8.0000e-005
8.0000e-005
4.1284
Total 0.0107 0.0916 0.0404 5.8000e-004
7.3900e-003
7.3900e-003
7.3900e-003
7.3900e-003
116.6640 116.6640 2.2400e-003
2.1400e-003
117.3573
Mitigated
CalEEMod Version: CalEEMod.2016.3.2 Date: 11/17/2017 12:43 PMPage 24 of 27
1110 University Mixed Use Project - Bay Area AQMD Air District, Summer

ROG NOx CO SO2 Fugitive PM10
Exhaust PM10
PM10 Total
Fugitive PM2.5
Exhaust PM2.5
PM2.5 Total
Bio- CO2 NBio- CO2 Total CO2 CH4 N2O CO2e
Category lb/day lb/day
Mitigated 17.6294 0.4021 25.0509 0.0421 3.1037 3.1037 3.1037 3.1037 334.8339 154.1780 489.0118 0.4640 0.0237 507.6655
Unmitigated 17.6294 0.4021 25.0509 0.0421 3.1037 3.1037 3.1037 3.1037 334.8339 154.1780 489.0118 0.4640 0.0237 507.6655
6.2 Area by SubCategory
ROG NOx CO SO2 Fugitive PM10
Exhaust PM10
PM10 Total
Fugitive PM2.5
Exhaust PM2.5
PM2.5 Total
Bio- CO2 NBio- CO2 Total CO2 CH4 N2O CO2e
SubCategory lb/day lb/day
Architectural Coating
0.1622 0.0000 0.0000 0.0000 0.0000 0.0000 0.0000
Consumer Products
0.9152 0.0000 0.0000 0.0000 0.0000 0.0000 0.0000
Hearth 16.4504 0.3637 21.7342 0.0419 3.0855 3.0855 3.0855 3.0855 334.8339 148.2353 483.0691 0.4582 0.0237 501.5770
Landscaping 0.1016 0.0384 3.3167 1.7000e-004
0.0182 0.0182 0.0182 0.0182 5.9427 5.9427 5.8300e-003
6.0886
Total 17.6294 0.4021 25.0509 0.0420 3.1037 3.1037 3.1037 3.1037 334.8339 154.1780 489.0118 0.4640 0.0237 507.6655
Unmitigated
CalEEMod Version: CalEEMod.2016.3.2 Date: 11/17/2017 12:43 PMPage 25 of 27
1110 University Mixed Use Project - Bay Area AQMD Air District, Summer

8.1 Mitigation Measures Waste
7.1 Mitigation Measures Water
7.0 Water Detail
8.0 Waste Detail
6.2 Area by SubCategory
ROG NOx CO SO2 Fugitive PM10
Exhaust PM10
PM10 Total
Fugitive PM2.5
Exhaust PM2.5
PM2.5 Total
Bio- CO2 NBio- CO2 Total CO2 CH4 N2O CO2e
SubCategory lb/day lb/day
Architectural Coating
0.1622 0.0000 0.0000 0.0000 0.0000 0.0000 0.0000
Consumer Products
0.9152 0.0000 0.0000 0.0000 0.0000 0.0000 0.0000
Hearth 16.4504 0.3637 21.7342 0.0419 3.0855 3.0855 3.0855 3.0855 334.8339 148.2353 483.0691 0.4582 0.0237 501.5770
Landscaping 0.1016 0.0384 3.3167 1.7000e-004
0.0182 0.0182 0.0182 0.0182 5.9427 5.9427 5.8300e-003
6.0886
Total 17.6294 0.4021 25.0509 0.0420 3.1037 3.1037 3.1037 3.1037 334.8339 154.1780 489.0118 0.4640 0.0237 507.6655
Mitigated
9.0 Operational Offroad
Equipment Type Number Hours/Day Days/Year Horse Power Load Factor Fuel Type
10.0 Stationary Equipment
CalEEMod Version: CalEEMod.2016.3.2 Date: 11/17/2017 12:43 PMPage 26 of 27
1110 University Mixed Use Project - Bay Area AQMD Air District, Summer

11.0 Vegetation
Fire Pumps and Emergency Generators
Equipment Type Number Hours/Day Hours/Year Horse Power Load Factor Fuel Type
Boilers
Equipment Type Number Heat Input/Day Heat Input/Year Boiler Rating Fuel Type
User Defined Equipment
Equipment Type Number
CalEEMod Version: CalEEMod.2016.3.2 Date: 11/17/2017 12:43 PMPage 27 of 27
1110 University Mixed Use Project - Bay Area AQMD Air District, Summer

Project Characteristics - CO2 intensity per PG&E, 2015
Land Use - Strip mall includes the retail space and yoga studio
Grading -
Demolition -
Vehicle Trips - Defaults with 30% WBCMP Vehicle Trip Reduction and 34% Retail Pass-by Reduction
1.1 Land Usage
Land Uses Size Metric Lot Acreage Floor Surface Area Population
Apartments Mid Rise 40.00 Dwelling Unit 1.05 40,000.00 114
Strip Mall 2.77 1000sqft 0.06 2,768.00 0
1.2 Other Project Characteristics
Urbanization
Climate Zone
Urban
5
Wind Speed (m/s) Precipitation Freq (Days)2.2 64
1.3 User Entered Comments & Non-Default Data
1.0 Project Characteristics
Utility Company Pacific Gas & Electric Company
2019Operational Year
CO2 Intensity (lb/MWhr)
307 0.029CH4 Intensity (lb/MWhr)
0.006N2O Intensity (lb/MWhr)
1110 University Mixed Use ProjectBay Area AQMD Air District, Winter
CalEEMod Version: CalEEMod.2016.3.2 Date: 11/17/2017 12:48 PMPage 1 of 27
1110 University Mixed Use Project - Bay Area AQMD Air District, Winter

2.0 Emissions Summary
Table Name Column Name Default Value New Value
tblGrading MaterialExported 0.00 278.00
tblProjectCharacteristics CO2IntensityFactor 641.35 307
tblVehicleTrips ST_TR 6.39 2.95
tblVehicleTrips ST_TR 42.04 19.40
tblVehicleTrips SU_TR 5.86 2.71
tblVehicleTrips SU_TR 20.43 9.44
tblVehicleTrips WD_TR 6.65 3.08
tblVehicleTrips WD_TR 44.32 20.30
CalEEMod Version: CalEEMod.2016.3.2 Date: 11/17/2017 12:48 PMPage 2 of 27
1110 University Mixed Use Project - Bay Area AQMD Air District, Winter

2.1 Overall Construction (Maximum Daily Emission)
ROG NOx CO SO2 Fugitive PM10
Exhaust PM10
PM10 Total
Fugitive PM2.5
Exhaust PM2.5
PM2.5 Total
Bio- CO2 NBio- CO2 Total CO2 CH4 N2O CO2e
Year lb/day lb/day
2018 2.7526 25.2357 15.6896 0.0272 5.8653 1.4405 6.8180 2.9711 1.3467 3.8476 0.0000 2,709.4026
2,709.4026
0.6207 0.0000 2,724.9200
2019 59.4925 16.7014 14.5057 0.0257 0.2803 0.9219 1.2021 0.0751 0.8903 0.9654 0.0000 2,395.3380
2,395.3380
0.4140 0.0000 2,405.4058
Maximum 59.4925 25.2357 15.6896 0.0272 5.8653 1.4405 6.8180 2.9711 1.3467 3.8476 0.0000 2,709.4026
2,709.4026
0.6207 0.0000 2,724.9200
Unmitigated Construction
ROG NOx CO SO2 Fugitive PM10
Exhaust PM10
PM10 Total
Fugitive PM2.5
Exhaust PM2.5
PM2.5 Total
Bio- CO2 NBio- CO2 Total CO2 CH4 N2O CO2e
Year lb/day lb/day
2018 2.7526 25.2357 15.6896 0.0272 5.8653 1.4405 6.8180 2.9711 1.3467 3.8476 0.0000 2,709.4026
2,709.4026
0.6207 0.0000 2,724.9200
2019 59.4925 16.7014 14.5057 0.0257 0.2803 0.9219 1.2021 0.0751 0.8903 0.9654 0.0000 2,395.3380
2,395.3380
0.4140 0.0000 2,405.4058
Maximum 59.4925 25.2357 15.6896 0.0272 5.8653 1.4405 6.8180 2.9711 1.3467 3.8476 0.0000 2,709.4026
2,709.4026
0.6207 0.0000 2,724.9200
Mitigated Construction
ROG NOx CO SO2 Fugitive PM10
Exhaust PM10
PM10 Total
Fugitive PM2.5
Exhaust PM2.5
PM2.5 Total
Bio- CO2 NBio-CO2 Total CO2 CH4 N20 CO2e
Percent Reduction
0.00 0.00 0.00 0.00 0.00 0.00 0.00 0.00 0.00 0.00 0.00 0.00 0.00 0.00 0.00 0.00
CalEEMod Version: CalEEMod.2016.3.2 Date: 11/17/2017 12:48 PMPage 3 of 27
1110 University Mixed Use Project - Bay Area AQMD Air District, Winter

2.2 Overall Operational
ROG NOx CO SO2 Fugitive PM10
Exhaust PM10
PM10 Total
Fugitive PM2.5
Exhaust PM2.5
PM2.5 Total
Bio- CO2 NBio- CO2 Total CO2 CH4 N2O CO2e
Category lb/day lb/day
Area 17.6294 0.4021 25.0509 0.0421 3.1037 3.1037 3.1037 3.1037 334.8339 154.1780 489.0118 0.4640 0.0237 507.6655
Energy 0.0107 0.0916 0.0404 5.8000e-004
7.3900e-003
7.3900e-003
7.3900e-003
7.3900e-003
116.6640 116.6640 2.2400e-003
2.1400e-003
117.3573
Mobile 0.3023 1.4238 3.4663 9.5200e-003
0.7887 0.0124 0.8011 0.2111 0.0117 0.2228 960.5298 960.5298 0.0427 961.5979
Total 17.9424 1.9175 28.5576 0.0522 0.7887 3.1235 3.9122 0.2111 3.1228 3.3339 334.8339 1,231.3718
1,566.2056
0.5090 0.0258 1,586.6207
Unmitigated Operational
ROG NOx CO SO2 Fugitive PM10
Exhaust PM10
PM10 Total
Fugitive PM2.5
Exhaust PM2.5
PM2.5 Total
Bio- CO2 NBio- CO2 Total CO2 CH4 N2O CO2e
Category lb/day lb/day
Area 17.6294 0.4021 25.0509 0.0421 3.1037 3.1037 3.1037 3.1037 334.8339 154.1780 489.0118 0.4640 0.0237 507.6655
Energy 0.0107 0.0916 0.0404 5.8000e-004
7.3900e-003
7.3900e-003
7.3900e-003
7.3900e-003
116.6640 116.6640 2.2400e-003
2.1400e-003
117.3573
Mobile 0.3023 1.4238 3.4663 9.5200e-003
0.7887 0.0124 0.8011 0.2111 0.0117 0.2228 960.5298 960.5298 0.0427 961.5979
Total 17.9424 1.9175 28.5576 0.0522 0.7887 3.1235 3.9122 0.2111 3.1228 3.3339 334.8339 1,231.3718
1,566.2056
0.5090 0.0258 1,586.6207
Mitigated Operational
CalEEMod Version: CalEEMod.2016.3.2 Date: 11/17/2017 12:48 PMPage 4 of 27
1110 University Mixed Use Project - Bay Area AQMD Air District, Winter

3.0 Construction Detail
Construction Phase
Phase Number
Phase Name Phase Type Start Date End Date Num Days Week
Num Days Phase Description
1 Demolition Demolition 6/4/2018 6/29/2018 5 20
2 Site Preparation Site Preparation 6/30/2018 7/3/2018 5 2
3 Grading Grading 7/4/2018 7/9/2018 5 4
4 Building Construction Building Construction 7/10/2018 4/15/2019 5 200
5 Paving Paving 4/16/2019 4/29/2019 5 10
6 Architectural Coating Architectural Coating 4/30/2019 5/13/2019 5 10
OffRoad Equipment
ROG NOx CO SO2 Fugitive PM10
Exhaust PM10
PM10 Total
Fugitive PM2.5
Exhaust PM2.5
PM2.5 Total
Bio- CO2 NBio-CO2 Total CO2 CH4 N20 CO2e
Percent Reduction
0.00 0.00 0.00 0.00 0.00 0.00 0.00 0.00 0.00 0.00 0.00 0.00 0.00 0.00 0.00 0.00
Residential Indoor: 81,000; Residential Outdoor: 27,000; Non-Residential Indoor: 4,152; Non-Residential Outdoor: 1,384; Striped Parking Area: 0 (Architectural Coating – sqft)
Acres of Grading (Site Preparation Phase): 1
Acres of Grading (Grading Phase): 1.5
Acres of Paving: 0
CalEEMod Version: CalEEMod.2016.3.2 Date: 11/17/2017 12:48 PMPage 5 of 27
1110 University Mixed Use Project - Bay Area AQMD Air District, Winter

Phase Name Offroad Equipment Type Amount Usage Hours Horse Power Load Factor
Architectural Coating Air Compressors 1 6.00 78 0.48
Paving Cement and Mortar Mixers 1 6.00 9 0.56
Demolition Concrete/Industrial Saws 1 8.00 81 0.73
Building Construction Generator Sets 1 8.00 84 0.74
Building Construction Cranes 1 6.00 231 0.29
Building Construction Forklifts 1 6.00 89 0.20
Site Preparation Graders 1 8.00 187 0.41
Paving Pavers 1 6.00 130 0.42
Paving Rollers 1 7.00 80 0.38
Demolition Rubber Tired Dozers 1 8.00 247 0.40
Grading Rubber Tired Dozers 1 6.00 247 0.40
Building Construction Tractors/Loaders/Backhoes 1 6.00 97 0.37
Demolition Tractors/Loaders/Backhoes 3 8.00 97 0.37
Grading Tractors/Loaders/Backhoes 1 7.00 97 0.37
Paving Tractors/Loaders/Backhoes 1 8.00 97 0.37
Site Preparation Tractors/Loaders/Backhoes 1 8.00 97 0.37
Grading Graders 1 6.00 187 0.41
Paving Paving Equipment 1 8.00 132 0.36
Site Preparation Rubber Tired Dozers 1 7.00 247 0.40
Building Construction Welders 3 8.00 46 0.45
Trips and VMT
CalEEMod Version: CalEEMod.2016.3.2 Date: 11/17/2017 12:48 PMPage 6 of 27
1110 University Mixed Use Project - Bay Area AQMD Air District, Winter

3.2 Demolition - 2018
ROG NOx CO SO2 Fugitive PM10
Exhaust PM10
PM10 Total
Fugitive PM2.5
Exhaust PM2.5
PM2.5 Total
Bio- CO2 NBio- CO2 Total CO2 CH4 N2O CO2e
Category lb/day lb/day
Fugitive Dust 0.5451 0.0000 0.5451 0.0825 0.0000 0.0825 0.0000 0.0000
Off-Road 2.4838 24.3641 15.1107 0.0241 1.4365 1.4365 1.3429 1.3429 2,391.1659
2,391.1659
0.6058 2,406.3105
Total 2.4838 24.3641 15.1107 0.0241 0.5451 1.4365 1.9816 0.0825 1.3429 1.4254 2,391.1659
2,391.1659
0.6058 2,406.3105
Unmitigated Construction On-Site
3.1 Mitigation Measures Construction
Phase Name Offroad Equipment Count
Worker Trip Number
Vendor Trip Number
Hauling Trip Number
Worker Trip Length
Vendor Trip Length
Hauling Trip Length
Worker Vehicle Class
Vendor Vehicle Class
Hauling Vehicle Class
Demolition 5 13.00 0.00 50.00 10.80 7.30 20.00 LD_Mix HDT_Mix HHDT
Site Preparation 3 8.00 0.00 0.00 10.80 7.30 20.00 LD_Mix HDT_Mix HHDT
Grading 3 8.00 0.00 35.00 10.80 7.30 20.00 LD_Mix HDT_Mix HHDT
Building Construction 7 30.00 5.00 0.00 10.80 7.30 20.00 LD_Mix HDT_Mix HHDT
Paving 5 13.00 0.00 0.00 10.80 7.30 20.00 LD_Mix HDT_Mix HHDT
Architectural Coating 1 6.00 0.00 0.00 10.80 7.30 20.00 LD_Mix HDT_Mix HHDT
CalEEMod Version: CalEEMod.2016.3.2 Date: 11/17/2017 12:48 PMPage 7 of 27
1110 University Mixed Use Project - Bay Area AQMD Air District, Winter

3.2 Demolition - 2018
ROG NOx CO SO2 Fugitive PM10
Exhaust PM10
PM10 Total
Fugitive PM2.5
Exhaust PM2.5
PM2.5 Total
Bio- CO2 NBio- CO2 Total CO2 CH4 N2O CO2e
Category lb/day lb/day
Hauling 0.0244 0.8279 0.1650 2.0000e-003
0.0437 3.3100e-003
0.0470 0.0120 3.1700e-003
0.0151 213.6145 213.6145 0.0118 213.9089
Vendor 0.0000 0.0000 0.0000 0.0000 0.0000 0.0000 0.0000 0.0000 0.0000 0.0000 0.0000 0.0000 0.0000 0.0000
Worker 0.0579 0.0437 0.4139 1.0500e-003
0.1068 7.2000e-004
0.1075 0.0283 6.6000e-004
0.0290 104.6223 104.6223 3.1400e-003
104.7007
Total 0.0823 0.8716 0.5789 3.0500e-003
0.1505 4.0300e-003
0.1545 0.0403 3.8300e-003
0.0441 318.2367 318.2367 0.0149 318.6096
Unmitigated Construction Off-Site
ROG NOx CO SO2 Fugitive PM10
Exhaust PM10
PM10 Total
Fugitive PM2.5
Exhaust PM2.5
PM2.5 Total
Bio- CO2 NBio- CO2 Total CO2 CH4 N2O CO2e
Category lb/day lb/day
Fugitive Dust 0.5451 0.0000 0.5451 0.0825 0.0000 0.0825 0.0000 0.0000
Off-Road 2.4838 24.3641 15.1107 0.0241 1.4365 1.4365 1.3429 1.3429 0.0000 2,391.1659
2,391.1659
0.6058 2,406.3105
Total 2.4838 24.3641 15.1107 0.0241 0.5451 1.4365 1.9816 0.0825 1.3429 1.4254 0.0000 2,391.1659
2,391.1659
0.6058 2,406.3105
Mitigated Construction On-Site
CalEEMod Version: CalEEMod.2016.3.2 Date: 11/17/2017 12:48 PMPage 8 of 27
1110 University Mixed Use Project - Bay Area AQMD Air District, Winter

3.2 Demolition - 2018
ROG NOx CO SO2 Fugitive PM10
Exhaust PM10
PM10 Total
Fugitive PM2.5
Exhaust PM2.5
PM2.5 Total
Bio- CO2 NBio- CO2 Total CO2 CH4 N2O CO2e
Category lb/day lb/day
Hauling 0.0244 0.8279 0.1650 2.0000e-003
0.0437 3.3100e-003
0.0470 0.0120 3.1700e-003
0.0151 213.6145 213.6145 0.0118 213.9089
Vendor 0.0000 0.0000 0.0000 0.0000 0.0000 0.0000 0.0000 0.0000 0.0000 0.0000 0.0000 0.0000 0.0000 0.0000
Worker 0.0579 0.0437 0.4139 1.0500e-003
0.1068 7.2000e-004
0.1075 0.0283 6.6000e-004
0.0290 104.6223 104.6223 3.1400e-003
104.7007
Total 0.0823 0.8716 0.5789 3.0500e-003
0.1505 4.0300e-003
0.1545 0.0403 3.8300e-003
0.0441 318.2367 318.2367 0.0149 318.6096
Mitigated Construction Off-Site
3.3 Site Preparation - 2018
ROG NOx CO SO2 Fugitive PM10
Exhaust PM10
PM10 Total
Fugitive PM2.5
Exhaust PM2.5
PM2.5 Total
Bio- CO2 NBio- CO2 Total CO2 CH4 N2O CO2e
Category lb/day lb/day
Fugitive Dust 5.7996 0.0000 5.7996 2.9537 0.0000 2.9537 0.0000 0.0000
Off-Road 1.8061 20.7472 8.0808 0.0172 0.9523 0.9523 0.8761 0.8761 1,735.3630
1,735.3630
0.5402 1,748.8690
Total 1.8061 20.7472 8.0808 0.0172 5.7996 0.9523 6.7518 2.9537 0.8761 3.8298 1,735.3630
1,735.3630
0.5402 1,748.8690
Unmitigated Construction On-Site
CalEEMod Version: CalEEMod.2016.3.2 Date: 11/17/2017 12:48 PMPage 9 of 27
1110 University Mixed Use Project - Bay Area AQMD Air District, Winter
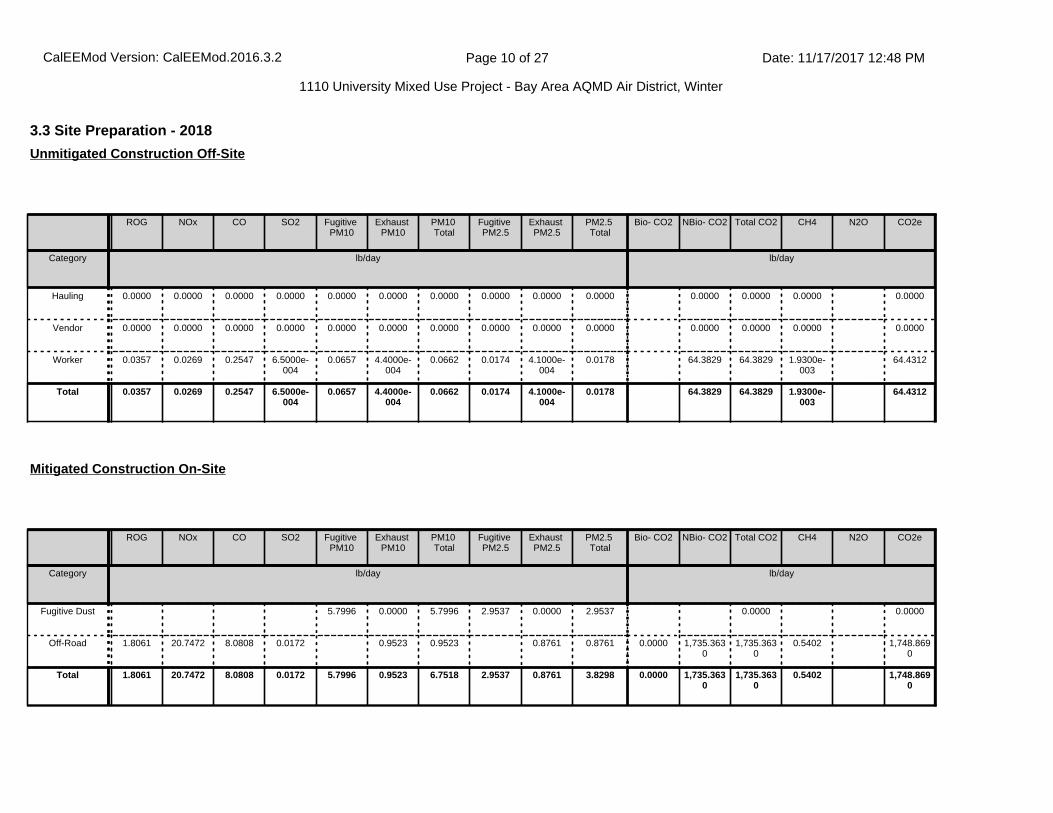
3.3 Site Preparation - 2018
ROG NOx CO SO2 Fugitive PM10
Exhaust PM10
PM10 Total
Fugitive PM2.5
Exhaust PM2.5
PM2.5 Total
Bio- CO2 NBio- CO2 Total CO2 CH4 N2O CO2e
Category lb/day lb/day
Hauling 0.0000 0.0000 0.0000 0.0000 0.0000 0.0000 0.0000 0.0000 0.0000 0.0000 0.0000 0.0000 0.0000 0.0000
Vendor 0.0000 0.0000 0.0000 0.0000 0.0000 0.0000 0.0000 0.0000 0.0000 0.0000 0.0000 0.0000 0.0000 0.0000
Worker 0.0357 0.0269 0.2547 6.5000e-004
0.0657 4.4000e-004
0.0662 0.0174 4.1000e-004
0.0178 64.3829 64.3829 1.9300e-003
64.4312
Total 0.0357 0.0269 0.2547 6.5000e-004
0.0657 4.4000e-004
0.0662 0.0174 4.1000e-004
0.0178 64.3829 64.3829 1.9300e-003
64.4312
Unmitigated Construction Off-Site
ROG NOx CO SO2 Fugitive PM10
Exhaust PM10
PM10 Total
Fugitive PM2.5
Exhaust PM2.5
PM2.5 Total
Bio- CO2 NBio- CO2 Total CO2 CH4 N2O CO2e
Category lb/day lb/day
Fugitive Dust 5.7996 0.0000 5.7996 2.9537 0.0000 2.9537 0.0000 0.0000
Off-Road 1.8061 20.7472 8.0808 0.0172 0.9523 0.9523 0.8761 0.8761 0.0000 1,735.3630
1,735.3630
0.5402 1,748.8690
Total 1.8061 20.7472 8.0808 0.0172 5.7996 0.9523 6.7518 2.9537 0.8761 3.8298 0.0000 1,735.3630
1,735.3630
0.5402 1,748.8690
Mitigated Construction On-Site
CalEEMod Version: CalEEMod.2016.3.2 Date: 11/17/2017 12:48 PMPage 10 of 27
1110 University Mixed Use Project - Bay Area AQMD Air District, Winter

3.3 Site Preparation - 2018
ROG NOx CO SO2 Fugitive PM10
Exhaust PM10
PM10 Total
Fugitive PM2.5
Exhaust PM2.5
PM2.5 Total
Bio- CO2 NBio- CO2 Total CO2 CH4 N2O CO2e
Category lb/day lb/day
Hauling 0.0000 0.0000 0.0000 0.0000 0.0000 0.0000 0.0000 0.0000 0.0000 0.0000 0.0000 0.0000 0.0000 0.0000
Vendor 0.0000 0.0000 0.0000 0.0000 0.0000 0.0000 0.0000 0.0000 0.0000 0.0000 0.0000 0.0000 0.0000 0.0000
Worker 0.0357 0.0269 0.2547 6.5000e-004
0.0657 4.4000e-004
0.0662 0.0174 4.1000e-004
0.0178 64.3829 64.3829 1.9300e-003
64.4312
Total 0.0357 0.0269 0.2547 6.5000e-004
0.0657 4.4000e-004
0.0662 0.0174 4.1000e-004
0.0178 64.3829 64.3829 1.9300e-003
64.4312
Mitigated Construction Off-Site
3.4 Grading - 2018
ROG NOx CO SO2 Fugitive PM10
Exhaust PM10
PM10 Total
Fugitive PM2.5
Exhaust PM2.5
PM2.5 Total
Bio- CO2 NBio- CO2 Total CO2 CH4 N2O CO2e
Category lb/day lb/day
Fugitive Dust 4.9221 0.0000 4.9221 2.5268 0.0000 2.5268 0.0000 0.0000
Off-Road 1.4972 17.0666 6.7630 0.0141 0.7947 0.7947 0.7311 0.7311 1,421.2605
1,421.2605
0.4425 1,432.3219
Total 1.4972 17.0666 6.7630 0.0141 4.9221 0.7947 5.7168 2.5268 0.7311 3.2579 1,421.2605
1,421.2605
0.4425 1,432.3219
Unmitigated Construction On-Site
CalEEMod Version: CalEEMod.2016.3.2 Date: 11/17/2017 12:48 PMPage 11 of 27
1110 University Mixed Use Project - Bay Area AQMD Air District, Winter

3.4 Grading - 2018
ROG NOx CO SO2 Fugitive PM10
Exhaust PM10
PM10 Total
Fugitive PM2.5
Exhaust PM2.5
PM2.5 Total
Bio- CO2 NBio- CO2 Total CO2 CH4 N2O CO2e
Category lb/day lb/day
Hauling 0.0854 2.8977 0.5774 7.0100e-003
0.1529 0.0116 0.1644 0.0419 0.0111 0.0530 747.6506 747.6506 0.0412 748.6811
Vendor 0.0000 0.0000 0.0000 0.0000 0.0000 0.0000 0.0000 0.0000 0.0000 0.0000 0.0000 0.0000 0.0000 0.0000
Worker 0.0357 0.0269 0.2547 6.5000e-004
0.0657 4.4000e-004
0.0662 0.0174 4.1000e-004
0.0178 64.3829 64.3829 1.9300e-003
64.4312
Total 0.1210 2.9246 0.8321 7.6600e-003
0.2186 0.0120 0.2306 0.0593 0.0115 0.0708 812.0335 812.0335 0.0432 813.1123
Unmitigated Construction Off-Site
ROG NOx CO SO2 Fugitive PM10
Exhaust PM10
PM10 Total
Fugitive PM2.5
Exhaust PM2.5
PM2.5 Total
Bio- CO2 NBio- CO2 Total CO2 CH4 N2O CO2e
Category lb/day lb/day
Fugitive Dust 4.9221 0.0000 4.9221 2.5268 0.0000 2.5268 0.0000 0.0000
Off-Road 1.4972 17.0666 6.7630 0.0141 0.7947 0.7947 0.7311 0.7311 0.0000 1,421.2605
1,421.2605
0.4425 1,432.3219
Total 1.4972 17.0666 6.7630 0.0141 4.9221 0.7947 5.7168 2.5268 0.7311 3.2579 0.0000 1,421.2605
1,421.2605
0.4425 1,432.3219
Mitigated Construction On-Site
CalEEMod Version: CalEEMod.2016.3.2 Date: 11/17/2017 12:48 PMPage 12 of 27
1110 University Mixed Use Project - Bay Area AQMD Air District, Winter

3.4 Grading - 2018
ROG NOx CO SO2 Fugitive PM10
Exhaust PM10
PM10 Total
Fugitive PM2.5
Exhaust PM2.5
PM2.5 Total
Bio- CO2 NBio- CO2 Total CO2 CH4 N2O CO2e
Category lb/day lb/day
Hauling 0.0854 2.8977 0.5774 7.0100e-003
0.1529 0.0116 0.1644 0.0419 0.0111 0.0530 747.6506 747.6506 0.0412 748.6811
Vendor 0.0000 0.0000 0.0000 0.0000 0.0000 0.0000 0.0000 0.0000 0.0000 0.0000 0.0000 0.0000 0.0000 0.0000
Worker 0.0357 0.0269 0.2547 6.5000e-004
0.0657 4.4000e-004
0.0662 0.0174 4.1000e-004
0.0178 64.3829 64.3829 1.9300e-003
64.4312
Total 0.1210 2.9246 0.8321 7.6600e-003
0.2186 0.0120 0.2306 0.0593 0.0115 0.0708 812.0335 812.0335 0.0432 813.1123
Mitigated Construction Off-Site
3.5 Building Construction - 2018
ROG NOx CO SO2 Fugitive PM10
Exhaust PM10
PM10 Total
Fugitive PM2.5
Exhaust PM2.5
PM2.5 Total
Bio- CO2 NBio- CO2 Total CO2 CH4 N2O CO2e
Category lb/day lb/day
Off-Road 2.5919 17.4280 13.8766 0.0220 1.0580 1.0580 1.0216 1.0216 2,030.8389
2,030.8389
0.4088 2,041.0596
Total 2.5919 17.4280 13.8766 0.0220 1.0580 1.0580 1.0216 1.0216 2,030.8389
2,030.8389
0.4088 2,041.0596
Unmitigated Construction On-Site
CalEEMod Version: CalEEMod.2016.3.2 Date: 11/17/2017 12:48 PMPage 13 of 27
1110 University Mixed Use Project - Bay Area AQMD Air District, Winter

3.5 Building Construction - 2018
ROG NOx CO SO2 Fugitive PM10
Exhaust PM10
PM10 Total
Fugitive PM2.5
Exhaust PM2.5
PM2.5 Total
Bio- CO2 NBio- CO2 Total CO2 CH4 N2O CO2e
Category lb/day lb/day
Hauling 0.0000 0.0000 0.0000 0.0000 0.0000 0.0000 0.0000 0.0000 0.0000 0.0000 0.0000 0.0000 0.0000 0.0000
Vendor 0.0270 0.6700 0.1905 1.3600e-003
0.0338 5.1900e-003
0.0390 9.7400e-003
4.9600e-003
0.0147 144.1209 144.1209 8.8000e-003
144.3410
Worker 0.1337 0.1009 0.9552 2.4300e-003
0.2464 1.6600e-003
0.2481 0.0654 1.5300e-003
0.0669 241.4360 241.4360 7.2400e-003
241.6169
Total 0.1608 0.7709 1.1458 3.7900e-003
0.2803 6.8500e-003
0.2871 0.0751 6.4900e-003
0.0816 385.5569 385.5569 0.0160 385.9579
Unmitigated Construction Off-Site
ROG NOx CO SO2 Fugitive PM10
Exhaust PM10
PM10 Total
Fugitive PM2.5
Exhaust PM2.5
PM2.5 Total
Bio- CO2 NBio- CO2 Total CO2 CH4 N2O CO2e
Category lb/day lb/day
Off-Road 2.5919 17.4280 13.8766 0.0220 1.0580 1.0580 1.0216 1.0216 0.0000 2,030.8389
2,030.8389
0.4088 2,041.0596
Total 2.5919 17.4280 13.8766 0.0220 1.0580 1.0580 1.0216 1.0216 0.0000 2,030.8389
2,030.8389
0.4088 2,041.0596
Mitigated Construction On-Site
CalEEMod Version: CalEEMod.2016.3.2 Date: 11/17/2017 12:48 PMPage 14 of 27
1110 University Mixed Use Project - Bay Area AQMD Air District, Winter

3.5 Building Construction - 2018
ROG NOx CO SO2 Fugitive PM10
Exhaust PM10
PM10 Total
Fugitive PM2.5
Exhaust PM2.5
PM2.5 Total
Bio- CO2 NBio- CO2 Total CO2 CH4 N2O CO2e
Category lb/day lb/day
Hauling 0.0000 0.0000 0.0000 0.0000 0.0000 0.0000 0.0000 0.0000 0.0000 0.0000 0.0000 0.0000 0.0000 0.0000
Vendor 0.0270 0.6700 0.1905 1.3600e-003
0.0338 5.1900e-003
0.0390 9.7400e-003
4.9600e-003
0.0147 144.1209 144.1209 8.8000e-003
144.3410
Worker 0.1337 0.1009 0.9552 2.4300e-003
0.2464 1.6600e-003
0.2481 0.0654 1.5300e-003
0.0669 241.4360 241.4360 7.2400e-003
241.6169
Total 0.1608 0.7709 1.1458 3.7900e-003
0.2803 6.8500e-003
0.2871 0.0751 6.4900e-003
0.0816 385.5569 385.5569 0.0160 385.9579
Mitigated Construction Off-Site
3.5 Building Construction - 2019
ROG NOx CO SO2 Fugitive PM10
Exhaust PM10
PM10 Total
Fugitive PM2.5
Exhaust PM2.5
PM2.5 Total
Bio- CO2 NBio- CO2 Total CO2 CH4 N2O CO2e
Category lb/day lb/day
Off-Road 2.2721 15.9802 13.4870 0.0220 0.9158 0.9158 0.8846 0.8846 2,018.0224
2,018.0224
0.3879 2,027.7210
Total 2.2721 15.9802 13.4870 0.0220 0.9158 0.9158 0.8846 0.8846 2,018.0224
2,018.0224
0.3879 2,027.7210
Unmitigated Construction On-Site
CalEEMod Version: CalEEMod.2016.3.2 Date: 11/17/2017 12:48 PMPage 15 of 27
1110 University Mixed Use Project - Bay Area AQMD Air District, Winter

3.5 Building Construction - 2019
ROG NOx CO SO2 Fugitive PM10
Exhaust PM10
PM10 Total
Fugitive PM2.5
Exhaust PM2.5
PM2.5 Total
Bio- CO2 NBio- CO2 Total CO2 CH4 N2O CO2e
Category lb/day lb/day
Hauling 0.0000 0.0000 0.0000 0.0000 0.0000 0.0000 0.0000 0.0000 0.0000 0.0000 0.0000 0.0000 0.0000 0.0000
Vendor 0.0243 0.6329 0.1741 1.3500e-003
0.0338 4.3900e-003
0.0382 9.7400e-003
4.2000e-003
0.0139 143.1260 143.1260 8.4100e-003
143.3362
Worker 0.1206 0.0883 0.8446 2.3500e-003
0.2464 1.6300e-003
0.2481 0.0654 1.5000e-003
0.0669 234.1896 234.1896 6.3600e-003
234.3486
Total 0.1449 0.7212 1.0187 3.7000e-003
0.2803 6.0200e-003
0.2863 0.0751 5.7000e-003
0.0808 377.3156 377.3156 0.0148 377.6847
Unmitigated Construction Off-Site
ROG NOx CO SO2 Fugitive PM10
Exhaust PM10
PM10 Total
Fugitive PM2.5
Exhaust PM2.5
PM2.5 Total
Bio- CO2 NBio- CO2 Total CO2 CH4 N2O CO2e
Category lb/day lb/day
Off-Road 2.2721 15.9802 13.4870 0.0220 0.9158 0.9158 0.8846 0.8846 0.0000 2,018.0224
2,018.0224
0.3879 2,027.7210
Total 2.2721 15.9802 13.4870 0.0220 0.9158 0.9158 0.8846 0.8846 0.0000 2,018.0224
2,018.0224
0.3879 2,027.7210
Mitigated Construction On-Site
CalEEMod Version: CalEEMod.2016.3.2 Date: 11/17/2017 12:48 PMPage 16 of 27
1110 University Mixed Use Project - Bay Area AQMD Air District, Winter

3.5 Building Construction - 2019
ROG NOx CO SO2 Fugitive PM10
Exhaust PM10
PM10 Total
Fugitive PM2.5
Exhaust PM2.5
PM2.5 Total
Bio- CO2 NBio- CO2 Total CO2 CH4 N2O CO2e
Category lb/day lb/day
Hauling 0.0000 0.0000 0.0000 0.0000 0.0000 0.0000 0.0000 0.0000 0.0000 0.0000 0.0000 0.0000 0.0000 0.0000
Vendor 0.0243 0.6329 0.1741 1.3500e-003
0.0338 4.3900e-003
0.0382 9.7400e-003
4.2000e-003
0.0139 143.1260 143.1260 8.4100e-003
143.3362
Worker 0.1206 0.0883 0.8446 2.3500e-003
0.2464 1.6300e-003
0.2481 0.0654 1.5000e-003
0.0669 234.1896 234.1896 6.3600e-003
234.3486
Total 0.1449 0.7212 1.0187 3.7000e-003
0.2803 6.0200e-003
0.2863 0.0751 5.7000e-003
0.0808 377.3156 377.3156 0.0148 377.6847
Mitigated Construction Off-Site
3.6 Paving - 2019
ROG NOx CO SO2 Fugitive PM10
Exhaust PM10
PM10 Total
Fugitive PM2.5
Exhaust PM2.5
PM2.5 Total
Bio- CO2 NBio- CO2 Total CO2 CH4 N2O CO2e
Category lb/day lb/day
Off-Road 0.9038 9.1743 8.9025 0.0135 0.5225 0.5225 0.4815 0.4815 1,325.0953
1,325.0953
0.4112 1,335.3751
Paving 0.0000 0.0000 0.0000 0.0000 0.0000 0.0000 0.0000
Total 0.9038 9.1743 8.9025 0.0135 0.5225 0.5225 0.4815 0.4815 1,325.0953
1,325.0953
0.4112 1,335.3751
Unmitigated Construction On-Site
CalEEMod Version: CalEEMod.2016.3.2 Date: 11/17/2017 12:48 PMPage 17 of 27
1110 University Mixed Use Project - Bay Area AQMD Air District, Winter

3.6 Paving - 2019
ROG NOx CO SO2 Fugitive PM10
Exhaust PM10
PM10 Total
Fugitive PM2.5
Exhaust PM2.5
PM2.5 Total
Bio- CO2 NBio- CO2 Total CO2 CH4 N2O CO2e
Category lb/day lb/day
Hauling 0.0000 0.0000 0.0000 0.0000 0.0000 0.0000 0.0000 0.0000 0.0000 0.0000 0.0000 0.0000 0.0000 0.0000
Vendor 0.0000 0.0000 0.0000 0.0000 0.0000 0.0000 0.0000 0.0000 0.0000 0.0000 0.0000 0.0000 0.0000 0.0000
Worker 0.0523 0.0383 0.3660 1.0200e-003
0.1068 7.1000e-004
0.1075 0.0283 6.5000e-004
0.0290 101.4822 101.4822 2.7600e-003
101.5511
Total 0.0523 0.0383 0.3660 1.0200e-003
0.1068 7.1000e-004
0.1075 0.0283 6.5000e-004
0.0290 101.4822 101.4822 2.7600e-003
101.5511
Unmitigated Construction Off-Site
ROG NOx CO SO2 Fugitive PM10
Exhaust PM10
PM10 Total
Fugitive PM2.5
Exhaust PM2.5
PM2.5 Total
Bio- CO2 NBio- CO2 Total CO2 CH4 N2O CO2e
Category lb/day lb/day
Off-Road 0.9038 9.1743 8.9025 0.0135 0.5225 0.5225 0.4815 0.4815 0.0000 1,325.0953
1,325.0953
0.4112 1,335.3751
Paving 0.0000 0.0000 0.0000 0.0000 0.0000 0.0000 0.0000
Total 0.9038 9.1743 8.9025 0.0135 0.5225 0.5225 0.4815 0.4815 0.0000 1,325.0953
1,325.0953
0.4112 1,335.3751
Mitigated Construction On-Site
CalEEMod Version: CalEEMod.2016.3.2 Date: 11/17/2017 12:48 PMPage 18 of 27
1110 University Mixed Use Project - Bay Area AQMD Air District, Winter
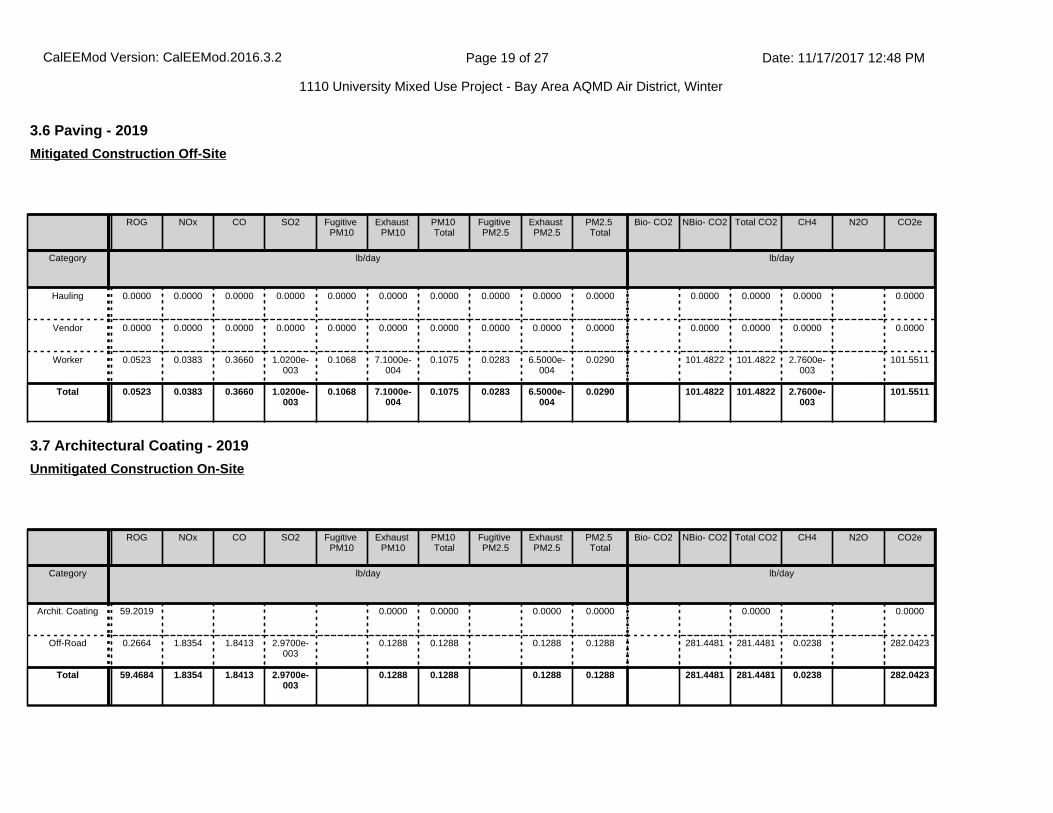
3.6 Paving - 2019
ROG NOx CO SO2 Fugitive PM10
Exhaust PM10
PM10 Total
Fugitive PM2.5
Exhaust PM2.5
PM2.5 Total
Bio- CO2 NBio- CO2 Total CO2 CH4 N2O CO2e
Category lb/day lb/day
Hauling 0.0000 0.0000 0.0000 0.0000 0.0000 0.0000 0.0000 0.0000 0.0000 0.0000 0.0000 0.0000 0.0000 0.0000
Vendor 0.0000 0.0000 0.0000 0.0000 0.0000 0.0000 0.0000 0.0000 0.0000 0.0000 0.0000 0.0000 0.0000 0.0000
Worker 0.0523 0.0383 0.3660 1.0200e-003
0.1068 7.1000e-004
0.1075 0.0283 6.5000e-004
0.0290 101.4822 101.4822 2.7600e-003
101.5511
Total 0.0523 0.0383 0.3660 1.0200e-003
0.1068 7.1000e-004
0.1075 0.0283 6.5000e-004
0.0290 101.4822 101.4822 2.7600e-003
101.5511
Mitigated Construction Off-Site
3.7 Architectural Coating - 2019
ROG NOx CO SO2 Fugitive PM10
Exhaust PM10
PM10 Total
Fugitive PM2.5
Exhaust PM2.5
PM2.5 Total
Bio- CO2 NBio- CO2 Total CO2 CH4 N2O CO2e
Category lb/day lb/day
Archit. Coating 59.2019 0.0000 0.0000 0.0000 0.0000 0.0000 0.0000
Off-Road 0.2664 1.8354 1.8413 2.9700e-003
0.1288 0.1288 0.1288 0.1288 281.4481 281.4481 0.0238 282.0423
Total 59.4684 1.8354 1.8413 2.9700e-003
0.1288 0.1288 0.1288 0.1288 281.4481 281.4481 0.0238 282.0423
Unmitigated Construction On-Site
CalEEMod Version: CalEEMod.2016.3.2 Date: 11/17/2017 12:48 PMPage 19 of 27
1110 University Mixed Use Project - Bay Area AQMD Air District, Winter

3.7 Architectural Coating - 2019
ROG NOx CO SO2 Fugitive PM10
Exhaust PM10
PM10 Total
Fugitive PM2.5
Exhaust PM2.5
PM2.5 Total
Bio- CO2 NBio- CO2 Total CO2 CH4 N2O CO2e
Category lb/day lb/day
Hauling 0.0000 0.0000 0.0000 0.0000 0.0000 0.0000 0.0000 0.0000 0.0000 0.0000 0.0000 0.0000 0.0000 0.0000
Vendor 0.0000 0.0000 0.0000 0.0000 0.0000 0.0000 0.0000 0.0000 0.0000 0.0000 0.0000 0.0000 0.0000 0.0000
Worker 0.0241 0.0177 0.1689 4.7000e-004
0.0493 3.3000e-004
0.0496 0.0131 3.0000e-004
0.0134 46.8379 46.8379 1.2700e-003
46.8697
Total 0.0241 0.0177 0.1689 4.7000e-004
0.0493 3.3000e-004
0.0496 0.0131 3.0000e-004
0.0134 46.8379 46.8379 1.2700e-003
46.8697
Unmitigated Construction Off-Site
ROG NOx CO SO2 Fugitive PM10
Exhaust PM10
PM10 Total
Fugitive PM2.5
Exhaust PM2.5
PM2.5 Total
Bio- CO2 NBio- CO2 Total CO2 CH4 N2O CO2e
Category lb/day lb/day
Archit. Coating 59.2019 0.0000 0.0000 0.0000 0.0000 0.0000 0.0000
Off-Road 0.2664 1.8354 1.8413 2.9700e-003
0.1288 0.1288 0.1288 0.1288 0.0000 281.4481 281.4481 0.0238 282.0423
Total 59.4684 1.8354 1.8413 2.9700e-003
0.1288 0.1288 0.1288 0.1288 0.0000 281.4481 281.4481 0.0238 282.0423
Mitigated Construction On-Site
CalEEMod Version: CalEEMod.2016.3.2 Date: 11/17/2017 12:48 PMPage 20 of 27
1110 University Mixed Use Project - Bay Area AQMD Air District, Winter

4.0 Operational Detail - Mobile
4.1 Mitigation Measures Mobile
3.7 Architectural Coating - 2019
ROG NOx CO SO2 Fugitive PM10
Exhaust PM10
PM10 Total
Fugitive PM2.5
Exhaust PM2.5
PM2.5 Total
Bio- CO2 NBio- CO2 Total CO2 CH4 N2O CO2e
Category lb/day lb/day
Hauling 0.0000 0.0000 0.0000 0.0000 0.0000 0.0000 0.0000 0.0000 0.0000 0.0000 0.0000 0.0000 0.0000 0.0000
Vendor 0.0000 0.0000 0.0000 0.0000 0.0000 0.0000 0.0000 0.0000 0.0000 0.0000 0.0000 0.0000 0.0000 0.0000
Worker 0.0241 0.0177 0.1689 4.7000e-004
0.0493 3.3000e-004
0.0496 0.0131 3.0000e-004
0.0134 46.8379 46.8379 1.2700e-003
46.8697
Total 0.0241 0.0177 0.1689 4.7000e-004
0.0493 3.3000e-004
0.0496 0.0131 3.0000e-004
0.0134 46.8379 46.8379 1.2700e-003
46.8697
Mitigated Construction Off-Site
CalEEMod Version: CalEEMod.2016.3.2 Date: 11/17/2017 12:48 PMPage 21 of 27
1110 University Mixed Use Project - Bay Area AQMD Air District, Winter

ROG NOx CO SO2 Fugitive PM10
Exhaust PM10
PM10 Total
Fugitive PM2.5
Exhaust PM2.5
PM2.5 Total
Bio- CO2 NBio- CO2 Total CO2 CH4 N2O CO2e
Category lb/day lb/day
Mitigated 0.3023 1.4238 3.4663 9.5200e-003
0.7887 0.0124 0.8011 0.2111 0.0117 0.2228 960.5298 960.5298 0.0427 961.5979
Unmitigated 0.3023 1.4238 3.4663 9.5200e-003
0.7887 0.0124 0.8011 0.2111 0.0117 0.2228 960.5298 960.5298 0.0427 961.5979
4.2 Trip Summary Information
4.3 Trip Type Information
Average Daily Trip Rate Unmitigated Mitigated
Land Use Weekday Saturday Sunday Annual VMT Annual VMT
Apartments Mid Rise 123.20 118.00 108.40 277,945 277,945
Strip Mall 56.19 53.70 26.13 79,374 79,374
Total 179.39 171.70 134.53 357,318 357,318
Miles Trip % Trip Purpose %
Land Use H-W or C-W H-S or C-C H-O or C-NW H-W or C-W H-S or C-C H-O or C-NW Primary Diverted Pass-by
Apartments Mid Rise 10.80 4.80 5.70 31.00 15.00 54.00 86 11 3
Strip Mall 9.50 7.30 7.30 16.60 64.40 19.00 45 40 15
4.4 Fleet Mix
Land Use LDA LDT1 LDT2 MDV LHD1 LHD2 MHD HHD OBUS UBUS MCY SBUS MH
Apartments Mid Rise 0.570523 0.041853 0.194077 0.115893 0.018544 0.005373 0.016909 0.024079 0.002502 0.002562 0.005975 0.000872 0.000837
Strip Mall 0.570523 0.041853 0.194077 0.115893 0.018544 0.005373 0.016909 0.024079 0.002502 0.002562 0.005975 0.000872 0.000837
CalEEMod Version: CalEEMod.2016.3.2 Date: 11/17/2017 12:48 PMPage 22 of 27
1110 University Mixed Use Project - Bay Area AQMD Air District, Winter

5.0 Energy Detail
ROG NOx CO SO2 Fugitive PM10
Exhaust PM10
PM10 Total
Fugitive PM2.5
Exhaust PM2.5
PM2.5 Total
Bio- CO2 NBio- CO2 Total CO2 CH4 N2O CO2e
Category lb/day lb/day
NaturalGas Mitigated
0.0107 0.0916 0.0404 5.8000e-004
7.3900e-003
7.3900e-003
7.3900e-003
7.3900e-003
116.6640 116.6640 2.2400e-003
2.1400e-003
117.3573
NaturalGas Unmitigated
0.0107 0.0916 0.0404 5.8000e-004
7.3900e-003
7.3900e-003
7.3900e-003
7.3900e-003
116.6640 116.6640 2.2400e-003
2.1400e-003
117.3573
5.1 Mitigation Measures Energy
Historical Energy Use: N
CalEEMod Version: CalEEMod.2016.3.2 Date: 11/17/2017 12:48 PMPage 23 of 27
1110 University Mixed Use Project - Bay Area AQMD Air District, Winter

6.1 Mitigation Measures Area
6.0 Area Detail
5.2 Energy by Land Use - NaturalGas
NaturalGas Use
ROG NOx CO SO2 Fugitive PM10
Exhaust PM10
PM10 Total
Fugitive PM2.5
Exhaust PM2.5
PM2.5 Total
Bio- CO2 NBio- CO2 Total CO2 CH4 N2O CO2e
Land Use kBTU/yr lb/day lb/day
Apartments Mid Rise
956.759 0.0103 0.0882 0.0375 5.6000e-004
7.1300e-003
7.1300e-003
7.1300e-003
7.1300e-003
112.5599 112.5599 2.1600e-003
2.0600e-003
113.2288
Strip Mall 34.8844 3.8000e-004
3.4200e-003
2.8700e-003
2.0000e-005
2.6000e-004
2.6000e-004
2.6000e-004
2.6000e-004
4.1041 4.1041 8.0000e-005
8.0000e-005
4.1284
Total 0.0107 0.0916 0.0404 5.8000e-004
7.3900e-003
7.3900e-003
7.3900e-003
7.3900e-003
116.6640 116.6640 2.2400e-003
2.1400e-003
117.3573
Unmitigated
NaturalGas Use
ROG NOx CO SO2 Fugitive PM10
Exhaust PM10
PM10 Total
Fugitive PM2.5
Exhaust PM2.5
PM2.5 Total
Bio- CO2 NBio- CO2 Total CO2 CH4 N2O CO2e
Land Use kBTU/yr lb/day lb/day
Apartments Mid Rise
0.956759 0.0103 0.0882 0.0375 5.6000e-004
7.1300e-003
7.1300e-003
7.1300e-003
7.1300e-003
112.5599 112.5599 2.1600e-003
2.0600e-003
113.2288
Strip Mall 0.0348844 3.8000e-004
3.4200e-003
2.8700e-003
2.0000e-005
2.6000e-004
2.6000e-004
2.6000e-004
2.6000e-004
4.1041 4.1041 8.0000e-005
8.0000e-005
4.1284
Total 0.0107 0.0916 0.0404 5.8000e-004
7.3900e-003
7.3900e-003
7.3900e-003
7.3900e-003
116.6640 116.6640 2.2400e-003
2.1400e-003
117.3573
Mitigated
CalEEMod Version: CalEEMod.2016.3.2 Date: 11/17/2017 12:48 PMPage 24 of 27
1110 University Mixed Use Project - Bay Area AQMD Air District, Winter
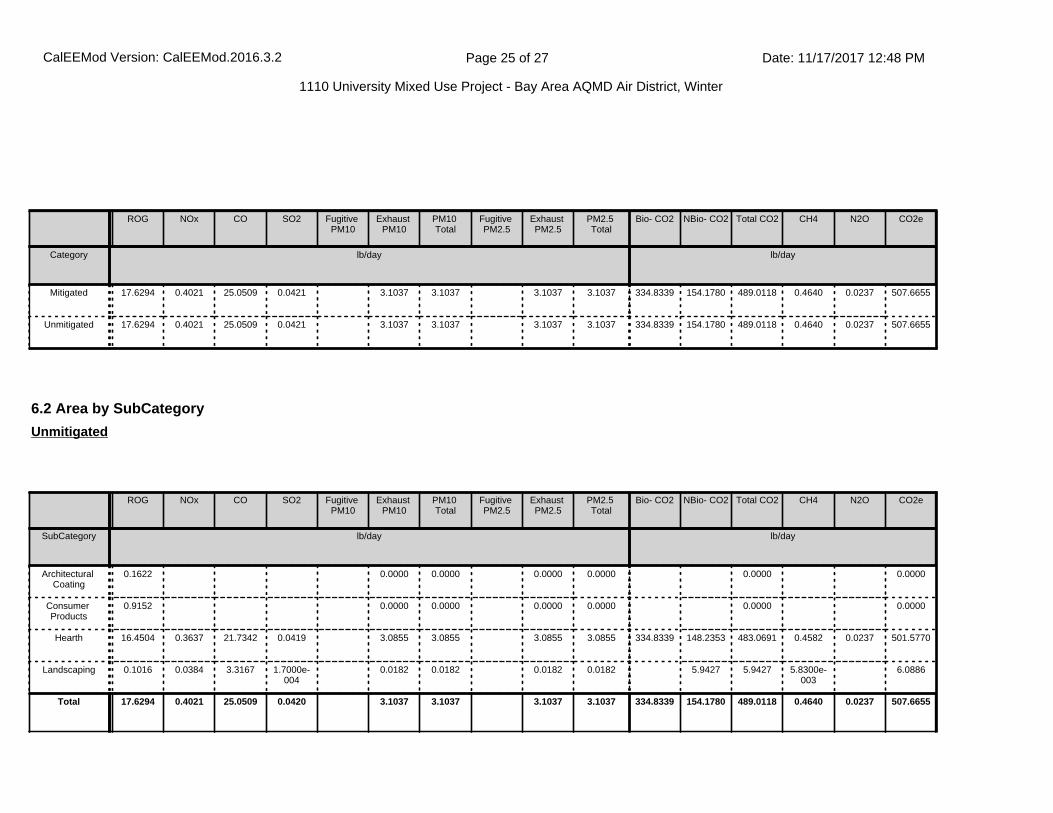
ROG NOx CO SO2 Fugitive PM10
Exhaust PM10
PM10 Total
Fugitive PM2.5
Exhaust PM2.5
PM2.5 Total
Bio- CO2 NBio- CO2 Total CO2 CH4 N2O CO2e
Category lb/day lb/day
Mitigated 17.6294 0.4021 25.0509 0.0421 3.1037 3.1037 3.1037 3.1037 334.8339 154.1780 489.0118 0.4640 0.0237 507.6655
Unmitigated 17.6294 0.4021 25.0509 0.0421 3.1037 3.1037 3.1037 3.1037 334.8339 154.1780 489.0118 0.4640 0.0237 507.6655
6.2 Area by SubCategory
ROG NOx CO SO2 Fugitive PM10
Exhaust PM10
PM10 Total
Fugitive PM2.5
Exhaust PM2.5
PM2.5 Total
Bio- CO2 NBio- CO2 Total CO2 CH4 N2O CO2e
SubCategory lb/day lb/day
Architectural Coating
0.1622 0.0000 0.0000 0.0000 0.0000 0.0000 0.0000
Consumer Products
0.9152 0.0000 0.0000 0.0000 0.0000 0.0000 0.0000
Hearth 16.4504 0.3637 21.7342 0.0419 3.0855 3.0855 3.0855 3.0855 334.8339 148.2353 483.0691 0.4582 0.0237 501.5770
Landscaping 0.1016 0.0384 3.3167 1.7000e-004
0.0182 0.0182 0.0182 0.0182 5.9427 5.9427 5.8300e-003
6.0886
Total 17.6294 0.4021 25.0509 0.0420 3.1037 3.1037 3.1037 3.1037 334.8339 154.1780 489.0118 0.4640 0.0237 507.6655
Unmitigated
CalEEMod Version: CalEEMod.2016.3.2 Date: 11/17/2017 12:48 PMPage 25 of 27
1110 University Mixed Use Project - Bay Area AQMD Air District, Winter

8.1 Mitigation Measures Waste
7.1 Mitigation Measures Water
7.0 Water Detail
8.0 Waste Detail
6.2 Area by SubCategory
ROG NOx CO SO2 Fugitive PM10
Exhaust PM10
PM10 Total
Fugitive PM2.5
Exhaust PM2.5
PM2.5 Total
Bio- CO2 NBio- CO2 Total CO2 CH4 N2O CO2e
SubCategory lb/day lb/day
Architectural Coating
0.1622 0.0000 0.0000 0.0000 0.0000 0.0000 0.0000
Consumer Products
0.9152 0.0000 0.0000 0.0000 0.0000 0.0000 0.0000
Hearth 16.4504 0.3637 21.7342 0.0419 3.0855 3.0855 3.0855 3.0855 334.8339 148.2353 483.0691 0.4582 0.0237 501.5770
Landscaping 0.1016 0.0384 3.3167 1.7000e-004
0.0182 0.0182 0.0182 0.0182 5.9427 5.9427 5.8300e-003
6.0886
Total 17.6294 0.4021 25.0509 0.0420 3.1037 3.1037 3.1037 3.1037 334.8339 154.1780 489.0118 0.4640 0.0237 507.6655
Mitigated
9.0 Operational Offroad
Equipment Type Number Hours/Day Days/Year Horse Power Load Factor Fuel Type
10.0 Stationary Equipment
CalEEMod Version: CalEEMod.2016.3.2 Date: 11/17/2017 12:48 PMPage 26 of 27
1110 University Mixed Use Project - Bay Area AQMD Air District, Winter

11.0 Vegetation
Fire Pumps and Emergency Generators
Equipment Type Number Hours/Day Hours/Year Horse Power Load Factor Fuel Type
Boilers
Equipment Type Number Heat Input/Day Heat Input/Year Boiler Rating Fuel Type
User Defined Equipment
Equipment Type Number
CalEEMod Version: CalEEMod.2016.3.2 Date: 11/17/2017 12:48 PMPage 27 of 27
1110 University Mixed Use Project - Bay Area AQMD Air District, Winter

P U B L I C R EV I E W D R AF T I N I T I AL S TU D Y / D R A F T MI TI G A T E D N EG A T I V E D E C L A R A TI O N J U N E 2 0 1 8
1 1 1 0 U N I V E R S I T Y AV E N U E M I X E D- U S E P RO J E C T B E R K E L E Y , C A
T:\CBE1702 1110 University\PRODUCTS\IS-MND\Public\1110 University Public Review.docx (06/14/18) C-1
APPENDIX C
PRELIMINARY TRANSPORTATION ANALYSIS AND PARKING SURVEY REPORT
1 1 1 0 U N I V E R S I T Y AV E N U E M I X E D- U S E P RO J E C T B E R K E L E Y , C A
P U B L I C R EV I E W D R AF T I N I T I AL S TU D Y / D R A F T MI TI G A T E D N EG A T I V E D E C L A R A TI O N
J U N E 2 0 1 8
T:\CBE1702 1110 University\PRODUCTS\IS-MND\Public\1110 University Public Review.docx (06/14/18) C-2
This page intentionally left blank.

VISION THAT MOVES YOUR COMMUNITY
PLEASANTON SAN JOSE SANTA ROSA SACRAMENTO FRESNO Corporate Office: 4305 Hacienda Drive, Suite 550, Pleasanton, CA 94588
Phone: 925.463.0611 Fax: 925.463.3690 www.TJKM.com DBE #40772 SBE #38780
Memorandum
Date: July 27, 2017
To: Dipan Shah, P.E. Transportation Divisions City of Berkeley
From:
Colin Burgett TJKM
Jurisdiction:
Berkeley, CA
Subject: Preliminary Transportation Analysis for 1110 University Avenue Mixed-use Development
This report summarizes the results of the preliminary transportation analysis conducted for the proposed 1110 University Avenue mixed-use development (“the Project”). This memorandum summarizes key elements of the proposed Project relevant to potential the Project description, provides a trip generation forecast, and an assessment of the site plan where relevant to access and mobility. An assessment of on-street motor vehicle parking supply and demand was provided separately. PROPOSED PROJECT The Project site is located on the south side of University Avenue, roughly 150 feet east of intersection of University and San Pablo Avenues, within the C-1 zoning district and University Avenue Strategic Plan area. The site is approximately one mile west of downtown Berkeley and 1.5 miles from the University of California campus, and served by bus service on University Avenue. Figure 1 shows the site location in relation to adjacent properties. The Project would redevelop an existing 6,739-square foot lot hat is currently developed with 2,858 gross square feet of ground-floor commercial space and eight second-floor apartments. The Project would replace the existing building with a new building that would provide 40 studio apartments on the upper levels, thus a net increase of 32 studio apartments. The Project would replace, but not expand, the leasable ground-floor commercial space. Access to the Project site would be via pedestrian entrances to and from the adjacent sidewalk on the south side of University Avenue. The Project would provide a bicycle storage facility on the ground-floor with capacity for 40 bicycles to be parked. No off-street motor vehicle parking would be provided. On-street time-limited parking spaces on University Avenue immediately adjacent to the site would be utilized for short-term parking and delivery access. Figure 2 shows the ground-floor site plan.

2
VISION THAT MOVES YOUR COMMUNITY
Figure 1 Site Context – Neighborhood Site Plan
Figure 2 Ground Floor Site Plan
3
VISION THAT MOVES YOUR COMMUNITY
Net Land Use Change with Project The net change in proposed land uses on the site is summarized below. As described below, the Project would increase the supply of studio apartments on the site, while the existing ground-floor commercial space would be replaced but not expanded: Existing Use: The 6,739-square foot site is currently developed with a two-story mixed-use building containing approximately 2,858 gross square feet of ground-floor commercial space and eight residential apartment dwelling units located on the second floor.
The existing ground-floor commercial space consists of approximately 2,488 gross square feet of sidewalk fronting commercial space – currently occupied by a “wash-and-fold” laundry service (approximately 1,848 square feet); a hair and nail salon (approximately 640 square feet); and the ground floor also includes an office space located at the rear of the building (approximately 370 gross square feet).
No off-street motor vehicle parking is provided. Proposed Use: The proposed Project would replace the existing building with a five-story mixed-use building containing 2,768 gross square feet of ground-floor commercial space and 40 residential studio apartments.
The commercial space would consist of a 1,654 square foot sidewalk-fronting retail space on the north side of building, and 1,114 square foot commercial flex space in the rear (south) side of the first floor proposed for use as a yoga studio.
The studio apartments, totaling 14,352 gross square of residential space, would be located on the second through fifth floors and would range in size from 319 to 370 square feet, with an average size of approximately 359 square feet per dwelling unit.
The proposed Project would provide 40 bicycle parking spaces and a bicycle repair station on the ground floor. No off-street motor vehicle parking spaces would be provided.
Net Land Use Change with Project: The proposed Project would therefore result in a net increase of 32 studio apartment dwelling units on the upper levels. The total gross square feet of leasable ground-floor commercial space would not increase with the proposed Project. The net change in dwelling units and gross commercial space is summarized on Table 1 below.
Table 1: Proposed Change in Use
Land Use Existing Use Proposed Use Net Increase in Size
with Project
Residential dwelling units (d.u.) 8 apartments 40 studio apartments +32 studio apartments
Ground‐floor commercial space (gross square feet) 2,858 gross square feet 2,768 gross square feet N/A

4
VISION THAT MOVES YOUR COMMUNITY
Special Characteristics of the Project The Project is located immediately adjacent to the existing commercial node where University and San Pablo Avenues intersect, while the site will provide studio apartments at a location within 1.5 miles of the University of California campus, and one mile from downtown Berkeley, thus within convenient cycling distance. Frequent transit services is provided on both University and San Pablo Avenues, including AC Transit’s “rapid bus” service on San Pablo Avenue. Figure 3 summarizes trip-reduction elements identified by the Project applicant, which includes provision of two free AC Transit passes for 40 years to each dwelling unit. The provision of “zero parking” on the Project site has also been identified as a component of the Project applicant’s “green trip” certification.
Figure 3 Project Trip Reduction Characteristics

5
VISION THAT MOVES YOUR COMMUNITY
TRIP GENERATION FORECAST This section describes the potential net increase in traffic volumes to and from the site that could result from the Project. The trip generation forecast is based on standard trip generation rates obtained from the standard reference Trip Generation, 9th Edition, published by the Institute of Transportation Engineers (ITE). As summarized below on Table 2 the proposed land uses are forecasted to generate up to 14 a.m. and 19 p.m. peak hour vehicle trips. The Project is therefore anticipated to result in a net increase of less than 10 peak hour vehicle trips compared to the existing land uses on the site.
Table 2: Trip Generation Forecast Land Use 1 (ITE Code)
Size 2 AM Peak Hour PM Peak Hour
Rate In:Out In Out Total Rate In:Out In Out Total
EXISTING LAND USE
Low-Rise Apartment (221) 8 d.u. 0.46 21:79 1 3 4 0.58 65:35 2 3 5
Nail Salon (918) 0.6 ksf 1.21 100:00 1 0 1 1.45 17:83 0 1 1
Office (710) 0.4 ksf 1.56 88:12 1 0 1 1.49 17:83 0 1 1
Retail (826) 1.8 ksf 2.71 44:56 2 3 5 6.84 48:52 6 6 12
Subtotal- Person Trips 5 6 11 8 11 19
WBCMP Vehicle Trip Reduction 2 30% -1 -2 -3 -3 -3 -6
Retail Pass-by Reduction3 34% -1 -1 -2
Total Reductions -1 -2 -3 -4 -5 -9
Subtotal 1: Existing Uses (Vehicle Trips)
4 4 8 4 6 10
PROPOSED LAND USE
Mid-Rise Apartment (223) 40 d.u. 0.30 31:69 4 8 12 0.39 58:42 9 7 16
Retail (826) 2.8 ksf 2.71 44:56 4 4 8 6.84 48:52 9 10 19
Subtotal- Person Trips 8 12 20 18 17 35
WBCMP Vehicle Trip Reduction 2 30% -2 -4 -6 -6 -5 -11
Retail Pass-by Reduction 3 34% -2 -3 -5
Total Reductions -2 -4 -6 -8 -8 -16
Subtotal 2: Proposed Uses (Vehicle Trips )
6 8 14 10 9 19
NET CHANGE WITH PROJECT
Net Vehicle Trips 2 4 6 6 3 9
Notes: 1. Forecasted trip rate for the proposed studio apartments is based on “Mid-Rise Apartments” (ITE Land Use 223), applicable to multi-family housing developments with three to ten floors. Trip generation estimate for the existing residential development is based on the average rate for “Low-Rise Apartments” (ITE Land Use Code 221), applicable to apartment buildings with one or two levels. 2. Sizes: ksf = 1,000 gross leasable square feet. d.u. = number of dwelling units. 3. WBCMP vehicle trip reduction derived from the West Berkeley Circulation Master Plan (WBCMP) trip reduction tool to reflect local travel characteristics in West Berkeley, to reflect local density of uses and rates of transit, walking and bicycling. 4. Retail pass-by reduction derived derived from ITE Trip Generation Handbook (3rd Edition), and applied to p.m. peak hour only, and applied after subtracting the WBMCP reduction. Trip Generation Rate Source: ITE Trip Generation Manual, 9th Edition, 2012

6
VISION THAT MOVES YOUR COMMUNITY
SITE ACCESS TJKM reviewed the project site plan to evaluate site access.
Site Access Direct access to the site will be on foot, via a pedestrian doorway entrance connecting directly to the adjacent sidewalk on University Avenue, while the street-front commercial space will also have direct pedestrian access to the sidewalk.
Residents traveling by bicycle will be accommodated by walking into the building via the pedestrian entrance, while a 40-space bicycle parking facility will be provided on the ground floor. Existing bicycle racks located on the sidewalk near the proposed commercial entrance accommodate short-term bicycle demand by commercial customers, while commercial tenants would also have access to the long-term indoor bicycle parking facility.
Transit stops are located at the intersection of University and San Pablo Avenues, approximately 150 feet to the west of the site. Existing sidewalks exceed minimum width and clear-space requirements, and will provide adequate pedestrian connections.
Motor Vehicle Parking Supply & Demand The Project is requesting a waiver of off-street parking requirements, and the parking assessment findings and methodology are described in a separate memorandum. The Berkeley Municipal Code (BMC) would typically require 15 off-street motor vehicle parking spaces for the residential portion of the development unless a reduction is granted. Similarly, the BMC code could also require up to six off-street spaces for the ground-floor residential portion of the development, although the BMC also specifies that off-street parking requirements in the C-1 zoning district may be waived for the commercial portions of mixed-use developments fronting University Avenue, that contain both a multi-family residential and retail component, as this Project does.
Based on the on-street parking occupancy surveys conducted within one-fifth mile of the site in March 2017, parking demand generated by the Project is not anticipated to substantially reduce the amount of available on-street parking within the parking survey area.
Commercial Vehicle Loading Based on the City’s Zoning Code, commercial developments exceeding 10,000 square feet would be provided to provide off-street loading spaces. Since the proposed commercial development is less than 10,000 square feet, off-street loading space is not required. The existing on-street parking space immediately fronting the site on University Avenue is currently designed as a short-term (“green-curb”) parking zone, to encourage turnover existing “wash-and-field” laundry facility. Maintaining this space for short-term parking is recommended to allow continued use for commercial deliveries. In addition, such spaces could serve a dual use in accommodating residential deliveries.

7
VISION THAT MOVES YOUR COMMUNITY
CONCLUSIONS AND RECOMMENDATOINS Based on the anticipated trip generation, parking demand, site plan, project characteristics and site context, conclusions and recommendations are summarized below. Based on this review, the following conclusions have been made:
1. Vehicle Trip Generation: The Project will result in net increase of less than 10 peak-hour vehicle trips. As shown on Table 2, the existing land uses on the site are estimated to generate 8 a.m. and 10 p.m. peak hour vehicle trips, while the proposed land uses will generate up to 14 a.m. and 19 p.m. peak hour vehicle trips. Therefore, the net increase in traffic would be six vehicle trips during the a.m. peak hour and nine vehicle trips during the p.m. peak hour.
2. Traffic Impacts: given the relatively low volume of vehicle trips generated, the Project is not anticipated to result in significant off-site traffic impacts would be anticipated.
3. Pedestrian, Bicycle & Transit Impacts: As no driveway curb-cuts are proposed, the Project is not anticipated to negatively affect pedestrian circulation on the adjacent sidewalk along University Avenue. Similarly, the Project will not result in significant impacts to bicycle circulation. Existing sidewalks will provide adequate pedestrian connections to/from the adjacent transit stops and commercial services.
4. Site Access: Direct access to the site will be on foot, via a pedestrian doorway entrance connecting directly to the adjacent sidewalk on University Avenue, while the street-front commercial space will also have direct pedestrian access to the sidewalk. Residents and commercial employees traveling by bicycle will be accommodated by walking into the building via the pedestrian entrance, while a 40-space bicycle parking facility will be provided on the ground floor. Existing bicycle racks located on the sidewalk near the proposed commercial entrance accommodate short-term bicycle demand by commercial customers. Transit stops are located at the intersection of University and San Pablo Avenues, approximately 150 feet to the west of the site. Existing sidewalks will provide adequate pedestrian connections to the adjacent commercial node and bus stops. Based on this review, site access is adequate for this location and proposed uses.
Based on this analysis, no significant transportation impacts are anticipated to result from the proposed Project. The following recommendation is provided below, which could be considered for incorporation into conditions of approval:
Loading & Deliveries: specify loading access procedures for resident move-in/move-out procedures. The existing on-street parking space immediately fronting the site on University Avenue is currently designed as a short-term (“green-curb”) parking zone, to encourage turnover existing “wash-and-field” laundry facility. Maintaining this space for short-term parking is recommended to allow continued use for commercial deliveries. In addition, such spaces could serve a dual use in accommodating residential deliveries.


VISION THAT MOVES YOUR COMMUNITY
www.TJKM.com PLEASANTON SAN JOSE SANTA ROSA OAKLAND SACRAMENTO FRESNO
Corporate Office: 4305 Hacienda Drive, Suite 550, Pleasanton, CA 94588 Phone: 925.463.0611 Fax: 925.463.3690 Email: [email protected]
DBE #40772 SBE #38780
July 24, 2017 Dipan Shah, P.E. Transportation Division City of Berkeley Subject: Parking Survey Report for 1110 University Avenue Dear Dipan: This letter report summarizes the results of the on‐street motor vehicle parking survey conducted for the proposed 1110 University Avenue mixed‐use development (“the Project”). The purpose of the parking survey is to assess the adequacy of the on‐street parking supply near the project site relative to the potential parking demand generated by the Project. The site is located in the C‐1 zoning district and University Avenue Specific Plan overlay. The proposed mixed‐use Project would redevelop an existing 6,739‐square foot lot that has no off‐street parking with both an upper‐level residential and ground‐floor commercial component:
The upper‐level residential component would replace eight existing apartments with 40 studio apartments, ranging in 319 to 370 square feet each, to provide 14,352 gross square of residential space. Based on the C‐1 zoning district requirements, the Berkeley Municipal Code (BMC) would require 15 off‐street motor vehicle parking spaces for the residential component (one per thousand square feet of residential space) unless a reduction is granted.
The ground‐floor commercial component would not expand the size of the commercial space. The site currently provides 2,858‐square feet of ground‐floor commercial space, while the proposed Project would provide 2,766 gross square feet of ground‐floor commercial space. The BMC would potentially require two off‐street parking spaces per thousand square feet of gross commercial space– thus six off‐street parking spaces the commercial portion. However, the C‐1 zoning district standards also specifies that off‐street parking requirements may be waived or modified for the commercial component of mixed‐use developments fronting University Avenue, that contain both a multi‐family residential and retail component, as this Project does.
Section 23E.140 of the BMC specifies that a reduction in the amount of required motor vehicle parking may be granted if: 1) The reduction will not substantially reduce the amount of available parking in the vicinity; and 2) The use includes one of the following neighborhood‐serving uses: Retail Products Store(s), Food
Service Establishments, and/or Personal/Household Service(s). These uses include, but are not limited to: Dry Cleaning and Laundry Agents, Drug Stores, Food Products Stores, Household Items Repair Shops, and/or Laundromats; and
3) The parking requirement modification will meet the purposes of the district related to improvement and support for alternative transportation, pedestrian improvements and activity, or similar policies; or if there are other factors, such as alternative transportation demand management strategies or policies in place that will reduce the parking demand generated by the use.

2
VISION THAT MOVES YOUR COMMUNITY
PARKING SURVEY AREA On‐street parking occupancy counts were conducted within walking distance of the project site, within approximately one‐fifth mile including the blocks bounded by:
Eighth Street (western border of survey area) Bonar Street / Chestnut Street (eastern border of survey area) Delaware Street (northern border of survey area) Alston Way (southern border of survey area)
Figure 1 shows the boundaries of the parking survey area. The survey differentiated between residential and commercial on‐street parking supply:
The on‐street residential parking supply within the survey area consists of 1,134 on‐street parking spaces that are not time‐restricted. The Project site is not located within a residential parking permit zone.
The on‐street commercial parking supply within the survey area consist of 274 time‐restricted spaces (both metered and unmetered) parking spaces, with time limits ranging from 1 to 2 hours for most spaces, while “green zones” are further limited to 5 to 30 minutes. The commercial parking supply within the parking survey area is primarily located on University and San Pablo Avenues. The one‐block segment of University Avenue immediately bordering the Project site, between San Pablo Avenue and Curtis Street, includes 30 on‐street commercial parking spaces on the block, and over 80 spaces on the 3‐block segment of University Avenue between Ninth and Bonnar Streets, with 2‐hour limits on most spaces.
The parking survey area therefore has a total capacity of 1,408 on‐street parking spaces, consisting of 1,134 residential on‐street spaces and 274 commercial (time‐limited) on‐street spaces. Appendix 1 provides a diagram showing the block‐by‐block parking supply. SURVEY PERIODS Peak parking demand for residential uses typically occurs in late evening (after 9:00 pm) and/or early morning (before 7:30 am) reflecting overnight parking demand. The survey therefore included counts during both the early morning and late evening periods that are most relevant to residential parking demand, as well as the late morning, mid‐day and early evening periods that are relevant for peak retail parking demand. The survey periods were as follows: Early Morning (6:00 – 7:00 am); Late Morning (9:00 – 10:00 am); Mid‐day (Noon‐ 1:00 pm); Early Evening (6:00 pm – 7:00 pm); and Late Evening (9:00 pm‐10:00 pm)

Figure 1. Parking Survey Area Boundaries
N
1110 University Avenue
LEGENDProject SiteBoundary of Parking Survey
0.2 miles
Scale in Miles

4
VISION THAT MOVES YOUR COMMUNITY
ON‐STREET PARKING SURVEY RESULTS On‐street parking occupancy counts were conducted during each survey period on a total of four different days (Wednesday, Friday, Saturday & Sunday) during a typical week from March 10 to March 15, 2017 when classes were in session at UC Berkeley. The parking survey observed the number of vehicles parked, and the number of vacant spaces, during each survey period for both residential and commercial parking. Table 1 describes the vacant supply of on‐street residential parking spaces during each survey period. The on‐street residential parking supply ranged from 234 to 309 vacant parking spaces during each survey period, representing occupancy rates ranging from 72 percent to 79 percent. The lowest occupancy rates for the residential parking supply occurred on weekdays between 6:00 a.m. and 7:00 a.m., while the lowest occupancy on weekends occurred in the evening, between 6:00 and 7:00 p.m., on both Saturday and Sunday. Peak occupancy occurred at varying time periods, between noon and 1:00 p.m. on Wednesday and Sunday, 6:00 p.m. and 7:00 p.m. on Friday, and between 9:00 a.m. and 10:00 a.m. on Saturday. The irregular pattern of peak occupancy for residential uses in the area may reflect both (1) usage of the residential parking supply by some adjacent commercial uses during mid‐day periods; and (2) relatively low rates of vehicle usage by residents, as many residential vehicles remain parked throughout the day on weekdays.
Table 1. Vacant On‐street Residential Parking Spaces Wednesday Friday Saturday Sunday 6:00‐7:00 AM 309 301 287 308 9:00‐10:00 AM 263 287 234 298 12:00‐1:00 PM 256 281 259 236 6:00‐7:00 PM 263 262 318 317 9:00‐10:00 PM 262 264 300 294
On‐street Parking Supply (Residential): 1,134 spaces Table 2 describes the vacant supply of on‐street commercial spaces during each survey period. The on‐street commercial parking supply ranged from 80 to 201 vacant spaces during each survey period, representing occupancy rates ranging from 22 percent to 71 percent. The lowest occupancy rates for the commercial parking supply occurred each day between 6:00 a.m. and 7:00 a.m., while peak occupancy occurred between 6:00 p.m. and 7:00 p.m. on most days except Sunday, when peak commercial occupancy occurred between noon and 1:00 p.m. on Sunday.
Table 2. Vacant On‐street Commercial (Metered and/or Time‐Limited) Parking Spaces Wednesday Friday Saturday Sunday 6:00‐7:00 AM 197 179 214 201 9:00‐10:00 AM 167 171 183 180 12:00‐1:00 PM 143 138 144 80 6:00‐7:00 PM 95 108 128 86 9:00‐10:00 PM 109 136 140 134
On‐street Parking Supply (Commercial): 274 spaces
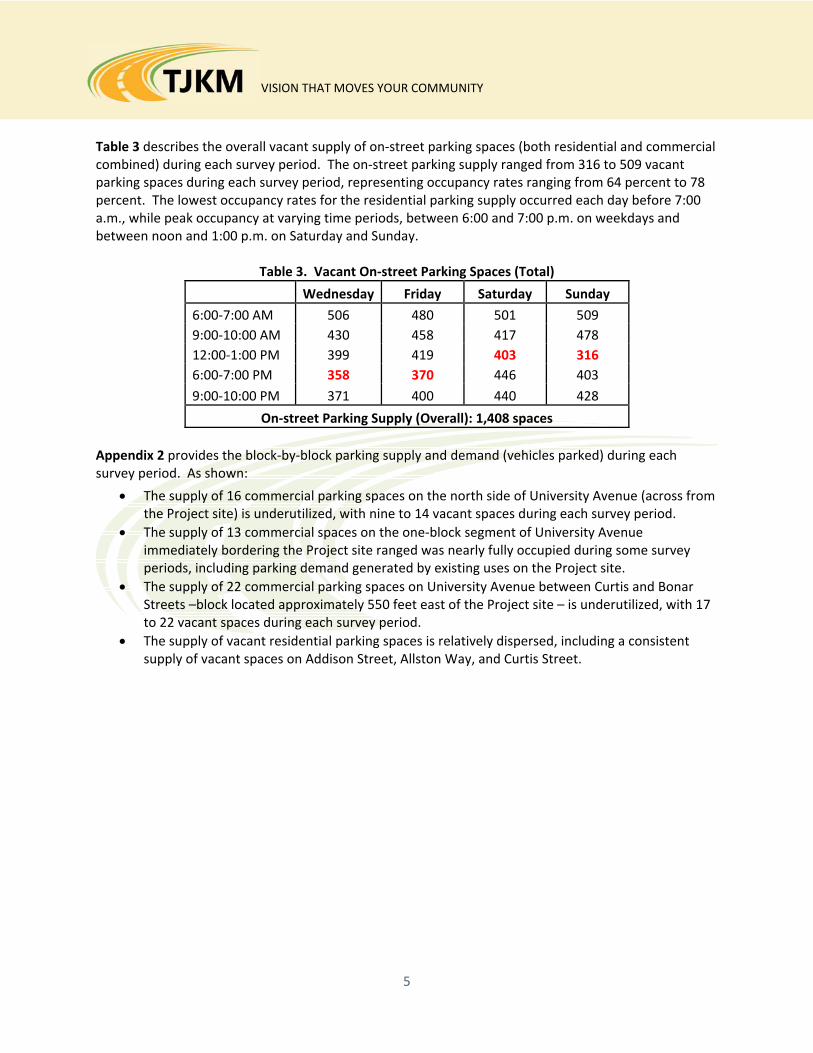
5
VISION THAT MOVES YOUR COMMUNITY
Table 3 describes the overall vacant supply of on‐street parking spaces (both residential and commercial combined) during each survey period. The on‐street parking supply ranged from 316 to 509 vacant parking spaces during each survey period, representing occupancy rates ranging from 64 percent to 78 percent. The lowest occupancy rates for the residential parking supply occurred each day before 7:00 a.m., while peak occupancy at varying time periods, between 6:00 and 7:00 p.m. on weekdays and between noon and 1:00 p.m. on Saturday and Sunday.
Table 3. Vacant On‐street Parking Spaces (Total) Wednesday Friday Saturday Sunday 6:00‐7:00 AM 506 480 501 509 9:00‐10:00 AM 430 458 417 478 12:00‐1:00 PM 399 419 403 316 6:00‐7:00 PM 358 370 446 403 9:00‐10:00 PM 371 400 440 428
On‐street Parking Supply (Overall): 1,408 spaces Appendix 2 provides the block‐by‐block parking supply and demand (vehicles parked) during each survey period. As shown:
The supply of 16 commercial parking spaces on the north side of University Avenue (across from the Project site) is underutilized, with nine to 14 vacant spaces during each survey period.
The supply of 13 commercial spaces on the one‐block segment of University Avenue immediately bordering the Project site ranged was nearly fully occupied during some survey periods, including parking demand generated by existing uses on the Project site.
The supply of 22 commercial parking spaces on University Avenue between Curtis and Bonar Streets –block located approximately 550 feet east of the Project site – is underutilized, with 17 to 22 vacant spaces during each survey period.
The supply of vacant residential parking spaces is relatively dispersed, including a consistent supply of vacant spaces on Addison Street, Allston Way, and Curtis Street.

6
VISION THAT MOVES YOUR COMMUNITY
PROJECT PARKING DEMAND Project parking demand consists of potential vehicles parked by the residential and commercial portions of the proposed Project. The Project site is approximately one mile west of downtown Berkeley and 1.5 miles from the University of California campus, and served by bus service on University Avenue.
BMC Code Requirements The Project site is located in the C‐1 zoning district University Avenue Specific Plan overlay. The proposed Project would not increase the gross square feet of commercial floor area over the existing use. The site currently provides 2,858‐square feet of ground‐floor commercial space, while the proposed Project would provide 2,766 gross square feet of ground‐floor commercial space. For sites in the C‐1 district, the BMC would requires up to six off‐street parking spaces for the commercial portion of the development (two spaces per thousand gross square feet). However, the BMC also specifies that off‐street parking requirements may be waived or modified for the commercial component of mixed‐use developments fronting University Avenue, that contain both a multi‐family residential and retail component, as this Project does.
Required parking for residential uses in the C‐1 zoning district is based on the R‐3 zoning district that requires one motor vehicle parking space per 1,000 square feet of gross floor area of residential space. The proposed Project would provide 14,352 gross square of residential space. Therefore, the Berkeley Municipal Code (BMC) would require 15 off‐street motor vehicle parking for the residential portion of the proposed Project unless a reduction is granted.
Residential Parking Demand The Project is anticipated to generate a lower rate of parking demand than typical apartments, since the residential portion of the Project would consist entirely of studio apartments, with an average size of approximately 360 square feet each, at a location within convenient bicycling distance of a major university, Future tenants of the proposed 40 studio apartment residential units are anticipated to have a relatively low rate of vehicle ownership, as the Project is located in a walkable neighborhood with frequent transit service, at close proximity to area bicycle routes, at a site within one mile of Downtown Berkeley, and within 1.5 miles of U.C. Berkeley. Furthermore, the Project includes elements aimed at “green trips” certification, including provision of transit passes to residents, 40 bicycle parking spaces for residents and additional bicycle parking spaces for guests. In addition the site is
Commercial Parking Demand The current building on the site includes 2,858 gross square feet of ground‐floor commercial space, while the proposed Project will include 2,768 gross square feet of commercial space. Therefore, the Project will not result in an expansion of the existing ground‐floor commercial space on the site. Commercial parking demand rates can vary by type of tenant, but a general rule of thumb for mixed‐use commercial areas is that overall parking demand tends to average approximately two vehicles parked per thousand square feet of development. Therefore, the potential parking demand for both the existing and proposed commercial uses is estimated to be approximately six vehicles. However, since the proposed Project will not result in an increase in gross commercial floor area over the existing use, the proposed Project is not anticipated to result in an increase in commercial parking demand compared to the existing use.

7
VISION THAT MOVES YOUR COMMUNITY
CONCLUSION Section 23E.28140 of the BMC specifies that a reduction in the amount of required motor vehicle parking in the C‐1 zoning district may be granted if (1) “the reduction will not substantially reduce the amount of available parking in the vicinity”; (2) uses include neighborhood‐serving retail uses, as this project does, and (3) the parking reduction meets the purposes of the district related to pedestrian activity or similar policies. This site is located with the C‐1 district and University Avenue Strategic Plan (UASP) overlay, which includes goals to encourage mix use infill, housing and pedestrian‐oriented development. As proposed, no off‐street motor vehicle parking would be provided, while the residential portion of the proposed Project would provide 40 studio apartments on a 6,739‐square foot lot located within bicycling distance of both the University of California campus and downtown Berkeley. The site is also located immediately adjacent to a mixed‐use/commercial node served by frequent bus service on both University and San Pablo Avenues. The Berkeley Municipal Code (BMC) would require 15 off‐street motor vehicle parking spaces for the residential portion of the development unless a reduction is granted. Similarly, the BMC code could also require up to six off‐street spaces for the ground‐floor residential portion of the development, although the BMC also specifies that off‐street parking requirements in the C‐1 zoning district may be waived for the commercial portions of mixed‐use developments fronting University Avenue, that contain both a multi‐family residential and retail component, as this Project does. Based on the anticipated Project parking demand, and the on‐street parking survey results described above, the supply of vacant on‐street parking is more than adequate to accommodate Project‐generated parking demand and therefore the proposed reduction in required off‐street motor vehicle parking spaces will not substantially reduce the amount of available parking in the vicinity:
Commercial Parking Supply: Since the proposed Project will not result in an increase in gross commercial floor area over the existing use, the proposed Project is not anticipated to result in increased commercial parking demand compared to the existing use. The supply of vacant on‐street commercial parking within walking distance of the Project site exceeded 80 vacant spaces during all survey periods, including nine to 14 vacant spaces on the north side of University Avenue (across from the Project site) and 17 to 22 vacant spaces on the south side of University Avenue between Curtis and Bonnar Streets. Therefore, the commercial parking supply is more than adequate to accommodate the commercial parking demand generated by the site, estimated at less than six vehicles, and is not anticipated to result in an increase in commercial parking demand compared to the existing commercial use at the site.
Residential Parking Supply: The Berkeley Municipal Code (BMC) would require 15 off‐street motor vehicle parking spaces for the residential portion of the development unless a reduction is granted. The supply of vacant on‐street residential parking spaces within walking distance of the Project site ranged from 234 to 318 vacant spaces during each survey period, and is more than adequate to accommodate parking demand generated by the proposed 40 studio apartments without substantially reducing the supply of vacant parking in the vicinity.
Please feel free to contact me if you have any questions regarding this report. Sincerely, Colin Burgett, Senior Project Manager, TJKM

VISION THAT MOVES YOUR COMMUNITY
Appendix A – Parking Supply Diagram

8TH STR
EET8TH
STREET
9TH STR
EET
10TH STR
EET
SAN
PAB
LO A
VEN
UE
HEARST AVENUE
UNIVERSITY AVENUE
DELAWARE STREET
UNIVERSITY AVENUE
CH
ESTNU
TSTR
EET
CU
RTIS STR
EET
BO
NA
R STR
EET
HEARST AVENUE
DELAWARE STREET
ADDISON STREET
UNIVERSITY AVENUE UNIVERSITY AVENUE
ADDISON STREET
ADDISON STREETADDISON STREET
ALLSTON WAY ALLSTON WAY
Marked Stall
ALLSTON WAY ALLSTON WAY
HEARST AVENUE HEARST AVENUE
COWPER STREET
BY
RO
N STR
EET
CU
RTIS STR
EET
SAN
PAB
LO A
VEN
UE
9TH STR
EET
1 Hour
1 Hour
1 Hour1 Hour
General Meter 1 Hour / 2 Hour
5 Min Parking
COMM
COMM
1 Hour
1 Hour
10TH STR
EET
2 Hour
BERKELEY WAY
30 MIN
30 MIN
1 Hour 10 MIN
2Hour
CH
ESTNU
TSTR
EET
BO
NA
RSTR
EET
ALLSTON WAY
BR
OW
NIN
GTR
EET30 MIN
2Hour
2Hour
2Hour
1 Hour
1 Hour
1 Hour
1 Hour
1 Hour
DELAWARE STREETDELAWARE STREETDELAWARE STREET
2 Hour (Comm)
24 Min(Comm)
24 Min(Comm)
2 Hour (Comm)
2 Hour (Comm)
2 Hour (Comm)
ALLSTON WAY
HEARST AVENUE
CU
RTIS STR
EETC
UR
TIS STREET
ADDISON STREET
9TH STR
EET9TH
STREET
8TH STR
EET8TH
STREET
CO
MM
1718
11 7
10 9
9
9
13+2H 14+1H16
5+2Y
8 29+1H 12
24 10
1314 1213
6
8 3+2GM
12+3MG11+1MG+1H
28
26
9
13
9M+1H 4+2M
28+2Y+1H2323 25
7
12
11
8
9 9
96
13 16
3019
12 11
11 7+1H
6+2H
8
9M+4GM+1Y
11
9
69+4G
17 17
10+1H
6+1H
1518 18 20+1H
9
8+1H
9
5+2S
11
7
7
96
10
11
12
14+3M 17
6+8M+2Y
11+2H 7+3M+1Y
13+4S 4+3M+5
8
9+4M+1H
11
9
7
5+2Y
16+1H 11+2M
Green Meter 30 MIN / 24 MIN
2+2M+1Y
8M 4M+2GM
5M+1W 4M
4M+1Y11M+2MG+1H+2W
22M
9M+5MG
6
5M
10M
1M+6GM+2Y+1G
Green Curb 5MIN / 10 MIN
8M+3Y 4M+3Y
3+3G+9 9
11M+3G+1Y
6M+2MG
12+3MG
7M+5MG+2G
4+9M+1Y
DrivewayHandicap Stall
Yellow Curb
General Stall
UNIVERSITY AVENUE
10TH STR
EET10TH
STREET
ADDISON STREET
ALLSTON WAY
Legend:
Red Curb
5 Min Parking Stall

VISION THAT MOVES YOUR COMMUNITY
Appendix B – Parking Supply & Demand by Survey Period

WEDNESDAY (3/15/2017) 6:00 - 7:00AM
11(9) 7(6) 8(7) 30(21) 12(7)
10(6) 9(6) 7(6) 24(22) 10(5)
18(17) 17(12) 9(10)* 15(6) 16(15) 15(11) 14(7) 13(0) 14(14) 13(13) 13(11) 12(10)
9(7) 11(6) 7(7) 26(28)* 13(14)*
8(6) 9(8) 7(9)* 28(26) 9(8)
6(5) 6(6)
17(14) 17(13) 14(8) 11(5) 17(13) 13(12) 14(6) 8(0) 13(13) 15(15)
8(8) 5(8)*
8(3) 6(0) 5(0) 16(6) 14(4)
5(1) 6(1) 4(1) 14(13) 22(1)
10(0) 6(5)
16(1) 13(4) 11(7) 12(11) 17(9) 12(5) 11(3) 7(6) 13(10) 16(10) 12(2)
15(6) 9(10)*
6(7)* 9(6) 9(8) 7(3)
13(5) 6(6)
10(0) 12(10) 11(5)
10(8) 7(7) 9(5) 11(8)
4(1) 19(16) 30(19) 23(6) 25(10) 23(11) 31(15)
17(13) 17(15) 18(12) 15(13) 18(10) 21(11) 9(3)
6(1) 5(0) 11(4) 8(7)
7(6) 11(7) 9(5) 8(2) 6(3) 9(2) 8(5)
11(7) 7(6) 7(4) 8(3) 9(4) 9(3) 11(6)
Note: * Including Vehicles that parked on Driveway & Red Curb
xx (yy) ‐ Supply (Occupied)
8thStreet
9thStreet
8thStreet
9thStreet
9thStreet
8thStreet
8thStreet
9thStreet
10thStreet
10thStreet
10thStreet
10thStreet
San Pablo AvenueSan Pablo Avenue
San Pablo AvenueSan Pablo Avenue
Curtis Street
Chestnut Street
Curtis StreetCurtis Street
Curtis Street
Chestnut Street
Bonar StreetBonar Street
Browning Street
Byron StreetByron Street
Delaware Street
University Avenue
Delaware StreetDelaware Street Delaware Street Delaware Street
University AvenueUniversity Avenue
Hearst Avenue
University AvenueUniversity Avenue
Hearst Avenue Hearst Avenue Hearst Avenue Hearst Avenue
Addison Street
Addison Street
Addison Street
Addison Street
Addison Street
Addison Street
Allston Way Allston WayAllston Way Allston WayAllston Way Allston WayAllston Way
Berkeley Way
Cowper Street
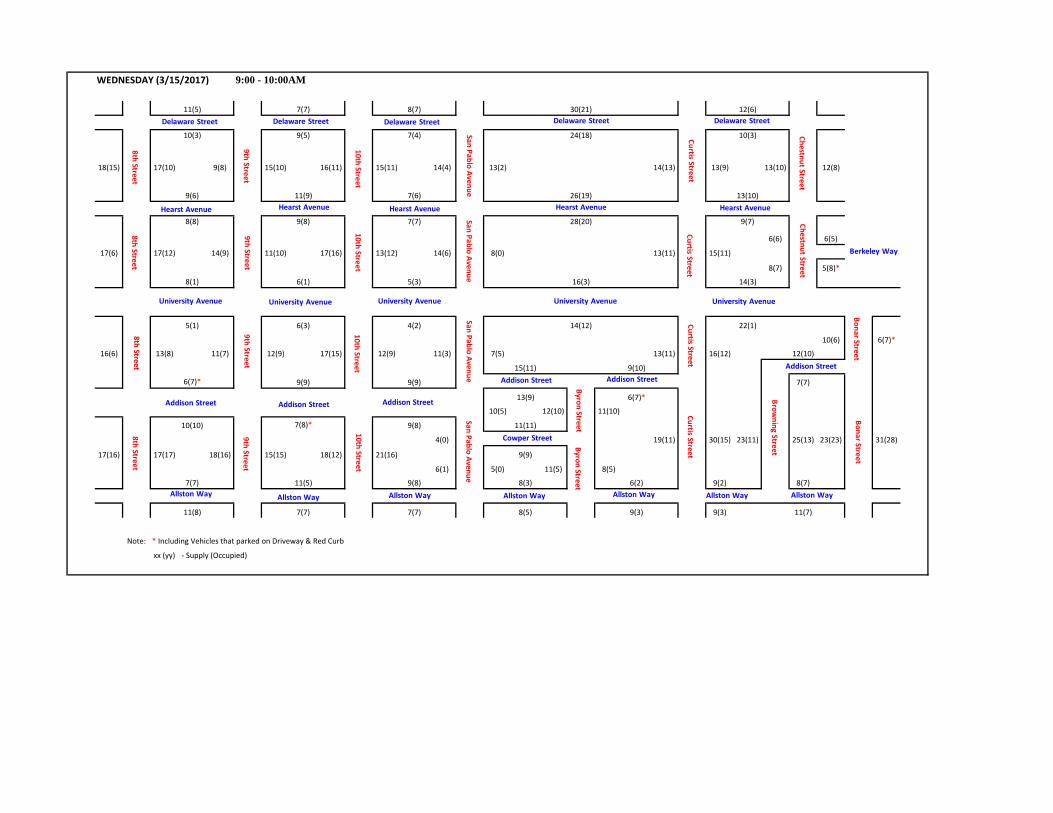
WEDNESDAY (3/15/2017) 9:00 - 10:00AM
11(5) 7(7) 8(7) 30(21) 12(6)
10(3) 9(5) 7(4) 24(18) 10(3)
18(15) 17(10) 9(8) 15(10) 16(11) 15(11) 14(4) 13(2) 14(13) 13(9) 13(10) 12(8)
9(6) 11(9) 7(6) 26(19) 13(10)
8(8) 9(8) 7(7) 28(20) 9(7)
6(6) 6(5)
17(6) 17(12) 14(9) 11(10) 17(16) 13(12) 14(6) 8(0) 13(11) 15(11)
8(7) 5(8)*
8(1) 6(1) 5(3) 16(3) 14(3)
5(1) 6(3) 4(2) 14(12) 22(1)
10(6) 6(7)*
16(6) 13(8) 11(7) 12(9) 17(15) 12(9) 11(3) 7(5) 13(11) 16(12) 12(10)
15(11) 9(10)
6(7)* 9(9) 9(9) 7(7)
13(9) 6(7)*
10(5) 12(10) 11(10)
10(10) 7(8)* 9(8) 11(11)
4(0) 19(11) 30(15) 23(11) 25(13) 23(23) 31(28)
17(16) 17(17) 18(16) 15(15) 18(12) 21(16) 9(9)
6(1) 5(0) 11(5) 8(5)
7(7) 11(5) 9(8) 8(3) 6(2) 9(2) 8(7)
11(8) 7(7) 7(7) 8(5) 9(3) 9(3) 11(7)
Note: * Including Vehicles that parked on Driveway & Red Curb
xx (yy) ‐ Supply (Occupied)
8thStreet
9thStreet
8thStreet
9thStreet
9thStreet
8thStreet
8thStreet
9thStreet
10thStreet
10thStreet
10thStreet
10thStreet
San Pablo AvenueSan Pablo Avenue
San Pablo AvenueSan Pablo Avenue
Curtis Street
Chestnut Street
Curtis StreetCurtis Street
Curtis Street
Chestnut Street
Bonar StreetBonar Street
Browning Street
Byron StreetByron Street
Delaware Street
University Avenue
Delaware StreetDelaware Street Delaware Street Delaware Street
University AvenueUniversity Avenue
Hearst Avenue
University AvenueUniversity Avenue
Hearst Avenue Hearst Avenue Hearst Avenue Hearst Avenue
Addison Street
Addison Street
Addison Street
Addison Street
Addison Street
Addison Street
Allston Way Allston WayAllston Way Allston WayAllston Way Allston WayAllston Way
Berkeley Way
Cowper Street

WEDNESDAY (3/15/2017) 12:00 - 1:00PM
11(3) 7(7) 8(7) 30(20) 12(7)
10(5) 9(8) 7(6) 24(19) 10(3)
18(14) 17(12) 9(7) 15(10) 16(12) 15(12) 14(4) 13(1) 14(9) 13(6) 13(11) 12(9)
9(5) 11(9) 7(8)* 26(17) 13(9)
8(7) 9(8) 7(7) 28(21) 9(8)
6(6) 6(5)
17(9) 17(15) 14(6) 11(7) 17(14) 13(12) 14(11) 8(1) 13(10) 15(7)
8(8) 5(8)*
8(2) 6(3) 5(3) 16(3) 14(4)
5(1) 6(3) 4(4) 14(11) 22(0)
10(9) 6(7)*
16(8) 13(7) 11(10) 12(10) 17(17) 12(13) 11(9) 7(6) 13(11) 16(11) 12(11)
15(12) 9(10)*
6(7)* 9(9) 9(9) 7(7)
13(6) 6(6)
10(2) 12(13)* 11(8)
10(9) 7(6) 9(9) 11(11)
4(2) 19(17) 30(18) 23(15) 25(17) 23(18) 31(28)
17(16) 17(16) 18(12) 15(12) 18(13) 21(16) 9(9)
6(1) 5(0) 11(9) 8(7)
7(6) 11(8) 9(8) 8(4) 6(2) 9(1) 8(8)
11(8) 7(4) 7(4) 8(7) 9(3) 9(2) 11(5)
Note: * Including Vehicles that parked on Driveway & Red Curb
xx (yy) ‐ Supply (Occupied)
8thStreet
9thStreet
8thStreet
9thStreet
9thStreet
8thStreet
8thStreet
9thStreet
10thStreet
10thStreet
10thStreet
10thStreet
San Pablo AvenueSan Pablo Avenue
San Pablo AvenueSan Pablo Avenue
Curtis Street
Chestnut Street
Curtis StreetCurtis Street
Curtis Street
Chestnut Street
Bonar StreetBonar Street
Browning Street
Byron StreetByron Street
Delaware Street
University Avenue
Delaware StreetDelaware Street Delaware Street Delaware Street
University AvenueUniversity Avenue
Hearst Avenue
University AvenueUniversity Avenue
Hearst Avenue Hearst Avenue Hearst Avenue Hearst Avenue
Addison Street
Addison Street
Addison Street
Addison Street
Addison Street
Addison Street
Allston Way Allston WayAllston Way Allston WayAllston Way Allston WayAllston Way
Berkeley Way
Cowper Street

WEDNESDAY (3/15/2017) 6:00 - 7:00PM
11(8) 7(7) 8(7) 30(23) 12(5)
10(6) 9(8) 7(7) 24(23) 10(4)
18(15) 17(12) 9(10)* 15(7) 16(12) 15(13) 14(9) 13(10) 14(11) 13(7) 13(10) 12(9)
9(5) 11(10) 7(9)* 26(24) 13(13)
8(4) 9(9) 7(6) 28(25) 9(9)
6(4) 6(6)
17(11) 17(16) 14(9) 11(7) 17(16) 13(12) 14(11) 8(8) 13(13) 15(12)
8(8) 5(8)*
8(2) 6(5) 5(4) 16(7) 14(5)
5(5) 6(5) 4(4) 14(11) 22(0)
10(0) 6(5)*
16(2) 13(7) 11(8) 12(11) 17(15) 12(10) 11(10) 7(6) 13(10) 16(13) 12(8)
15(14) 9(10)*
6(5) 9(9) 9(10)* 7(5)
13(11) 6(6)10(11)* 12(11) 11(9)
10(10) 7(6) 9(8) 11(7)
4(4) 19(13) 30(18) 23(11) 25(11) 23(13) 31(20)
17(14) 17(14) 18(16) 15(11) 18(9) 21(16) 9(9)
6(5) 5(3) 11(9) 8(8)
7(5) 11(8) 9(9) 8(3) 6(2) 9(0) 8(7)
11(1) 7(6) 7(6) 8(5) 9(4) 9(5) 11(7)
Note: * Including Vehicles that parked on Driveway & Red Curb
xx (yy) ‐ Supply (Occupied)
8thStreet
9thStreet
8thStreet
9thStreet
9thStreet
8thStreet
8thStreet
9thStreet
10thStreet
10thStreet
10thStreet
10thStreet
San Pablo AvenueSan Pablo Avenue
San Pablo AvenueSan Pablo Avenue
Curtis Street
Chestnut Street
Curtis StreetCurtis Street
Curtis Street
Chestnut Street
Bonar StreetBonar Street
Browning Street
Byron StreetByron Street
Delaware Street
University Avenue
Delaware StreetDelaware Street Delaware Street Delaware Street
University AvenueUniversity Avenue
Hearst Avenue
University AvenueUniversity Avenue
Hearst Avenue Hearst Avenue Hearst Avenue Hearst Avenue
Addison Street
Addison Street
Addison Street
Addison Street
Addison Street
Addison Street
Allston Way Allston WayAllston Way Allston WayAllston Way Allston WayAllston Way
Berkeley Way
Cowper Street

WEDNESDAY (3/15/2017) 9:00 - 10:00PM
11(7) 7(7) 8(9)* 30(26) 12(5)
10(5) 9(7) 7(7) 24(27)* 10(5)
18(16) 17(12) 9(8) 15(7) 16(13) 15(11) 14(13) 13(8) 14(15)* 13(16)* 13(11) 12(12)
9(6) 11(8) 7(7) 26(23) 13(16)*
8(6) 9(9) 7(5) 28(28) 9(10)*
6(5) 6(5)
17(10) 17(14) 14(8) 11(8) 17(14) 13(11) 14(12) 8(3) 13(14)* 15(14)
8(9)* 5(8)*
8(4) 6(5) 5(2) 16(2) 14(8)
5(2) 6(5) 4(1) 14(15)* 22(1)
10(0) 6(4)
16(2) 13(7) 11(8) 12(10) 17(9) 12(9) 11(12)* 7(7) 13(8) 16(11) 12(3)
15(10) 9(11)*
6(6) 9(8) 9(7) 7(3)
13(10) 6(7)*10(12)* 12(10) 11(7)
10(9) 7(8)* 9(10)* 11(10)
4(7)* 19(14) 30(16) 23(7) 25(10) 23(12) 31(16)
17(13) 17(15) 18(15) 15(13) 18(13) 21(15) 9(6)
6(7)* 5(5) 11(7) 8(7)
7(5) 11(8) 9(7) 8(2) 6(1) 9(1) 8(5)
11(4) 7(6) 7(6) 8(6) 9(4) 9(2) 11(4)
Note: * Including Vehicles that parked on Driveway & Red Curb
xx (yy) ‐ Supply (Occupied)
8thStreet
9thStreet
8thStreet
9thStreet
9thStreet
8thStreet
8thStreet
9thStreet
10thStreet
10thStreet
10thStreet
10thStreet
San Pablo AvenueSan Pablo Avenue
San Pablo AvenueSan Pablo Avenue
Curtis Street
Chestnut Street
Curtis StreetCurtis Street
Curtis Street
Chestnut Street
Bonar StreetBonar Street
Browning Street
Byron StreetByron Street
Delaware Street
University Avenue
Delaware StreetDelaware Street Delaware Street Delaware Street
University AvenueUniversity Avenue
Hearst Avenue
University AvenueUniversity Avenue
Hearst Avenue Hearst Avenue Hearst Avenue Hearst Avenue
Addison Street
Addison Street
Addison Street
Addison Street
Addison Street
Addison Street
Allston Way Allston WayAllston Way Allston WayAllston Way Allston WayAllston Way
Berkeley Way
Cowper Street

FRIDAY (3/10/2017) 6:00 - 7:00AM
11(8) 7(8)* 8(10)* 30(23) 12(8)
10(4) 9(6) 7(6) 24(24) 10(7)
18(18) 17(14) 9(11)* 15(6) 16(12) 15(12) 14(10) 13(0) 14(14) 13(11) 13(12) 12(12)
9(6) 11(6) 7(5) 26(26) 13(13)
8(7) 9(9) 7(4) 28(28) 9(9)
6(7)* 6(4)
17(13) 17(16) 14(7) 11(6) 17(11) 13(8) 14(9) 8(0) 13(12) 15(14)
8(7) 5(6)*
8(4) 6(0) 5(2) 16(7) 14(4)
5(1) 6(1) 4(1) 14(12) 22(3)
10(0) 6(5)
16(2) 13(3) 11(11) 12(10) 17(15) 12(1) 11(3) 7(7) 13(10) 16(13) 12(3)
15(14) 9(8)
6(5) 9(8) 9(7) 7(4)
13(5) 6(5)
10(1) 12(9) 11(9)
10(9) 7(6) 9(7) 11(6)
4(0) 19(16) 30(19) 23(2) 25(12) 23(15) 31(19)
17(13) 17(12) 18(13) 15(11) 18(11) 21(10) 9(5)
6(0) 5(0) 11(7) 8(3)
7(6) 11(6) 9(3) 8(0) 6(6) 9(3) 8(6)
11(6) 7(6) 7(5) 8(5) 9(4) 9(3) 11(7)
Note: * Including Vehicles that parked on Driveway & Red Curb
xx (yy) ‐ Supply (Occupied)
8thStreet
9thStreet
8thStreet
9thStreet
9thStreet
8thStreet
8thStreet
9thStreet
10thStreet
10thStreet
10thStreet
10thStreet
San Pablo AvenueSan Pablo Avenue
San Pablo AvenueSan Pablo Avenue
Curtis Street
Chestnut Street
Curtis StreetCurtis Street
Curtis Street
Chestnut Street
Bonar StreetBonar Street
Browning Street
Byron StreetByron Street
Delaware Street
University Avenue
Delaware StreetDelaware Street Delaware Street Delaware Street
University AvenueUniversity Avenue
Hearst Avenue
University AvenueUniversity Avenue
Hearst Avenue Hearst Avenue Hearst Avenue Hearst Avenue
Addison Street
Addison Street
Addison Street
Addison Street
Addison Street
Addison Street
Allston Way Allston WayAllston Way Allston WayAllston Way Allston WayAllston Way
Berkeley Way
Cowper Street

FRIDAY (3/10/2017) 9:00 - 10:00AM
11(6) 7(6) 8(8) 30(21) 12(10)
10(5) 9(6) 7(6) 24(22) 10(7)
18(13) 17(11) 9(8) 15(9) 16(10) 15(11) 14(4) 13(1) 14(8) 13(7) 13(10) 12(8)
9(6) 11(6) 7(8) 26(21) 13(10)
8(7) 9(8) 7(7) 28(24) 9(6)
6(5) 6(4)
17(9) 17(13) 14(6) 11(7) 17(14) 13(7) 14(6) 8(1) 13(12) 15(9)
8(7) 5(6)*
8(4) 6(1) 5(1) 16(2) 14(5)
5(0) 6(2) 4(1) 14(9) 22(5)
10(0) 6(5)
16(6) 13(6) 11(5) 12(9) 17(17) 12(9) 11(4) 7(7) 13(8) 16(13) 12(10)
15(10) 9(7)
6(5) 9(8) 9(9) 7(6)
13(8) 6(6)
10(1) 12(13)* 11(11)
10(9) 7(6) 9(8) 11(11)
4(2) 19(12) 30(16) 23(9) 25(13) 23(14) 31(17)
17(16) 17(16) 18(13) 15(15) 18(16) 21(18) 9(7)
6(4) 5(6)* 11(8) 8(7)
7(6) 11(6) 9(6) 8(4) 6(5) 9(1) 8(7)
11(8) 7(6) 7(7) 8(7) 9(3) 9(1) 11(6)
Note: * Including Vehicles that parked on Driveway & Red Curb
xx (yy) ‐ Supply (Occupied)
8thStreet
9thStreet
8thStreet
9thStreet
9thStreet
8thStreet
8thStreet
9thStreet
10thStreet
10thStreet
10thStreet
10thStreet
San Pablo AvenueSan Pablo Avenue
San Pablo AvenueSan Pablo Avenue
Curtis Street
Chestnut Street
Curtis StreetCurtis Street
Curtis Street
Chestnut Street
Bonar StreetBonar Street
Browning Street
Byron StreetByron Street
Delaware Street
University Avenue
Delaware StreetDelaware Street Delaware Street Delaware Street
University AvenueUniversity Avenue
Hearst Avenue
University AvenueUniversity Avenue
Hearst Avenue Hearst Avenue Hearst Avenue Hearst Avenue
Addison Street
Addison Street
Addison Street
Addison Street
Addison Street
Addison Street
Allston Way Allston WayAllston Way Allston WayAllston Way Allston WayAllston Way
Berkeley Way
Cowper Street

FRIDAY (3/10/2017) 12:00 - 1:00PM
11(2) 7(4) 8(10)* 30(21) 12(8)
10(5) 9(5) 7(6) 24(20) 10(7)
18(15) 17(14) 9(9) 15(10) 16(10) 15(12) 14(6) 13(6) 14(7) 13(9) 13(9) 12(11)
9(6) 11(6) 7(7) 26(19) 13(10)
8(6) 9(8) 7(6) 28(22) 9(8)
6(6) 6(6)
17(10) 17(16) 14(7) 11(10) 17(13) 13(10) 14(10) 8(6) 13(11) 15(11)
8(7) 5(7)*
8(1) 6(5) 5(4) 16(6) 14(3)
5(1) 6(2) 4(4) 14(10) 22(0)
10(0) 6(4)
16(7) 13(7) 11(6) 12(10) 17(15) 12(13)* 11(5) 7(9) 13(10) 16(13) 12(10)
15(14) 9(7)
6(6) 9(8) 9(8) 7(6)
13(12) 6(7)*
10(3) 12(11) 11(9)
10(8) 7(8)* 9(8) 11(11)
4(4) 19(12) 30(20) 23(8) 25(13) 23(14) 31(16)
17(14) 17(15) 18(13) 15(13) 18(16) 21(17) 9(8)
6(3) 5(0) 11(8) 8(6)
7(6) 11(7) 9(8) 8(4) 6(4) 9(4) 8(7)
11(7) 7(4) 7(8) 8(6) 9(3) 9(0) 11(6)
Note: * Including Vehicles that parked on Driveway & Red Curb
xx (yy) ‐ Supply (Occupied)
8thStreet
9thStreet
8thStreet
9thStreet
9thStreet
8thStreet
8thStreet
9thStreet
10thStreet
10thStreet
10thStreet
10thStreet
San Pablo AvenueSan Pablo Avenue
San Pablo AvenueSan Pablo Avenue
Curtis Street
Chestnut Street
Curtis StreetCurtis Street
Curtis Street
Chestnut Street
Bonar StreetBonar Street
Browning Street
Byron StreetByron Street
Delaware Street
University Avenue
Delaware StreetDelaware Street Delaware Street Delaware Street
University AvenueUniversity Avenue
Hearst Avenue
University AvenueUniversity Avenue
Hearst Avenue Hearst Avenue Hearst Avenue Hearst Avenue
Addison Street
Addison Street
Addison Street
Addison Street
Addison Street
Addison Street
Allston Way Allston WayAllston Way Allston WayAllston Way Allston WayAllston Way
Berkeley Way
Cowper Street

FRIDAY (3/10/2017) 6:00 - 7:00PM
11(7) 7(6) 8(10) 30(26) 12(8)
10(4) 9(5) 7(6) 24(25) 10(8)
18(13) 17(15) 9(7) 15(6) 16(13) 15(12) 14(9) 13(7) 14(11) 13(9) 13(13) 12(11)
9(8) 11(9) 7(8)* 26(24) 13(14)*
8(7) 9(10) 7(7) 28(25) 9(9)
6(8)* 6(8)*
17(14) 17(18) 14(7) 11(6) 17(15) 13(12) 14(10) 8(7) 13(11) 15(11)
8(8) 5(8)*
8(3) 6(5) 5(4) 16(5) 14(8)
5(3) 6(4) 4(4) 14(13) 22(1)
10(0) 6(5)*
16(4) 13(5) 11(10) 12(12) 17(17) 12(11) 11(7) 7(7) 13(11) 16(12) 12(2)
15(12) 9(8)
6(7)* 9(10)* 9(9) 7(2)
13(11) 6(7)*
10(6) 12(12) 11(10)
10(9) 7(9)* 9(8) 11(11)
4(4) 19(12) 30(20) 23(5) 25(11) 23(15) 31(18)
17(13) 17(9) 18(15) 15(16)* 18(13) 21(11) 9(8)
6(4) 5(4) 11(7) 8(5)
7(7) 11(7) 9(4) 8(0) 6(4) 9(3) 8(2)
11(4) 7(6) 7(5) 8(5) 9(5) 9(1) 11(4)
Note: * Including Vehicles that parked on Driveway & Red Curb
xx (yy) ‐ Supply (Occupied)
8thStreet
9thStreet
8thStreet
9thStreet
9thStreet
8thStreet
8thStreet
9thStreet
10thStreet
10thStreet
10thStreet
10thStreet
San Pablo AvenueSan Pablo Avenue
San Pablo AvenueSan Pablo Avenue
Curtis Street
Chestnut Street
Curtis StreetCurtis Street
Curtis Street
Chestnut Street
Bonar StreetBonar Street
Browning Street
Byron StreetByron Street
Delaware Street
University Avenue
Delaware StreetDelaware Street Delaware Street Delaware Street
University AvenueUniversity Avenue
Hearst Avenue
University AvenueUniversity Avenue
Hearst Avenue Hearst Avenue Hearst Avenue Hearst Avenue
Addison Street
Addison Street
Addison Street
Addison Street
Addison Street
Addison Street
Allston Way Allston WayAllston Way Allston WayAllston Way Allston WayAllston Way
Berkeley Way
Cowper Street

FRIDAY (3/10/2017) 9:00 - 10:00PM
11(7) 7(8) 8(10)* 30(26) 12(7)
10(4) 9(7) 7(7) 24(26)* 10(8)
18(16) 17(15) 9(8) 15(9) 16(13) 15(13) 14(11) 13(8) 14(13) 13(11) 13(12) 12(13)
9(7) 11(7) 7(8) 26(27)* 13(14)*
8(7) 9(8) 7(9) 28(26) 9(9)
6(6) 6(6)
17(13) 17(18) 14(10) 11(9) 17(18) 13(12) 14(6) 8(5) 13(15) 15(14)
8(7) 5(8)*
8(3) 6(1) 5(1) 16(6) 14(9)
5(2) 6(1) 4(2) 14(9) 22(3)
10(0) 6(5)
16(2) 13(6) 11(8) 12(10) 17(10) 12(10) 11(5) 7(7) 13(11) 16(12) 12(5)
15(11) 9(8)
6(6) 9(7) 9(6) 7(4)
13(5) 6(7)*
10(6) 12(10) 11(6)
10(9) 7(4) 9(6) 11(9)
4(3) 19(15) 30(20) 23(2) 25(9) 23(11) 31(10)
17(15) 17(12) 18(15) 15(13) 18(11) 21(13) 9(3)
6(1) 5(3) 11(7) 8(7)
7(6) 11(7) 9(4) 8(2) 6(3) 9(3) 8(5)
11(5) 7(8) 7(4) 8(6) 9(4) 9(1) 11(4)
Note: * Including Vehicles that parked on Driveway & Red Curb
xx (yy) ‐ Supply (Occupied)
8thStreet
9thStreet
8thStreet
9thStreet
9thStreet
8thStreet
8thStreet
9thStreet
10thStreet
10thStreet
10thStreet
10thStreet
San Pablo AvenueSan Pablo Avenue
San Pablo AvenueSan Pablo Avenue
Curtis Street
Chestnut Street
Curtis StreetCurtis Street
Curtis Street
Chestnut Street
Bonar StreetBonar Street
Browning Street
Byron StreetByron Street
Delaware Street
University Avenue
Delaware StreetDelaware Street Delaware Street Delaware Street
University AvenueUniversity Avenue
Hearst Avenue
University AvenueUniversity Avenue
Hearst Avenue Hearst Avenue Hearst Avenue Hearst Avenue
Addison Street
Addison Street
Addison Street
Addison Street
Addison Street
Addison Street
Allston Way Allston WayAllston Way Allston WayAllston Way Allston WayAllston Way
Berkeley Way
Cowper Street

SATURDAY (3/11/2017) 6:00 - 7:00AM
11(8) 7(7) 8(10)* 30(25) 12(11)
10(5) 9(8) 7(6) 24(23) 10(8)
18(17) 17(14) 9(9) 15(7) 16(15) 15(12) 14(2) 13(1) 14(15) 13(12) 13(12) 12(13)*
9(5) 11(7) 7(5) 26(27)* 13(14)*
8(7) 9(7) 7(7) 28(25) 9(10)
6(7)* 6(7)*
17(13) 17(7) 14(8) 11(7) 17(10) 13(11) 14(8) 8(0) 13(14) 15(14)
8(8) 5(6)*
8(2) 6(0) 5(0) 16(6) 14(5)
5(1) 6(2) 4(0) 14(9) 22(1)
10(0) 6(5)
16(4) 13(8) 11(9) 12(11) 17(10) 12(5) 11(0) 7(5) 13(11) 16(12) 12(3)
15(10) 9(9)
6(8)* 9(8) 9(8) 7(3)
13(5) 6(6)
10(1) 12(8) 11(8)
10(10) 7(6) 9(5) 11(5)
4(0) 19(16) 30(22) 23(2) 25(12) 23(13) 31(12)
17(15) 17(9) 18(13) 15(14) 18(141) 21(10) 9(3)
6(1) 5(0) 11(6) 8(4)
7(5) 11(8) 9(4) 8(1) 6(4) 9(4) 8(5)
11(7) 7(6) 7(3) 8(5) 9(5) 9(2) 11(4)
Note: * Including Vehicles that parked on Driveway & Red Curb
xx (yy) ‐ Supply (Occupied)
8thStreet
9thStreet
8thStreet
9thStreet
9thStreet
8thStreet
8thStreet
9thStreet
10thStreet
10thStreet
10thStreet
10thStreet
San Pablo AvenueSan Pablo Avenue
San Pablo AvenueSan Pablo Avenue
Curtis Street
Chestnut Street
Curtis StreetCurtis Street
Curtis Street
Chestnut Street
Bonar StreetBonar Street
Browning Street
Byron StreetByron Street
Delaware Street
University Avenue
Delaware StreetDelaware Street Delaware Street Delaware Street
University AvenueUniversity Avenue
Hearst Avenue
University AvenueUniversity Avenue
Hearst Avenue Hearst Avenue Hearst Avenue Hearst Avenue
Addison Street
Addison Street
Addison Street
Addison Street
Addison Street
Addison Street
Allston Way Allston WayAllston Way Allston WayAllston Way Allston WayAllston Way
Berkeley Way
Cowper Street

SATURDAY (3/11/2017) 9:00 - 10:00AM
11(7) 7(7) 8(7) 30(24) 12(12)
10(7) 9(9) 7(4) 24(26) 10(10)
18(14) 17(13) 9(10) 15(12) 16(14) 15(12) 14(4) 13(5) 14(13) 13(12) 13(13) 12(12)
9(6) 11(8) 7(8) 26(26) 13(15)
8(8) 9(9) 7(9)* 28(26) 9(9)
6(8) 6(7)
17(9) 17(15) 14(4) 11(10) 17(12) 13(12) 14(7) 8(0) 13(12) 15(15)
8(7) 5(7)*
8(1) 6(2) 5(4) 16(3) 14(4)
5(1) 6(5) 4(0) 14(10) 22(0)
10(0) 6(4)
16(3) 13(8) 11(8) 12(13)* 17(13) 12(7) 11(4) 7(5) 13(10) 16(12) 12(9)
15(13) 9(9)
6(7) 9(7) 9(7) 7(7)
13(9) 6(7)*
10(4) 12(10) 11(8)
10(8) 7(7) 9(8) 11(11)
4(0) 19(17) 30(19) 23(1) 25(10) 23(19) 31(27)
17(14) 17(8) 18(11) 15(13) 18(11) 21(12) 9(7)
6(0) 5(1)* 11(5) 8(6)
7(5) 11(5) 9(6) 8(2) 6(4) 9(3) 8(6)
11(6) 7(5) 7(7) 8(6) 9(4) 9(2) 11(5)
Note: * Including Vehicles that parked on Driveway & Red Curb
xx (yy) ‐ Supply (Occupied)
8thStreet
9thStreet
8thStreet
9thStreet
9thStreet
8thStreet
8thStreet
9thStreet
10thStreet
10thStreet
10thStreet
10thStreet
San Pablo AvenueSan Pablo Avenue
San Pablo AvenueSan Pablo Avenue
Curtis Street
Chestnut Street
Curtis StreetCurtis Street
Curtis Street
Chestnut Street
Bonar StreetBonar Street
Browning Street
Byron StreetByron Street
Delaware Street
University Avenue
Delaware StreetDelaware Street Delaware Street Delaware Street
University AvenueUniversity Avenue
Hearst Avenue
University AvenueUniversity Avenue
Hearst Avenue Hearst Avenue Hearst Avenue Hearst Avenue
Addison Street
Addison Street
Addison Street
Addison Street
Addison Street
Addison Street
Allston Way Allston WayAllston Way Allston WayAllston Way Allston WayAllston Way
Berkeley Way
Cowper Street

SATURDAY (3/11/2017) 12:00 - 1:00PM
11(5) 7(7) 8(9)* 30(24) 12(8)
10(5) 9(9) 7(7) 24(24) 10(10)
18(15) 17(10) 9(9) 15(6) 16(17) 15(13) 14(7) 13(8) 14(13) 13(10) 13(13) 12(10)
9(4) 11(8) 7(9) 26(27)* 13(11)
8(7) 9(9) 7(8) 28(28) 9(10)*
6(5) 6(7)*
17(13) 17(15) 14(8) 11(8) 17(16) 13(11) 14(9) 8(7) 13(13) 15(12)
8(8) 5(8)*
8(3) 6(3) 5(1) 16(5) 14(6)
5(2) 6(5) 4(4) 14(7) 22(2)
10(3) 6(3)
16(3) 13(6) 11(11) 12(12) 17(13) 12(9) 11(5) 7(8) 13(11) 16(12) 12(9)
15(12) 9(6)
6(6) 9(7) 9(7) 7(2)
13(8) 6(5)
10(4) 12(11) 11(10)
10(6) 7(7) 9(7) 11(10)
4(3) 19(20)* 30(21) 23(4) 25(13) 23(13) 31(13)
17(11) 17(10) 18(13) 15(11) 18(10) 21(10) 9(8)
6(2) 5(4) 11(7) 8(6)
7(2) 11(8) 9(7) 8(4) 6(5) 9(2) 8(7)
11(6) 7(3) 7(7) 8(5) 9(4) 9(4) 11(7)
Note: * Including Vehicles that parked on Driveway & Red Curb
xx (yy) ‐ Supply (Occupied)
8thStreet
9thStreet
8thStreet
9thStreet
9thStreet
8thStreet
8thStreet
9thStreet
10thStreet
10thStreet
10thStreet
10thStreet
San Pablo AvenueSan Pablo Avenue
San Pablo AvenueSan Pablo Avenue
Curtis Street
Chestnut Street
Curtis StreetCurtis Street
Curtis Street
Chestnut Street
Bonar StreetBonar Street
Browning Street
Byron StreetByron Street
Delaware Street
University Avenue
Delaware StreetDelaware Street Delaware Street Delaware Street
University AvenueUniversity Avenue
Hearst Avenue
University AvenueUniversity Avenue
Hearst Avenue Hearst Avenue Hearst Avenue Hearst Avenue
Addison Street
Addison Street
Addison Street
Addison Street
Addison Street
Addison Street
Allston Way Allston WayAllston Way Allston WayAllston Way Allston WayAllston Way
Berkeley Way
Cowper Street
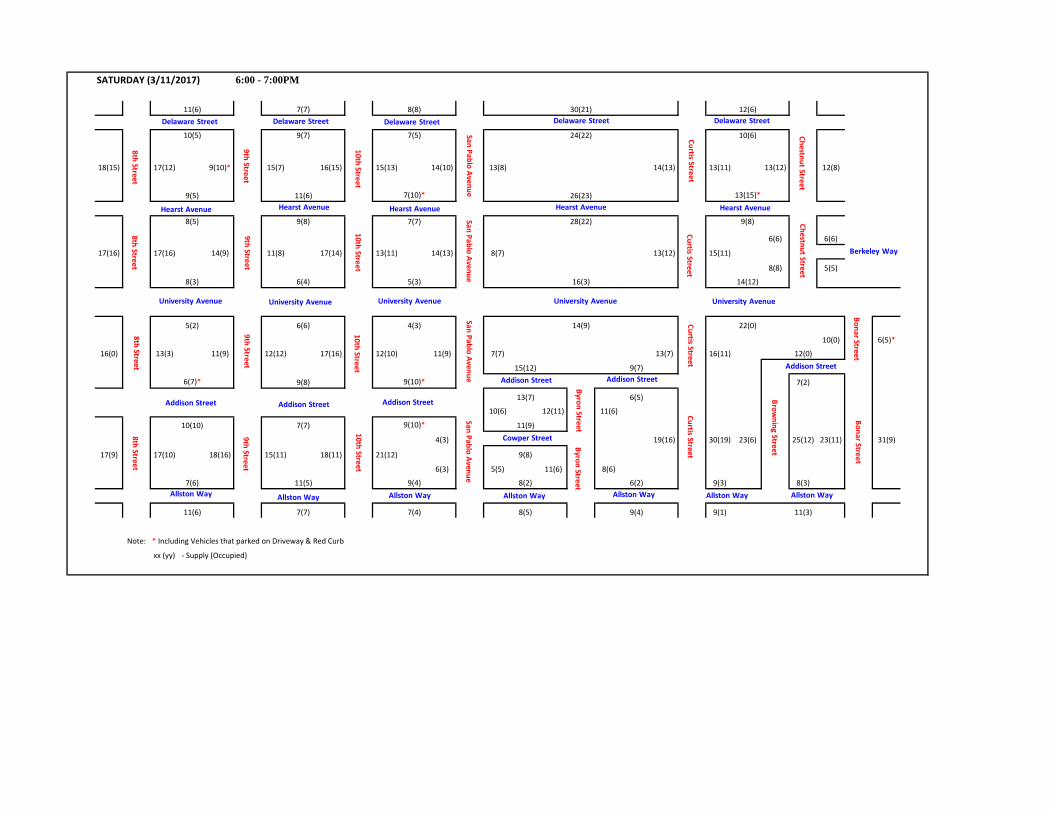
SATURDAY (3/11/2017) 6:00 - 7:00PM
11(6) 7(7) 8(8) 30(21) 12(6)
10(5) 9(7) 7(5) 24(22) 10(6)
18(15) 17(12) 9(10)* 15(7) 16(15) 15(13) 14(10) 13(8) 14(13) 13(11) 13(12) 12(8)
9(5) 11(6) 7(10)* 26(23) 13(15)*
8(5) 9(8) 7(7) 28(22) 9(8)
6(6) 6(6)
17(16) 17(16) 14(9) 11(8) 17(14) 13(11) 14(13) 8(7) 13(12) 15(11)
8(8) 5(5)
8(3) 6(4) 5(3) 16(3) 14(12)
5(2) 6(6) 4(3) 14(9) 22(0)
10(0) 6(5)*
16(0) 13(3) 11(9) 12(12) 17(16) 12(10) 11(9) 7(7) 13(7) 16(11) 12(0)
15(12) 9(7)
6(7)* 9(8) 9(10)* 7(2)
13(7) 6(5)
10(6) 12(11) 11(6)
10(10) 7(7) 9(10)* 11(9)
4(3) 19(16) 30(19) 23(6) 25(12) 23(11) 31(9)
17(9) 17(10) 18(16) 15(11) 18(11) 21(12) 9(8)
6(3) 5(5) 11(6) 8(6)
7(6) 11(5) 9(4) 8(2) 6(2) 9(3) 8(3)
11(6) 7(7) 7(4) 8(5) 9(4) 9(1) 11(3)
Note: * Including Vehicles that parked on Driveway & Red Curb
xx (yy) ‐ Supply (Occupied)
8thStreet
9thStreet
8thStreet
9thStreet
9thStreet
8thStreet
8thStreet
9thStreet
10thStreet
10thStreet
10thStreet
10thStreet
San Pablo AvenueSan Pablo Avenue
San Pablo AvenueSan Pablo Avenue
Curtis Street
Chestnut Street
Curtis StreetCurtis Street
Curtis Street
Chestnut Street
Bonar StreetBonar Street
Browning Street
Byron StreetByron Street
Delaware Street
University Avenue
Delaware StreetDelaware Street Delaware Street Delaware Street
University AvenueUniversity Avenue
Hearst Avenue
University AvenueUniversity Avenue
Hearst Avenue Hearst Avenue Hearst Avenue Hearst Avenue
Addison Street
Addison Street
Addison Street
Addison Street
Addison Street
Addison Street
Allston Way Allston WayAllston Way Allston WayAllston Way Allston WayAllston Way
Berkeley Way
Cowper Street

SATURDAY (3/11/2017) 9:00 - 10:00PM
11(7) 7(6) 8(9)* 30(28) 12(9)
10(2) 9(7) 7(8)* 24(32)* 10(7)
18(16) 17(13) 9(8) 15(5) 16(13) 15(11) 14(16)* 13(13) 14(13) 13(12) 13(12) 12(13)
9(5) 11(5) 7(10)* 26(28)* 13(16)*
8(5) 9(5) 7(6) 28(29)* 9(10)*
6(6) 6(7)*
17(15) 17(18) 14(9) 11(7) 17(15) 13(8) 14(11) 8(7) 13(12) 15(15)
8(8) 5(8)*
8(3) 6(1) 5(3) 16(7) 14(14)
5(3) 6(1) 4(3) 14(3) 22(4)
10(0) 6(4)
16(2) 13(3) 11(7) 12(10) 17(12) 12(7) 11(6) 7(5) 13(9) 16(12) 12(1)
15(13) 9(7)
6(7) 9(7) 9(5) 7(3)
13(4) 6(2)
10(7) 12(11) 11(4)
10(7) 7(8)* 9(7) 11(6)
4(4) 19(13) 30(18) 23(5) 25(11) 23(12) 31(12)
17(11) 17(11) 18(14) 15(15) 18(12) 21(12) 9(4)
6(1) 5(2) 11(9) 8(7)
7(5) 11(5) 9(2) 8(1) 6(2) 9(3) 8(4)
11(7) 7(6) 7(4) 8(4) 9(5) 9(1) 11(3
Note: * Including Vehicles that parked on Driveway & Red Curb
xx (yy) ‐ Supply (Occupied)
8thStreet
9thStreet
8thStreet
9thStreet
9thStreet
8thStreet
8thStreet
9thStreet
10thStreet
10thStreet
10thStreet
10thStreet
San Pablo AvenueSan Pablo Avenue
San Pablo AvenueSan Pablo Avenue
Curtis Street
Chestnut Street
Curtis StreetCurtis Street
Curtis Street
Chestnut Street
Bonar StreetBonar Street
Browning Street
Byron StreetByron Street
Delaware Street
University Avenue
Delaware StreetDelaware Street Delaware Street Delaware Street
University AvenueUniversity Avenue
Hearst Avenue
University AvenueUniversity Avenue
Hearst Avenue Hearst Avenue Hearst Avenue Hearst Avenue
Addison Street
Addison Street
Addison Street
Addison Street
Addison Street
Addison Street
Allston Way Allston WayAllston Way Allston WayAllston Way Allston WayAllston Way
Berkeley Way
Cowper Street

SUNDAY (3/12/2017) 6:00 - 7:00AM
11(7) 7(7) 8(9)* 30(23) 12(8)
10(4) 9(7) 7(6) 24(23) 10(8)
18(16) 17(14) 9(12)* 15(6) 16(13) 15(12) 14(0) 13(3) 14(13) 13(12) 13(11) 12(113)
9(7) 11(5) 7(5) 26(25) 13(14)*
8(5) 9(8) 7(4) 28(25) 9(7)
6(4) 6(6)
17(15) 17(16) 14(8) 11(8) 17(11) 13(7) 14(6) 8(1) 13(14)* 15(14)
8(9)* 5(7)*
8(5) 6(0) 5(0) 16(4) 14(5)
5(0) 6(0) 4(2) 14(14) 22(0)
10(0) 6(5)
16(2) 13(4) 11(10) 12(13)* 17(9) 12(6) 11(2) 7(1) 13(10) 16(12) 12(1)
15(9) 9(10)*
6(8)* 9(6) 9(7) 7(3)
13(2) 6(6)
10(2) 12(11) 11(5)
10(9) 7(7) 9(2) 11(10)
4(0) 19(13) 30(18) 23(5) 25(12) 23(14) 31(12)
17(11) 17(12) 18(12) 15(14) 18(13) 21(15) 9(9)
6(1) 5(0) 11(9) 8(5)
7(6) 11(7) 9(4) 8(1) 6(5) 9(3) 8(4)
11(6) 7(7) 7(5) 8(5) 9(6) 9(1) 11(6)
Note: * Including Vehicles that parked on Driveway & Red Curb
xx (yy) ‐ Supply (Occupied)
San Pablo AvenueSan Pablo Avenue
San Pablo AvenueSan Pablo Avenue
10thStreet
10thStreet
10thStreet
10thStreet
9thStreet
9thStreet
9thStreet
9thStreet
8thStreet
8thStreet
8thStreet
8thStreet
Curtis StreetCurtis Street
Curtis StreetCurtis Street
Chestnut StreetChestnut Street
Bonar StreetBonar Street
Browning Street
Byron StreetByron Street
Delaware StreetDelaware Street Delaware StreetDelaware StreetDelaware Street
University AvenueUniversity AvenueUniversity AvenueUniversity Avenue University Avenue
Hearst AvenueHearst Avenue Hearst AvenueHearst Avenue Hearst Avenue
Addison Street
Addison Street
Addison Street
Addison Street
Addison Street
Addison Street
Allston Way Allston Way Allston WayAllston Way Allston WayAllston Way
Berkeley Way
Allston Way
Cowper Street
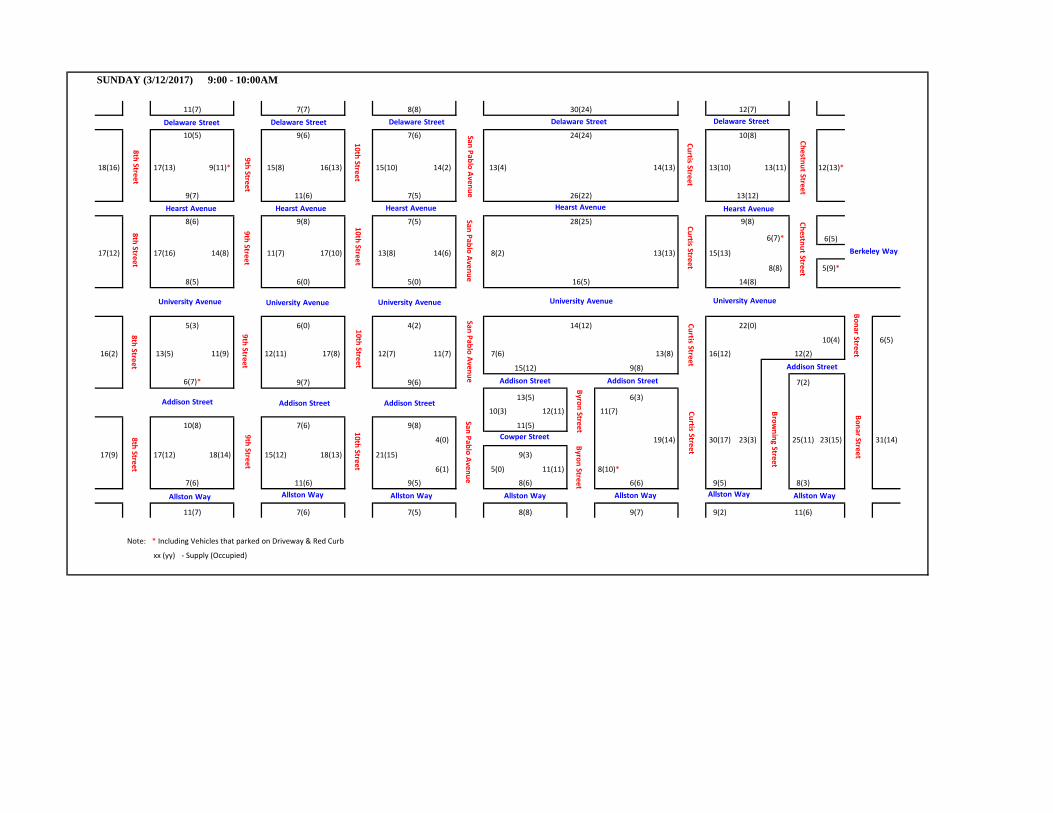
SUNDAY (3/12/2017) 9:00 - 10:00AM
11(7) 7(7) 8(8) 30(24) 12(7)
10(5) 9(6) 7(6) 24(24) 10(8)
18(16) 17(13) 9(11)* 15(8) 16(13) 15(10) 14(2) 13(4) 14(13) 13(10) 13(11) 12(13)*
9(7) 11(6) 7(5) 26(22) 13(12)
8(6) 9(8) 7(5) 28(25) 9(8)
6(7)* 6(5)
17(12) 17(16) 14(8) 11(7) 17(10) 13(8) 14(6) 8(2) 13(13) 15(13)
8(8) 5(9)*
8(5) 6(0) 5(0) 16(5) 14(8)
5(3) 6(0) 4(2) 14(12) 22(0)
10(4) 6(5)
16(2) 13(5) 11(9) 12(11) 17(8) 12(7) 11(7) 7(6) 13(8) 16(12) 12(2)
15(12) 9(8)
6(7)* 9(7) 9(6) 7(2)
13(5) 6(3)
10(3) 12(11) 11(7)
10(8) 7(6) 9(8) 11(5)
4(0) 19(14) 30(17) 23(3) 25(11) 23(15) 31(14)
17(9) 17(12) 18(14) 15(12) 18(13) 21(15) 9(3)
6(1) 5(0) 11(11) 8(10)*
7(6) 11(6) 9(5) 8(6) 6(6) 9(5) 8(3)
11(7) 7(6) 7(5) 8(8) 9(7) 9(2) 11(6)
Note: * Including Vehicles that parked on Driveway & Red Curb
xx (yy) ‐ Supply (Occupied)
San Pablo AvenueSan Pablo Avenue
San Pablo AvenueSan Pablo Avenue
10thStreet
10thStreet
10thStreet
10thStreet
9thStreet
9thStreet
9thStreet
9thStreet
8thStreet
8thStreet
8thStreet
8thStreet
Curtis StreetCurtis Street
Curtis StreetCurtis Street
Chestnut StreetChestnut Street
Bonar StreetBonar Street
Browning Street
Byron StreetByron Street
Delaware StreetDelaware Street Delaware StreetDelaware StreetDelaware Street
University AvenueUniversity AvenueUniversity AvenueUniversity Avenue University Avenue
Hearst AvenueHearst Avenue Hearst AvenueHearst Avenue Hearst Avenue
Addison Street
Addison Street
Addison Street
Addison Street
Addison Street
Addison Street
Allston Way Allston Way Allston WayAllston Way Allston WayAllston Way
Berkeley Way
Allston Way
Cowper Street

SUNDAY (3/12/2017) 12:00 - 1:00PM
11(6) 7(7) 8(8) 30(22) 12(9)
10(5) 9(5) 7(6) 24(27)* 10(6)
18(10) 17(14) 9(10)* 15(8) 16(15) 15(12) 14(10) 13(10) 14(14) 13(6) 13(11) 12(10)
9(5) 11(7) 7(9)* 26(25) 13(14)*
8(5) 9(9)* 7(6) 28(28) 9(8)
6(5) 6(5)
17(14) 17(17) 14(6) 11(12)* 17(13) 13(11) 14(10) 8(7) 13(14)* 15(12)
8(6) 5(6)*
8(5) 6(5) 5(5) 16(6) 14(10)
5(3) 6(6) 4(4) 14(13) 22(10)
10(9) 6(6)
16(3) 13(4) 11(12)* 12(14)* 17(10) 12(10) 11(9) 7(7) 13(10) 16(10) 12(8)
15(10) 9(11)*
6(7)* 9(6) 9(9) 7(6)
13(10) 6(7)*
10(6) 12(12) 11(10)
10(8) 7(6) 9(10)* 11(10)
4(3) 19(18) 30(23) 23(5) 25(11) 23(15) 31(16)
17(11) 17(12) 18(12) 15(12) 18(9) 21(12) 9(9)
6(5) 5(5) 11(13)* 8(10)*
7(7) 11(9) 9(3) 8(7) 6(8)* 9(9) 8(7)
11(8) 7(5) 7(5) 8(7) 9(7) 9(6) 11(5)
Note: * Including Vehicles that parked on Driveway & Red Curb
xx (yy) ‐ Supply (Occupied)
San Pablo AvenueSan Pablo Avenue
San Pablo AvenueSan Pablo Avenue
10thStreet
10thStreet
10thStreet
10thStreet
9thStreet
9thStreet
9thStreet
9thStreet
8thStreet
8thStreet
8thStreet
8thStreet
Curtis StreetCurtis Street
Curtis StreetCurtis Street
Chestnut StreetChestnut Street
Bonar StreetBonar Street
Browning Street
Byron StreetByron Street
Delaware StreetDelaware Street Delaware StreetDelaware StreetDelaware Street
University AvenueUniversity AvenueUniversity AvenueUniversity Avenue University Avenue
Hearst AvenueHearst Avenue Hearst AvenueHearst Avenue Hearst Avenue
Addison Street
Addison Street
Addison Street
Addison Street
Addison Street
Addison Street
Allston Way Allston Way Allston WayAllston Way Allston WayAllston Way
Berkeley Way
Allston Way
Cowper Street

SUNDAY (3/12/2017) 6:00 - 7:00PM
11(6) 7(6) 8(10)* 30(25) 12(6)
10(3) 9(7) 7(8)* 24(26)* 10(4)
18(13) 17(10) 9(10) 15(10) 16(11) 15(10) 14(10) 13(5) 14(11) 13(12) 13(10) 12(12)
9(6) 11(4) 7(7) 26(23) 13(11)
8(4) 9(8) 7(5) 28(27) 9(8)
6(7)* 6(8)*
17(15) 17(16) 14(8) 11(7) 17(13) 13(8) 14(12) 8(6) 13(14)* 15(13)
8(8) 5(7)*
8(6) 6(3) 5(3) 16(4) 14(10)
5(4) 6(5) 4(3) 14(15)* 22(11)
10(2) 6(4)*
16(13) 13(12) 11(7) 12(10) 17(15) 12(11) 11(9) 7(8)* 13(9) 16(10) 12(6)
15(15) 9(7)
6(6) 9(7) 9(7) 7(5)
13(9) 6(4)
10(8) 12(10) 11(7)
10(7) 7(7) 9(8) 11(6)
4(3) 19(11) 30(18) 23(2) 25(13) 23(13) 31(13)
17(11) 17(15) 18(15) 15(9) 18(10) 21(11) 9(3)
6(3) 5(3) 11(9) 8(5)
7(4) 11(6) 9(1) 8(3) 6(0) 9(2) 8(4)
11(6) 7(6) 7(4) 8(78) 9(5) 9(1) 11(5)
Note: * Including Vehicles that parked on Driveway & Red Curb
xx (yy) ‐ Supply (Occupied)
San Pablo AvenueSan Pablo Avenue
San Pablo AvenueSan Pablo Avenue
10thStreet
10thStreet
10thStreet
10thStreet
9thStreet
9thStreet
9thStreet
9thStreet
8thStreet
8thStreet
8thStreet
8thStreet
Curtis StreetCurtis Street
Curtis StreetCurtis Street
Chestnut StreetChestnut Street
Bonar StreetBonar Street
Browning Street
Byron StreetByron Street
Delaware StreetDelaware Street Delaware StreetDelaware StreetDelaware Street
University AvenueUniversity AvenueUniversity AvenueUniversity Avenue University Avenue
Hearst AvenueHearst Avenue Hearst AvenueHearst Avenue Hearst Avenue
Addison Street
Addison Street
Addison Street
Addison Street
Addison Street
Addison Street
Allston Way Allston Way Allston WayAllston Way Allston WayAllston Way
Berkeley Way
Allston Way
Cowper Street

SUNDAY (3/12/2017) 9:00 - 10:00PM
11(6) 7(6) 8(10)* 30(26) 12(10)
10(4) 9(7) 7(7) 24(30)* 10(7)
18(16) 17(16) 9(7) 15(7) 16(11) 15(9) 14(15)* 13(12) 14(914) 13(12) 13(12) 12(11)
9(7) 11(5) 7(10)* 26(27)* 13(13)
8(6) 9(8) 7(7) 28(27) 9(9)
6(7)* 6(5)
17(17) 17(15) 14(8) 1141)* 17(12) 13(10) 14(8) 8(8) 13(14)* 15(15)
8(8) 5(8)*
8(6) 6(0) 5(15) 16(7) 14(4)
5(0) 6(4) 4(3) 14(13) 22(7)
10(3) 6(7)*
16(4) 13(7) 11(8) 12(11) 17(11) 12(9) 11(9) 7(6) 13(7) 16(12) 12(2)
15(12) 9(8)
6(6) 9(9) 9(6) 7(5)
13(3) 6(5)
10(6) 12(12) 11(7)
10(8) 7(7) 9(1) 11(7)
4(2) 19(7) 30(18) 23(2) 25(10) 23(13) 31(18)
17(5) 17(18)* 18(16) 15(9) 18(12) 21(13) 9(5)
6(1) 5(45) 11(7) 8(5)
7(5) 11(6) 9(4) 8(0) 6(1) 9(2) 8(5)
11(7) 7(8)* 7(6) 8(68) 9(4) 9(3) 11(7)
Note: * Including Vehicles that parked on Driveway & Red Curb
xx (yy) ‐ Supply (Occupied)
San Pablo AvenueSan Pablo Avenue
San Pablo AvenueSan Pablo Avenue
10thStreet
10thStreet
10thStreet
10thStreet
9thStreet
9thStreet
9thStreet
9thStreet
8thStreet
8thStreet
8thStreet
8thStreet
Curtis StreetCurtis Street
Curtis StreetCurtis Street
Chestnut StreetChestnut Street
Bonar StreetBonar Street
Browning Street
Byron StreetByron Street
Delaware StreetDelaware Street Delaware StreetDelaware StreetDelaware Street
University AvenueUniversity AvenueUniversity AvenueUniversity Avenue University Avenue
Hearst AvenueHearst Avenue Hearst AvenueHearst Avenue Hearst Avenue
Addison Street
Addison Street
Addison Street
Addison Street
Addison Street
Addison Street
Allston Way Allston Way Allston WayAllston Way Allston WayAllston Way
Berkeley Way
Allston Way
Cowper Street