appendix a - illinois environmental protection agency · appendix a table description page ... udh...
TRANSCRIPT
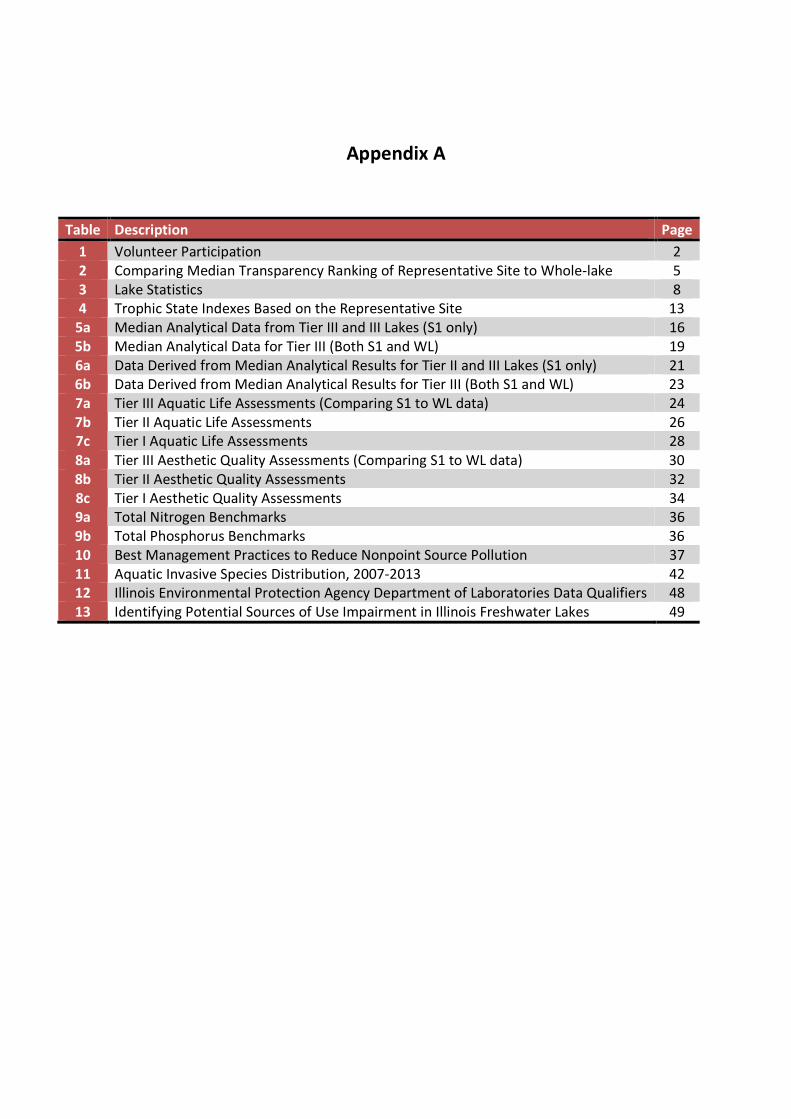
Appendix A
Table Description Page
1 Volunteer Participation 22 Comparing Median Transparency Ranking of Representative Site to Whole-lake 53 Lake Statistics 84 Trophic State Indexes Based on the Representative Site 13
5a Median Analytical Data from Tier III and III Lakes (S1 only) 165b Median Analytical Data for Tier III (Both S1 and WL) 196a Data Derived from Median Analytical Results for Tier II and III Lakes (S1 only) 216b Data Derived from Median Analytical Results for Tier III (Both S1 and WL) 237a Tier III Aquatic Life Assessments (Comparing S1 to WL data) 247b Tier II Aquatic Life Assessments 267c Tier I Aquatic Life Assessments 288a Tier III Aesthetic Quality Assessments (Comparing S1 to WL data) 308b Tier II Aesthetic Quality Assessments 328c Tier I Aesthetic Quality Assessments 349a Total Nitrogen Benchmarks 369b Total Phosphorus Benchmarks 3610 Best Management Practices to Reduce Nonpoint Source Pollution 3711 Aquatic Invasive Species Distribution, 2007-2013 4212 Illinois Environmental Protection Agency Department of Laboratories Data Qualifiers 4813 Identifying Potential Sources of Use Impairment in Illinois Freshwater Lakes 49

Appendix A: Table 1Page 2
Volunteer Participation 2013 VLMP Report
Lake
CodeLake/County
Oversite
Region
Sample
Events
Volunteer
Hours
RCJ Altamont New/Effingham IEPA 12 44
RTT Antioch/Lake LCHD 11 16.5
RMJ Apple Canyon/Jo Daviess IEPA 10 64
RTG Bangs/Lake LCHD 9 17
RTZT Barrington/Lake LCHD 12 23
RPJ Bass/Lee IEPA 11 14.5
RDW Beaver/Grundy IEPA 9 18
REZG Bertinetti/Christian IEPA 12 42
SEB Bird's Pond/Sangamon IEPA 10 23.5
RPK Black Oak/Lee IEPA 11 8
RDO Bloomgington/McLean IEPA 12 43
RCB Borah/Richland IEPA 2 2
SGC Buffalo Creek/Lake LCHD 10 62
STJ Campton/Kane CMAP 2 4
RNZH Campus/Jackson GERPDC 11 24
RPV Candlewick/Boone IEPA 9 48.5
RDD Canton/Fulton IEPA 3 28
RNI Carbondale/Jackson GERPDC 11 24
RTD Catherine/Lake LCHD 2 4
RNE Cedar/Jackson GERPDC 12 95
RTI Channel/Lake LCHD 2 6
RGR Charles/DuPage CMAP 10 42.25
RBC Charleston SCR/Coles IEPA 11 73
VTZ Charlotte/Kane CMAP 8 18
SNA Chautauqua/Jackson GERPDC 10 10
WDK Civic/Grundy IEPA 10 57
RGQ Countryside/Lake LCHD 9 27.5
RGZA Crooked/Lake LCHD 2 2
VTZH Crystal/McHenry CMAP 4 13
REE Dawson/McLean IEPA 11 25.5
REA Decatur/Macon IEPA 5 18
WGZK Deep Quarry/DuPage CMAP 11 32
VTD Deep/Lake LCHD 10 36
RNJ Devil's Kitchen/Williamson GERPDC 9 36
RGB Diamond/Lake LCHD 6 13
RGV Druce/Lake LCHD 10 25.5
RTZG Duck/Lake LCHD 7 27
RTM East Loon/Lake LCHD 4 15
SDS Eureka/Woodford IEPA 2 2
SDA Evergreen/McLean IEPA 11 40
VTT Fischer/Lake LCHD 12 62
RMF Fish Trap/Jo Daviess IEPA 3 12
RGZG Forest/Lake LCHD 11 24
RGZC Fourth/Lake LCHD 11 35
RLH Fyre/Mercer IEPA 7 7
RGI Gages/Lake LCHD 10 21

Appendix A: Table 1Page 3
Volunteer Participation 2013 VLMP Report
Lake
CodeLake/County
Oversite
Region
Sample
Events
Volunteer
Hours
RMM Galena/Jo Daviess IEPA 12 69.5
RJZK Gamlin/St. Clair IEPA 5 5
RTZS Goose/McHenry CMAP 8 30
ROP Governor Bond/Bond IEPA 4 11
RTQ Grass/Lake LCHD 4 8
RGK Grays/Lake LCHD 6 9
RAI Harrisburg/Williamson GERPDC 1 1
RNZC Herrin New/Williamson GERPDC 7 16
RNZD Herrin Old/Williamson GERPDC 5 33
ROZA Highland Silver/Madison IEPA 5 16.5
RBO Homer/Champaign IEPA 10 21.5
RTZU Honey/Lake LCHD 8 26
WGZY Indian/Cook CMAP 11 28
RTZI Island/Lake LCHD 1 5
RDI Jacksonville/Morgan IEPA 11 25.5
RNU Jaycee/Jefferson GERPDC 7 7.5
RTZV Joliet Jr College/Will CMAP 3 4.5
RTZV Killarney/McHenry CMAP 11 52
RNC Kincaid/Jackson GERPDC 12 24
STM La Fox Pond/Kane CMAP 12 36
RAL Lake of Egypt/Williamson GERPDC 12 86
UTZ Lake of the Hollows/ CMAP 1 1.5
REG Lake of the Woods/Champaign IEPA 11 25
STG Leisure/Lake LCHD 4 6
VGI Leopold/Lake LCHD 11 14.5
UDC Lincoln/Grundy IEPA 9 17
RGC Linden/Lake LCHD 5 4.75
STC Little Silver/Lake LCHD 12 12
RGU Loch Lomond/Lake LCHD 10 50
RTJ Long/Lake LCHD 10 21
RHZK Longmeadow/Cook CMAP 9 38
VTZJ Louise/Lake LCHD 4 5
WGZZ Loveless/DuPage CMAP 4 4
RCF Mattoon/Shelby IEPA 5 40
SDL Mauvaiseterre/Morgan IEPA 11 20.5
RAZA McLeansboro New/Hamilton GERPDC 2 2
RNZI Miller/Jefferson GERPDC 11 107
RGZD Miltmore/Lake LCHD 11 62
RGP Minear/Lake LCHD 7 21
RND Murphysboro/Jackson GERPDC 12 6
STO Napa Suwe/Lake LCHD 12 45
RNZO New Thompson/Jackson GERPDC 9 9
RTUA Nippersink/Lake LCHD 8 10
RCC Olney East Fork/Richland IEPA 2 2
SDZW Ossami/Tazewell IEPA 9 36.5
RDF Otter/MaCoupin IEPA 10 42

Appendix A: Table 1Page 4
Volunteer Participation 2013 VLMP Report
Lake
CodeLake/County
Oversite
Region
Sample
Events
Volunteer
Hours
RCG Paradise/Coles IEPA 5 40
RBL Paris Twin East/Edgar IEPA 7 16
RBX Paris Twin West/Edgar IEPA 8 16
REL Petersburg/Menard IEPA 9 16
RPC Pierce/Winnebago IEPA 6 18
RHN Pinckneyville/Perry GERPDC 4 8
RPZB Pine/Lee IEPA 11 9.5
RPZI Richardson Wildlife/Lee IEPA 12 18
RTH Round/Lake LCHD 8 9
RGM Sand/Lake LCHD 6 4.75
RCE Sara/Effingham IEPA 11 92
RTW Silver/McHenry CMAP 13 59.5
RNZG Spring Arbor/Jackson GERPDC 12 12
UGV Spring Ledge/Lake LCHD 8 8
RDR Spring/McDonough IEPA 12 114
REF Springfield/Sangamon IEPA 12 86
SGW Stephen/Will CMAP 3 8
RPI Summerset/Winnebago IEPA 9 33
REZN Sunset/Champaign IEPA 11 19
RPL Sunset/Lee IEPA 10 6
UDH Sunset/MaCoupin IEPA 1 5
RGZF Sylvan/Lake LCHD 8 28.5
REC Taylorville/Christian IEPA 3 16
RGW Third/Lake LCHD 9 36
WTJ Three Oaks North/McHenry CMAP 8 31
WTG Three Oaks South/McHenry CMAP 8 42
RTZQ Timber/Lake LCHD 3 4.5
RTZF Tower/Lake LCHD 4 8
REZL Twin Oaks/Champaign IEPA 11 18.5
RGZM Valley/Lake LCHD 12 25
RBD Vermilion/Vermilion IEPA 6 37
RCA Vernor/Richland IEPA 2 2
SGB Virginia/Cook CMAP 12 16
WGS Waterford/Lake LCHD 16 52.75
RTZB West Loon/Lake LCHD 2 8
RPZK Westlake/Winnebago IEPA 9 8
RTZC Wonder/McHenry CMAP 8 15
RPM Woodhaven/Lee IEPA 16 19.5
RTZZ Woods Creek/McHenry CMAP 9 36.5
RTS Zurich/Lake LCHD 12 25
1,077 3,428.5
Chicago Metropolitan Agency for Planning CMAP 155 511.25
Greater Egypt Regional Planning and Development Commission GERPDC 147 500.5
Illinois Environmental Protection Agency IEPA 436 1491.5
Lake County Health Department LCHD 339 925.25

Appendix A: Table 2Page 5
Comparing Median Transparency Ranking of Representative Site (S1) to Whole-lake (WL)
2013 VLMP Report
Lake
CodeLake/County
WL SD
(in)
S1 SD
(in)
%
ChangeWL Trophic State S1 Trophic State
RCJ Altamont New/Effingham 35 39.5 11.4 Eutrophic Eutrophic
RTT Antioch/Lake 62 62 0.0 Eutrophic Eutrophic
RMJ Apple Canyon/Jo Daviess 35 35.5 1.4 Eutrophic Eutrophic
RTG Bangs/Lake 105 108 2.8 Mesotrophic Mesotrophic
RTZT Barrington/Lake 48 51 5.9 Eutrophic Eutrophic
RPJ Bass/Lee 29.5 28 (5.4) Eutrophic Eutrophic
RDW Beaver/Grundy 108 114 5.3 Mesotrophic Mesotrophic
REZG Bertinetti/Christian 18.5 20 7.5 Hypereutrophic Eutrophic
SEB Bird's Pond/Sangamon 33.5 34 1.5 Eutrophic Eutrophic
RPK Black Oak/Lee 24 25.5 5.9 Eutrophic Eutrophic
RDO Bloomgington/McLean 24 26 7.7 Eutrophic Eutrophic
RCB Borah/Richland 16.5 22 25.0 Hypereutrophic Eutrophic
SGC Buffalo Creek/Lake 22 18 (22.2) Eutrophic Hypereutrophic
STJ Campton/Kane 14 16 12.5 Hypereutrophic Hypereutrophic
RNZH Campus/Jackson 30.5 30.5 0.0 Eutrophic Eutrophic
RPV Candlewick/Boone 36 40 10.0 Eutrophic Eutrophic
RDD Canton/Fulton 46 63 27.0 Eutrophic Eutrophic
RNI Carbondale/Jackson 8 8.5 5.9 Hypereutrophic Hypereutrophic
RTD Catherine/Lake 28 30.5 8.2 Eutrophic Eutrophic
RNE Cedar/Jackson 50 50 0.0 Eutrophic Eutrophic
RTI Channel/Lake 25 25 0.0 Eutrophic Eutrophic
RGR Charles/DuPage 30.5 31 1.6 Eutrophic Eutrophic
RBC Charleston SCR/Coles 17 17 0.0 Hypereutrophic Hypereutrophic
VTZ Charlotte/Kane 58 126 54.0 Eutrophic Mesotrophic
SNA Chautauqua/Jackson 20 24 16.7 Eutrophic Eutrophic
WDK Civic/Grundy 446 443.5 (0.6) Oligotrophic Oligotrophic
RGQ Countryside/Lake 35 38 7.9 Eutrophic Eutrophic
RGZA Crooked/Lake 26 26.5 1.9 Eutrophic Eutrophic
VTZH Crystal/McHenry 115.5 127.5 9.4 Mesotrophic Mesotrophic
REE Dawson/McLean 39 57 31.6 Eutrophic Eutrophic
REA Decatur/Macon 15.5 19 18.4 Hypereutrophic Hypereutrophic
WGZK Deep Quarry/DuPage 269 272 1.1 Oligotrophic Oligotrophic
VTD Deep/Lake 168.5 175 3.7 Oligotrophic Oligotrophic
RNJ Devil's Kitchen/Williamson 120 120 0.0 Mesotrophic Mesotrophic
RGB Diamond/Lake 67 69 2.9 Eutrophic Eutrophic
RGV Druce/Lake 154.5 154.5 0.0 Mesotrophic Mesotrophic
RTZG Duck/Lake 46 50 8.0 Eutrophic Eutrophic
RTM East Loon/Lake 36.5 32.5 (12.3) Eutrophic Eutrophic
SDS Eureka/Woodford 19 22 13.6 Hypereutrophic Eutrophic
SDA Evergreen/McLean 25 36 30.6 Eutrophic Eutrophic
VTT Fischer/Lake 19 22 13.6 Hypereutrophic Eutrophic
RMF Fish Trap/Jo Daviess 8 10 20.0 Hypereutrophic Hypereutrophic
RGZG Forest/Lake 28 29 3.4 Eutrophic Eutrophic
RGZC Fourth/Lake 36 36 0.0 Eutrophic Eutrophic
RLH Fyre/Mercer 65 66 1.5 Eutrophic Eutrophic
RGI Gages/Lake 64.5 76.5 15.7 Eutrophic Eutrophic
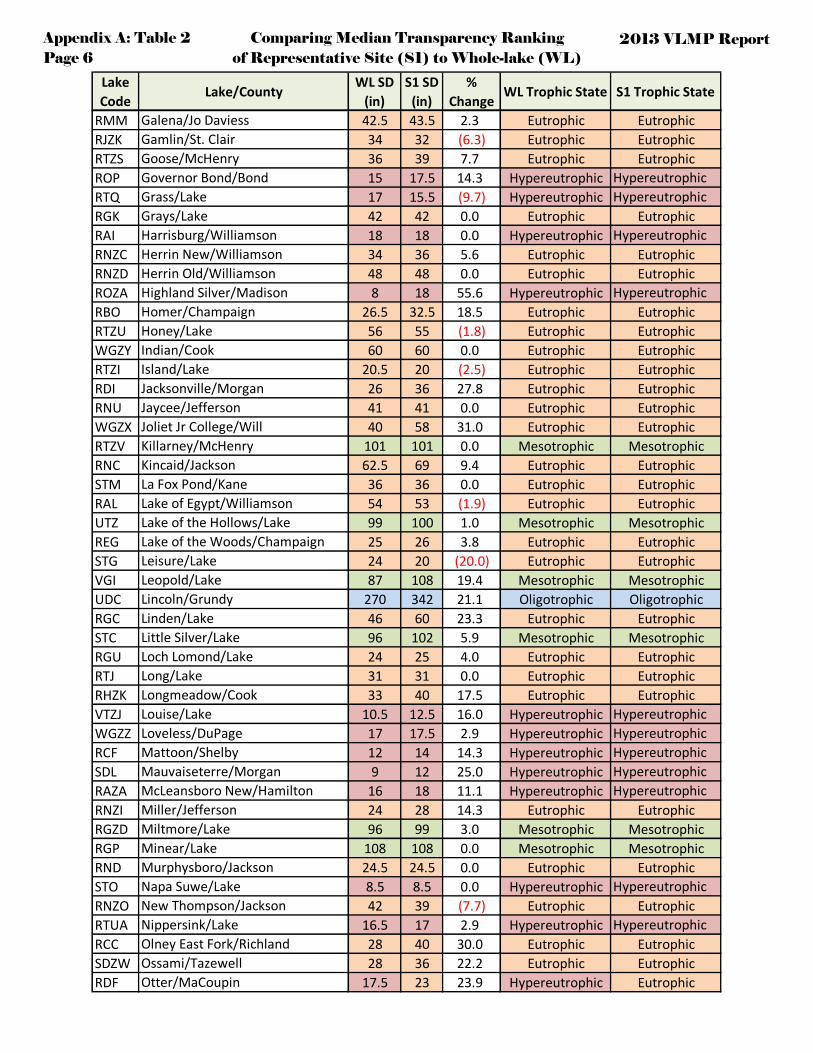
Appendix A: Table 2Page 6
Comparing Median Transparency Ranking of Representative Site (S1) to Whole-lake (WL)
2013 VLMP Report
Lake
CodeLake/County
WL SD
(in)
S1 SD
(in)
%
ChangeWL Trophic State S1 Trophic State
RMM Galena/Jo Daviess 42.5 43.5 2.3 Eutrophic Eutrophic
RJZK Gamlin/St. Clair 34 32 (6.3) Eutrophic Eutrophic
RTZS Goose/McHenry 36 39 7.7 Eutrophic Eutrophic
ROP Governor Bond/Bond 15 17.5 14.3 Hypereutrophic Hypereutrophic
RTQ Grass/Lake 17 15.5 (9.7) Hypereutrophic Hypereutrophic
RGK Grays/Lake 42 42 0.0 Eutrophic Eutrophic
RAI Harrisburg/Williamson 18 18 0.0 Hypereutrophic Hypereutrophic
RNZC Herrin New/Williamson 34 36 5.6 Eutrophic Eutrophic
RNZD Herrin Old/Williamson 48 48 0.0 Eutrophic Eutrophic
ROZA Highland Silver/Madison 8 18 55.6 Hypereutrophic Hypereutrophic
RBO Homer/Champaign 26.5 32.5 18.5 Eutrophic Eutrophic
RTZU Honey/Lake 56 55 (1.8) Eutrophic Eutrophic
WGZY Indian/Cook 60 60 0.0 Eutrophic Eutrophic
RTZI Island/Lake 20.5 20 (2.5) Eutrophic Eutrophic
RDI Jacksonville/Morgan 26 36 27.8 Eutrophic Eutrophic
RNU Jaycee/Jefferson 41 41 0.0 Eutrophic Eutrophic
WGZX Joliet Jr College/Will 40 58 31.0 Eutrophic Eutrophic
RTZV Killarney/McHenry 101 101 0.0 Mesotrophic Mesotrophic
RNC Kincaid/Jackson 62.5 69 9.4 Eutrophic Eutrophic
STM La Fox Pond/Kane 36 36 0.0 Eutrophic Eutrophic
RAL Lake of Egypt/Williamson 54 53 (1.9) Eutrophic Eutrophic
UTZ Lake of the Hollows/Lake 99 100 1.0 Mesotrophic Mesotrophic
REG Lake of the Woods/Champaign 25 26 3.8 Eutrophic Eutrophic
STG Leisure/Lake 24 20 (20.0) Eutrophic Eutrophic
VGI Leopold/Lake 87 108 19.4 Mesotrophic Mesotrophic
UDC Lincoln/Grundy 270 342 21.1 Oligotrophic Oligotrophic
RGC Linden/Lake 46 60 23.3 Eutrophic Eutrophic
STC Little Silver/Lake 96 102 5.9 Mesotrophic Mesotrophic
RGU Loch Lomond/Lake 24 25 4.0 Eutrophic Eutrophic
RTJ Long/Lake 31 31 0.0 Eutrophic Eutrophic
RHZK Longmeadow/Cook 33 40 17.5 Eutrophic Eutrophic
VTZJ Louise/Lake 10.5 12.5 16.0 Hypereutrophic Hypereutrophic
WGZZ Loveless/DuPage 17 17.5 2.9 Hypereutrophic Hypereutrophic
RCF Mattoon/Shelby 12 14 14.3 Hypereutrophic Hypereutrophic
SDL Mauvaiseterre/Morgan 9 12 25.0 Hypereutrophic Hypereutrophic
RAZA McLeansboro New/Hamilton 16 18 11.1 Hypereutrophic Hypereutrophic
RNZI Miller/Jefferson 24 28 14.3 Eutrophic Eutrophic
RGZD Miltmore/Lake 96 99 3.0 Mesotrophic Mesotrophic
RGP Minear/Lake 108 108 0.0 Mesotrophic Mesotrophic
RND Murphysboro/Jackson 24.5 24.5 0.0 Eutrophic Eutrophic
STO Napa Suwe/Lake 8.5 8.5 0.0 Hypereutrophic Hypereutrophic
RNZO New Thompson/Jackson 42 39 (7.7) Eutrophic Eutrophic
RTUA Nippersink/Lake 16.5 17 2.9 Hypereutrophic Hypereutrophic
RCC Olney East Fork/Richland 28 40 30.0 Eutrophic Eutrophic
SDZW Ossami/Tazewell 28 36 22.2 Eutrophic Eutrophic
RDF Otter/MaCoupin 17.5 23 23.9 Hypereutrophic Eutrophic

Appendix A: Table 2Page 7
Comparing Median Transparency Ranking of Representative Site (S1) to Whole-lake (WL)
2013 VLMP Report
Lake
CodeLake/County
WL SD
(in)
S1 SD
(in)
%
ChangeWL Trophic State S1 Trophic State
RCG Paradise/Coles 12 13 7.7 Hypereutrophic Hypereutrophic
RBL Paris Twin East/Edgar 18 23 21.7 Hypereutrophic Eutrophic
RBX Paris Twin West/Edgar 16 16.5 3.0 Hypereutrophic Hypereutrophic
REL Petersburg/Menard 64 64 0.0 Eutrophic Eutrophic
RPC Pierce/Winnebago 18 13.5 (33.3) Hypereutrophic Hypereutrophic
RNH Pinckneyville/Perry 32.5 33.5 3.0 Eutrophic Eutrophic
RPZB Pine/Lee 39.5 39.5 0.0 Eutrophic Eutrophic
RPZI Richardson Wildlife/Lee 27 26.5 (1.9) Eutrophic Eutrophic
RTH Round/Lake 60 71 15.5 Eutrophic Eutrophic
RGM Sand/Lake 26.5 27 1.9 Eutrophic Eutrophic
RCE Sara/Effingham 32 36 11.1 Eutrophic Eutrophic
RTW Silver/McHenry 66 88 25.0 Eutrophic Mesotrophic
RNZG Spring Arbor/Jackson 63.5 67 5.2 Eutrophic Eutrophic
UGV Spring Ledge/Lake 72 78.5 8.3 Eutrophic Eutrophic
RDR Spring/McDonough 15 20 25.0 Hypereutrophic Eutrophic
REF Springfield/Sangamon 13 20.5 36.6 Hypereutrophic Eutrophic
SGW Stephen/Will 47 45 (4.4) Eutrophic Eutrophic
RPI Summerset/Winnebago 38 62 38.7 Eutrophic Eutrophic
REZN Sunset/Champaign 76 84 9.5 Eutrophic Mesotrophic
RPL Sunset/Lee 33 34 2.9 Eutrophic Eutrophic
UDH Sunset/MaCoupin 25 25 0.0 Eutrophic Eutrophic
RGZF Sylvan/Lake 33 34.5 4.3 Eutrophic Eutrophic
REC Taylorville/Christian 12 24 50.0 Hypereutrophic Eutrophic
RGW Third/Lake 85 87 2.3 Mesotrophic Mesotrophic
WTJ Three Oaks North/McHenry 168 208.5 19.4 Oligotrophic Oligotrophic
WTG Three Oaks South/McHenry 260 290.5 10.5 Oligotrophic Oligotrophic
RTZQ Timber/Lake 48.5 50 3.0 Eutrophic Eutrophic
RTZF Tower/Lake 30 29 (3.4) Eutrophic Eutrophic
REZL Twin Oaks/Champaign 10 11 9.1 Hypereutrophic Hypereutrophic
RGZM Valley/Lake 35 36.5 4.1 Eutrophic Eutrophic
RBD Vermilion/Vermilion 18 26.5 32.1 Hypereutrophic Eutrophic
RCA Vernor/Richland 46 50 8.0 Eutrophic Eutrophic
SGB Virginia/Cook 225 236 4.7 Oligotrophic Oligotrophic
WGS Waterford/Lake 72 108 33.3 Eutrophic Mesotrophic
RTZB West Loon/Lake 114 114 0.0 Mesotrophic Mesotrophic
RPZK Westlake/Winnebago 32 34 5.9 Eutrophic Eutrophic
RTZC Wonder/McHenry 16 17.5 8.6 Hypereutrophic Hypereutrophic
RPM Woodhaven/Lee 43 42 (2.4) Eutrophic Eutrophic
RTZZ Woods Creek/McHenry 35 39 10.3 Eutrophic Eutrophic
RTS Zurich/Lake 90 90 0.0 Mesotrophic Mesotrophic
TSI Oligotrophic - Greater than 158 inches
TSI Mesotrophic - 79 to 158 inches
TSI Eutrophic - 19.7 to 79 inches
TSI Hypereutrophic - less than 19.7 inches

Appendix A: Table 3Page 8
Lake Statistics 2013 VLMP Report
Lake/County Lat Lon BasinWatershed
(HUCS)Watershed Name
Lake
Area
W/shed
Area
Max
Depth
Ave
Depth
Owner-
shipAccess
Lake
Type
Altamont New/Effingham 39.031948 -88.714726 31 05120114 Little and Lower Wabash 57 620 30 17 Public Yes I
Antioch/Lake 42.467781 -88.098059 3 07120006 Upper Fox 85 125 9 5 Multiple No I
Apple Canyon/Jo Daviess 42.417100 -90.164100 9 07060005 Mississippi North 450 13,000 60 15 Private No I
Bangs/Lake 42.265281 -88.132227 3 07120006 Upper Fox 306 960 32 14 Public Yes G
Barrington/Lake 42.221700 -88.147100 3 07120006 Upper Fox 95 172 13 7 Private No I
Bass/Lee 41.654400 -89.287300 8 07090007 Green 26 1,895 14 7 Private No I
Beaver/Grundy 41.336800 -88.317300 11 07120005 Upper Illinois 80 19,276 21 3 Private No Q
Bertinetti/Christian 39.533297 -89.251344 20 07130007 Lower Sangamon 55 4,400 18 Private No I
Bird's Pond/Sangamon 39.747067 -89.565557 20 07130007 Lower Sangamon 3 16 Private No P
Black Oak/Lee 41.657500 -89.289500 8 07090007 Green 6 2,240 8 4 Private No P
Bloomington/McLean 40.660567 -88.935553 14 07130004 Mackinaw 635 45,400 35 14 Public Yes I
Borah/Richland 38.774390 -88.069800 31 05120114 Little and Lower Wabash 137 2,154 25 11 Public Yes I
Buffalo Creek/Lake 42.156979 -87.991331 2 07120004 Des Plaines 35 10,304 6 4 Public Yes I
Campton/Kane 41.952936 -88.410869 3 07120007 Upper Fox 32 3,850 9 3 Private No I
Campus/Jackson 37.708892 -89.223059 26 07140106 Big Muddy 40 384 17 8 Public Yes I
Candlewick/Boone 42.348700 -88.865700 5 07090006 Kishwaukee 200 2,100 30 15 Private No I
Canton/Fulton 40.564200 -89.973560 13 07130003 Middle Illinois 250 9,728 33 13 Private No I
Carbondale/Jackson 37.698892 -89.223615 26 07140106 Big Muddy 133 1,920 11 3 Public Yes I
Catherine/Lake 42.485838 -88.128337 3 07120006 Upper Fox 165 766,146 35 17 Multiple Yes G
Cedar/Jackson 37.666115 -89.280560 26 07140106 Big Muddy 1,800 19,330 45 23 Multiple Yes I
Channel/Lake 42.486392 -88.137503 3 07120006 Upper Fox 337 766,146 36 14 Public Yes G
Charles/DuPage 41.815560 -87.958059 2 07120004 Des Plaines 16 450 20 9 Private No I
Charleston SCR/Coles 39.470281 -88.143616 30 05120112 Embarras/Middle Wabash 339 1,132 15 10 Public Yes I
Charlotte/Kane 41.915560 -88.370480 3 07120007 Upper Fox 2 Private No P
Chautauqua/Jackson 37.726300 -89.302200 26 07140106 Big Muddy 88 1,249 40 20 Private No I
Civic/Grundy 41.310278 -88.284441 11 07120005 Upper Illinois 390 73 35 Private No Q
Countryside/Lake 42.253006 -88.044047 2 07120004 Des Plaines 140 900 10 6 Private No I
Crooked/Lake 42.422503 -88.051670 2 07120004 Des Plaines 140 1,260 26.5 11 Multiple Yes G
Crystal/McHenry 42.233436 -88.354408 3 07120006 Upper Fox 230 3,072 46 14 Multiple No G
Dawson/McLean 40.403610 -88.722810 22 07130009 Salt Creek 148 2,830 10 Public Yes I

Appendix A: Table 3Page 9
Lake Statistics 2013 VLMP Report
Lake/County Lat Lon BasinWatershed
(HUCS)Watershed Name
Lake
Area
W/shed
Area
Max
Depth
Ave
Depth
Owner-
shipAccess
Lake
Type
Decatur/Macon 39.824449 -88.952504 21 07130006 Upper Sangamon 3,072 592,000 20 8 Public Yes I
Deep Quarry/DuPage 41.939727 -88.178615 2 07120004 Des Plaines 37 65 45 18 Public Yes Q
Deep/Lake 42.428337 -88.066889 3 07120006 Upper Fox 226 592 48 18 Multiple Yes G
Devils Kitchen/Williamson 37.641948 -89.105560 26 07140106 Big Muddy 810 11,700 100 36 Public Yes I
Diamond/Lake 42.250230 -88.007290 2 07120004 Des Plaines 154 400 25 9 Multiple Yes G
Druce/Lake 42.366900 -88.005000 2 07120004 Des Plaines 88 1,333 32 9 Multiple No G
Duck/Lake 42.376115 -88.121393 3 07120006 Upper Fox 93 4,000 9 4 Multiple Yes G
East Loon/Lake 42.453337 -88.073337 3 07120006 Upper Fox 178 5,259 24 11 Multiple Yes G
Eureka/Woodford 40.705003 -89.277505 14 07130004 Mackinaw 35 1,700 18 10 Public Yes I
Evergreen/McLean 40.648770 -89.054650 14 07130004 Mackinaw 700 25,600 48 17 Public Yes I
Fischer/Lake 42.358059 -88.157503 11 07120005 Upper Illinois 23 2,150 11 3 Multiple Yes I
Fish Trap/Jo Daviess 42.382781 -90.467781 9 07060005 Mississippi North 285 358 8 3 Public Yes R
Forest/Lake 42.213038 -88.054505 2 07120004 Des Plaines 40 430 9 5 Private No I
Fourth/Lake 42.392098 -88.031469 2 07120004 Des Plaines 305 840 6 3 Multiple Yes G
Fyre/Mercer 41.296000 -90.488400 16 07080104 Mississippi North Central 150 1,082 38 20 Private No I
Gages/Lake 42.351380 -87.999440 2 07120004 Des Plaines 143 1,280 52 8 Multiple Yes G
Galena/Jo Daviess 42.400400 -90.349200 9 07060005 Mississippi North 220 10,340 60 20 Multiple No I
Gamlin/St. Clair 38.598500 -90.019600 27 07140101 Mississippi South Central 3 26 8 Private No P
Goose/McHenry 42.179900 -88.311600 3 07120006 Upper Fox 11 6,200 16 7 Public Yes Q
Governor Bond/Bond 38.925940 -89.399040 24 07140203 Middle Kaskaskia 775 22,080 25 13 Public Yes I
Grass/Lake 42.430559 -88.163337 3 07120006 Upper Fox 1,360 766,146 3 Multiple Yes G
Grays/Lake 42.342200 -88.048000 3 07120006 Upper Fox 80 400 18 7 Public Yes G
Harrisburg/Saline 37.835837 -88.590005 32 05140204 Saline 209 3,456 30 10 Multiple Yes I
Herrin New/Williamson 37.635800 -89.014460 26 07140106 Big Muddy 46 2,200 26 8 Public Yes I
Herrin Old/Williamson 37.763059 -89.035559 26 07140106 Big Muddy 51 1,140 14 5 Public Yes I
Highland Silver/Madison 38.766010 -89.698390 25 07140204 Lower Kaskaskia 600 30,144 20 12 Public Yes I
Homer/Champaign 40.060210 -87.984840 29 05120109 Vermilion (Wabash Basin) 102 9,280 21 11 Public Yes I
Honey/Lake 42.200600 -88.130100 3 07120006 Upper Fox 66 590 19 9 Private No G
Indian/Cook 41.832781 -87.840005 2 07120004 Des Plaines 4 15 13 7 Public Yes P
Island/Lake 42.275281 -88.200838 3 07120006 Upper Fox 76 6,972 9 5 Public Yes I

Appendix A: Table 3Page 10
Lake Statistics 2013 VLMP Report
Lake/County Lat Lon BasinWatershed
(HUCS)Watershed Name
Lake
Area
W/shed
Area
Max
Depth
Ave
Depth
Owner-
shipAccess
Lake
Type
Jacksonville/Morgan 39.672503 -90.212226 18 07130011 Lower Illinois/Macoupin 477 6,880 36 13 Public Yes I
Jaycee/Jefferson 38.370281 -88.898617 26 07140106 Big Muddy 115 1,670 20 Public Yes I
Joliet Jr. College/Will 41.500900 -88.185000 2 07120004 Des Plaines 11 300 10 6 Public Yes G
Killarney/McHenry 42.239450 -88.257290 3 07120006 Upper Fox 80 1,500 22 6 Private No G
Kinkaid/Jackson 37.778836 -89.449500 26 07140106 Big Muddy 2,750 42,336 89 29 Multiple Yes I
La Fox Pond/Kane 41.871560 -88.436560 3 07120007 Upper Fox 4 10 7 Private No P
Lake of Egypt/Williamson 37.620837 -88.943338 32 05140204 Saline 3,500 18,540 45 19 Public Yes I
Lake of the Hollow/Lake 42.365562 -88.183950 3 07120006 Upper Fox 75 1,008 15 7.5 Private No G
Lake of the Woods/Champaign 40.200559 -88.381671 21 07130006 Upper Sangamon 23 612 22 10 Public Yes I
Leisure/Lake 42.436200 -88.185900 2 07120004 Des Plaines 12 9 7 Private No I
Leopold/Lake 42.327082 -88.011318 2 07120004 Des Plaines 28 1,439 16 5 Private No I
Lincoln/Grundy 41.317348 -88.315116 11 07120005 Upper Illinois 112 65 25 Private No Q
Linden/Lake 42.420837 -88.028338 2 07120004 Des Plaines 31 80 11 5 Multiple Yes I
Little Silver/Lake 42.473400 -88.074800 3 07120006 Upper Fox 45 639 25 18 Multiple No G
Loch Lomond/Lake 42.280600 -88.005100 2 07120004 Des Plaines 75 1,439 8 5 Private No I
Long/Lake 42.377781 -88.126115 3 07120006 Upper Fox 393 27,008 30 13 Multiple No G
Longmeadow/Cook 42.086309 -87.752877 1 07120003 Chicago/Calumet 2 18 Multiple No P
Louise/Lake 42.160255 -88.114906 3 07120006 Upper Fox 38 17,664 10 5 Private No I
Loveless/DuPage 41.889110 -88.187290 2 07120004 Des Plaines 2 5 Multiple No P
Mattoon/Shelby 39.334730 -88.482480 31 05120114 Little and Lower Wabash 765 25,650 35 10 Public Yes I
Mauvaise Terre/Morgan 39.720003 -90.214448 18 07130011 Lower Illinois/Macoupin 172 20,851 8 5 Public Yes I
McLeansboro New/Hamilton 38.084448 -88.553337 32 05140204 Saline 75 935 20 10 Public Yes I
Miller/Jefferson 38.396656 -88.892390 26 07140106 Big Muddy 131 2,976 22 Private No I
Miltmore/Lake 42.396110 -88.041667 2 07120004 Des Plaines 84 94 21 10 Multiple No G
Minear/Lake 42.290317 -87.941458 2 07120004 Des Plaines 75 85 23 10 Multiple Yes Q
Murphysboro/Jackson 37.773615 -89.380559 26 07140106 Big Muddy 145 1,722 32 14 Public Yes I
Napa Suwe/Lake 42.287042 -88.124777 3 07120006 Upper Fox 61 960 5 3 Multiple No G
New Thompson/Jackson 37.744167 -89.254722 26 07140106 Big Muddy 19 75 25 10 Private No I
Nippersink/Lake 42.413060 -88.180559 3 07120006 Upper Fox 420 766,146 3 Multiple Yes G
Olney East Fork/Richland 38.761670 -88.076710 31 05120114 Little and Lower Wabash 935 9,982 40 15 Public Yes I

Appendix A: Table 3Page 11
Lake Statistics 2013 VLMP Report
Lake/County Lat Lon BasinWatershed
(HUCS)Watershed Name
Lake
Area
W/shed
Area
Max
Depth
Ave
Depth
Owner-
shipAccess
Lake
Type
Ossami/Tazewell 40.635586 -89.468316 11 07130001 Upper Illinois 5 9 Private No P
Otter/Macoupin 39.408900 -89.911990 18 07130012 Lower Illinois/Macoupin 760 12,992 80 21 Public Yes I
Paradise/Coles 39.413120 -88.439630 31 05120114 Little and Lower Wabash 166 11,580 23 9 Public Yes I
Paris Twin East/Edgar 39.630220 -87.677710 30 05120111 Embarras/Middle Wabash 163 12,800 27 10 Public Yes I
Paris Twin West/Edgar 39.635930 -87.694100 30 05120111 Embarras/Middle Wabash 25 11,264 9 3 Public Yes I
Petersburg/Menard 39.988600 -89.850100 20 07130008 Lower Sangamon 191 1,460 65 24 Private No I
Pierce/Winnebago 42.345330 -88.985100 6 07090005 Rock 162 8,150 36 12 Public Yes I
Pinckneyville/Perry 38.096670 -89.396671 26 07140106 Big Muddy 250 3,051 20 12 Public Yes G
Pine/Lee 41.651800 -89.309500 8 07090007 Green 3 352 20 11 Private No P
Richardson Wildlife/Lee 41.715388 -89.188098 8 07090007 Green 12 40 9 6 Public Yes I
Round/Lake 42.361671 -88.076671 3 07120006 Upper Fox 229 1,602 32 8 Multiple Yes G
Sand/Lake 42.412503 -88.043337 2 07120004 Des Plaines 115 229 33 10 Multiple Yes G
Sara/Effingham 39.126200 -88.618670 31 05120114 Little and Lower Wabash 586 7,560 53 20 Public Yes I
Silver/McHenry 42.246650 -88.247460 3 07120006 Upper Fox 42 1,600 18 9 Public Yes I
Spring Arbor/Jackson 37.650281 -89.168893 26 07140106 Big Muddy 100 500 48 12 Private No I
Spring Ledge/Lake 42.423260 -88.020624 2 07120004 Des Plaines 3 9 Multiple Yes P
Spring/McDonough 40.506660 -90.717570 17 07130010 La Moine 5 12,928 20 10 Public Yes I
Springfield/Sangamon 39.756115 -89.593616 20 07130007 Lower Sangamon 4,200 165,366 26 13 Public Yes I
Stephen/Will 41.566400 -88.225981 2 07120004 Des Plaines 1 Private No P
Summerset/Winnebago 42.448600 -89.384900 7 07090004 Pecatonica 285 4,500 40 18 Private No I
Sunset/Champaign 40.181900 -88.423200 21 07130006 Upper Sangamon 89 393 60 Public Yes Q
Sunset/Lee 41.647900 -89.293700 8 07090007 Green 7 300 10 6 Private No P
Sunset/Macoupin 39.436400 -89.855400 18 07130012 Lower Illinois/Macoupin 149 2,800 37 12 Multiple No I
Sylvan/Lake 42.242147 -88.046133 2 07120004 Des Plaines 39 1,039 12 8 Multiple No I
Taylorville/Christian 39.529448 -89.255838 20 07130007 Lower Sangamon 1,148 84,032 30 7 Public Yes I
Third/Lake 42.370837 -88.014448 2 07120004 Des Plaines 157 7,680 70 19 Public Yes G
Three Oaks North/McHenry 42.223601 -88.302678 3 07120006 Upper Fox 33 40 23 Public Yes Q
Three Oaks South/McHenry 42.215852 -88.305410 3 07120006 Upper Fox 282 41 19 Public Yes Q
Timber/Lake 42.240281 -88.127503 3 07120006 Upper Fox 32 450 15 8 Private No G
Tower/Lake 42.228185 -88.152374 3 07120006 Upper Fox 69 1,500 8 5 Private No I

Appendix A: Table 3Page 12
Lake Statistics 2013 VLMP Report
Lake/County Lat Lon BasinWatershed
(HUCS)Watershed Name
Lake
Area
W/shed
Area
Max
Depth
Ave
Depth
Owner-
shipAccess
Lake
Type
Twin Oaks/Champaign 40.213760 -88.375433 21 07130006 Upper Sangamon 9 195 5 3 Private No I
Valley/Lake 42.349920 -87.982673 2 07120004 Des Plaines 12 117 10 5 Multiple Yes I
Vermilion/Vermilion 40.157400 -87.649100 29 05120109 Vermilion (Wabash Basin) 608 200,006 27 8 Multiple Yes I
Vernor/Richland 38.763790 -88.102500 31 05120114 Little and Lower Wabash 36 300 45 15 Public Yes I
Virginia/Cook 42.146100 -87.945000 2 07120004 Des Plaines 6 50 65 35 Private No P
Waterford/Lake 42.427200 -88.026400 2 07120004 Des Plaines 67 100 13 6 Multiple Yes I
West Loon/Lake 42.452781 -88.083338 3 07120006 Upper Fox 168 3,760 40 16 Private No G
Westlake/Winnebago 42.316337 -89.284705 7 07090003 Pecatonica 82 Private No I
Wonder/McHenry 42.375005 -88.354727 3 07120006 Upper Fox 830 62,270 12 5 Private No I
Woodhaven/Lee 41.656600 -89.306100 8 07090007 Green 27 630 30 9 Private No I
Woods Creek/McHenry 42.180490 -88.318880 3 07120006 Upper Fox 56 6,190 26 16 Public Yes I
Zurich/Lake 42.195003 -88.098337 3 07120006 Upper Fox 250 1,240 32 11 Multiple Yes G
38,477
Lake Type Count
Glacial 30
Impoundment 78
Pond 14
Quarry 9
Riverine 1
Total 132

Appendix A: Table 4Page 13
Trophic State Indexes Based on the Representative Site
2013 VLMP Report
Lake
CodeLake/County TSI
SDTSI
TPTSI
CHL Trophic State TSITN Lat Lon
RCJ Altamont New/Effingham 60.0 76.6 58.2 Eutrophic 54.3 39.031948 -88.714726
RTT Antioch/Lake 53.5 Eutrophic 42.467781 -88.098059
RMJ Apple Canyon/Jo Daviess 61.5 59.4 67.4 Eutrophic 55.6 42.417100 -90.164100
RTG Bangs/Lake 45.5 Mesotrophic 42.265281 -88.132227
RTZT Barrington/Lake 56.3 Eutrophic 42.221700 -88.147100
RPJ Bass/Lee 64.9 68.4 68.9 Eutrophic 71.1 41.654400 -89.287300
RDW Beaver/Grundy 44.7 Mesotrophic 41.336800 -88.317300
REZG Bertinetti/Christian 69.8 75.2 69.7 Eutrophic 66.7 39.533297 -89.251344
SEB Bird's Pond/Sangamon 62.1 67.8 58.8 Eutrophic 51.7 39.747067 -89.565557
RPK Black Oak/Lee 66.3 Eutrophic 41.657500 -89.289500
RDO Bloomington/McLean 66.0 68.4 70.6 Eutrophic 82.3 40.660567 -88.935553
RCB Borah/Richland 68.4 69.2 27.9 Eutrophic 60.0 38.774390 -88.069800
SGC Buffalo Creek/Lake 71.3 67.2 59.6 Eutrophic 55.4 42.156979 -87.991331
STJ Campton/Kane 73.0 Hypereutrophic 41.952936 -88.410869
RNZH Campus/Jackson 63.7 Eutrophic 37.708892 -89.223059
RPV Candlewick/Boone 59.8 59.8 63.1 Eutrophic 52.5 42.348700 -88.865700
RDD Canton/Fulton 53.2 58.6 57.0 Eutrophic 78.0 40.564200 -89.973560
RNI Carbondale/Jackson 82.1 67.6 Eutrophic 58.3 37.698892 -89.223615
RTD Catherine/Lake 63.7 Eutrophic 42.485838 -88.128337
RNE Cedar/Jackson 56.6 44.1 51.3 Eutrophic 49.8 37.666115 -89.280560
RTI Channel/Lake 66.5 Eutrophic 42.486392 -88.137503
RGR Charles/DuPage 63.4 82.5 64.5 Eutrophic 58.2 41.815560 -87.958059
RBC Charleston SCR/Coles 72.1 70.4 72.4 Hypereutrophic 61.1 39.470281 -88.143616
VTZ Charlotte/Kane 43.2 Mesotrophic 41.915560 -88.370480
SNA Chautauqua/Jackson 67.1 Eutrophic 37.726300 -89.302200
WDK Civic/Grundy 25.1 27.4 36.3 Oligotrophic 38.8 41.310278 -88.284441
RGQ Countryside/Lake 60.5 Eutrophic 42.253006 -88.044047
RGZA Crooked/Lake 65.7 Eutrophic 42.422503 -88.051670
VTZH Crystal/McHenry 43.1 44.1 57.9 Mesotrophic 51.4 42.233436 -88.354408
REE Dawson/McLean 54.7 50.9 62.5 Eutrophic 72.4 40.403610 -88.722810
REA Decatur/Macon 70.5 71.7 67.0 Hypereutrophic 88.7 39.824449 -88.952504
WGZK Deep Quarry/DuPage 32.2 38.7 40.2 Oligotrophic 38.3 41.939727 -88.178615
VTD Deep/Lake 38.5 46.6 48.5 Mesotrophic 49.3 42.428337 -88.066889
RNJ Devils Kitchen/Williamson 44.0 37.4 Oligotrophic 38.1 37.641948 -89.105560
RGB Diamond/Lake 51.9 54.3 49.6 Eutrophic 50.8 42.250230 -88.007290
RGV Druce/Lake 40.3 37.4 47.5 Mesotrophic 45.7 42.366900 -88.005000
RTZG Duck/Lake 56.6 Eutrophic 42.376115 -88.121393
RTM East Loon/Lake 62.8 Eutrophic 42.453337 -88.073337
SDS Eureka/Woodford 68.4 Eutrophic 40.705003 -89.277505
SDA Evergreen/McLean 61.3 56.4 59.4 Eutrophic 80.3 40.648770 -89.054650
VTT Fischer/Lake 68.4 75.0 68.0 Eutrophic 61.0 42.358059 -88.157503
RMF Fish Trap/Jo Daviess 79.7 Hypereutrophic 42.382781 -90.467781
RGZG Forest/Lake 64.4 63.4 55.1 Eutrophic 53.6 42.213038 -88.054505
RGZC Fourth/Lake 61.3 Eutrophic 42.392098 -88.031469
RLH Fyre/Mercer 52.6 Eutrophic 41.296000 -90.488400
RGI Gages/Lake 50.4 Eutrophic 42.351380 -87.999440
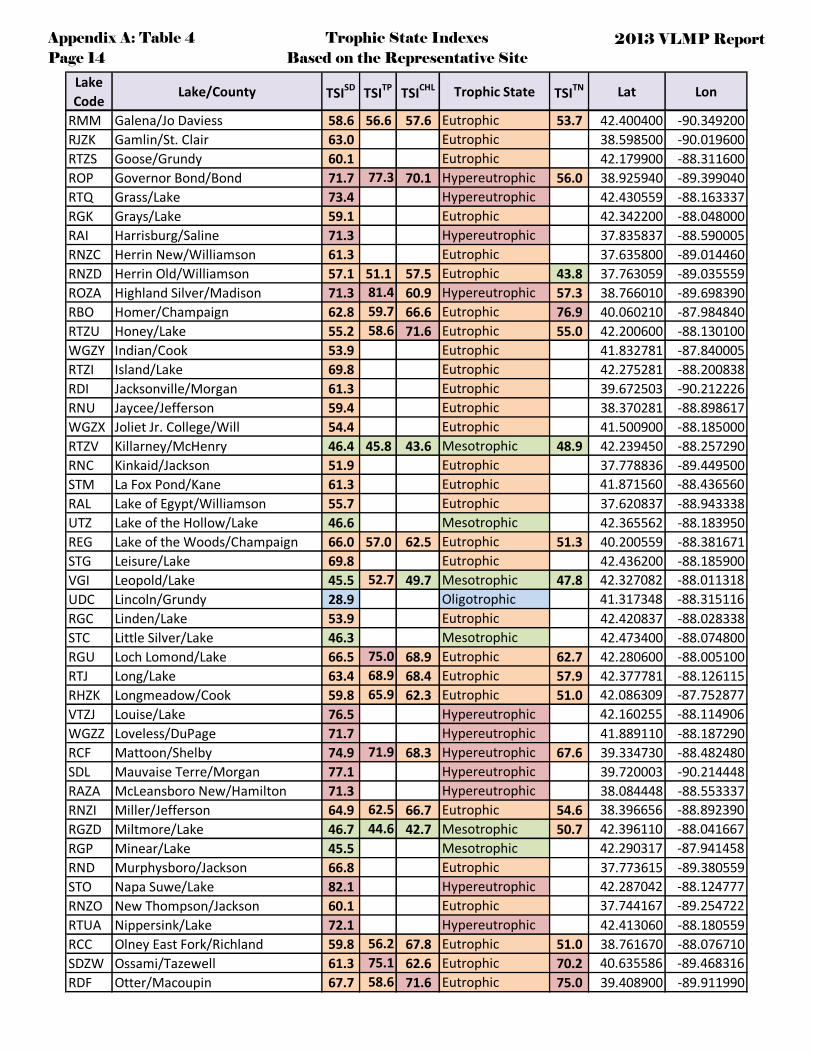
Appendix A: Table 4Page 14
Trophic State Indexes Based on the Representative Site
2013 VLMP Report
Lake
CodeLake/County TSI
SDTSI
TPTSI
CHL Trophic State TSITN Lat Lon
RMM Galena/Jo Daviess 58.6 56.6 57.6 Eutrophic 53.7 42.400400 -90.349200
RJZK Gamlin/St. Clair 63.0 Eutrophic 38.598500 -90.019600
RTZS Goose/Grundy 60.1 Eutrophic 42.179900 -88.311600
ROP Governor Bond/Bond 71.7 77.3 70.1 Hypereutrophic 56.0 38.925940 -89.399040
RTQ Grass/Lake 73.4 Hypereutrophic 42.430559 -88.163337
RGK Grays/Lake 59.1 Eutrophic 42.342200 -88.048000
RAI Harrisburg/Saline 71.3 Hypereutrophic 37.835837 -88.590005
RNZC Herrin New/Williamson 61.3 Eutrophic 37.635800 -89.014460
RNZD Herrin Old/Williamson 57.1 51.1 57.5 Eutrophic 43.8 37.763059 -89.035559
ROZA Highland Silver/Madison 71.3 81.4 60.9 Hypereutrophic 57.3 38.766010 -89.698390
RBO Homer/Champaign 62.8 59.7 66.6 Eutrophic 76.9 40.060210 -87.984840
RTZU Honey/Lake 55.2 58.6 71.6 Eutrophic 55.0 42.200600 -88.130100
WGZY Indian/Cook 53.9 Eutrophic 41.832781 -87.840005
RTZI Island/Lake 69.8 Eutrophic 42.275281 -88.200838
RDI Jacksonville/Morgan 61.3 Eutrophic 39.672503 -90.212226
RNU Jaycee/Jefferson 59.4 Eutrophic 38.370281 -88.898617
WGZX Joliet Jr. College/Will 54.4 Eutrophic 41.500900 -88.185000
RTZV Killarney/McHenry 46.4 45.8 43.6 Mesotrophic 48.9 42.239450 -88.257290
RNC Kinkaid/Jackson 51.9 Eutrophic 37.778836 -89.449500
STM La Fox Pond/Kane 61.3 Eutrophic 41.871560 -88.436560
RAL Lake of Egypt/Williamson 55.7 Eutrophic 37.620837 -88.943338
UTZ Lake of the Hollow/Lake 46.6 Mesotrophic 42.365562 -88.183950
REG Lake of the Woods/Champaign 66.0 57.0 62.5 Eutrophic 51.3 40.200559 -88.381671
STG Leisure/Lake 69.8 Eutrophic 42.436200 -88.185900
VGI Leopold/Lake 45.5 52.7 49.7 Mesotrophic 47.8 42.327082 -88.011318
UDC Lincoln/Grundy 28.9 Oligotrophic 41.317348 -88.315116
RGC Linden/Lake 53.9 Eutrophic 42.420837 -88.028338
STC Little Silver/Lake 46.3 Mesotrophic 42.473400 -88.074800
RGU Loch Lomond/Lake 66.5 75.0 68.9 Eutrophic 62.7 42.280600 -88.005100
RTJ Long/Lake 63.4 68.9 68.4 Eutrophic 57.9 42.377781 -88.126115
RHZK Longmeadow/Cook 59.8 65.9 62.3 Eutrophic 51.0 42.086309 -87.752877
VTZJ Louise/Lake 76.5 Hypereutrophic 42.160255 -88.114906
WGZZ Loveless/DuPage 71.7 Hypereutrophic 41.889110 -88.187290
RCF Mattoon/Shelby 74.9 71.9 68.3 Hypereutrophic 67.6 39.334730 -88.482480
SDL Mauvaise Terre/Morgan 77.1 Hypereutrophic 39.720003 -90.214448
RAZA McLeansboro New/Hamilton 71.3 Hypereutrophic 38.084448 -88.553337
RNZI Miller/Jefferson 64.9 62.5 66.7 Eutrophic 54.6 38.396656 -88.892390
RGZD Miltmore/Lake 46.7 44.6 42.7 Mesotrophic 50.7 42.396110 -88.041667
RGP Minear/Lake 45.5 Mesotrophic 42.290317 -87.941458
RND Murphysboro/Jackson 66.8 Eutrophic 37.773615 -89.380559
STO Napa Suwe/Lake 82.1 Hypereutrophic 42.287042 -88.124777
RNZO New Thompson/Jackson 60.1 Eutrophic 37.744167 -89.254722
RTUA Nippersink/Lake 72.1 Hypereutrophic 42.413060 -88.180559
RCC Olney East Fork/Richland 59.8 56.2 67.8 Eutrophic 51.0 38.761670 -88.076710
SDZW Ossami/Tazewell 61.3 75.1 62.6 Eutrophic 70.2 40.635586 -89.468316
RDF Otter/Macoupin 67.7 58.6 71.6 Eutrophic 75.0 39.408900 -89.911990

Appendix A: Table 4Page 15
Trophic State Indexes Based on the Representative Site
2013 VLMP Report
Lake
CodeLake/County TSI
SDTSI
TPTSI
CHL Trophic State TSITN Lat Lon
RCG Paradise/Coles 76.0 73.3 75.1 Hypereutrophic 82.8 39.413120 -88.439630
RBL Paris Twin East/Edgar 67.7 Eutrophic 39.630220 -87.677710
RBX Paris Twin West/Edgar 72.5 Hypereutrophic 39.635930 -87.694100
REL Petersburg/Menard 53.0 Eutrophic 39.988600 -89.850100
RPC Pierce/Winnebago 75.4 Hypereutrophic 42.345330 -88.985100
RNH Pinckneyville/Perry 62.3 73.5 Eutrophic 56.4 38.096670 -89.396671
RPZB Pine/Lee 60.0 Eutrophic 41.651800 -89.309500
RPZI Richardson Wildlife/Lee 65.7 Eutrophic 41.715388 -89.188098
RTH Round/Lake 51.5 Eutrophic 42.361671 -88.076671
RGM Sand/Lake 65.4 Eutrophic 42.412503 -88.043337
RCE Sara/Effingham 61.3 58.7 60.0 Eutrophic 51.5 39.126200 -88.618670
RTW Silver/McHenry 48.4 48.7 51.8 Mesotrophic 45.0 42.246650 -88.247460
RNZG Spring Arbor/Jackson 52.3 52.2 60.7 Eutrophic 53.0 37.650281 -89.168893
UGV Spring Ledge/Lake 50.1 54.6 50.6 Eutrophic 49.9 42.423260 -88.020624
RDR Spring/McDonough 69.8 76.1 71.5 Hypereutrophic 77.2 40.506660 -90.717570
REF Springfield/Sangamon 69.4 85.3 65.5 Eutrophic 78.2 39.756115 -89.593616
SGW Stephen/Will 58.1 76.8 69.5 Eutrophic 57.0 41.566400 -88.225981
RPI Summerset/Winnebago 53.5 53.2 53.5 Eutrophic 60.8 42.448600 -89.384900
REZN Sunset/Champaign 49.1 35.0 44.2 Mesotrophic 35.5 40.181900 -88.423200
RPL Sunset/Lee 62.1 Eutrophic 41.647900 -89.293700
UDH Sunset/Macoupin 66.5 73.5 65.5 Eutrophic 60.7 39.436400 -89.855400
RGZF Sylvan/Lake 61.9 59.4 63.1 Eutrophic 53.3 42.242147 -88.046133
REC Taylorville/Christian 67.1 86.2 63.6 Eutrophic 64.1 39.529448 -89.255838
RGW Third/Lake 48.6 Mesotrophic 42.370837 -88.014448
WTJ Three Oaks North/McHenry 36.0 20.0 29.7 Oligotrophic 57.2 42.223601 -88.302678
WTG Three Oaks South/McHenry 31.2 27.4 38.1 Oligotrophic 37.6 42.215852 -88.305410
RTZQ Timber/Lake 56.6 59.4 56.9 Eutrophic 57.1 42.240281 -88.127503
RTZF Tower/Lake 64.4 71.0 61.5 Eutrophic 58.0 42.228185 -88.152374
REZL Twin Oaks/Champaign 78.4 80.0 72.1 Hypereutrophic 65.3 40.213760 -88.375433
RGZM Valley/Lake 61.1 63.2 59.3 Eutrophic 53.5 42.349920 -87.982673
RBD Vermilion/Vermilion 65.7 70.8 71.3 Hypereutrophic 78.1 40.157400 -87.649100
RCA Vernor/Richland 56.6 74.8 23.8 Hypereutrophic 57.6 38.763790 -88.102500
SGB Virginia/Cook 34.2 Oligotrophic 42.146100 -87.945000
WGS Waterford/Lake 45.5 Mesotrophic 42.427200 -88.026400
RTZB West Loon/Lake 44.7 Mesotrophic 42.452781 -88.083338
RPZK Westlake/Winnebago 63.0 72.8 66.6 Hypereutrophic 69.2 42.316337 -89.284705
RTZC Wonder/McHenry 71.7 81.3 78.7 Hypereutrophic 66.5 42.375005 -88.354727
RPM Woodhaven/Lee 59.1 70.1 64.1 Eutrophic 58.2 41.656600 -89.306100
RTZZ Woods Creek/McHenry 60.1 60.8 62.0 Eutrophic 54.1 42.180490 -88.318880
RTS Zurich/Lake 48.1 Mesotrophic 42.195003 -88.098337
TSI Oligotrophic (Less than 40 TSI)
TSI Mesotrophic (40 to 50 TSI)
TSI Eutrophic (50 to 70 TSI)
TSI Hypereutrophic (70 amd Greater TSI)

Appendix A: Table 5aPage 16
Median Analytical Data from Tier II and III Lakes (S1 only) 2013 VLMP Report
Lake
CodeLake/County
Ammonia
(mg/L)
NO2/NO3
(mg/L)
TKN
(mg/L)
TP
(mg/L)
Alkalinity
(mg/L)
Chloride
(mg/L)
TSS
(mg/L)
VSS
(mg/L)
CHL-a, corr
(ug/L)
RCJ Altamont New/Effingham 0.11 0.082 0.91 0.152 54 10 7 16.6
RMJ Apple Canyon/Jo Daviess 0.02 0.055 0.94 0.046 180 7 8 42.7
RPJ Bass/Lee 0.02 1.830 1.34 0.086 170 16 14 49.7
REZG Bertinetti/Christian 0.03 0.959 1.38 0.138 110 18 11 53.7
SEB Bird's Pond/Sangamon* 0.08 0.057 0.77 0.083 155 7 6 17.8
RDO Bloomington/McLean 0.05 5.955 0.98 0.086 177.5 14 8 58.7
RCB Borah/Richland 0.02 0.055 1.41 0.091 0.8
SGC Buffalo Creek/Lake 0.03 0.055 1.01 0.080 153 182 11 9 19.3
RPV Candlewick/Boone 0.02 0.065 0.81 0.048 120 16 16 27.4
RDD Canton/Fulton 0.05 4.455 0.67 0.044 163 9 6 14.7
RNI Carbondale/Jackson 0.02 0.055 1.25 0.082 81 16 13
RNE Cedar/Jackson 0.02 0.055 0.67 0.016 41 4 4 8.2
RGR Charles/DuPage* 0.21 0.055 1.24 0.230 133 123 11 9 31.8
RBC Charleston SCR/Coles 0.02 0.055 1.53 0.099 140 22 13 70.8
WDK Civic/Grundy 0.04 0.055 0.28 0.005 128 4 4 1.8
VTZH Crystal/McHenry 0.15 0.099 0.71 0.016 185 103 4 4 16.2
REE Dawson/McLean 0.03 2.765 0.71 0.026 130 7 6 25.8
REA Decatur/Macon 0.05 9.760 0.95 0.109 201 19 9 40.7
WGZK Deep Quarry/DuPage 0.04 0.055 0.27 0.011 170 68 4 4 2.7
VTD Deep/Lake 0.04 0.055 0.64 0.019 158 214 5 4 6.2
RNJ Devil's Kitchen/Williamson 0.02 0.055 0.27 0.010 27 4 4
RGB Diamond/Lake 0.02 0.055 0.72 0.033 140 165 7 6 6.9
RGV Druce/Lake 0.02 0.055 0.49 0.010 133 322 5 4 5.6
SDA Evergreen/McLean 0.10 5.085 0.88 0.038 135 11 9 18.9
VTT Fischer/Lake 0.02 0.055 1.52 0.136 160 109 18 15 45.3
RGZG Forest/Lake 0.04 0.055 0.89 0.061 145 220 13 8 12.1
RMM Galena/Jo Daviess 0.05 0.055 0.65 0.038 195 7 6 15.6
ROP Governor Bond/Bond 0.02 0.055 1.06 0.160 100 15 13 56.3
RNZD Herrin Old/Williamson 0.07 0.055 0.42 0.026 34 4 6 15.5
ROZA Highland Silver/Madison 0.10 0.235 0.99 0.212 51 13 8 21.9
RBO Homer/Champaign 0.03 3.925 0.80 0.047 180 11 8 39.4
RTZU Honey/Lake 0.03 0.055 0.98 0.044 150 140 9 8 65.4

Appendix A: Table 5aPage 17
Median Analytical Data from Tier II and III Lakes (S1 only) 2013 VLMP Report
Lake
CodeLake/County
Ammonia
(mg/L)
NO2/NO3
(mg/L)
TKN
(mg/L)
TP
(mg/L)
Alkalinity
(mg/L)
Chloride
(mg/L)
TSS
(mg/L)
VSS
(mg/L)
CHL-a, corr
(ug/L)
RTZV Killarney/McHenry 0.07 0.055 0.63 0.018 200 184 4 4 3.8
REG Lake of the Woods/Champaign 0.02 0.055 0.75 0.039 175 12 9 25.8
VGI Leopold/Lake 0.07 0.055 0.57 0.029 165 183 4 4 7.0
RGU Loch Lomond/Lake 0.03 0.055 1.72 0.136 148 144 17 15 49.9
RTJ Long/Lake 0.02 0.057 1.22 0.089 173 152 14 9 47.0
RHZK Longmeadow/Cook* 0.43 0.061 0.73 0.073 233 57 7 6 25.3
RCF Mattoon/Shelby 0.02 1.364 1.12 0.110 110 15 11 46.9
RNZI Miller/Jefferson 0.02 0.055 0.96 0.057 50 8 8 39.5
RGZD Miltmore/Lake 0.04 0.055 0.72 0.017 143 230 5 5 3.4
RCC Olney East Fork/Richland 0.04 0.055 0.73 0.037 44.3
SDZW Ossami/Tazewell* 0.06 1.553 1.43 0.137 175 13 10 26.1
RDF Otter/Macoupin 0.02 2.785 1.37 0.044 83 12 12 65.2
RCG Paradise/Coles 0.02 5.805 1.33 0.121 145 15 11 93.7
RNH Pinckneyville/Perry 0.02 0.055 1.09 0.123 100 12 11
RCE Sara/Effingham 0.02 0.055 0.76 0.044 100 7 6 20.0
RTW Silver/McHenry 0.04 0.055 0.47 0.022 195 193 7 6 8.7
RNZG Spring Arbor/Jackson 0.06 0.055 0.85 0.028 70 4 4 21.6
UGV Spring Ledge/Lake* 0.02 0.055 0.68 0.033 153 237 5 5 7.7
RDR Spring/McDonough 0.02 3.480 1.37 0.147 115 16 12 64.7
REF Springfield/Sangamon 0.02 4.600 0.80 0.278 130 11 7 35.1
SGW Stephen/Will* 0.33 0.065 1.13 0.154 248 183 13 10 53.0
RPI Summerset/Winnebago 0.07 0.844 0.71 0.030 185 4 4 10.3
REZN Sunset/Champaign 0.02 0.055 0.21 0.009 133 5 4 4.0
UDH Sunset/Macoupin 0.02 0.739 0.80 0.123 96 13 9 35.1
RGZF Sylvan/Lake 0.04 0.055 0.87 0.046 145 124 14 10 27.5
REC Taylorville/Christian 0.03 0.978 0.98 0.297 148 20 10 28.8
WTJ Three Oaks North/McHenry 0.02 1.020 0.19 0.003 200 335 4 4 0.9
WTG Three Oaks South/McHenry 0.02 0.055 0.26 0.005 170 349 4 4 2.1
RTZQ Timber/Lake 0.03 0.140 1.07 0.046 163 98 5 5 14.5
RTZF Tower/Lake 0.06 0.055 1.23 0.103 190 104 12 9 23.3
REZL Twin Oaks/Champaign* 0.02 0.055 2.07 0.192 128 31 21 68.4
RGZM Valley/Lake* 0.12 0.055 0.88 0.060 190 232 7 7 18.7

Appendix A: Table 5aPage 18
Median Analytical Data from Tier II and III Lakes (S1 only) 2013 VLMP Report
Lake
CodeLake/County
Ammonia
(mg/L)
NO2/NO3
(mg/L)
TKN
(mg/L)
TP
(mg/L)
Alkalinity
(mg/L)
Chloride
(mg/L)
TSS
(mg/L)
VSS
(mg/L)
CHL-a, corr
(ug/L)
RBD Vermilion/Vermilion 0.02 3.740 1.41 0.102 170 15 11 63.5
RCA Vernor/Richland 0.02 0.055 1.19 0.134 0.5
RPZK Westlake/Winnebago 0.06 1.610 1.18 0.117 180 15 13 39.1
RTZC Wonder/McHenry 0.04 0.202 2.11 0.210 185 80 31 23 135.0
RPM Woodhaven/Lee 0.05 0.055 1.24 0.097 140 13 12 30.4
RTZZ Woods Creek/McHenry 0.02 0.055 0.92 0.051 170 140 11 10 24.7
At least one sample comprising the TP data was over 0.05 mg/L
At or below Method Detection Limit (MDL) or the Reporting Limit (RL)
RED Median value is over WQS.
Over the acute benchmark of for protection of sensitive aquatic animals. Not a WQS.
Over the chronic benchmark for protection of sensitive aquatic animals. Not a WQS.
* Lake with less than 20 acres of surface area.
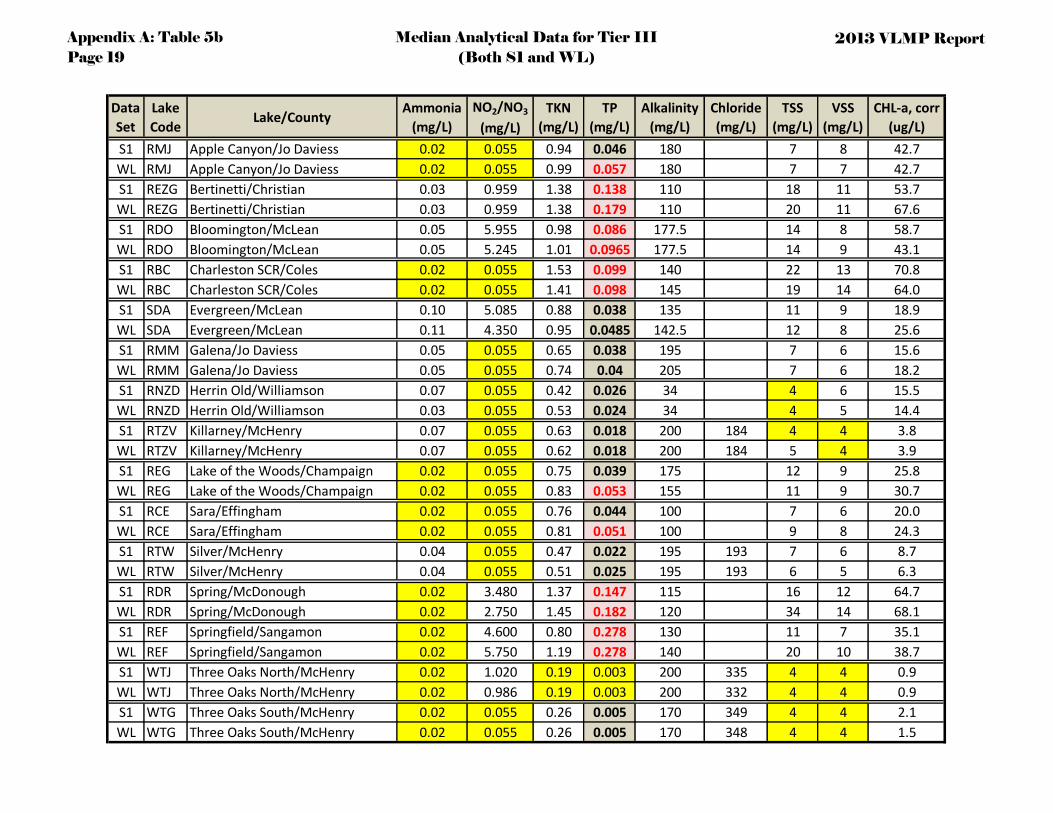
Appendix A: Table 5bPage 19
Median Analytical Data for Tier III(Both S1 and WL)
2013 VLMP Report
Data
Set
Lake
CodeLake/County
Ammonia
(mg/L)
NO2/NO3
(mg/L)
TKN
(mg/L)
TP
(mg/L)
Alkalinity
(mg/L)
Chloride
(mg/L)
TSS
(mg/L)
VSS
(mg/L)
CHL-a, corr
(ug/L)
S1 RMJ Apple Canyon/Jo Daviess 0.02 0.055 0.94 0.046 180 7 8 42.7
WL RMJ Apple Canyon/Jo Daviess 0.02 0.055 0.99 0.057 180 7 7 42.7
S1 REZG Bertinetti/Christian 0.03 0.959 1.38 0.138 110 18 11 53.7
WL REZG Bertinetti/Christian 0.03 0.959 1.38 0.179 110 20 11 67.6
S1 RDO Bloomington/McLean 0.05 5.955 0.98 0.086 177.5 14 8 58.7
WL RDO Bloomington/McLean 0.05 5.245 1.01 0.0965 177.5 14 9 43.1
S1 RBC Charleston SCR/Coles 0.02 0.055 1.53 0.099 140 22 13 70.8
WL RBC Charleston SCR/Coles 0.02 0.055 1.41 0.098 145 19 14 64.0
S1 SDA Evergreen/McLean 0.10 5.085 0.88 0.038 135 11 9 18.9
WL SDA Evergreen/McLean 0.11 4.350 0.95 0.0485 142.5 12 8 25.6
S1 RMM Galena/Jo Daviess 0.05 0.055 0.65 0.038 195 7 6 15.6
WL RMM Galena/Jo Daviess 0.05 0.055 0.74 0.04 205 7 6 18.2
S1 RNZD Herrin Old/Williamson 0.07 0.055 0.42 0.026 34 4 6 15.5
WL RNZD Herrin Old/Williamson 0.03 0.055 0.53 0.024 34 4 5 14.4
S1 RTZV Killarney/McHenry 0.07 0.055 0.63 0.018 200 184 4 4 3.8
WL RTZV Killarney/McHenry 0.07 0.055 0.62 0.018 200 184 5 4 3.9
S1 REG Lake of the Woods/Champaign 0.02 0.055 0.75 0.039 175 12 9 25.8
WL REG Lake of the Woods/Champaign 0.02 0.055 0.83 0.053 155 11 9 30.7
S1 RCE Sara/Effingham 0.02 0.055 0.76 0.044 100 7 6 20.0
WL RCE Sara/Effingham 0.02 0.055 0.81 0.051 100 9 8 24.3
S1 RTW Silver/McHenry 0.04 0.055 0.47 0.022 195 193 7 6 8.7
WL RTW Silver/McHenry 0.04 0.055 0.51 0.025 195 193 6 5 6.3
S1 RDR Spring/McDonough 0.02 3.480 1.37 0.147 115 16 12 64.7
WL RDR Spring/McDonough 0.02 2.750 1.45 0.182 120 34 14 68.1
S1 REF Springfield/Sangamon 0.02 4.600 0.80 0.278 130 11 7 35.1
WL REF Springfield/Sangamon 0.02 5.750 1.19 0.278 140 20 10 38.7
S1 WTJ Three Oaks North/McHenry 0.02 1.020 0.19 0.003 200 335 4 4 0.9
WL WTJ Three Oaks North/McHenry 0.02 0.986 0.19 0.003 200 332 4 4 0.9
S1 WTG Three Oaks South/McHenry 0.02 0.055 0.26 0.005 170 349 4 4 2.1
WL WTG Three Oaks South/McHenry 0.02 0.055 0.26 0.005 170 348 4 4 1.5

Appendix A: Table 5bPage 20
Median Analytical Data for Tier III(Both S1 and WL)
2013 VLMP Report
At or below Method Detection Limit (MDL) or if MDL is not available, the Reporting Limit (RL).
At least one value over WQS.
RED Median value is over WQS.
S1 Data set using Tier III site 1 data only.
WL Data set using all Tier III surface data.
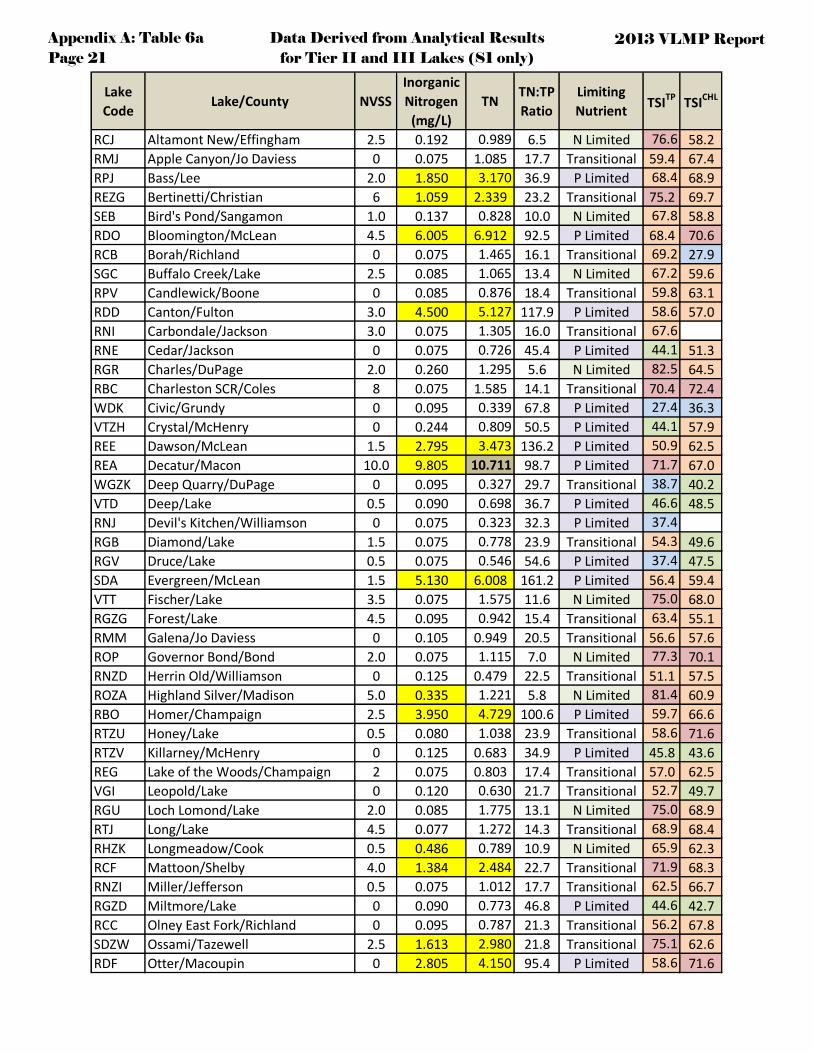
Appendix A: Table 6aPage 21
Data Derived from Analytical Results for Tier II and III Lakes (S1 only)
2013 VLMP Report
Lake
CodeLake/County NVSS
Inorganic
Nitrogen
(mg/L)
TNTN:TP
Ratio
Limiting
NutrientTSI
TPTSI
CHL
RCJ Altamont New/Effingham 2.5 0.192 0.989 6.5 N Limited 76.6 58.2
RMJ Apple Canyon/Jo Daviess 0 0.075 1.085 17.7 Transitional 59.4 67.4
RPJ Bass/Lee 2.0 1.850 3.170 36.9 P Limited 68.4 68.9
REZG Bertinetti/Christian 6 1.059 2.339 23.2 Transitional 75.2 69.7
SEB Bird's Pond/Sangamon 1.0 0.137 0.828 10.0 N Limited 67.8 58.8
RDO Bloomington/McLean 4.5 6.005 6.912 92.5 P Limited 68.4 70.6
RCB Borah/Richland 0 0.075 1.465 16.1 Transitional 69.2 27.9
SGC Buffalo Creek/Lake 2.5 0.085 1.065 13.4 N Limited 67.2 59.6
RPV Candlewick/Boone 0 0.085 0.876 18.4 Transitional 59.8 63.1
RDD Canton/Fulton 3.0 4.500 5.127 117.9 P Limited 58.6 57.0
RNI Carbondale/Jackson 3.0 0.075 1.305 16.0 Transitional 67.6
RNE Cedar/Jackson 0 0.075 0.726 45.4 P Limited 44.1 51.3
RGR Charles/DuPage 2.0 0.260 1.295 5.6 N Limited 82.5 64.5
RBC Charleston SCR/Coles 8 0.075 1.585 14.1 Transitional 70.4 72.4
WDK Civic/Grundy 0 0.095 0.339 67.8 P Limited 27.4 36.3
VTZH Crystal/McHenry 0 0.244 0.809 50.5 P Limited 44.1 57.9
REE Dawson/McLean 1.5 2.795 3.473 136.2 P Limited 50.9 62.5
REA Decatur/Macon 10.0 9.805 10.711 98.7 P Limited 71.7 67.0
WGZK Deep Quarry/DuPage 0 0.095 0.327 29.7 Transitional 38.7 40.2
VTD Deep/Lake 0.5 0.090 0.698 36.7 P Limited 46.6 48.5
RNJ Devil's Kitchen/Williamson 0 0.075 0.323 32.3 P Limited 37.4
RGB Diamond/Lake 1.5 0.075 0.778 23.9 Transitional 54.3 49.6
RGV Druce/Lake 0.5 0.075 0.546 54.6 P Limited 37.4 47.5
SDA Evergreen/McLean 1.5 5.130 6.008 161.2 P Limited 56.4 59.4
VTT Fischer/Lake 3.5 0.075 1.575 11.6 N Limited 75.0 68.0
RGZG Forest/Lake 4.5 0.095 0.942 15.4 Transitional 63.4 55.1
RMM Galena/Jo Daviess 0 0.105 0.949 20.5 Transitional 56.6 57.6
ROP Governor Bond/Bond 2.0 0.075 1.115 7.0 N Limited 77.3 70.1
RNZD Herrin Old/Williamson 0 0.125 0.479 22.5 Transitional 51.1 57.5
ROZA Highland Silver/Madison 5.0 0.335 1.221 5.8 N Limited 81.4 60.9
RBO Homer/Champaign 2.5 3.950 4.729 100.6 P Limited 59.7 66.6
RTZU Honey/Lake 0.5 0.080 1.038 23.9 Transitional 58.6 71.6
RTZV Killarney/McHenry 0 0.125 0.683 34.9 P Limited 45.8 43.6
REG Lake of the Woods/Champaign 2 0.075 0.803 17.4 Transitional 57.0 62.5
VGI Leopold/Lake 0 0.120 0.630 21.7 Transitional 52.7 49.7
RGU Loch Lomond/Lake 2.0 0.085 1.775 13.1 N Limited 75.0 68.9
RTJ Long/Lake 4.5 0.077 1.272 14.3 Transitional 68.9 68.4
RHZK Longmeadow/Cook 0.5 0.486 0.789 10.9 N Limited 65.9 62.3
RCF Mattoon/Shelby 4.0 1.384 2.484 22.7 Transitional 71.9 68.3
RNZI Miller/Jefferson 0.5 0.075 1.012 17.7 Transitional 62.5 66.7
RGZD Miltmore/Lake 0 0.090 0.773 46.8 P Limited 44.6 42.7
RCC Olney East Fork/Richland 0 0.095 0.787 21.3 Transitional 56.2 67.8
SDZW Ossami/Tazewell 2.5 1.613 2.980 21.8 Transitional 75.1 62.6
RDF Otter/Macoupin 0 2.805 4.150 95.4 P Limited 58.6 71.6

Appendix A: Table 6aPage 22
Data Derived from Analytical Results for Tier II and III Lakes (S1 only)
2013 VLMP Report
Lake
CodeLake/County NVSS
Inorganic
Nitrogen
(mg/L)
TNTN:TP
Ratio
Limiting
NutrientTSI
TPTSI
CHL
RCG Paradise/Coles 4.0 5.825 7.130 58.9 P Limited 73.3 75.1
RNH Pinckneyville/Perry 0.5 0.075 1.145 9.3 N Limited 73.5
RCE Sara/Effingham 0 0.075 0.817 17.4 Transitional 58.7 60.0
RTW Silver/McHenry 0 0.095 0.520 26.7 Transitional 48.7 51.8
RNZG Spring Arbor/Jackson 0 0.110 0.907 32.4 P Limited 52.2 60.7
UGV Spring Ledge/Lake 0 0.075 0.732 22.2 Transitional 54.6 50.6
RDR Spring/McDonough 2 3.500 4.850 34.1 P Limited 76.1 71.5
REF Springfield/Sangamon 4 4.620 5.203 18.7 Transitional 85.3 65.5
SGW Stephen/Will 3.5 0.395 1.190 7.7 N Limited 76.8 69.5
RPI Summerset/Winnebago 0 0.914 1.550 51.7 P Limited 53.2 53.5
REZN Sunset/Champaign 0.5 0.075 0.269 31.6 P Limited 35.0 44.2
UDH Sunset/Macoupin 4.0 0.759 1.539 12.5 N Limited 73.5 65.5
RGZF Sylvan/Lake 3.5 0.090 0.922 20.0 Transitional 59.4 63.1
REC Taylorville/Christian 10.0 1.003 1.957 6.6 N Limited 86.2 63.6
WTJ Three Oaks North/McHenry 0 1.040 1.210 403.3 P Limited 20.0 29.7
WTG Three Oaks South/McHenry 0 0.095 0.312 74.8 P Limited 27.4 38.1
RTZQ Timber/Lake 0 0.170 1.205 26.2 Transitional 59.4 56.9
RTZF Tower/Lake 3.0 0.110 1.280 12.4 N Limited 71.0 61.5
REZL Twin Oaks/Champaign 9.5 0.075 2.120 11.0 N Limited 80.0 72.1
RGZM Valley/Lake 0.5 0.175 0.936 15.6 Transitional 63.2 59.3
RBD Vermilion/Vermilion 4.0 3.760 5.150 50.5 P Limited 70.8 71.3
RCA Vernor/Richland 0 0.075 1.245 9.3 N Limited 74.8 23.8
RPZK Westlake/Winnebago 2.0 1.665 2.785 23.9 Transitional 72.8 66.6
RTZC Wonder/McHenry 8.5 0.242 2.312 11.0 N Limited 81.3 78.7
RPM Woodhaven/Lee 1.0 0.105 1.295 13.4 N Limited 70.1 64.1
RTZZ Woods Creek/McHenry 1.0 0.075 0.978 19.2 Transitional 60.8 62.0
Levels considered high enough to proove harmful to aquatic mammals.
Levels considered high enough to readily stimulate algal blooms.
TSI Oligotrophic (Less than 40 TSI)
TSI Mesotrophic (40 to 50 TSI)
TSI Eutrophic (50 to 70 TSI)
TSI Hypereutrophic (70 amd Greater TSI)
S1 Data set using Tier III site 1 data only.

Appendix A: Table 6bPage 23
Data Derived from Analytical Results for Tier III (Both WL and S1)
2013 VLMP Report
Data
Set
Lake
CodeLake/County NVSS
Inorganic
Nitrogen
(mg/L)
TNTN:TP
Ratio
Limiting
NutrientTSI
TP TSICHL
S1 RMJ Apple Canyon/Jo Daviess 0 0.075 1.085 17.7 Transitional 59.4 67.4
WL RMJ Apple Canyon/Jo Daviess 0 0.165 1.145 19.7 Transitional 62.5 67.4
S1 REZG Bertinetti/Christian 6 1.059 2.339 23.2 Transitional 75.2 69.7
WL REZG Bertinetti/Christian 7 1.053 2.253 21.4 Transitional 79.0 71.9
S1 RDO Bloomington/McLean 4.5 6.005 6.912 92.5 P Limited 68.4 70.6
WL RDO Bloomington/McLean 5 5.295 6.425 76.2 P Limited 70.0 67.5
S1 RBC Charleston SCR/Coles 8 0.075 1.585 14.1 Transitional 70.4 72.4
WL RBC Charleston SCR/Coles 4 0.082 1.466 15.2 Transitional 70.3 71.4
S1 SDA Evergreen/McLean 1.5 5.130 6.008 161.2 P Limited 56.4 59.4
WL SDA Evergreen/McLean 2.5 4.395 5.340 99.7 P Limited 60.1 62.4
S1 RMM Galena/Jo Daviess 0 0.105 0.949 20.5 Transitional 56.6 57.6
WL RMM Galena/Jo Daviess 1 0.105 0.874 18.6 Transitional 57.3 59.1
S1 RNZD Herrin Old/Williamson 0 0.125 0.479 22.5 Transitional 51.1 57.5
WL RNZD Herrin Old/Williamson 0 0.085 0.586 21.4 Transitional 50.0 56.8
S1 RTZV Killarney/McHenry 0 0.125 0.683 34.9 P Limited 45.8 43.6
WL RTZV Killarney/McHenry 0 0.125 0.678 37.0 P Limited 45.8 43.9
S1 REG Lake of the Woods/Champaign 2 0.075 0.803 17.4 Transitional 57.0 62.5
WL REG Lake of the Woods/Champaign 2 0.075 0.888 16.3 Transitional 61.4 64.2
S1 RCE Sara/Effingham 0 0.075 0.817 17.4 Transitional 58.7 60.0
WL RCE Sara/Effingham 1 0.075 0.954 17.4 Transitional 60.8 61.9
S1 RTW Silver/McHenry 0 0.095 0.520 26.7 Transitional 48.7 51.8
WL RTW Silver/McHenry 0 0.095 0.568 23.9 Transitional 50.6 48.7
S1 RDR Spring/McDonough 2 3.500 4.850 34.1 P Limited 76.1 71.5
WL RDR Spring/McDonough 19 2.770 4.480 24.6 Transitional 79.2 72.0
S1 REF Springfield/Sangamon 4 4.620 5.203 18.7 Transitional 85.3 65.5
WL REF Springfield/Sangamon 13 5.770 6.404 24.1 Transitional 85.3 66.5
S1 WTJ Three Oaks North/McHenry 0 1.040 1.210 403.3 P Limited 20.0 29.7
WL WTJ Three Oaks North/McHenry 0 1.006 1.176 373.7 P Limited 20.0 29.5
S1 WTG Three Oaks South/McHenry 0 0.095 0.312 74.8 P Limited 27.4 38.1
WL WTG Three Oaks South/McHenry 0 0.094 0.318 63.6 P Limited 27.4 34.4
Levels considered high enough to readily stimulate algal blooms.
Levels considered high enough to proove harmful to aquatic mammals.
TSI Oligotrophic (Less than 40 TSI)
TSI Mesotrophic (40 to 50 TSI)
TSI Eutrophic (50 to 70 TSI)
TSI Hypereutrophic (70 amd Greater TSI)
S1 Data set using Tier III site 1 data only.
WL Data set using all Tier III data.
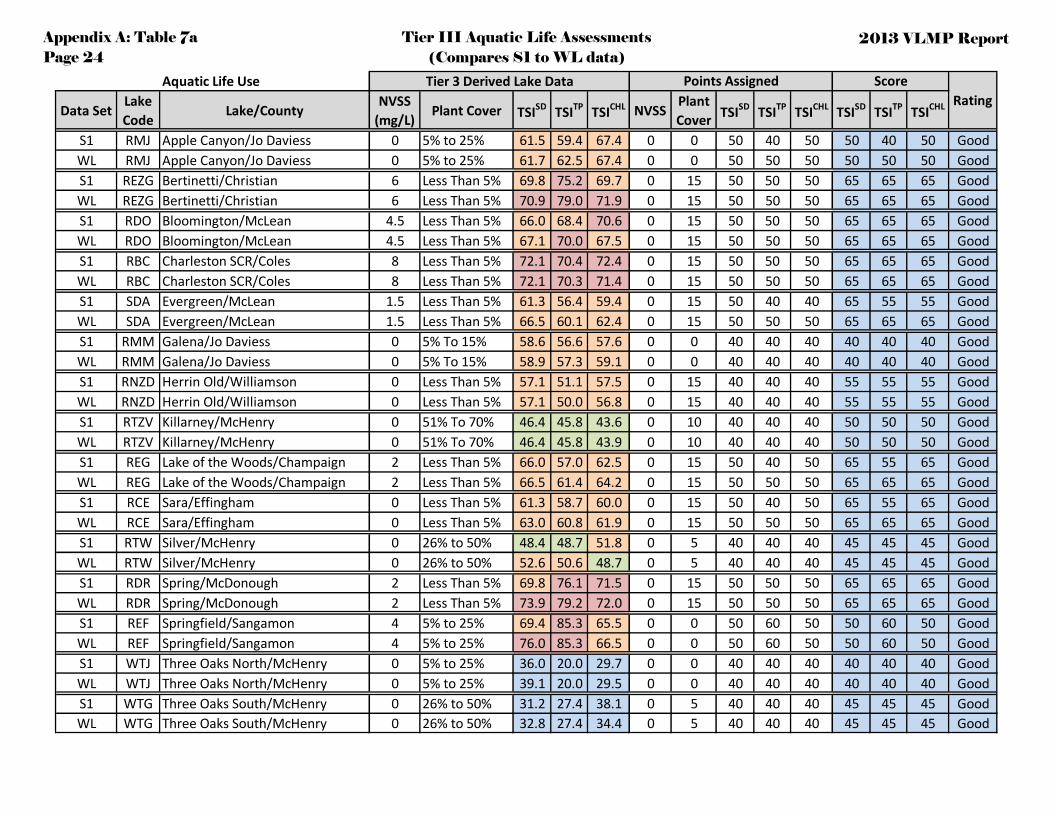
Appendix A: Table 7aPage 24
Tier III Aquatic Life Assessments (Compares S1 to WL data)
2013 VLMP Report
Aquatic Life Use
Data SetLake
CodeLake/County
NVSS
(mg/L)Plant Cover TSISD TSITP TSICHL NVSS
Plant
CoverTSISD TSITP TSICHL TSISD TSITP TSICHL
S1 RMJ Apple Canyon/Jo Daviess 0 5% to 25% 61.5 59.4 67.4 0 0 50 40 50 50 40 50 Good
WL RMJ Apple Canyon/Jo Daviess 0 5% to 25% 61.7 62.5 67.4 0 0 50 50 50 50 50 50 Good
S1 REZG Bertinetti/Christian 6 Less Than 5% 69.8 75.2 69.7 0 15 50 50 50 65 65 65 Good
WL REZG Bertinetti/Christian 6 Less Than 5% 70.9 79.0 71.9 0 15 50 50 50 65 65 65 Good
S1 RDO Bloomington/McLean 4.5 Less Than 5% 66.0 68.4 70.6 0 15 50 50 50 65 65 65 Good
WL RDO Bloomington/McLean 4.5 Less Than 5% 67.1 70.0 67.5 0 15 50 50 50 65 65 65 Good
S1 RBC Charleston SCR/Coles 8 Less Than 5% 72.1 70.4 72.4 0 15 50 50 50 65 65 65 Good
WL RBC Charleston SCR/Coles 8 Less Than 5% 72.1 70.3 71.4 0 15 50 50 50 65 65 65 Good
S1 SDA Evergreen/McLean 1.5 Less Than 5% 61.3 56.4 59.4 0 15 50 40 40 65 55 55 Good
WL SDA Evergreen/McLean 1.5 Less Than 5% 66.5 60.1 62.4 0 15 50 50 50 65 65 65 Good
S1 RMM Galena/Jo Daviess 0 5% To 15% 58.6 56.6 57.6 0 0 40 40 40 40 40 40 Good
WL RMM Galena/Jo Daviess 0 5% To 15% 58.9 57.3 59.1 0 0 40 40 40 40 40 40 Good
S1 RNZD Herrin Old/Williamson 0 Less Than 5% 57.1 51.1 57.5 0 15 40 40 40 55 55 55 Good
WL RNZD Herrin Old/Williamson 0 Less Than 5% 57.1 50.0 56.8 0 15 40 40 40 55 55 55 Good
S1 RTZV Killarney/McHenry 0 51% To 70% 46.4 45.8 43.6 0 10 40 40 40 50 50 50 Good
WL RTZV Killarney/McHenry 0 51% To 70% 46.4 45.8 43.9 0 10 40 40 40 50 50 50 Good
S1 REG Lake of the Woods/Champaign 2 Less Than 5% 66.0 57.0 62.5 0 15 50 40 50 65 55 65 Good
WL REG Lake of the Woods/Champaign 2 Less Than 5% 66.5 61.4 64.2 0 15 50 50 50 65 65 65 Good
S1 RCE Sara/Effingham 0 Less Than 5% 61.3 58.7 60.0 0 15 50 40 50 65 55 65 Good
WL RCE Sara/Effingham 0 Less Than 5% 63.0 60.8 61.9 0 15 50 50 50 65 65 65 Good
S1 RTW Silver/McHenry 0 26% to 50% 48.4 48.7 51.8 0 5 40 40 40 45 45 45 Good
WL RTW Silver/McHenry 0 26% to 50% 52.6 50.6 48.7 0 5 40 40 40 45 45 45 Good
S1 RDR Spring/McDonough 2 Less Than 5% 69.8 76.1 71.5 0 15 50 50 50 65 65 65 Good
WL RDR Spring/McDonough 2 Less Than 5% 73.9 79.2 72.0 0 15 50 50 50 65 65 65 Good
S1 REF Springfield/Sangamon 4 5% to 25% 69.4 85.3 65.5 0 0 50 60 50 50 60 50 Good
WL REF Springfield/Sangamon 4 5% to 25% 76.0 85.3 66.5 0 0 50 60 50 50 60 50 Good
S1 WTJ Three Oaks North/McHenry 0 5% to 25% 36.0 20.0 29.7 0 0 40 40 40 40 40 40 Good
WL WTJ Three Oaks North/McHenry 0 5% to 25% 39.1 20.0 29.5 0 0 40 40 40 40 40 40 Good
S1 WTG Three Oaks South/McHenry 0 26% to 50% 31.2 27.4 38.1 0 5 40 40 40 45 45 45 Good
WL WTG Three Oaks South/McHenry 0 26% to 50% 32.8 27.4 34.4 0 5 40 40 40 45 45 45 Good
Rating
Tier 3 Derived Lake Data Points Assigned Score

Appendix A: Table 7aPage 25
Tier III Aquatic Life Assessments (Compares S1 to WL data)
2013 VLMP Report
TSI Oligotrophic (Less than 40 TSI) Good Aquatic Life Rating - Good - Less than 75
TSI Mesotrophic (40 to 50 TSI) Fair Aquatic Life Rating - Fair - 75 to 95
TSI Eutrophic (50 to 70 TSI) Poor Aquatic Life Rating - Poor - 95 or greater
TSI Hypereutrophic (70 or greater TSI)
S1 Data set using Tier III site 1 data only.
WL Data set using all Tier III data.
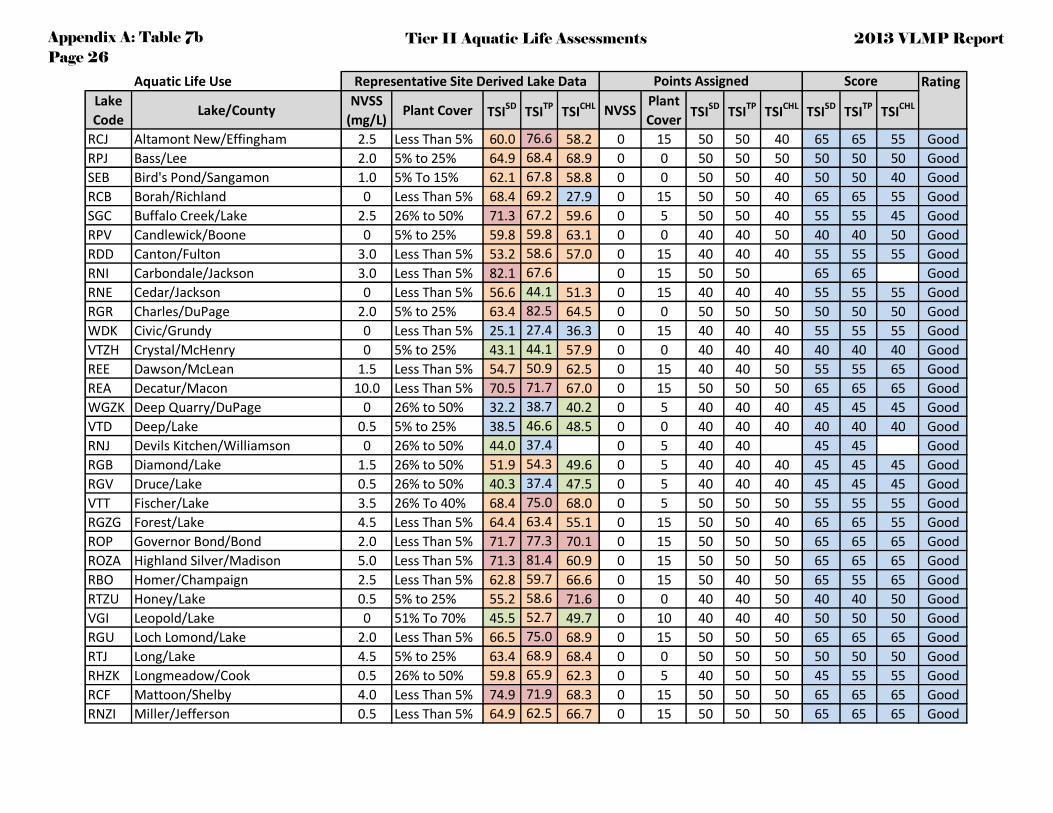
Appendix A: Table 7bPage 26
Tier II Aquatic Life Assessments 2013 VLMP Report
Aquatic Life Use Rating
Lake
CodeLake/County
NVSS
(mg/L)Plant Cover TSISD TSITP TSICHL NVSS
Plant
CoverTSISD TSITP TSICHL TSISD TSITP TSICHL
RCJ Altamont New/Effingham 2.5 Less Than 5% 60.0 76.6 58.2 0 15 50 50 40 65 65 55 Good
RPJ Bass/Lee 2.0 5% to 25% 64.9 68.4 68.9 0 0 50 50 50 50 50 50 Good
SEB Bird's Pond/Sangamon 1.0 5% To 15% 62.1 67.8 58.8 0 0 50 50 40 50 50 40 Good
RCB Borah/Richland 0 Less Than 5% 68.4 69.2 27.9 0 15 50 50 40 65 65 55 Good
SGC Buffalo Creek/Lake 2.5 26% to 50% 71.3 67.2 59.6 0 5 50 50 40 55 55 45 Good
RPV Candlewick/Boone 0 5% to 25% 59.8 59.8 63.1 0 0 40 40 50 40 40 50 Good
RDD Canton/Fulton 3.0 Less Than 5% 53.2 58.6 57.0 0 15 40 40 40 55 55 55 Good
RNI Carbondale/Jackson 3.0 Less Than 5% 82.1 67.6 0 15 50 50 65 65 Good
RNE Cedar/Jackson 0 Less Than 5% 56.6 44.1 51.3 0 15 40 40 40 55 55 55 Good
RGR Charles/DuPage 2.0 5% to 25% 63.4 82.5 64.5 0 0 50 50 50 50 50 50 Good
WDK Civic/Grundy 0 Less Than 5% 25.1 27.4 36.3 0 15 40 40 40 55 55 55 Good
VTZH Crystal/McHenry 0 5% to 25% 43.1 44.1 57.9 0 0 40 40 40 40 40 40 Good
REE Dawson/McLean 1.5 Less Than 5% 54.7 50.9 62.5 0 15 40 40 50 55 55 65 Good
REA Decatur/Macon 10.0 Less Than 5% 70.5 71.7 67.0 0 15 50 50 50 65 65 65 Good
WGZK Deep Quarry/DuPage 0 26% to 50% 32.2 38.7 40.2 0 5 40 40 40 45 45 45 Good
VTD Deep/Lake 0.5 5% to 25% 38.5 46.6 48.5 0 0 40 40 40 40 40 40 Good
RNJ Devils Kitchen/Williamson 0 26% to 50% 44.0 37.4 0 5 40 40 45 45 Good
RGB Diamond/Lake 1.5 26% to 50% 51.9 54.3 49.6 0 5 40 40 40 45 45 45 Good
RGV Druce/Lake 0.5 26% to 50% 40.3 37.4 47.5 0 5 40 40 40 45 45 45 Good
VTT Fischer/Lake 3.5 26% To 40% 68.4 75.0 68.0 0 5 50 50 50 55 55 55 Good
RGZG Forest/Lake 4.5 Less Than 5% 64.4 63.4 55.1 0 15 50 50 40 65 65 55 Good
ROP Governor Bond/Bond 2.0 Less Than 5% 71.7 77.3 70.1 0 15 50 50 50 65 65 65 Good
ROZA Highland Silver/Madison 5.0 Less Than 5% 71.3 81.4 60.9 0 15 50 50 50 65 65 65 Good
RBO Homer/Champaign 2.5 Less Than 5% 62.8 59.7 66.6 0 15 50 40 50 65 55 65 Good
RTZU Honey/Lake 0.5 5% to 25% 55.2 58.6 71.6 0 0 40 40 50 40 40 50 Good
VGI Leopold/Lake 0 51% To 70% 45.5 52.7 49.7 0 10 40 40 40 50 50 50 Good
RGU Loch Lomond/Lake 2.0 Less Than 5% 66.5 75.0 68.9 0 15 50 50 50 65 65 65 Good
RTJ Long/Lake 4.5 5% to 25% 63.4 68.9 68.4 0 0 50 50 50 50 50 50 Good
RHZK Longmeadow/Cook 0.5 26% to 50% 59.8 65.9 62.3 0 5 40 50 50 45 55 55 Good
RCF Mattoon/Shelby 4.0 Less Than 5% 74.9 71.9 68.3 0 15 50 50 50 65 65 65 Good
RNZI Miller/Jefferson 0.5 Less Than 5% 64.9 62.5 66.7 0 15 50 50 50 65 65 65 Good
Representative Site Derived Lake Data Points Assigned Score

Appendix A: Table 7bPage 27
Tier II Aquatic Life Assessments 2013 VLMP Report
Aquatic Life Use Rating
Lake
CodeLake/County
NVSS
(mg/L)Plant Cover TSISD TSITP TSICHL NVSS
Plant
CoverTSISD TSITP TSICHL TSISD TSITP TSICHL
Representative Site Derived Lake Data Points Assigned Score
RGZD Miltmore/Lake 0 51% To 70% 46.7 44.6 42.7 0 10 40 40 40 50 50 50 Good
RCC Olney East Fork/Richland 0 Less Than 5% 59.8 56.2 67.8 0 15 40 40 50 55 55 65 Good
SDZW Ossami/Tazewell 2.5 51% To 70% 61.3 75.1 62.6 0 10 50 50 50 60 60 60 Good
RDF Otter/Macoupin 0 Less Than 5% 67.7 58.6 71.6 0 15 50 40 50 65 55 65 Good
RCG Paradise/Coles 4.0 Less Than 5% 76.0 73.3 75.1 0 15 50 50 50 65 65 65 Good
RNH Pinckneyville/Perry 0.5 Less Than 5% 62.3 73.5 0 15 50 50 65 65 Good
RNZG Spring Arbor/Jackson 0 Less Than 5% 52.3 52.2 60.7 0 15 40 40 50 55 55 65 Good
UGV Spring Ledge/Lake 0 51% To 70% 50.1 54.6 50.6 0 10 40 40 40 50 50 50 Good
SGW Stephen/Will 3.5 5% to 25% 58.1 76.8 69.5 0 0 40 50 50 40 50 50 Good
RPI Summerset/Winnebago 0 Less Than 5% 53.5 53.2 53.5 0 15 40 40 40 55 55 55 Good
REZN Sunset/Champaign 0.5 Less Than 5% 49.1 35.0 44.2 0 15 40 40 40 55 55 55 Good
UDH Sunset/Macoupin 4.0 Less Than 5% 66.5 73.5 65.5 0 15 50 50 50 65 65 65 Good
RGZF Sylvan/Lake 3.5 Less Than 5% 61.9 59.4 63.1 0 15 50 40 50 65 55 65 Good
REC Taylorville/Christian 10.0 Less Than 5% 67.1 86.2 63.6 0 15 50 60 50 65 75 65 Good
RTZQ Timber/Lake 0 5% to 25% 56.6 59.4 56.9 0 0 40 40 40 40 40 40 Good
RTZF Tower/Lake 3.0 5% to 25% 64.4 71.0 61.5 0 0 50 50 50 50 50 50 Good
REZL Twin Oaks/Champaign 9.5 Less Than 5% 78.4 80.0 72.1 0 15 50 50 50 65 65 65 Good
RGZM Valley/Lake 0.5 5% to 25% 61.1 63.2 59.3 0 0 50 50 40 50 50 40 Good
RBD Vermilion/Vermilion 4.0 5% To 15% 65.7 70.8 71.3 0 0 50 50 50 50 50 50 Good
RCA Vernor/Richland 0 Less Than 5% 56.6 74.8 23.8 0 15 40 50 40 55 65 55 Good
RPZK Westlake/Winnebago 2.0 Less Than 5% 65.7 72.8 66.6 0 15 50 50 50 65 65 65 Good
RTZC Wonder/McHenry 8.5 Less Than 5% 71.7 81.3 78.7 0 15 50 50 50 65 65 65 Good
RPM Woodhaven/Lee 1.0 5% To 15% 59.1 70.1 64.1 0 0 40 50 50 40 50 50 Good
RTZZ Woods Creek/McHenry 1.0 Less Than 5% 60.1 60.8 62.0 0 15 50 50 50 65 65 65 Good
TSI Oligotrophic (Less than 40 TSI) Good Aquatic Life Rating - Good - Less than 75
TSI Mesotrophic (40 to 50 TSI) Fair Aquatic Life Rating - Fair - 75 to 95
TSI Eutrophic (50 to 70 TSI) Poor Aquatic Life Rating - Poor - 95 or greater
TSI Hypereutrophic (70 or greater TSI)

Appendix A: Table 7cPage 28
Tier I Aquatic Life Assessments 2013 VLMP Report
Aquatic Life Use
Lake
CodeLake/County Plant Cover TSI
SD NVSS
Low
NVSS
High
Plant
CoverTSI
SD TSISD
Low
TSISD
High
RTT Antioch/Lake Less Than 5% 53.5 0 15 15 40 55 70 Good
RTG Bangs/Lake 26% to 50% 45.5 0 15 5 40 45 60 Good
RTZT Barrington/Lake 5% to 25% 56.3 0 15 0 40 40 55 Good
RDW Beaver/Grundy 5% to 25% 44.7 0 15 0 40 40 55 Good
RPK Black Oak/Lee 5% To 15% 66.3 0 15 0 50 50 65 Good
STJ Campton/Kane 5% to 25% 73.0 0 15 0 50 50 65 Good
RNZH Campus/Jackson Less Than 5% 63.7 0 15 15 50 65 80 Good to Fair
RTD Catherine/Lake 26% to 50% 63.7 0 15 5 50 55 70 Good
RTI Channel/Lake 26% to 50% 66.5 0 15 5 50 55 70 Good
VTZ Charlotte/Kane Less Than 5% 43.2 0 15 15 40 55 70 Good
SNA Chautauqua/Jackson Less Than 5% 67.1 0 15 15 50 65 80 Good to Fair
RGQ Countryside/Lake Greater Than 70% 60.5 0 15 15 50 65 80 Good to Fair
RGZA Crooked/Lake Less Than 5% 65.7 0 15 15 50 65 80 Good to Fair
RTZG Duck/Lake Greater Than 70% 56.6 0 15 15 40 55 70 Good
RTM East Loon/Lake 26% to 50% 62.8 0 15 5 50 55 70 Good
SDS Eureka/Woodford Less Than 5% 68.4 0 15 15 50 65 80 Good to Fair
RMF Fish Trap/Jo Daviess 5% To 15% 79.7 0 15 0 50 50 65 Good
RGZC Fourth/Lake Greater Than 70% 61.3 0 15 15 50 65 80 Good to Fair
RLH Fyre/Mercer Less Than 5% 52.6 0 15 15 40 55 70 Good
RGI Gages/Lake 51% To 70% 50.4 0 15 10 40 50 65 Good
RJZK Gamlin/St. Clair 5% To 15% 63.0 0 15 0 50 50 65 Good
RTZS Goose/Grundy Less Than 5% 60.1 0 15 15 50 65 80 Good to Fair
RTQ Grass/Lake Less Than 5% 73.4 0 15 15 50 65 80 Good to Fair
RGK Grays/Lake 26% to 50% 59.1 0 15 5 40 45 60 Good
RAI Harrisburg/Saline No Selection 71.3 0 15 15 50 65 80 Good to Fair
RNZC Herrin New/Williamson Less Than 5% 61.3 0 15 15 50 65 80 Good to Fair
WGZY Indian/Cook Less Than 5% 53.9 0 15 15 40 55 70 Good
RTZI Island/Lake 5% to 25% 69.8 0 15 0 50 50 65 Good
RDI Jacksonville/Morgan Less Than 5% 61.3 0 15 15 50 65 80 Good to Fair
RNU Jaycee/Jefferson Less Than 5% 59.4 0 15 15 40 55 70 Good
WGZX Joliet Jr. College/Will 26% to 50% 54.4 0 15 5 40 45 60 Good
RNC Kinkaid/Jackson 5% to 25% 51.9 0 15 0 40 40 55 Good
STM La Fox Pond/Kane 26% to 50% 61.3 0 15 5 50 55 70 Good
RAL Lake of Egypt/Williamson 26% to 50% 55.7 0 15 5 40 45 60 Good
UTZ Lake of the Hollow/Lake 51% To 70% 46.6 0 15 10 40 50 65 Good
STG Leisure/Lake Less Than 5% 69.8 0 15 15 50 65 80 Good to Fair
UDC Lincoln/Grundy Less Than 5% 28.9 0 15 15 40 55 70 Good
RGC Linden/Lake 26% to 50% 53.9 0 15 5 40 45 60 Good
STC Little Silver/Lake 26% to 50% 46.3 0 15 5 40 45 60 Good
VTZJ Louise/Lake Less Than 5% 76.5 0 15 15 50 65 80 Good to Fair
WGZZ Loveless/DuPage 51% To 70% 71.7 0 15 10 50 60 75 Good to Fair
SDL Mauvaise Terre/Morgan Less Than 5% 77.1 0 15 15 50 65 80 Good to Fair
RAZA McLeansboro New/Hamilton Less Than 5% 71.3 0 15 15 50 65 80 Good to Fair
RGP Minear/Lake Less Than 5% 45.5 0 15 15 40 55 70 Good
ScorePoints AssignedTier 1 Derived Lake DataRating or
Range

Appendix A: Table 7cPage 29
Tier I Aquatic Life Assessments 2013 VLMP Report
Aquatic Life Use
Lake
CodeLake/County Plant Cover TSI
SD NVSS
Low
NVSS
High
Plant
CoverTSI
SD TSISD
Low
TSISD
High
ScorePoints AssignedTier 1 Derived Lake DataRating or
Range
RND Murphysboro/Jackson 5% to 25% 66.8 0 15 0 50 50 65 Good
STO Napa Suwe/Lake Less Than 5% 82.1 0 15 15 50 65 80 Good to Fair
RNZO New Thompson/Jackson 5% to 25% 60.1 0 15 0 50 50 65 Good
RTUA Nippersink/Lake 5% to 25% 72.1 0 15 0 50 50 65 Good
RBL Paris Twin East/Edgar Less Than 5% 67.7 0 15 15 50 65 80 Good to Fair
RBX Paris Twin West/Edgar Less Than 5% 72.5 0 15 15 50 65 80 Good to Fair
REL Petersburg/Menard Less Than 5% 53.0 0 15 15 40 55 70 Good
RPC Pierce/Winnebago 5% To 15% 75.4 0 15 0 50 50 65 Good
RPZB Pine/Lee 5% To 15% 60.0 0 15 0 50 50 65 Good
RPZI Richardson Wildlife/Lee 51% To 70% 65.7 0 15 10 50 60 75 Good to Fair
RTH Round/Lake 5% to 25% 51.5 0 15 0 40 40 55 Good
RGM Sand/Lake 5% to 25% 65.4 0 15 0 50 50 65 Good
RPL Sunset/Lee Less Than 5% 62.1 0 15 15 50 65 80 Good to Fair
RGW Third/Lake 26% to 50% 48.6 0 15 5 40 45 60 Good
SGB Virginia/Cook Less Than 5% 34.2 0 15 15 40 55 70 Good
WGS Waterford/Lake Greater Than 70% 45.5 0 15 15 40 55 70 Good
RTZB West Loon/Lake 26% to 50% 44.7 0 15 5 40 45 60 Good
RTS Zurich/Lake 5% to 25% 48.1 0 15 0 40 40 55 Good
TSI Oligotrophic (Less than 40 TSI) Good Aquatic Life Rating - Good - Less than 75
TSI Mesotrophic (40 to 50 TSI) Fair Aquatic Life Rating - Fair - 75 to 95
TSI Eutrophic (50 to 70 TSI) Poor Aquatic Life Rating - Poor - 95 or greater
TSI Hypereutrophic (70 or greater TSI)

Appendix A: Table 8aPage 30
Tier III Aesthetic Quality Assessments (Comparing S1 to WL data)
2013 VLMP Report
Aesthetic Quality Use Rating
Data
Set
Lake
CodeLake/County
NVSS
(mg/L)Plant Cover TSISD TSITP TSICHL NVSS
Plant
CoverTSISD TSITP TSICHL TSISD TSITP TSICHL
S1 RMJ Apple Canyon/Jo Daviess 0 5% to 25% 61.5 59.4 67.4 0 7.5 61.5 59.4 67.4 69 67 75 Fair
WL RMJ Apple Canyon/Jo Daviess 0 5% to 25% 61.7 62.5 67.4 0 7.5 61.7 62.5 67.4 69 70 75 Fair
S1 REZG Bertinetti/Christian 6 Less Than 5% 69.8 75.2 69.7 5 0 69.8 75.2 69.7 75 80 75 Fair
WL REZG Bertinetti/Christian 6 Less Than 5% 70.9 79.0 71.9 5 0 70.9 79.0 71.9 76 84 77 Fair
S1 RDO Bloomington/McLean 4.5 Less Than 5% 66.0 68.4 70.6 5 0 66.0 68.4 70.6 71 73 76 Fair
WL RDO Bloomington/McLean 4.5 Less Than 5% 67.1 70.0 67.5 5 0 67.1 70.0 67.5 72 75 73 Fair
S1 RBC Charleston SCR/Coles 8 Less Than 5% 72.1 70.4 72.4 10 0 72.1 70.4 72.4 82 80 82 Fair
WL RBC Charleston SCR/Coles 8 Less Than 5% 72.1 70.3 71.4 10 0 72.1 70.3 71.4 82 80 81 Fair
S1 SDA Evergreen/McLean 1.5 Less Than 5% 61.3 56.4 59.4 0 0 61.3 56.4 59.4 61 56 59 Good
WL SDA Evergreen/McLean 1.5 Less Than 5% 66.5 60.1 62.4 0 0 66.5 60.1 62.4 67 60 62 Fair
S1 RMM Galena/Jo Daviess 0 5% To 15% 58.6 56.6 57.6 0 7.5 58.6 56.6 57.6 66 64 65 Fair
WL RMM Galena/Jo Daviess 0 5% To 15% 58.9 57.3 59.1 0 7.5 58.9 57.3 59.1 66 65 67 Fair
S1 RNZD Herrin Old/Williamson 0 Less Than 5% 57.1 51.1 57.5 0 0 57.1 51.1 57.5 57 51 57 Good
WL RNZD Herrin Old/Williamson 0 Less Than 5% 57.1 50.0 56.8 0 0 57.1 50.0 56.8 57 50 57 Good
S1 RTZV Killarney/McHenry 0 51% To 70% 46.4 45.8 43.6 0 15 46.4 45.8 43.6 61 61 59 Fair
WL RTZV Killarney/McHenry 0 51% To 70% 46.4 45.8 43.9 0 15 46.4 45.8 43.9 61 61 59 Fair
S1 REG Lake of the Woods/Champaign 2 Less Than 5% 66.0 57.0 62.5 0 0 66.0 57.0 62.5 66 57 62 Fair
WL REG Lake of the Woods/Champaign 2 Less Than 5% 66.5 61.4 64.2 0 0 66.5 61.4 64.2 67 61 64 Fair
S1 RCE Sara/Effingham 0 Less Than 5% 61.3 58.7 60.0 0 0 61.3 58.7 60.0 61 59 60 Fair
WL RCE Sara/Effingham 0 Less Than 5% 63.0 60.8 61.9 0 0 63.0 60.8 61.9 63 61 62 Fair
S1 RTW Silver/McHenry 0 26% to 50% 48.4 48.7 51.8 0 15 48.4 48.7 51.8 63 64 67 Fair
WL RTW Silver/McHenry 0 26% to 50% 52.6 50.6 48.7 0 15 52.6 50.6 48.7 68 66 64 Fair
S1 RDR Spring/McDonough 2 Less Than 5% 69.8 76.1 71.5 0 0 69.8 76.1 71.5 70 76 72 Fair
WL RDR Spring/McDonough 2 Less Than 5% 73.9 79.2 72.0 0 0 73.9 79.2 72.0 74 79 72 Fair
S1 REF Springfield/Sangamon 4 5% to 25% 69.4 85.3 65.5 5 7.5 69.4 85.3 65.5 82 98 78 Fair
WL REF Springfield/Sangamon 4 5% to 25% 76.0 85.3 66.5 5 7.5 76.0 85.3 66.5 88 98 79 Fair
S1 WTJ Three Oaks North/McHenry 0 5% to 25% 36.0 20.0 29.7 0 7.5 36.0 20.0 29.7 43 27 37 Good
WL WTJ Three Oaks North/McHenry 0 5% to 25% 39.1 20.0 29.5 0 7.5 39.1 20.0 29.5 47 27 37 Good
S1 WTG Three Oaks South/McHenry 0 26% to 50% 31.2 27.4 38.1 0 15 31.2 27.4 38.1 46 42 53 Good
WL WTG Three Oaks South/McHenry 0 26% to 50% 32.8 27.4 34.4 0 15 32.8 27.4 34.4 48 42 49 Good
Tier 3 Derived Lake Data Points Assigned Score
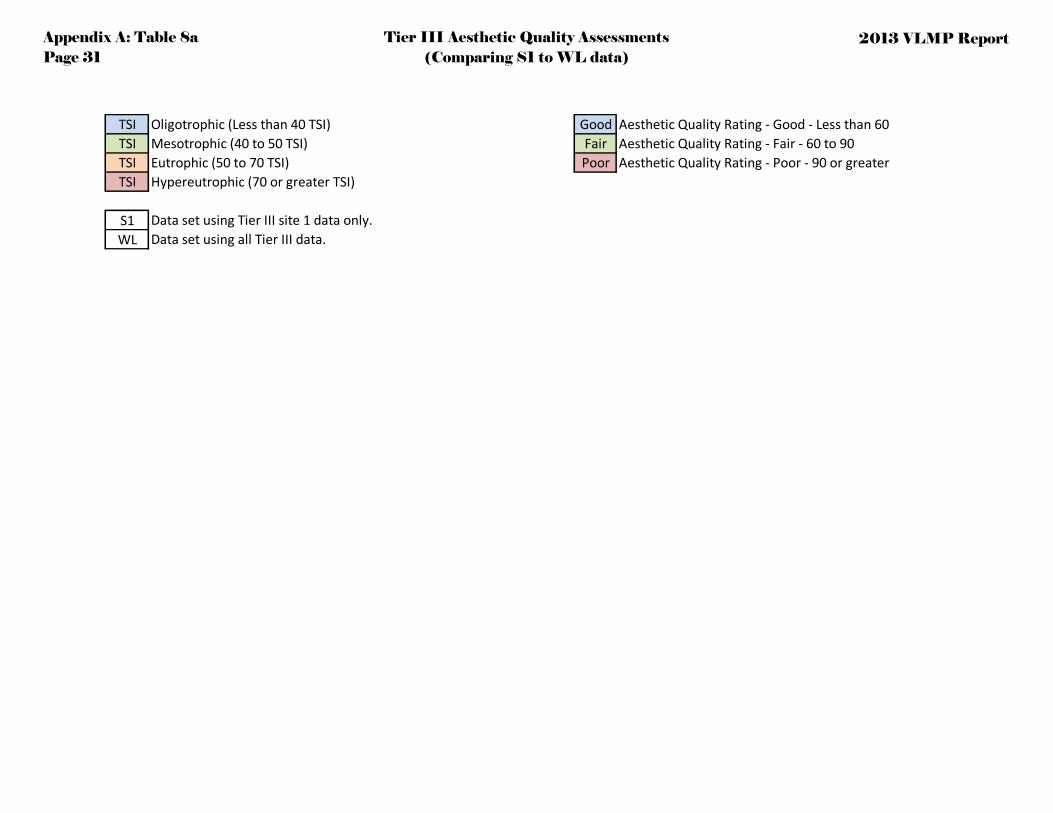
Appendix A: Table 8aPage 31
Tier III Aesthetic Quality Assessments (Comparing S1 to WL data)
2013 VLMP Report
TSI Oligotrophic (Less than 40 TSI) Good Aesthetic Quality Rating - Good - Less than 60
TSI Mesotrophic (40 to 50 TSI) Fair Aesthetic Quality Rating - Fair - 60 to 90
TSI Eutrophic (50 to 70 TSI) Poor Aesthetic Quality Rating - Poor - 90 or greater
TSI Hypereutrophic (70 or greater TSI)
S1 Data set using Tier III site 1 data only.
WL Data set using all Tier III data.

Appendix A: Table 8bPage 32
Tier II Aesthetic Quality Assessments 2013 VLMP Report
Aesthetic Quality Use
Lake
CodeLake/County
NVSS
(mg/L)Plant Cover TSISD TSITP TSICHL NVSS
Plant
CoverTSISD TSITP TSICHL TSISD TSITP TSICHL
RCJ Altamont New/Effingham 2.5 Less Than 5% 60.0 76.6 58.2 0 0 60.0 76.6 58.2 60 77 58 Fair
RPJ Bass/Lee 2.0 5% to 25% 64.9 68.4 68.9 0 7.5 64.9 68.4 68.9 72 76 76 Fair
SEB Bird's Pond/Sangamon 1.0 5% To 15% 62.1 67.8 58.8 0 7.5 62.1 67.8 58.8 70 75 66 Fair
RCB Borah/Richland 0 Less Than 5% 68.4 69.2 27.9 0 0 68.4 69.2 27.9 68 69 28 Fair
SGC Buffalo Creek/Lake 2.5 26% to 50% 71.3 67.2 59.6 0 15 71.3 67.2 59.6 86 82 75 Fair
RPV Candlewick/Boone 0 5% to 25% 59.8 59.8 63.1 0 7.5 59.8 59.8 63.1 67 67 71 Fair
RDD Canton/Fulton 3.0 Less Than 5% 53.2 58.6 57.0 5 0 53.2 58.6 57.0 58 64 62 Fair
RNI Carbondale/Jackson 3.0 Less Than 5% 82.1 67.6 5 0 82.1 67.6 87 73 Fair
RNE Cedar/Jackson 0 Less Than 5% 56.6 44.1 51.3 0 0 56.6 44.1 51.3 57 44 51 Good
RGR Charles/DuPage 2.0 5% to 25% 63.4 82.5 64.5 0 7.5 63.4 82.5 64.5 71 90 72 Fair
WDK Civic/Grundy 0 Less Than 5% 25.1 27.4 36.3 0 0 25.1 27.4 36.3 25 27 36 Good
VTZH Crystal/McHenry 0 5% to 25% 43.1 44.1 57.9 0 7.5 43.1 44.1 57.9 51 52 65 Good
REE Dawson/McLean 1.5 Less Than 5% 54.7 50.9 62.5 0 0 54.7 50.9 62.5 55 51 62 Good
REA Decatur/Macon 10.0 Less Than 5% 70.5 71.7 67.0 10 0 70.5 71.7 67.0 80 82 77 Fair
WGZK Deep Quarry/DuPage 0 26% to 50% 32.2 38.7 40.2 0 15 32.2 38.7 40.2 47 54 55 Good
VTD Deep/Lake 0.5 5% to 25% 38.5 46.6 48.5 0 7.5 38.5 46.6 48.5 46 54 56 Good
RNJ Devils Kitchen/Williamson 0 26% to 50% 44.0 37.4 0 15 44.0 37.4 59 52 Good
RGB Diamond/Lake 1.5 26% to 50% 51.9 54.3 49.6 0 15 51.9 54.3 49.6 67 69 65 Fair
RGV Druce/Lake 0.5 26% to 50% 40.3 37.4 47.5 0 15 40.3 37.4 47.5 55 52 63 Good
VTT Fischer/Lake 3.5 26% To 40% 68.4 75.0 68.0 5 15 68.4 75.0 68.0 88 95 88 Fair
RGZG Forest/Lake 4.5 Less Than 5% 64.4 63.4 55.1 5 0 64.4 63.4 55.1 69 68 60 Fair
ROP Governor Bond/Bond 2.0 Less Than 5% 71.7 77.3 70.1 0 0 71.7 77.3 70.1 72 77 70 Fair
ROZA Highland Silver/Madison 5.0 Less Than 5% 71.3 81.4 60.9 5 0 71.3 81.4 60.9 76 86 66 Fair
RBO Homer/Champaign 2.5 Less Than 5% 62.8 59.7 66.6 0 0 62.8 59.7 66.6 63 60 67 Fair
RTZU Honey/Lake 0.5 5% to 25% 55.2 58.6 71.6 0 7.5 55.2 58.6 71.6 63 66 79 Fair
VGI Leopold/Lake 0 51% To 70% 45.5 52.7 49.7 0 15 45.5 52.7 49.7 60 68 65 Fair
RGU Loch Lomond/Lake 2.0 Less Than 5% 66.5 75.0 68.9 0 0 66.5 75.0 68.9 67 75 69 Fair
RTJ Long/Lake 4.5 5% to 25% 63.4 68.9 68.4 5 7.5 63.4 68.9 68.4 76 81 81 Fair
RHZK Longmeadow/Cook 0.5 26% to 50% 59.8 65.9 62.3 0 15 59.8 65.9 62.3 75 81 77 Fair
RCF Mattoon/Shelby 4.0 Less Than 5% 74.9 71.9 68.3 5 0 74.9 71.9 68.3 80 77 73 Fair
RNZI Miller/Jefferson 0.5 Less Than 5% 64.9 62.5 66.7 0 0 64.9 62.5 66.7 65 62 67 Fair
Representative Site Derived Lake Data Points Assigned Score
Rating

Appendix A: Table 8bPage 33
Tier II Aesthetic Quality Assessments 2013 VLMP Report
Aesthetic Quality Use
Lake
CodeLake/County
NVSS
(mg/L)Plant Cover TSISD TSITP TSICHL NVSS
Plant
CoverTSISD TSITP TSICHL TSISD TSITP TSICHL
Representative Site Derived Lake Data Points Assigned Score
Rating
RGZD Miltmore/Lake 0 51% To 70% 46.7 44.6 42.7 0 15 46.7 44.6 42.7 62 60 58 Fair
RCC Olney East Fork/Richland 0 Less Than 5% 59.8 56.2 67.8 0 0 59.8 56.2 67.8 60 56 68 Fair
SDZW Ossami/Tazewell 2.5 51% To 70% 61.3 75.1 62.6 0 15 61.3 75.1 62.6 76 90 78 Fair
RDF Otter/Macoupin 0 Less Than 5% 67.7 58.6 71.6 0 0 67.7 58.6 71.6 68 59 72 Fair
RCG Paradise/Coles 4.0 Less Than 5% 76.0 73.3 75.1 5 0 76.0 73.3 75.1 81 78 80 Fair
RNH Pinckneyville/Perry 0.5 Less Than 5% 62.3 73.5 0 0 62.3 73.5 62 74 Fair
RNZG Spring Arbor/Jackson 0 Less Than 5% 52.3 52.2 60.7 0 0 52.3 52.2 60.7 52 52 61 Good
UGV Spring Ledge/Lake 0 51% To 70% 50.1 54.6 50.6 0 15 50.1 54.6 50.6 65 70 66 Fair
SGW Stephen/Will 3.5 5% to 25% 58.1 76.8 69.5 5 7.5 58.1 76.8 69.5 71 89 82 Fair
RPI Summerset/Winnebago 0 Less Than 5% 53.5 53.2 53.5 0 0 53.5 53.2 53.5 53 53 53 Good
REZN Sunset/Champaign 0.5 Less Than 5% 49.1 35.0 44.2 0 0 49.1 35.0 44.2 49 35 44 Good
UDH Sunset/Macoupin 4.0 Less Than 5% 66.5 73.5 65.5 5 0 66.5 73.5 65.5 72 79 70 Fair
RGZF Sylvan/Lake 3.5 Less Than 5% 61.9 59.4 63.1 5 0 61.9 59.4 63.1 67 64 68 Fair
REC Taylorville/Christian 10.0 Less Than 5% 67.1 86.2 63.6 10 0 67.1 86.2 63.6 77 96 74 Fair
RTZQ Timber/Lake 0 5% to 25% 56.6 59.4 56.9 0 7.5 56.6 59.4 56.9 64 67 64 Fair
RTZF Tower/Lake 3.0 5% to 25% 64.4 71.0 61.5 5 7.5 64.4 71.0 61.5 77 83 74 Fair
REZL Twin Oaks/Champaign 9.5 Less Than 5% 78.4 80.0 72.1 10 0 78.4 80.0 72.1 88 90 82 Fair
RGZM Valley/Lake 0.5 5% to 25% 61.1 63.2 59.3 0 7.5 61.1 63.2 59.3 69 71 67 Fair
RBD Vermilion/Vermilion 4.0 5% To 15% 65.7 70.8 71.3 5 7.5 65.7 70.8 71.3 78 83 84 Fair
RCA Vernor/Richland 0 Less Than 5% 56.6 74.8 23.8 0 0 56.6 74.8 23.8 57 75 24 Good
RPZK Westlake/Winnebago 2.0 Less Than 5% 65.7 72.8 66.6 0 0 65.7 72.8 66.6 66 73 67 Fair
RTZC Wonder/McHenry 8.5 Less Than 5% 71.7 81.3 78.7 10 0 71.7 81.3 78.7 82 91 89 Fair
RPM Woodhaven/Lee 1.0 5% To 15% 59.1 70.1 64.1 0 7.5 59.1 70.1 64.1 67 78 72 Fair
RTZZ Woods Creek/McHenry 1.0 Less Than 5% 60.1 60.8 62.0 0 0 60.1 60.8 62.0 60 61 62 Fair
TSI Oligotrophic (Less than 40 TSI) Good Aesthetic Quality Rating - Good - Less than 60
TSI Mesotrophic (40 to 50 TSI) Fair Aesthetic Quality Rating - Fair - 60 to 90
TSI Eutrophic (50 to 70 TSI) Poor Aesthetic Quality Rating - Poor - 90 or greater
TSI Hypereutrophic (70 or greater TSI)
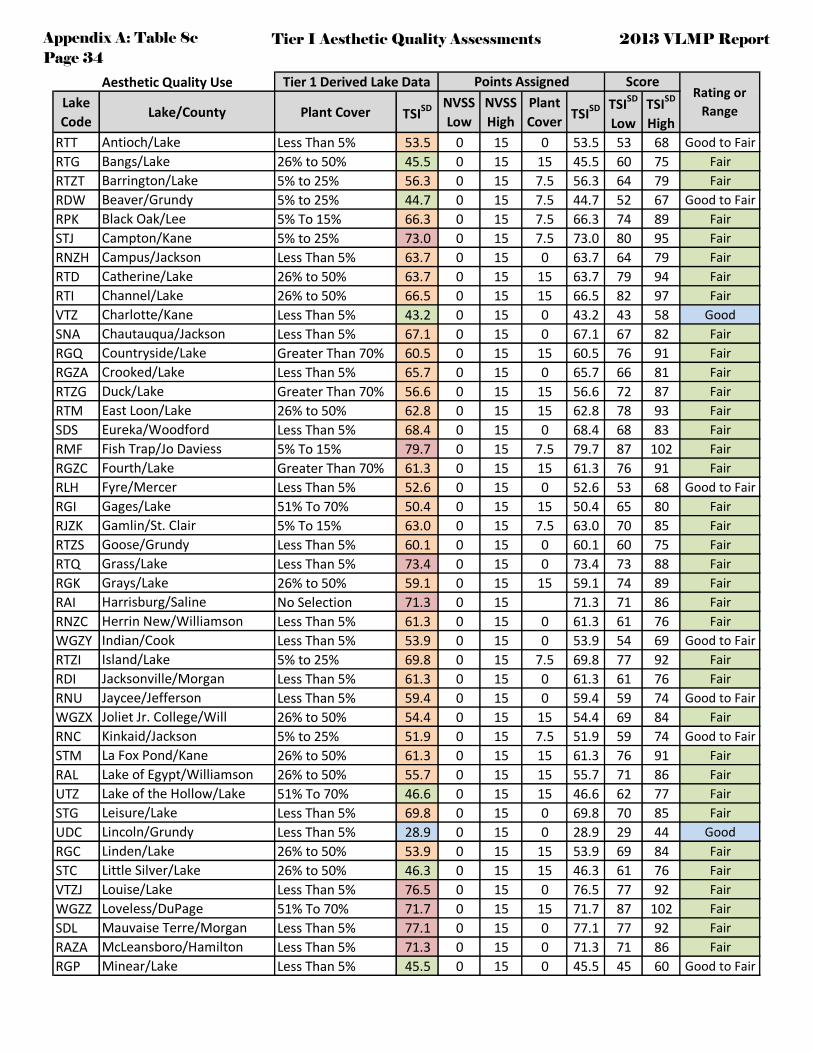
Appendix A: Table 8cPage 34
Tier I Aesthetic Quality Assessments 2013 VLMP Report
Aesthetic Quality Use
Lake
CodeLake/County Plant Cover TSI
SD NVSS
Low
NVSS
High
Plant
CoverTSI
SD TSISD
Low
TSISD
High
RTT Antioch/Lake Less Than 5% 53.5 0 15 0 53.5 53 68 Good to Fair
RTG Bangs/Lake 26% to 50% 45.5 0 15 15 45.5 60 75 Fair
RTZT Barrington/Lake 5% to 25% 56.3 0 15 7.5 56.3 64 79 Fair
RDW Beaver/Grundy 5% to 25% 44.7 0 15 7.5 44.7 52 67 Good to Fair
RPK Black Oak/Lee 5% To 15% 66.3 0 15 7.5 66.3 74 89 Fair
STJ Campton/Kane 5% to 25% 73.0 0 15 7.5 73.0 80 95 Fair
RNZH Campus/Jackson Less Than 5% 63.7 0 15 0 63.7 64 79 Fair
RTD Catherine/Lake 26% to 50% 63.7 0 15 15 63.7 79 94 Fair
RTI Channel/Lake 26% to 50% 66.5 0 15 15 66.5 82 97 Fair
VTZ Charlotte/Kane Less Than 5% 43.2 0 15 0 43.2 43 58 Good
SNA Chautauqua/Jackson Less Than 5% 67.1 0 15 0 67.1 67 82 Fair
RGQ Countryside/Lake Greater Than 70% 60.5 0 15 15 60.5 76 91 Fair
RGZA Crooked/Lake Less Than 5% 65.7 0 15 0 65.7 66 81 Fair
RTZG Duck/Lake Greater Than 70% 56.6 0 15 15 56.6 72 87 Fair
RTM East Loon/Lake 26% to 50% 62.8 0 15 15 62.8 78 93 Fair
SDS Eureka/Woodford Less Than 5% 68.4 0 15 0 68.4 68 83 Fair
RMF Fish Trap/Jo Daviess 5% To 15% 79.7 0 15 7.5 79.7 87 102 Fair
RGZC Fourth/Lake Greater Than 70% 61.3 0 15 15 61.3 76 91 Fair
RLH Fyre/Mercer Less Than 5% 52.6 0 15 0 52.6 53 68 Good to Fair
RGI Gages/Lake 51% To 70% 50.4 0 15 15 50.4 65 80 Fair
RJZK Gamlin/St. Clair 5% To 15% 63.0 0 15 7.5 63.0 70 85 Fair
RTZS Goose/Grundy Less Than 5% 60.1 0 15 0 60.1 60 75 Fair
RTQ Grass/Lake Less Than 5% 73.4 0 15 0 73.4 73 88 Fair
RGK Grays/Lake 26% to 50% 59.1 0 15 15 59.1 74 89 Fair
RAI Harrisburg/Saline No Selection 71.3 0 15 71.3 71 86 Fair
RNZC Herrin New/Williamson Less Than 5% 61.3 0 15 0 61.3 61 76 Fair
WGZY Indian/Cook Less Than 5% 53.9 0 15 0 53.9 54 69 Good to Fair
RTZI Island/Lake 5% to 25% 69.8 0 15 7.5 69.8 77 92 Fair
RDI Jacksonville/Morgan Less Than 5% 61.3 0 15 0 61.3 61 76 Fair
RNU Jaycee/Jefferson Less Than 5% 59.4 0 15 0 59.4 59 74 Good to Fair
WGZX Joliet Jr. College/Will 26% to 50% 54.4 0 15 15 54.4 69 84 Fair
RNC Kinkaid/Jackson 5% to 25% 51.9 0 15 7.5 51.9 59 74 Good to Fair
STM La Fox Pond/Kane 26% to 50% 61.3 0 15 15 61.3 76 91 Fair
RAL Lake of Egypt/Williamson 26% to 50% 55.7 0 15 15 55.7 71 86 Fair
UTZ Lake of the Hollow/Lake 51% To 70% 46.6 0 15 15 46.6 62 77 Fair
STG Leisure/Lake Less Than 5% 69.8 0 15 0 69.8 70 85 Fair
UDC Lincoln/Grundy Less Than 5% 28.9 0 15 0 28.9 29 44 Good
RGC Linden/Lake 26% to 50% 53.9 0 15 15 53.9 69 84 Fair
STC Little Silver/Lake 26% to 50% 46.3 0 15 15 46.3 61 76 Fair
VTZJ Louise/Lake Less Than 5% 76.5 0 15 0 76.5 77 92 Fair
WGZZ Loveless/DuPage 51% To 70% 71.7 0 15 15 71.7 87 102 Fair
SDL Mauvaise Terre/Morgan Less Than 5% 77.1 0 15 0 77.1 77 92 Fair
RAZA McLeansboro/Hamilton Less Than 5% 71.3 0 15 0 71.3 71 86 Fair
RGP Minear/Lake Less Than 5% 45.5 0 15 0 45.5 45 60 Good to Fair
Tier 1 Derived Lake Data Points Assigned ScoreRating or
Range

Appendix A: Table 8cPage 35
Tier I Aesthetic Quality Assessments 2013 VLMP Report
Aesthetic Quality Use
Lake
CodeLake/County Plant Cover TSI
SD NVSS
Low
NVSS
High
Plant
CoverTSI
SD TSISD
Low
TSISD
High
Tier 1 Derived Lake Data Points Assigned ScoreRating or
Range
RND Murphysboro/Jackson 5% to 25% 66.8 0 15 7.5 66.8 74 89 Fair
STO Napa Suwe/Lake Less Than 5% 82.1 0 15 0 82.1 82 97 Fair
RNZO New Thompson/Jackson 5% to 25% 60.1 0 15 7.5 60.1 68 83 Fair
RTUA Nippersink/Lake 5% to 25% 72.1 0 15 7.5 72.1 80 95 Fair
RBL Paris Twin East/Edgar Less Than 5% 67.7 0 15 0 67.7 68 83 Fair
RBX Paris Twin West/Edgar Less Than 5% 72.5 0 15 0 72.5 73 88 Fair
REL Petersburg/Menard Less Than 5% 53.0 0 15 0 53.0 53 68 Good to Fair
RPC Pierce/Winnebago 5% To 15% 75.4 0 15 7.5 75.4 83 98 Fair
RPZB Pine/Lee 5% To 15% 60.0 0 15 7.5 60.0 67 82 Fair
RPZI Richardson Wildlife/Lee 51% To 70% 65.7 0 15 15 65.7 81 96 Fair
RTH Round/Lake 5% to 25% 51.5 0 15 7.5 51.5 59 74 Good to Fair
RGM Sand/Lake 5% to 25% 65.4 0 15 7.5 65.4 73 88 Fair
RPL Sunset/Lee Less Than 5% 62.1 0 15 0 62.1 62 77 Fair
RGW Third/Lake 26% to 50% 48.6 0 15 15 48.6 64 79 Fair
SGB Virginia/Cook Less Than 5% 34.2 0 15 0 34.2 34 49 Good
WGS Waterford/Lake Greater Than 70% 45.5 0 15 15 45.5 60 75 Fair
RTZB West Loon/Lake 26% to 50% 44.7 0 15 15 44.7 60 75 Fair
RTS Zurich/Lake 5% to 25% 48.1 0 15 7.5 48.1 56 71 Good to Fair
TSI Oligotrophic (Less than 40 TSI) Good Aesthetic Quality Rating - Good - Less than 60
TSI Mesotrophic (40 to 50 TSI) Fair Aesthetic Quality Rating - Fair - 60 to 90
TSI Eutrophic (50 to 70 TSI) Poor Aesthetic Quality Rating - Poor - 90 or greater
TSI Hypereutrophic (70 or greater TSI)
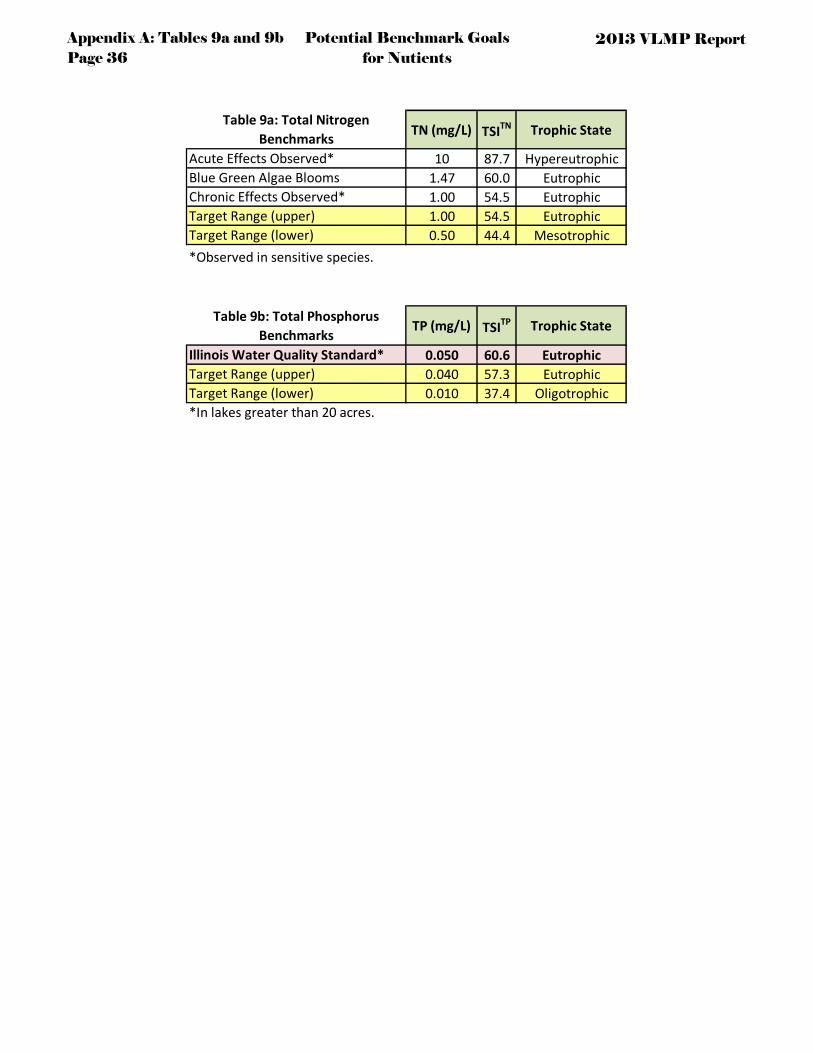
Appendix A: Tables 9a and 9bPage 36
Potential Benchmark Goals for Nutients
2013 VLMP Report
Table 9a: Total Nitrogen
BenchmarksTN (mg/L) TSI
TN Trophic State
Acute Effects Observed* 10 87.7 Hypereutrophic
Blue Green Algae Blooms 1.47 60.0 Eutrophic
Chronic Effects Observed* 1.00 54.5 Eutrophic
Target Range (upper) 1.00 54.5 Eutrophic
Target Range (lower) 0.50 44.4 Mesotrophic
*Observed in sensitive species.
Table 9b: Total Phosphorus
BenchmarksTP (mg/L) TSI
TP Trophic State
Illinois Water Quality Standard* 0.050 60.6 Eutrophic
Target Range (upper) 0.040 57.3 Eutrophic
Target Range (lower) 0.010 37.4 Oligotrophic
*In lakes greater than 20 acres.
Total Phosphorus (USEPA 2000)
EPA Ecoregion VI

Appendix A: Table 10Page 37
Best Management Practices to Reduce Nonpoint Source Pollution
2013 VLMP Report
CategoriesAgricul-
ture
Construc-
tion
Urban
Runoff
Hydrologic
Modification
Resource
Extraction
Ground-
waterWetlands
Practices Priority Priority Priority Priority Priority Priority Priority
Access Roads Low Low Low Low Low --- ---
Aeration/Destratification Medium Medium Medium Medium Medium --- ---
Aquatic Vegetation Re-
establishmentLow --- Medium Medium Low Low High
Artificial Circulation Low Low Medium Low Medium Low Low
Barley Straw Addition Low Low Medium Low Low --- ---
Barriers to Diver Runoff from
Resource Extraction Work SitesLow Low Low Low High Low Low
Bioengineering Stabilization
PracticesHigh High High High High High High
Biorentention Practices High High High High High High High
Bioswale High High High High High High High
Bottom Feeding Fish Species
EradicationLow --- Low Low --- --- Low
Bottom Sealing Medium Medium Medium Medium Medium --- Medium
Brush Management Low Low Low Low Low --- Medium
Buffer Strips High High High High High High High
Catchment Basins High High High High High High High
Channel Vegetation Medium Medium Medium Medium Medium Medium Medium
Check Dams High High High High High --- ---
Cistern Medium --- Medium Medium Medium --- Medium
Clearing and Snagging Low Low Low Medium Low --- Low
Compost Facility Low Low Low Low Low --- ---
Concrete Collection Pit High High High High High High High
Confinement Pens High --- --- --- --- --- ---
Conservation Cover High High High High High High High
Conservation Cropping Systems High --- --- --- --- --- High
Conservation Reserve Programs High --- High --- --- --- High
Conservation Tillage High --- --- --- --- --- High
Constructed Wetlands High High High High High High High
Contour Farming High --- --- --- --- --- High
Contour Orchard and Other Fruit
AreaLow --- Low --- --- Low Low
Cover and Green Manure Crop Medium Medium Medium Medium Medium --- Medium
Critical Area Planting High High High High High High High
Dam, Diversion Low Low Low Low Low Low Low
Dam, Floodwater Retarding Low Low Low Low Low Low Low
Dam, Multiple Use Low Low Low Low Low Low Low
Dam, Removal Low Low Low Low Low Low Low
Deferred Grazing High --- --- --- --- --- ---
Detention Basins, Dry or Wet High High High High High High High
Dewatering Practices Medium Medium Medium Medium Medium Medium ---
Discharge Flow Regulation High High High High High High High
Diversions Medium Medium Medium Medium Medium Medium Medium
Dike High High High High High High High
Dike Floodway Channel Medium Medium Medium Medium Medium Medium Medium
Ditch Stabilization High High High High High High High
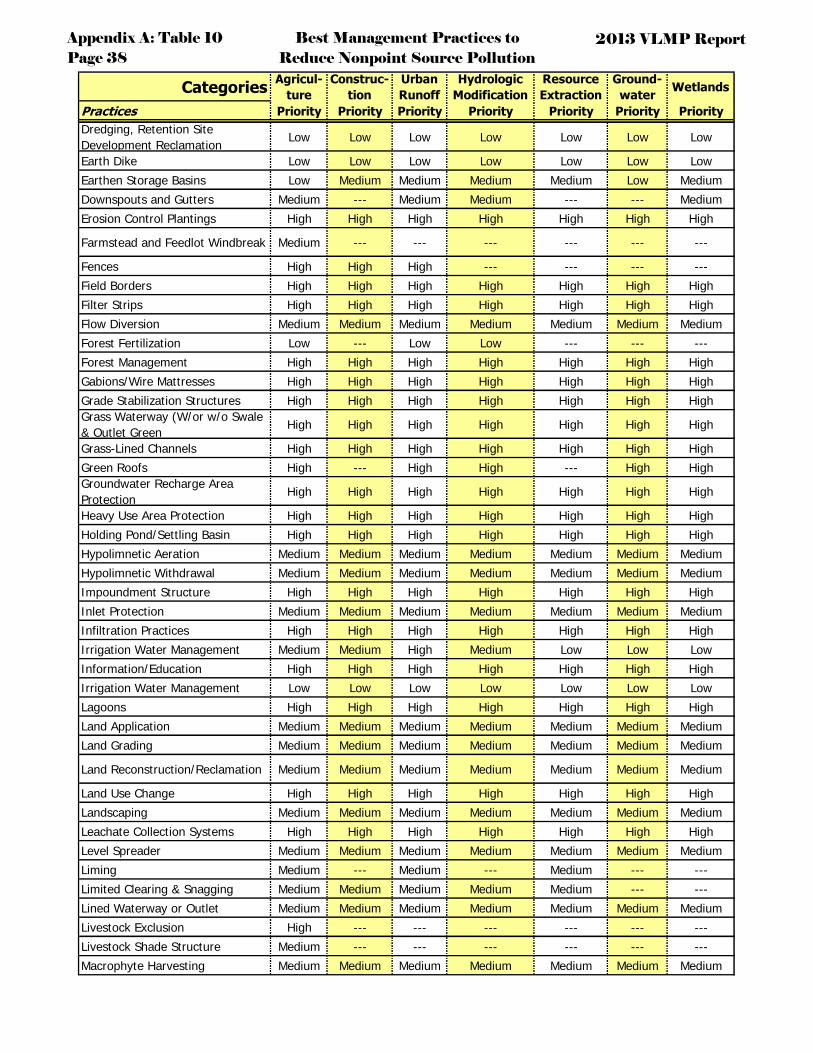
Appendix A: Table 10Page 38
Best Management Practices to Reduce Nonpoint Source Pollution
2013 VLMP Report
CategoriesAgricul-
ture
Construc-
tion
Urban
Runoff
Hydrologic
Modification
Resource
Extraction
Ground-
waterWetlands
Practices Priority Priority Priority Priority Priority Priority Priority
Dredging, Retention Site
Development ReclamationLow Low Low Low Low Low Low
Earth Dike Low Low Low Low Low Low Low
Earthen Storage Basins Low Medium Medium Medium Medium Low Medium
Downspouts and Gutters Medium --- Medium Medium --- --- Medium
Erosion Control Plantings High High High High High High High
Farmstead and Feedlot Windbreak Medium --- --- --- --- --- ---
Fences High High High --- --- --- ---
Field Borders High High High High High High High
Filter Strips High High High High High High High
Flow Diversion Medium Medium Medium Medium Medium Medium Medium
Forest Fertilization Low --- Low Low --- --- ---
Forest Management High High High High High High High
Gabions/Wire Mattresses High High High High High High High
Grade Stabilization Structures High High High High High High High
Grass Waterway (W/or w/o Swale
& Outlet GreenHigh High High High High High High
Grass-Lined Channels High High High High High High High
Green Roofs High --- High High --- High High
Groundwater Recharge Area
ProtectionHigh High High High High High High
Heavy Use Area Protection High High High High High High High
Holding Pond/Settling Basin High High High High High High High
Hypolimnetic Aeration Medium Medium Medium Medium Medium Medium Medium
Hypolimnetic Withdrawal Medium Medium Medium Medium Medium Medium Medium
Impoundment Structure High High High High High High High
Inlet Protection Medium Medium Medium Medium Medium Medium Medium
Infiltration Practices High High High High High High High
Irrigation Water Management Medium Medium High Medium Low Low Low
Information/Education High High High High High High High
Irrigation Water Management Low Low Low Low Low Low Low
Lagoons High High High High High High High
Land Application Medium Medium Medium Medium Medium Medium Medium
Land Grading Medium Medium Medium Medium Medium Medium Medium
Land Reconstruction/Reclamation Medium Medium Medium Medium Medium Medium Medium
Land Use Change High High High High High High High
Landscaping Medium Medium Medium Medium Medium Medium Medium
Leachate Collection Systems High High High High High High High
Level Spreader Medium Medium Medium Medium Medium Medium Medium
Liming Medium --- Medium --- Medium --- ---
Limited Clearing & Snagging Medium Medium Medium Medium Medium --- ---
Lined Waterway or Outlet Medium Medium Medium Medium Medium Medium Medium
Livestock Exclusion High --- --- --- --- --- ---
Livestock Shade Structure Medium --- --- --- --- --- ---
Macrophyte Harvesting Medium Medium Medium Medium Medium Medium Medium

Appendix A: Table 10Page 39
Best Management Practices to Reduce Nonpoint Source Pollution
2013 VLMP Report
CategoriesAgricul-
ture
Construc-
tion
Urban
Runoff
Hydrologic
Modification
Resource
Extraction
Ground-
waterWetlands
Practices Priority Priority Priority Priority Priority Priority Priority
Mixing/Loading Pads Medium Medium Medium Medium Medium --- ---
Monitoring Medium Medium Medium Medium Medium Medium Medium
Mud/Dust Control Medium Medium Medium Medium Medium Medium Medium
Mulching Medium Medium Medium Medium Medium Medium Medium
Nutrient Management High High High High High High High
Nutrient Management Plans High High High High High High High
Oil and Grit Separator Medium Medium Medium Medium Medium --- ---
On-Site Treatment System
CorrectionMedium Medium Medium Medium Medium Medium Medium
Open Channel
Construction/ImprovementHigh High High High High High High
Open Gutter Systems Medium --- Medium Medium --- --- Medium
Open Space Land Acquisition Medium Medium Medium Medium Medium Medium Medium
Outlet Protection High High High High High High High
Outside Concrete Collection
SystemsHigh High High High High High High
Oxidation Ditch Medium Medium Medium Medium Medium Medium Medium
Pasture/Hayland Management &
PlantingHigh --- --- --- --- High High
Pasture Protection High --- --- --- --- High High
Pasture Rotation High --- --- --- --- High High
Paved Waterways Low Low Low Low Low Low Low
Pesticide Application Certification
and TrainingMedium Medium Medium Medium Medium Medium Medium
Pest Management Low Low Low Low Low Low Low
Prescribed Burning Medium Medium Medium Medium --- --- Medium
Phosphorus Inactivation Medium Medium Medium Medium Medium Medium Medium
Planned Grazing Systems High --- --- --- --- High High
Planning/Administration Medium Medium Medium Medium Medium Medium Medium
Pond Medium Medium Medium Medium Medium Medium Medium
Pond Sealing or Lining Medium Medium Medium Medium Medium Medium Medium
Porous Pavement Medium Medium Medium Medium Medium Medium Medium
Portable Sediment Tank Medium Medium Medium Medium Medium Medium Medium
Prairie Restoration Medium Medium Medium Medium Medium Medium Medium
Protect Existing Vegetation Medium Medium Medium Medium Medium Medium Medium
Rain Barrel Medium --- Medium Medium --- Medium Medium
Rain Garden Medium --- Medium Medium --- Medium Medium
Recessed Street Medium Medium Medium Medium Medium Medium Medium
Recreation Area Improvement Low Low Low Low Low Low High
Regeneration/Reforestation Medium Medium Medium Medium Medium Medium Medium
Regulations Medium Medium Medium Medium Medium Medium Medium
Replace Leaking Storage Tanks Medium Medium Medium --- Medium Medium Medium
Reshape Banks/Sideslopes High High High High High High High
Retention Basin High High High High High High High
Retards & Jetties High High High High High High High
Revegetated Riparian
Zone/CorridorHigh High High High High High High

Appendix A: Table 10Page 40
Best Management Practices to Reduce Nonpoint Source Pollution
2013 VLMP Report
CategoriesAgricul-
ture
Construc-
tion
Urban
Runoff
Hydrologic
Modification
Resource
Extraction
Ground-
waterWetlands
Practices Priority Priority Priority Priority Priority Priority Priority
Rip Rap High High High High High High ---
Rock Barrier High High High High High High High
Rock Outlet Protection High High High High High High High
Rock Outlets High High High High High High High
Roof Runoff Management High High High High High High High
Runoff Control High High High High High High High
Sand Filters Medium Medium Medium Medium Medium Medium Medium
Sealing Bore Holes High High High --- High High High
Sediment Traps/Basins High High High High High High High
Seeding High High High High High High High
Sediment Oxidation Medium Medium Medium Medium Medium Medium Medium
Shading and Sediment Covers Medium Medium Medium Medium Medium Medium Medium
Sinkhole Stabilization Medium Medium Medium Medium Medium Medium Medium
Silt Fence Medium Medium Medium Medium Medium Medium Medium
Site Evaluation Requirements Medium Medium Medium Medium Medium Medium Medium
Spillway Restoration Medium Medium Medium Medium Medium Medium Medium
Sodding Medium Medium Medium Medium --- Medium ---
Soil Testing/Nutrient Management High High High High High High High
Spray Nozzle Refinements High --- High --- --- --- ---
Stabilized Construction Entrance
Stacking AreaMedium Medium Medium Medium Medium Medium Medium
Storm Drain Inlet Protection Medium Medium Medium Medium Medium Medium Medium
Stacking Area Medium Medium Medium Medium Medium Medium Medium
Staging of Clearing, Grubbing,
Scalping, Grading and
Reclamation Activities
Medium Medium Medium Medium Medium Medium Medium
Stock Trails and Walkways Medium Medium Medium Medium Medium Medium Medium
Straw Bale Dike Medium Medium Medium Medium Medium Medium Medium
Stream Channel Restoration High High High High High High High
Stream Channel Stabilization High High High High High High High
Streambank and Shoreline
Protection/StabilizationHigh High High High High High High
Street Sweeping --- Medium Medium --- --- --- ---
Strip Cropping (Contour) High --- High --- High High ---
Subsurface Drainage High High High High High High High
Surface Drainage High High High High High High High
Sustainable Management Practices High High High High High High High
Swale High High High High High High High
Technical Assistance High High High High High High High
Temporary Vegetative Cover High High High High High High High
Terraces High High High High High High High
Topsoiling Medium Medium Medium Medium Medium --- ---
Toxic Salt Reduction High High High High High High High
Tree Planting Medium Medium Medium Medium Medium Medium Medium
Trenches and Ponds Medium Medium Medium Medium Medium Medium Medium

Appendix A: Table 10Page 41
Best Management Practices to Reduce Nonpoint Source Pollution
2013 VLMP Report
CategoriesAgricul-
ture
Construc-
tion
Urban
Runoff
Hydrologic
Modification
Resource
Extraction
Ground-
waterWetlands
Practices Priority Priority Priority Priority Priority Priority Priority
Triple Rinsing Pesticide Containers Medium Medium Medium --- Medium Medium Medium
Trough or Tank Medium Medium Medium --- Medium Medium ---
Underground Outlet Medium Medium Medium Medium Medium Medium Medium
Urban Filter Strip --- High High High High High High
Urban Stormwater Wetlands --- High High High High High High
Vegetative Bank Stabilization High High High High High High High
Vegetative Buffers High High High High High High High
Vegetative Filter Strips High High High High High High High
Vegetative Deflectors High High High High High High High
Vegetative Management High High High High High High High
Vegetative Removal Medium Medium Medium Medium Medium Medium Medium
Vegetative Stabilization High High High High High High High
Vegetative Swale High High High High High High High
Vegetative Protection/Soil
StabilizationHigh High High High High High High
Waste Application (Application on
Land)Low Low Low Low Low Low Low
Waste Water Recovery High High High High High High High
Waste Management System High High High High High High High
Waste Storage Lagoons/Ponds
(various)Medium Medium Medium Medium Medium Medium Medium
Waste Storage/Control Structures High High High High High High High
Water Level Drawdown/Refilling Low Low Low Low Low Low Low
Water/Sediment Control Basins High High High High High High High
Water Harvesting Medium Medium Medium Medium Medium Medium Medium
Well Sealing High High High High High High High
Well Setback Zones High High High High High High High
Well Site Protection High High High High High High High
Wetland Acquisition High High High High High High High
Wetland Creation High High High High High High High
Wetland Protection High High High High High High High
Wetland Restoration High High High High High High High
Wildlife Plantings High High High High High High High
Wildlife Upland Habitat
ManagementHigh High High High High High High
Wildlife Wetland Habitat
ManagementHigh High High High High High High
Willow Spikes High High High High High High Low
Windbreaks (Field, Farmstead,
Feedlots)Medium --- Medium --- Medium --- ---
Winter Feed Station High --- --- --- --- High High
Woodland Improvement High High High High High High High
Woodland and Pruning High High High High High High High
Zoning High High High High High High High

Appendix A: Table 11Page 42
Aquatic Invasive Species Distribution 2007 thru 2013
2013 VLMP Report
Lake/CountyLake
CodeLatitude Longitude
Co
mm
on
Carp
Grass C
arp
Zebra M
ussel
Ru
sty Crayfish
Asian
Carp
Asian
Clam
Eurasian
Ru
ffe
Fishh
oo
k Waterflea
New
Zealand
Mu
dsn
ail
Qu
agga Mu
ssel
Spin
y Waterflea
Cu
rlyleaf Po
nd
weed
Eurasian
Waterm
ilfoil
Pu
rple Lo
osestrife
Hyd
rilla
Water H
yacinth
Flow
ering R
ush
Reed
Man
na G
rass
Altamont New/Effingham RCJ 39.031948 -88.714726 x xAntioch/Lake RTT 42.467781 -88.098059 x x x xApple Canyon/Jo Daviess RMJ 42.417100 -90.164100 x x x x x xAtwood/McHenry VTS 42.228892 -88.258893 x xBangs/Lake RTG 42.265281 -88.132227 x x x x xBarrington/Lake RTZT 42.221700 -88.147100 x xBass/Lee RPJ 41.654400 -89.287300 x x x x xBeaver/Grundy RDW 41.336800 -88.317300 x x x x xBeck/Cook RGE 42.075282 -87.872782 xBertinetti/Christian REZG 39.533297 -89.251344 x xBig Shadow/Will WDC 41.286633 -88.201330 xBird's Pond/Sangamon SEB 39.747067 -89.565557 xBlack Oak/Lee RPK 41.657500 -89.289500 x x x x xBloomington/McLean RDO 40.660567 -88.935553Bluff/Lake VTJ 42.452226 -88.127781 x x xBorah/Richland RCB 38.774390 -88.069800Buffalo Creek/Lake SGC 42.156979 -87.991331 x x xCampton/Kane STJ 41.952936 -88.410869 xCampus/Jackson RNZH 37.708892 -89.223059Candlewick/Boone RPV 42.348700 -88.865700 x x x xCanton/Fulton RDD 40.564200 -89.973560Carbondale/Jackson RNI 37.698892 -89.223615Catherine/Lake RTD 42.485838 -88.128337 x x x x x xCedar/Jackson RNE 37.666115 -89.280560 x xCedar/Lake RTK 42.419726 -88.090281 x x xChannel/Lake RTI 42.486392 -88.137503 x x x x x xCharles/DuPage RGR 41.815560 -87.958059 x xCharleston SCR/Coles RBC 39.470281 -88.143616 x x x xCharlotte/Kane VTZ 41.915560 -88.370480 xChautauqua/Jackson SNA 37.726300 -89.302200 x x xChicago Botanic Garden/Cook RHJA 42.141504 -87.786226 x x x x xChrista/Lake STU 42.351451 -88.151454 x xCivic/Grundy WDK 41.310278 -88.284441 x x

Appendix A: Table 11Page 43
Aquatic Invasive Species Distribution 2007 thru 2013
2013 VLMP Report
Lake/CountyLake
CodeLatitude Longitude
Co
mm
on
Carp
Grass C
arp
Zebra M
ussel
Ru
sty Crayfish
Asian
Carp
Asian
Clam
Eurasian
Ru
ffe
Fishh
oo
k Waterflea
New
Zealand
Mu
dsn
ail
Qu
agga Mu
ssel
Spin
y Waterflea
Cu
rlyleaf Po
nd
weed
Eurasian
Waterm
ilfoil
Pu
rple Lo
osestrife
Hyd
rilla
Water H
yacinth
Flow
ering R
ush
Reed
Man
na G
rass
Country/Menard REQ 39.963400 -89.746800 x x xCountryside/Lake RGQ 42.253006 -88.044047 x x x x xCrab Orchard/Williamson RNA 37.722226 -89.144448 x x xCrooked/Lake RGZA 42.422503 -88.051670 x x xCross/Lake UTV 42.491583 -88.085749 x x xCrystal/McHenry VTZH 42.233436 -88.354408 x x x xDawson/McLean REE 40.403610 -88.722810 xDecatur/Macon REA 39.824449 -88.952504 xDeep Quarry/DuPage WGZK 41.939727 -88.178615 x x x x xDeep/Lake VTD 42.428337 -88.066889 x x xDevils Kitchen/Williamson RNJ 37.641948 -89.105560Diamond/Lake RGB 42.250230 -88.007290 x x x x xDinosaur/Will WDF 41.284591 -88.208087 xDrake/Cass REZR 40.003640 -90.083240 xDruce/Lake RGV 42.366900 -88.005000 x x x x x xDuck/Lake RTZG 42.376115 -88.121393 x x xDunlap/Madison RJD 38.807400 -89.937500 x xDutchman/Johnson RAM 37.491290 -88.913890 xEast Loon/Lake RTM 42.453337 -88.073337 x x x xEureka/Woodford SDS 40.705003 -89.277505 x xEvergreen/McLean SDA 40.648770 -89.054650Fawn Ridge 1/Cook UHI 41.565632 -87.733848 xFawn Ridge 2/Cook UHJ 41.565524 -87.735151 xFawn Ridge 3/Cook UHK 41.564232 -87.735078 xFischer/Lake VTT 42.358059 -88.157503 x x x x x xFish Trap/Jo Daviess RMF 42.382781 -90.467781 x x x x x x xFish/Lake VTK 42.335004 -88.156949 x xForest/Lake RGZG 42.213038 -88.054505 x x x xFourth/Lake RGZC 42.392098 -88.031469 x x x x xFox/Lake RTF 42.405281 -88.166671 x x xFyre/Mercer RLH 41.296000 -90.488400 x x xGages/Lake RGI 42.351380 -87.999440 x x x xGalena/Jo Daviess RMM 42.400400 -90.349200 x x x
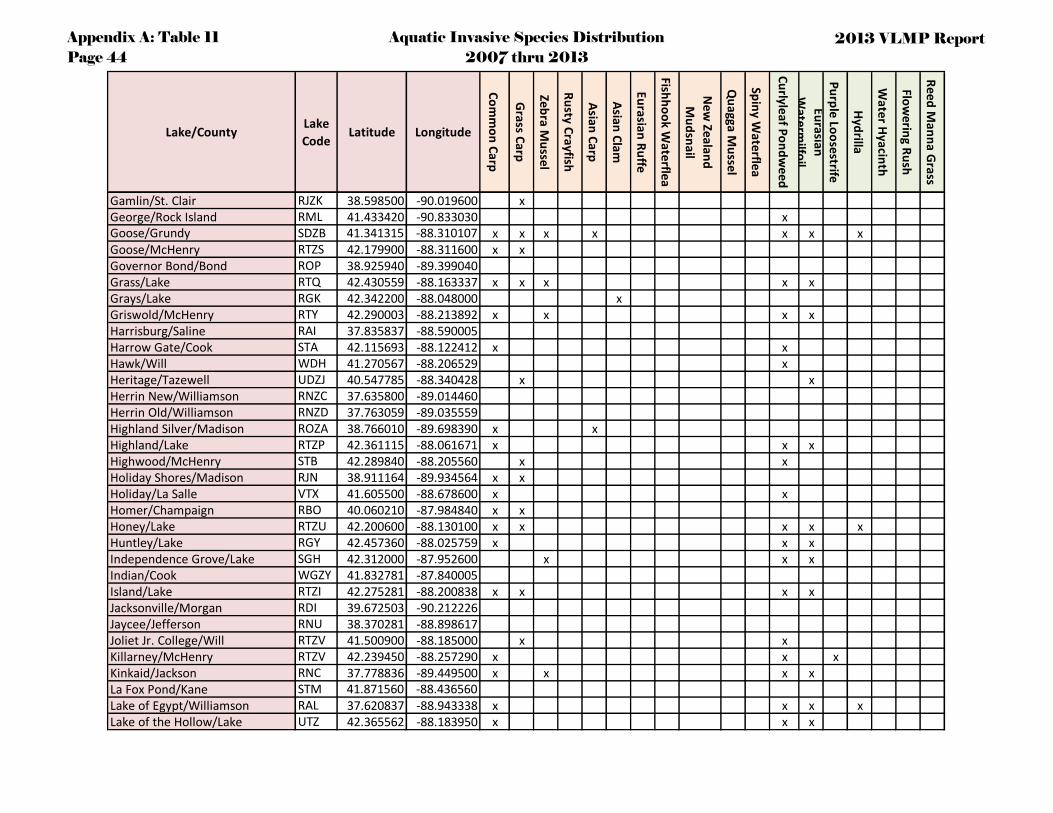
Appendix A: Table 11Page 44
Aquatic Invasive Species Distribution 2007 thru 2013
2013 VLMP Report
Lake/CountyLake
CodeLatitude Longitude
Co
mm
on
Carp
Grass C
arp
Zebra M
ussel
Ru
sty Crayfish
Asian
Carp
Asian
Clam
Eurasian
Ru
ffe
Fishh
oo
k Waterflea
New
Zealand
Mu
dsn
ail
Qu
agga Mu
ssel
Spin
y Waterflea
Cu
rlyleaf Po
nd
weed
Eurasian
Waterm
ilfoil
Pu
rple Lo
osestrife
Hyd
rilla
Water H
yacinth
Flow
ering R
ush
Reed
Man
na G
rass
Gamlin/St. Clair RJZK 38.598500 -90.019600 xGeorge/Rock Island RML 41.433420 -90.833030 xGoose/Grundy SDZB 41.341315 -88.310107 x x x x x x xGoose/McHenry RTZS 42.179900 -88.311600 x xGovernor Bond/Bond ROP 38.925940 -89.399040Grass/Lake RTQ 42.430559 -88.163337 x x x x xGrays/Lake RGK 42.342200 -88.048000 xGriswold/McHenry RTY 42.290003 -88.213892 x x x xHarrisburg/Saline RAI 37.835837 -88.590005Harrow Gate/Cook STA 42.115693 -88.122412 x xHawk/Will WDH 41.270567 -88.206529 xHeritage/Tazewell UDZJ 40.547785 -88.340428 x xHerrin New/Williamson RNZC 37.635800 -89.014460Herrin Old/Williamson RNZD 37.763059 -89.035559Highland Silver/Madison ROZA 38.766010 -89.698390 x xHighland/Lake RTZP 42.361115 -88.061671 x x xHighwood/McHenry STB 42.289840 -88.205560 x xHoliday Shores/Madison RJN 38.911164 -89.934564 x xHoliday/La Salle VTX 41.605500 -88.678600 x xHomer/Champaign RBO 40.060210 -87.984840 x xHoney/Lake RTZU 42.200600 -88.130100 x x x x xHuntley/Lake RGY 42.457360 -88.025759 x x xIndependence Grove/Lake SGH 42.312000 -87.952600 x x xIndian/Cook WGZY 41.832781 -87.840005Island/Lake RTZI 42.275281 -88.200838 x x x xJacksonville/Morgan RDI 39.672503 -90.212226Jaycee/Jefferson RNU 38.370281 -88.898617Joliet Jr. College/Will RTZV 41.500900 -88.185000 x xKillarney/McHenry RTZV 42.239450 -88.257290 x x xKinkaid/Jackson RNC 37.778836 -89.449500 x x x xLa Fox Pond/Kane STM 41.871560 -88.436560Lake of Egypt/Williamson RAL 37.620837 -88.943338 x x x xLake of the Hollow/Lake UTZ 42.365562 -88.183950 x x x

Appendix A: Table 11Page 45
Aquatic Invasive Species Distribution 2007 thru 2013
2013 VLMP Report
Lake/CountyLake
CodeLatitude Longitude
Co
mm
on
Carp
Grass C
arp
Zebra M
ussel
Ru
sty Crayfish
Asian
Carp
Asian
Clam
Eurasian
Ru
ffe
Fishh
oo
k Waterflea
New
Zealand
Mu
dsn
ail
Qu
agga Mu
ssel
Spin
y Waterflea
Cu
rlyleaf Po
nd
weed
Eurasian
Waterm
ilfoil
Pu
rple Lo
osestrife
Hyd
rilla
Water H
yacinth
Flow
ering R
ush
Reed
Man
na G
rass
Lake of the Woods/Champaign REG 40.200559 -88.381671 x x xLambert/DuPage SGG 41.857200 -88.078200 x xLe Aqua Na/Stephenson RPA 42.419410 -89.829930 x x xLeisure/Lake STG 42.436200 -88.185900 x xLeopold/Lake VGI 42.327082 -88.011318 x xLincoln/Grundy UDC 41.317348 -88.315116 x x x x xLinden/Lake RGC 42.420837 -88.028338 x xLittle Shadow/Will WDE 41.288308 -88.191078 xLittle Silver/Lake STC 42.473400 -88.074800 x x xLoch Lomond/Lake RGU 42.280600 -88.005100 x x x xLong/Lake RTJ 42.377781 -88.126115 x x x xLongmeadow/Cook RHZK 42.086309 -87.752877Lost Nation/Ogle RPZG 41.918423 -89.368541 x x x x xLouise/Lake VTZJ 42.160255 -88.114906 x x xLoveless/DuPage WGZZ 41.889110 -88.187290 xMaple/Cook RHD 41.714726 -87.887782 x x x x x xMarie/Lake RTR 42.462781 -88.134448 x xMattoon/Shelby RCF 39.334730 -88.482480Mauvaise Terre/Morgan SDL 39.720003 -90.214448McCullom/McHenry RTZD 42.361390 -88.288560 x xMcLeansboro New/Hamilton RAZA 38.084448 -88.553337Miller/Jefferson RNZI 38.396656 -88.892390 xMiltmore/Lake RGZD 42.396110 -88.041667 x x xMinear/Lake RGP 42.290317 -87.941458 x x x xMonee/Will RFH 41.388650 -87.761220 xMurphysboro/Jackson RND 37.773615 -89.380559 x xNapa Suwe/Lake STO 42.287042 -88.124777 x x x x xNew Thompson/Jackson RNZO 37.744167 -89.254722 x xNippersink/Lake RTUA 42.413060 -88.180559 x x x x xOlney East Fork/Richland RCC 38.761670 -88.076710Ossami/Tazewell SDZW 40.635586 -89.468316 xOtter/Macoupin RDF 39.408900 -89.911990 x x xParadise/Coles RCG 39.413120 -88.439630

Appendix A: Table 11Page 46
Aquatic Invasive Species Distribution 2007 thru 2013
2013 VLMP Report
Lake/CountyLake
CodeLatitude Longitude
Co
mm
on
Carp
Grass C
arp
Zebra M
ussel
Ru
sty Crayfish
Asian
Carp
Asian
Clam
Eurasian
Ru
ffe
Fishh
oo
k Waterflea
New
Zealand
Mu
dsn
ail
Qu
agga Mu
ssel
Spin
y Waterflea
Cu
rlyleaf Po
nd
weed
Eurasian
Waterm
ilfoil
Pu
rple Lo
osestrife
Hyd
rilla
Water H
yacinth
Flow
ering R
ush
Reed
Man
na G
rass
Pardum/Knox UDZH 40.740259 -89.987713 x xParis Twin East/Edgar RBL 39.630220 -87.677710Paris Twin West/Edgar RBX 39.635930 -87.694100Petersburg/Menard REL 39.988600 -89.850100 x xPetite/Lake VTW 42.429170 -88.131948 x x x x x x xPierce/Winnebago RPC 42.345330 -88.985100 x x x x xPinckneyville/Perry RHN 38.096670 -89.396671 x xPine/Lee RPZB 41.651800 -89.309500 x x x x x xPistakee/Lake RTU 42.381670 -88.199449 x x xPrairie/Cass REZP 39.995690 -90.058770 xRice/Knox RDC 40.949112 -90.325866 xRichardson Wildlife/Lee RPZI 41.715388 -89.188098Round/Lake RTH 42.361671 -88.076671 x x x x x xSalem/Marion ROR 38.641115 -88.945837 x xSanctuary Pond/DuPage SGX 41.854715 -88.195152 x x x x xSand/Lake RGM 42.412503 -88.043337 x x x xSara/Effingham RCE 39.126200 -88.618670 x xShadow/Henry RPZD 41.545800 -90.172500 x x xSilver/McHenry RTW 42.246650 -88.247460 x xSlocum/Lake RTP 42.260281 -88.188059 x xSpoon/Knox SDZH 40.951386 -90.126328 xSpring Arbor/Jackson RNZG 37.650281 -89.168893 x xSpring Ledge/Lake UGV 42.423260 -88.020624Spring North/Tazewell SDZM 40.492920 -89.830110 x xSpring South/Tazewell RDQ 40.441200 -89.898120 xSpring/Lake RGZT 42.445100 -88.126100 x x xSpring/McDonough RDR 40.506660 -90.717570Springfield/Sangamon REF 39.756115 -89.593616 xStephen/Will SGW 41.566400 -88.225981 x xSummerset/Winnebago RPI 42.448600 -89.384900 x x x x xSunset/Champaign REZN 40.181900 -88.423200 x xSunset/Lee RPL 41.647900 -89.293700 x x x x x xSunset/Macoupin UDH 39.436400 -89.855400 x x

Appendix A: Table 11Page 47
Aquatic Invasive Species Distribution 2007 thru 2013
2013 VLMP Report
Lake/CountyLake
CodeLatitude Longitude
Co
mm
on
Carp
Grass C
arp
Zebra M
ussel
Ru
sty Crayfish
Asian
Carp
Asian
Clam
Eurasian
Ru
ffe
Fishh
oo
k Waterflea
New
Zealand
Mu
dsn
ail
Qu
agga Mu
ssel
Spin
y Waterflea
Cu
rlyleaf Po
nd
weed
Eurasian
Waterm
ilfoil
Pu
rple Lo
osestrife
Hyd
rilla
Water H
yacinth
Flow
ering R
ush
Reed
Man
na G
rass
Sylvan/Lake RGZF 42.242147 -88.046133 x x x x xTaylorville/Christian REC 39.529448 -89.255838 xThird Shadow/Will WDD 41.283651 -88.202204 xThird/Lake RGW 42.370837 -88.014448 x x x x x xThree Oaks North/McHenry WTJ 42.223601 -88.302678 x xThree Oaks South/McHenry WTG 42.215852 -88.305410 x x xTimber/Lake RTZQ 42.240281 -88.127503 x x xTower/Lake RTZF 42.228185 -88.152374 x x xTully Monster/Will WDG 41.288228 -88.205731 x xTurnberry 1/McHenry SPA 42.217983 -88.386503 xTwin Oaks/Champaign REZL 40.213760 -88.375433 x x xValley/Lake RGZM 42.349920 -87.982673 xVermilion/Vermilion RBD 40.157400 -87.649100 xVernor/Richland RCA 38.763790 -88.102500 xVirginia/Cook SGB 42.146100 -87.945000 x xWaterford/Lake WGS 42.427200 -88.026400 x xWaverly/Morgan SDC 39.600837 -90.009170 xWee Ma Tuk/Fulton VDA 40.533220 -90.166110 xWeslake/St. Clair RJJ 38.595600 -90.029200 xWest Loon/Lake RTZB 42.452781 -88.083338 x x x x xWestlake/Winnebago RPZK 42.316337 -89.284705 x xWhite/Lake UGX 42.452028 -88.039653 x xWildwood/Marshall RDK 41.078559 -89.284450 xWillow Creek/Vermilion RBY 40.011475 -87.573732 xWillow/Stephenson RPZH 42.332711 -89.638531 x x xWonder/McHenry RTZC 42.375005 -88.354727 x xWoodhaven/Lee RPM 41.656600 -89.306100 x x x x xWoods Creek/McHenry RTZZ 42.180490 -88.318880 x xWooster/Lake RTZH 42.364448 -88.149449 x x x xZurich/Lake RTS 42.195003 -88.098337 x x x x x
111 59 39 17 12 2 1 1 1 1 1 103 89 21 17 6 3 1

Appendix A: Table 12Page 48
Illinois Environmental Protection Agency Department of Laboratory
Data Qualifiers
2013 VLMP Report
Code Description
B1 The sample matrix caused possible effects on measurement. The result may be biased low.
B2 The sample matrix caused possible effects on measurement. The result may be biased high.
CValue calculated. Value reported was not measured directly, but was calculated from other available
data.
I See Case Narrative for more information.
JEstimated number. The laboratory cannot support the validity of this number. The result is between the
method detection limit and the reporting limit.
J1 Surrogate compound recovery limits have not been met.
J2 Internal Standard criteria were not met.
J3The reported value failed to meet the established quality control criteria for either precision or accuracy
possibly due to matrix effects.
J5 Blank Spike failed high, result was less than the reporting limit – impact on data may be minimal.
J6 Blank Spike failed high – possible high bias or false positive result.
J7 Blank Spike failed low – possible low bias or false non-detect result at the reporting limit.
LActual value not known, but known to be greater than value shown. Value shown is the highest
acceptable level for quantification.
M Presence of material verified (i.e., positive detection). Value is estimated
Q Maximum holding time exceeded.
S Test results provided by outside source.
VIndicates the analyte was detected in the associated method blank and was outside method blank
acceptance criteria.
XReported value should not be used. Some or all of the quality control data for the analyte were outside
acceptance criteria, or the presence/absence of the analyte cannot be determined from the data.
Y The laboratory analysis was performed on an unpreserved or improperly preserved sample.
# Results are not compliant with the NELAC standards.
* Non-NELAP accredited.
Revision 10/31/2011

Appendix A: Table 13Page 49
Identifying Potential Sources of Use Impairment
in Illinois Freshwater Lakes
2013 VLMP Report
Potential Source Guidelines
Acid Mine DrainageLow pH and iron deposition due to mine drainage based upon actual
observation and/or other existing data.
AgricultureGeneral agricultural related activities based upon satellite land use,
actual observation and/or other existing data.
Animal Feeding Operations (NPS)Open area feedlots or animal holding buildings and impervious areas
based upon satellite land use, actual observation and/or other existing
data.Aquaculture (Not Permitted) or
Aquaculture (Permitted)
Fish production facility based upon actual observation and/or other
existing data.
Atmospheric Deposition – Acidity,
or Atmospheric Deposition –
Nitrogen, or Atmospheric
Deposition – Toxics
Atmospheric deposition of nutrients, minerals, etc based upon actual
observation and/or other existing data.
ChannelizationStraightening of stream meanders based upon actual observation
and/or other existing data.
Combined Sewer OverflowsCombined sanitary and storm sewer overflow based upon Facility-
Related Stream Survey, Agency effluent monitoring, Discharge
Monitoring Reports and/or other existing data.
Contaminated SedimentsHigh concentrations of metals and organic compounds in sediment
based upon actual observation and/or other existing data.
Crop Production (Crop Land or
Dry Land)
Nonirrigated crop production based upon satellite land use, actual
observation and/or other existing data.
Dam Construction (Other than
Upstream Flood Control Projects)
Dam construction activities based upon actual observation and/or
other existing data.
Discharges from Biosolids storage,
application or disposal
Storage, application or disposal of sludge based upon actual
observation and/or other existing data.
Drainage/Filling/Loss of WetlandsDraining or filling in of wetland areas based upon actual observation
and/or other existing data.
Dredge MiningUnderwater mining (e.g., sand and gravel) activities based upon
satellite land use, actual observation and/or other existing data.Dredging (e.g., for Navigation
Channels)
Deepening of stream channels based upon actual observation and/or
other existing data.
Golf Courses Golf course runoff directly to water
Habitat Modification - other than
Hydromodification
General alteration of riparian habitat based upon actual observation
and/or other existing dataHighway/Road/Bridge Runoff
(Nonconstruction Related)
Salt and pesticide runoff from highways, roads & bridges based upon
actual observation and/or other existing data.
Highways, Roads, Bridges,
Infrastructure (New Construction)
Highway/road/bridge construction activities based upon actual
observation and/or other existing data.
Impacts from Abandoned Mine
Lands (Inactive)
Abandoned mining operation based upon actual observation and/or
other existing data.

Appendix A: Table 13Page 50
Identifying Potential Sources of Use Impairment
in Illinois Freshwater Lakes
2013 VLMP Report
Potential Source Guidelines
Impacts from Hydrostructure Flow
Regulation/Modification
Alteration of normal flow regimes (e.g., dams, channelization,
impervious surfaces, water withdrawal) based upon actual
observation and/or other existing data.
Inappropriate Waste DisposalIllegal waste disposal sites based upon actual observation and/or
other existing data.
Industrial Land TreatmentLand application of industrial wastes based upon actual observation
and/or other existing data.
Industrial Point Source DischargeIndustrial point source discharge based upon Facility-Related Stream
Survey, Agency effluent, DMR and/or other existing data.
Irrigated Crop ProductionIrrigated crop production based upon satellite land use, actual
observation and/or other existing data.
Lake Fertilization
Artificial fertilization activities (e.g., addition of triple super-phosphate
to create algal blooms for macrophyte control or enhance lake fertility)
based upon actual observation and/or other existing data.
LandfillsLeachate and/or runoff from landfills based upon actual observation
and/or other existing data.Leaking Underground Storage
Tank Leaks
Leaks from storage tanks based upon actual observation and/or other
existing data.Livestock (Grazing or Feeding
Operations
Riparian and/or upland pastureland grazing based upon satellite land
use, actual observation and/or other existing data
Loss of Riparian HabitatRemoval of riparian vegetation based upon actual observation and/or
other existing data.
Marina Boat Construction, or
Marina Boat Maintenance, or
Marina Dredging Operations, or
Marina Fueling Operations, or
Marina-related Shoreline Erosion,
or Marina/Boating Pumpout
releases, or Marina/Boating
Sanitary On-vessel Discharges
In-water and on-land releases based upon actual observation and/or
other existing data.
Mill TailingsMilling operations based upon satellite land use, actual observation
and/or other existing data.
Mine TailingsMine processing activities (e.g., gob piles) based upon satellite land
use, actual observation and/or other existing data.
Municipal Point Source DischargesMunicipal point source discharge based upon Facility-Related Stream
Survey, Agency effluent, DMR and/or other existing data.
Natural Sources See source methodology.
On-site Treatment Systems (Septic
Systems and Similar Decentralized
Systems)
Septic system leachate or surface runoff based upon actual observation
and/or other existing data.
Other Recreational Pollution
Sources
Other recreational impacts based upon actual observation and/or
other existing data.
Other Spill Related ImpactsAccidental spills based upon actual observation and/or other existing
data.

Appendix A: Table 13Page 51
Identifying Potential Sources of Use Impairment
in Illinois Freshwater Lakes
2013 VLMP Report
Potential Source Guidelines
Permitted Silvicultural ActivitiesGeneral forest management related runoff based upon satellite land
use, actual observation and/or other existing data.
Pesticide Application
Herbicide/algicide applications (e.g., eradication of a beneficial
macrophyte community, reduced dissolved oxygen. levels after
application) based upon actual observation and/or other existing data.
Petroleum/Natural Gas ActivitiesOil and gas production activities based upon satellite land use, actual
observation and/or other existing data.
RCRA Hazardous Waste SitesHazardous waste leachate or surface runoff based upon actual
observation and/or other existing data.
Runoff from
Forest/Grassland/Parkland
Watershed related nonpoint source runoff other than from previously
specified sources (e.g., lawn or parkland fertilization, leaf litter/forest
bed runoff) based upon actual observation and/or other existing data.
Salt Storage SitesSalt storage for winter highway maintenance based upon actual
observation and/or other existing data.Sanitary Sewer Overflows
(Collection System Failures)
Broken sanitary sewer line or overflow based upon Facility-Related
Stream Survey, Agency effluent and/or other existing data.
Septage DisposalDisposal of septic tank sludge based upon actual observation and/or
other existing data.
Site Clearance (Land Development
or Redevelopment)
New residential/commercial construction activities based upon actual
observation and/or other existing data.
Source Unknown No identifiable source based upon available information.
Specialty Crop ProductionTruck farming, orchards, or horticultural areas based upon satellite
land use, actual observation and/or other existing data.Streambank
Modifications/Destabilization or
Littoral/Shore Area Modifications
(Nonriverine)
Shoreline modification/destabilization activities (e.g., bank erosion, rip
rap, loss of habitat) based upon actual observation and/or other
existing data.
Subsurface (Hardrock) MiningSubsurface coal mining activities based upon satellite land use, actual
observation and/or other existing data.
Surface MiningSurface mining (e.g., coal, limestone) activities based upon satellite
land use, actual observation and/or other existing data.Unpermitted Discharge (Domestic
Wastes)
Wildcat sewer discharge based upon Facility-Related Stream Survey,
Agency effluent and/or other existing data.Upstream Impoundments (e.g., Pl-
566 NRCS Structures)
Upstream impoundment based upon actual observation and/or other
existing data.
Urban Runoff/Storm SewersUrban and storm sewer runoff based upon actual observation and/or
other existing data
WaterfowlNutrient enrichment from waterfowl wastes based upon actual
observation and/or other existing data.