appendix b minnesota pollution control agency: …treecanopybmp.org/uploads/files/appendix b mpca...
TRANSCRIPT

Appendix B
Minnesota Pollution Control Agency:
Calculating Credits for Tree Trenches and Tree Boxes

6/28/2017 Calculating credits for tree trenches and tree boxes Minnesota Stormwater Manual
https://stormwater.pca.state.mn.us/index.php/Calculating_credits_for_tree_trenches_and_tree_boxes 1/19
Recommended pollutant removal efficiencies, in percent,for tree trench/tree box BMPs. Sources. NOTE: removalefficiencies are 100 percent for water that is infiltrated.
TSS=total suspended solids; TP=total phosphorus; PP=particulate phosphorus; DP=dissolved
phosphorus; TN=total nitrogen
TSS TP PP DP TN Metals Bacteria Hydrocarbons
85linktotable
linktotable
linktotable
50 35 95 80
Calculating credits for tree trenches and tree boxesGreen Infrastructure: Trees can be an important tool for retention and detention ofstormwater runoff. Trees provide additional benefits, including cleaner air, reductionof heat island effects, carbon sequestration, reduced noise pollution, reducedpavement maintenance needs, and cooler cars in shaded parking lots.
Credit refers to the quantity of stormwater or pollutant reduction achieved towardmeeting a runoff volume or water quality goal either by an individual BestManagement Practice (BMP) or cumulatively with multiple BMPs. Stormwatercredits are a tool for local stormwater authorities who are interested in
providing incentives to site developers to encourage the preservation of naturalareas and the reduction of the volume of stormwater runoff being conveyed to abest management practice (BMP);complying with permit requirements, including antidegradation (see [1]; [2]);meeting the MIDS performance goal; ormeeting or complying with water quality objectives, including Total Maximum Daily Load (TMDL) Wasteload Allocations (WLAs).
This page provides a discussion of how tree trench/tree box practices can achieve stormwater credits. Tree systems with and without underdrains areboth discussed, with separate sections for each type of system as appropriate.
Contents
1 Overview1.1 Pollutant removal mechanisms1.2 Location in the treatment train
2 Methodology for calculating credits2.1 Assumptions and approach2.2 Volume credit calculations no underdrain
2.2.1 Interception credit2.2.2 Infiltration and ET credits
2.3 Volume credit calculations underdrain2.4 Example calculation
2.4.1 Infiltration credit2.4.2 Evapotranspiration credit2.4.3 Interception credit2.4.4 Total credit
2.5 Total suspended solids credit calculations2.6 Phosphorus credit calculations
2.6.1 Example calculations3 Methods for calculating credits
3.1 Credits based on models3.2 The Simple Method and MPCA Estimator3.3 MIDS Calculator3.4 Credits based on reported literature values3.5 Credits based on field monitoring
4 Other pollutants5 References and suggested reading6 Related pages
Overview
6/28/2017 Calculating credits for tree trenches and tree boxes Minnesota Stormwater Manual
https://stormwater.pca.state.mn.us/index.php/Calculating_credits_for_tree_trenches_and_tree_boxes 2/19
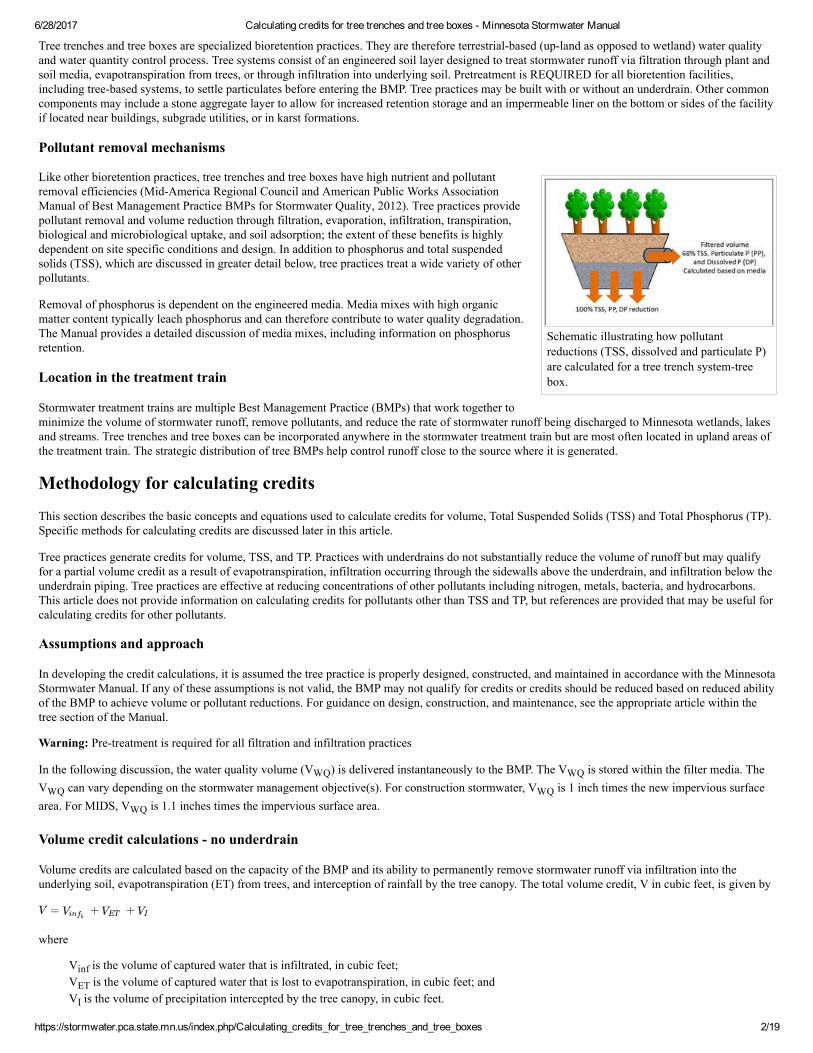
Schematic illustrating how pollutantreductions (TSS, dissolved and particulate P)are calculated for a tree trench systemtreebox.
Tree trenches and tree boxes are specialized bioretention practices. They are therefore terrestrialbased (upland as opposed to wetland) water qualityand water quantity control process. Tree systems consist of an engineered soil layer designed to treat stormwater runoff via filtration through plant andsoil media, evapotranspiration from trees, or through infiltration into underlying soil. Pretreatment is REQUIRED for all bioretention facilities,including treebased systems, to settle particulates before entering the BMP. Tree practices may be built with or without an underdrain. Other commoncomponents may include a stone aggregate layer to allow for increased retention storage and an impermeable liner on the bottom or sides of the facilityif located near buildings, subgrade utilities, or in karst formations.
Pollutant removal mechanisms
Like other bioretention practices, tree trenches and tree boxes have high nutrient and pollutantremoval efficiencies (MidAmerica Regional Council and American Public Works AssociationManual of Best Management Practice BMPs for Stormwater Quality, 2012). Tree practices providepollutant removal and volume reduction through filtration, evaporation, infiltration, transpiration,biological and microbiological uptake, and soil adsorption; the extent of these benefits is highlydependent on site specific conditions and design. In addition to phosphorus and total suspendedsolids (TSS), which are discussed in greater detail below, tree practices treat a wide variety of otherpollutants.
Removal of phosphorus is dependent on the engineered media. Media mixes with high organicmatter content typically leach phosphorus and can therefore contribute to water quality degradation.The Manual provides a detailed discussion of media mixes, including information on phosphorusretention.
Location in the treatment train
Stormwater treatment trains are multiple Best Management Practice (BMPs) that work together tominimize the volume of stormwater runoff, remove pollutants, and reduce the rate of stormwater runoff being discharged to Minnesota wetlands, lakesand streams. Tree trenches and tree boxes can be incorporated anywhere in the stormwater treatment train but are most often located in upland areas ofthe treatment train. The strategic distribution of tree BMPs help control runoff close to the source where it is generated.
Methodology for calculating credits
This section describes the basic concepts and equations used to calculate credits for volume, Total Suspended Solids (TSS) and Total Phosphorus (TP).Specific methods for calculating credits are discussed later in this article.
Tree practices generate credits for volume, TSS, and TP. Practices with underdrains do not substantially reduce the volume of runoff but may qualifyfor a partial volume credit as a result of evapotranspiration, infiltration occurring through the sidewalls above the underdrain, and infiltration below theunderdrain piping. Tree practices are effective at reducing concentrations of other pollutants including nitrogen, metals, bacteria, and hydrocarbons.This article does not provide information on calculating credits for pollutants other than TSS and TP, but references are provided that may be useful forcalculating credits for other pollutants.
Assumptions and approach
In developing the credit calculations, it is assumed the tree practice is properly designed, constructed, and maintained in accordance with the MinnesotaStormwater Manual. If any of these assumptions is not valid, the BMP may not qualify for credits or credits should be reduced based on reduced abilityof the BMP to achieve volume or pollutant reductions. For guidance on design, construction, and maintenance, see the appropriate article within thetree section of the Manual.
Warning: Pretreatment is required for all filtration and infiltration practices
In the following discussion, the water quality volume (VWQ) is delivered instantaneously to the BMP. The VWQ is stored within the filter media. TheVWQ can vary depending on the stormwater management objective(s). For construction stormwater, VWQ is 1 inch times the new impervious surfacearea. For MIDS, VWQ is 1.1 inches times the impervious surface area.
Volume credit calculations no underdrain
Volume credits are calculated based on the capacity of the BMP and its ability to permanently remove stormwater runoff via infiltration into theunderlying soil, evapotranspiration (ET) from trees, and interception of rainfall by the tree canopy. The total volume credit, V in cubic feet, is given by
where
Vinf is the volume of captured water that is infiltrated, in cubic feet;VET is the volume of captured water that is lost to evapotranspiration, in cubic feet; andVI is the volume of precipitation intercepted by the tree canopy, in cubic feet.
V = + +Vinfb VET VI

6/28/2017 Calculating credits for tree trenches and tree boxes Minnesota Stormwater Manual
https://stormwater.pca.state.mn.us/index.php/Calculating_credits_for_tree_trenches_and_tree_boxes 3/19
Schematic illustrating terms used forcalculating credits for a tree trench system.
Interception credit
Water intercepted by a tree canopy may evaporate or be slowly released such that it does not contribute to stormwater runoff. An interception credit isgiven by a simplified value of the interception capacity (Ic), as presented by Breuer et al. (2003) for deciduous and coniferous tree species.
Ic coniferous = 0.087 inches (2.2 millimeters)Ic deciduous = 0.043 inches (1.1 millimeters)
This credit is per storm event.
Infiltration and ET credits
The infiltration and ET credits are assumed to be instantaneous values entirely based on thecapacity of the BMP to capture, store, and transmit water in any storm event. Because the volume iscalculated as an instantaneous volume, the water quality volume (VWQ) is assumed to be instantlystored in the bioretention media. The volume of water between saturation and field capacity isassumed to infiltrate through the bottom of the BMP. The volume credit (Vinfb) for infiltration
through the bottom of the BMP into the underlying soil, in cubic feet, is given by
where
n is the porosity of the media in cubic feet per cubic foot;FC is the field capacity of the media in cubic feet per cubic foot;AM is the area at the surface of the media, in square feet;AB is the area at the bottom of the media, in square feet; andDM is the media depth within the BMP, in feet.
Vinfb should be calculated to infiltrate within a specific drawdown time. The construction stormwater permit has a 48 hour drawdown requirement (24
hours is recommended for discharges to trout streams).
ET is calculated as the volume of water between field capacity and the permanent wilting point. Two calculations are needed to determine theevapotranspiration (ET) credit. The smaller of the two calculated values will be used as the ET credit.
The first calculation is the volume of water available for ET. This equals the water stored between field capacity and the wilting point. Note thiscalculation is made for the entire thickness of the media.
The second calculation is the theoretical ET. The theoretical volume of ET lost (Lindsey and Bassuk, 1991) per day per tree is given by
Where:
CP is the canopy projection area (square feet);LAI is the Leaf Area Index;Erate is the evaporation rate per unit time (feet per day);Eratio is the evaporation ratio; and3 accounts for the number of days over which ET occurs (the average number of days between rain events in Minnesota).
Caution: The theoretical ET must be adjusted if the actual soil volume is less than the recommended volume. See the adjustment calculation below.
The canopy projection area (CP) is the perceived tree canopy diameter at maturity and is given by
where d is the diameter of the canopy as measured at the dripline (feet).
CP varies by tree species. Please refer to the Tree Species List for these values. Default values can be used in place of calculating CP. Defaults for CPare based on tree size and are
315 for a small tree;490 for a medium sized tree; and707 for a large tree.
The leaf area index (LAI) should be stratified by type into either
deciduous tree species (LAI = 3.5 for small trees, 4.1 for mediumsized trees, and 4.7 for large trees), or
= (n − FC) ( + ) /2Vinfb DM AM AB
ET = (CP )(LAI)( )( ) ∗ 3Erate Eratio
CP = Π(d/2)2

6/28/2017 Calculating credits for tree trenches and tree boxes Minnesota Stormwater Manual
https://stormwater.pca.state.mn.us/index.php/Calculating_credits_for_tree_trenches_and_tree_boxes 4/19
coniferous tree species (LAI = 5.47).
These values are based on collected research for global leaf area from 19322000 (Scurlock, Asner and Gower, 2002).
The evaporation rate (Erate) per unit time can be calculated using a pan evaporation rate for the given area, as available at NOAA. This should beestimated as a per day value.
The evaporation ratio (Eratio) is the equivalent that accounts for the efficiency of the leaves to transpire the available soil water or, alternately, thestomatal resistance of the canopy to transpiration and water movement. This is set at 0.20, or 20 percent based on research by Lindsey and Bassuk(1991). This means that a 1 square centimeter leaf transpires only about 1/5 as much as 1 square centimeter of pan surface.
If the soil volume is less than the recommended volume, the theoretical ET must be adjusted. Since the recommended soil volume equals 2 times thecanopy project area (CP), the adjustment term is given by
Where Sv is the actual soil volume in cubic feet. Multiply the theoretical ET by the adjustment term to arrive at the true value for theoretical ET.
It is recommended that calculations be based over a three day period. To determine the credit, compare the volume of water available for ET to thetheoretical ET over a 3 day period. The credit is the smaller of these two values.
Recommended values for porosity, field capacity and wilting point for different soils.1 Link to this table.
Soil Hydrologicsoil group
Porosity 2(volume/volume)
Field capacity(volume/volume)
Wilting point(volume/volume)
Porosity minus fieldcapacity
(volume/volume)3
Field capacity minuswilting point
(volume/volume)4
Sand A (GM, SW,or SP) 0.43 0.17 0.025 to 0.09 0.26 0.11
Loamysand
A (GM, SW,or SP) 0.44 0.09 0.04 0.35 0.05
Sandyloam
A (GM, SW,or SP) 0.45 0.14 0.05 0.31 0.09
Loam B (ML or OL) 0.47 0.25 to 0.32 0.09 to 0.15 0.19 0.16Silt loam B (ML or OL) 0.50 0.28 0.11 0.22 0.17Sandyclayloam
C 0.4 0.07
Clayloam D 0.46 0.32 0.15 0.14 0.17
Siltyclayloam
D 0.47 to 0.51 0.30 to 0.37 0.17 to 0.22 0.16 0.14
Sandyclay D 0.43 0.11
Siltyclay D 0.47 0.05
Clay D 0.47 0.32 0.20 0.15 0.12
1Sources of information include Saxton and Rawls (2006), Cornell University, USDANIFA, Minnesota Stormwater Manual
2Soil saturation is assumed to be equal to the porosity.
3This value may be used to represent the volume of water that will drain from a bioretention media.
4This value may be used to estimate the amount of water available for evapotranspiration
The annual volume captured and infiltrated by the BMP can be determined with appropriate modeling tools, including the MIDS calculator. Examplevalues are shown below for a scenario using the MIDS calculator. For example, a permeable pavement system designed to capture 1 inch of runofffrom impervious surfaces will capture 89 percent of annual runoff from a site with B (SM) soils.
Annual volume, expressed as a percent of annual runoff, treated by a BMP as a function of soil and water quality volume. See footnote1 forhow these were determined. Link to this table
Soil Water quality volume (VWQ) (inches)0.5 0.75 1.00 1.25 1.50
Adjustment = ( )/(2CP )Sv

6/28/2017 Calculating credits for tree trenches and tree boxes Minnesota Stormwater Manual
https://stormwater.pca.state.mn.us/index.php/Calculating_credits_for_tree_trenches_and_tree_boxes 5/19
Soil Water quality volume (VWQ) (inches)0.5 0.75 1.00 1.25 1.50
A (GW) 84 92 96 98 99A (SP) 75 86 92 95 97B (SM) 68 81 89 93 95B (MH) 65 78 86 91 94C 63 76 85 90 93
1Values were determined using the MIDS calculator. BMPs were sized to exactly meet the water quality volume for a 2 acre site with 1 acre of impervious, 1 acre of forested land, and annual rainfall of 31.9 inches.
Volume credit calculations underdrain
Volume credits for a tree system with an underdrain include the ET and interception credits discussed above and an infiltration credit. The main designvariables impacting the infiltration volume credit include whether the underdrain is elevated above the native soils and if an impermeable liner on thesides or bottom of the basin is used. Other design variables include media top surface area, underdrain location, basin bottom area, total depth of media,soil water holding capacity and media porosity, and infiltration rate of underlying soils. The total volume credit (Vinf), in cubic feet, is given by
where:
Vinfb = volume of infiltration through the bottom of the basin (cubic feet);Vinfs = volume of infiltration through the sides of the basin (cubic feet);VU = volume of water stored beneath the underdrain that will infiltrate into the underlying soil (cubic feet);VET = volume of captured water that is lost to evapotranspiration, in cubic feet; andVI = volume of precipitation intercepted by the tree canopy, in cubic feet.
Volume credits for ET and canopy interception remain the same as shown above
Volume credits for infiltration through the bottom of the basin (Vinfb) are accounted for only if the bottom of the basin is not lined and the BMP
permanently removes a portion of the stormwater runoff via infiltration through sidewalls or beneath the underdrain piping. As long as water continuesto draw down, some infiltration will occur through the bottom of the BMP. However, it is assumed that when an underdrain is included in theinstallation, the majority of water will be filtered through the media and exit through the underdrain. Because of this, the drawdown time is likely to beshort. Volume credit for infiltration through the bottom of the basin is given by
where
IR = design infiltration rate of underlying soil (inches per hour);AB = surface area at the bottom of the basin (square feet); andDDT = drawdown time for ponded water (hours).
Information: The MIDS calculator assigns a default value of 0.06 inches per hour, equivalent to a D soil, to IR. This is based on the assumption thatmost water will drain to the underdrain, but that some loss to underlying soil will occur. A conservative approach assuming a D soil was thus chosen.
The Construction Stormwater permit requires drawdown within 48 hours and recommends 24 hours when discharges are to a trout stream. With aproperly functioning underdrain, the drawdown time is likely to be considerably less than 48 hours.
Volume credit for infiltration through the sides of the basin is accounted for only if the sides of the basin are not lined with an impermeable liner.Volume credit for infiltration through the sides of the basin is given by
where
AM = the area at the media surface (square feet); andAU = the surface area at the underdrain (square feet).
Information: The MIDS calculator assigns a default value of 0.06 inches per hour, equivalent to a D soil, to IR. This is based on the assumption thatmost water will drain to the underdrain, but that some loss to underlying soil will occur. A conservative approach assuming a D soil was thus chosen.
This equation assumes water will infiltrate through the entire sideslope area during the period when water is being drawn down. This is not the case,however, since the water level will decline in the BMP. The MIDS calculator assumes a linear drop in water level and thus divides the right hand termin the above equation by 2.
= + + + +Vinf Vinfb Vinfs VU VET VI
= DDT /12VinfB AB IR
= ( − ) DDT /12Vinfs AM AU IR

6/28/2017 Calculating credits for tree trenches and tree boxes Minnesota Stormwater Manual
https://stormwater.pca.state.mn.us/index.php/Calculating_credits_for_tree_trenches_and_tree_boxes 6/19
Volume credit for media storage capacity below the underdrain (VU) is accounted for only if the underdrain is elevated above the native soils. Volumecredit for media storage capacity below the underdrain is given by
where
AB = surface area at the bottom of the media (square feet);n = media porosity (cubic feet per cubic foot);FC is the field capacity of the soil, in cubic feet per cubic foot; andDU = the depth of media below the underdrain (feet).
This equation assumes water between the soil porosity and field capacity will infiltrate into the underlying soil. Water stored below the underdrainshould infiltrate within a specified drawdown time. The construction stormwater permit has a 48 hour requirement for drawdown (24 hours isrecommended when discharges are to trout streams).
The ET and infiltration credits are assumed to be instantaneous values based on the design capacity of the BMP for a specific storm event.Instantaneous volume reduction, also termed event based volume reduction, can be converted to annual volume reduction percentages using the MIDScalculator or other appropriate modeling tools. Assuming an instantaneous volume will somewhat overestimate actual storage when the majority ofwater is being captured by the underdrains.
The volume of water passing through underdrains can be determined by subtracting the volume loss (V) from the volume of water instantaneouslycaptured by the BMP. No volume reduction credit is given for filtered stormwater that exits through the underdrain, but the volume of filtered water canbe used in the calculation of pollutant removal credits through filtration.
Example calculation
A parking lot is developed and will contain tree trenches containing red maple (Acer rubrum). The tree trench has 1000 cubic feet of sandy loam pertree. Note that the following calculations are on a per tree basis. Total volume credit for the BMP will equal the per tree value times the number oftrees, assuming all trees are of the same relative size (large in this case).
Infiltration credit
The infiltration credit is given by
Evapotranspiration credit
Using the tree morphology table, red maple is a large tree with a mature canopy of 30 feet. The available storage volume is given by
The theoretical ET volume is given by
The smaller value is the theoretical ET (28.2 cubic feet), so that is the volume credit. Note that if the recommended soil volume of 1414 cubic feet hadbeen used the credit would be 39.9 cubic feet.
To make this calculation we used the default value of 707 for CP and the soil volume information from the table above. The evaporation rate (Erate) of0.24 inches per day (0.02 feet per day) was from data collected at the Southwest Research and Outreach Center in Lamberton, Minnesota.
Interception credit
The interception credit is given by
The division by 12 converts the calculation to feet.
Total credit
The total credit is the sum of the infiltration, ET and interception credits and equals (310 + 28.2 + 2.5) or 340.7 cubic feet.
Total suspended solids credit calculations
TSS reduction credits correspond with volume reduction through infiltration/ET and filtration of water captured by the tree BMP and are given by
= (n − FC) ( + )/2VU DU AU AB
(soilvolume)(porosity − fieldcapacity) = 1000 ∗ 0.31 = 310cubicfeet
Soilvolume(fieldcapacity − wiltingpoint) = 1000 ∗ 0.09 = 90cubicfeet
(CP )(LAI)( )( )(adjustment)(3days) = 707 ∗ 4.7 ∗ 0.02 ∗ 0.2 ∗ (1000/(2 ∗ 707)) ∗ 3 = 28.2cubicfeetErate Eratio
707(0.043/12) = 2.5cubicfeet

6/28/2017 Calculating credits for tree trenches and tree boxes Minnesota Stormwater Manual
https://stormwater.pca.state.mn.us/index.php/Calculating_credits_for_tree_trenches_and_tree_boxes 7/19
Schematic illustrating how pollutantreductions (TSS, dissolved and particulate P)are calculated for the tree trench systemtreebox with an underdrain BMP in the MIDScalculator. If there is no underdrain, pollutantremoval for infiltrated water is 100 percent.
where
MTSS = TSS removal (pounds);MTSSi+ET = TSS removal from infiltrated and evapotranspired water (pounds); andMTSSf = TSS removal from filtered water (pounds).
Pollutant removal for infiltrated and evapotranspired water is assumed to be 100 percent. Theeventbased mass of pollutant removed through infiltration and ET, in pounds, is given by
underdrain no underdrain
where
EMCTSS is the event mean TSS concentration in runoff water entering the BMP (milligramsper liter).
The EMCTSS entering the BMP is a function of the contributing land use and treatment by upstream tributary BMPs. For more information on EMCvalues for TSS, link here. If there is no underdrain, the water quality volume (VWQ)) is used in this calculation.
Removal for the filtered portion is less than 100 percent. The eventbased mass of pollutant removed through filtration, in pounds, is given by
where
Vtotal is the total volume of water captured by the BMP (cubic feet); andRTSS is the TSS pollutant removal percentage for filtered runoff.
The Stormwater Manual provides a recommended value for RTSS of 0.85 (85 percent removal) for filtered water, while the MIDS calculator provides avalue of 0.65 (65 percent). Alternate justified percentages for TSS removal can be used if proven to be applicable to the BMP design.
The above calculations may be applied on an event or annual basis and are given by
where
F is the fraction of annual volume filtered through the BMP; andVannual is the annual volume treated by the BMP, in acrefeet.
Phosphorus credit calculations
Total phosphorus (TP) reduction credits correspond with volume reduction through infiltration/ET and filtration of water captured by the tree BMP andare given by
where
MTP = TP removal (pounds);MTPi+ET = TP removal from infiltrated and evapotranspired water (pounds); andMTPf = TP removal from filtered water (pounds).
Pollutant removal for infiltrated water is assumed to be 100 percent. The mass of pollutant removed through infiltration and ET, in pounds, is given by
underdrain no underdrain
where
EMCTP is the event mean TP concentration in runoff water entering the BMP (milligrams per liter).
The EMCTP entering the BMP is a function of the contributing land use and treatment by upstream tributary BMPs.
= +MTSS MTSSi+ETMTSSf
= 0.0000624 ( + + + ) EMMTSSi+ETVinfb Vinfs VU VET CTSS
= 0.0000624 EMMTSSi+ETVWQ CTSS
= 0.0000624 ( − ( + + )) EM MTSSfVtotal Vinfb Vinfs VU CTSS RTSS
= 2.72 F EM MTSSfVannual CTSS RTSS
= +MTP MTPi+ETMTPf
= 0.0000624 ( + + + ) EMMTPi+ETVinfb Vinfs VU VET CTP
= 0.0000624 ) EMMTPi+ETVWQ CTP

6/28/2017 Calculating credits for tree trenches and tree boxes Minnesota Stormwater Manual
https://stormwater.pca.state.mn.us/index.php/Calculating_credits_for_tree_trenches_and_tree_boxes 8/19
The filtration credit for TP in an underdrained system assumes removal rates based on the soil media mix used and the presence or absence ofamendments. Soil mixes with more than 30 mg/kg phosphorus (P) content are likely to leach phosphorus and do not qualify for a water quality credit. Ifthe soil phosphorus concentration is less than 30 mg/kg, the mass of phosphorus removed through filtration, in pounds, is given by
Information: Soil mixes C and D are assumed to contain less than 30 mg/kg of phosphorus and therefore do not require testing
Again, assuming the phosphorus content in the media is less than 30 milligrams per kilogram, the removal efficiency (RTP) provided in the StormwaterManual is a function of the fraction of phosphorus that is in particulate or dissolved form, the depth of the media, and the presence or absence of soilamendments. For the purpose of calculating credits it can be assumed that TP in storm water runoff consists of 55 percent particulate phosphorus (PP)and 45 percent dissolved phosphorus (DP). The removal efficiency for particulate phosphorus is 80 percent. The removal efficiency for dissolvedphosphorus is 20 percent if the media depth is 2 feet or greater. The efficiency decreases by 1 percent for each 0.1 foot decrease in media thicknessbelow 2 feet. If a soil amendment is added to the BMP design, an additional 40 percent credit is applied to dissolved phosphorus. Thus, the overallremoval efficiency, (RTP), expressed as a percent removal of total phosphorus, is given by
where
the first term on the right side of the equation represents the removal of particulate phosphorus;the second term on the right side of the equation represents the removal of dissolved phosphorus; andDMUmax=2 = the media depth above the underdrain, up to a maximum of 2 feet.
The following table can be used to calculate phosphorus credits.
Phosphorus credits for bioretention systems with an underdrain. Link to this table
Particulate phosphorus Dissolved phosphorus
Is Media Mix C or D being used or, if using a mix other than C or D, isthe media phosphorus content 30 mg/kg or less per the Mehlich 3 (orequivalent) test1?
If yes, particulate credit = 80% of the particulate fraction (assumedto be 55% of total P)If no or unknown, particulate credit = 0%
TP removal credit
Particulate fraction (55% of TP) * removal rate for that fraction(80%) = 0.55 * 0.80 = 0.44 or 44%
1. Is Media Mix C or D being used or, if using a mix other than C or D, isthe media phosphorus content 30 mg/kg or less per the Mehlich 3 (orequivalent) test1?
If yes, credit as a % (up to a maximum of 20%) = 20 * (depth ofmedia above underdrain, in feet/2)If no or unknown, credit = 0%
2. Does the system include approved Psorbing soil amendments2?
If yes, additional 40% credit
TP removal credit
TP removal if dissolved credit is 20% = Dissolved fraction (45%) *removal rate for that fraction (20%) = 0.09 or 9 percentAdjust TP removal if depth is less than 2 feetAdjust TP removal if dissolved credit is higher due to use of Psorbing soil amendments
1Other widely accepted soil P tests may be used. Note: a basic conversion of test results may be necessary
2Acceptable P sorption amendments include
5% by volume elemental iron filings above IWS or elevated underdrainminimum 5% by volume sorptive media above IWS or elevated underdrainminimum 5% by weight water treatment residuals (WTR) to a depth of at least 10 cmother P sorptive amendments with supporting third party research results showing P reduction for at least 20 year lifespan, P credit commensurate with research results
Example calculations
Example 1 Assume the following:
A tree trench with an underdrain has 1 foot of media above the underdrain50 percent of annual runoff is infiltrated into the underlying soil40 percent of annual runoff is captured by the underdrain10 percent of annual runoff bypasses the BMPMedia Mix A is used and soil phosphorus is 32 milligrams per kilogramWater Treatment Residuals, 7 percent by weight, have been mixed into the top 15 centimeters of the media.
= 0.0000624 ( − ( + + + )) EM MTPfVtotal Vinfb Vinfs VU VET CTP RTP
= (0.8 ∗ 0.55) + (0.45 ∗ ((0.2 ∗ ( )/2) + )) ∗ 100RTP DMUmax=20.40ifamendmentisused

6/28/2017 Calculating credits for tree trenches and tree boxes Minnesota Stormwater Manual
https://stormwater.pca.state.mn.us/index.php/Calculating_credits_for_tree_trenches_and_tree_boxes 9/19
The credits are as follows
100 percent credit for infiltrated runoff = 50 percent of annual runoff = 50 percent of annual phosphorus loadFor water that is captured by the underdrain
The media is Mix A with a P content greater than 30 milligrams per kilogram, resulting in no credit for particulate or dissolved phosphorusA Psorbing amendment has been added to the media and meets the requirements for a credit of 40 percent. The credit applies to thedissolved portion of phosphorus, which is 45 percent of total phosphorus. The credit is therefore 40 percent times 45 percent times theannual runoff volume of 40 percent, resulting in a credit of 7 percent of total annual P (0.4 * 0.45 * 0.4).
No credit for water that bypasses the BMPThe total credit is 57 percent of the annual P load.
Example 2 Assume the following:
A tree trench with an underdrain has 1 foot of media above the underdrain50 percent of annual runoff is infiltrated into the underlying soil40 percent of annual runoff is captured by the underdrain10 percent of annual runoff bypasses the BMPMedia Mix C is used
The credits are as follows
100 percent credit for infiltrated runoff = 50 percent of annual runoff = 50 percent of annual phosphorus loadFor water that is captured by the underdrain
The media is Mix C resulting in 80 percent credit for particulate phosphorus. Since particulate P is 55 percent of total P, the credit is 0.80 *0.55 * 0.40 = 18 percent. The value of 0.4 in the equation accounts for 40 percent of the annual runoff volume.The media mix is C and there is 1 foot of media above the underdrain. The credit is 0.2 * 1/2 * 0.45 = 5 percent. The 1/2 adjusts for thethickness of media above the underdrain and the 0.45 accounts for 45 percent of total phosphorus being in dissolved form.
No credit for water that bypasses the BMPThe total phosphorus credit is 73 percent of the annual P load (50 + 18 +5).
Methods for calculating credits
Tree trenches and tree boxes are specialized bioretention BMPs. This section provides specific information on generating and calculating credits frombioretention BMPS, including treebased systems, for volume, Total Suspended Solids (TSS) and Total Phosphorus (TP). Stormwater runoff volumeand pollution reductions (“credits”) may be calculated using one of the following methods:
1. Quantifying volume and pollution reductions based on accepted hydrologic models2. The Simple Method and MPCA Estimator3. MIDS Calculator4. Quantifying volume and pollution reductions based on values reported in literature5. Quantifying volume and pollution reductions based on field monitoring
Credits based on models
Users may opt to use a water quality model or calculator to compute volume, TSS and/or TP pollutant removal for the purpose of determining credits.The available models described below are commonly used by water resource professionals, but are not explicitly endorsed or required by the MinnesotaPollution Control Agency. Furthermore, many of the models listed below cannot be used to determine compliance with the Construction StormwaterGeneral permit since the permit requires the water quality volume to be calculated as an instantaneous volume.
Use of models or calculators for the purpose of computing pollutant removal credits should be supported by detailed documentation, including:
Model name and versionDate of analysisPerson or organization conducting analysisDetailed summary of input dataCalibration and verification informationDetailed summary of output data
The following table lists water quantity and water quality models that are commonly used by water resource professionals to predict the hydrologic,hydraulic, and/or pollutant removal capabilities of a single or multiple stormwater BMPs. The table can be used to guide a user in selecting the mostappropriate model for computing volume, TSS, and/or TP removal for bioretention BMPs, including treebased systems. In using this table, use the sortarrow on the table to select Infiltrator BMPs or Filter BMPs, depending on the type of tree BMP and the terminology used in the model.
Comparison of stormwater models and calculators. Additional information and descriptions for some of the models listed in this table can befound at this link. Note that the Construction Stormwater General Permit requires the water quality volume to be calculated as aninstantaneous volume, meaning several of these models cannot be used to determine compliance with the permit. Link to this table Access this table as a Microsoft Word document: File:Stormwater Model and Calculator Comparisons table.docx.
Model name BMP Category Assess Assess Assess Comments

6/28/2017 Calculating credits for tree trenches and tree boxes Minnesota Stormwater Manual
https://stormwater.pca.state.mn.us/index.php/Calculating_credits_for_tree_trenches_and_tree_boxes 10/19
TPremoval?
TSSremoval?
volumereduction?
Constructedbasin BMPs
FilterBMPs
InfiltratorBMPs
SwaleorstripBMPs
ReuseManu factureddevices
Model name BMP Category Assess
TPremoval?
Assess
TSSremoval?
Assess
volumereduction?
Comments
Constructedbasin BMPs
FilterBMPs
InfiltratorBMPs
SwaleorstripBMPs
ReuseManu factureddevicesCenter for
NeighborhoodTechnologyGreen ValuesNationalStormwaterManagementCalculator
X X X X No No Yes
Does notcomputevolumereduction forsome BMPs,includingcisterns andtree trenches.
CivilStorm Yes Yes Yes
CivilStormhas anengineeringlibrary withmanydifferent typesof BMPs tochoose from.This listchanges asnewinformationbecomesavailable.
EPA NationalStormwaterCalculator
X X X No No Yes
Primarypurpose is toassessreductions instormwatervolume.
EPA SWMM X X X Yes Yes Yes
User definesparameter thatcan be used tosimulategeneralizedconstituents.
HydroCAD X X X No No Yes
Will assesshydraulics,volumes, andpollutantloading, butnot pollutantreduction.
infoSWMM X X X Yes Yes Yes
User definesparameter thatcan be used tosimulategeneralizedconstituents.
infoWorks ICM X X X X Yes Yes Yes
iTreeHydro X No No Yes
Includessimplecalculator forrain gardens.
iTreeStreets No No Yes
Computesvolumereduction fortrees, only.

6/28/2017 Calculating credits for tree trenches and tree boxes Minnesota Stormwater Manual
https://stormwater.pca.state.mn.us/index.php/Calculating_credits_for_tree_trenches_and_tree_boxes 11/19
Model name BMP Category Assess
TPremoval?
Assess
TSSremoval?
Assess
volumereduction?
Comments
Constructedbasin BMPs
FilterBMPs
InfiltratorBMPs
SwaleorstripBMPs
ReuseManu factureddevices
LSPC X X X Yes Yes Yes
Thoughdeveloped forHSPF, theUSEPA BMPWeb Toolkitcan be usedwith LSPC tomodelstructuralBMPs such asdetentionbasins, orinfiltrationBMPs thatrepresentsource controlfacilities,which capturerunoff fromsmallimperviousareas (e.g.,parking lots orrooftops).
MapShed X X X X Yes Yes Yes
Regionspecific inputdata notavailable forMinnesota butuser cancreate thisdata for anyregion.
MCWD/MWMOStormwaterReuse Calculator
X Yes No Yes
Computesstoragevolume forstormwaterreuse systems
MetropolitanCouncilStormwaterReuse GuideExcelSpreadsheet
X No No Yes
Computesstoragevolume forstormwaterreuse systems.Uses 30yearprecipitationdata specificto Twin Citesregion ofMinnesota.
MIDS Calculator X X X X X X Yes Yes Yes
Includes userdefinedfeature thatcan be usedformanufactureddevices andother BMPs.

6/28/2017 Calculating credits for tree trenches and tree boxes Minnesota Stormwater Manual
https://stormwater.pca.state.mn.us/index.php/Calculating_credits_for_tree_trenches_and_tree_boxes 12/19
Model name BMP Category Assess
TPremoval?
Assess
TSSremoval?
Assess
volumereduction?
Comments
Constructedbasin BMPs
FilterBMPs
InfiltratorBMPs
SwaleorstripBMPs
ReuseManu factureddevices
MIKE URBAN(SWMM orMOUSE)
X X X Yes Yes Yes
User definesparameter thatcan be used tosimulategeneralizedconstituents.
P8 X X X X Yes Yes Yes
PCSWMM X X X Yes Yes Yes
User definesparameter thatcan be used tosimulategeneralizedconstituents.
PLOAD X X X X X Yes Yes No
Userdefinedpractices withuserspecifiedremovalpercentages.
PondNet X Yes No Yes
Flow andphosphorusrouting inpondnetworks.
PondPack X [ No No Yes
PondPack cancalculate firstflush volume,but does notmodelpollutants. Itcan be used tocalculate pondinfiltration.
RECARGA X No No Yes
SELECT X X X X X Yes Yes Yes
User definesparameter thatcan be used tosimulategeneralizedconstituents.
SHSAM X No Yes No
Several flowthroughstructuresincludingstandardsumps, andproprietarysystems suchas CDS,Stormceptors,and Vortechssystems
SUSTAIN X X X X X Yes Yes Yes
CategorizesBMPs intoPoint BMPs,Linear BMPs,and AreaBMPs

6/28/2017 Calculating credits for tree trenches and tree boxes Minnesota Stormwater Manual
https://stormwater.pca.state.mn.us/index.php/Calculating_credits_for_tree_trenches_and_tree_boxes 13/19
Model name BMP Category Assess
TPremoval?
Assess
TSSremoval?
Assess
volumereduction?
Comments
Constructedbasin BMPs
FilterBMPs
InfiltratorBMPs
SwaleorstripBMPs
ReuseManu factureddevices
SWAT X X X Yes Yes Yes
Model offersmanyagriculturalBMPs andpractices, butlimited urbanBMPs at thistime.
Virginia RunoffReductionMethod
X X X X X X Yes No Yes
Users inputEvent MeanConcentration(EMC)pollutantremovalpercentagesformanufactureddevices.
WARMF X X Yes Yes Yes
IncludesagricultureBMPassessmenttools.Compatiblewith USEPABasins
WinHSPF X X X Yes Yes Yes
USEPA BMPWeb Toolkitavailable toassist withimplementingstructuralBMPs such asdetentionbasins, orinfiltrationBMPs thatrepresentsource controlfacilities,which capturerunoff fromsmallimperviousareas (e.g.,parking lots orrooftops).
WinSLAMM X X X X Yes Yes Yes
XPSWMM X X X Yes Yes Yes
User definesparameter thatcan be used tosimulategeneralizedconstituents.
The Simple Method and MPCA Estimator

6/28/2017 Calculating credits for tree trenches and tree boxes Minnesota Stormwater Manual
https://stormwater.pca.state.mn.us/index.php/Calculating_credits_for_tree_trenches_and_tree_boxes 14/19
Download the MIDS Calculator
The Simple Method is a technique used for estimating storm pollutant export delivered from urban development sites. Pollutant loads are estimated asthe product of mean pollutant concentrations and runoff depths over specified periods of time (usually annual or seasonal). The method was developedto provide an easy yet reasonably accurate means of predicting the change in pollutant loadings in response to development. Ohrel (2000) states: "Ingeneral, the Simple Method is most appropriate for small watersheds (<640 acres) and when quick and reasonable stormwater pollutant load estimatesare required". Rainfall data, land use (runoff coefficients), land area, and pollutant concentration are needed to use the Simple Method. For moreinformation on the Simple Method, see The Simple method to Calculate Urban Stormwater Loads or The Simple Method for estimating phosphorusexport.
Some simple stormwater calculators utilize the Simple Method (STEPL, Watershed Treatment Model). The MPCA developed a simple calculator forestimating load reductions for TSS, total phosphorus, and bacteria. Called the MPCA Estimator, this tool was developed specifically for complyingwith the MS4 General Permit TMDL annual reporting requirement. The MPCA Estimator provides default values for pollutant concentration, runoffcoefficients for different land uses, and precipitation, although the user can modify these and is encouraged to do so when local data exist. The user isrequired to enter area for different land uses and area treated by BMPs within each of the land uses. BMPs include infiltrators (e.g. bioinfiltration,infiltration basin, tree trench, permeable pavement, etc.), filters (biofiltration, sand filter, green roof), constructed ponds and wetlands, andswales/filters. The MPCA Estimator includes standard removal efficiencies for these BMPs, but the user can modify those values if better data areavailable. Output from the calculator is given as a load reduction (percent, mass, or number of bacteria) from the original estimated load.
Warning: The MPCA Estimator should not be used for modeling a stormwater system or selecting BMPs.
Because the MPCA Estimator does not consider BMPs in series, makes simplifying assumptions about runoff and pollutant removal processes, anduses generalized default information, it should only be used for estimating pollutant reductions from an estimated load. It is not intended as a decisionmaking tool.
Download MPCA Estimator here: File:MPCA Estimator.xlsx
A quick guide for the estimator is available Quick Guide: MPCA Estimator tab.
MIDS Calculator
The Minimal Impact Design Standards (MIDS) best management practice (BMP) calculator is atool used to determine stormwater runoff volume and pollutant reduction capabilities of various lowimpact development (LID) BMPs. The MIDS calculator estimates the stormwater runoff volumereductions for various BMPs and annual pollutant load reductions for total phosphorus (including abreakdown between particulate and dissolved phosphorus) and total suspended solids (TSS). Thecalculator was intended for use on individual development sites, though capable modelers couldmodify its use for larger applications.
The MIDS calculator is designed in Microsoft Excel with a graphical user interface (GUI), packaged as a windows application, used to organize inputparameters. The Excel spreadsheet conducts the calculations and stores parameters, while the GUI provides a platform that allows the user to enter dataand presents results in a userfriendly manner.
Detailed guidance has been developed for all BMPs in the calculator, including tree systems with an underdrain and without an underdrain. Anoverview of individual input parameters and workflows is presented in the MIDS Calculator User Documentation.
Credits based on reported literature values
A simplified approach to computing a credit would be to apply a reduction value found in literature to the pollutant mass load or concentration (EMC)entering the BMP. Concentration reductions resulting from treatment can be converted to mass reductions if the volume of stormwater treated is known.
Designers may use the pollutant reduction values reported in this manual or may research values from other databases and published literature.Designers who opt for this approach should
select the median value from pollutant reduction databases that report a range of reductions, such as from the International BMP Database;select a pollutant removal reduction from literature that studied a BMP with site characteristics and climate similar to the device being consideredfor credits;review the article to determine that the design principles of the studied BMP are close to the design recommendations for Minnesota, asdescribed in this manual and/or by a local permitting agency; andgive preference to literature that has been published in a peerreviewed publication.
Information: Tree trenches and tree boxes are bioretention practices, but there is limited information in the literature on pollutant removal in treebased systems. The following references provide information for bioretention systems, which can be applied to treebased practices
The following references summarize pollutant reduction values from multiple studies or sources that could be used to determine credits for bioretentionsystems. Users should note that there is a wide range of monitored pollutant removal effectiveness in the literature. Before selecting a literature value,users should compare the characteristics of the monitored site in the literature against the characteristics of the proposed bioretention device,considering such conditions as watershed characteristics, bioretention sizing, soil infiltration rates, and climate factors.
International Stormwater Best Management Practices (BMP) Database Pollutant Category Summary Statistical Addendum: TSS, Bacteria,Nutrients, and Metals
Compilation of BMP performance studies published through 2011

6/28/2017 Calculating credits for tree trenches and tree boxes Minnesota Stormwater Manual
https://stormwater.pca.state.mn.us/index.php/Calculating_credits_for_tree_trenches_and_tree_boxes 15/19
Provides values for TSS, Bacteria, Nutrients, and MetalsApplicable to grass strips, bioretention, bioswales, detention basins, green roofs, manufactured devices, media filters, porous pavements,wetland basins, and wetland channels
Effectiveness Evaluation of Best Management Practices for Stormwater Management in Portland, OregonAppendix M contains Excel spreadsheet of structural and nonstructural BMP performance evaluationsProvides values for sediment, nutrients, pathogens, metals, quantity, air purification, carbon sequestration, flood storage, avian habitat,aquatics habitat and aestheticsApplicable to filters, wet ponds, porous pavements, soakage trenches, flowthrough stormwater planters, infiltration stormwater planters,vegetated infiltration basins, swales, and treatment wetlands
The Illinois Green Infrastructure StudyFigure ES1 summarizes BMP effectivenessProvides values for TN, TSS, peak flows / runoff volumesApplicable to permeable pavements, constructed wetlands, infiltration, detention, filtration, and green roofs
New Hampshire Stormwater ManualVolume 2, Appendix B summarizes BMP effectivenessProvides values for TSS, TN, and TP removalApplicable to basins and wetlands, stormwater wetlands, infiltration practices, filtering practices, treatment swales, vegetated buffers, andpretreatment practices
Design Guidelines for Stormwater Bioretention Facilities. University of Wisconsin, MadisonTable 21 summarizes typical removal ratesProvides values for TSS, metals, TP, TKN, ammonium, organics, and bacteriaApplicable for bioretention
BMP Performance Analysis. Prepared for US EPA Region 1, Boston MA.Appendix B provides pollutant removal performance curvesProvides values for TP, TSS, and zincPollutant removal broken down according to land useApplicable to infiltration trench, infiltration basin, bioretention, grass swale, wet pond, and porous pavement
Weiss, P.T., J.S. Gulliver and A.J. Erickson. 2005. The Cost and Effectiveness of Stormwater Management Practices: Final ReportTable 8 and Appendix B provides pollutant removal efficiencies for TSS and PApplicable to wet basins, stormwater wetlands, bioretention filter, sand filter, infiltration trench, and filter strips/grass swales
Credits based on field monitoring
Field monitoring may be used to calculate stormwater credits in lieu of desktop calculations or models/calculators as described. Careful planning isHIGHLY RECOMMENDED before commencing a program to monitor the performance of a BMP. The general steps involved in planning andimplementing BMP monitoring include the following.
Establish the objectives and goals of the monitoring.Which pollutants will be measured?Will the monitoring study the performance of a single BMP or multiple BMPs?Are there any variables that will affect the BMP performance? Variables could include design approaches, maintenance activities, rainfallevents, rainfall intensity, etc.Will the results be compared to other BMP performance studies?What should be the duration of the monitoring period? Is there a need to look at the annual performance vs the performance during a singlerain event? Is there a need to assess the seasonal variation of BMP performance?
Plan the field activities. Field considerations include:Equipment selection and placementSampling protocols including selection, storage, delivery to the laboratoryLaboratory servicesHealth and Safety plans for field personnelRecord keeping protocols and formsQuality control and quality assurance protocols
Execute the field monitoringAnalyze the results
The following guidance manuals have been developed to assist BMP owners and operators on how to plan and implement BMP performancemonitoring.
Urban Stormwater BMP Performance Monitoring
Geosyntec Consultants and Wright Water Engineers prepared this guide in 2009 with support from the USEPA, Water Environment ResearchFoundation, Federal Highway Administration, and the Environment and Water Resource Institute of the American Society of Civil Engineers. Thisguide was developed to improve and standardize the protocols for all BMP monitoring and to provide additional guidance for Low ImpactDevelopment (LID) BMP monitoring. Highlighted chapters in this manual include:
Chapter 2: Designing the ProgramChapters 3 & 4: Methods and EquipmentChapters 5 & 6: Implementation, Data Management, Evaluation and ReportingChapter 7: BMP Performance AnalysisChapters 8, 9, & 10: LID Monitoring

6/28/2017 Calculating credits for tree trenches and tree boxes Minnesota Stormwater Manual
https://stormwater.pca.state.mn.us/index.php/Calculating_credits_for_tree_trenches_and_tree_boxes 16/19
Evaluation of Best Management Practices for Highway Runoff Control (NCHRP Report 565)
AASHTO (American Association of State Highway and Transportation Officials) and the FHWA (Federal Highway Administration) sponsored this2006 research report, which was authored by Oregon State University, Geosyntec Consultants, the University of Florida, and the Low ImpactDevelopment Center. The primary purpose of this report is to advise on the selection and design of BMPs that are best suited for highway runoff. Thedocument includes the following chapters on performance monitoring that may be a useful reference for BMP performance monitoring, especially forthe performance assessment of a highway BMP:
Chapter 4: Stormwater Characterization4.2: General Characteristics and Pollutant Sources4.3: Sources of Stormwater Quality data
Chapter 8: Performance Evaluation8.1: Methodology Options8.5: Evaluation of Quality Performance for Individual BMPs8.6: Overall Hydrologic and Water Quality Performance Evaluation
Chapter 10: Hydrologic Evaluation10.5: Performance Verification and Design Optimization
Investigation into the Feasibility of a National Testing and Evaluation Program for Stormwater Products and Practices.
In 2014 the Water Environment Federation released this White Paper that investigates the feasibility of a national program for the testing of stormwaterproducts and practices. The information contained in this White Paper would be of use to those considering the monitoring of a manufactured BMP.The report does not include any specific guidance on the monitoring of a BMP, but it does include a summary of the existing technical evaluationprograms that could be consulted for testing results for specific products (see Table 1 on page 8).
Caltrans Stormwater Monitoring Guidance Manual (Document No. CTSWOT13999.43.01)
The most current version of this manual was released by the State of California, Department of Transportation in November 2013. As with the othermonitoring manuals described, this manual does include guidance on planning a stormwater monitoring program. However, this manual is among themost thorough for field activities. Relevant chapters include:
Chapter 4: Monitoring Methods and EquipmentChapter 5: Analytical Methods and Laboratory SelectionChapter 6: Monitoring Site SelectionChapter 8: Equipment Installation and MaintenanceChapter 10: PreStorm PreparationChapter 11: Sample Collection and HandlingChapter 12: Quality Assurance / Quality ControlChapter 13: Laboratory Reports and Data ReviewChapter 15: Gross Solids Monitoring
Optimizing Stormwater Treatment Practices: A Handbook of Assessment and Maintenance
This online manual was developed in 2010 by Andrew Erickson, Peter Weiss, and John Gulliver from the University of Minnesota and St. AnthonyFalls Hydraulic Laboratory with funding provided by the Minnesota Pollution Control Agency. The manual advises on a fourlevel process to assess theperformance of a Best Management Practice, involving:
Level 1: Visual InspectionLevel 2: Capacity TestingLevel 3: Synthetic Runoff TestingLevel 4: MonitoringLevel 1 activities do not produce numerical performance data that could be used to obtain a stormwater management credit. BMP owners andoperators who are interested in using data obtained from Levels 2 and 3 should consult with the MPCA or other regulatory agency to determine ifthe results are appropriate for credit calculations. Level 4, Monitoring, is the method most frequently used for assessment of the performance of aBMP.
Use these links to obtain detailed information on the following topics related to BMP performance monitoring:
Water Budget MeasurementSampling MethodsAnalysis of Water and SoilsData Analysis for Monitoring
Other pollutants
In addition to TSS and phosphorus, bioretention BMPs can reduce loading of other pollutants. According to the International Stormwater Database,studies have shown that bioretention BMPs are effective at reducing concentrations of pollutants, including metals, and bacteria. A compilation of thepollutant removal capabilities from a review of literature are summarized below.
Relative pollutant reduction from bioretention systems for metals, nitrogen, bacteria, and organics. Link to this table

6/28/2017 Calculating credits for tree trenches and tree boxes Minnesota Stormwater Manual
https://stormwater.pca.state.mn.us/index.php/Calculating_credits_for_tree_trenches_and_tree_boxes 17/19
Pollutant Constituent Treatment capabilities1
Metals2 Cadmium, Chromium, Copper, Zinc, Lead High
Nitrogen2 Total nitrogen, Total Kjeldahl nitrogen Low/medium
Bacteria2 Fecal coliform, e. coli HighOrganics Petroleum hydrocarbons3, Oil/grease4 High
1 Low: < 30%; Medium: 30 to 65%; High: >65%
2 International Stormwater Database, (2012)
3 LeFevre et al., (2012)
4 Hsieh and Davis (2005).
References and suggested reading
To see how some other cities are calculating tree credits, see Cities That are Pioneers in Developing Stormwater Credit Systems for Trees (Shanstrom,2014)
Brown, Robert A., and William F. Hunt III. 2010. Impacts of media depth on effluent water quality and hydrologic performance of undersizedbioretention cells. Journal of Irrigation and Drainage Engineering 137, no. 3: 132143.Brown, R. A., and W. F. Hunt. 2011. Underdrain configuration to enhance bioretention exfiltration to reduce pollutant loads. Journal ofEnvironmental Engineering 137, no. 11: 10821091.Bureau of Environmental Services. 2006. Effectiveness Evaluation of Best Management Practices for Stormwater Management in Portland.Oregon. Bureau of Environmental Services, Portland, Oregon.California Stormwater Quality Association. 2003. California Stormwater BMP HandbookNew Development and Redevelopment. CaliforniaStormwater Quality Association, Menlo Park, CA.Chris, Denich, Bradford Andrea, and Drake Jennifer. 2013. Bioretention: assessing effects of winter salt and aggregate application on planthealth, media clogging and effluent quality. Water Quality Research Journal of Canada. 48(4):387.Caltrans. 2004. BMP Retrofit Pilot Program Final Report. Report No. CTSWRT01050. Division of Environmental Analysis. California Dept.of Transportation, Sacramento, CA.CDM Smith. 2012. Omaha Regional Stormwater Design Manual. Chapter 8 Stormwater Best Management Practices. Kansas City, MO.Davis, Allen P., Mohammad Shokouhian, Himanshu Sharma, and Christie Minami. 2001. Laboratory study of biological retention for urbanstormwater management. Water Environment Research, 73, no. 1:514.Davis, Allen P., Mohammad Shokouhian, Himanshu Sharma, and Christie Minami. 2006. Water quality improvement through bioretentionmedia: Nitrogen and phosphorus removal. Water Environment Research 78, no. 3: 284293.Davis, Allen P., Mohammad Shokouhian, Himanshu Sharma, Christie Minami, and Derek Winogradoff. 2003. Water quality improvementthrough bioretention: Lead, copper, and zinc removal. Water Environment Research 75, no. 1: 7382.DiBlasi, Catherine J., Houng Li, Allen P. Davis, and Upal Ghosh. 2008. Removal and fate of polycyclic aromatic hydrocarbon pollutants in anurban stormwater bioretention facility. Environmental science & technology 43, no. 2: 494502.Dorman, M. E., H. Hartigan, F. Johnson, and B. Maestri. 1988. Retention, detention, and overland flow for pollutant removal from highwaystormwater runoff: interim guidelines for management measures. Final report, September 1985June 1987. No. PB89133292/XAB. Versar, Inc.,Springfield, VA (USA).Geosyntec Consultants and Wright Water Engineers. 2012. Urban Stormwater BMP Performance Monitoring. Prepared under Support from U.S.Environmental Protection Agency, Water Environment Research Foundation, Federal Highway Administration, Environmental and WaterResource Institute of the American Society of Civil Engineers.Gulliver, J. S., A. J. Erickson, and P.T. Weiss. 2010. Stormwater treatment: Assessment and maintenance. University of Minnesota, St. AnthonyFalls Laboratory. Minneapolis, MN.Hathaway, J. M., W. F. Hunt, and S. Jadlocki. 2009. Indicator bacteria removal in stormwater best management practices in Charlotte, NorthCarolina. Journal of Environmental Engineering 135, no. 12: 12751285.Hong, Eunyoung, Eric A. Seagren, and Allen P. Davis. 2006. Sustainable oil and grease removal from synthetic stormwater runoff using benchscale bioretention studies. Water Environment Research 78, no. 2: 141155.Hsieh, Chihsu, and Allen P. Davis. 2005. Evaluation and optimization of bioretention media for treatment of urban storm water runoff. Journalof Environmental Engineering 131, no. 11: 15211531.Hunt, W. F., A. R. Jarrett, J. T. Smith, and L. J. Sharkey. 2006. Evaluating bioretention hydrology and nutrient removal at three field sites inNorth Carolina. Journal of Irrigation and Drainage Engineering 132, no. 6: 600608.Jaffe, et. al. 2010. The Illinois Green Infrastructure Study. Prepared by the University of Illinois at Chicago, Chicago Metropolitan Agency forPlanning. Center for Neighborhood Technology, IllinoisIndiana Sea Grant College Program.Jurries, Dennis. 2003. Biofilters (Bioswales, Vegetative Buffers, & Constructed Wetlands) for Storm Water Discharge Pollution Removal.Quality, State of Oregon, Department of Environmental Quality (Ed.).Lefevre G.H., Hozalski R.M., Novak P. 2012. The role of biodegradation in limiting the accumulation of petroleum hydrocarbons in raingardensoil. Water Res. 46(20):675362.Leisenring, M., J. Clary, and P. Hobson. 2012. International Stormwater Best Management Practices (BMP) Database Pollutant CategorySummary Statistical Addendum: TSS, Bacteria, Nutrients, and Metals. July: 131.Li, Houng, and Allen P. Davis. 2009. Water quality improvement through reductions of pollutant loads using bioretention. Journal ofEnvironmental Engineering 135, no. 8: 567576.Komlos, John, and Robert G. Traver. 2012. Longterm orthophosphate removal in a fieldscale stormwater bioinfiltration rain garden. Journalof Environmental Engineering 138, no. 10: 991998.

6/28/2017 Calculating credits for tree trenches and tree boxes Minnesota Stormwater Manual
https://stormwater.pca.state.mn.us/index.php/Calculating_credits_for_tree_trenches_and_tree_boxes 18/19
MidAmerica Regional Council, and American Public Works Association. 2012. Manual of best management practices for stormwater quality.New Hampshire Department of Environmental Services. 2008. New Hampshire Stormwater Manual. Volume 2 Appendix B. Concord, NH.North Carolina Department of Environment and Natural Resources. 2007. Stormwater Best Management Practices Manual. North CarolinaDepartment of Environment and Natural Resources, Raleigh, North Carolina.Passeport, Elodie, William F. Hunt, Daniel E. Line, Ryan A. Smith, and Robert A. Brown. 2009. Field study of the ability of two grassedbioretention cells to reduce stormwater runoff pollution. Journal of Irrigation and Drainage Engineering 135, no. 4: 505510.Ohrel, R. 2000. Simple and Complex Stormwater Pollutant Load Models Compared: The Practice of Watershed Protection. Center for WatershedProtection, Ellicott City, MD. Pages 6063Oregon State University Transportation Officials. Dept. of Civil, Environmental Engineering, University of Florida. Dept. of EnvironmentalEngineering Sciences, GeoSyntec Consultants, and Low Impact Development Center, Inc. 2006. Evaluation of Best Management Practices forHighway Runoff Control. No. 565. Transportation Research Board.Schueler, T.R., Kumble, P.A., and Heraty, M.A. 1992. A Current Assessment of Urban Best Management Practices: Techniques for ReducingNonPoint Source Pollution in the Coastal Zone. Metropolitan Washington Council of Governments, Washington, D.C.TetraTech. 2008. BMP Performance Analysis. Prepared for US EPA Region 1, Boston, MA.Torres, Camilo. 2010. Characterization and Pollutant Loading Estimation for Highway Runoff in Omaha, Nebraska. M.S. Thesis, University ofNebraska, Lincoln.United States EPA. 1999. Stormwater technology fact sheetbioretention. Office of Water, EPA 832F99 12.Water Environment Federation. 2014. Investigation into the Feasibility of a National Testing and Evaluation Program for Stormwater Productsand Practices. A White Paper by the National Stormwater Testing and Evaluation of Products and Practices (STEPP) Workgroup SteeringCommittee.WEF, ASCE/EWRI. 2012. Design of Urban Stormwater Controls. WEF Manual of Practice No. 23, ASCE/EWRI Manuals and Reports onEngineering Practice No. 87. Prepared by the Design of Urban Stormwater Controls Task Forces of the Water Environment Federation and theAmerican Society of Civil Engineers/Environmental & Water Resources Institute.Weiss, Peter T., John S. Gulliver, and Andrew J. Erickson. 2005. The Cost and Effectiveness of Stormwater Management Practices Final Report..Published by: Minnesota Department of Transportation.Wossink, G. A. A., and Bill Hunt. 2003. The economics of structural stormwater BMPs in North Carolina. Water Resources Research Institute ofthe University of North Carolina.
Related pages
TreesOverview for treesTypes of tree BMPsPlant lists for treesStreet sweeping for treesReferences for treesSupporting material for trees
Calculating creditsCalculating credits for bioretentionCalculating credits for infiltration basinCalculating credits for infiltration trenchCalculating credits for permeable pavementCalculating credits for green roofsCalculating credits for sand filterCalculating credits for stormwater pondsCalculating credits for stormwater wetlandsCalculating credits for iron enhanced sand filterCalculating credits for swaleCalculating credits for tree trenches and tree boxesCalculating credits for stormwater and rainwater harvest and use/reuse
The following pages address incorporation of trees into stormwater management under paved surfaces
Design guidelines for tree quality and planting tree trenches and tree boxesDesign guidelines for soil characteristics tree trenches and tree boxesConstruction guidelines for tree trenches and tree boxesProtection of existing trees on construction sitesOperation and maintenance of tree trenches and tree boxesAssessing the performance of tree trenches and tree boxesCalculating credits for tree trenches and tree boxesCase studies for tree trenches and tree boxesSoil amendments to enhance phosphorus sorptionFact sheet for tree trenches and tree boxesRequirements, recommendations and information for using trees as a BMP in the MIDS calculatorRequirements, recommendations and information for using trees with an underdrain as a BMP in the MIDS calculator
Retrieved from "https://stormwater.pca.state.mn.us/index.php?title=Calculating_credits_for_tree_trenches_and_tree_boxes&oldid=31580"

6/28/2017 Calculating credits for tree trenches and tree boxes Minnesota Stormwater Manual
https://stormwater.pca.state.mn.us/index.php/Calculating_credits_for_tree_trenches_and_tree_boxes 19/19
Categories: Trees Calculating credits Search
This page was last modified on 16 February 2017, at 16:39.
Minnesota Pollution Control Agency | 6512966300, 8006573864 | Assistance | Web site policy
© 2017 by Minnesota Pollution Control Agency • Powered by MediaWiki