appendix b strategies for establishing and using
TRANSCRIPT

PROVEN TECHNOLOGIES AND REMEDIES GUIDANCE – REMEDIATION OF METALS IN SOIL
Background Estimates of Metals in Soil August 2008
APPENDIX B STRATEGIES FOR ESTABLISHING AND USING
BACKGROUND ESTIMATES OF METALS IN SOIL
PROVEN TECHNOLOGIES AND REMEDIES GUIDANCE – REMEDIATION OF METALS IN SOIL
Background Estimates of Metals in Soil B-1
TABLE OF CONTENTS
Page
PREFACE ....................................................................................................................B-3 1.0 INTRODUCTION...............................................................................................B-3 2.0 RATIONALE FOR SITE-SPECIFIC BACKGROUND ESTIMATES ...................B-3 3.0 ESTIMATING BACKGROUND CONCENTRATIONS .......................................B-5
3.1 Defining the Target Population ...............................................................B-5 3.2 Developing an Appropriate Background Data Set ..................................B-6
3.2.1 Using Existing Background Data..................................................B-6 3.2.2 Generating New Background Data...............................................B-7 3.2.3 Pooling Background Data Sets ....................................................B-7
3.3 Exploratory Data Analysis.......................................................................B-8 3.3.1 Descriptive Statistics ....................................................................B-8 3.3.2 Graphical Representations...........................................................B-8 3.3.3 Tests of Data Set Distribution ......................................................B-9 3.3.4 Outlier Identification and Removal .............................................B-11 3.3.5 Treatment of Censored Data......................................................B-12
3.4 Documenting Background Estimates....................................................B-13 4.0 IDENTIFYING METALS AS CHEMICALS OF POTENTIAL CONCERN .........B-14 5.0 DEVELOPING BACKGROUND-BASED CLEANUP GOALS ..........................B-17 FOR METALS 6.0 REFERENCES................................................................................................B-17
LIST OF FIGURES Figure B-1 Example of Graphical Representations.................................................B-10
LIST OF TABLES Table 1 Selected Quantitative Tests for Normality.............................................B-11 Table 2 Selected Outlier Screening Methods ....................................................B-12 Table 3 General Guidelines for Addressing Censored Data ..............................B-13 Table 4 Common Data Set Comparison Methods .............................................B-16 ATTACHMENT A: Arsenic Strategies, Determination of Arsenic Remediation,
Development of Arsenic Cleanup Goals for Proposed and Existing School Sites (DTSC, 2007)

PROVEN TECHNOLOGIES AND REMEDIES GUIDANCE – REMEDIATION OF METALS IN SOIL
Background Estimates of Metals in Soil B-2
ABBREVIATIONS AND ACRONYMS bgs below ground surface COPC chemical of potential concern DF detection frequency DQO data quality objective DTSC Department of Toxic Substances Control EDA exploratory data analysis EPA U.S. Environmental Protection Agency fs fourth spread IQR interquartile range Max maximum concentration in data set Min minimum concentration in data set n sample size Q1 first quartile Q3 third quartile St. Dev. standard deviation

PROVEN TECHNOLOGIES AND REMEDIES GUIDANCE – REMEDIATION OF METALS IN SOIL
Background Estimates of Metals in Soil B-3
PREFACE
This appendix provides a suggested strategy for establishing and applying background concentrations of metals in soil, if determined to be necessary to support characterization and cleanup activities at a site. The strategy is presented as a progression of steps beginning with considerations for establishing background concentrations, use of the background concentrations to identify constituents of potential concern (COPCs), and use of the background concentrations to establish appropriate cleanup goals. Because it is not possible to provide a single approach that would apply to all sites, this appendix does not prescribe or mandate a particular methodology. The project team should develop and apply background concentrations using an approach that is appropriate for the conditions and objectives at a given site. This appendix is for guidance only, and is applicable on a case-by-case basis.
1.0 INTRODUCTION
The amount of metals present in soils at a site may represent contributions from several sources, including metals present under pristine conditions (natural conditions without any impacts from humans), metals contributed by releases from site activities, and metals attributable of other off-site sources (e.g., lead historically emitted from car exhaust). Metals concentrations that represent only pristine or natural conditions often are referred to as “background” concentrations. Metals concentrations that represent a combination of natural levels and non-specific off-site sources are referred to as “ambient concentrations.” More detailed discussions of the terms “background” and “ambient” can be found in EPA (1989, 1995, 2002a). For the purposes of this appendix, the general term “background” will be used to refer to soil that has not been affected by site-related releases. An assessment of background concentrations of metals in soil may be needed during the site cleanup process to:
• assist with characterizing the nature and extent of metals contamination that was caused by site activities,
• evaluate whether a metal should be identified as a chemical of potential concern (COPC) for the risk assessment, and
• assist with establishing an appropriate cleanup goal for the metal.
2.0 RATIONALE FOR SITE-SPECIFIC BACKGROUND ESTIMATES
The ultimate objective of developing background estimates is to enable an “apples to apples” comparison that eliminates unnecessary variability in the comparison between

PROVEN TECHNOLOGIES AND REMEDIES GUIDANCE – REMEDIATION OF METALS IN SOIL
Background Estimates of Metals in Soil B-4
metals concentrations in potentially-impacted site soils and unimpacted soils. With this in mind, the ideal approach for establishing site-specific background concentrations is to identify unimpacted areas:
• that are located as close as possible to the potentially impacted areas, and
• with soil characteristics similar to soils that potentially have been impacted by site activities. (See Section 3.0 for further discussion.)
The role of proximity in the background determination is based on the concept that soils located closer to the site will be more representative of site conditions than soils located further away. The range of metals concentrations measured in these nearby soils will more closely reflect the range of metals concentrations in site soils prior to site activities. Soils located further away may have been influenced by different natural processes or other anthropogenic activities than have occurred at the site.
Several common constraints may necessitate deviation from the ideal approach to site-specific background estimates. At some sites, it may not be possible to find a nearby area that has not been affected by site activities. Extensive fill placement (e.g., such as in coastal areas) may require an alternate approach.
Options to consider when it is not possible to use the ideal approach for a site-specific background determination include:
• Using background estimates that have been developed for a nearby site;
• Using regional estimates for background concentrations;
• Pooling site data and using statistical techniques to identify a range of background concentrations;
• For sites (and their surrounding areas) that are thought only to have potential impacts to surface soil (e.g., former agricultural sites), using soil data collected at depth (e.g., 5 feet bgs); and/or
• Using geochemical methods to identify a range of background concentrations.1
Each of these options requires careful assessment as to whether the background estimates are appropriate for use at the subject site. A decision to use background estimates from nearby sites or from regional studies should be made after a thorough review of the data set (e.g., data quality, soil types) and statistical protocols used to derive these estimates. Use of regional estimates is arguably the least preferred option because it has the greatest potential to be least representative of site conditions (e.g., range of metals concentrations, unaccounted for variables). Experience has shown that the approach of using pooled site data requires a meticulous review of the data set to
1 Discussion of geochemical methods for identifying a range of background concentrations is beyond the scope of this appendix. NAVFAC (2002) provides further discussion of the use of geochemical methods in background screening.

PROVEN TECHNOLOGIES AND REMEDIES GUIDANCE – REMEDIATION OF METALS IN SOIL
Background Estimates of Metals in Soil B-5
identify (1) data with elevated detection limits, (2) disparities in data quality, (3) variability introduced by differences in represented soil types, (4) sample results that do not represent soil (e.g., concrete rubble), and (5) data reflecting obvious site impacts. Hence, the use of pooled data sets is not a simple undertaking and requires careful evaluation.
Whether using the ideal approach or one of the alternative options to establish a site-specific background value, professional judgment must be used to ensure that the background estimates are reasonably conservative to define the nature and extent of contamination, identify metal COPCs, and derive background-based cleanup goals. At the same time, professional judgment is needed to ensure that the background estimates are not set too high or too low. Studies that have compiled typical ranges of metals concentrations in regional soil types can be a useful check that the site-specific background estimates are realistic.
3.0 ESTIMATING BACKGROUND CONCENTRATIONS Estimating background concentrations is a multi-step process that begins with careful definition of the target population. The next step is developing and screening the background data set. Finally, statistical techniques are used to characterize the background population. 3.1 DEFINING THE TARGET POPULATION In the most general terms, the target population for the background determination is soil with characteristics similar to those occurring on the cleanup site. Characteristics to consider when matching soils from unimpacted areas to site soils include:
• Soil type − Lithology (e.g., sand, silt, clay) − Soil series − Soil horizons (e.g., zones where metals are accumulating/leaching, zones
with differences in clay content) − Mineralogy − Geochemical conditions − Vegetation types,
• Topography and landform (e.g., marshy areas versus upland areas),
• Conceptual site model for fate and transport pathways of site contaminants,
• Location and source of fill materials, and
• Similar historical use (prior to site activities subject to cleanup effort). Depending on the variability in site conditions, one or more target populations may be identified, each requiring its own background estimates. For example, a site consisting of upland and marshy areas likely will require at least two target background populations, one for upland soil and one marshy soil. In contrast, if the site consists of
PROVEN TECHNOLOGIES AND REMEDIES GUIDANCE – REMEDIATION OF METALS IN SOIL
Background Estimates of Metals in Soil B-6
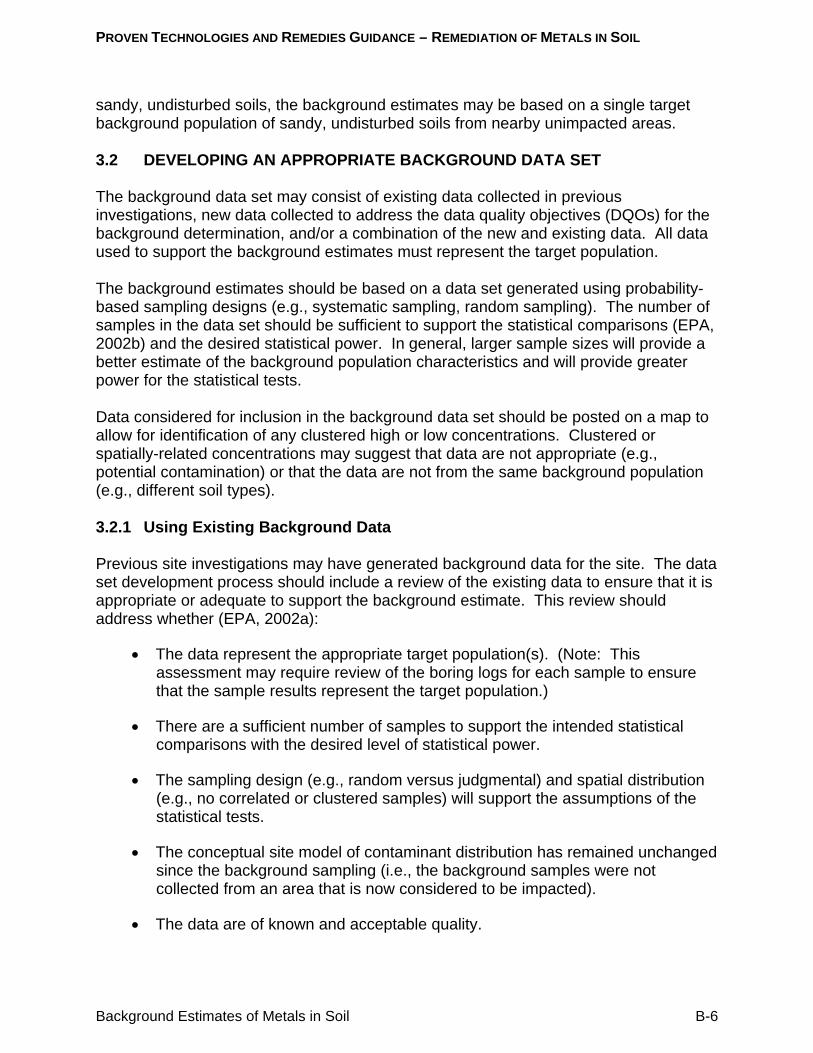
sandy, undisturbed soils, the background estimates may be based on a single target background population of sandy, undisturbed soils from nearby unimpacted areas. 3.2 DEVELOPING AN APPROPRIATE BACKGROUND DATA SET The background data set may consist of existing data collected in previous investigations, new data collected to address the data quality objectives (DQOs) for the background determination, and/or a combination of the new and existing data. All data used to support the background estimates must represent the target population. The background estimates should be based on a data set generated using probability-based sampling designs (e.g., systematic sampling, random sampling). The number of samples in the data set should be sufficient to support the statistical comparisons (EPA, 2002b) and the desired statistical power. In general, larger sample sizes will provide a better estimate of the background population characteristics and will provide greater power for the statistical tests. Data considered for inclusion in the background data set should be posted on a map to allow for identification of any clustered high or low concentrations. Clustered or spatially-related concentrations may suggest that data are not appropriate (e.g., potential contamination) or that the data are not from the same background population (e.g., different soil types). 3.2.1 Using Existing Background Data Previous site investigations may have generated background data for the site. The data set development process should include a review of the existing data to ensure that it is appropriate or adequate to support the background estimate. This review should address whether (EPA, 2002a):
• The data represent the appropriate target population(s). (Note: This assessment may require review of the boring logs for each sample to ensure that the sample results represent the target population.)
• There are a sufficient number of samples to support the intended statistical comparisons with the desired level of statistical power.
• The sampling design (e.g., random versus judgmental) and spatial distribution (e.g., no correlated or clustered samples) will support the assumptions of the statistical tests.
• The conceptual site model of contaminant distribution has remained unchanged since the background sampling (i.e., the background samples were not collected from an area that is now considered to be impacted).
• The data are of known and acceptable quality.

PROVEN TECHNOLOGIES AND REMEDIES GUIDANCE – REMEDIATION OF METALS IN SOIL
Background Estimates of Metals in Soil B-7
3.2.2 Generating New Background Data Generating new background data should follow the DQO process and should have a sampling design that will support the intended statistical analyses. Suggested resources for the DQO process and sampling design include:
• Guidance for Data Quality Assessment (EPA, 2006ab), • Guidance for Choosing a Sampling Design for Environmental Data Collection
(EPA, 2002b). • Guidance for Comparing Background and Chemical Concentrations in Soil for
CERCLA Sites (EPA, 2002a), and • Visual Sampling Plan (PNNL, 2007).
Sampling and analysis activities should be conducted under an approved sampling and analysis plan and quality assurance project plan. An annotated outline that could be used for a workplan to evaluate background concentrations of metals is provided in Appendix A2. 3.2.3 Pooling Background Data Sets The data set used for the background estimates may include data generated by various investigation phases. In this instance, the data sources should be compared to ensure that:
• the data were collected using similar sampling and analytical methods (EPA, 1992),
• the data are of comparable quality,
• the data have similar detection limits (this is particularly applicable when the pooled data set contains a significant number of censored values (also known as “non-detects”)),
• one data set does not consistently show a higher or lower bias relative to the other data (For example, data generated using one analytical method may be biased higher than data generated using another analytical method.),
• one portion of the reference area is not overrepresented,
• the data sets have similar concentration ranges, measures of central tendency, and variability, and
• the combined data set fulfills the DQOs for the background estimates (e.g., probability-based sampling strategy, samples distributed throughout the selected reference area).
Graphical and statistical methods should be used to ensure that it is appropriate to pool the data sets. Graphical methods such as histograms, boxplots, and probability plots

PROVEN TECHNOLOGIES AND REMEDIES GUIDANCE – REMEDIATION OF METALS IN SOIL
Background Estimates of Metals in Soil B-8
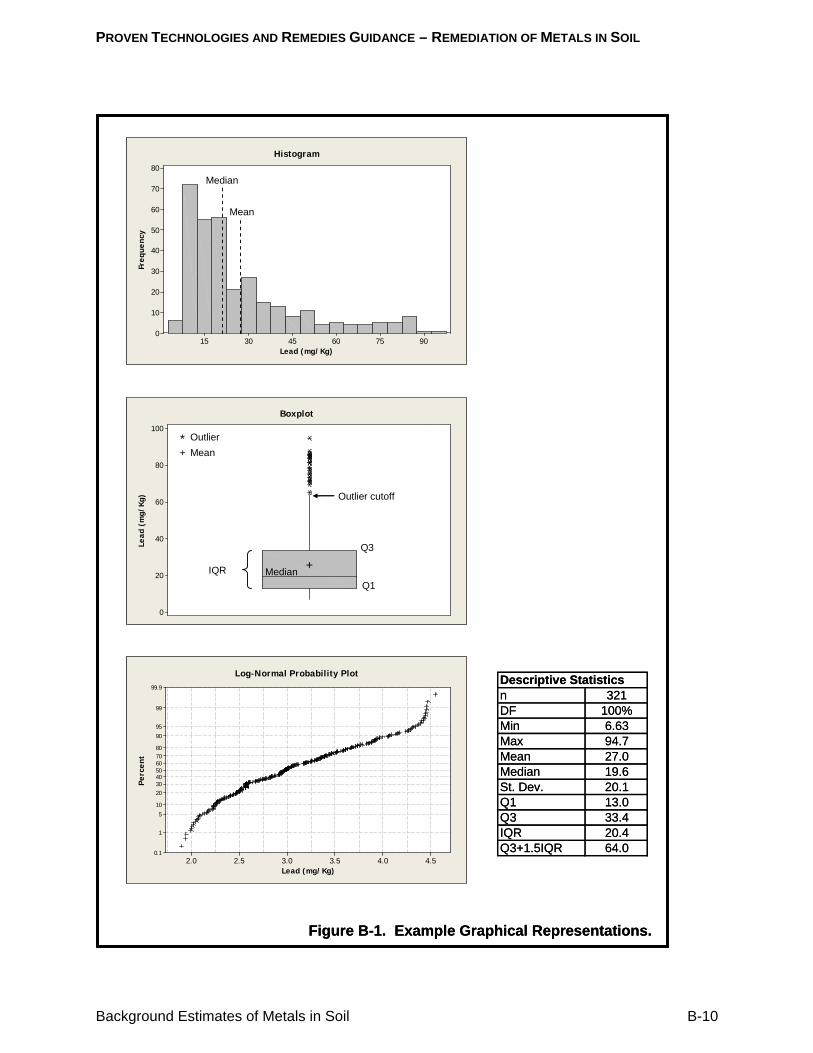
(see Section 3.3.2) can be used to assess similarity between data sets. Statistical tests can be used to test differences between measures of central tendency and variability of the data sets (see Section 5; see Gilbert, 1987; EPA, 2006b; Helsel and Hirsch, 2002). 3.3 EXPLORATORY DATA ANALYSIS Exploratory data analysis (EDA) is an iterative process that uses several tools to evaluate data characteristics, make appropriate adjustments to the data set (e.g., adjust for censored values), and refine the data set (e.g., remove outliers). Prior to beginning EDA, all data should have been reviewed to ensure that it represents the target population (Section 3.1) and that it is appropriate to include the data in the analysis (Section 3.2). 3.3.1 Descriptive Statistics Descriptive statistics can be used as the starting point for EDA to provide an initial assessment of the data set characteristics as well as to evaluate the effects of any data set adjustments. These statistics include the number of samples, the detection frequency2, the maximum and minimum concentrations (range of the data), calculated measures of central tendency (mean, median), and calculated measures of dispersion (standard deviation, variance). The statistics may also include measures of relative standing (e.g., concentration corresponding to a certain percentile of the sample). Definitions for these parameters can be found in general statistical texts, EPA (2006b) and Helsel and Hirsch (2002). Descriptive statistics are updated during EDA, particularly after adjusting for censored values or removing outlier values. 3.3.2 Graphical Representations Graphical representations can be used as a starting point for EDA to obtain an initial assessment of the data set characteristics as well as to evaluate the effects of any data set adjustments. Various graphical methods are used to represent the background data set during EDA. Three particularly useful graphical methods are highlighted below and illustrated in Figure B-1. It is beyond the scope of this appendix to provide detailed discussions of possible graphical methods that may be useful during EDA. However, general statistical texts typically discuss the various graph styles. EPA (2006b) and Helsel and Hirsch (2002) also provide useful discussions of graphical methods. Histogram As shown on Figure B-1, histograms divide the concentration range into bins and count the number of samples that fall into each bin. Histograms are useful for assessing whether the data are symmetric around the mean or median, or whether the data are
2 Ratio of the number of detected values and the total number of values in the data set. The detection frequency can be expressed as the percentage of detected values by multiplying the ratio by a factor of 100.

PROVEN TECHNOLOGIES AND REMEDIES GUIDANCE – REMEDIATION OF METALS IN SOIL
Background Estimates of Metals in Soil B-9
skewed toward higher or lower concentrations. The distance between the mean and median provides an indication of the skewness in the data. Histograms may also be useful in recognizing whether multiple populations are present in the data set. Box-and-Whisker Plot Box-and-whisker plots are useful tools for summarizing and visualizing the range, mean, median, and skewness of the background data set (Figure B-1). The plots are constructed by ranking the data set from lowest to highest concentrations and presenting the data in four segments (quartiles), each representing 25 percent of the data set. The first quartile represents the lowest 25 percent of the concentrations and is represented by the lower tail. The fourth quartile represents the highest 25 percent of the concentrations and is shown as the upper tail. The data between the first and third quartiles (Q1 and Q3) is represented as the box that is bisected by the median value (midpoint of the ranked data). Outlier values typically are shown as individual data points located outside of the box-and-whisker diagram (asterisks on Figure B-1). Probability Plot Probability plots are useful for evaluating how well the data set distribution is modeled by an assumed distribution. Common types include a normal probability plot which compares the data to a normal distribution and a log-normal probability plot which compares the data to a log-normal distribution. Departures from linearity provide information about how the data distribution deviates from the assumed distribution. EPA (2006b) and Helsel and Hirsch (2002) provide detailed descriptions of how to construct a probability plot. 3.3.3 Tests of the Data Set Distribution An understanding of the distribution underlying a data set is needed to ensure selection of appropriate statistical tests3, such as for flagging outliers or for comparing background and site data sets. Multiple lines of evidence should be used to determine the data set distribution. Evaluation of the data set distribution should use a combination of graphical techniques (i.e., histograms, probability plots) and quantitative methods (see Table 1). Details regarding the distributional tests can be found in EPA (2006b) and Gilbert (1987). Distributional tests should be repeated after removing outliers and adjusting for censored values. If the revised tests indicate changes in the data set distribution or if the data set distribution is unclear, one option is to use both parametric and non-parametric techniques to conduct the statistical comparisons. The most conservative approach could be selected if there are any differences in the outcome of the statistical tests that would affect the cleanup decisions at the site
3 Parametric statistical methods should be used if a data set has a normal or log-normal distribution. Non-parametric statistical methods can be used if a data set has neither a normal or log-normal distribution.
PROVEN TECHNOLOGIES AND REMEDIES GUIDANCE – REMEDIATION OF METALS IN SOIL
Background Estimates of Metals in Soil B-10
Lead
(m
g/Kg
)
100
80
60
40
20
0
Boxplot
Lead (mg/Kg)
Freq
uenc
y
907560453015
80
70
60
50
40
30
20
10
0
Histogram
Lead (mg/Kg)
Perc
ent
4.54.03.53.02.52.0
99.9
99
95
90
80706050403020
10
5
1
0.1
Log-Normal Probability Plot Descriptive Statisticsn 321DF 100%Min 6.63Max 94.7Mean 27.0Median 19.6St. Dev. 20.1Q1 13.0Q3 33.4IQR 20.4Q3+1.5IQR 64.0
Figure B-1. Example Graphical Representations.
Q1
Q3
IQR
Outlier cutoff
Outlier
Mean
Median
+
Mean*+
Median

PROVEN TECHNOLOGIES AND REMEDIES GUIDANCE – REMEDIATION OF METALS IN SOIL
Background Estimates of Metals in Soil B-11
Table 1. Selected Quantitative Tests for Normality. TEST SAMPLE SIZE RECOMMENDED USE
None recommended < 8 Not applicable.
Tests Recommended by EPA (2006b)
Shapiro Wilk W Test < 5000 Highly recommended by EPA (2006b).
Filliben’s Statistic < 100 Highly recommended by EPA (2006b), especially in conjunction with a normal probability plot.
Skewness and Kurtosis Tests > 50 Useful for large sample sizes (EPA, 2006b).
Geary’s Test > 50 Useful when tables for other tests are not available (EPA, 2006b).
Studentized Range Test < 1000 Highly recommended, except for asymmetric data with large tails (EPA, 2006b)
Chi-Square Test Large Useful for grouped data and when the comparison distribution is known (EPA, 2006b)
Lilliefors Kolmogorov-Smirnoff Test > 50 Useful when tables for other tests are not available (EPA, 2006b).
Other Tests
Coefficient of Variation Test Any Only use to quickly discard an assumption of normality
D’Agostino Test 50 < n <1000 Data sets with 100% detection frequency (NAVFAC, 2002).
Note: Table not intended to be inclusive for all possible tests for normality. 3.3.4 Outlier Identification and Removal Outliers are measurements that are extremely large or small relative to the rest of the data and are thought to misrepresent the population from which they are intended to be collected (EPA, 2006b). These values may be a result of errors associated with the sample collection, laboratory analysis, transcription, or data entry. The values could also be a true reflection of the population being sampled (e.g., heterogeneous geologic conditions, evidence of contamination). A conservative approach should be taken to identify outliers in the background data set because inclusion of these values may bias the population estimates derived from the data set. For example, mean values are particularly sensitive to outliers. Also, the maximum value in the background data set may be set too high and thus affect the COPC identification process. The background data set should be screened for outliers using multiple approaches (described below and summarized in Table 2), evaluating the reason for any extreme values, and using professional judgment to remove data points that are interpreted as outliers.

PROVEN TECHNOLOGIES AND REMEDIES GUIDANCE – REMEDIATION OF METALS IN SOIL
Background Estimates of Metals in Soil B-12
Table 2. Selected Outlier Screening Methods. APPROACH METHOD ASSUMES
NORMAL DISTRIBUTION?
SAMPLE SIZE ABLE TO ADDRESS MULTIPLE OUTLIERS?
Graphical Identification of Unusual Data Points
1 Graphs of Data No n > 6 Yes
Quantitative Tests Recommended by EPA (2006b)
2 Extreme Value Test
Yes n < 25 Only if apply test to least extreme value first (EPA, 2006b).
Discordance Test
Yes 3 < n < 50 No
Rosner’s Test Yes n > 25 Yes, up to 10 outliers (EPA, 2006b)
Walsh’s Test No n > 50 Yes
Outlier Cutoff Value
3 Quartile-Based Outlier Cutoff
No n > 6 Yes
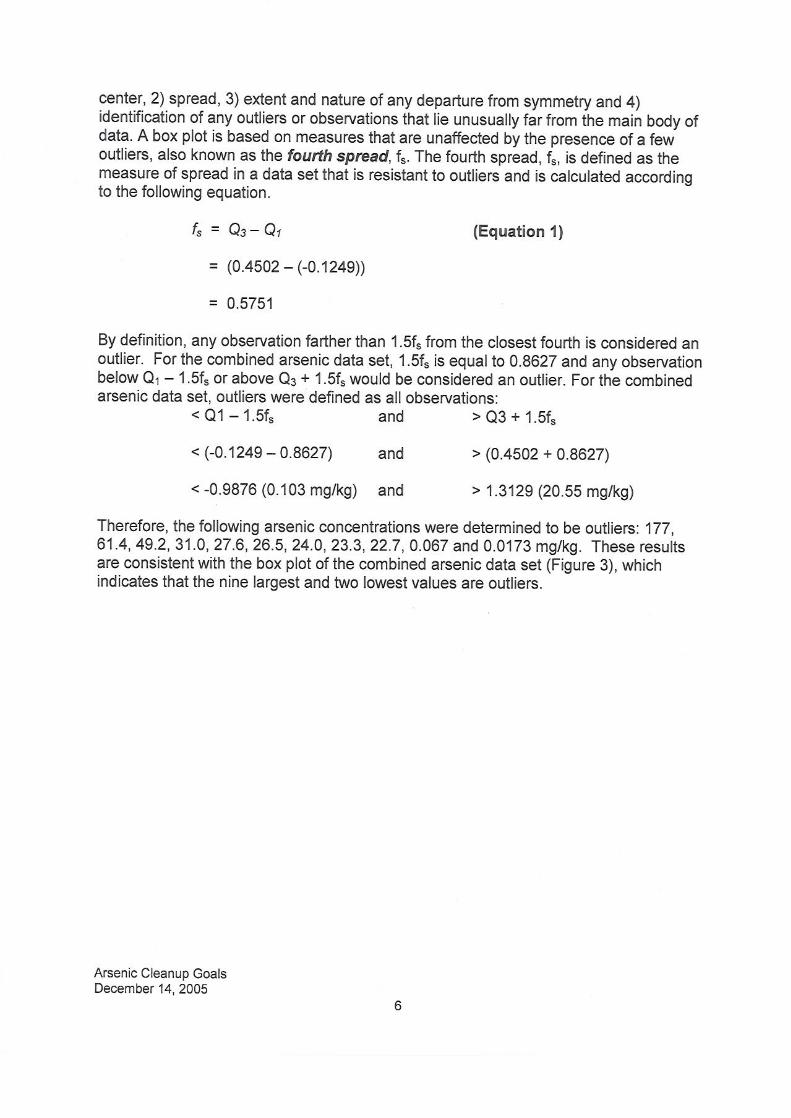
Note: Table not intended to be inclusive for all possible outlier screening methods. The simplest approach consists of evaluating graphs of the data (e.g., box plots, scatter plots) for unusual data points. Another approach is to use an appropriate quantitative statistical method to screen for outliers. Detailed descriptions of outlier screening methods are provided in EPA (2006b) and Gilbert (1987). A third approach for identifying outliers is based on the values used to construct a box-and-whisker plot of the data set (see Section 3.3.2). The approach ranks the data, and determines the largest measurement corresponding to the first quartile (Q1) and third quartile (Q3). The outliers are then identified as values that fall above or below the following:
Lower Outlier Cutoff: Q1 - 1.5 (Q3-Q1)4 Upper Outlier Cutoff: Q3 + 1.5 (Q3-Q1)
This approach is an iterative process in which Q1, Q3, and the cutoffs are recalculated each time outliers are removed from the data set. The process continues until no data points fall outside of the outlier cutoffs. Without additional data collection, this approach may be the only option available for data sets with small sample sizes. This approach may also be useful for identifying outliers in data sets with neither normal nor log-normal distribution. 3.3.5 Treatment of Censored Data Some measurements in the data set may be reported as less than a reporting limit (i.e., the concentration falls between “0” and the reporting limit). These censored values
4 The difference between Q3 and Q1 is referred to as the interquartile range (IQR) or fourth spread (fs).

PROVEN TECHNOLOGIES AND REMEDIES GUIDANCE – REMEDIATION OF METALS IN SOIL
Background Estimates of Metals in Soil B-13
(also known as non-detects) are still part of the background data set, but will need to be addressed before performing some quantitative analyses. The number of censored values in a data set is often discussed in terms of the detection frequency5, which is simply the ratio of the number of detected values and the total number of values in the data set. Some statistical procedures require a certain detection frequency. The approach used to deal with censored values should be selected based on the data set characteristics and the intended use of the data. EPA (2006b) and Helsel and Hirsch (2002) provide some general guidelines for addressing censored data. These guidelines are summarized in Table 3. Discussions regarding these methods can be found in EPA (2006b) and NAVFAC (2002). Table 3. General Guidelines for Addressing Censored Data.
PERCENTAGE OF CENSORED VALUES
STRATEGY COMMENT
< 15% Aitchison’s Method or Cohen’s Method
Cohen’s method can be used if n > 20 (EPA, 2006b).
< 15% Replace censored values with the RL, one-half the RL, or replace with a very small number.1
• For some sample sizes, replacement of censored values may affect estimate of parameter variability.
• Check to make sure that replacement value does not overly-influence the calculated population parameters.
15 to 50% Replace censored values with the RL, one-half the RL, or a very small number. 1
• Consider using non-parametric methods or test of proportions to analyze data. Alternatively, consider using Cohen’s or Aitchison’s Method.
• Check to make sure that replacement value does not overly-influence the calculated population parameters.
15 to 50% Aitchison’s Method or Cohen’s Method
See EPA (2006b) for distributional assumptions and for recommended criteria for selecting which method to use.
15 to 50% Trimmed mean Discards tails of data for unbiased estimated of the population mean.
15 to 50% Winsorized mean and standard deviation
Replaces data in tails of data set with next most extreme data value.
>50 to 90% Tests for proportions. For data sets having this range of detection frequency, descriptive statistics do not provide much insight into the underlying distribution of measurements.
>90% None Consult with a statistician. Notes: RL is reporting limit.
1 The ProUCL User Guide (EPA, 2007) notes that substitution methods may not perform well even for detection frequencies as low as 5 to 10 percent. Further, the ProUCL User Guide suggests avoidance of substitution methods for some estimation and hypothesis testing approaches.
3.4 DOCUMENTING BACKGROUND ESTIMATES At a minimum, documentation of the process used to develop the background estimates should include: 5 Detection frequency can be expressed as either a ratio or as a percentage (ratio multiplied by 100).
PROVEN TECHNOLOGIES AND REMEDIES GUIDANCE – REMEDIATION OF METALS IN SOIL
Background Estimates of Metals in Soil B-14
• Description of site history and setting, • Summary of major soil types at the site, • Description of background data set (e.g., sample numbers, map of locations,
data posted on maps, reports that present the results of data included in the data set),
• Demonstration that background data set is adequate, • Description of steps used to evaluate the data set and rationale for any data set
adjustments, • Descriptive statistics for background population before and after any
adjustments to the data set, and • Appropriate figures, graphics, and tables.
4.0 IDENTIFYING METALS AS CHEMICALS OF POTENTIAL CONCERN As discussed in Chapter 5, the background data set is used to screen on-site data to determine which metals should be identified as COPCs. If multiple soil types are present, this comparison should compare background and on-site data from the same soil types. The steps that should be followed for this comparison are: Step 1 For each metal, compare the highest site concentration with the highest
background concentration. If the site concentration is equal to or less than the highest background concentration, the metal may be eliminated as a COPC. If the onsite maximum concentration is greater than the background maximum concentration and the detection frequency is greater than 50 percent, go to Step 2. If the detection frequency is less than 50 percent and the onsite maximum is greater than the background maximum, retain the metal as a COPC.
Step 2 For each metal, compare the site and background arithmetic mean
concentrations. If the means are comparable, and if the highest site concentration is below the concentration associated with unacceptable risk or hazard, the metal may be eliminated as a COPC. If the metal is not eliminated by this screening, go to Step 3.
Step 3 Statistically compare the site and background concentrations. Select the
statistical approach depending on the sample size.
Option 1. If the data set is of sufficient size, statistically evaluate the overlap of the background and on-site distributions to determine if the data sets come from the same population and have the same distribution. If so, and if the highest site concentration is below the concentration associated with unacceptable risk or hazard, the metal may be eliminated as a COPC. If not, include the metal as a COPC in the risk evaluation. Table 4 summarizes some options for making this statistical comparison. The statistical

PROVEN TECHNOLOGIES AND REMEDIES GUIDANCE – REMEDIATION OF METALS IN SOIL
Background Estimates of Metals in Soil B-15
comparison method should be selected based on site-specific considerations, desired statistical power, and the data set characteristics. Option 2. If the background data set is limited (i.e., small sample size), the site data can be evaluated using probability plots to determine if one or more populations are present. If only one population is present, and if the highest on-site concentration is below the concentration associated with unacceptable risk or hazard, the metal may be eliminated as a COPC. If two or more populations are present, include the metal as a COPC. Note that this option should be applied cautiously because using probability plots to screen for multiple populations is subjective and requires professional judgment. Cook (1998) states that use of probability plots for this purpose requires careful consideration of the “actual site conditions, sample descriptions, spatial distribution, and the degree to which different soil types, sample types, or qualified data affect the appearance of the plot.” If using this option, it is important to keep the following points in mind: A. Inflection points on probability plots do not always indicate multiple
populations or a break in population. Instead, an inflection point may only indicate that the data distribution assumed for construction of the probability plot is incorrect. Inflection points in the probability plot should be carefully evaluated to determine if the point is a true separation of statistical populations (e.g., can the point be explained by site operation history, geological features, and analytical problems) (Cook, 1998).
B. A lack of an inflection point does not necessarily indicate one population.
Populations may overlap such that they are indistinguishable on a probability plot. Given that each population will have its own characteristics, supplemental EDA is needed to assist in defining discrete populations (Cook, 1998).
C. If a wide range of concentrations are present on-site, including the higher
concentrations in the probability plot may hinder the ability to discern the break between populations characterized by lower concentrations. In this instance, excluding data with known impacts may facilitate recognition of multiple populations.
Additional information on eliminating metals as COPCs is provided in Selecting Inorganic Constituents are Chemicals of Potential Concern at Risk Assessments at Hazardous Waste Sites and Permitted Facilities – Final Policy (DTSC, 1997).

PROVEN TECHNOLOGIES AND REMEDIES GUIDANCE – REMEDIATION OF METALS IN SOIL
Background Estimates of Metals in Soil B-16
Table 4. Common Data Set Comparison Methods. TEST TESTS FOR
DIFFERENCES IN REQUIREMENTS COMMENT
Wilcoxon Rank Sum Test (WRS Test)
Medians of the site and background populations.
• Only one reporting limit for censored values and all detected values greater than reporting limit.
• Data sets comprised of independent, random samples.
• Underlying populations have same shape and dispersion.
• Detection frequency >60%.
• Recommended by DTSC (1997).
• May produce misleading results if many tied values (EPA, 2006b).
Two-Sample t-Test (Equal Variances)
Means of the site and background populations.
• Both data sets have a normal distribution, or n>30 for both data sets (EPA, 2006b).
• Both data sets have equal variances.
• Treatment of censored values has no significant impact on computed mean.
• Independent populations.
• Outliers may affect test results.
• Not well suited to data sets with censored values. Generally use with data sets having detection frequency >85%.
Satterthwaite Two-Sample t-Test (Unequal Variances)
Means of site and background populations.
• Both data sets have a normal distribution, or n>30 for both data sets (EPA, 2006b).
• Detection frequency of 100%.
• Site and background data sets do not have equal variances.
• Independent populations.
• Outliers may affect test results.
Gehan Test Medians of the site and background populations.
• Censoring mechanism for censored values is the same for both populations.
Slippage Test Largest values of the site and background populations.
• At least one detected background value is present and is larger than the largest censored value.
• Independent, random sampling design.
• May require large sample size for adequate power.
• High outliers may bias test results.
• Use in combination Quantile Test Largest values of the
site and background populations.
• Independent, random or systematic sampling design for both data sets.
• Both data sets have similar variances.
with t-test or WRS test (EPA, 2006b).
Two-Sample Test of Proportions
Proportions of the site and background populations above a given cutoff level.
• Detection frequency >50%. • Random sampling design for
both data sets. • Approximate normal
distribution.
• Verify that normal approximation may be used (EPA, 2006b).
Note: This table summarizes information presented in EPA (2006b) and NAVFAC (2002). Additional details regarding these data set comparison methods can be found in EPA (2006b), NAVFAC (2002), and Helsel and Hirsch (2002).

PROVEN TECHNOLOGIES AND REMEDIES GUIDANCE – REMEDIATION OF METALS IN SOIL
Background Estimates of Metals in Soil B-17
5.0 DEVELOPING BACKGROUND-BASED CLEANUP GOALS FOR METALS As discussed in Chapter 5, it is anticipated that cleanup goals for certain metals (e.g., arsenic) may need to be developed using background values because the risk-based cleanup goal would be below the concentration that occurs in nature. In general, two options are available for developing background-based cleanup goals for metals (DTSC, 2007). Option 1. Use an upper limit of the background data set (e.g., 95th percentile
concentration, maximum concentration) as the cleanup goal. Option 2. Select a cleanup goal based on a graphical and statistical evaluation of the
background and site data sets. - The graphical evaluation consists of using probability plots of the
combined site and background data sets to interpret an inflection point as an approximation of the cleanup goal. When making this approximation, please refer to the caveats for interpreting inflection points on probability plots that are discussed on page B-15.
- The statistical evaluation consists of calculating the upper 95 percent Limit for the 0.99 Quartile (UL0.95(X0.99)) as described by Gilbert (1987).
The DTSC document entitled, Arsenic Strategies, Determination of Arsenic Remediation, Development of Arsenic Cleanup Goals for Proposed and Existing Schools Sites (DTSC, 2007), provides examples of how to derive a cleanup goal using these two options. Please note that these examples may not be applicable to, or feasible for, all sites. The document is included as Attachment A of this appendix.
6.0 REFERENCES
Cook, P.D. 1998. Estimating Background Concentrations of Inorganic Analytes from On-Site Soil Sample Data. Superfund Risk Assessment in Soil Contamination Studies: Third Volume, ASTM STP 1338. K.B. Hoddinott, Ed. American Society for Testing and Materials.
DTSC. 1997. Selecting Inorganic Constituents are Chemicals of Potential Concern at Risk Assessments at Hazardous Waste Sites and Permitted Facilities – Final Policy. Human and Ecological Risk Division. February. www.dtsc.ca.gov/AssessingRisk/upload/backgrnd.pdf
DTSC. 2007. Arsenic Strategies, Determination of Arsenic Remediation, Development of Arsenic Cleanup Goals for Proposed and Existing Schools Sites. March. www.dtsc.ca.gov/Schools/upload/Arsenic-Cleanup-Strategies-March-2007.pdf
Gilbert, R.O. 1987. Statistical Methods for Environmental Pollution Monitoring. Van Nostrand Reinhold, New York.

PROVEN TECHNOLOGIES AND REMEDIES GUIDANCE – REMEDIATION OF METALS IN SOIL
Background Estimates of Metals in Soil B-18
Helsel, D.R. and R.M. Hirsch. 2002. Chapter A3, Statistical Methods in Water Resources. Book 4, Hydrologic Analysis and Interpretation. Techniques of Water-Resources Investigations of the United States Geological Survey. September. pubs.usgs.gov/twri/twri4a3.
Naval Facilities Engineering Command (NAVFAC). 2002. Guidance for Environmental Background Analysis, Volume I: Soil. NFESC User’s Guide UG-2049-ENV. April. https://portal.navfac.navy.mil/portal/page?_pageid=181,5386718&_dad=portal&_schema=PORTAL
Pacific Northwest National Laboratory (PNNL). 2007. Visual Sample Plan, Version 5.0, Users Guide. PNNL-16939 September. dqo.pnl.gov/vsp/pnnl16939.pdf
U.S. Environmental Protection Agency (EPA). 1989. Risk Assessment Guidance for Superfund, Volume I: Human Health Evaluation Manual (Part A). EPA/540/1-89/002. www.epa.gov/oswer/riskassessment/
EPA. 1992. Statistical Methods for Evaluating Attainment of Cleanup Standards, Volume 3: Reference-Based Standards for Soils and Solid Media. EPA 230-R-94-004. December. www.clu-in.org/download/stats/vol3-refbased.pdf
EPA. 1995. Engineering Forum Issue: Determination of Background Concentrations of Inorganics in Soils and Sediments at Hazardous Waste Sites. EPA/540/S-96/500. December. www.epa.gov/esd/tsc/images/engin.pdf
EPA. 2002a. Guidance for Comparing Background and Chemical Concentrations in Soil for CERCLA Sites. EPA 540-R-01-003. September. www.epa.gov/oswer/riskassessment/pdf/background.pdf
EPA. 2002b. Guidance for Choosing a Sampling Design for Environmental Data Collection. EPA/240/R-02/005. December. www.epa.gov//quality1/qs-docs/g5s-final.pdf
EPA. 2006a. Data Quality Assessment: A Reviewer’s Guide, EPA QA/G-9R. EPA/240/B-06/002. February. www.epa.gov/quality/qa_docs.html
EPA. 2006b. Data Quality Assessment: Statistical Methods for Practitioners, EPA QA/G-9S. EPA/240/B-06/003. February. www.epa.gov/quality/qa_docs.html
EPA. 2007. ProUCL Version 4.00.02 User Guide. EPA/600/R-07/038. April. www.epa.gov/esd/tsc/images/proUCL4user.pdf.

PROVEN TECHNOLOGIES AND REMEDIES GUIDANCE – REMEDIATION OF METALS IN SOIL
Background Estimates of Metals in Soil B-19
ATTACHMENT A
Arsenic Strategies, Determination of Arsenic Remediation, Development of Arsenic Cleanup Goals for Proposed and Existing School Sites (DTSC, 2007)