appendix b – survey of water softener penetration into the
TRANSCRIPT

Appendix B – Survey of Water Softener Penetration into the Residential Market in the Phoenix Metropolitan Area
1
1
Survey of Water Softener Penetration Into the Residential Market in
The Phoenix Metropolitan Area
Prepared For:
U.S. DEPARTMENT OF THE INTERIOR BUREAU OF RECLAMATION LOWER COLORADO REGION
PHOENIX AREA OFFICE
November 11, 2004
Prepared By:
Insights & Solutions, Inc.
th8222 S. 48 St. Suite 210
Phoenix Arizona 85044
(480) 874-1222 Fax (480) 874-2111
insightssolutions.com
1
TABLE OF CONTENTS TABLE OF CONTENTS....................................................................................................... 2 BACKGROUND................................................................................................................... 3 METHODOLOGY................................................................................................................. 4
................................................................................................................ 4 Areas Surveyed................................................................................................ 5 City/Zip Code Cluster Map
....................................................................................................... 6 Qualified Residences:.............................................................................................................. 6 Sampling Method............................................................................................................. 6 CATI Interviewing
................................................................................................................... 6 Questionnaire....................................................................................................................... 7 Tabulations
...................................................................................................... 7 Statistical SignificanceCONCLUSION ..................................................................................................................... 8 EXECUTIVE SUMMARY ................................................................................................... 10 FINDINGS .......................................................................................................................... 13
.................................................................................................................... 13 Water Taste......................................................................................... 14 Rating of Local Water Quality
.............................................................................................................. 15 Water Concerns..................................................... 17 Willingness to Pay More for Increased Water Quality
............................................................................................................. 19 Type of Dwelling............................................................................................................ 20 Home Ownership
................................................................................................................... 21 Age of Home............................................................................................. 22 Swimming Pool Ownership
......................................................................................................... 24 Backwashing Pools.................................................................................................... 26 Water Devices Owned
................................................................................ 27 Water Devices Owned (Continued)......................................................................... 29 Water Softener in Home or Added Later
................................................................................................ 32 Usage of Water Softener.............................................................................. 33 Primary Reason Use Water Softener
.............................................................................................................. 34 Extent of Usage.......................................................................................... 35 Water Softener Maintenance
..................................................................................................... 36 Home Addition of Salt............................................................................................... 38 Frequency of Adding Salt
..................................................................................... 39 Pounds of Salt Used Per Month........................................... 40 Usage of Sodium Chloride versus Potassium Chloride Salt
.......................................................................................................... 41 Household Income
Survey of Water Softener Penetration Into the Residential Market in The Phoenix Metropolitan Area November 2004 Source: Insights & Solutions, Inc.
2

BACKGROUND The Central Arizona Salinity Study in Phase I attempted to identify and quantify the sources of salt that are entering the waste water treatment plants in the Phoenix metropolitan area. Residential properties seem to be a large contributor of salts to the water cycle. It is thought that water softeners, which replace calcium and magnesium, with sodium or potassium are one of the biggest sources of residential salts. One major unanswered question has been; how many residents have water softeners in their homes? The Bureau of Reclamation and the Sub-Regional Operating Group (SROG) cities of Phoenix, Tempe, Glendale, Scottsdale and Mesa asked Insights & Solutions, Inc. (I&S) to conduct a telephone survey to answer the question; how far have the water softeners penetrated into the residential market? Among other issues, the study was designed to answer the following questions:
• Percentage of water softeners in established (Area 1) verses growth areas (Areas 2). • Percentage of water softeners verses household income. • Percentage of sodium chloride versus potassium chloride versus household income. • Percentage of households who believe they have poor quality water which have water
softeners versus percentage of households who believe they have poor quality water which do not have a water softener.
• Percentage of households who have water softeners and home RO units. • Percentage of water softeners compared to age of home.
Survey of Water Softener Penetration Into the Residential Market in The Phoenix Metropolitan Area November 2004 Source: Insights & Solutions, Inc.
3

METHODOLOGY Areas Surveyed The markets surveyed consisted of two separate sampling areas, encompassing the following areas:
Area 1 – Established Areas of Phoenix, Glendale, Scottsdale, Tempe and Mesa • Zip Codes 85301, 85031, 85051, 85032, 85015, 85013, 85014, 85016, 85020, 85021,
85018, 85008, 85040, 85257, 85251, 85250, 85281, 85282, 85201, 85202, 85204, 85203, 85213, 85205
Area 2 - New Growth Areas of north Scottsdale, Phoenix and Glendale and the new growth areas of east Mesa and south Phoenix (Ahwatukee) • Zip Codes 85027, 85310, 85283, 85085, 85086, 85024, 85050, 85255, 85262, 85263,
85259, 85048, 85045, 85207, 85208, 85215, 85206, 85205 (See Attached Map)
Survey of Water Softener Penetration Into the Residential Market in The Phoenix Metropolitan Area November 2004 Source: Insights & Solutions, Inc.
4

City/Zip Code Cluster Map
Survey of Water Softener Penetration Into the Residential Market in The Phoenix Metropolitan Area November 2004 Source: Insights & Solutions, Inc.
5

Qualified Residences: Qualified residences included:
• Single Family • Duplex • Townhouse • Condominium • Mobile Home/Trailer
Apartment dwellers were excluded from the study. Sampling Method As the primary objective of the study was to determine incidence of Water Softeners in homes, I&S employed random telephone numbers in the two selected areas and Random Digit dialing to complete the surveys, as opposed to using listed samples. Random samples and Random Digit dialing ensured that all households had an equal chance of being contacted (as opposed to listed samples that eliminate unlisted households).
CATI Interviewing All calls were made from I&S’ in-house, CRT equipped telephone interviewing facility in Phoenix, Arizona. I&S computerized the survey process ensuring that interviewers accurately followed the telephone script. I&S’ in-house, expertly trained CATI programmers programmed the survey for use. The survey was programmed in both English and Spanish. Respondents were asked in which language they preferred to have the survey conducted and were surveyed in the selected language. The inclusion of Spanish language surveys ensured that all households were included in the study, increasing the accuracy of the findings. Questionnaire The questionnaire was four minutes in length and addressed the following subjects:
• Language preference • Rating taste of tap water • Residence Zip Code • Rating of local water quality • Primary concern: Water quality, water availability, water cost • Willingness to pay more for increased water quality • Type of residence
Survey of Water Softener Penetration Into the Residential Market in The Phoenix Metropolitan Area November 2004 Source: Insights & Solutions, Inc.
6

• Own or rent dwelling • Age of home • Swimming pool ownership • Where backwash pool • Ownership of Reverse Osmosis filter or Water Softener • Purchased home with Water Softener or added it later • Current use of Water Softener • Primary reason for using Water Softener • Extent to Water Softener usage • Service unit themselves or through Service Contract • Salt added by household member • Frequency of adding salt • Quantity of salt utilized each month • Type of salt used: Sodium Chloride vs. Potassium Chloride • Household income
Tabulations The study was tabulating by Insights & Solutions’ trained programming staff using Insights & Solutions’ proprietary SaTabs tabulation program. This program provides imbedded charting and graphing functions for the end user to use in reporting the information as well as the standard cross tabulations of the data. Statistical Significance In total, 2,453 households were screened, 1,392 in the Established Area and 1,061 in the Growth area. At the 95% confidence interval the data is statistically significant +/- 2 percentage points in total and +/- 3 percentage points within each sampled area.
Survey of Water Softener Penetration Into the Residential Market in The Phoenix Metropolitan Area November 2004 Source: Insights & Solutions, Inc.
7
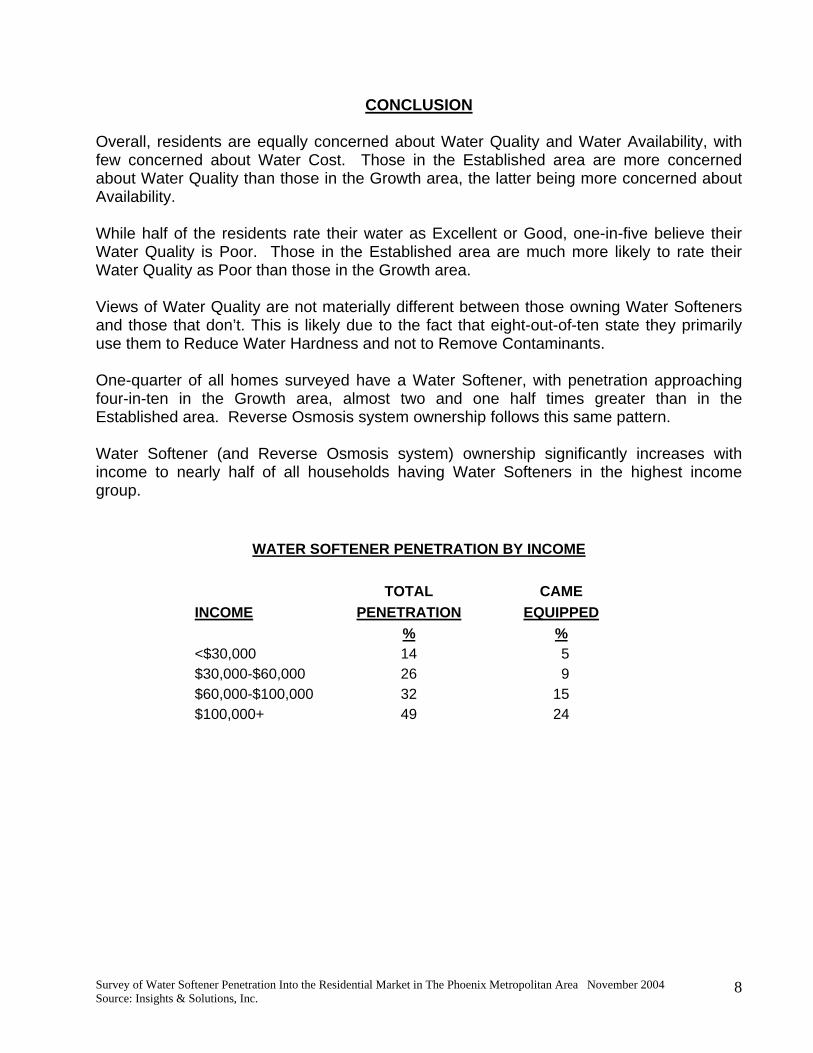
CONCLUSION Overall, residents are equally concerned about Water Quality and Water Availability, with few concerned about Water Cost. Those in the Established area are more concerned about Water Quality than those in the Growth area, the latter being more concerned about Availability. While half of the residents rate their water as Excellent or Good, one-in-five believe their Water Quality is Poor. Those in the Established area are much more likely to rate their Water Quality as Poor than those in the Growth area. Views of Water Quality are not materially different between those owning Water Softeners and those that don’t. This is likely due to the fact that eight-out-of-ten state they primarily use them to Reduce Water Hardness and not to Remove Contaminants. One-quarter of all homes surveyed have a Water Softener, with penetration approaching four-in-ten in the Growth area, almost two and one half times greater than in the Established area. Reverse Osmosis system ownership follows this same pattern. Water Softener (and Reverse Osmosis system) ownership significantly increases with income to nearly half of all households having Water Softeners in the highest income group.
WATER SOFTENER PENETRATION BY INCOME TOTAL CAME INCOME PENETRATION EQUIPPED % %<$30,000 14 5 $30,000-$60,000 26 9 $60,000-$100,000 32 15 $100,000+ 49 24
Survey of Water Softener Penetration Into the Residential Market in The Phoenix Metropolitan Area November 2004 Source: Insights & Solutions, Inc.
8

The survey shows an increasing trend for new homes to come equipped with Water Softeners. And, Water Softeners are now a significance presence in all homes regardless of age, when we include those added after individuals move in.
WATER SOFTENER PENETRATION BY YEAR OF HOME YEAR
HOME TOTAL CAME BUILT PENETRATION EQUIPPED % %<1970 17 5 1970s 23 8 1980s 27 12 1990s 47 22 2000+ 51 29
We also see a strong correlation between swimming pool ownership, Water Softener and Reverse Osmosis System ownership indicating they are all “quality of life” amenities. Nearly all Water Softeners are currently being used. About one-third are used to soften all the household’s water, about half are used to soften just the inside water and the remainder are softening just hot water. About a third of those with Water Softeners have someone else maintain them and the remainder do it themselves. Most households add 40 lbs of salt, once a month. Sodium Chloride is the predominant type of salt used at the rate of 1.63 to 1 compared to Potassium Chloride.
Survey of Water Softener Penetration Into the Residential Market in The Phoenix Metropolitan Area November 2004 Source: Insights & Solutions, Inc.
9

EXECUTIVE SUMMARY
• The taste of tap water in the sampled areas is rated Fair to Poor by two-thirds of the population (66%), with four-out-of-ten (41%) rating it Poor.
o Poor ratings were similar whether or not they own a Water Softener 9Own Water Softener=37% vs. Don’t Own Water Softener=41%)
o Residents in the Established area rated their tap water poorer than those living in the Growth area (44% vs. 37%).
• Half (50%) of the population surveyed rate their Water Quality as Excellent or Good, with the Growth areas rating their Water Quality higher than those in the Established area (53% vs. 48%).
• About one-in-five (19%) rate their Water Quality as Poor. o Those in the Established area rate their Water Quality significantly Poorer
than those in the Growth area (22% vs. 15%). o Ownership of Water Softeners does not materially affect their rating of Water
Quality (Own Water Softener=53% vs. Don’t Own Water Softener=51%). • Residents are equally concerned about Water Quality (44%) and Water Availability
(43%). Few (7%), overall, think Cost is a major concern, even among the lowest income groups (12%).
o Water Quality is more important to those in the Established area (48%). o Water Availability is more important in the Growth area (47%), among higher
income groups (up to 56%) and among those with Water Softeners (50%). o Those without Water Softeners are equally concerned about Water Quality
(43%) and Water Availability (46%). • One-quarter (26%) of the respondents would pay more to increase their Water
Quality. o Those living in the Established area are significantly more likely to say they
would pay more (30%) versus those in the Growth areas (20%) • Single-family homes are the predominant dwelling type, with more than two-thirds
(68%) living in this home type. One-in-seven (14%) live in apartments and the remainder are spread across the remaining home types.
o In the Growth area, a higher percentage of people live single-family homes (79% vs. 61%) and Mobile homes/Trailers (9% vs. 4%).
o In the Established area a higher percentage of people live in Apartments (22% vs. 4%), Condos (6% vs. 4%), Townhouses (5% vs. 1%) and Duplexes (2% vs. < 1%).
• Three-quarters (75%) of respondents say they own their dwelling. o Home ownership is significantly higher in the Growth area (87% than in the
Established area (66%). • The average home was built in 1985, with the average dwelling in the Established
area built in 1975 and in the Growth area in 1995.
Survey of Water Softener Penetration Into the Residential Market in The Phoenix Metropolitan Area November 2004 Source: Insights & Solutions, Inc.
10

o One-third (33%) of the homes built in the Established area were built before 1970.
• Over one-in-four (27%) homes have a swimming pool. o There are significantly more pools in the Growth area (31%) than in the
Established area (24%). o Homes with Water Softeners are much more likely to have swimming pools
than those without Water Softeners (46% vs. 26%). o Pool ownership skews significantly to higher income groups (<$30,000=14%
vs. $100,000+=60%). o New homes are significantly more likely to have swimming pools (pre-
1970s=24% vs. 1990s=44%, 2000+ 38%) • About one-in-six (17%) people backwash their pools, amounting to about two-thirds
(63%) of pool owners backwashing their pools. • One-quarter (25%) of all households surveyed own a Water Softener.
o Penetration is significantly higher in the Growth area (39%) than in the Established area (16%) or nearly two and one half times greater (2.44).
o Ownership of Reverse Osmosis systems is similar to Water Softener ownership (Growth area=35% vs. Established area=18%).
o Ownership of both types of systems is much higher in the Growth area (23% vs. 6%) or almost four times as great (3.83).
o Significantly more households have neither type of system in the Established area (49% vs. 42%).
o There is a direct relationship between income and water system ownership. Water Softener ownership increases with income (<$30,000=14%; $100,000+=49%) and fully 70% of those earning <$30,000 do not have either a Reverse Osmosis or a Water Softener system.
o Newer homes have a much higher penetration of Water Softeners and Reverse Osmosis systems than older homes.
Half (51%) of homes built since 2000 have Water Softeners Only one-in-six (17%) of homes built prior to 1970 have Water
Softeners Two-thirds (67%) of homes built before 1970 have neither system.
• Nearly half (43%) of homes that have a Water Softener said it was in the home when they moved in (or 11% of total homes), with the remainder adding it.
o Nearly one-in-five (18%) of homes in the Growth area came with Water Softeners.
o Only 6% of homes in the Established area came with a Water Softener. o Those earning $60,000 or more are as likely to add a Water Softener as to
have had it in the home when they moved in $60,000-$100,000=In-Home 15% vs. Added 17%; $100,000+=In-Home-24% vs. Added-25%).
o Those in lower income groups are more likely to add Water Softeners after they move in (<$30,000=In-Home-5% vs. Added-9%; $30,000-$60,000=In-Home-9% vs. Added-16%).
o There is an increasing trend for new homes to have Water Softeners.
Survey of Water Softener Penetration Into the Residential Market in The Phoenix Metropolitan Area November 2004 Source: Insights & Solutions, Inc.
11

<1970 = 5% 1970s = 8% 1980s = 12% 1990s = 22% 2000+ = 29%
• Nearly all households with Water Softeners use their units (94%). This amounts to
14% in the Established area and 37% in the Growth area, 24% overall. • Water Softeners are primarily used to Reduce Water Hardness (80%). Removing
Contaminants is a distant, secondary (6%) reason. • Nearly half (45%) of Water Softeners just soften inside water, a third (37%) soften all
the water and 9% soften just hot water. o Overall, 10% are softening all the water, 12% inside water and 2% hot water.
• One-in-fourteen (7%) households have someone maintain their Water Softener or just over a quarter (27%) of those with Water Softeners.
• One-in-six (16%) households add their own salt to their Water Softener. o Two-thirds (61%) of households with Water Softeners add their own salt. o One-quarter (25%) of households in the Growth area add their own salt. o Corresponding to newer homes having more Water Softeners, approximately
one-third of homes 1990s or newer add their own salt (1990s=30%, 2000+=34%)
• Most households add salt once a month or 11% of households. • The average household adds 40 pounds of salt a month. • Sodium Chloride salt is used significantly more often than Potassium Chloride (18%
vs. 11%).
Survey of Water Softener Penetration Into the Residential Market in The Phoenix Metropolitan Area November 2004 Source: Insights & Solutions, Inc.
12

FINDINGS Water Taste Overall, the taste of tap water is rated Fair or Poor by two-thirds of those screened (66%), with 41% rating it Poor. Poor ratings are similar regardless of owning a Water Softener (Own Water Softener=37%, Do not own Water Softener=41%). However, Poor ratings are significantly greater in the Established area (44%) than in the Growth area (37%)
Survey of Water Softener Penetration Into the Residential Market in The Phoenix Metropolitan Area November 2004 Source: Insights & Solutions, Inc.
13

Rating of Local Water Quality Half (50%) of respondents rate their local water quality as Excellent or Good. Similar to taste ratings, the Established areas rate taste significantly lower (48%) than those in the Growth area (53%). Ownership of Water Softeners indicates a directional skew with those with Water Softeners rating their water quality somewhat higher (53% Excellent/Good vs. those without Water Softeners 50% Excellent/Good). Just less than one in five (19%) rate their local water quality as Poor, with significantly more in the Established areas rating their water quality as Poor (22%) than those in the Growth areas (15%). Poor ratings are similar regardless of Water Softener ownership (Own=17%, Do Not Own=18%).
Survey of Water Softener Penetration Into the Residential Market in The Phoenix Metropolitan Area November 2004 Source: Insights & Solutions, Inc.
14

Water Concerns When asked about their principal concern, Water Quality and Water Availability are virtually tied, with 44% saying Water Quality and 43% saying Water Availability. Only 7% say Cost. Water Quality is much more of a concern among those living in the Established areas (48%), whereas Water Availability is more of a concern among those in the Growth area (47%). Those with Water Softeners are significantly more likely to be concerned with Water Availability over Quality (Water Availability=50% vs. Water Quality=39%). Those without Water Softeners are about equally concerned about Water Quality and Water Availability (Water Quality=43% vs. Water Availability=46%).
Survey of Water Softener Penetration Into the Residential Market in The Phoenix Metropolitan Area November 2004 Source: Insights & Solutions, Inc.
15
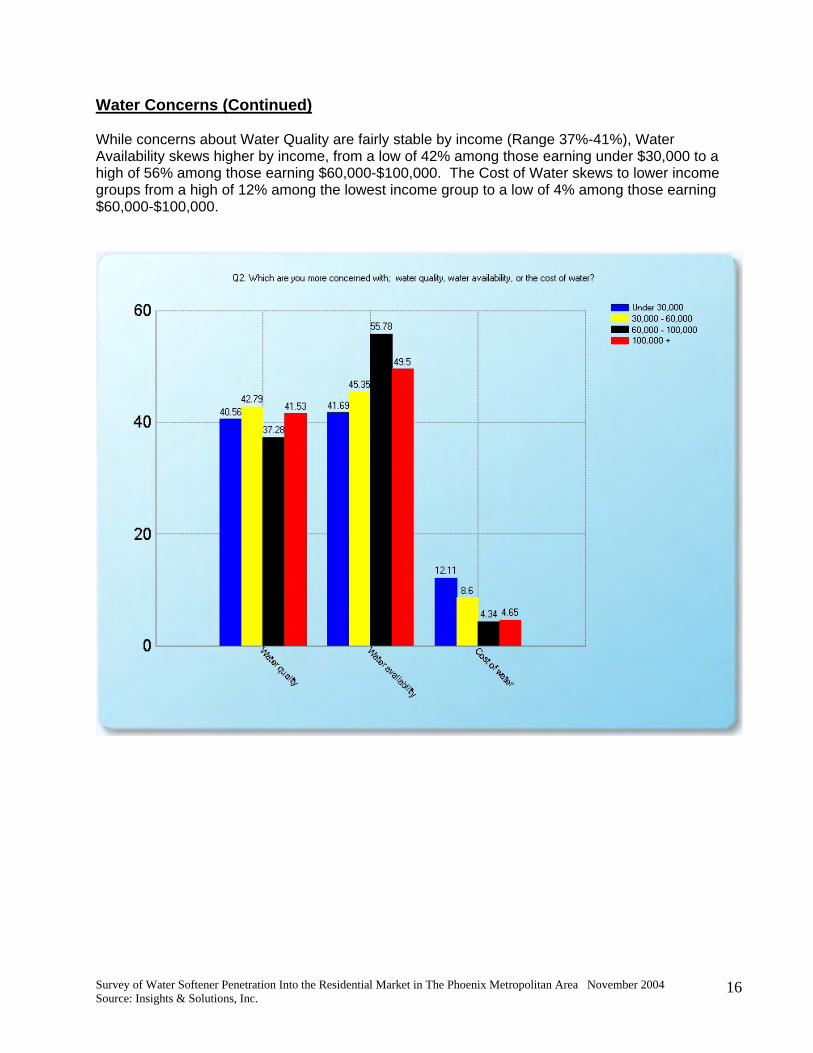
Water Concerns (Continued) While concerns about Water Quality are fairly stable by income (Range 37%-41%), Water Availability skews higher by income, from a low of 42% among those earning under $30,000 to a high of 56% among those earning $60,000-$100,000. The Cost of Water skews to lower income groups from a high of 12% among the lowest income group to a low of 4% among those earning $60,000-$100,000.
Survey of Water Softener Penetration Into the Residential Market in The Phoenix Metropolitan Area November 2004 Source: Insights & Solutions, Inc.
16

Willingness to Pay More for Increased Water Quality About one-quarter (26%) of all respondents would pay more for increased Water Quality. Those in the Established areas show significantly more likelihood to pay more (30%) versus the Growth areas (20%).
Survey of Water Softener Penetration Into the Residential Market in The Phoenix Metropolitan Area November 2004 Source: Insights & Solutions, Inc.
17

Willingness to Pay More for Increased Water Quality (Continued) Willingness to pay more generally skews higher with income, though not to the degree that geography does (<$30,000=23% vs. $100,000+=27%).
Survey of Water Softener Penetration Into the Residential Market in The Phoenix Metropolitan Area November 2004 Source: Insights & Solutions, Inc.
18

Type of Dwelling Overall, over two-thirds of all respondents live in a single-family home (68%); one in seven (14%) live in apartments, with the remainder spread across Mobile homes/Trailers (6%), Condominiums (5%), Townhouses (3%) and Duplexes (1%). While single-family homes are still the predominant dwelling type in the Established area (61%), versus the Growth Area, we see a higher percentage of people living in Apartments (22% vs. 4%), Condos (6% vs. 4%), Townhouses (5% vs. 1%) and Duplexes (2% vs. <1%). In the Growth area, significantly more live in single-family homes (79% vs. 61%) and Mobile homes/Trailers (9% vs. 4%).
Survey of Water Softener Penetration Into the Residential Market in The Phoenix Metropolitan Area November 2004 Source: Insights & Solutions, Inc.
19
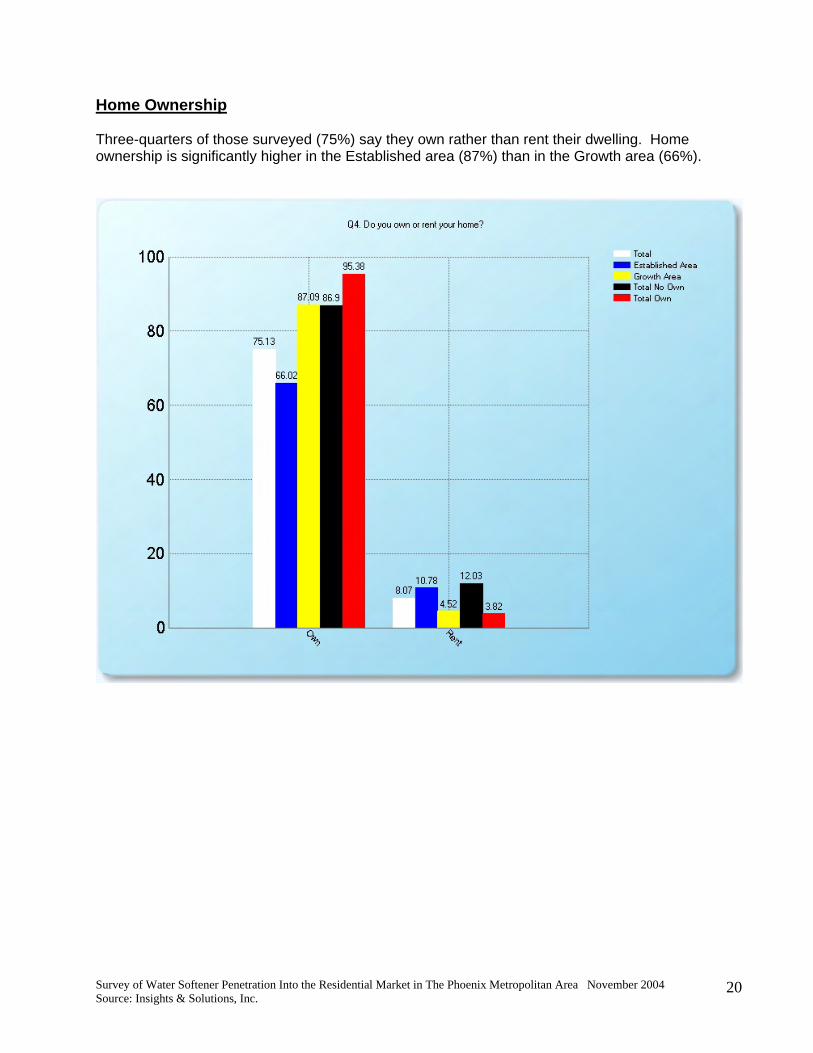
Home Ownership Three-quarters of those surveyed (75%) say they own rather than rent their dwelling. Home ownership is significantly higher in the Established area (87%) than in the Growth area (66%).
Survey of Water Softener Penetration Into the Residential Market in The Phoenix Metropolitan Area November 2004 Source: Insights & Solutions, Inc.
20

Age of Home The average home was built in 1985. As would be expected, homes are much older in the Established area with the median age at 1975 versus 1995 in the Established area. Fully, one-third of the dwellings in the Established area were built before 1970 (33%) versus only 5% in the Established area.
Survey of Water Softener Penetration Into the Residential Market in The Phoenix Metropolitan Area November 2004 Source: Insights & Solutions, Inc.
21

Swimming Pool Ownership Just over one-quarter of all dwellings have a swimming pool (27%), with pool ownership significantly greater in the Growth area (31%) versus the Established area (24%). Dwellings with Water Softeners are 77% more likely to have a swimming pool than those without a Water Softener (46% vs. 26%).
Survey of Water Softener Penetration Into the Residential Market in The Phoenix Metropolitan Area November 2004 Source: Insights & Solutions, Inc.
22
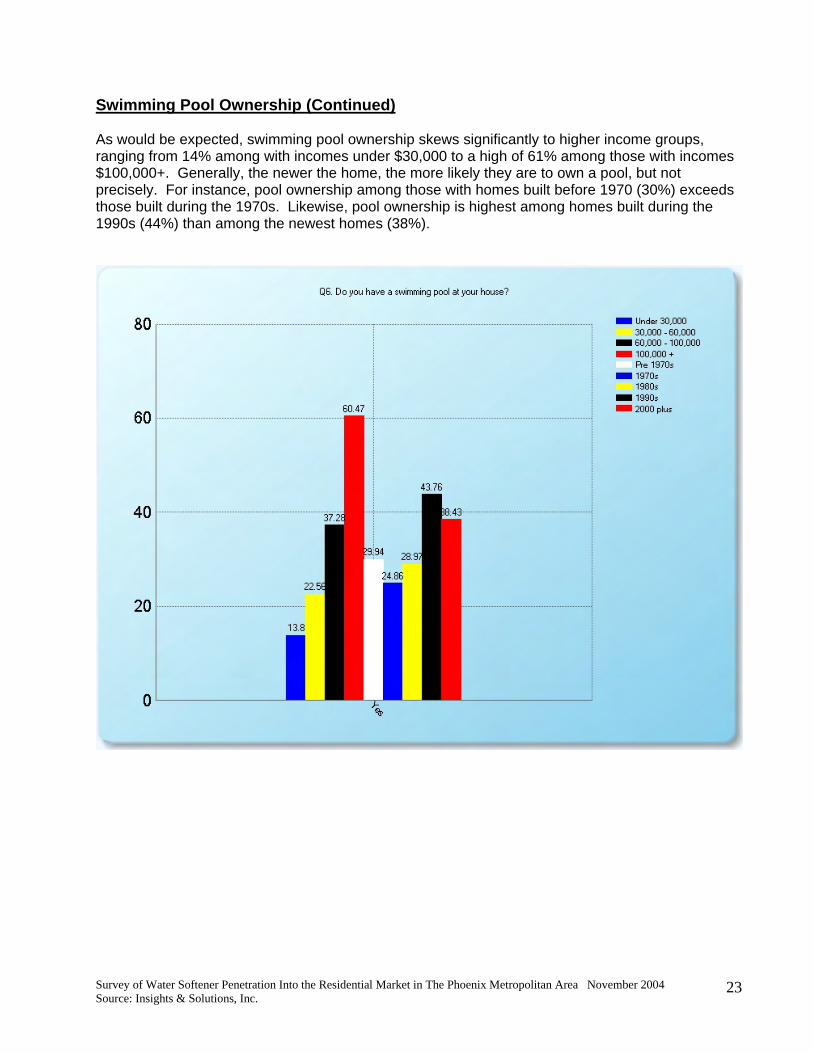
Swimming Pool Ownership (Continued) As would be expected, swimming pool ownership skews significantly to higher income groups, ranging from 14% among with incomes under $30,000 to a high of 61% among those with incomes $100,000+. Generally, the newer the home, the more likely they are to own a pool, but not precisely. For instance, pool ownership among those with homes built before 1970 (30%) exceeds those built during the 1970s. Likewise, pool ownership is highest among homes built during the 1990s (44%) than among the newest homes (38%).
Survey of Water Softener Penetration Into the Residential Market in The Phoenix Metropolitan Area November 2004 Source: Insights & Solutions, Inc.
23
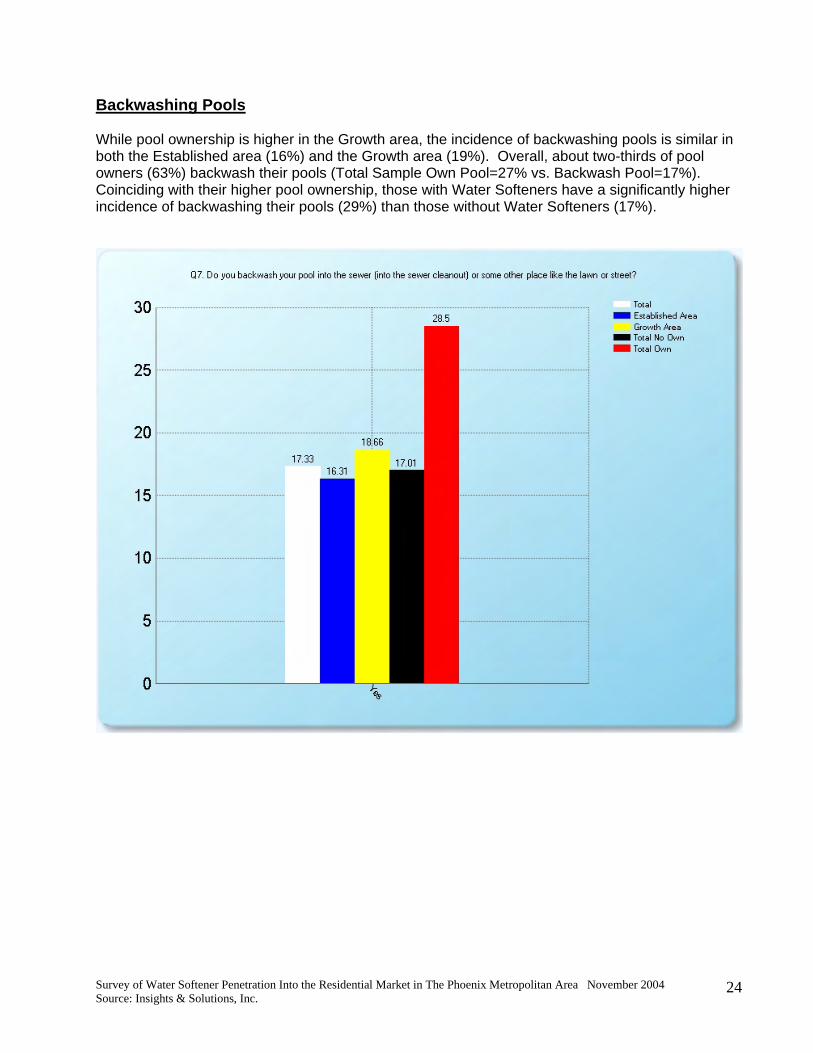
Backwashing Pools While pool ownership is higher in the Growth area, the incidence of backwashing pools is similar in both the Established area (16%) and the Growth area (19%). Overall, about two-thirds of pool owners (63%) backwash their pools (Total Sample Own Pool=27% vs. Backwash Pool=17%). Coinciding with their higher pool ownership, those with Water Softeners have a significantly higher incidence of backwashing their pools (29%) than those without Water Softeners (17%).
Survey of Water Softener Penetration Into the Residential Market in The Phoenix Metropolitan Area November 2004 Source: Insights & Solutions, Inc.
24

Backwashing Pools (Continued) Similarly, backwashing follows the pattern of pool ownership within income and age of home groups.
Survey of Water Softener Penetration Into the Residential Market in The Phoenix Metropolitan Area November 2004 Source: Insights & Solutions, Inc.
25

Water Devices Owned Overall, one-quarter (26%) of the households surveyed have a Water Softener. Water Softener ownership is significantly higher in the Growth area (39%) than in the Established area (16%), or almost two and one half times greater (2.44). The ownership pattern for Reverse Osmosis systems is similar to Water Softener ownership (35% vs. 18%). Ownership of both types of systems is much higher in the Growth area (23%) vs. the Established area (6%) or almost four times greater (3.83). As a result, those in the Established area have significantly more saying they own neither type of system than those in the Growth area (49% vs. 42%).
Survey of Water Softener Penetration Into the Residential Market in The Phoenix Metropolitan Area November 2004 Source: Insights & Solutions, Inc.
26
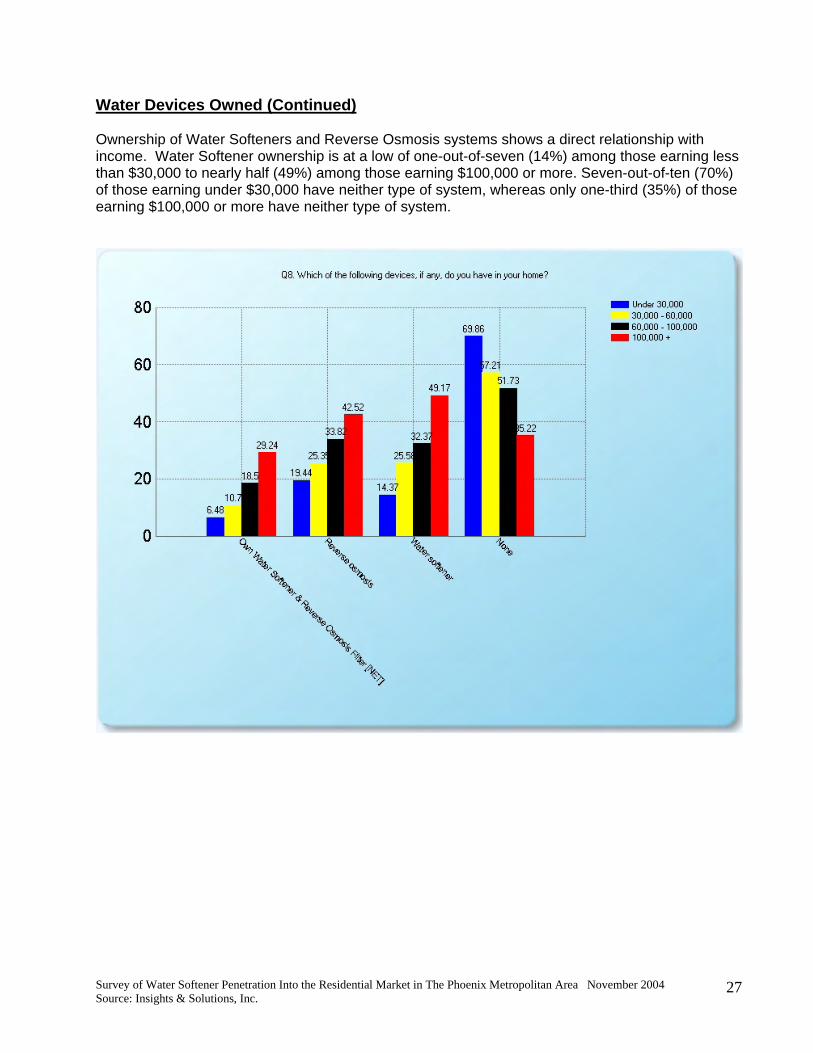
Water Devices Owned (Continued) Ownership of Water Softeners and Reverse Osmosis systems shows a direct relationship with income. Water Softener ownership is at a low of one-out-of-seven (14%) among those earning less than $30,000 to nearly half (49%) among those earning $100,000 or more. Seven-out-of-ten (70%) of those earning under $30,000 have neither type of system, whereas only one-third (35%) of those earning $100,000 or more have neither type of system.
Survey of Water Softener Penetration Into the Residential Market in The Phoenix Metropolitan Area November 2004 Source: Insights & Solutions, Inc.
27

Water Devices Owned (Continued) Similarly, we see that, the newer the home, the higher the penetration of Water Softener and Reverse Osmosis systems. Homes built since 2000 have a Water Softener penetration of 51% versus only 17% among homes built before 1970. Two-thirds of homes built before 1970 (67%) have neither type of system, versus only one-third (38%) having neither type of system in homes built since 2000.
Survey of Water Softener Penetration Into the Residential Market in The Phoenix Metropolitan Area November 2004 Source: Insights & Solutions, Inc.
28

Water Softener in Home or Added Later Among those owning a Water Softener, just over half (55%) say they added the Water Softener after they moved in. This represents 20% of homes in the Growth area and 9% in the Established area. Four-out-of-ten (44%) of the homes in the Growth area came with Water Softeners, representing nearly one-in-five (18%) of the dwellings. Only one-in-seventeen homes (6%) in the Established area came with a Water Softener.
Survey of Water Softener Penetration Into the Residential Market in The Phoenix Metropolitan Area November 2004 Source: Insights & Solutions, Inc.
29

Water Softener in Home or Added Later (Continued) Those earning $60,000 or more are as likely to add a Water Softener as to have had one in their home when the moved in ($60,000-$100,000= In-Home-15% vs. Added-17%; $100,000+= In-Home-24% vs. Added-25%). Those in lower income groups are more likely to add Water Softeners after they move in (<$30,000= In-Home-5% vs. Added-9%; $30,000-$60,000= In-Home-9% vs. Added-16%).
Survey of Water Softener Penetration Into the Residential Market in The Phoenix Metropolitan Area November 2004 Source: Insights & Solutions, Inc.
30
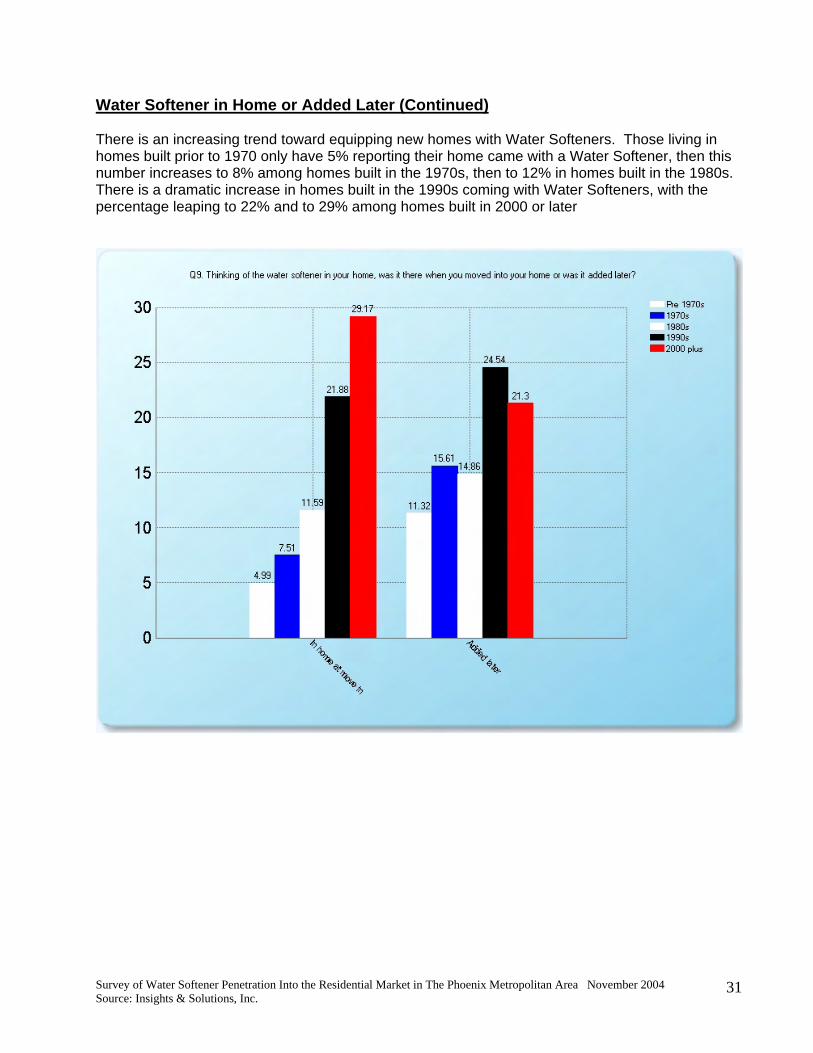
Water Softener in Home or Added Later (Continued) There is an increasing trend toward equipping new homes with Water Softeners. Those living in homes built prior to 1970 only have 5% reporting their home came with a Water Softener, then this number increases to 8% among homes built in the 1970s, then to 12% in homes built in the 1980s. There is a dramatic increase in homes built in the 1990s coming with Water Softeners, with the percentage leaping to 22% and to 29% among homes built in 2000 or later
Survey of Water Softener Penetration Into the Residential Market in The Phoenix Metropolitan Area November 2004 Source: Insights & Solutions, Inc.
31

Usage of Water Softener Nearly all of those owning a Water Softener are using their units (94%). This amounts to one quarter of all households (24%); 14% of households in the Established area and 37% in the Growth area.
Survey of Water Softener Penetration Into the Residential Market in The Phoenix Metropolitan Area November 2004 Source: Insights & Solutions, Inc.
32
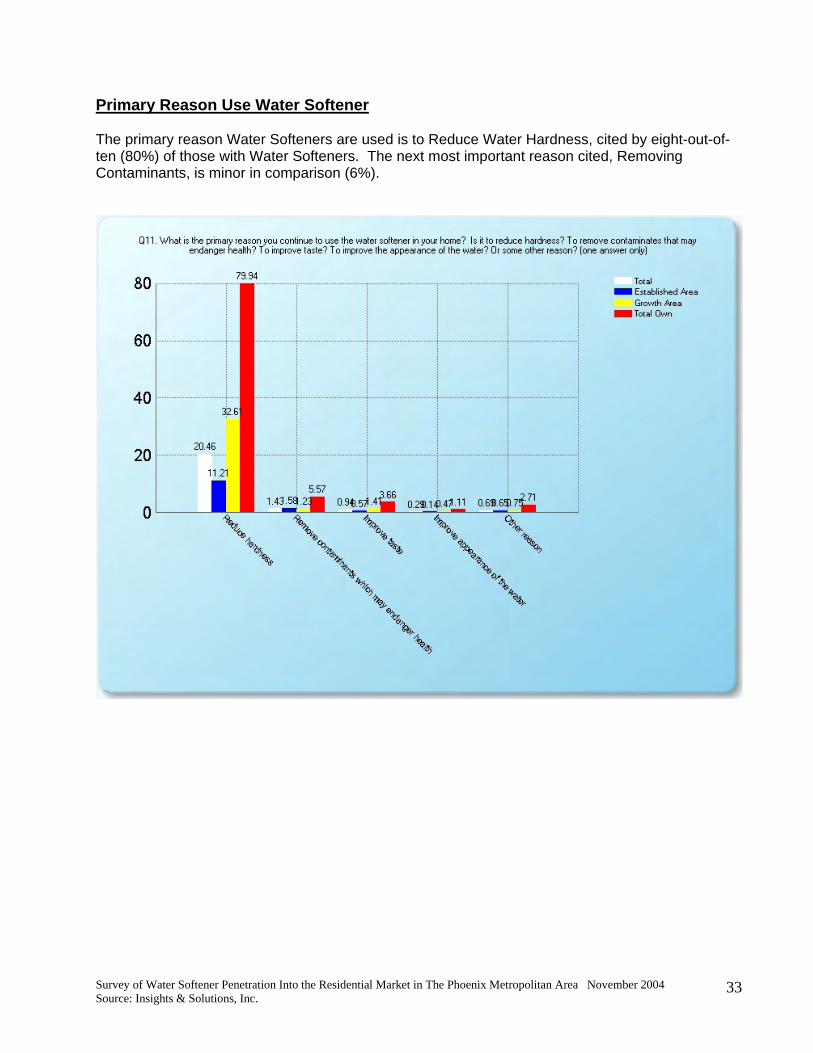
Primary Reason Use Water Softener The primary reason Water Softeners are used is to Reduce Water Hardness, cited by eight-out-of-ten (80%) of those with Water Softeners. The next most important reason cited, Removing Contaminants, is minor in comparison (6%).
Survey of Water Softener Penetration Into the Residential Market in The Phoenix Metropolitan Area November 2004 Source: Insights & Solutions, Inc.
33

Extent of Usage Nearly half of those with Water Softeners (45%) say they just soften inside water. A third (37%) say they soften all their water and the remainder (9%) says they just soften their hot water. Thus, one-in-ten households (10%) are softening all their water, one-in-eight (12%) are softening just their inside water and 2% are softening just their hot water.
Survey of Water Softener Penetration Into the Residential Market in The Phoenix Metropolitan Area November 2004 Source: Insights & Solutions, Inc.
34

Water Softener Maintenance Just over half (27%) of those with Water Softeners have someone come to their home on a regular basis to maintain their Water Softener, or one-in-fourteen homes. One-in-ten (10%) households in the Growth area have someone maintain their units.
Survey of Water Softener Penetration Into the Residential Market in The Phoenix Metropolitan Area November 2004 Source: Insights & Solutions, Inc.
35
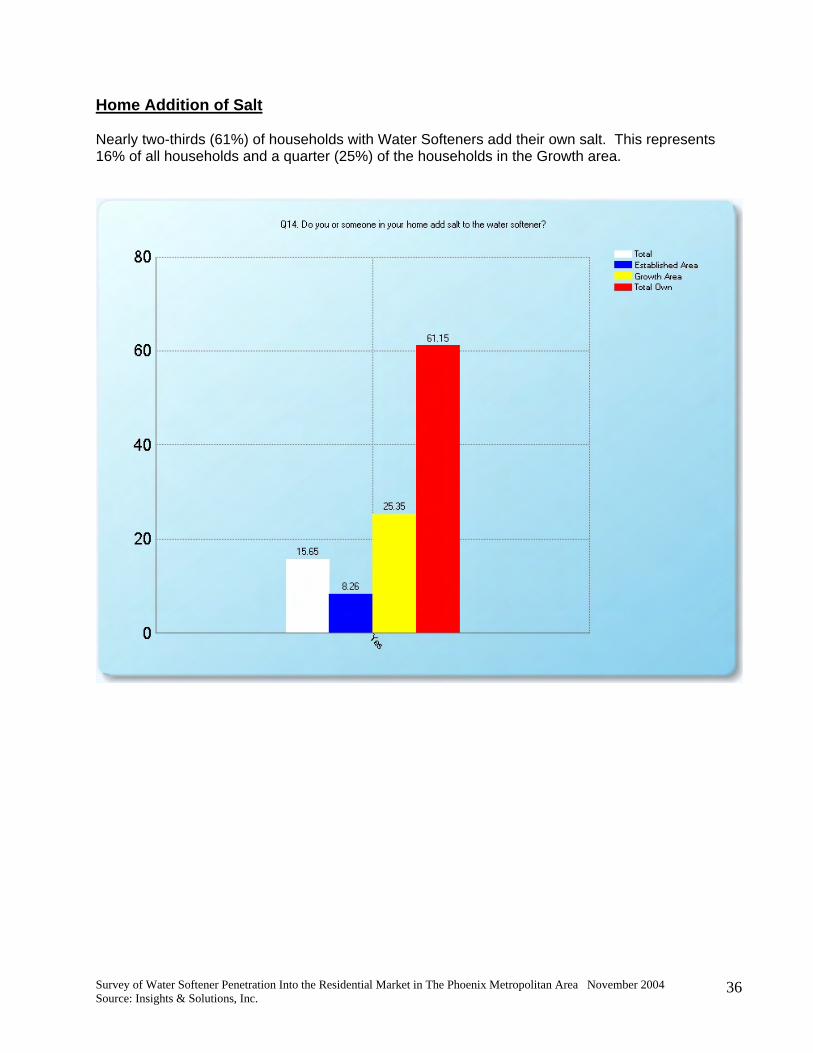
Home Addition of Salt Nearly two-thirds (61%) of households with Water Softeners add their own salt. This represents 16% of all households and a quarter (25%) of the households in the Growth area.
Survey of Water Softener Penetration Into the Residential Market in The Phoenix Metropolitan Area November 2004 Source: Insights & Solutions, Inc.
36

Home Addition of Salt (Continued) Approximately one-third of homes built since 1990 add salt to their units (1990s=30%; 2000+=34%). Homes built prior to 1990 show rates from 17% among those built during the 80s to a low of 8% among those homes built prior to 1970.
Survey of Water Softener Penetration Into the Residential Market in The Phoenix Metropolitan Area November 2004 Source: Insights & Solutions, Inc.
37

Frequency of Adding Salt The vast majority of those owning Water Softeners add salt once a month (41%) or 11% of households.
Survey of Water Softener Penetration Into the Residential Market in The Phoenix Metropolitan Area November 2004 Source: Insights & Solutions, Inc.
38

Pounds of Salt Used Per Month The median amount of salt used per month is 40 pounds.
Survey of Water Softener Penetration Into the Residential Market in The Phoenix Metropolitan Area November 2004 Source: Insights & Solutions, Inc.
39

Usage of Sodium Chloride versus Potassium Chloride Salt While many don’t know the type of salt they use, those that do know say they use Sodium Chloride significantly more than Potassium Chloride (18% vs. 11%).
Survey of Water Softener Penetration Into the Residential Market in The Phoenix Metropolitan Area November 2004 Source: Insights & Solutions, Inc.
40

Household Income The median income of all households surveyed is $45,000. The median for the Established area is $45,000 and for the Growth area is $80,000. This same pattern is seen among those owning Water Softeners ($80,000) and those that don’t ($45,000).
Survey of Water Softener Penetration Into the Residential Market in The Phoenix Metropolitan Area November 2004 Source: Insights & Solutions, Inc.
41