appendix c - boston college
TRANSCRIPT
Appendix CPercentiles and Standard Deviations of Reading Achievement

328 appendix c: percentiles and standard deviations of reading achievement
Exhibit C.1: Percentiles of Achievement in Reading
Countries 5th percentile 25th percentile 50th percentile 75th percentile 95th percentile
Austria 427 (3.5) 498 (4.1) 542 (2.6) 582 (2.2) 636 (5.3)Belgium (Flemish) 451 (3.7) 512 (1.8) 549 (3.2) 585 (1.9) 636 (4.6)Belgium (French) 381 (2.7) 455 (3.2) 503 (3.4) 547 (2.9) 608 (4.1)Bulgaria 397 (10.0) 498 (6.5) 553 (4.6) 604 (3.4) 673 (6.0)Canada, Alberta 446 (5.8) 516 (4.2) 562 (2.6) 607 (2.6) 668 (2.6)Canada, British Columbia 439 (5.5) 513 (4.8) 561 (2.8) 606 (2.8) 668 (4.1)Canada, Nova Scotia 407 (8.1) 495 (3.7) 547 (2.4) 594 (2.8) 658 (3.8)Canada, Ontario 433 (4.7) 510 (4.0) 557 (3.5) 603 (4.3) 666 (4.7)Canada, Quebec 422 (6.9) 493 (3.4) 536 (3.7) 577 (3.8) 632 (4.0)Chinese Taipei 420 (3.9) 497 (3.0) 540 (1.7) 579 (2.0) 633 (4.7)Denmark 418 (4.5) 505 (3.6) 553 (2.7) 594 (1.8) 649 (2.9)England 383 (8.0) 486 (4.6) 546 (2.9) 598 (2.3) 673 (5.1)France 406 (2.5) 478 (2.4) 525 (2.1) 568 (2.1) 626 (4.7)Georgia 342 (5.1) 420 (5.5) 475 (3.4) 525 (3.7) 588 (5.1)Germany 430 (4.9) 508 (3.0) 553 (3.1) 593 (2.3) 647 (2.4)Hong Kong SAR 460 (4.7) 527 (2.9) 567 (1.6) 605 (1.8) 655 (2.9)Hungary 427 (6.4) 507 (5.0) 555 (3.1) 599 (3.5) 658 (2.3)Iceland 388 (2.6) 469 (2.0) 516 (1.2) 558 (2.4) 615 (2.3)Indonesia 271 (7.5) 351 (4.6) 408 (4.1) 460 (4.6) 529 (3.2)Iran, Islamic Rep. of 258 (5.3) 357 (4.7) 427 (3.6) 489 (4.6) 567 (2.5)Israel 325 (11.0) 453 (5.6) 527 (2.4) 582 (2.8) 653 (5.2)Italy 435 (5.3) 507 (3.0) 554 (3.3) 599 (4.3) 658 (3.3)Kuwait 148 (10.1) 251 (6.4) 331 (4.7) 411 (4.4) 510 (2.5)Latvia 433 (9.2) 501 (4.9) 543 (2.7) 585 (3.1) 639 (3.3)Lithuania 440 (5.1) 500 (2.0) 539 (1.5) 577 (2.2) 627 (4.5)Luxembourg 442 (2.7) 514 (1.8) 560 (1.9) 603 (1.2) 662 (2.4)Macedonia, Rep. of 272 (8.4) 369 (4.6) 448 (6.0) 518 (4.5) 599 (7.5)Moldova, Rep. of 378 (4.1) 457 (4.2) 505 (4.4) 547 (2.2) 606 (3.8)Morocco 144 (9.6) 244 (7.9) 321 (8.3) 402 (9.1) 503 (7.8)Netherlands 457 (3.3) 513 (1.8) 549 (1.9) 584 (1.8) 631 (2.1)New Zealand 374 (3.0) 478 (2.5) 539 (2.2) 592 (2.1) 664 (4.0)Norway 378 (3.8) 457 (5.5) 503 (3.2) 544 (2.4) 598 (3.7)Poland 386 (5.8) 470 (3.9) 525 (3.1) 572 (1.7) 635 (3.0)Qatar 198 (2.9) 284 (1.4) 353 (1.6) 424 (2.2) 509 (4.0)Romania 317 (12.7) 436 (8.5) 501 (4.5) 554 (3.0) 621 (3.5)Russian Federation 443 (9.5) 523 (4.4) 569 (4.1) 612 (2.9) 671 (2.7)Scotland 385 (5.5) 480 (4.9) 532 (4.1) 581 (3.8) 651 (8.4)Singapore 420 (5.8) 512 (4.9) 565 (4.0) 612 (2.8) 672 (3.2)Slovak Republic 394 (6.3) 488 (4.0) 539 (4.4) 582 (2.6) 639 (2.9)Slovenia 395 (3.7) 476 (2.2) 527 (1.9) 571 (1.7) 629 (2.6)South Africa 108 (3.4) 203 (3.6) 283 (4.8) 384 (9.2) 562 (13.2)Spain 390 (4.1) 468 (3.4) 517 (2.3) 561 (1.7) 622 (3.8)Sweden 437 (3.6) 512 (3.4) 554 (2.2) 592 (2.3) 647 (5.5)Trinidad and Tobago 255 (6.3) 364 (5.3) 443 (6.0) 510 (4.1) 595 (6.6)United States 409 (7.6) 494 (3.5) 545 (4.2) 592 (3.8) 653 (7.3)
( ) Standard errors appear in parentheses. Because results are rounded to the nearest whole number, some totals may appear inconsistent.
SOU
RCE:
IEA
Pro
gres
s in
Inte
rnat
iona
l Rea
ding
Lite
racy
Stu
dy (P
IRLS
) 200
6
Exhibit C.1 Percentiles of Achievement in Reading PIRLS 20064th Grade

329appendix c: percentiles and standard deviations of reading achievement
Exhibit C.2: Standard Deviations of Achievement in Reading
Countries
Overall Girls Boys
MeanStandard Deviation
MeanStandard Deviation
MeanStandard Deviation
Austria 538 (2.2) 64 (1.4) 543 (2.3) 62 (1.7) 533 (2.6) 65 (1.7) Belgium (Flemish) 547 (2.0) 56 (1.0) 550 (2.3) 54 (1.2) 544 (2.4) 57 (1.2) Belgium (French) 500 (2.6) 69 (1.3) 502 (2.8) 67 (1.5) 497 (2.9) 70 (1.6) Bulgaria 547 (4.4) 83 (2.4) 558 (4.4) 80 (2.7) 537 (5.0) 84 (3.1) Canada, Alberta 560 (2.4) 68 (1.2) 564 (2.4) 67 (1.6) 556 (2.7) 67 (1.3) Canada, British Columbia 558 (2.6) 69 (1.3) 562 (2.9) 68 (1.7) 554 (3.1) 70 (1.6) Canada, Nova Scotia 542 (2.2) 76 (1.5) 553 (2.5) 73 (2.0) 531 (2.8) 78 (1.9) Canada, Ontario 555 (2.7) 71 (1.3) 562 (3.3) 68 (1.4) 549 (3.3) 72 (2.1) Canada, Quebec 533 (2.8) 63 (1.1) 539 (2.7) 61 (1.6) 527 (3.5) 65 (1.6) Chinese Taipei 535 (2.0) 64 (1.0) 542 (2.2) 62 (1.3) 529 (2.3) 66 (1.3) Denmark 546 (2.3) 70 (1.2) 553 (2.8) 69 (1.9) 539 (2.7) 69 (1.7) England 539 (2.6) 87 (1.6) 549 (3.0) 87 (2.1) 530 (2.8) 86 (1.8) France 522 (2.1) 67 (1.0) 527 (2.4) 65 (1.3) 516 (2.4) 67 (1.2) Georgia 471 (3.1) 75 (1.5) 480 (3.3) 73 (1.6) 463 (3.8) 76 (1.9) Germany 548 (2.2) 67 (1.2) 551 (2.5) 66 (1.4) 544 (2.5) 68 (1.8) Hong Kong SAR 564 (2.4) 59 (1.2) 569 (2.5) 56 (1.4) 559 (2.8) 61 (1.4) Hungary 551 (3.0) 70 (1.8) 554 (3.6) 70 (2.3) 548 (2.9) 70 (1.9) Iceland 511 (1.3) 68 (1.0) 520 (1.7) 65 (1.5) 501 (1.9) 70 (1.3) Indonesia 405 (4.1) 79 (2.1) 415 (4.2) 76 (2.1) 395 (4.6) 80 (2.6) Iran, Islamic Rep. of 421 (3.1) 95 (1.8) 429 (5.3) 94 (2.8) 414 (3.8) 95 (2.5) Israel 512 (3.3) 99 (2.6) 520 (4.1) 96 (3.0) 506 (3.7) 101 (2.8) Italy 551 (2.9) 68 (1.4) 555 (3.3) 67 (1.7) 548 (3.3) 68 (2.0) Kuwait 330 (4.2) h (2.1) 364 (4.7) 101 (2.7) 297 (6.2) 109 (2.8) Latvia 541 (2.3) 63 (1.2) 553 (2.7) 60 (1.3) 530 (2.6) 63 (1.8) Lithuania 537 (1.6) 57 (1.1) 546 (2.0) 56 (1.3) 528 (2.0) 56 (1.4) Luxembourg 557 (1.1) 66 (0.7) 559 (1.3) 66 (0.9) 556 (1.6) 67 (1.0) Macedonia, Rep. of 442 (4.1) 101 (2.3) 453 (4.4) 101 (2.7) 432 (4.4) 100 (2.6) Moldova, Rep. of 500 (3.0) 69 (1.4) 507 (3.1) 67 (1.7) 493 (3.5) 70 (2.1) Morocco 323 (5.9) 109 (2.8) 332 (6.6) 106 (3.0) 314 (6.6) h (3.8) Netherlands 547 (1.5) 53 (0.9) 551 (2.0) 53 (1.2) 543 (1.6) 53 (1.3) New Zealand 532 (2.0) 87 (1.3) 544 (2.2) 81 (1.5) 520 (2.9) 90 (1.8) Norway 498 (2.6) 67 (1.4) 508 (2.8) 64 (1.7) 489 (3.1) 67 (1.8) Poland 519 (2.4) 75 (1.3) 528 (2.6) 74 (1.6) 511 (2.7) 76 (1.6) Qatar 353 (1.1) 96 (0.9) 372 (1.7) 90 (1.1) 335 (1.7) 97 (1.3) Romania 489 (5.0) 91 (3.0) 497 (5.0) 91 (3.5) 483 (5.7) 92 (3.4) Russian Federation 565 (3.4) 69 (2.0) 572 (3.9) 67 (2.1) 557 (3.4) 69 (2.3) Scotland 527 (2.8) 80 (1.6) 538 (3.6) 78 (1.8) 516 (3.1) 80 (2.2) Singapore 558 (2.9) 77 (1.6) 567 (3.1) 73 (1.7) 550 (3.3) 79 (1.9) Slovak Republic 531 (2.8) 74 (2.1) 537 (2.7) 73 (2.1) 525 (3.3) 75 (2.7) Slovenia 522 (2.1) 71 (0.9) 532 (2.1) 67 (1.3) 512 (2.7) 73 (1.2) South Africa 302 (5.6) 136 (3.6) 319 (6.3) 136 (4.3) 283 (5.5) 134 (3.6) Spain 513 (2.5) 71 (1.6) 515 (2.6) 71 (1.9) 511 (3.1) 71 (2.3) Sweden 549 (2.3) 64 (1.3) 559 (2.6) 62 (1.5) 541 (2.6) 64 (1.7) Trinidad and Tobago 436 (4.9) 103 (2.6) 451 (4.9) 98 (3.2) 420 (6.0) 106 (2.9) United States 540 (3.5) 74 (1.3) 545 (3.3) 71 (1.5) 535 (4.4) 77 (1.7)
( ) Standard errors appear in parentheses. Because results are rounded to the nearest whole number, some totals may appear inconsistent.
SOU
RCE:
IEA
Pro
gres
s in
Inte
rnat
iona
l Rea
ding
Lite
racy
Stu
dy (P
IRLS
) 200
6
Exhibit C.2 Standard Deviations of Achievement in Reading PIRLS 20064th Grade

330 appendix c: percentiles and standard deviations of reading achievement
Exhibit C.3: Percentiles of Achievement in Literary Reading
Countries 5th percentile 25th percentile 50th percentile 75th percentile 95th percentile
Austria 427 (4.1) 498 (3.4) 541 (2.9) 580 (2.8) 633 (3.5)Belgium (Flemish) 445 (4.0) 508 (2.2) 546 (1.9) 583 (3.6) 635 (3.6)Belgium (French) 383 (6.8) 455 (2.8) 503 (3.3) 546 (3.2) 606 (3.4)Bulgaria 391 (7.7) 492 (4.6) 548 (4.3) 599 (5.4) 670 (4.8)Canada, Alberta 439 (4.1) 516 (3.8) 564 (2.2) 609 (2.7) 674 (4.5)Canada, British Columbia 436 (3.0) 512 (3.7) 562 (3.1) 608 (3.9) 674 (4.3)Canada, Nova Scotia 406 (5.9) 495 (3.4) 547 (2.4) 596 (2.3) 662 (3.6)Canada, Ontario 428 (6.6) 508 (3.4) 557 (2.9) 605 (3.4) 675 (5.6)Canada, Quebec 420 (4.4) 488 (4.9) 533 (3.4) 574 (3.6) 628 (4.3)Chinese Taipei 409 (3.2) 488 (3.1) 534 (2.2) 577 (2.0) 638 (3.1)Denmark 422 (6.0) 507 (3.2) 554 (2.0) 594 (1.6) 649 (1.8)England 382 (5.5) 483 (2.3) 544 (3.7) 600 (2.6) 679 (5.4)France 402 (4.0) 474 (3.1) 519 (2.4) 562 (2.6) 620 (4.2)Georgia 347 (5.6) 426 (3.2) 479 (4.2) 530 (4.2) 595 (4.3)Germany 431 (5.4) 510 (1.6) 555 (3.0) 594 (3.5) 647 (3.4)Hong Kong SAR 446 (3.2) 517 (4.3) 560 (2.5) 601 (2.3) 657 (3.4)Hungary 435 (4.2) 513 (4.1) 560 (2.7) 604 (2.5) 665 (3.6)Iceland 397 (2.6) 474 (2.9) 519 (1.9) 560 (2.6) 615 (5.5)Indonesia 265 (10.3) 344 (3.6) 400 (4.4) 452 (4.5) 522 (4.7)Iran, Islamic Rep. of 262 (8.1) 360 (3.8) 432 (4.1) 496 (3.0) 574 (5.2)Israel 334 (13.5) 457 (6.5) 530 (2.8) 584 (3.6) 658 (4.6)Italy 425 (9.3) 504 (3.2) 554 (3.5) 603 (3.6) 669 (6.9)Kuwait 165 (7.5) 264 (5.3) 341 (3.3) 417 (3.1) 517 (5.5)Latvia 430 (8.2) 499 (3.5) 543 (1.8) 582 (2.7) 638 (3.2)Lithuania 441 (4.1) 504 (2.1) 543 (2.7) 582 (3.3) 635 (3.8)Luxembourg 437 (3.3) 512 (2.4) 557 (1.3) 601 (1.7) 663 (3.2)Macedonia, Rep. of 275 (8.6) 368 (4.7) 443 (3.8) 511 (5.4) 590 (3.4)Moldova, Rep. of 371 (6.1) 449 (3.9) 497 (2.8) 538 (3.9) 599 (6.4)Morocco 128 (10.8) 234 (5.6) 316 (6.8) 402 (8.4) 507 (7.1)Netherlands 448 (3.5) 508 (2.0) 547 (2.6) 583 (2.9) 635 (3.4)New Zealand 373 (3.5) 473 (2.8) 534 (3.0) 588 (3.1) 658 (2.3)Norway 382 (4.3) 460 (4.2) 506 (3.7) 547 (3.5) 602 (2.5)Poland 387 (4.7) 472 (4.3) 529 (3.4) 577 (2.3) 645 (4.3)Qatar 201 (5.7) 290 (2.2) 358 (2.0) 429 (2.4) 514 (3.5)Romania 323 (10.4) 440 (7.2) 501 (5.4) 557 (3.9) 627 (3.3)Russian Federation 440 (6.3) 517 (3.7) 565 (4.0) 608 (2.7) 670 (5.9)Scotland 381 (5.1) 478 (4.0) 532 (3.7) 582 (2.5) 651 (5.2)Singapore 408 (5.8) 502 (5.1) 557 (3.5) 608 (3.0) 673 (4.7)Slovak Republic 398 (5.9) 491 (5.3) 541 (3.3) 584 (2.8) 642 (2.4)Slovenia 396 (2.7) 476 (3.9) 525 (2.2) 567 (3.4) 625 (2.5)South Africa 107 (3.7) 203 (4.0) 280 (4.5) 381 (8.5) 555 (10.9)Spain 385 (4.0) 470 (3.7) 520 (2.1) 569 (3.0) 632 (4.8)Sweden 437 (4.4) 508 (4.1) 550 (3.2) 588 (2.3) 640 (3.7)Trinidad and Tobago 257 (9.6) 362 (9.2) 440 (4.4) 510 (5.2) 593 (4.4)United States 403 (6.6) 492 (5.3) 546 (3.3) 595 (3.2) 660 (5.4)
( ) Standard errors appear in parentheses. Because results are rounded to the nearest whole number, some totals may appear inconsistent.
SOU
RCE:
IEA
Pro
gres
s in
Inte
rnat
iona
l Rea
ding
Lite
racy
Stu
dy (P
IRLS
) 200
6
Exhibit C.3 Percentiles of Achievement in Literary Reading PIRLS 20064th Grade

331appendix c: percentiles and standard deviations of reading achievement
Exhibit C.4: Standard Deviations of Achievement in Literary Reading
Countries
Overall Girls Boys
MeanStandard Deviation
MeanStandard Deviation
MeanStandard Deviation
Austria 537 (2.1) 62 (1.1) 543 (2.6) 60 (1.3) 531 (2.4) 64 (1.4) Belgium (Flemish) 544 (1.9) 58 (1.3) 547 (2.2) 56 (1.8) 541 (2.3) 59 (1.4) Belgium (French) 499 (2.4) 67 (1.2) 504 (2.6) 66 (1.4) 495 (2.8) 68 (1.5) Bulgaria 542 (4.5) 84 (3.0) 553 (4.6) 80 (2.8) 532 (5.4) 86 (4.1) Canada, Alberta 561 (2.7) 71 (1.8) 567 (2.9) 70 (2.3) 556 (3.0) 71 (1.7) Canada, British Columbia 559 (2.7) 72 (1.4) 565 (3.0) 70 (1.7) 553 (3.2) 72 (1.7) Canada, Nova Scotia 543 (2.4) 77 (1.4) 552 (3.4) 74 (1.7) 534 (2.6) 79 (1.9) Canada, Ontario 555 (3.0) 74 (1.2) 562 (3.5) 72 (1.8) 549 (3.3) 76 (2.0) Canada, Quebec 529 (2.8) 64 (1.4) 536 (3.1) 61 (2.2) 523 (3.4) 66 (1.6) Chinese Taipei 530 (2.0) 69 (1.3) 538 (2.2) 67 (1.7) 523 (2.2) 71 (1.4) Denmark 547 (2.6) 68 (1.7) 554 (3.0) 68 (2.2) 541 (3.1) 68 (1.8) England 539 (2.6) 89 (1.6) 550 (3.1) 89 (1.8) 528 (2.7) 88 (2.4) France 516 (2.4) 66 (1.1) 523 (2.6) 64 (1.3) 510 (2.7) 67 (1.3) Georgia 476 (3.2) 75 (1.6) 484 (3.7) 74 (1.4) 470 (3.6) 76 (2.4) Germany 549 (2.2) 66 (1.1) 554 (2.4) 65 (1.5) 544 (2.6) 67 (1.7) Hong Kong SAR 557 (2.6) 64 (1.3) 564 (2.6) 61 (1.4) 551 (3.3) 66 (1.6) Hungary 557 (2.9) 70 (1.9) 560 (3.6) 70 (2.4) 553 (2.9) 70 (2.1) Iceland 514 (1.7) 66 (1.0) 525 (2.4) 63 (1.4) 504 (1.9) 67 (1.3) Indonesia 397 (3.9) 78 (1.8) 408 (4.0) 76 (2.1) 387 (4.4) 79 (2.3) Iran, Islamic Rep. of 426 (3.1) 96 (2.0) 432 (5.3) 97 (2.6) 421 (4.0) 96 (2.7) Israel 516 (3.4) 98 (2.3) 524 (4.0) 96 (2.6) 509 (3.8) 99 (2.7) Italy 551 (3.3) 74 (1.7) 556 (3.6) 72 (1.8) 548 (3.6) 75 (2.4) Kuwait 340 (3.7) 108 (2.4) 372 (4.5) 102 (2.2) 310 (5.2) 105 (2.8) Latvia 539 (2.4) 63 (1.3) 550 (3.0) 61 (1.4) 529 (2.7) 64 (2.0) Lithuania 542 (1.9) 58 (1.0) 550 (2.4) 58 (1.3) 533 (2.0) 58 (1.2) Luxembourg 555 (1.0) 68 (0.8) 557 (1.4) 68 (1.0) 552 (1.4) 69 (1.0) Macedonia, Rep. of 439 (3.7) 97 (2.1) 449 (4.3) 96 (2.3) 429 (4.0) 97 (2.6) Moldova, Rep. of 492 (2.8) 68 (1.5) 499 (3.3) 67 (1.8) 486 (3.0) 69 (1.8) Morocco 317 (6.5) 116 (2.6) 326 (6.9) 113 (3.0) 310 (7.4) 119 (3.4) Netherlands 545 (1.8) 57 (1.3) 548 (2.2) 57 (1.6) 541 (2.3) 56 (1.6) New Zealand 527 (2.1) 86 (1.3) 539 (2.3) 81 (2.0) 516 (2.9) 90 (1.5) Norway 501 (2.5) 67 (1.4) 512 (2.8) 64 (1.7) 491 (2.7) 67 (1.9) Poland 523 (2.5) 78 (1.5) 532 (2.8) 77 (1.9) 514 (3.0) 77 (1.8) Qatar 358 (1.3) 96 (1.5) 376 (1.8) 92 (1.5) 341 (2.3) 97 (1.8) Romania 493 (4.8) 91 (3.3) 501 (4.9) 90 (3.7) 485 (5.6) 91 (3.6) Russian Federation 561 (3.3) 69 (2.0) 568 (3.8) 68 (2.1) 554 (3.3) 70 (2.3) Scotland 527 (2.6) 81 (1.7) 538 (3.4) 79 (2.1) 515 (3.0) 82 (2.1) Singapore 552 (2.9) 80 (2.0) 560 (3.2) 77 (1.9) 544 (3.4) 82 (2.4) Slovak Republic 533 (2.9) 74 (2.7) 539 (2.9) 73 (2.4) 527 (3.5) 75 (3.3) Slovenia 519 (2.0) 69 (1.2) 529 (2.3) 66 (1.6) 511 (2.6) 71 (1.4) South Africa 299 (5.2) 135 (3.5) 318 (6.0) 134 (3.9) 281 (5.3) 132 (3.8) Spain 516 (2.7) 75 (1.5) 520 (3.1) 75 (2.2) 513 (3.1) 75 (1.9) Sweden 546 (2.3) 61 (1.1) 557 (2.7) 60 (1.6) 536 (2.6) 61 (1.4) Trinidad and Tobago 434 (4.6) 104 (2.7) 450 (4.9) 98 (3.0) 419 (5.6) 107 (3.0) United States 541 (3.6) 78 (1.5) 547 (3.6) 75 (1.9) 534 (4.1) 80 (2.0)
( ) Standard errors appear in parentheses. Because results are rounded to the nearest whole number, some totals may appear inconsistent.
SOU
RCE:
IEA
Pro
gres
s in
Inte
rnat
iona
l Rea
ding
Lite
racy
Stu
dy (P
IRLS
) 200
6
Exhibit C.4 Standard Deviations of Achievement in Literary Reading PIRLS 20064th Grade

332 appendix c: percentiles and standard deviations of reading achievement
Exhibit C.5: Percentiles of Achievement in Informational Reading
Countries 5th percentile 25th percentile 50th percentile 75th percentile 95th percentile
Austria 424 (6.7) 495 (2.5) 540 (2.4) 581 (2.0) 637 (3.0)Belgium (Flemish) 456 (5.3) 512 (2.7) 549 (2.8) 584 (2.6) 631 (1.9)Belgium (French) 383 (4.5) 453 (4.2) 500 (3.1) 545 (2.7) 606 (4.4)Bulgaria 403 (10.9) 500 (5.5) 555 (4.5) 605 (3.3) 678 (3.5)Canada, Alberta 445 (5.4) 513 (3.6) 557 (3.5) 600 (3.6) 662 (2.6)Canada, British Columbia 437 (6.0) 510 (3.7) 555 (3.3) 600 (2.5) 662 (4.7)Canada, Nova Scotia 406 (9.2) 493 (2.7) 544 (2.6) 590 (2.1) 653 (3.9)Canada, Ontario 440 (6.3) 509 (3.6) 554 (3.6) 597 (3.6) 659 (4.2)Canada, Quebec 423 (3.9) 493 (2.4) 536 (3.4) 578 (3.7) 633 (5.4)Chinese Taipei 435 (5.7) 502 (2.2) 542 (1.9) 578 (2.1) 628 (2.2)Denmark 412 (5.7) 498 (3.2) 548 (3.8) 592 (2.3) 649 (3.1)England 387 (5.3) 485 (3.9) 543 (3.5) 595 (2.7) 666 (3.2)France 413 (3.7) 482 (3.7) 528 (1.8) 573 (2.9) 631 (3.0)Georgia 333 (4.5) 415 (3.5) 469 (3.5) 520 (4.1) 586 (6.3)Germany 428 (4.0) 505 (2.1) 550 (2.6) 590 (2.5) 643 (2.3)Hong Kong SAR 471 (4.6) 533 (3.4) 572 (2.1) 607 (2.3) 654 (2.2)Hungary 419 (4.2) 497 (4.8) 545 (3.3) 589 (3.3) 649 (3.7)Iceland 380 (3.3) 459 (1.9) 509 (1.8) 555 (1.7) 616 (2.2)Indonesia 275 (5.2) 363 (4.5) 422 (6.0) 476 (4.2) 545 (5.4)Iran, Islamic Rep. of 269 (4.0) 357 (4.2) 422 (3.6) 485 (4.3) 564 (5.1)Israel 321 (5.3) 450 (4.9) 521 (3.3) 576 (2.2) 649 (3.8)Italy 439 (3.6) 508 (2.6) 552 (3.1) 593 (3.6) 651 (6.7)Kuwait 131 (6.8) 243 (5.2) 326 (5.0) 412 (6.3) 518 (6.9)Latvia 435 (6.5) 499 (2.4) 542 (2.5) 583 (3.5) 640 (3.4)Lithuania 437 (2.6) 495 (2.5) 532 (2.1) 568 (2.5) 616 (2.0)Luxembourg 448 (3.8) 514 (3.2) 559 (1.7) 601 (1.4) 658 (3.3)Macedonia, Rep. of 276 (5.9) 378 (4.1) 455 (5.2) 526 (4.6) 609 (5.7)Moldova, Rep. of 386 (5.2) 463 (4.7) 512 (4.6) 557 (2.4) 617 (5.8)Morocco 164 (9.3) 262 (4.6) 334 (6.4) 409 (7.8) 505 (14.4)Netherlands 463 (3.7) 515 (2.9) 549 (2.4) 582 (1.9) 627 (5.1)New Zealand 384 (4.0) 481 (1.8) 540 (2.8) 592 (2.5) 661 (1.8)Norway 375 (4.9) 450 (4.9) 499 (3.1) 542 (3.8) 599 (4.4)Poland 391 (4.8) 468 (4.9) 519 (3.0) 566 (2.5) 627 (4.2)Qatar 202 (3.9) 289 (2.6) 356 (2.4) 424 (2.2) 508 (2.4)Romania 323 (13.7) 435 (7.0) 497 (6.4) 548 (3.7) 616 (5.6)Russian Federation 448 (6.1) 522 (4.1) 568 (3.1) 609 (2.6) 667 (4.2)Scotland 393 (6.0) 478 (2.9) 531 (2.8) 580 (2.9) 649 (3.6)Singapore 437 (6.2) 520 (3.5) 569 (3.1) 613 (3.8) 668 (3.1)Slovak Republic 394 (7.8) 483 (2.8) 533 (2.7) 577 (2.4) 635 (2.0)Slovenia 399 (5.7) 477 (3.3) 528 (1.8) 572 (2.7) 632 (2.2)South Africa 126 (5.2) 220 (3.8) 298 (4.3) 395 (8.5) 568 (10.0)Spain 390 (5.7) 466 (3.7) 512 (2.7) 554 (2.4) 614 (4.0)Sweden 431 (4.1) 508 (2.6) 553 (2.5) 594 (2.6) 652 (4.2)Trinidad and Tobago 270 (4.7) 372 (8.0) 445 (7.3) 511 (6.4) 596 (5.2)United States 414 (7.0) 493 (5.4) 541 (3.3) 586 (4.1) 644 (4.8)
( ) Standard errors appear in parentheses. Because results are rounded to the nearest whole number, some totals may appear inconsistent.
SOU
RCE:
IEA
Pro
gres
s in
Inte
rnat
iona
l Rea
ding
Lite
racy
Stu
dy (P
IRLS
) 200
6
Exhibit C.5 Percentiles of Achievement in Informational Reading PIRLS 20064th Grade

333appendix c: percentiles and standard deviations of reading achievement
Exhibit C.6: Standard Deviations of Achievement in Informational Reading
Countries
Overall Girls Boys
MeanStandard Deviation
MeanStandard Deviation
MeanStandard Deviation
Austria 536 (2.3) 65 (1.2) 540 (2.7) 63 (1.2) 533 (2.6) 66 (1.6) Belgium (Flemish) 547 (2.0) 53 (0.9) 550 (2.4) 52 (1.1) 545 (2.2) 54 (1.5) Belgium (French) 498 (2.8) 68 (1.4) 499 (3.3) 67 (1.7) 497 (3.0) 69 (1.6) Bulgaria 550 (4.4) 83 (2.3) 558 (4.4) 81 (3.0) 542 (5.2) 84 (2.6) Canada, Alberta 556 (2.4) 66 (1.3) 559 (2.5) 65 (1.3) 553 (2.8) 66 (1.6) Canada, British Columbia 554 (2.7) 68 (1.3) 556 (3.3) 67 (1.6) 551 (2.8) 69 (1.6) Canada, Nova Scotia 539 (2.4) 75 (1.6) 549 (2.8) 71 (1.7) 529 (3.0) 77 (2.2) Canada, Ontario 552 (3.0) 67 (1.5) 558 (3.3) 65 (1.6) 547 (3.9) 67 (2.1) Canada, Quebec 533 (2.7) 64 (1.0) 539 (2.7) 61 (1.5) 528 (3.6) 66 (1.5) Chinese Taipei 538 (1.8) 59 (1.0) 543 (1.8) 56 (1.4) 534 (2.3) 60 (1.3) Denmark 542 (2.4) 72 (1.4) 547 (2.8) 71 (2.0) 536 (3.1) 72 (1.8) England 537 (2.5) 84 (1.9) 545 (2.8) 84 (2.1) 529 (2.9) 84 (2.3) France 526 (2.1) 67 (1.0) 531 (2.7) 66 (1.3) 521 (2.3) 67 (1.2) Georgia 465 (3.6) 77 (1.7) 474 (3.7) 75 (2.1) 457 (4.4) 78 (2.4) Germany 544 (2.3) 66 (1.1) 547 (2.4) 65 (1.3) 542 (2.7) 67 (1.8) Hong Kong SAR 568 (2.3) 56 (1.3) 572 (2.2) 54 (1.4) 564 (2.8) 58 (1.6) Hungary 541 (3.1) 70 (2.2) 543 (3.7) 69 (2.7) 539 (3.1) 71 (2.5) Iceland 505 (1.4) 71 (1.1) 514 (1.9) 69 (1.6) 497 (2.1) 73 (1.8) Indonesia 418 (4.2) 82 (2.0) 427 (4.6) 80 (2.7) 409 (5.0) 83 (2.1) Iran, Islamic Rep. of 420 (3.1) 91 (1.7) 429 (4.9) 89 (2.2) 412 (3.8) 91 (2.5) Israel 507 (3.6) 99 (2.5) 513 (4.5) 97 (2.8) 502 (4.1) 100 (2.8) Italy 549 (2.9) 64 (1.6) 551 (3.1) 63 (2.0) 547 (3.4) 65 (1.9) Kuwait 327 (4.3) 118 (2.1) 361 (6.3) 109 (2.0) 292 (6.0) 116 (2.6) Latvia 540 (2.4) 63 (1.3) 553 (2.7) 60 (1.2) 527 (2.7) 62 (1.7) Lithuania 530 (1.6) 54 (0.9) 539 (2.2) 54 (1.3) 521 (2.0) 54 (0.9) Luxembourg 557 (1.0) 64 (1.0) 557 (1.2) 64 (1.2) 556 (1.5) 64 (1.1) Macedonia, Rep. of 450 (4.2) 103 (2.4) 460 (4.6) 103 (3.1) 440 (4.4) 101 (2.6) Moldova, Rep. of 508 (3.0) 70 (1.5) 514 (3.2) 69 (1.7) 502 (3.5) 71 (1.8) Morocco 335 (6.0) 105 (3.2) 344 (6.1) 101 (2.9) 326 (6.9) 107 (4.3) Netherlands 548 (1.6) 50 (0.9) 552 (1.8) 49 (1.0) 543 (1.9) 50 (1.3) New Zealand 534 (2.2) 84 (1.2) 545 (2.3) 79 (1.6) 522 (3.0) 87 (1.5) Norway 494 (2.8) 68 (1.6) 502 (3.4) 66 (1.7) 486 (2.8) 70 (2.2) Poland 515 (2.2) 72 (1.6) 523 (2.3) 72 (2.0) 507 (2.8) 72 (1.8) Qatar 356 (1.6) 94 (0.9) 374 (2.3) 90 (1.1) 339 (2.3) 94 (1.3) Romania 487 (4.9) 88 (2.7) 494 (5.2) 87 (3.3) 481 (5.4) 89 (2.8) Russian Federation 564 (3.3) 66 (2.2) 572 (3.5) 65 (2.0) 555 (3.6) 66 (2.6) Scotland 527 (2.6) 78 (1.7) 537 (3.6) 76 (2.1) 517 (2.8) 78 (2.2) Singapore 563 (2.8) 70 (1.6) 572 (2.9) 66 (1.5) 555 (3.3) 73 (2.0) Slovak Republic 527 (2.6) 73 (1.8) 532 (2.5) 71 (1.8) 522 (3.3) 74 (2.4) Slovenia 523 (2.4) 71 (1.2) 533 (2.4) 68 (1.7) 514 (3.2) 72 (1.3) South Africa 316 (5.1) 132 (3.3) 332 (5.8) 132 (3.9) 299 (5.4) 130 (3.4) Spain 508 (2.9) 68 (1.8) 508 (3.2) 68 (2.3) 508 (3.2) 67 (1.9) Sweden 549 (2.4) 67 (1.2) 557 (2.9) 65 (1.5) 541 (2.6) 68 (1.7) Trinidad and Tobago 440 (4.6) 99 (2.2) 455 (5.0) 95 (2.6) 426 (5.5) 101 (2.5) United States 537 (3.4) 70 (1.3) 542 (3.1) 68 (1.7) 532 (4.4) 72 (1.8)
( ) Standard errors appear in parentheses. Because results are rounded to the nearest whole number, some totals may appear inconsistent.
SOU
RCE:
IEA
Pro
gres
s in
Inte
rnat
iona
l Rea
ding
Lite
racy
Stu
dy (P
IRLS
) 200
6
Exhibit C.6 Standard Deviations of Achievement in Informational Reading PIRLS 20064th Grade

334 appendix c: percentiles and standard deviations of reading achievement
Exhibit C.7:
Countries 5th percentile 25th percentile 50th percentile 75th percentile 95th percentile
Austria 428 (3.7) 502 (1.8) 548 (2.0) 589 (1.5) 647 (2.7)Belgium (Flemish) 444 (3.4) 507 (2.2) 547 (1.9) 585 (2.4) 638 (3.1)Belgium (French) 380 (4.7) 454 (3.5) 504 (3.0) 550 (2.4) 613 (4.9)Bulgaria 395 (11.0) 492 (5.0) 542 (4.7) 592 (3.8) 658 (4.6)Canada, Alberta 432 (3.5) 505 (2.2) 554 (3.5) 602 (3.7) 669 (3.3)Canada, British Columbia 429 (4.4) 504 (3.4) 553 (2.8) 599 (2.6) 664 (4.9)Canada, Nova Scotia 400 (5.3) 486 (3.1) 537 (3.5) 585 (3.8) 650 (4.8)Canada, Ontario 418 (6.4) 496 (2.8) 544 (3.9) 593 (3.0) 661 (2.6)Canada, Quebec 420 (2.9) 491 (3.8) 535 (2.9) 577 (2.5) 636 (4.3)Chinese Taipei 420 (5.7) 500 (2.1) 545 (1.9) 587 (1.9) 645 (3.3)Denmark 409 (6.8) 504 (3.6) 557 (3.6) 605 (3.0) 669 (4.0)England 373 (6.3) 476 (3.5) 538 (3.7) 595 (4.2) 676 (4.8)France 407 (4.7) 479 (2.8) 526 (2.0) 570 (2.5) 628 (3.0)Georgia 353 (5.0) 429 (3.9) 482 (3.9) 530 (3.1) 594 (5.6)Germany 429 (6.5) 511 (4.6) 559 (2.3) 604 (2.9) 664 (1.9)Hong Kong SAR 455 (3.7) 521 (3.1) 561 (2.6) 598 (1.6) 649 (3.2)Hungary 423 (5.3) 500 (3.7) 548 (2.2) 591 (3.2) 650 (2.8)Iceland 388 (5.0) 470 (2.3) 520 (1.6) 566 (1.5) 629 (4.5)Indonesia 278 (8.7) 358 (4.4) 412 (4.5) 464 (3.8) 532 (2.7)Iran, Islamic Rep. of 265 (5.6) 363 (4.5) 433 (3.1) 497 (3.1) 578 (4.3)Israel 329 (6.0) 450 (5.7) 521 (2.9) 574 (4.5) 642 (3.6)Italy 425 (6.6) 498 (3.9) 546 (3.6) 592 (3.6) 655 (4.4)Kuwait 164 (6.8) 259 (4.1) 336 (7.0) 416 (5.9) 510 (3.8)Latvia 427 (4.2) 491 (2.8) 535 (4.2) 579 (1.8) 638 (3.7)Lithuania 427 (3.4) 492 (2.3) 534 (2.5) 572 (2.5) 626 (4.5)Luxembourg 440 (2.9) 518 (2.4) 567 (2.0) 615 (2.1) 681 (2.9)Macedonia, Rep. of 280 (7.3) 376 (5.7) 452 (5.3) 519 (3.9) 598 (5.8)Moldova, Rep. of 365 (4.0) 442 (4.6) 491 (3.3) 533 (2.5) 593 (5.0)Morocco 166 (9.9) 262 (7.5) 335 (5.1) 410 (8.0) 507 (6.0)Netherlands 448 (3.8) 511 (2.2) 553 (2.3) 592 (2.4) 649 (3.0)New Zealand 370 (4.4) 470 (1.7) 530 (2.1) 584 (3.1) 656 (3.4)Norway 375 (4.0) 457 (3.1) 506 (2.8) 552 (3.1) 613 (3.9)Poland 383 (6.1) 466 (3.1) 521 (3.8) 569 (1.9) 632 (3.9)Qatar 208 (2.1) 293 (2.1) 360 (1.7) 429 (3.7) 516 (2.6)Romania 322 (13.4) 437 (6.4) 498 (5.8) 551 (5.3) 619 (3.8)Russian Federation 439 (6.7) 518 (3.7) 566 (4.0) 610 (3.4) 672 (5.8)Scotland 377 (8.9) 475 (5.6) 529 (2.7) 579 (2.7) 651 (6.0)Singapore 408 (4.7) 508 (4.1) 566 (4.2) 619 (3.1) 687 (3.3)Slovak Republic 390 (8.6) 485 (3.4) 536 (2.7) 580 (2.4) 639 (2.8)Slovenia 391 (4.9) 473 (3.0) 524 (2.5) 569 (2.2) 629 (4.0)South Africa 121 (3.8) 212 (4.1) 287 (4.9) 385 (8.4) 559 (14.6)Spain 389 (7.9) 464 (3.5) 512 (1.2) 556 (3.3) 615 (4.0)Sweden 430 (5.7) 508 (3.9) 554 (2.4) 597 (2.6) 657 (5.7)Trinidad and Tobago 262 (14.4) 367 (8.4) 444 (7.0) 512 (5.5) 600 (7.4)United States 395 (4.4) 483 (3.6) 537 (4.6) 587 (3.7) 652 (4.3)
( ) Standard errors appear in parentheses. Because results are rounded to the nearest whole number, some totals may appear inconsistent.
SOU
RCE:
IEA
Pro
gres
s in
Inte
rnat
iona
l Rea
ding
Lite
racy
Stu
dy (P
IRLS
) 200
6
Exhibit C.7 Percentiles of Achievement in Reading for Retrieval and Straightforward Inferencing PIRLS 20064th Grade
335appendix c: percentiles and standard deviations of reading achievement
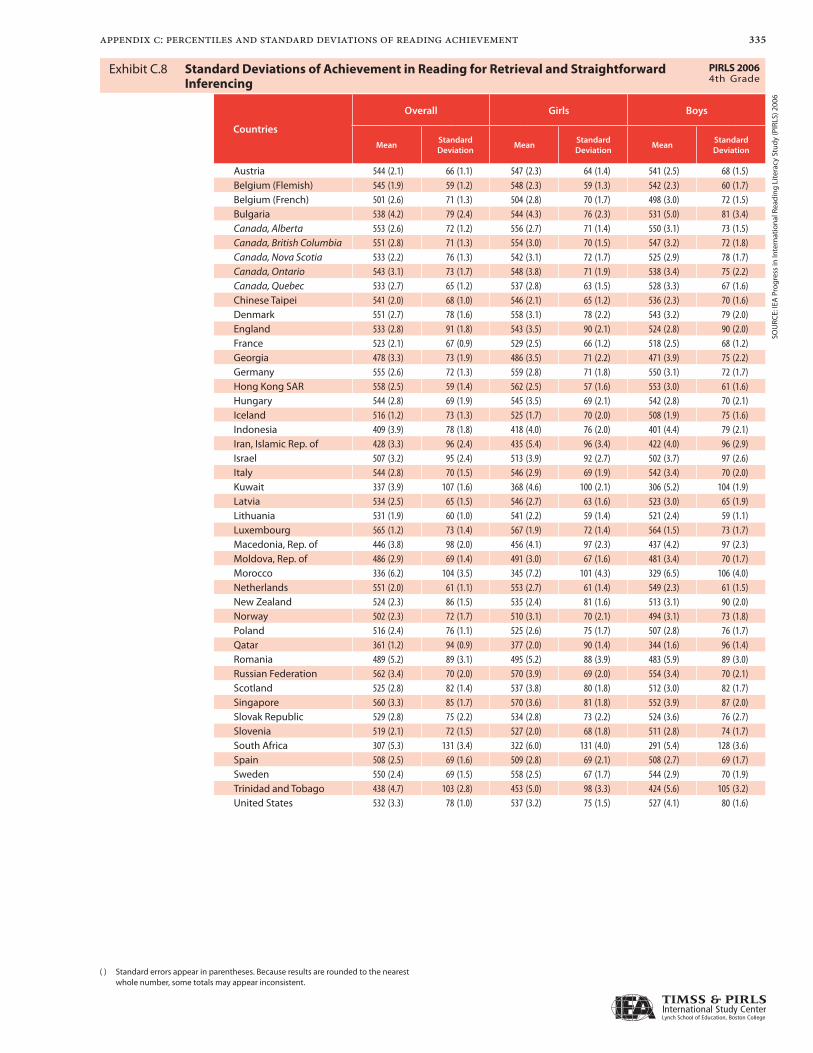
Exhibit C.8: Standard Deviations of Achievement in Reading for Retrieval and Straightforward Inferencing
Countries
Overall Girls Boys
MeanStandard Deviation
MeanStandard Deviation
MeanStandard Deviation
Austria 544 (2.1) 66 (1.1) 547 (2.3) 64 (1.4) 541 (2.5) 68 (1.5) Belgium (Flemish) 545 (1.9) 59 (1.2) 548 (2.3) 59 (1.3) 542 (2.3) 60 (1.7) Belgium (French) 501 (2.6) 71 (1.3) 504 (2.8) 70 (1.7) 498 (3.0) 72 (1.5) Bulgaria 538 (4.2) 79 (2.4) 544 (4.3) 76 (2.3) 531 (5.0) 81 (3.4) Canada, Alberta 553 (2.6) 72 (1.2) 556 (2.7) 71 (1.4) 550 (3.1) 73 (1.5) Canada, British Columbia 551 (2.8) 71 (1.3) 554 (3.0) 70 (1.5) 547 (3.2) 72 (1.8) Canada, Nova Scotia 533 (2.2) 76 (1.3) 542 (3.1) 72 (1.7) 525 (2.9) 78 (1.7) Canada, Ontario 543 (3.1) 73 (1.7) 548 (3.8) 71 (1.9) 538 (3.4) 75 (2.2) Canada, Quebec 533 (2.7) 65 (1.2) 537 (2.8) 63 (1.5) 528 (3.3) 67 (1.6) Chinese Taipei 541 (2.0) 68 (1.0) 546 (2.1) 65 (1.2) 536 (2.3) 70 (1.6) Denmark 551 (2.7) 78 (1.6) 558 (3.1) 78 (2.2) 543 (3.2) 79 (2.0) England 533 (2.8) 91 (1.8) 543 (3.5) 90 (2.1) 524 (2.8) 90 (2.0) France 523 (2.1) 67 (0.9) 529 (2.5) 66 (1.2) 518 (2.5) 68 (1.2) Georgia 478 (3.3) 73 (1.9) 486 (3.5) 71 (2.2) 471 (3.9) 75 (2.2) Germany 555 (2.6) 72 (1.3) 559 (2.8) 71 (1.8) 550 (3.1) 72 (1.7) Hong Kong SAR 558 (2.5) 59 (1.4) 562 (2.5) 57 (1.6) 553 (3.0) 61 (1.6) Hungary 544 (2.8) 69 (1.9) 545 (3.5) 69 (2.1) 542 (2.8) 70 (2.1) Iceland 516 (1.2) 73 (1.3) 525 (1.7) 70 (2.0) 508 (1.9) 75 (1.6) Indonesia 409 (3.9) 78 (1.8) 418 (4.0) 76 (2.0) 401 (4.4) 79 (2.1) Iran, Islamic Rep. of 428 (3.3) 96 (2.4) 435 (5.4) 96 (3.4) 422 (4.0) 96 (2.9) Israel 507 (3.2) 95 (2.4) 513 (3.9) 92 (2.7) 502 (3.7) 97 (2.6) Italy 544 (2.8) 70 (1.5) 546 (2.9) 69 (1.9) 542 (3.4) 70 (2.0) Kuwait 337 (3.9) 107 (1.6) 368 (4.6) 100 (2.1) 306 (5.2) 104 (1.9) Latvia 534 (2.5) 65 (1.5) 546 (2.7) 63 (1.6) 523 (3.0) 65 (1.9) Lithuania 531 (1.9) 60 (1.0) 541 (2.2) 59 (1.4) 521 (2.4) 59 (1.1) Luxembourg 565 (1.2) 73 (1.4) 567 (1.9) 72 (1.4) 564 (1.5) 73 (1.7) Macedonia, Rep. of 446 (3.8) 98 (2.0) 456 (4.1) 97 (2.3) 437 (4.2) 97 (2.3) Moldova, Rep. of 486 (2.9) 69 (1.4) 491 (3.0) 67 (1.6) 481 (3.4) 70 (1.7) Morocco 336 (6.2) 104 (3.5) 345 (7.2) 101 (4.3) 329 (6.5) 106 (4.0) Netherlands 551 (2.0) 61 (1.1) 553 (2.7) 61 (1.4) 549 (2.3) 61 (1.5) New Zealand 524 (2.3) 86 (1.5) 535 (2.4) 81 (1.6) 513 (3.1) 90 (2.0) Norway 502 (2.3) 72 (1.7) 510 (3.1) 70 (2.1) 494 (3.1) 73 (1.8) Poland 516 (2.4) 76 (1.1) 525 (2.6) 75 (1.7) 507 (2.8) 76 (1.7) Qatar 361 (1.2) 94 (0.9) 377 (2.0) 90 (1.4) 344 (1.6) 96 (1.4) Romania 489 (5.2) 89 (3.1) 495 (5.2) 88 (3.9) 483 (5.9) 89 (3.0) Russian Federation 562 (3.4) 70 (2.0) 570 (3.9) 69 (2.0) 554 (3.4) 70 (2.1) Scotland 525 (2.8) 82 (1.4) 537 (3.8) 80 (1.8) 512 (3.0) 82 (1.7) Singapore 560 (3.3) 85 (1.7) 570 (3.6) 81 (1.8) 552 (3.9) 87 (2.0) Slovak Republic 529 (2.8) 75 (2.2) 534 (2.8) 73 (2.2) 524 (3.6) 76 (2.7) Slovenia 519 (2.1) 72 (1.5) 527 (2.0) 68 (1.8) 511 (2.8) 74 (1.7) South Africa 307 (5.3) 131 (3.4) 322 (6.0) 131 (4.0) 291 (5.4) 128 (3.6) Spain 508 (2.5) 69 (1.6) 509 (2.8) 69 (2.1) 508 (2.7) 69 (1.7) Sweden 550 (2.4) 69 (1.5) 558 (2.5) 67 (1.7) 544 (2.9) 70 (1.9) Trinidad and Tobago 438 (4.7) 103 (2.8) 453 (5.0) 98 (3.3) 424 (5.6) 105 (3.2) United States 532 (3.3) 78 (1.0) 537 (3.2) 75 (1.5) 527 (4.1) 80 (1.6)
( ) Standard errors appear in parentheses. Because results are rounded to the nearest whole number, some totals may appear inconsistent.
SOU
RCE:
IEA
Pro
gres
s in
Inte
rnat
iona
l Rea
ding
Lite
racy
Stu
dy (P
IRLS
) 200
6
Exhibit C.8 Standard Deviations of Achievement in Reading for Retrieval and Straightforward Inferencing
PIRLS 20064th Grade

336 appendix c: percentiles and standard deviations of reading achievement
Exhibit C.9: Percentiles of Achievement in Reading for Interpreting, Integrating,
Countries 5th percentile 25th percentile 50th percentile 75th percentile 95th percentile
Austria 417 (3.3) 490 (2.9) 534 (2.3) 575 (2.3) 628 (3.3)Belgium (Flemish) 458 (2.1) 512 (2.6) 548 (1.4) 583 (2.0) 632 (2.1)Belgium (French) 383 (4.6) 452 (2.7) 499 (2.8) 544 (2.4) 604 (3.6)Bulgaria 397 (12.0) 504 (7.5) 559 (3.6) 610 (5.0) 679 (6.9)Canada, Alberta 454 (3.0) 523 (3.2) 566 (2.7) 608 (4.0) 665 (4.1)Canada, British Columbia 448 (3.0) 520 (3.3) 564 (3.7) 607 (3.4) 666 (4.8)Canada, Nova Scotia 421 (6.9) 504 (2.0) 552 (1.7) 598 (2.7) 657 (2.3)Canada, Ontario 450 (5.1) 522 (2.7) 565 (3.8) 607 (3.8) 664 (3.6)Canada, Quebec 421 (5.3) 492 (3.0) 534 (3.5) 574 (3.2) 627 (3.7)Chinese Taipei 421 (5.0) 491 (1.9) 533 (1.8) 572 (1.5) 626 (2.6)Denmark 428 (6.2) 505 (2.7) 548 (2.6) 586 (2.0) 635 (2.5)England 399 (8.8) 492 (2.4) 548 (2.4) 598 (2.9) 670 (4.7)France 404 (3.7) 475 (2.5) 521 (2.4) 564 (2.5) 621 (3.3)Georgia 324 (7.7) 408 (2.7) 466 (3.5) 519 (4.2) 587 (4.2)Germany 427 (3.8) 503 (2.3) 545 (2.7) 584 (2.7) 636 (2.9)Hong Kong SAR 463 (5.8) 529 (2.7) 569 (4.1) 607 (3.2) 656 (4.0)Hungary 436 (5.3) 512 (3.6) 558 (4.0) 600 (2.8) 658 (6.4)Iceland 386 (3.4) 462 (1.5) 508 (1.4) 548 (2.0) 603 (3.8)Indonesia 268 (7.7) 350 (6.2) 407 (5.3) 460 (4.0) 531 (3.8)Iran, Islamic Rep. of 260 (8.2) 355 (3.0) 422 (5.5) 484 (3.4) 562 (3.1)Israel 331 (13.7) 461 (6.9) 531 (3.5) 584 (2.7) 654 (4.5)Italy 445 (6.1) 514 (3.3) 557 (2.7) 600 (3.6) 658 (4.1)Kuwait + + + + + + + + + +Latvia 446 (4.0) 508 (3.3) 547 (3.0) 586 (1.5) 637 (2.6)Lithuania 448 (3.3) 506 (2.3) 542 (2.4) 576 (2.2) 625 (3.6)Luxembourg 438 (3.5) 508 (1.3) 551 (0.9) 592 (1.6) 647 (3.1)Macedonia, Rep. of 262 (7.0) 363 (3.4) 444 (4.0) 517 (5.4) 601 (5.3)Moldova, Rep. of 397 (5.8) 473 (4.5) 520 (3.2) 561 (2.6) 620 (3.6)Morocco + + + + + + + + + +Netherlands 455 (6.0) 509 (1.6) 544 (2.5) 577 (1.6) 622 (2.3)New Zealand 392 (3.3) 487 (2.2) 545 (3.0) 595 (2.9) 661 (2.7)Norway 380 (5.8) 453 (3.9) 499 (3.5) 541 (3.2) 595 (3.0)Poland 394 (7.7) 474 (3.6) 527 (1.7) 573 (2.2) 633 (2.0)Qatar + + + + + + + + + +Romania 320 (13.5) 438 (6.5) 500 (4.1) 554 (4.9) 621 (4.2)Russian Federation 445 (6.0) 522 (3.4) 567 (4.0) 608 (3.8) 664 (3.9)Scotland 388 (11.7) 482 (2.9) 533 (4.2) 580 (3.3) 648 (4.7)Singapore 431 (4.9) 513 (3.6) 561 (3.7) 604 (3.5) 660 (3.7)Slovak Republic 400 (5.5) 489 (3.8) 539 (3.7) 580 (2.9) 635 (3.1)Slovenia 404 (4.6) 481 (2.6) 528 (2.5) 569 (2.2) 624 (2.6)South Africa + + + + + + + + + +Spain 389 (7.3) 471 (3.5) 520 (3.3) 564 (3.1) 625 (3.1)Sweden 437 (4.8) 508 (2.2) 551 (2.7) 589 (2.8) 641 (3.3)Trinidad and Tobago 263 (9.5) 367 (5.6) 443 (5.1) 510 (4.5) 590 (4.4)United States 427 (5.8) 503 (3.8) 550 (3.9) 593 (3.5) 649 (3.1)
A plus (+) sign indicates average achievement could not be accurately estimated on the interpreting, integrating, and evaluating scale.
( ) Standard errors appear in parentheses. Because results are rounded to the nearest whole number, some totals may appear inconsistent.
SOU
RCE:
IEA
Pro
gres
s in
Inte
rnat
iona
l Rea
ding
Lite
racy
Stu
dy (P
IRLS
) 200
6
Exhibit C.9 Percentiles of Achievement in Reading for Interpreting, Integrating, and Evaluating PIRLS 20064th Grade

337appendix c: percentiles and standard deviations of reading achievement
Exhibit C.10: Standard Deviations of Achievement in Reading for Interpreting, Integrating, and Evaluating
Countries
Overall Girls Boys
Mean Standard Deviation Mean Standard
Deviation Mean Standard Deviation
Austria 530 (2.2) 64 (1.1) 536 (2.7) 62 (1.4) 524 (2.4) 66 (1.5) Belgium (Flemish) 547 (1.8) 53 (0.9) 550 (2.4) 52 (1.1) 544 (2.0) 54 (1.1) Belgium (French) 497 (2.5) 67 (1.2) 500 (2.6) 66 (1.4) 494 (2.9) 67 (1.6) Bulgaria 553 (4.4) 84 (2.8) 565 (4.4) 80 (2.6) 540 (5.1) 85 (3.6) Canada, Alberta 564 (2.3) 64 (1.3) 570 (2.5) 64 (1.7) 558 (2.8) 64 (1.4) Canada, British Columbia 562 (2.5) 65 (1.1) 567 (2.7) 65 (1.5) 557 (3.1) 66 (1.4) Canada, Nova Scotia 548 (2.0) 71 (1.5) 559 (2.2) 68 (1.7) 537 (2.6) 73 (1.8) Canada, Ontario 563 (2.9) 64 (0.9) 569 (3.2) 62 (1.2) 556 (3.1) 66 (1.5) Canada, Quebec 531 (2.7) 62 (1.3) 539 (2.6) 59 (1.5) 523 (3.3) 64 (1.8) Chinese Taipei 530 (1.9) 62 (1.1) 537 (1.9) 60 (1.2) 523 (2.2) 64 (1.2) Denmark 542 (2.3) 62 (1.1) 548 (2.8) 62 (1.4) 536 (2.6) 62 (1.6) England 543 (2.4) 81 (1.9) 552 (2.8) 81 (2.3) 534 (2.7) 81 (1.8) France 518 (2.3) 66 (1.0) 523 (2.6) 65 (1.5) 513 (2.5) 67 (1.0) Georgia 461 (3.5) 80 (2.0) 471 (4.1) 78 (2.7) 453 (4.1) 82 (2.4) Germany 540 (2.2) 65 (1.3) 543 (2.4) 64 (1.6) 537 (2.7) 66 (1.9) Hong Kong SAR 566 (2.4) 59 (1.5) 572 (2.6) 56 (1.4) 559 (2.8) 61 (1.8) Hungary 554 (3.0) 68 (1.8) 557 (3.6) 67 (2.1) 551 (3.0) 67 (2.0) Iceland 503 (1.3) 66 (1.1) 514 (1.9) 62 (1.4) 493 (1.7) 67 (1.5) Indonesia 404 (4.1) 80 (2.3) 415 (4.1) 78 (2.5) 393 (4.8) 81 (2.7) Iran, Islamic Rep. of 418 (3.3) 93 (2.1) 425 (5.5) 93 (2.8) 412 (4.2) 92 (2.8) Israel 516 (3.6) 97 (2.6) 523 (4.3) 95 (3.2) 510 (3.7) 99 (2.6) Italy 556 (2.9) 65 (1.5) 559 (2.9) 64 (1.6) 552 (3.4) 65 (2.0) Kuwait + + + + + + + + + + + + Latvia 545 (1.9) 58 (1.2) 557 (2.3) 56 (1.4) 534 (2.2) 58 (1.7) Lithuania 540 (1.6) 53 (1.0) 549 (2.2) 52 (1.2) 532 (2.0) 52 (1.4) Luxembourg 548 (0.9) 63 (0.9) 550 (1.4) 63 (0.9) 546 (1.2) 63 (1.3) Macedonia, Rep. of 439 (4.0) 105 (2.6) 451 (4.7) 104 (3.0) 428 (4.2) 104 (2.5) Moldova, Rep. of 515 (2.9) 67 (1.2) 523 (3.1) 66 (1.5) 508 (3.2) 68 (1.5) Morocco + + + + + + + + + + + + Netherlands 542 (1.5) 51 (1.1) 547 (2.0) 50 (1.4) 538 (1.8) 51 (1.5) New Zealand 538 (2.2) 81 (1.3) 550 (2.3) 76 (1.5) 526 (2.9) 85 (1.8) Norway 495 (2.4) 66 (1.5) 505 (2.5) 64 (1.8) 485 (2.9) 66 (1.7) Poland 522 (2.3) 72 (1.4) 529 (2.4) 71 (1.8) 514 (3.0) 73 (1.8) Qatar + + + + + + + + + + + + Romania 490 (5.3) 91 (3.4) 498 (5.6) 90 (4.2) 482 (5.9) 91 (3.4) Russian Federation 563 (3.2) 66 (1.9) 569 (3.8) 65 (2.1) 555 (3.2) 67 (2.0) Scotland 528 (2.6) 77 (1.2) 538 (3.3) 75 (1.7) 519 (2.9) 77 (1.7) Singapore 556 (2.7) 69 (1.5) 564 (2.8) 66 (1.7) 548 (3.2) 72 (1.7) Slovak Republic 531 (2.8) 71 (2.2) 538 (2.8) 70 (2.4) 525 (3.4) 72 (2.7) Slovenia 523 (2.0) 66 (1.0) 534 (2.1) 62 (1.3) 514 (2.4) 68 (1.3) South Africa + + + + + + + + + + + + Spain 515 (2.6) 72 (1.8) 519 (2.9) 72 (2.0) 512 (3.0) 71 (2.1) Sweden 546 (2.2) 62 (1.0) 557 (2.7) 60 (1.3) 537 (2.5) 62 (1.3) Trinidad and Tobago 437 (5.0) 100 (2.6) 453 (5.5) 95 (3.3) 421 (5.8) 103 (3.1) United States 546 (3.3) 67 (1.1) 552 (3.0) 65 (1.3) 540 (4.1) 69 (1.5)
A plus (+) sign indicates average achievement could not be accurately estimated on the interpreting, integrating, and evaluating scale.
( ) Standard errors appear in parentheses. Because results are rounded to the nearest whole number, some totals may appear inconsistent.
SOU
RCE:
IEA
Pro
gres
s in
Inte
rnat
iona
l Rea
ding
Lite
racy
Stu
dy (P
IRLS
) 200
6
Exhibit C.10 Standard Deviations of Achievement in Reading for Interpreting, Integrating, and Evaluating
PIRLS 20064th Grade
