appendix d-1 ace extension core capacity … · the ridership forecasting referred to herein has...
TRANSCRIPT

Appendix D-1 ACE Extension Core Capacity Memorandum


1
AECOM
300 Lakeside Drive
Suite 400
Oakland, California 94612-3596
www.aecom.com
510 893 3600 tel
The purpose of this memo is to assess the capacity utilization and ridership patterns of current ACE
service and evaluate core capacity as service is expanded. In the coming decade, SJRRC plans to
extend ACE from Stockton to Natomas in 2020 and Lathrop to Ceres in 2023. While only the Lathrop
to Ceres project is currently funded, this memo conservatively includes both extensions.
At present, the above extensions are planned without an increase in the four daily round trips on the
existing route. To accommodate the increases in ridership expected with the extensions, ACE
proposes to increase train lengths. This memo evaluates this approach and considers additional
capacity investments that may be required.
The ridership forecasting referred to herein has been conducted using the AECOM ACE Passenger
Rail Forecasting Model (“ACE Model”) for the proposed “implementation year” of the ACE extensions.
To align with demographic projections for generating ridership forecasts, 2025 is designated as the
“implementation year” following the expected start of service on both extensions.
The first two sections of this memo contain the project description of the ACE extensions and the
overall ridership forecast. The third section details the existing capacity utilization, and the fourth
section presents the utilization for 2025. The final section sums up the conclusions regarding the
capacity utilization with the extensions.
Project Description
Table 1 presents the existing and proposed service changes to each train for the year 2025, showing
which trains are extended to Ceres and Natomas.
Table 1: 2025 Service Changes by Train
Figure 1 shows the proposed route and stations for both the San Joaquins service and ACE under
the Valley Rail Project, as defined in the San Joaquin Joint Powers Authority’s and San Joaquin
To Dan Leavitt Page 1
CC
Stacey Mortensen
Brian Schmidt
Subject
ACE Core Capacity Analysis –
Revised for ACE Extension Lathrop to Ceres/Merced Draft EIR
From
Ryan Park
Laura McWethy
Date March 27, 2018
Existing (Stockton – San Jose) Extensions
Departs Arrives Origin Destination Departs Arrives
ACE01 4:20 AM 6:32 AM Ceres San Jose 4:17 AM 6:45 AM
ACE03
5:35 AM 7:47 AM Stockton San Jose 5:33 AM 7:45 AM
ACE05 6:40 AM 8:52 AM Stockton San Jose 6:33 AM 8:45 AM
ACE07 7:05 AM 9:17 AM Natomas San Jose 6:19 AM 9:45 AM
ACE04 3:35 PM 5:47 PM San Jose Ceres 3:15 PM 5:43 PM ACE06 4:35 PM 6:47 PM San Jose Natomas 4:15 PM 7:41 PM
ACE08 5:35 PM 7:47 PM San Jose Stockton 5:15 PM 7:27 PM
ACE10 6:38 PM 8:50 PM San Jose Stockton 6:15 PM 8:27 PM

ACE Core Capacity Analysis March 27, 2018
2
Regional Rail Commission’s joint 2018 Transit and Intercity Rail Capital Program application. In
addition to the four round trips traveling on the existing route, three roundtrips are planned to operate
between Ceres and Natomas and one round trip between Stockton and Natomas. These trains would
connect with the trains traveling on the existing route, increasing the overall service on the existing
route. The Ceres extension would include new rail stations at Ripon, Modesto, and Ceres, and bus
connections to Turlock, Livingston/Atwater, and Merced. The Natomas extension would include new
stations at Lodi, Elk Grove, City College, Sacramento Midtown, Old North Sacramento, and Natomas,
dependent on funding. For the most conservative estimates of capacity utilization, all stations are
included in the ridership modeling presented in this memo.
Figure 1: Valley Rail Project
Ridership Forecast
With the extensions, ridership is expected to surpass 3 million, over 85 percent more riders than
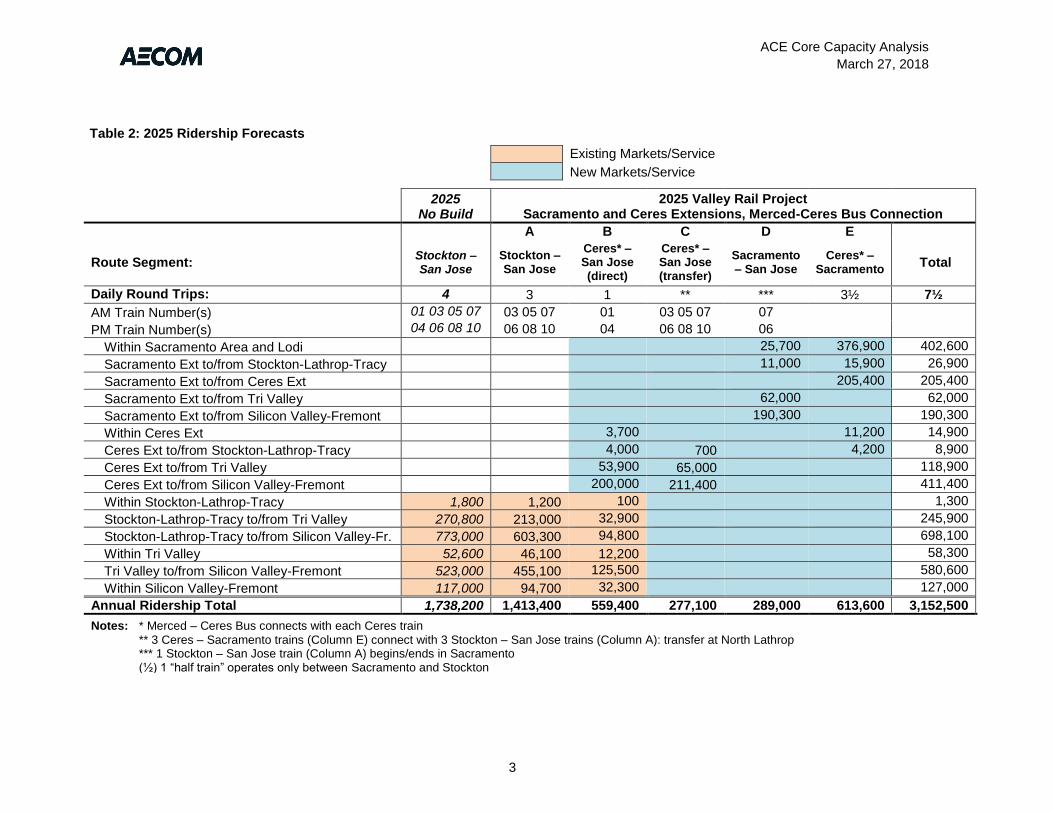
projected for 2025 No Build (the existing route and service with no extensions). Table 2 breaks down
the ridership by markets (rows) and route segments (columns, labeled A – E) for both the No Build
and Project scenarios. Existing markets are markets are shaded orange, while new markets
accessed by the extensions are shaded blue. Overall, ridership in the existing markets would be
somewhat reduced under the Valley Rail Project as compared to the No Build, since direct service
to/from Stockton would be reduced from four trains to three, and Stockton riders would have a few
minutes of additional travel time stopping at the new North Lathrop transfer station. However,
ridership within and between the Tri Valley and Silicon Valley markets would increase because of an
improved schedule under the Project; trains would be operated over a somewhat longer span of
service and at regular intervals.
ACE Core Capacity Analysis March 27, 2018
3
Table 2: 2025 Ridership Forecasts
Existing Markets/Service
New Markets/Service
2025 No Build
2025 Valley Rail Project Sacramento and Ceres Extensions, Merced-Ceres Bus Connection
A B C D E
Route Segment: Stockton – San Jose
Stockton – San Jose
Ceres* – San Jose (direct)
Ceres* – San Jose (transfer)
Sacramento – San Jose
Ceres* – Sacramento
Total
Daily Round Trips: (see notes below)
4 3 1 ** *** 3½ 7½
AM Train Number(s) 01 03 05 07 03 05 07 01 03 05 07 07
PM Train Number(s) 04 06 08 10 06 08 10 04 06 08 10 06
Within Sacramento Area and Lodi 25,700 25,700
376,900 376
376,900
402,600 402,600 Sacramento Ext to/from Stockton-Lathrop-Tracy 11,000
11,000 15,900 15,900
26,900 26,900 Sacramento Ext to/from Ceres Ext
205,400 205,400
205,400 205,400 Sacramento Ext to/from Tri Valley 62,000
62,000 62,000
62,000 Sacramento Ext to/from Silicon Valley-Fremont 190,300 190,300
190,300 190,300 Within Ceres Ext 3,700
400 11,200
11,200 14,900 14,800 Ceres Ext to/from Stockton-Lathrop-Tracy 4,000
600 700 4,200
4,200 8,900 8,900 Ceres Ext to/from Tri Valley 53,900
46,100 65,000 118,900
118,800 Ceres Ext to/from Silicon Valley-Fremont 200,000 150,600
211,400 411,400 411,600 Within Stockton-Lathrop-Tracy 1,800 1,200 100
100
1,300 1,300 Stockton-Lathrop-Tracy to/from Tri Valley 270,800 213,000 32,900
32,900 245,900
245,900 Stockton-Lathrop-Tracy to/from Silicon Valley-Fr. 773,000 603,300 94,800 94,800
698,100 698,100 Within Tri Valley 52,600 46,100 12,200 58,300 58,300 Tri Valley to/from Silicon Valley-Fremont 523,000 455,100 125,500
125,500 580,600
580,600 Within Silicon Valley-Fremont 117,000 94,700 32,300 6,300
127,000 24,800 Annual Ridership Total 1,738,200
1.337.200 1,337,200
1,413,400 1.337.200 1,337,200
559,400 469,500
277,100 289,000 289,000
613,600 613,600
3,152,500 3,050,300 Notes: * Merced – Ceres Bus connects with each Ceres train
** 3 Ceres – Sacramento trains (Column E) connect with 3 Stockton – San Jose trains (Column A): transfer at North Lathrop *** 1 Stockton – San Jose train (Column A) begins/ends in Sacramento (½) 1 “half train” operates only between Sacramento and Stockton

ACE Core Capacity Analysis March 27, 2018
4
Table 3 shows the progression of ridership growth from 2013 to 2017 and to the 2025 scenario
forecasts. The 2013 and 2017 results are outputs from the ACE Model, calibrated to actual ridership
counts from the respective year. The “Sacramento Area and Lodi”, “Stockton-Lathrop-Tracy” and
“Ceres Extension” markets in Table 2 are aggregated as “Central Valley”. In 2025, travel within the
Central Valley increases from 1,800 annual riders under No Build to 660,000 with the extensions; this
ridership would have no impact on the ACE trunk line between Lathrop and San Jose. Trips to and
from Silicon Valley include Fremont, which is forecast to amount to 15 percent of the Central Valley
to/from Silicon Valley market in 2025.
Table 3: Annual Ridership Market Summary, 2013 and 2017 Model Outputs to 2025 Forecasts
2013 Modeled
2017 Modeled
2025 No Build
2025 Valley Rail
Project Sacramento and Ceres
Extensions, Merced-
Ceres Bus Connection
Within Central Valley 1,300 1,600 1,800 660,000 1,300 Central Valley to/from Tri Valley 184,200 232,900 270,800 426,800
245,900
Central Valley to/from Silicon Valley-Fr. 529,000 668,400 773,000 1,299,800 698,100 Within Tri Valley 35,700 45,000 52,600 58,300 58,300 Tri Valley to/from Silicon Valley-Fremont 356,200 448,700 523,000 580,600
580,600 Within Silicon Valley-Fremont 74,600 100,700 117,000 127,000 24,800 Annual Ridership Total 1,181,000 1,497,300 1,738,200
1.337.200 1,337,200
3,152,500 3,050,300
Existing Conditions
With four westbound departures in the morning and four eastbound departures in the
afternoon/evening each weekday, ACE provides a commute alternative for jobs in Tri Valley and
Silicon Valley. In October 2017, ACE served an average of 5,809 daily riders.
Peaking by Service Day
ACE ridership varies from day to day, with the highest ridership occurring midweek (Tuesdays,
Wednesdays, and Thursdays), followed by Mondays, with the least ridership on Fridays. In October
2017, average Tuesday-Thursday ridership totaled 6,053 (104% of the average daily ridership for the
month), average Monday ridership totaled 5,845 (101% of the average for the month), and average
Friday ridership totaled 4,969 (86% of the average for the month). Given these results, core capacity
is evaluated for Tuesday-Thursday trains.
Peaking by Train
Similar to the peaking of ACE ridership midweek, the first and last trains in each direction of the
service day have lower ridership than the second and third trains. ACE has adjusted train lengths
accordingly, operating the first train of each directional service period (ACE01 and ACE04) as 6-car
trains, the second and third trains (ACE03, ACE05, ACE06 and ACE08) as 7-car trains, and the last
train (ACE07 and ACE10) as 5-car trains.
This pattern holds true, regardless of the day of the week; however, the average train ridership for the
month of October 2017 presented in Table 1 specifically reflects Tuesday-Thursday trains.
Residents of San Joaquin Valley commute to jobs in both Tri Valley and Silicon Valley, while Tri
Valley residents commute to Silicon Valley. Figure 2 shows the average seated capacity utilization
between each station pair in October 2017 for ACE03 and ACE06, the trains with the highest
ridership in each direction. The peak load typically occurs where both commuting markets have their

ACE Core Capacity Analysis March 27, 2018
5
highest ridership on board: in the westbound direction, between Pleasanton (in Tri Valley) and
Fremont (in Silicon Valley); in the eastbound direction, between Fremont and Pleasanton. The
greatest average capacity utilization on ACE03 and ACE06 occurred between this station pair, and
was 79 and 83 percent, respectively.
Figure 2: Average Seated Capacity Utilization, October 2017
Analysis of October 2017 data found that while Fremont-Pleasanton dominates as the peak link,
about ten percent of trains have their point of highest capacity utilization between Great America and
Fremont or in Tri Valley. As a consequence, the average peak link load – including all of the station
pairs where the peak link load occurs – is somewhat greater than the average Fremont/ Pleasanton
link load. For ACE03 and ACE06, the average seated capacity utilization at the peak link load is 81
and 84 percent, respectively, a few points higher than the average at Fremont/Pleasanton.

ACE Core Capacity Analysis March 27, 2018
6
As shown in Table 4, given the different train lengths, average peak link seated capacity utilization
ranges from a high of 84 percent for ACE06 to a low of 36 percent for ACE10. Of course, capacity
utilization is lower on Monday and Friday trains.
Table 4: ACE Ridership by Train, October 2017
Departs
Stockton
Arrives
San Jose
Average
Train
Ridership
(Tues.-
Thurs.)
Average
Fremont/
Pleasanton
Link Load
Average
Peak Link
Load
Seated
Train
Capacity
(train length
in cars)
Average
Seated
Capacity
Utilization*
ACE01 4:20 AM 6:32 AM 766 613 616 798 (6) 77 - 77 %
ACE03
5:35 AM 7:47 AM 959 729 748 919 (7)
79 - 81 %
ACE05 6:40 AM 8:52 AM 883 678 686 919 (7)
74 - 75 %
ACE07 7:05 AM 9:17 AM 521 389 398 656 (5)
59 - 61 %
Departs
San Jose
Arrives
Stockton
ACE04 3:35 PM 5:47 PM 823 581 605 798 (6) 73 - 76 %
ACE06 4:35 PM 6:47 PM 952 767 771 919 (7)
83 - 84 %
ACE08 5:35 PM 7:47 PM 859 710 720 919 (7)
77 - 78 %
ACE10 6:38 PM 8:50 PM 290 234 236 656 (5)
36 - 36 %
Total 6,053
*Average Seated Capacity Utilization at Fremont/Pleasanton (lower %) and at Peak Link (upper %)
The above analysis of existing conditions shows that even the most crowded ACE train still offers
nearly free seated capacity. ACE currently has the capability to increase the 5- and 6-car trains to 7-
car trains, which would address capacity issues on the shorter trains as ridership increases,
particularly on ACE04, the train with the highest average link load still operated as a 6-car train.
Current ACE service is operated with 25 cars. As ridership continues to grow, especially as service
begins on the ACE extensions, train lengths greater than 7 cars will be needed. Platform extensions
to accommodate 8-car and 10-car trains are under development at ACE-controlled stations. The
following sections evaluate future conditions and assess future capacity needs.
2025 Conditions
The travel patterns for the 2025 forecast change from existing conditions, so the ridership forecast
was post-processed for both the No Build and the Valley Rail Project in order to convert the model
output (annual ridership numbers by train and market flow) to an estimated average daily peak link
load. This was done for both scenarios to ensure consistency across the two scenarios and allow
capacity utilization to be compared. As such, the average daily midweek ridership numbers are not
precise estimates of actual daily travel, but are intended to represent an approximate value of how
many riders may travel on a daily basis. The following procedure was applied:
1. Convert the annual market flows by train to average mid-week daily numbers by applying the
following factors, creating a table similar to Table 2 for each train:
a. Annual to Daily factor – 253 days of weekday service per year
b. Mid-week peak factor based on October 2017 ridership – 104 percent of weekly average

ACE Core Capacity Analysis March 27, 2018
7
2. Sum up market flows contributing to the peak link load, which is typically between Fremont
and Pleasanton (the dividing line between the Tri-Valley market and the Silicon Valley
markets):
a. Sacramento Extension to/from Silicon Valley
b. Ceres Extension to/from Silicon Valley
c. Stockton-Lathrop-Tracy to/from Silicon Valley
d. Tri Valley to/from Silicon Valley
3. Compare the Valley Rail Project market flows to the No Build market flows and adjust for
consistency.
4. Compare the peak link loads by train and market to the capacity of each train to determine
capacity utilization.
As part of post-processing, the location of the peak links by train for the Valley Rail Project was
checked, as the changing travel patterns may have shifted the peak link further east. For three of the
eight trains traveling on the existing route, the location of the peak link shifted to
Pleasanton/Livermore from Fremont/Pleasanton, where it is currently located. However, the peak
load remained within 4 percent of the Fremont/Pleasanton link.
2025 No Build Capacity Utilization
As shown in Table 2, annual 2025 No Build ridership is expected to reach 1.644 million, or about
6,500 daily riders. To determine capacity utilization in Table 5, the midweek factor of 104 percent is
applied, resulting in the 6,756 daily “midweek” riders. The average Fremont/Pleasanton link load is
calculated as the total trips to/from Silicon Valley. Finally, the average Fremont/Pleasanton peak link
load is divided by the seats provided on each train to yield capacity utilization.
As shown in Table 5, the 2025 No Build peak link load utilization would remain within the seated
capacity of the existing composition of ACE service, with two exceptions. With 7 cars, ACE06 would
approach full capacity (97 percent utilization) – between Fremont and Pleasanton trains would only
Table 5: ACE Capacity Utilization, 2025 No Build
Departs
Stockton
Arrives
San Jose
Average
Train
Ridership
(Tues.-
Thurs.)
Percent
of Daily
Ridership
Average
Fremont/
Pleasanton
Link Load
Seated
Train
Capacity
(train length
in cars)
Seated
Capacity
Utilization at
Fremont/
Pleasanton
Link Load
ACE01 4:20 AM 6:32 AM 780 12% 633 798 (6) 79%
ACE03
5:35 AM 7:47 AM 1,196 18% 947 1,061 (8) 89%
ACE05 6:40 AM 8:52 AM 920 14% 715 919 (7)
78%
ACE07 7:05 AM 9:17 AM 473 7% 368 656 (5)
56%
Departs
San Jose
Arrives
Stockton
ACE04 3:35 PM 5:47 PM 911 13% 706 798 (6) 88%
ACE06 4:35 PM 6:47 PM 1,133 17% 888 1,061 (8) 84%
ACE08 5:35 PM 7:47 PM 1,020 15% 812 919 (7)
88%
ACE10 6:38 PM 8:50 PM 323 5% 258 656 (5)
39%
Total 6,756 100%

ACE Core Capacity Analysis March 27, 2018
8
have about 4 empty seats per car. With 7 cars, ACE03 would have about 4 standees per car between
Pleasanton and Fremont. Since the average peak link load will be somewhat greater than the
average Fremont/Pleasanton link load, an additional car would be needed for ACE03 and ACE06 to
ensure all riders have a seat. Only a single additional car would need to be added to the fleet to
operate an 8-car train as ACE03 in the AM and returning as ACE06 in the PM.
2025 Valley Rail Project Capacity Utilization
ACE plans to extend service on the UPRR Sacramento Subdivision from Stockton to Sacramento by
2020, with stations serving Midtown and a terminus at Natomas. By 2023, service is also planned to
extend from Lathrop to Ceres along the UPRR Fresno Subdivision. The preliminary service schedule
reassigns the earliest train of each directional service period (ACE01 and ACE04) as a train operating
directly between Ceres and San Jose, leaving three trains operating between Stockton and San Jose
One of these round trips, the latest morning service (ACE07) and the second afternoon service
(ACE06) would operate between Natomas and San Jose, serving the new Sacramento Subdivision
stations. In addition, three round trips would operate between Ceres and Natomas, which would be
timed to meet the second, third and fourth trains of each directional service period (ACE03, ACE05,
ACE07 and ACE06, ACE08, ACE10) at a new North Lathrop transfer station.
Table 6: 2025 Valley Rail Project, Daily Silicon Valley (Fremont/Pleasanton Link Load) Ridership
A B C D E
Route Segment: Stockton – San Jose
Ceres* – San Jose (direct)
Ceres* – San Jose (transfer)
Sacramento – San Jose
Ceres* – Sacramento
Total
Daily Round Trips: (see notes below)
3 1 ** *** 3½ 7½
AM Train Number(s) 03 05 07 01 03 05 07 07
PM Train Number(s) 06 08 10 04 06 08 10 06
ACE01 – Ceres Ext
361 990
– Existing Route 629
ACE03 934 119 1,053
ACE05 702 150 852
ACE07 361 215 391 967
ACE04 – Ceres Ext
461 1,155
– Existing Route 694
ACE06 793 126 391 1,310
ACE08 885 135 1,020
ACE10 256 124 380
Total 3,931 2,145 869 782 7,727
Notes: * Merced – Ceres Bus connects with each Ceres train
** 3 Ceres – Sacramento trains (Column E) connect with 3 Stockton – San Jose trains (Column A): transfer at North Lathrop *** 1 Stockton – San Jose train (Column A) begins/ends in Sacramento (½) 1 “half train” operates only between Sacramento and Stockton
Using the post-processing procedure detailed above, Table 6 sums the contribution of each route
segment to the Fremont/Pleasanton link load to calculate the total average daily Pleasanton/Fremont
link load for each individual train, broken into the Table 2 route segments. Trips which contribute to
the capacity utilization on the Fremont/Pleasanton link load are those traveling to/from Silicon Valley.

ACE Core Capacity Analysis March 27, 2018
9
Each route segment is reviewed below to determine its contribution to capacity utilization at the
Fremont/Pleasanton link load.
A. Stockton – San Jose: Daily midweek ridership between Stockton and San Jose on trains
ACE03, ACE05, ACE07, ACE06, ACE08, and ACE10 would be reduced from 6,756 under
the No Build to 4,921 under the Valley Rail Project, since direct service to/from Stockton
would be reduced from four trains to three, and Stockton riders would have a few minutes of
additional travel time stopping at the new North Lathrop transfer station. Of these riders,
3,931 travel to or from Silicon Valley, contributing to the Fremont/Pleasanton link load. Per
train, the number of Fremont/Pleasanton link load riders ranges from 256 on ACE10 to 934
on ACE03, as shown in Table 6.
Because the Valley Rail Project does not increase Stockton – San Jose ridership at the
existing stations, parking demand at Tracy and stations west of Tracy would not be increased
with the Sacramento and Ceres Extensions. However, the extensions will deliver more riders
to the shuttles serving Pleasanton and Great America, requiring additional shuttle capacity.
The impact of increased ridership on shuttle capacity is analyzed in the ACE Extension
Lathrop to Ceres/Merced Draft EIR.
B. Ceres – San Jose (Direct Service): The market for the direct Ceres to San Jose round trip
(ACE01 and ACE04) is forecast at 2,722 daily midweek riders in 2025, including riders who
use the Merced-Ceres bus connection. Of these riders, 2,145 travel to or from Silicon Valley,
contributing to the Fremont/Pleasanton link load. ACE01 and ACE04 have an average of 990
and 1,155 Fremont/Pleasanton link load riders, respectively, as shown in Table 6.
C. Ceres – San Jose (Transfer Trains): The market for the three Ceres-Natomas trains,
scheduled to meet the three Stockton-San Jose trains for timed transfers, is forecast at 1,138
daily midweek riders in 2025, including riders who use the Merced-Ceres bus connection. Of
these riders, 869 travel to or from Silicon Valley, contributing to the Fremont/Pleasanton link
load. Per train, the number of peak link load riders ranges from 119 on ACE03 to 215 on
ACE07, as shown in Table 6.
D. Sacramento – San Jose: The market of the direct Natomas to San Jose round trip (ACE06
and ACE07) on the Sacramento Extension (excluding the ridership on the existing route,
which is found in Route Segment A) is forecast at 1,187 daily midweek riders in 2025. Of
these riders, 782 travel to or from Silicon Valley, contributing to the Fremont/Pleasanton link
load. The number of Fremont/Pleasanton link load riders is 391 on ACE06 and 391 on
ACE07, as shown in Table 6.
E. Ceres – Sacramento: Riders on the three trains between Ceres and Sacramento who do
not transfer to Stockton-San Jose trains do not contribute to the peak link load, and thus do
not impact the core capacity between Stockton and San Jose.
Table 7 presents 2025 ridership and capacity utilization with the Sacramento and Ceres Extensions.
Only ACE05 and ACE10 would accommodate the Pleasanton/Fremont link load under the 2025
Project (852 and 380 riders, respectively) with the existing train lengths (7 and 5 cars, respectively).
Since crews are not able to reconfigure the trains at the Tamien Layover Facility, the same consists
used for the AM trains must also be used for the PM trains. Also, the train consists serving each AM
origin must match the train consists serving the same PM destination to meet equipment rotation
requirements.

ACE Core Capacity Analysis March 27, 2018
10
ACE06 would require a 10-car train to accommodate its 1,310 Fremont/Pleasanton link load
riders, which would utilize 99 percent of seated capacity. Since the ACE06 consist arriving at
Natomas in the PM must match the ACE07 consist departing Natomas in the AM, ACE07
would require 10 cars as well; its 967 Fremont/Pleasanton link load riders would utilize 73
percent of seated capacity.
ACE04 would require a 9-car train to accommodate its 1,155 Fremont/Pleasanton link load
riders, which would utilize 98 percent of seated capacity. Since the ACE01 consist departing
Ceres in the AM must match the ACE04 consist returning to Ceres in the PM, ACE01 would
require 9 cars as well; its 990 Fremont/Pleasanton link load riders would utilize 84 percent of
seated capacity.
ACE03 would require an 8-car train to accommodate its 1,053 Fremont/Pleasanton link load
riders, which would utilize 99 percent of seated capacity. Of the remaining PM trains, ACE08
has the greatest demand and would be assigned an 8-car train as well; its 1,020
Fremont/Pleasanton link load riders would utilize 96 percent of seated capacity.
Finally, ACE05 could continue to be operated with a 7-car consist as it is today; its 852
Fremont/Pleasanton link load riders would utilize 93 percent of seated capacity. However,
two cars would have to be added to ACE10 to balance the AM and PM consist sizes. With 7
cars, the 380 Fremont/Pleasanton link load riders of ACE10 would utilize 41 percent of
seated capacity.
As shown in Table 7, at least 34 cars would be required for the four round trips serving San Jose to
accommodate 2025 Valley Rail Project ridership, 9 additional cars than in existing operations.
However, if the Sacramento Extension is not implemented, ACE06 and ACE07 would not need as
much capacity. The average Fremont/Pleasanton link load would be reduced to 919 and 576,
respectively, and could be operated with an 8-car train. The required number of cars would thus be
reduced to 32.
Table 7: ACE Capacity Utilization, 2025 Valley Rail Project
Departs
Ceresa
Stocktonb
Natomasc
Arrives
San Jose
Average
Train
Ridership
(Tues.-
Thurs.)
Percent
of Daily
Ridership
Average
Fremont/
Pleasanton
Link Load
Seated
Train
Capacity
(train length
in cars)
Seated
Capacity
Utilization at
Fremont/
Pleasanton
Link Load
ACE01 4:17 AMa 6:45 AM 1,229 12% 990 1,182 (9)
84%
ACE03
5:33 AMb 7:45 AM 1,315 13% 1,053 1,061 (8) 99%
ACE05 6:33 AMb 8:45 AM 1,088 11% 852 919 (7)
93%
ACE07 6:19 AMc 9:45 AM 1,356 14% 967 1,324 (10) 73%
Departs
San Jose
Arrives a, b, c
ACE04 3:15 PM 5:43 PMa 1,493 15% 1,155 1,182 (9)
98%
ACE06 4:15 PM 7:41 PMc 1,856 19% 1,310 1,324 (10) 99%
ACE08 5:15 PM 7:27 PMb 1,157 12% 1,020 1,061 (8) 96%
ACE10 6:15 PM 8:27 PMb 474 5% 380 919 (7)
41%
Total 9,968 100%

ACE Core Capacity Analysis March 27, 2018
11
Conclusions
The forecasted ridership increases from the implementation of the proposed Sacramento and
Ceres/Merced Extensions will be accommodated by the core capacity expansion (between Stockton
and San Jose) included as part of the Valley Rail Project. ACE is already preparing to expand
capacity by extending platforms to accommodate 8-car and 10-car trains at the stations it operates,
and procuring new locomotives to provide the additional power to push/pull longer trains over
Altamont Pass. Delivery of two new locomotives is expected by 2019, followed by an additional pair in
2020. By deploying longer trains with up to 10 cars, ACE will have sufficient seated capacity to
accommodate 2025 Ceres Extension ridership, as presented in the ACE Extension Lathrop to
Ceres/Merced Draft EIR, as well as 2025 Valley Rail Project ridership.
Table 8: Fleet Requirement and Capacity Utilization Summary, 2017 Actual and 2025 Forecasts
October
2017
2025 No
Build
2025 Project
(Ceres
Extension
only)
2025 Project
(Ceres +
Sacramento
Extensions)
Fleet Requirement for Core
(minimum daily operating cars)
25 26 32 34
Consist Size (Average Seated Capacity Utilization at Fremont/Pleasanton Link Load)
ACE01 6 (77%) 6 (79%) 9 (84%) 9 (84%)
ACE03
7 (79%) 8 (89%) 8 (99%) 8 (99%)
ACE05 7 (74%) 7 (78%) 7 (93%) 7 (93%)
ACE07 5 (59%) 5 (56%) 8 (54%) 10 (73%)
ACE04 6 (73%) 6 (88%) 9 (98%) 9 (98%)
ACE06 7 (83%) 8 (84%) 8 (87%) 10 (99%)
ACE08 7 (77%) 7 (88%) 8 (96%) 8 (96%)
ACE10 5 (36%) 5 (39%) 7 (41%) 7 (41%)
