appendix d: econometric estimation · supported by fisher center for the strategic use of...
TRANSCRIPT
1
254
Appendix D:
Econometric
Estimation
255
• Method requires cross-section or time series data
• Regression
–E.g., survey data or test marketing data, or already existing market data
Econometrics is Estimation of
Statistical Relations of
Economic Variables
*
256
• Synthesize large amounts of info
in an effective way
• provides framework for
systematic thought
– assumptions explicit
*
257
Typical Regression Analysis
Unit sales = a + b1 price + b2
advertising + bi other variable + e
or
Thomas T. Nagle & Reed K. Holden, “The Strategy and Tactics of Pricing: A Guide to Profitable
Decision Making,” Second Edition 1995
Market share = a + b1 lagged market share
+ b2 price + bi other variable + e
*
2
258
Other Control Variables
• Adding variables that might
affect sales
–Growth in GNP
–Growth in population
–Season
–Income levelThomas T. Nagle & Reed K. Holden, “The Strategy and Tactics of Pricing: A Guide to Profitable
Decision Making,” Second Edition 1995
*
259
Analyzing Sales & Panel
• Usually by linear regression
analysis.
260
Problems with Regressions
• If only little historical variation, price statistics cannot reveal the effect of price changes.
Thomas T. Nagle & Reed K. Holden, “The Strategy and Tactics of Pricing: A Guide to Profitable
Decision Making,” Second Edition 1995
http://www.freebsd.org/g
ifs/bug.jpg
N
261
• Need to assume a specific
mathematical model for the
relationship between price and
sale.
• If specification is incorrect, the
results will be incorrect
Thomas T. Nagle & Reed K. Holden, “The Strategy and Tactics of Pricing: A Guide to Profitable
Decision Making,” Second Edition 1995
3
262
• Also, the results can only be
values over the range of price
levels for which data was
available
263
Econometrics
• Predicting the future requires
assumption that behavior is like
the past.
Thomas T. Nagle & Reed K. Holden, “The Strategy and Tactics of Pricing: A Guide to Profitable
Decision Making,” Second Edition 1995
264
Ordinary Least Squares (OLS)
• Use linear regression models
to quantify linear relationships
among variables
• Can estimate OLS regression
using any statistical software
package (STATA, SAS,
EXCEL, Minitab, etc.)http://www.chass.utoronto.ca/~murdockj/eco310/F03_310_six.pdf
*
265
4
266
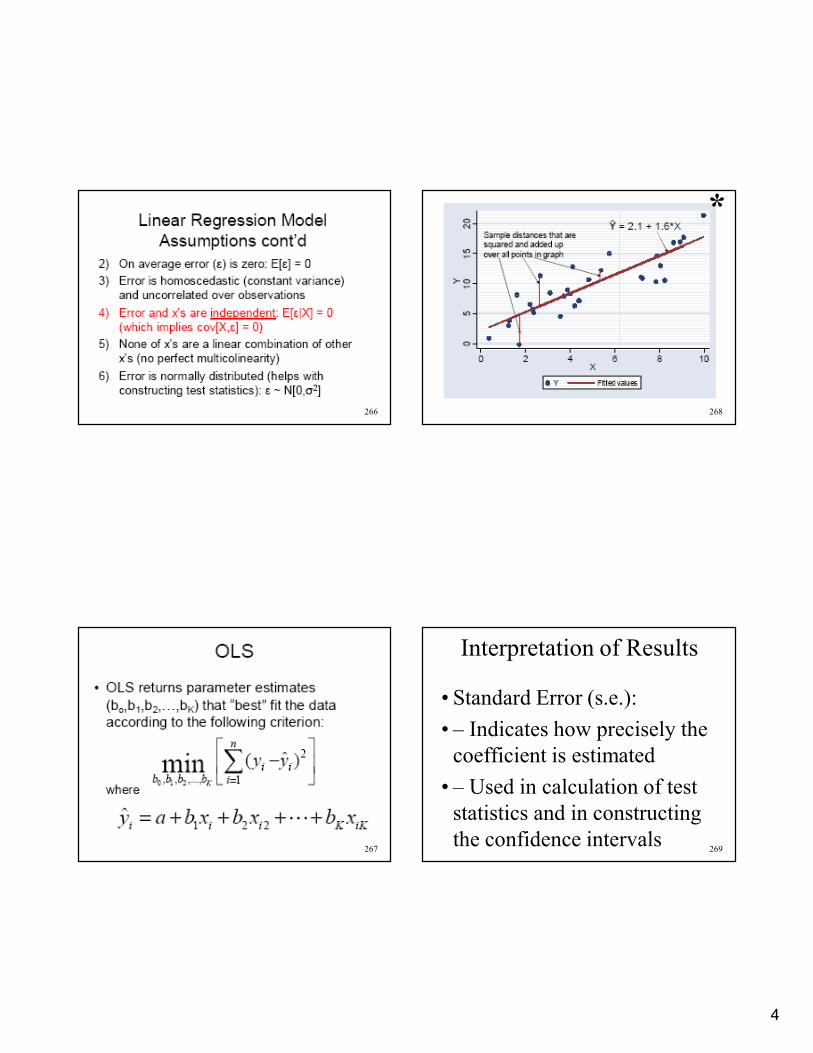
267
268
*
269
Interpretation of Results
• Standard Error (s.e.):
• – Indicates how precisely the
coefficient is estimated
• – Used in calculation of test
statistics and in constructing
the confidence intervals
5
270
Interpretation of Results,
cont’d• T-statistic
• – Tests hypothesis that
coefficient is (statistically) =β0
(null hypothesis)
271
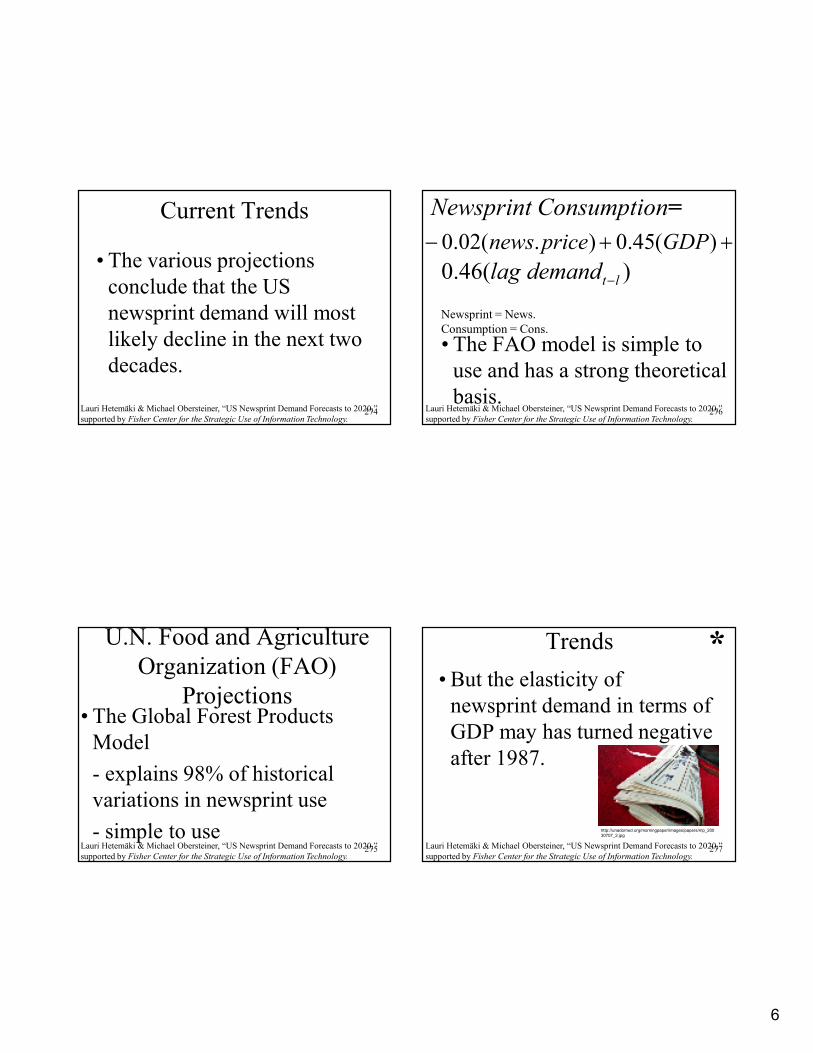
Example: Demand Estimation
for Newsprint
- For newspapers,
directories etc.
http://www.andrewdegrandpre.com/newspaper_roll_centered1.jpg
http://homepage.mac.com/albertkwa
n/Chronicle_Blog/C1258471436/E1
867671640/Media/newspaper%20ro
ll.gif
Lauri Hetemäki & Michael Obersteiner, “US Newsprint Demand Forecasts to 2020,”
supported by Fisher Center for the Strategic Use of Information Technology.
*
272
• Of great importance to
newspaper companies:
- What will be the price of its
largest non-personnel cost item?
• Also of great importance to paper
and forestry companies which
must make investments in new
trees.
*
273
Approaches to Forecast
Newsprint Demand1. The “classical model”:
GDP and newsprint price
determine newsprint
demand.
Lauri Hetemäki & Michael Obersteiner, “US Newsprint Demand Forecasts to 2020,”
supported by Fisher Center for the Strategic Use of Information Technology.
*
6
274
Current Trends
• The various projections
conclude that the US
newsprint demand will most
likely decline in the next two
decades.
Lauri Hetemäki & Michael Obersteiner, “US Newsprint Demand Forecasts to 2020,”
supported by Fisher Center for the Strategic Use of Information Technology.
275
U.N. Food and Agriculture
Organization (FAO)
Projections• The Global Forest Products
Model
- explains 98% of historical
variations in newsprint use
- simple to useLauri Hetemäki & Michael Obersteiner, “US Newsprint Demand Forecasts to 2020,”
supported by Fisher Center for the Strategic Use of Information Technology.
276
• The FAO model is simple to
use and has a strong theoretical
basis.
++− )(45.0).(02.0 GDPpricenews
Newsprint Consumption=
Newsprint = News.
Consumption = Cons.
Lauri Hetemäki & Michael Obersteiner, “US Newsprint Demand Forecasts to 2020,”
supported by Fisher Center for the Strategic Use of Information Technology.
)(46.0 ltdemand lag −
277
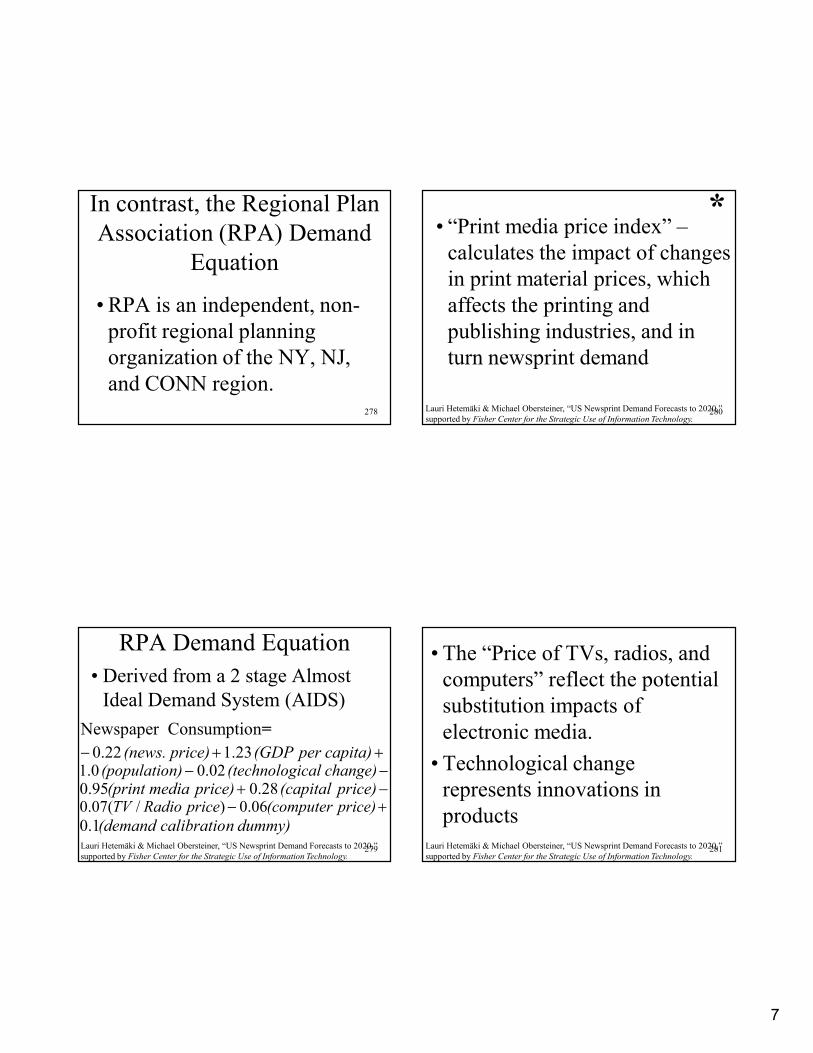
Trends
• But the elasticity of
newsprint demand in terms of
GDP may has turned negative
after 1987.
Lauri Hetemäki & Michael Obersteiner, “US Newsprint Demand Forecasts to 2020,”
supported by Fisher Center for the Strategic Use of Information Technology.
http://unadorned.org/morningpaper/images/papers/mp_200
30707_2.jpg
*
7
278
In contrast, the Regional Plan
Association (RPA) Demand
Equation
• RPA is an independent, non-
profit regional planning
organization of the NY, NJ,
and CONN region.
279
RPA Demand Equation
• Derived from a 2 stage Almost
Ideal Demand System (AIDS)
−+ price) (capital price) media (print 0.280.95
capita) per (GDP price) (news. ++− 1.23 0.22−− change) ical(technolog n)(populatio 0.021.0
+− price) (computer price RadioTV 0.06)/(0.07
Newspaper Consumption=
Lauri Hetemäki & Michael Obersteiner, “US Newsprint Demand Forecasts to 2020,”
supported by Fisher Center for the Strategic Use of Information Technology.
dummy) ncalibratio (demand0.1
280
• “Print media price index” –
calculates the impact of changes
in print material prices, which
affects the printing and
publishing industries, and in
turn newsprint demand
Lauri Hetemäki & Michael Obersteiner, “US Newsprint Demand Forecasts to 2020,”
supported by Fisher Center for the Strategic Use of Information Technology.
*
281
• The “Price of TVs, radios, and
computers” reflect the potential
substitution impacts of
electronic media.
• Technological change
represents innovations in
products
Lauri Hetemäki & Michael Obersteiner, “US Newsprint Demand Forecasts to 2020,”
supported by Fisher Center for the Strategic Use of Information Technology.

8
282
• Adjusts for the decrease in
newsprint demand post 2000
and the recession in the US
economy.
Demand Calibration Dummy
Lauri Hetemäki & Michael Obersteiner, “US Newsprint Demand Forecasts to 2020,”
supported by Fisher Center for the Strategic Use of Information Technology.
283
Figure 1. US Newsprint Consumption Projections: FAO (1995-2010 and
RPA (2001-2020)
Lauri Hetemäki & Michael Obersteiner, “US Newsprint Demand Forecasts to 2020,”
supported by Fisher Center for the Strategic Use of Information Technology.
*
284
• The RPA model
accounts for the
importance of the
relative prices of
newsprint and
electronic media
as substitutes.
http://www.newspapercatalog.com/newspapers/images/newspapercatalog/ad02bg.gif
Lauri Hetemäki & Michael Obersteiner, “US Newsprint Demand Forecasts to 2020,”
supported by Fisher Center for the Strategic Use of Information Technology.
285
• FAO projections reflect the
pre-1987 trend:
increasing newsprint demand
• RPA projections reflect the
post-1987 trend:
decreasing demand
Lauri Hetemäki & Michael Obersteiner, “US Newsprint Demand Forecasts to 2020,”
supported by Fisher Center for the Strategic Use of Information Technology.
9
286
Alternative Econometric
Approach:
Bayesian Model
287
The Bayesian Model
• Incorporates other information
(e.g. subjective expert
knowledge) into econometric
forecasting models.
• This model has gained
popularity.Lauri Hetemäki & Michael Obersteiner, “US Newsprint Demand Forecasts to 2020,”
supported by Fisher Center for the Strategic Use of Information Technology.
288
• Expert opinion will often
require one to reset the equation
accordingly.
- If GDP growth is believed not
to impact future demand, the
mead value of GDP distribution
of the previous year should be
reset.Lauri Hetemäki & Michael Obersteiner, “US Newsprint Demand Forecasts to 2020,”
supported by Fisher Center for the Strategic Use of Information Technology.
289
• This shift moves from the
classical model, based on the
“prior” p(GDPt|Dt-1) to the
Bayesian post-intervention prior
p(GDPt|Dt-1, It) where It denotes
the external information available
from the experts at time t. It is
called the “prior” information set.Lauri Hetemäki & Michael Obersteiner, “US Newsprint Demand Forecasts to 2020,”
supported by Fisher Center for the Strategic Use of Information Technology.
10
290
• Such “prior information by
experts is derived from
simulations produced by
exercises.
• Participants develop
consumption scenarios from
1998 up to year 2013 in 5-year
intervals.Lauri Hetemäki & Michael Obersteiner, “US Newsprint Demand Forecasts to 2020,”
supported by Fisher Center for the Strategic Use of Information Technology.
291
Deriving the “Bayesian prior”
• Experts create scenarios of
future demand.
• The experts are asked to
give quantitative responses
to three factors of the US
newsprint market:Lauri Hetemäki & Michael Obersteiner, “US Newsprint Demand Forecasts to 2020,”
supported by Fisher Center for the Strategic Use of Information Technology.
292
1. economic and
lifestyle development
2. the trend from
paper media to
electronic media
3. future changes in the
weight and size of
newspapers.
http://istresults.cordis.lu/Pictures/200402/61220_001.jpg
Lauri Hetemäki & Michael Obersteiner, “US Newsprint Demand Forecasts to 2020,” supported by
Fisher Center for the Strategic Use of Information Technology.
293
• After the first scenarios are
created, they are discussed and
improved by the participants.
The process continues until the
experts come to a consensus on
the ideal scenario
Lauri Hetemäki & Michael Obersteiner, “US Newsprint Demand Forecasts to 2020,”
supported by Fisher Center for the Strategic Use of Information Technology.
11
294
The Classical Approach• Newsprints are defined as forest
products.
• A behavioral hypothesis derives
the demand by an optimization
problem, producing a demand
function:ikik
ik
a
ik
ik
ikikik DXPaDησ σ
1,−=Lauri Hetemäki & Michael Obersteiner, “US Newsprint Demand Forecasts to 2020,”
supported by Fisher Center for the Strategic Use of Information Technology.
295
Newspaper Circulation Model
• Rests on logical reasoning:
If more people read
newspapers → newspaper
circulation will increase →
higher demand for newsprint.
Lauri Hetemäki & Michael Obersteiner, “US Newsprint Demand Forecasts to 2020,”
supported by Fisher Center for the Strategic Use of Information Technology.
296
• Since 1987, there has been a
decline in the volume of
newspaper circulation.
Lauri Hetemäki & Michael Obersteiner, “US Newsprint Demand Forecasts to 2020,”
supported by Fisher Center for the Strategic Use of Information Technology.
*
297
• The logarithmic form of this
model is:
ttnewstnewstnews dcircd µγγγ ++∆+= − )ln()ln()ln( 1,2,10,
*
12
298
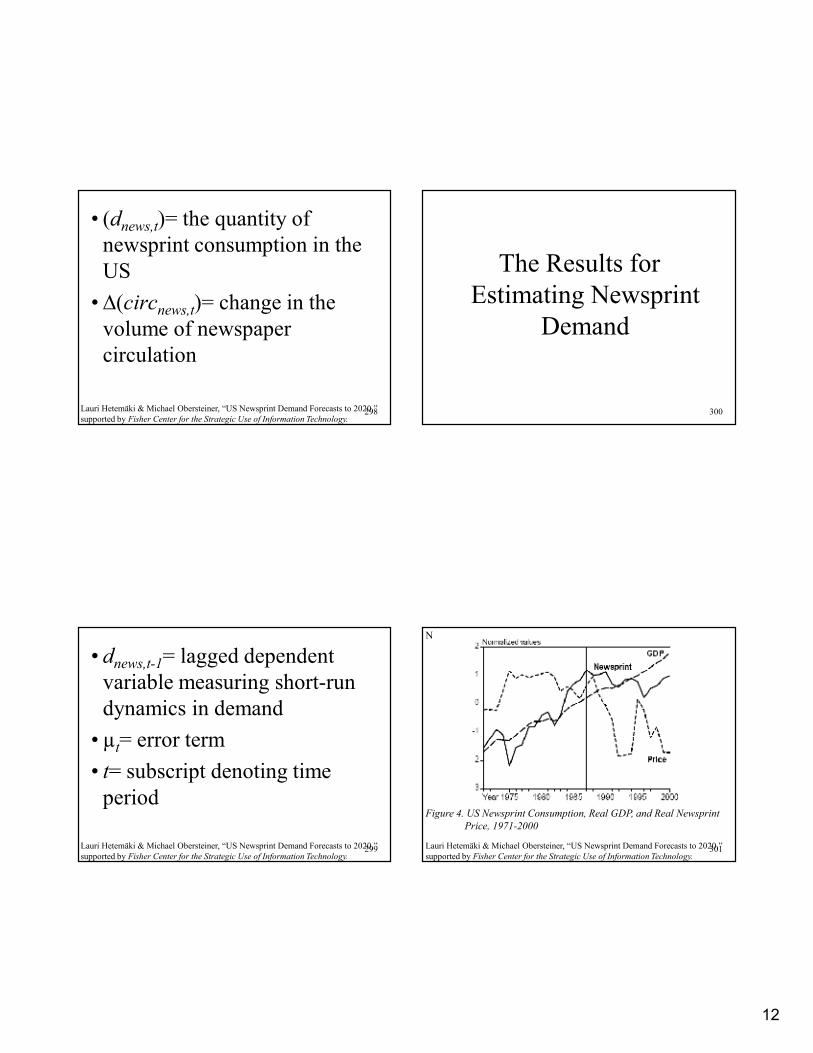
• (dnews,t)= the quantity of
newsprint consumption in the
US
• ∆(circnews,t)= change in the
volume of newspaper
circulation
Lauri Hetemäki & Michael Obersteiner, “US Newsprint Demand Forecasts to 2020,”
supported by Fisher Center for the Strategic Use of Information Technology.
299
• dnews,t-1= lagged dependent
variable measuring short-run
dynamics in demand
• µt= error term
• t= subscript denoting time
period
Lauri Hetemäki & Michael Obersteiner, “US Newsprint Demand Forecasts to 2020,”
supported by Fisher Center for the Strategic Use of Information Technology.
300
The Results for
Estimating Newsprint
Demand
301
Figure 4. US Newsprint Consumption, Real GDP, and Real Newsprint
Price, 1971-2000
N
Lauri Hetemäki & Michael Obersteiner, “US Newsprint Demand Forecasts to 2020,”
supported by Fisher Center for the Strategic Use of Information Technology.

13
302N
Lauri Hetemäki & Michael Obersteiner, “US Newsprint Demand Forecasts to 2020,”
supported by Fisher Center for the Strategic Use of Information Technology.
303
3. Newspaper Circulation
Model• The absolute value in the changes
in newspaper circulation
parameter show that a 1%
increase in circulation would lead
to a very large (3.1%) increase in
demand for newsprintLauri Hetemäki & Michael Obersteiner, “US Newsprint Demand Forecasts to 2020,”
supported by Fisher Center for the Strategic Use of Information Technology.
*
304Lauri Hetemäki & Michael Obersteiner, US Newsprint Demand
Forecasts to 2020, p.30.
*
305
Conclusions
• The Classical forest products
demand model could not
explain the recent structural
change in the US newsprint
consumption.
Lauri Hetemäki & Michael Obersteiner, US Newsprint Demand
Forecasts to 2020, p.32.

14
306Lauri Hetemäki & Michael Obersteiner, US Newsprint Demand Forecasts to 2020, p.31.
307
Conclusions
• Both GDP and newsprint price
proved to be insignificant
determinants of demand.
• Results also point out that a
negative income elasticity is
possible.Lauri Hetemäki & Michael Obersteiner, US Newsprint Demand
Forecasts to 2020, p.32.
308
309
Interpretation of Results– Rule of thumb: t-stats >2 or <-2
a statistically significant
difference (reject null)
– Most software reports t-test
where β0=0. In general “a
parameter is statistically
significant” means that it is
statistically different from 0
15
310
Interpretation of Results
• R-square
– Measure of overall fit of the
model: what percent of the
observed variation in the
dependent variable explained
by independent variables
(rather than error term)
311
Problems of Econometric Demand Estimation
• Data
–Often insufficient
–Often unreliable
*
312
• Need to assume a specific
mathematical model for the
relationship between price and sale.
• If specification is incorrect, the
results will be incorrect
• Predicting the future requires
assumption that behavior is like the
past.Thomas T. Nagle & Reed K. Holden, “The Strategy and Tactics of Pricing: A Guide to Profitable
Decision Making,” Second Edition 1995
*
313
• Model
–is the model that is estimated properly defined and coherent?
–Is it stable?
Problems of Econometric Demand Estimation
16
314
Other Types Of Models For
Econometric Demand
Estimation• Inverse• Stone-Geary• Quadratic• Stochastic• Discrete• Dynamic• Inter-temporal
•Engel•Log-linear•Semi-log•Constant elasticity•2 stage least
square•Etc., etc.
315
• Econometric problems–Serial correlation–Multicollinearity–Homoscedasticity–lags–exogeneity
Problems of Econometric Demand Estimation
*
316
Problems of Econometric Demand Estimation
• Results–statistically significant?–conclusion justified?–Can one claim causality–stable over time, for forecasting?
*