appendix d: rail alternatives -...
TRANSCRIPT

DRAFT Technical Report RAILYARD ALIGNMENT AND BENEFITS STUDY
Appendix D: Economic Analysis of Rail Alternatives

D R A F T M E M O R A N D U M
To: Joe Speaks, CH2M
From: Darin Smith and Jenny Lin
Subject: Preliminary Land Value Analysis for RAB Project; EPS #141018
Date: May 31, 2016
In t roduc t ion and Purpose
As a sub-consultant to CH2M, EPS has been retained to conduct economic and fiscal analyses related to the Railyard Alternatives and I-280 Boulevard Feasibility Study (RAB). The San Francisco Planning Department is leading the RAB project and is seeking input on alternatives currently under review for major mobility improvements in the fast-growing Mission Bay/South of Market area of the City, including Caltrain and High Speed Rail and converting the northern end of I-280 into a surface boulevard. This draft memorandum builds upon the methodology and findings of EPS’s similar study of the site in 2012 and provides an updated initial analysis of the land value per developable building square foot of residential and non-residential uses for a “generic” parcel in the vicinity of the 4th and King site. These “generic” findings can be applied to different sites that may be identified through the ongoing planning process, including the 4th and King site itself as well as others that may be developable as a result of related activities including changes to Interstate 280 and alternative routes for train service and stations.
In this updated memorandum, EPS used the results of this research to estimate the comparative land value of three alternative sites and configurations. These configurations include two Railyards site scenarios (partial electrification and full electrification) and one Boulevard site scenario. It is noted that these estimates do not authoritatively determine the value of the sites, for which further planning and due diligence work would be required.
page D-1

Draft Memorandum May 31, 2016 Preliminary Land Value Analysis for RAB Project Page 2
P:\141000s\141018 4thKingRAB\Report\Memo053116.docx
Methodo logy
Land transactions provide an important indicator of a property’s value as a development site. Land sale prices reflect the full spectrum of a site’s unique attributes: size, locational quality, state of entitlements, potential development density, allowable uses, and costs for construct on the site, among others. Reviewing actual land sales provides important information on how the marketplace is valuing developable land. As a land valuation tool, the “comparables” approach is limited to the number of transactions that have actually taken place and the extent to which the transactions are similar to the conditions of the subject property.
In selecting recent land sales for review, EPS has examined those as similar to the 4th and King site as possible. Specifically, sales conforming to the following criteria are included in Figure 1 and Table 1:
Near 4th and King. The land sales included in the table include sales all within close proximity of the site, either in South of Market, Mission Bay, Potrero Hill, or Central Waterfront areas.
Recently sold. Land sales are relatively recent, ranging in sale dates from 2005 to current transactions. The results are categorized by year to identify temporal trends in pricing.
Diversity of programs. Sales examined include residential, commercial, and mixed-use programs.
Medium-to high-density. What can be developed—from a regulatory, a physical, and a market perspective—is ultimately what drives the value of land. All of the land sales in the table reflect planned developments similar to the likely programs for the 4th and King site and associated opportunity sites, meaning multifamily housing, office, lodging, or other dense urban uses.
In total, EPS has identified 51 transactions meeting these criteria over the last 11 years.
Key F ind ings : La nd T ra nsa c t ions
The figures presented are general and intended to be used to compare site and alignment alternatives, not to represent specifics of any given property at any given time.
As shown in Table 1, the review of nearby, developable land sales indicate the following:
In general, land values have been trending upwards in price per acre for the last 11 years. Table 1 shows that in 2005-2008, 18 transactions averaged approximately $26.2 million per acre, but transactions slowed (only 12 transactions) during the recession of 2009-2012 and averaged only $13.2 million per acre, a 50 percent decrease from the previous period. Since 2013, however, transaction activity has quickened (21 transactions in three years) and land prices have risen well beyond their pre-recession rates to approximately $33.5 million per acre. These recent transactions include three “outliers” —the Park Tower, Salesforce Tower, and 535 Mission Street sites around the new Transbay Terminal, which allow much higher density than any of the other sites in the sample—that significantly skew the average land values upward on a per-acre basis.
page D-2

Draft Memorandum May 31, 2016 Preliminary Land Value Analysis for RAB Project Page 3
P:\141000s\141018 4thKingRAB\Report\Memo053116.docx
Because of the differences in allowable densities among these sample transactions, it is likely more instructive to consider the land values as they relate to allowable development. Over the past 11 years, commercial land in the subject area has transacted at an average of roughly $150 per buildable square foot, meaning a site on which a developer could build a 100,000-square foot building would sell for $15 million. Residential land has averaged roughly $97,000 per buildable unit during that same 11-year period, meaning a site on which 100 units could be built would sell for $9.7 million.
The more recent transactions from 2013 through 2015 yield higher values per square foot than the overall sample from the past 11 years. The more recent commercial values have averaged $174 per buildable square foot (vs. $154 for the 11-year sample), while the residential values have averaged $119,055 per buildable unit (vs. $96,953 for the 11-year sample).
The land transaction data indicate that land sold for lower-density residential projects (under 200 units per acre) consistently have yielded higher land values per buildable unit than land for projects over 200 units per acre. This may be because construction costs for higher density projects are greater than for lower-density projects, while achievable home values in higher-density projects may not fully offset the added construction costs.
The data for commercial transaction are less conclusive, as the three transactions yielding the highest land value per buildable square foot are also uniquely located near the Transbay Terminal and have extraordinary allowable density (FARs above 18.0), whereas all other commercial land transactions have lower than a 10.0 FAR and have more consistent values per buildable square foot. The three “outliers” therefore may represent uniquely attractive investments that may not be replicable on a typical parcel in the RAB study, except possibly on the 4th and King site itself if it is to have a high-capacity transit station as well as private development.
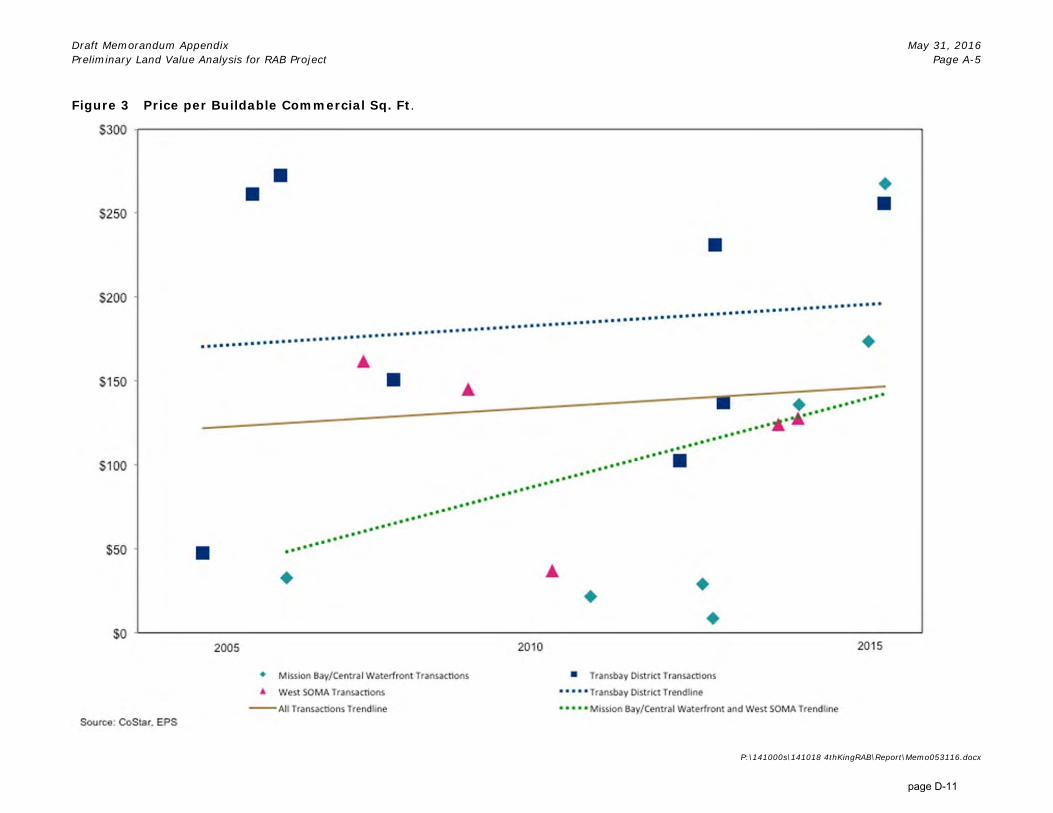
As shown in Figures 2 and 3, the transactions can be disaggregated by location, with separate indicators for the Mission Bay/Central Waterfront, Transbay District, and West SOMA areas shown on Figure 1. These geographic distinctions reveal that, in general, the highest land values both on a per-acre basis and a per-buildable commercial square foot basis have been in the vicinity of the new Transbay Terminal. These premium prices reflect both the additional density allowable in that area under the City’s Transit Center District Plan, and the value premiums frequently associated with proximity to major transportation hubs. These results are instructive in that they suggest that optimal land values at 4th and King and other sites would be realized if they are associated with significant transit services.
Figure 4 provides a similar geographic disaggregation for residential transactions on a per-unit basis, and indicates less clear geographic differences. In fact, the Transbay District area appears to have yielded somewhat lower land values per buildable residential unit than the overall sample. These trendlines are influenced by a few significant outliers, however, and in all geographic areas the great majority of transactions have been between $50,000 and $150,000 per buildable unit.
page D-3

Draft Memorandum May 31, 2016 Preliminary Land Value Analysis for RAB Project Page 4
P:\141000s\141018 4thKingRAB\Report\Memo053116.docx
The land transactions evaluated herein have occurred over a 10-year period that has featured both extraordinarily strong market conditions and an international recession. To estimate land values in a “stabilized” market condition, EPS believes it is most useful to apply the average values over the period, rather than assuming that currently strong values will necessarily continue. For purposes of comparing the land values that may apply to development of the 4th and King site or other sites in the RAB study, EPS recommends using the following assumptions:
Commercial:
o FAR 1-5: $127/Buildable Commercial Sq. Ft.
o FAR 5-10: $162/Buildable Commercial Sq. Ft.
o FAR 10+: $183/Buildable Commercial Sq. Ft.
o Because the Transbay area is demonstrating a clear premium on commercial land, assign a 10 percent premium to the figures above if the subject site is at a significant multi-modal transit station such as a 4th & King High-Speed Rail station.
Residential:
o 1-200 DU/Acre: $157,100/Buildable Residential Unit
o 200+ DU/Acre +: $77,500/Buildable Residential Unit
o Because the Transbay area is not demonstrating a clear premium on residential land pricing, no value premium is recommended for residential development at a multi-modal transit station at 4th & King or elsewhere.
Key F ind ings : La nd Va lua t ions
The previous figures have been applied to the Planning Department’s potential land use scenarios in order to estimate the land values associated with various sites that may be available for development. As shown in Table 4, the Planning Department has confirmed three possible scenarios, two Railyard site scenarios (partial electrification and full electrification) and one Boulevard site scenario. The full buildout of the partial electrification scenario for the Railyards site would include only commercial space (both retail and office), while full electrification of the site would replace some office uses with residential space. The Boulevard sites are currently assumed to be used for residential development. Using the projected programs of these scenarios, EPS estimated the floor area ratio for commercial development and units per acre for residential development and applied the appropriate buildable land values as noted in the previous section.
Partial electrification of the Railyards site is estimated to yield a higher potential value than full electrification of the site, despite having very similar total square footage of buildings. The land use program of the partial electrification scenario, based on historical trends,
page D-4

Draft Memorandum May 31, 2016 Preliminary Land Value Analysis for RAB Project Page 5
P:\141000s\141018 4thKingRAB\Report\Memo053116.docx
is estimated to yield $421.6 million, while the full electrification scenario is estimated to yield $281.4 million, reflecting that commercial development may yield higher values than residential land use.1
Based on our estimates, the Boulevard sites, designated entirely for residential development, are estimated to yield approximately $95.6 million at buildout.
Please note that these land values assume parcels are sold or leased for individual buildings rather than being a “bulk sale” that may yield a discount because the buildings would be phased and the developer would not realize their full financial returns in the short-term.
1 Assumes that an average residential unit is 1,200 gross square feet.
page D-5

APPENDIX
page D-6

Draft Memorandum Appendix May 31, 2016 Preliminary Land Value Analysis for RAB Project Page A-1
P:\141000s\141018 4thKingRAB\Report\Memo053116.docx
Figure 1 Recent Land Sales Near 4th and King (See Table 1 for location details)
page D-7

Table 1Summary Table
Property Name Acres Sq. Ft. Commercial Sq.
Ft. Residential
Unitsper Acre per Sq. Ft.
per Commercial Bldg. Sq. Ft.
per Unit
1 Mission Bay/Central Waterfront GSW Arena, LLC Golden State Warriors Arena 3rd St at 16th St 10/9/2015 $155,100,000 12.0 523,051 580,000 - 1.1 - $12,914,238 $297 $267 - MB-RA Office
2 Transbay District Park Tower Transbay Block 5 250 Howard St 10/6/2015 $172,500,000 0.6 26,353 675,000 - 25.6 - $282,786,885 $6,546 $256 - - Office3 West SOMA City & County of San Francisco 490 S Van Ness Ave 8/28/2015 $18,500,000 2.1 91,123 - 72 - 34.4 $8,851,675 $203 - $256,944 UMU Apartment/Condo
4 Mission Bay/Central Waterfront Kilroy Realty Corporation 100-170 Hooper St 7/7/2015 $78,000,000 3.3 143,064 450,000 - 3.1 - $23,780,488 $545 $173 - PDR-1-D Office
5 West SOMA Rodgers Street LLC 349 8th St 6/2/2015 $5,400,000 0.3 10,890 1,236 38 0.1 152.0 $21,600,000 $496 - $142,105 WMUG Mixed Use
6 West SOMA Pacific 1125 Market Corporation 1121-1125 Market St 5/22/2015 $19,800,000 0.3 12,401 - 150 - 535.7 $70,714,286 $1,597 - $132,000 C-3-G Apartment
7 Mission Bay/Central Waterfront 1000 Channel Street (SF) Owner, LLC 2 Acre Development Site 1000 Channel St 11/12/2014 $70,000,000 2.0 87,120 - 350 - 175.0 $35,000,000 $803 - $200,000 MB-RA Apartment
8 Mission Bay/Central Waterfront Ricardo Pimienta 595 Mariposa St 9/19/2014 $2,210,000 0.1 3,706 - 20 - 222.2 $24,555,556 $596 - $110,500 UMU Apartment/Condo
9 Mission Bay/Central Waterfront KR Mission Bay, LLC Block 40 1800 Owens St 6/2/2014 $95,000,000 3.3 141,413 700,000 - 5.0 - $29,230,769 $672 $136 - MB-RA Medical/Office
10 West SOMA MSP Property, LLC 949-965 Market St 5/30/2014 $48,000,000 1.1 46,173 375,000 - 8.1 - $45,283,019 $1,040 $128 - C3G, San Francisco Office/Retail
11 West SOMA V Shiplet Street LLC Shipley St at Falmouth St 5/21/2014 $1,705,000 0.1 5,445 - 15 - 115.4 $13,115,385 $313 - $113,667 MUR Mixed Use
12 West SOMA Monogram Residential 1401-1415 Mission St 5/9/2014 $12,800,000 0.3 11,425 - 121 - 465.4 $49,230,769 $1,120 - $105,785 - Apartment Units
13 West SOMA Mercer 1326 LLC3 1376 Harrison St 2/5/2014 $665,000 0.1 2,374 5,342 - 2.3 - $13,300,000 $280 $124 - WMUG Hold for Development
14 Mission Bay/Central Waterfront 945 Kansas St LLC 945-951 Kansas St 7/30/2013 $1,100,000 0.3 12,475 - 9 - 31.0 $3,793,103 $88 - $122,222 Rh2 Apartment Units
15 West SOMA Naughton P P & B A 2004 Trust 254 Shipley St 6/20/2013 $1,100,000 0.1 3,484 7,839 - 2.3 - $13,750,000 $316 $140 - MUR Mixed Use
16 Transbay District 201 Folsom Acquisition, LP 201 Folsom Site 201 Folsom St 6/10/2013 $73,000,000 1.7 75,358 - 655 - 378.6 $42,196,532 $969 - $111,450 RC-4 Apartment
17 Transbay District Salesforce Tower Transbay Tower Land 101 1st St 3/26/2013 $191,816,196 1.2 49,998 1,400,000 - 28.0 - $166,796,692 $3,836 $137 - P Office
18 Transbay District 535 Mission High Rise Office Site 531-539 Mission St 2/6/2013 $71,000,000 0.4 16,308 307,000 - 18.8 - $191,891,892 $4,354 $231 - C30, San Francisco Office
19 West SOMA 520 9th Street LLC 520 9th St 1/30/2013 $775,000 0.1 4,778 - 12 - 109.1 $7,045,455 $162 - $64,583 UMU Apartment
20 Transbay District UDR, Inc. Site for Residential Tower 399 Fremont St 1/28/2013 $20,200,000 0.9 37,897 - 452 - 519.5 $23,218,391 $533 - $44,690 RH DTR Apartment
21 Mission Bay/Central Waterfront Nibbi Brothers, Inc. 485 Irwin St 1/24/2013 $1,600,000 1.1 47,916 179,685 - 3.8 - $1,454,545 $33 $9 - PDR-1-D Parking Lot
22 Mission Bay/Central Waterfront 100 Hooper Fee Owner, LLC 100-170 Hooper St 11/28/2012 $12,500,000 3.3 143,064 427,000 - 3.0 - $3,810,976 $87 $29 - PDR-1-D Office
23 Transbay District Kilroy Realty Corporation 329 Brannan St 7/20/2012 $18,500,000 0.8 35,701 180,000 - 5.0 - $22,560,976 $518 $103 - SSO Office
24 Transbay District Fremont 325 Development, LLC 325 Fremont St 2/15/2012 $4,850,000 0.2 6,433 - 70 - 466.7 $32,333,333 $754 - $69,286 RH-DTR Apartment
25 Transbay District OM/UDR SF, LLC Site for Residential Tower 399 Fremont St 1/24/2012 $38,000,000 0.9 37,897 - 468 - 537.9 $43,678,161 $1,003 - $81,197 RH DTR Apartment
26 Mission Bay/Central Waterfront EQR - Mission Bay Block 13 LP Lot 13 - Development site 650-690 Long Bridge St 11/17/2011 $32,760,000 1.6 71,002 - 273 - 167.5 $20,098,160 $461 - $120,000 MB-RA Multifamily
27 West SOMA STS Investments, LLC 574 Natoma St 5/20/2011 $500,000 0.0 1,873 - 11 - 275.0 $12,500,000 $267 - $45,455 RED Multifamily
28 West SOMA Sylvester Carolan 1029 Natoma St 3/28/2011 $576,500 0.1 1,999 - 4 - 80.0 $11,530,000 $288 - $144,125 SLR Apartment/Condo
29 Mission Bay/Central Waterfront California College of the ArtsCalifornia College of the Arts Expansion Site
1100 7th St 2/24/2011 $8,400,000 2.4 102,801 385,504 - 3.8 - $3,559,322 $82 $22 - PDR-1-D Commercial
30 Transbay District 45 Lansing Development, LLC 45 Lansing St 8/24/2010 $12,500,000 0.3 14,997 - 217 - 638.2 $36,764,706 $834 - $57,604 RMU, San Francisco Apartment/Condo
31 West SOMA First California Investments 713 Brannan St 7/22/2010 $865,000 0.2 10,349 23,285 - 2.3 - $3,604,167 $84 $37 - SALI Parking Lot
32 West SOMA National American Health Ctr 80 Julian Ave 5/1/2009 $830,000 0.1 2,996 - 15 - 214.3 $11,857,143 $277 - $55,333 VALEN Apartment Units ...
33 West SOMA Golden Gate Partners LLC3 1376 Harrison St 3/25/2009 $775,000 0.1 2,374 5,342 - 2.3 - $15,500,000 $326 $145 - WMUG Hold for Development
34 West SOMA 55 Ninth, LLC 55 9th St 1/30/2008 $15,750,000 0.8 35,801 - 260 - 317.1 $19,207,317 $440 - $60,577 C-3-G, San Francisco Apartment/Condo
35 Transbay District Transbay Joint Powers Authority 200 Main St 1/23/2008 $6,488,720 0.2 9,548 42,966 - 4.5 - $29,494,182 $680 $151 - C3OSD Truck Terminal
36 West SOMA Jian Qiang Li and Jie Ying Ming 16-18 Brush Pl 8/1/2007 $450,000 0.0 1,481 2,777 - 1.9 - $15,000,000 $304 $162 - SLR Parking Lot
37 West SOMA Townsend Dev Partners 570 Townsend St 12/29/2006 $5,400,000 1.7 75,620 - 80 - 46.0 $3,103,448 $71 - $67,500 SLI Multifamily
38 West SOMA 1360-1364 Stevenson Street LLC Land 1360-1364 Stevenson St 10/6/2006 $1,400,000 0.1 3,541 - 5 - 62.5 $17,500,000 $395 - $280,000 CM, San Francisco Multifamily
39 Transbay District 60 Rausch, LLC 766 Harrison St 9/6/2006 $5,121,500 0.2 6,882 - 98 - 612.5 $32,009,375 $744 - $52,260 M1 Multifamily
40 Transbay District Turnberry Ltd. 45 Lansing St 8/7/2006 $30,000,000 0.3 14,997 - 265 - 779.4 $88,235,294 $2,000 - $113,208 RMU, San Francisco Apartment Units - Condo
41 Transbay District John S. Cooney SLI Zoned Lot 246 Ritch St 5/31/2006 $1,300,000 0.1 4,125 - 19 - 211.1 $14,444,444 $315 - $68,421 SLI, San Francisco Apartment Units - Condo
42 Mission Bay/Central Waterfront Potrero Hill Imaging, LLC3 Hold For Development Site 100 Texas St 5/19/2006 $1,665,000 0.3 13,503 50,636 - 3.8 - $5,370,968 $123 $33 - M1, San Francisco Hold for Development
43 Transbay District 535 Mission Street Property, LLC High Rise Office Site 531-539 Mission St 4/13/2006 $30,000,000 0.4 16,308 110,079 - 6.8 - $81,081,081 $1,840 $273 - C30, San Francisco Office
44 West SOMA Cal-Bay International, Inc.3 C-3S Zoned Lot 248-252 9th St 4/3/2006 $2,650,000 0.1 5,000 - 14 - 127.3 $24,090,909 $530 - $189,286 C-3S, San Francisco Hold for Development
45 West SOMA 299 Valencia Street, LLC Condominium Site 299 Valencia St 1/27/2006 $3,950,000 0.3 10,890 - 202 - 808.0 $15,800,000 $363 - $19,554 CM, San Francisco Apartment Units - Condo
46 Transbay District Transbay Joint Powers Authority Hold For Development Site 80 Natoma St 11/2/2005 $58,000,000 0.8 32,900 222,075 - 6.8 - $76,315,789 $1,763 $261 - C3O, San Francisco Hold for Development
47 Transbay District South Beach Partners, LLC 270 Brannan St 10/13/2005 $16,000,000 0.9 37,814 106 - 121.8 $18,390,805 $423 - $150,943 SSO, San Francisco Office
48 West SOMA 30 Dore, LLC 42 Unit Condominium Complex Site 24 Dore St 7/22/2005 $1,800,000 0.2 8,498 6,374 - 0.8 - $9,000,000 $212 $282 - RED-MX Apartment/Condo
49 West SOMA South Beach Partners, LLC Multi-Family Condominium Site 230-234 7th St 7/14/2005 $3,700,000 0.3 12,196 - 40 - 142.9 $13,214,286 $303 - $92,500 SLR, San Francisco Apartment/Condo
50 West SOMA Redevelopment Agency CCSF Multi Family Subsidized Units Site 275 10th St 6/27/2005 $4,000,000 0.5 20,473 - 134 - 285.1 $8,510,638 $195 - $29,851 C-M, San Francisco Apartment/Condo
51 Transbay District Chelsea King Street, LLC Hotel Site 144 King St 1/21/2005 $4,500,000 0.2 9,866 94,500 - 9.6 - $19,565,217 $456 $48 - M2, San Francisco Hotel
Total/ Average $1,363,502,916 48.3 2,103,681 6,231,639 4,175 12.6 419.4 $28,235,720 $648 $154 $96,953
Sold 2013-Current $1,040,271,196 31.06 1,352,752 4,681,102 1,894 15.3 367.9 $33,492,312 $769 $174 $119,055
Sold 2009-2012 $131,056,500 9.9 431,486 1,021,131 1,058 3.6 449.1 $13,238,030 $304 $40 $85,082
Sold 2005-2008 $192,175,220 7.33 319,443 529,407 1,223 6.7 473.3 $26,217,629 $602 $194 $72,994
Weighted Average excluding Outliers1 $928,186,720 46.2 2,011,022 3,849,639 4,175 4.3 419.4 $20,108,031 $462 $137 $96,953
Source: CoStar and Economic and Planning Systems, Inc.
[1] Outliers include the Park Tower, Salesforce Tower, and 535 Mission St.[2] EPS estimated the DU/Acre and FARs for sales with undisclosed data through investigation of local zoning requirements.
Proposed UseBuyer Company or Project ZoningLand Size Price per Land AreaBuildable Area Price per Buildable Area
Sale Price FAR2 DU/Acre2Property Address Sale DateNo. Zone
Economic & Planning Systems, Inc. 5/31/2016 P:\141000s\141018 4thKingRAB\Data\LandTransactions31016.xls
page D-8

Draft Memorandum Appendix May 31, 2016 Preliminary Land Value Analysis for RAB Project Page A-3
P:\141000s\141018 4thKingRAB\Report\Memo053116.docx
Figure 2 Price per Acre by Location
page D-9

Draft Memorandum Appendix May 31, 2016 Preliminary Land Value Analysis for RAB Project Page A-4
P:\141000s\141018 4thKingRAB\Report\Memo053116.docx
Table 2 Summary of Commercial Land Transactions
page D-10
Draft Memorandum Appendix May 31, 2016 Preliminary Land Value Analysis for RAB Project Page A-5
P:\141000s\141018 4thKingRAB\Report\Memo053116.docx
Figure 3 Price per Buildable Commercial Sq. Ft.
page D-11

Draft Memorandum Appendix May 31, 2016 Preliminary Land Value Analysis for RAB Project Page A-6
P:\141000s\141018 4thKingRAB\Report\Memo053116.docx
Table 3 Summary of Residential Land Transactions on Site
page D-12

Draft Memorandum Appendix May 31, 2016 Preliminary Land Value Analysis for RAB Project Page A-7
P:\141000s\141018 4thKingRAB\Report\Memo053116.docx
Figure 4 Price per Buildable Residential Unit
page D-13

Draft Memorandum Appendix May 31, 2016 Preliminary Land Value Analysis for RAB Project Page A-8
P:\141000s\141018 4thKingRAB\Report\Memo053116.docx
Table 4 Summary of Land Valuations by Site
Table 5 Valuation of Partial Electrification of Railyards Site
Scenario Office (Sq.Ft.)1 Commercial (Sq.Ft.)1
Residential (Sq.Ft.)1 Total Value
4th and KingPartial Electrification 2,429,346 114,821 - $421,632,894Full Electrification 1,055,068 114,821 1,459,804 $281,411,573
Boulevard - - 1,355,136 $95,558,800
Source: City of San Francisco and Economic and Planning Systems, Inc.
ItemOffice
(Sq.Ft.)1Commercial
(Sq.Ft.)1Total
(Sq.Ft.) Max Building
Footprint1Est. Land
Size (Acre)2Est. FAR
Est. Price per Sq.Ft.3
Total Value
K1 228,748 10,398 239,146 20,795 0.60 9.2 $162 $38,741,644K2 294,910 13,405 308,315 26,810 0.77 9.2 $162 $49,947,030K3 219,450 9,975 229,425 19,950 0.57 9.2 $162 $37,166,850K4 311,960 14,180 326,140 28,360 0.81 9.2 $162 $52,834,680T1 106,947 7,130 114,077 14,260 0.41 6.4 $162 $18,480,442T2 137,880 9,192 147,072 18,384 0.53 6.4 $162 $23,825,664T3 143,100 9,540 152,640 19,080 0.55 6.4 $162 $24,727,680T4 143,100 9,540 152,640 19,080 0.55 6.4 $162 $24,727,680T5 396,928 26,462 423,390 52,924 1.52 6.4 $162 $68,589,1154th/King Tower 446,323 5,000 451,323 21,505 0.62 16.8 $183 $82,592,109Total 2,429,346 114,821 2,544,167 6.92 $421,632,894
1 Provided by the City of San Francisco, Planning Department.
3Average price per buildable commercial sq.ft. in the category 5-10 FAR is $162 and $183 for FAR 10+.
Source: City of San Francisco and Economic and Planning Systems, Inc.
2 Assumes that max building footprint is 80% of total land size. This assumption was confirmed by the City of San Francisco Planning Department.
page D-14

Draft Memorandum Appendix May 31, 2016 Preliminary Land Value Analysis for RAB Project Page A-9
P:\141000s\141018 4thKingRAB\Report\Memo053116.docx
Table 6 Valuation of Full Electrification of Railyards Site
Table 7 Valuation of Boulevard Sites
Est. Price per Unit4 Total Value
Est. Price per Unit5 Total Value
K1 228,748 10,398 - 239,146 - 20,795 0.60 9.2 - $162 $38,734,835 - -K2 294,910 13,405 - 308,315 - 26,810 0.77 9.2 - $162 $49,938,252 - -K3 219,450 9,975 - 229,425 - 19,950 0.57 9.2 - $162 $37,160,318 - -K4 311,960 14,180 - 326,140 - 28,360 0.81 9.2 - $162 $52,825,395 - -T1 - 7,130 99,817 7,130 83 14,260 0.41 0.4 203.3 $127 $903,577 $77,500 $6,446,528T2 - 9,192 128,688 9,192 107 18,384 0.53 0.4 203.3 $127 $1,164,924 $77,500 $8,311,100T3 - 9,540 133,560 9,540 111 19,080 0.55 0.4 203.3 $127 $1,209,027 $77,500 $8,625,750T4 - 9,540 133,560 9,540 111 19,080 0.55 0.4 203.3 $127 $1,209,027 $77,500 $8,625,750T5 - 26,462 370,466 26,462 309 52,924 1.52 0.4 203.3 $127 $3,353,573 $77,500 $23,925,9234th/King Tower - 5,000 593,713 5,000 495 21,505 0.62 0.2 801.7 $127 $633,662 $77,500 $38,343,932Total 1,055,068 114,821 1,459,804 1,169,890 1,217 6.92 $187,132,591 $94,278,983
1Provided by the City of San Francisco, Planning Department.2 Assumes an average of 1,200 gross sq.ft. per unit.
4 Average price per buildable commercial sq.ft. in the category 1-5 FAR is $127 and for 5-10 FAR is $162.5 Average price per buildable residential unit in the category 200+ DU/AC is $77,500.
Source: City of San Francisco and Economic and Planning Systems, Inc.
3 Assumes that max building footprint is 80% of total land size. This assumption was confirmed by the City of San Francisco Planning Department.
Est. FAR
Est. DU/AC
Commercial Residential Item
Office (Sq.Ft.)1
Commercial (Sq.Ft.)1
Residential (Sq.Ft.)1
Total Commercial
(Sq.Ft.)
Total Residential
(Units)2
Max Building Footprint1
Est. Land Size (Acre)3
Item Residential (Sq.Ft.)
Total Residential
(Units)1
Max Building Footprint
Est. Land Size (Sq.Ft)2
Est. Land Size (Acre)
Est. DU/AC
Est.Price per Unit3 Total Value
B1 204,597 170 25,575 31,968 0.73 232.3 $77,500 $13,213,556B2 183,934 153 22,992 28,740 0.66 232.3 $77,500 $11,879,071B3-Base 121,200 101 30,300 37,875 0.87 116.2 $157,100 $15,867,100B3-Tower 192,000 160 12,000 15,000 0.34 464.6 $77,500 $12,400,000B4 406,917 339 45,213 56,516 1.30 261.4 $77,500 $26,280,056B5 246,488 205 27,388 34,234 0.79 261.4 $77,500 $15,919,017Total 1,355,136 1,129 204,334 4.69 $95,558,800
1 Assumes an average of 1,200 gross sq.ft. per unit.2 Assumes that max building footprint is 80% of total land size. This assumption was confirmed by the City of San Francisco Planning Department. 3 Average price per buildable residential unit in the category 1-200 DU/AC is $157,100 and $77,500 for the category 200+ DU/AC.
Source: City of San Francisco and Economic and Planning Systems, Inc.
page D-15