appendix e health risk assessment technical report...5750 hollywood boulevard project health risk...
TRANSCRIPT

APPENDIX E – HEALTH RISK ASSESSMENT TECHNICAL REPORT


HEALTH RISK ASSESSMENT TECHNICAL REPORT
FortheProposed5750HollywoodBoulevardProject5732‐5766HollywoodBoulevard
LosAngeles,CA
Preparedfor:
5750 HOLLYWOOD BOULEVARD, LLC 9663SantaMonicaBoulevard
Suite974BeverlyHills,CA90210
Preparedby:
PCRSERVICESCORPORATION201SantaMonicaBoulevard,Suite500
SantaMonica,CA90401TEL310.451.4488FAX310.451.5279
October2015


5750HollywoodBoulevardProject HealthRiskAssessmentTechnicalReportPCRServicesCorporation
ACRONYMS AND ABBREVIATIONS
Acronym Description
Basin SouthCoastAirBasin
CARB CaliforniaAirResourcesBoard
CEQA CaliforniaEnvironmentalQualityAct
City CityofLosAngeles
CPF CancerPotencyFactor
DPM dieselexhaustparticulatematter
HARP HotspotsAnalysisandReportingProgram
HRA HealthRiskAssessment
MATESIV MultipleAirToxicsExposureStudy,May2015
SCAQMD SouthCoastAirQualityManagementDistrictTAC toxicaircontaminants
USEPA UnitedStatesEnvironmentalProtectionAgency


5750HollywoodBoulevardProject HealthRiskAssessmentTechnicalReportPCRServicesCorporation i
Table of Contents
Page
ACRONYMSANDABBREVIATIONS....................................................................................................................................1
EXECUTIVESUMMARY.....................................................................................................................................................ES‐1
1.0INTRODUCTION...............................................................................................................................................................1 1.1 ProjectDescription...............................................................................................................................................................1 1.2 ExistingAirQualityConditions.......................................................................................................................................1
2.0REGULATIONSANDSIGNIFICANCETHRESHOLDS...............................................................................................5 2.1 RegulatorySetting................................................................................................................................................................5
3.0METHODOLOGY...............................................................................................................................................................7 3.1 SourceIdentification(HollywoodFreeway).............................................................................................................7 3.2 EmissionsCalculations(HollywoodFreeway).........................................................................................................7 3.3 DispersionModeling(HollywoodFreeway)..............................................................................................................8 3.4 CancerRiskandHealthRiskCalculations(HollywoodFreeway)....................................................................8
4.0IMPACTANALYSIS........................................................................................................................................................13
5.0SUMMARYOFRESULTS..............................................................................................................................................15
APPENDICES
APPENDIXA:HEALTHRISKASSESSMENTWORKSHEETSANDOUTPUTFILES
List of Figures
Figure Page
ES‐1 VicinityLocationMap..................................................................................................................................................ES‐3 1 SiteAerialPhotograph.......................................................................................................................................................3 2 Source‐ReceptorDiagram.................................................................................................................................................9
List of Tables
Table Page
ES‐1 MaximumCancerRiskImpactforOn‐siteSensitiveReceptors.................................................................ES‐1 1 FreewayandRampTrafficVolumes.............................................................................................................................7 2 OEHHARecommendedResidentialDailyBreathingRatesforPointEstimateDose
Calculations(L/kgbodyweight)..............................................................................................................................11 3 OEHHARecommendationsforFractionofTimeatHome(FAH)forEvaluatingResidential
CancerRisk..........................................................................................................................................................................12 4 SummaryofCarcinogenicRisksforOn‐siteSensitiveReceptors.................................................................13


5750HollywoodBoulevardProject HealthRiskAssessmentTechnicalReportPCRServicesCorporation ES‐1
EXECUTIVE SUMMARY
The purpose of this Health Risk Assessment Technical Report is to assess and discuss the impacts ofpotentialtoxicaircontaminantsthatmayimpacton‐siteresidentsatthe5750HollywoodBoulevardProject.5750HollywoodBoulevard,LLC,theApplicant,proposesamixed‐usedevelopmentona1.10‐acrepropertyat5732‐5766HollywoodBoulevard(theProjectSiteorSite)intheHollywoodcommunityoftheCityofLosAngeles (the Project). The applicant has retained PCR Services Corporation (PCR) to conduct acomprehensive Health Risk Assessment for the proposed Project. In accordance with the requirementsundertheCaliforniaEnvironmentalQualityAct(CEQA),thisTechnicalReportprovidesanestimateofhealthimpactstoon‐sitefutureresidentsduetoemissionsfromthenearby101Freeway.
TheProjectSiteshowninFigureES‐1,VicinityLocationMap,islocatedintheHollywoodcommunityoftheCity of LosAngeles. The applicant proposes to developnew structures for the Site. This includes anewmulti‐family complex, underground parking structure, and street‐level retail. The buildings and parkingstructures will be spread throughout the site and are not adjacent to each other. The Project includesexcavationforsubterraneanparking,andconstructionofbuildings.
TheHealth Risk Assessment includes three separate components: 1) Emissions inventory; 2)DispersionModeling; and3)HealthRiskCalculations. Emissions from the101Freewaywerecalculatedusing trafficdata obtained from the California Department of Transportation (Caltrans) Performance MeasurementSystem (PeMS) database and emission factors from the California Air Resources Board (CARB) EMFACmodel. Dispersion modeling was performed using the US Environmental Protection Agency (USEPA)AERMODmodel with meteorological data from the closest South Coast Air Quality Management District(SCAQMD)monitoringstation. Sensitivereceptorsusedformodelingwereplacedatthelocationof futureresidential buildings. Health risk calculations were performed using the CARB Hotspots Analysis andReportingProgram(HARP),version2.
As shown inTableES‐1,MaximumCancerRiskImpactforOn‐siteSensitiveReceptors, below, cancer riskatthe maximum impacted receptor was below the SCAQMD significance threshold of 10 in one million.Therefore, impacts to on‐site receptors were less than significant and no mitigation measures werenecessary.
Table ES‐1
Maximum Cancer Risk Impact for On‐site Sensitive Receptors
Risk Scenario Carcinogenic Risk Per One Million*
MaximumExposedIndividual(MEI)(closesttofreeway)
6.8
SCAQMDSignificanceThreshold 10ExceedThreshold? No
Source:PCRServicesCorporation,2015

Executive Summary October 2015
5750HollywoodBoulevardProject AirQualityTechnicalReportPCRServicesCorporation ES‐2
Thispageintentionallyblank.

£¤101
Hollywood Boulevard
PROJECT SITE
FIGURE
Source: ESRI Street Map, 2009; PCR Services Corporation, 2015.
0 500 1,000 Feet
5750 Hollywood Boulevard Project
Regional Vicinity Mapo ES-1
^PROJECT
SITE£¤101

Executive Summary October 2015
5750HollywoodBoulevardProject AirQualityTechnicalReportPCRServicesCorporation ES‐4
Thispageintentionallyblank.

5750HollywoodBoulevardProject HealthRiskAssessmentTechnicalReportPCRServicesCorporation 1
1.0 INTRODUCTION
1.1 PROJECT DESCRIPTION
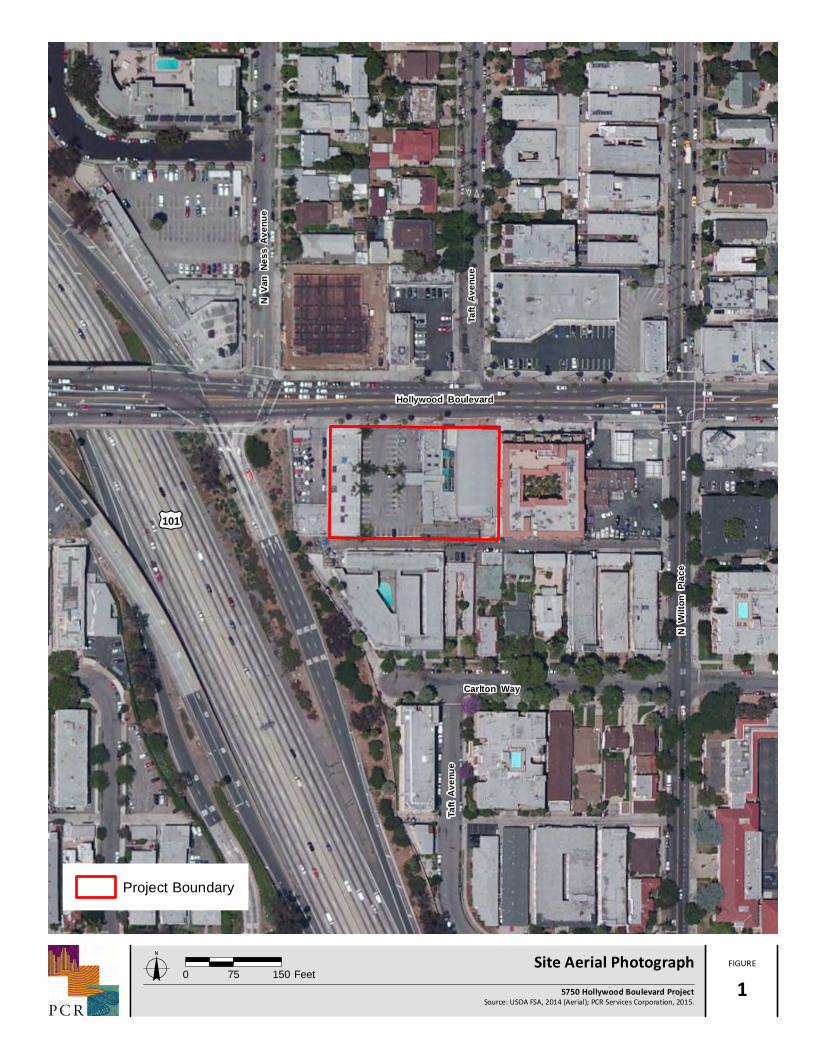
TheProject Site is immediatelyborderedbyHollywoodBoulevard to thenorth, an alley to the south, thefour‐storyHollywoodViewTowersmixed‐useresidentialandretaildevelopmenttotheeast,andtheSaab&RaffiautomotiverepairshopandHollywoodFreeway(US101)embankmentandnorthboundexitramptothewest,asshownintheaerialphotographpresentedinFigure1,SiteAerialPhotograph.Landusestothenorth,acrossHollywoodBoulevard,includetheHollywoodSeventh‐DayAdventistChurch,LosAngelesFireDepartment Station No. 82, a single‐story commercial corner development with neighborhood‐servingcommercialuses,andaPierOneretailstore.Landusestothesouth,acrossthealleyfromtheProjectSite,consist ofmulti‐family apartment buildings and single‐family residences. Landuses to the east andwestalongHollywoodBoulevardarepredominantlycommercialwithsomemulti‐familyresidentialdevelopment.
TheProjectSite isgenerally flat,withagentleslopeof less than twopercent to thesouthandanaverageelevationofapproximately390feetabovemeansealevel.TheProjectSitecurrentlycontainstwobuildings,5766HollywoodBoulevardand5750HollywoodBoulevard,separatedbyasurfaceparkinglot.Theparkinglot is accessed via twodriveways onHollywoodBoulevard. 5766HollywoodBoulevard consists of a one‐story brick building constructed in 1924 and occupying the western end of the Project Site. The 8,750‐square‐foot building, designed by the architectural firm of Morgan, Walls & Clements as an automobileshowroom,wasmostrecentlyusedbytheneighboringSaab&Raffiautomotiverepairshopinconjunctionwiththeiroperationsontheadjoiningparceltothewestuntilearly2014,whenthebuildingwasvacated.
The Project would redevelop the Site with a seven‐story mixed‐use building housing 161 residentialdwellings, including five live/work or shopkeeper units and 14 affordable housing units, totalingapproximately 168,956 square feet.1,2 A total of 271automobile parking spaces and 96bicycle parkingspaceswouldbeprovidedwithintwosubterraneanparkinglevelsandoneat‐gradelevel. DevelopmentoftheProjectwouldinvolvedemolitionofthetwoon‐sitebuildingsandsurfaceparkinglot.
The overall project will include total demolition of 23,528 GSF of existing buildings and the addition of168,956GSFofnewBuildingsplus271parkingspaces.
1.2 EXISTING AIR QUALITY CONDITIONS
TheSCAQMDhasreleasedadraftfinalBasin‐wideairtoxicsstudy(MATESIV,MultipleAirToxicsExposureStudy,May2015). TheMATESIVStudyrepresentsoneof themostcomprehensiveair toxicsstudieseverconducted in an urban environment. The Study was aimed at estimating the cancer risk from toxic airemissionsthroughouttheBasinbyconductingacomprehensivemonitoringprogram,anupdatedemissionsinventoryoftoxicaircontaminants,andamodelingefforttofullycharacterizehealthrisksforthoselivinginthe Basin. The Study concluded that the average carcinogenic risk from air pollution in the Basin is1 Thisarea is themaximumgross floorarea forFARpurposes,calculated inaccordancewithLosAngelesMunicipalCode (LAMC)
Section 12.03, and excludes basement storage, vertical circulation including stairways and elevator shafts, rooms housingmechanicalequipment,parkingandassociatedcirculation,service/mechanicalequipment,lightcourtsandareas“opentobelow”inthemainlobbyandresidentialdwellingmezzanines.
2 Themaximum gross floor area for FAR purposes includes a by‐right density bonus of 35percent over the otherwise allowablemaximumdensitypermittedinaccordancewithLAMCSection12.22.A.25fordesignating11percent(14units)ofthebasepermittedunitsforVeryLowIncomehouseholds.
1.0 Introduction October 2015
5750HollywoodBoulevardProject HealthRiskAssessmentTechnicalReportPCRServicesCorporation 2
approximately420inonemillion.Mobilesources(e.g.,cars,trucks,trains,ships,aircraft,etc.)representthegreatest contributors. Approximately 75 percent of the risk is attributed to diesel particulate emissions,approximately20percenttoothertoxicsassociatedwithmobilesources(includingbenzene,butadiene,andformaldehyde), and approximately 5 percent of all carcinogenic risk is attributed to stationary sources(whichincludeindustriesandothercertainbusinesses,suchasdrycleanersandchromeplatingoperations).
As part of theMATES IV study, the SCAQMDhas prepared a series ofmaps that show regional trends inestimatedoutdoorinhalationcancerriskfromtoxicemissions,aspartofanongoingefforttoprovideinsightinto relative risks. The maps’ estimates represent the number of potential cancers per million peopleassociatedwitha lifetimeofbreathingair toxics (24hoursperdayoutdoors for70years) inpartsof thearea.TheMATESIVwebinteractivemapisthemostrecentlyavailablemaptorepresentexistingconditionsneartheProjectarea. Theestimatedcancerriskisapproximately471cancerspermillion.3Generally,theriskfromairtoxicsislowernearthecoastline;increasinginland,withhigherrisksconcentratednearlargedieselsources(e.g.,freeways,airports,andports).
3 South Coast Air Quality Management District, Multiple Air Toxics Exposure Study Iv – Model Estimated Cancer Risk, (2015),
http://www3.aqmd.gov/webappl/OI.Web/OI.aspx?jurisdictionID=AQMD.gov&shareID=73f55d6b‐82cc‐4c41‐b779‐4c48c9a8b15b.AccessedJune23,2015.
£¤101
Hollywood Boulevard
N W
ilton
Place
Carlton Way
Taft
Aven
ue
N Va
n Ne
ss A
venu
e
Taft
Aven
ue
FIGURE
Source: USDA FSA, 2014 (Aerial); PCR Services Corporation, 2015.
0 75 150 Feet
5750 Hollywood Boulevard Project
Site Aerial Photographo 1
Project Boundary

1.0 Introduction October 2015
5750HollywoodBoulevardProject HealthRiskAssessmentTechnicalReportPCRServicesCorporation 4
Thispageintentionallyblank.

5750HollywoodBoulevardProject HealthRiskAssessmentTechnicalReportPCRServicesCorporation 5
2.0 REGULATIONS AND SIGNIFICANCE THRESHOLDS
2.1 REGULATORY SETTING
Certainairpollutantshavebeenrecognizedtocausenotablehealthproblemsandconsequentialdamagetothe environment either directly or in reaction with other pollutants, due to their presence in elevatedconcentrationsintheatmosphere.Suchpollutantshavebeenidentifiedandregulatedaspartoftheoverallendeavor to prevent further deterioration and facilitate improvement in air quality. The SCAQMDperiodicallyassesseslevelsoftoxicaircontaminants(TACs)intheAirBasin.ATACisdefinedbyCaliforniaHealthandSafetyCodeSection39655:
“Toxicaircontaminant”meansanairpollutantwhichmaycauseorcontributetoanincreaseinmortalityorinseriousillness,orwhichmayposeapresentorpotentialhazardtohumanhealth.Asubstancethatislistedasahazardousairpollutantpursuanttosubsection(b)ofSection112ofthefederalact(42U.S.C.Sec.7412(b))isatoxicaircontaminant.
TACsrefertoadiversegroupofairpollutantsthatarecapableofcausingchronic(i.e.,oflongduration)andacute (i.e., severe but of shortduration) adverse effects onhumanhealth. TACs includeboth organic andinorganic chemical substances thatmay be emitted from a variety of common sources including gasolinestations,motorvehicles,drycleaners,industrialoperations,paintingoperations,andresearchandteachingfacilities.TACsaredifferent than “criteria”pollutants in that ambient airquality standardshavenotbeenestablishedforTACs,largelybecausetherearehundredsofairtoxics,andtheireffectsonhealthtendtobefeltonalocalscaleratherthanonaregionalbasis.
In 1998, The California Environmental Protection Agency (CalEPA) identified diesel exhaust particulatematter(DPM)asatoxicaircontaminantbasedonitspotentialtocausecancer,prematuredeath,andotherhealthproblems.ThegreatestpotentialforTACemissionsduringconstructionisrelatedtodieselparticulatematteremissionsassociatedwithheavy‐dutyequipment.Duringlong‐termoperations,sourcesofDPMmayincludeheavydutydieseltrucksandstationaryemergencygenerators.
The City of Los Angeles Planning Commission has considered implications of living in close proximity tofreeways. At the requestof thePlanningCommission,Planning staffpreparedanadvisorynotice to alertapplicants toconsiderpublichealth implicationsof freeway‐adjacentprojects.4 Inpreparing thisadvisorynotice, Planning staff has research and studies documenting health impacts to occupants living and/orworkingnearfreeways.Basedonthelinkbetweenhealthimpactsanddistancefromfreeways,theadvisorynoticeprovidesrecommendedbufferdistancestoprotectnewsensitiveusesplacednearfreeways.
As part of this advisory notice, the City Planning Commission advises that projects requiring an EIR andwhich place sensitive receptors in close proximity (1,000 feet) to a freeway perform a Health RiskAssessment(HRA)asasupplementaltechnicalreport.TheresultsoftheHRAwouldprovideinformationtotheCityandapplicantregardinghealthimpactsandallowtheapplicanttomakeaninformeddecisionaboutsiteplanninganddesign.TheCommissionmayalsoconsiderrequirementsincludingenhancedfiltrationoradjustmentstobuildingorientation,operablewindowsandscreeningwithvegetation.
4 AdvisoryNoticetoApplicants–AddendumtoJanuary26,2012Report.LosAngelesCityPlanningCommission.October2012.

2.0 REgulations and Significance Thresholds October 2015
5750HollywoodBoulevardProject HealthRiskAssessmentTechnicalReportPCRServicesCorporation 6
In order to determine the Project’s consistency with the City’s Advisory Notice for Freeway‐Adjacentprojects and CARB’s recommendations, an HRA was prepared to assess the consistency of the proposedsitingofnewresidential landuses inproximity to theHollywood freeway,asubstantialexistingsourceofTACs. TheHRAWorksheets, included inAppendixAof thisTechnicalReport,evaluate thechroniccancerrisk and health effects of TACs associated with diesel‐powered trucks emitting diesel particulate matter(DPM)alongtheHollywoodFreeway,inproximitytopotentialresidentsoftheProject.
AlthoughtheCity’sAdvisoryNoticedoesnotestablishsignificancethresholds,theCityofLosAngelesCEQAThresholdsGuideandtheSCAQMDhasestablishedthatasignificantimpactwouldoccuriftheprojectwouldexposesensitivereceptorstotoxicaircontaminantsresultinginanincrementalcancerriskimpactgreaterorequalto10inonemillion.

5750HollywoodBoulevardProject HealthRiskAssessmentTechnicalReportPCRServicesCorporation 7
3.0 METHODOLOGY
3.1 SOURCE IDENTIFICATION (HOLLYWOOD FREEWAY)
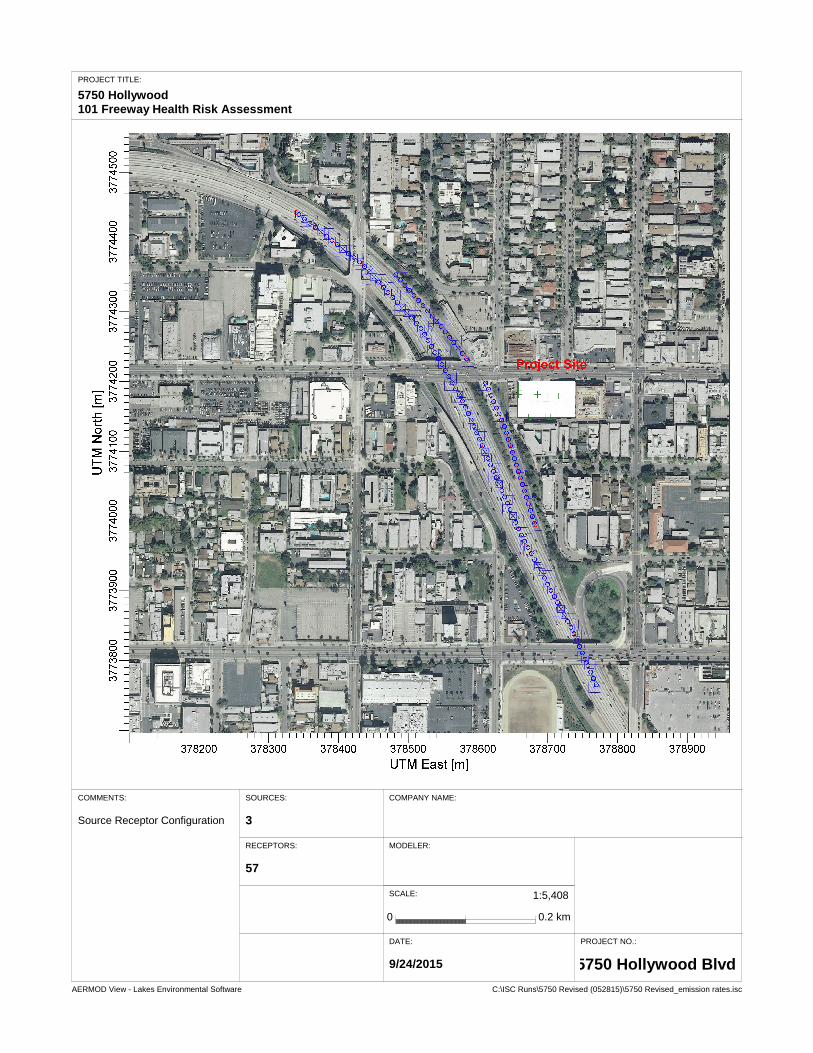
TheCaliforniaDepartmentofTransportation(Caltrans)PerformanceMeasurementSystem(PeMS)collectsandmaintainstrafficvolumecountsforvehiclestraversingtheCaliforniastatehighwaysystem.Consistentwith SCAQMD recommendations, the roadway segment lengths analyzed in this study were determinedbasedonfreewaysegmentslocatedwithinanapproximate0.25‐mileradiusoftheProjectSiteboundaries.As shown in Figure 2, Source Receptor Diagram, a 0.25 mile radius was selected based on SCAQMDrecommendations for sitingsourcesof toxics in relation tosensitive receptors (schools, residentialuses).5Table1,FreewayandRampTrafficVolumes,presentstheannualaveragedailytrafficvolumes(AADT)andpeakhourtrafficvolumesforthefreewaysegmentsconsideredinthisassessment.
3.2 EMISSIONS CALCULATIONS (HOLLYWOOD FREEWAY)
Vehicle traffic and speeddatawasobtained from theCaltransPeMSdatabase for theUS‐101mainline, aswellason‐andoff‐rampswithinaquartermileofthesite.VehicletrafficdataforYear2014wasobtainedforthesegmentoftheUS‐101mainlinewithin0.25mileofthesite.Hourlytrafficdatawasalsoobtainedtoaccountfortemporalvariationoftraffic flow. Anannualtrafficgrowthrateofonepercentwasappliedtoaccountforfuturetrafficflow.
Emission factorswere obtained from the CARBEMFAC2014 emissionsmodel. EMFACwas run for 2018through2047toidentifytheaverageDPMemissionfactorsfromheavy‐dutydieseltruckstypicaloftheUS‐101 over the lifetime of the project’s operations. Vehicle emission factors were calculated assumingexposuredurationof30years.Vehicleemissionswerethencalculatedforeachyearfrom2018(theyearofProject buildout and occupancy) through 2047 based on average traffic flow and vehicle speed along thestudysegment. Certainvehicleweight classes thatdonot travel along the101Freeway (i.e. agricultural)wereremovedfromtheaverageDPMemissionfactorcalculation.
5 AirQualityIssuesinSchoolSiteSelection,SouthCoastAirQualityManagementDistrict,June2005.
Table 1
Freeway and Ramp Traffic Volumes
Sources/Freeway Segment Post Mile AADT Peak Hour
Freeway‐MainSegment1.US101FreewayNorth&South(0.51miles) 7.72 217,000 12,000
Ramps2.US101North&SouthFreewayOn‐RampfromHollywoodBoulevard(0.10miles)
7.85 18,500 770
3.US101North&SouthFreewayOff‐RamptoHollywoodBoulevard(0.14miles)
7.71 14,600 600
Source: California Department of Transportation; pems.dot.ca.gov; http://www.dot.ca.gov/hq/traffops/saferesr/trafdata/;2015.

3.0 Methodology October 2015
5750HollywoodBoulevardProject HealthRiskAssessmentTechnicalReportPCRServicesCorporation 8
3.3 DISPERSION MODELING (HOLLYWOOD FREEWAY)
Dispersion modeling was performed using the AMS/EPA Regulatory Model (AERMOD), version 14134.Meteorologicaldata from theSCAQMD’sDowntownLAmonitoring stationwithinSourceReceptorArea1wasusedtorepresentlocalweatherconditionsandprevailingwindsdata.TerraindatafromU.S.GeologicalSurvey(USGS)wasusedtoassignelevationstosourcesandmodelingreceptors.
For modeling purposes, receptors were located on the Project Site at ground level and at two differentheightstoestimateconcentrationsatbalconiesandwindowsthatfacethefreewayandwithintheproposedbuilding’sinteriorcourtyard.Receptorswerealsoplacedattheroofleveltoaccountforresidentsutilizingthe building’s rooftop amenities. The dispersion modeling took into account variable traffic volumes atdifferenttimesofday.HourlyemissionsforfreewaysourceswerecalculatedusinghourlyPeMStrafficdatawithcorrespondingemissionfactorsbasedonhourlymeanspeeddata. Off‐sitesourceswereaddedtothemodel for equipmentwith active permitswithin 500 feet of the Project Site boundary. Permits that are“active” indicatea facilityorsourcethat iscurrentlyallowedtoemitpollutants inaccordancewithpermitconditions.Ascalaremissionrate(1g/s)wasusedforallsourcesforlaterinputintotheHotspotsAnalysisandReportingProgram(HARP).
3.4 CANCER RISK AND HEALTH RISK CALCULATIONS (HOLLYWOOD FREEWAY)
Cancerriskwascalculatedusing theCARB’smostrecentversionofHARP(version2)whichwasreleasedMarch 2015. This version of HARP incorporates themost recent Office of Environmental Health HazardAssessment(OEHHA)guidelinesforhealthriskassessments.Theexposuredurationwasassumedtobe30years and exposurewas based on default values provided by OEHHA andwithin HARP (which has beenupdatedtoaccountforthemostrecentOEHHAguidelinesforhealthriskassessments).
Inperforminghealthriskcalculations,carcinogeniccompoundsarenotconsideredtohavethresholdlevels(i.e.,doselevelsbelowwhichtherearenorisks). Anyexposure,therefore,willhavesomeassociatedrisk.Incremental health risks associated with exposure to carcinogenic compounds is defined in terms of theprobability of developing cancer as a result of exposure to a chemical at a given concentration. Under adeterministic approach (i.e., point estimate methodology), the cancer risk probability is determined bymultiplyingthechemical’sannualconcentrationbyitsunitriskfactor(URF). TheURFisameasureofthecarcinogenicpotentialofachemicalwhenadoseisreceivedthroughtheinhalationpathway.Itrepresentsanupperboundestimateof theprobabilityofcontractingcancerasaresultofcontinuousexposure toanambientconcentrationofonemicrogrampercubicmeter(µg/m3)overa70‐yearlifetime.TheURFsutilizedin the assessment and the corresponding cancer potency factors (CPF) were obtained principally fromOEHHAGuidance.
Fortheinhalationpathway,thecancerriskcharacterizationprocedurerequirestheincorporationofseveraldiscrete variables to effectively quantify dose. Once determined, contaminant dose is multiplied by thecancer potency factor (CPF) in units of inverse dose expressed in milligrams per kilogram per day(mg/kg/day)‐1andotherexposurefactorstoderivethecancerriskestimate.Therefore,toaccommodatetheuniqueexposuresassociatedwiththeproposedpopulation,thefollowingdosealgorithmwasutilized.
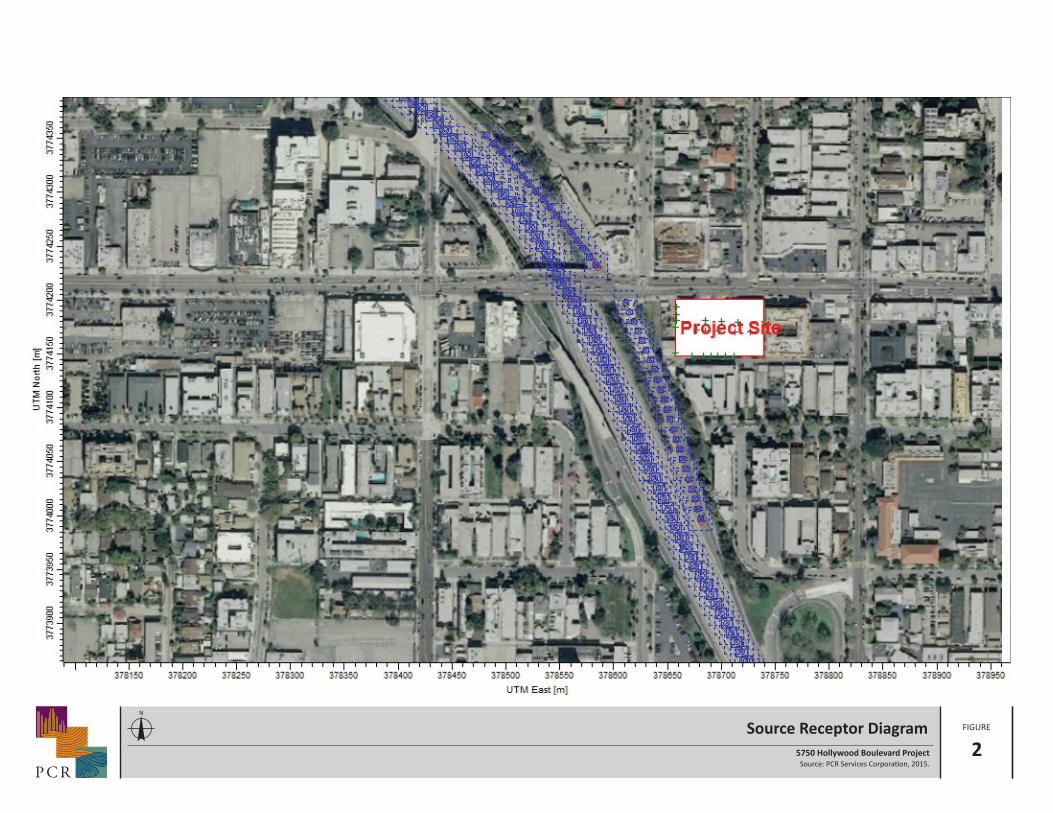
FIGURESource Receptor Diagram
5750 Hollywood Boulevard Project 2Source: PCR Services Corpora on, 2015.
P C R
N

3.0 Methodology October 2015
5750HollywoodBoulevardProject HealthRiskAssessmentTechnicalReportPCRServicesCorporation 10
Thispageintentionallyblank.

October 2015 3.0 Methodology
5750HollywoodBoulevardProject AirQualityTechnicalReportPCRServicesCorporation ES‐11
CDI=(CAIR×{BR/BW}×A×EF)
Where: CDI = Chronicdailyintake(mg/kg/day); CAIR = Concentrationofcontaminantinair(mg/m3); {BR/BW} = DailyBreathingRatenormalizedtobodyweight(l/kgbodyweight‐day); EF = Exposurefrequency(days/year); A = Inhalationabsorptionfactor(unitless).
OEHHArecommendeddefaultvalues for theparameters listedabovewereused in theHRAanalysis. Thedailybreathing rate {BR/BW}used in the analysiswasbasedonwasbasedonOEHHArecommendationswhichvarydependingonagewhichareshowninTable2,OEHHARecommendedResidentialDailyBreathingRatesforPointEstimateDoseCalculations(L/kgbodyweight). Therecommendedexposurefrequency(EF)is350daysperyearwhich isequivalent to0.96(350days/365daysayear). The inhalationabsorptionfactor(A)isassumedtobe1forinhalationbasedriskassessment.6
Oncedoseiscalculated,cancerriskiscalculatedbyaccountingforcancerpotencyofthespecificpollutant,agesensitivity,exposureduration,averagingtimeforlifetimecancerrisk,andfractionoftimespentathome(sensitive receptor). The Cancer Potency Factor (CPF) is specific for each pollutant and is determinedthroughpeerreviewedscientificstudies.OEHHAhasdeterminedthatDieselparticulatematter(DPM)hasaunitriskfactorof3.0E‐4(ug/m3)‐1andaslopefactorof1.1(mg/kg‐day)‐1.7TheAgeSensitivityFactor(ASF)accountsforgreatersusceptibilityinearlylife,startingfromthe3rdtrimesterofpregnancyto70years.Thefraction of time at home (FAH) takes into account the time actually residing at the sensitive receptorlocation. Fraction of time at home also takes into account time spent at time for various age groups.Exposuredurationforpurposesofthishealthriskassessmentwasassumedtobe30years,consistentwithOEHHArecommendationsforresidentialuses.
Asshownintheequationbelow,theincrementalincreaseincancerriskistheproductofthedoseandthepollutant‐specificCPF,ASF,ED,andFAHvalues.Cancerriskiscalculatedbymultiplyingtheinhalationdoseby the inhalation cancer potency factor to yield thepotential inhalation excess cancer risk. The followingequationillustratestheformulaforcalculatingcancerrisk.Toconvertthisriskvaluetochancespermillionofdevelopingcancer,thepotentialcancerriskismultipliedby106.
6 OEHHA,AirToxicsHotSpotsProgramGuidanceManualforPreparationofHealthRiskAssessments,(August2003)5‐16.7 OEHHAHotSpotsUnitRiskandCancerPotencyFactors.May2009.
Table 2
OEHHA Recommended Residential Daily Breathing Rates for Point Estimate Dose Calculations (L / kg body weight)
3rd Trimester 0<2 Years 2<9 Years 2<16 Years 16<30 Years
Average 225 658 535 452 21095thPercentile 361 1090 861 745 335
Source: OEHHA Air Toxics Hot Spots Program Guidance Manual. February 2015.

3.0 Methodology October 2015
5750HollywoodBoulevardProject HealthRiskAssessmentTechnicalReportPCRServicesCorporation 12
CancerRisk=Dose(mg/kg‐day)×CPF(mg/kg‐day)‐1xASFxED/ATxFAH
Where: Dose = Amountofaspecificpollutantapersonisexposedto(mg/kg‐day) CPF = CancerPotencyFactor,thecancerpotencyofaspecificpollutant(mg/kg‐day)‐1 ASF = AgeSensitivityFactor(unitless)
ED/AT = ExposureDuration,howlongapersonwillbeexposedtoaspecificpollutantintheirlifetime (years)/Averaging Time, length of time over which the average dose iscalculated(days)
FAH = Fractionoftimeathome(unitless)
Asindicatedintheequationabove,eachagegrouphasdifferentexposureparameterswhichrequirecancerrisk to be calculated separately for each age group. FAH values are presented in Table 3, OEHHARecommendationsforFractionofTimeatHome(FAH)forEvaluatingResidentialCancerRisk.
Table 3
OEHHA Recommendations for Fraction of Time at Home (FAH) for Evaluating Residential Cancer Risk
Age Range Fraction of Time at Residence
3rdTrimesterand0<2Years 0.852<16Years 0.7216‐70Years 0.73
Source: OEHHA Air Toxics Hot Spots Program Guidance Manual. February 2015.

5750HollywoodBoulevardProject HealthRiskAssessmentTechnicalReportPCRServicesCorporation 13
4.0 IMPACT ANALYSIS
Health risk impacts (cancer risk) were assessed for future on‐site residents. Table 4, Summary ofCarcinogenic Risks for On‐Site Sensitive Receptors, summarizes the carcinogenic risk for representativereceptorslocatedthroughouttheSite.Forcarcinogenicexposures,thecancerriskfromDPMemissionsfortheProjectSiteresulted inamaximumcarcinogenicriskof6.8peronemillion for the30‐yearresidentialexposurescenario. Thisscenarioisbasedonahighlyconservative30‐year,24‐hours‐per‐day,seven‐days‐per‐weekexposure.The30‐yearlifetimeexposureisadefaultassumptionunderOEHHAguidelineswhichtakes into account early life (infant and children) exposure. Cancer risk for on‐Site receptorswhich arefurther away from the freewaywoulddrop to2.0peronemillion. It shouldbenoted that the calculatedcancer risk assumes no mitigation such as mechanical filtration and exposure with windows open. Thecurrent City of Los Angeles Building Code requires mechanical filtration with a Minimum EfficiencyReportingValue(MERV)of11orhigher.ThiswouldreducetypicalindoorPM10concentrationsbyatleast85percent. Therefore,actualcancerriskimpactstoon‐siteresidentswouldbelowerthanthosereportedabove.
The HRA worksheets (provided in Appendix) provide a detailed breakdown of these calculations. Insummary,theProjectSite’sworst‐caselocationwouldnotbeexposedtocancerriskinexcessoftheSCAQMDsignificance threshold of 10 per onemillion. As a result, on‐Site residential uses would be provided anadequate health‐based separation distance from the freeway and impactswould be considered less thansignificant.
Table 4
Summary of Carcinogenic Risks for On‐site Sensitive Receptors
Risk Scenario Carcinogenic Risk Per One Million*
MaximumExposedIndividual(MEI)(closesttofreeway)
6.8
MiddleoftheSite 2.5SoutheastCorneroftheSite 2.0
SeecalculationworksheetspresentedinAppendix.*Thesignificancethresholdis10permillion.Source:PCRServicesCorporation,2015

5750HollywoodBoulevardProject HealthRiskAssessmentTechnicalReportPCRServicesCorporation 15
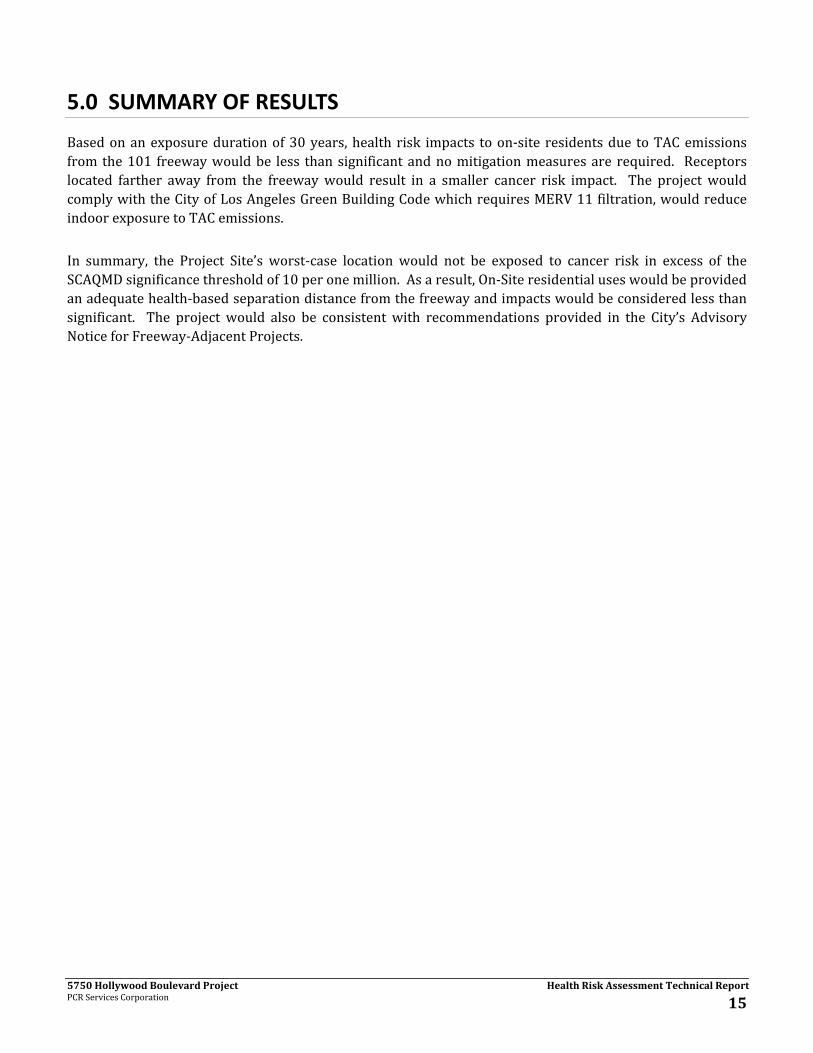
5.0 SUMMARY OF RESULTS
Basedonanexposuredurationof30years,health risk impacts toon‐site residentsdue toTACemissionsfromthe101 freewaywouldbe less thansignificantandnomitigationmeasuresare required. Receptorslocated farther away from the freewaywould result in a smaller cancer risk impact. The project wouldcomplywiththeCityofLosAngelesGreenBuildingCodewhichrequiresMERV11filtration,wouldreduceindoorexposuretoTACemissions.
In summary, the Project Site’s worst‐case location would not be exposed to cancer risk in excess of theSCAQMDsignificancethresholdof10peronemillion.Asaresult,On‐Siteresidentialuseswouldbeprovidedanadequatehealth‐basedseparationdistancefromthefreewayandimpactswouldbeconsideredlessthansignificant. The project would also be consistentwith recommendations provided in the City’s AdvisoryNoticeforFreeway‐AdjacentProjects.


5750HollywoodBoulevardProject HealthRiskAssessmentTechnicalReportPCRServicesCorporation
APPENDIX A HEALTH RISK ASSESSMENT WORKSHEETS AND OUTPUT FILES


5750HollywoodHealthRiskAssessmentTechnicalReportAppendixA,HealthRiskAssessmentWorksheetsandOutputFilesA.1 EmissionsInventory
A.2 AERMODDispersionModeling
A.3 HARPOutputFiles

AppendixA.1EmissionsInventory

5750 Hollywood101 Freeway Health Risk Assessment
Emissions Inventory5750 Hollywood Blvd. Health Risk AssessmentEmissions Inventory ‐ Annual (2018‐2048)
Vehicle Mix Ramps
% Light Duty Vehicle Growth Rate 1% per year
99% * 5750 Hollywood Blvd. Traffic Study% Heavy Duty Trucks
1%
Roadway Road Segment Year Year ID Truck Flow (vehicles/yr) Length (mile) Speed (mph) Diesel EF
(g/mi)PM10 Emissions
(lbs/yr)Mainline Northbound Mainline 2018 2 448,709 0.51 60 0.038 19Mainline Southbound Mainline 2018 2 1,254,808 0.51 55 0.035 50Ramp Northbound On-Ramp 2018 2 40,519 0.10 5 0.090 1Ramp Northbound Off-Ramp 2018 2 27,744 0.14 5 0.090 1Ramp Southbound On-Ramp 2018 2 27,014 0.10 5 0.090 1Ramp Southbound Off-Ramp 2018 2 25,554 0.14 5 0.090 1
Mainline Northbound Mainline 2019 3 453,196 0.51 60 0.033 16Mainline Southbound Mainline 2019 3 1,267,356 0.51 55 0.031 44Ramp Northbound On-Ramp 2019 3 40,924 0.10 5 0.076 1Ramp Northbound Off-Ramp 2019 3 28,021 0.14 5 0.076 1Ramp Southbound On-Ramp 2019 3 27,284 0.10 5 0.076 0Ramp Southbound Off-Ramp 2019 3 25,809 0.14 5 0.076 1
Mainline Northbound Mainline 2020 4 457,728 0.51 60 0.026 13Mainline Southbound Mainline 2020 4 1,280,030 0.51 55 0.024 35Ramp Northbound On-Ramp 2020 4 41,333 0.10 5 0.055 1Ramp Northbound Off-Ramp 2020 4 28,301 0.14 5 0.055 0Ramp Southbound On-Ramp 2020 4 27,557 0.10 5 0.055 0Ramp Southbound Off-Ramp 2020 4 26,067 0.14 5 0.055 0
Mainline Northbound Mainline 2021 5 462,305 0.51 60 0.017 9Mainline Southbound Mainline 2021 5 1,292,830 0.51 55 0.016 23Ramp Northbound On-Ramp 2021 5 41,746 0.10 5 0.043 0Ramp Northbound Off-Ramp 2021 5 28,584 0.14 5 0.043 0Ramp Southbound On-Ramp 2021 5 27,832 0.10 5 0.043 0Ramp Southbound Off-Ramp 2021 5 26,328 0.14 5 0.043 0
Mainline Northbound Mainline 2022 6 466,928 0.51 60 0.015 8Mainline Southbound Mainline 2022 6 1,305,758 0.51 55 0.014 21Ramp Northbound On-Ramp 2022 6 42,164 0.10 5 0.039 0Ramp Northbound Off-Ramp 2022 6 28,870 0.14 5 0.039 0Ramp Southbound On-Ramp 2022 6 28,111 0.10 5 0.039 0Ramp Southbound Off-Ramp 2022 6 26,591 0.14 5 0.039 0
Mainline Northbound Mainline 2023 7 471,598 0.51 60 0.010 6Mainline Southbound Mainline 2023 7 1,318,816 0.51 55 0.010 15Ramp Northbound On-Ramp 2023 7 42,586 0.10 5 0.028 0Ramp Northbound Off-Ramp 2023 7 29,159 0.14 5 0.028 0Ramp Southbound On-Ramp 2023 7 28,392 0.10 5 0.028 0Ramp Southbound Off-Ramp 2023 7 26,857 0.14 5 0.028 0
Mainline Northbound Mainline 2024 8 476,314 0.51 60 0.010 5Mainline Southbound Mainline 2024 8 1,332,004 0.51 55 0.009 14Ramp Northbound On-Ramp 2024 8 43,011 0.10 5 0.026 0Ramp Northbound Off-Ramp 2024 8 29,450 0.14 5 0.026 0Ramp Southbound On-Ramp 2024 8 28,676 0.10 5 0.026 0Ramp Southbound Off-Ramp 2024 8 27,126 0.14 5 0.026 0
Mainline Northbound Mainline 2025 9 481,077 0.51 60 0.009 5Mainline Southbound Mainline 2025 9 1,345,324 0.51 55 0.009 13Ramp Northbound On-Ramp 2025 9 43,441 0.10 5 0.024 0Ramp Northbound Off-Ramp 2025 9 29,745 0.14 5 0.024 0Ramp Southbound On-Ramp 2025 9 28,962 0.10 5 0.024 0Ramp Southbound Off-Ramp 2025 9 27,397 0.14 5 0.024 0
Annual Emissions (EMFAC2014)_042715.xlsx Page 1 of 4 3:04 PM 9/24/2015

5750 Hollywood101 Freeway Health Risk Assessment
Emissions Inventory5750 Hollywood Blvd. Health Risk AssessmentEmissions Inventory ‐ Annual (2018‐2048)
Vehicle Mix Ramps
% Light Duty Vehicle Growth Rate 1% per year
99% * 5750 Hollywood Blvd. Traffic Study% Heavy Duty Trucks
1%
Roadway Road Segment Year Year ID Truck Flow (vehicles/yr) Length (mile) Speed (mph) Diesel EF
(g/mi)PM10 Emissions
(lbs/yr)Mainline Northbound Mainline 2026 10 485,888 0.51 60 0.009 5Mainline Southbound Mainline 2026 10 1,358,777 0.51 55 0.008 13Ramp Northbound On-Ramp 2026 10 43,876 0.10 5 0.022 0Ramp Northbound Off-Ramp 2026 10 30,042 0.14 5 0.022 0Ramp Southbound On-Ramp 2026 10 29,252 0.10 5 0.022 0Ramp Southbound Off-Ramp 2026 10 27,671 0.14 5 0.022 0
Mainline Northbound Mainline 2027 11 490,746 0.51 60 0.008 4Mainline Southbound Mainline 2027 11 1,372,365 0.51 55 0.008 12Ramp Northbound On-Ramp 2027 11 44,315 0.10 5 0.020 0Ramp Northbound Off-Ramp 2027 11 30,343 0.14 5 0.020 0Ramp Southbound On-Ramp 2027 11 29,544 0.10 5 0.020 0Ramp Southbound Off-Ramp 2027 11 27,948 0.14 5 0.020 0
Mainline Northbound Mainline 2028 12 495,654 0.51 60 0.007 4Mainline Southbound Mainline 2028 12 1,386,089 0.51 55 0.007 11Ramp Northbound On-Ramp 2028 12 44,758 0.10 5 0.019 0Ramp Northbound Off-Ramp 2028 12 30,646 0.14 5 0.019 0Ramp Southbound On-Ramp 2028 12 29,840 0.10 5 0.019 0Ramp Southbound Off-Ramp 2028 12 28,227 0.14 5 0.019 0
Mainline Northbound Mainline 2029 13 500,610 0.51 60 0.007 4Mainline Southbound Mainline 2029 13 1,399,950 0.51 55 0.007 11Ramp Northbound On-Ramp 2029 13 45,205 0.10 5 0.017 0Ramp Northbound Off-Ramp 2029 13 30,953 0.14 5 0.017 0Ramp Southbound On-Ramp 2029 13 30,138 0.10 5 0.017 0Ramp Southbound Off-Ramp 2029 13 28,509 0.14 5 0.017 0
Mainline Northbound Mainline 2030 14 505,617 0.51 60 0.006 4Mainline Southbound Mainline 2030 14 1,413,949 0.51 55 0.006 10Ramp Northbound On-Ramp 2030 14 45,657 0.10 5 0.016 0Ramp Northbound Off-Ramp 2030 14 31,262 0.14 5 0.016 0Ramp Southbound On-Ramp 2030 14 30,440 0.10 5 0.016 0Ramp Southbound Off-Ramp 2030 14 28,794 0.14 5 0.016 0
Mainline Northbound Mainline 2031 15 510,673 0.51 60 0.006 3Mainline Southbound Mainline 2031 15 1,428,089 0.51 55 0.006 9Ramp Northbound On-Ramp 2031 15 46,114 0.10 5 0.015 0Ramp Northbound Off-Ramp 2031 15 31,575 0.14 5 0.015 0Ramp Southbound On-Ramp 2031 15 30,744 0.10 5 0.015 0Ramp Southbound Off-Ramp 2031 15 29,082 0.14 5 0.015 0
Mainline Northbound Mainline 2032 16 515,779 0.51 60 0.006 3Mainline Southbound Mainline 2032 16 1,442,369 0.51 55 0.006 9Ramp Northbound On-Ramp 2032 16 46,575 0.10 5 0.014 0Ramp Northbound Off-Ramp 2032 16 31,891 0.14 5 0.014 0Ramp Southbound On-Ramp 2032 16 31,051 0.10 5 0.014 0Ramp Southbound Off-Ramp 2032 16 29,373 0.14 5 0.014 0
Mainline Northbound Mainline 2033 17 520,937 0.51 60 0.005 3Mainline Southbound Mainline 2033 17 1,456,793 0.51 55 0.005 8Ramp Northbound On-Ramp 2033 17 47,041 0.10 5 0.013 0Ramp Northbound Off-Ramp 2033 17 32,210 0.14 5 0.013 0Ramp Southbound On-Ramp 2033 17 31,362 0.10 5 0.013 0Ramp Southbound Off-Ramp 2033 17 29,667 0.14 5 0.013 0
Annual Emissions (EMFAC2014)_042715.xlsx Page 2 of 4 3:04 PM 9/24/2015

5750 Hollywood101 Freeway Health Risk Assessment
Emissions Inventory5750 Hollywood Blvd. Health Risk AssessmentEmissions Inventory ‐ Annual (2018‐2048)
Vehicle Mix Ramps
% Light Duty Vehicle Growth Rate 1% per year
99% * 5750 Hollywood Blvd. Traffic Study% Heavy Duty Trucks
1%
Roadway Road Segment Year Year ID Truck Flow (vehicles/yr) Length (mile) Speed (mph) Diesel EF
(g/mi)PM10 Emissions
(lbs/yr)Mainline Northbound Mainline 2034 18 526,147 0.51 60 0.005 3Mainline Southbound Mainline 2034 18 1,471,361 0.51 55 0.005 8Ramp Northbound On-Ramp 2034 18 47,511 0.10 5 0.012 0Ramp Northbound Off-Ramp 2034 18 32,532 0.14 5 0.012 0Ramp Southbound On-Ramp 2034 18 31,676 0.10 5 0.012 0Ramp Southbound Off-Ramp 2034 18 29,964 0.14 5 0.012 0
Mainline Northbound Mainline 2035 19 531,408 0.51 60 0.005 3Mainline Southbound Mainline 2035 19 1,486,075 0.51 55 0.005 8Ramp Northbound On-Ramp 2035 19 47,986 0.10 5 0.012 0Ramp Northbound Off-Ramp 2035 19 32,857 0.14 5 0.012 0Ramp Southbound On-Ramp 2035 19 31,992 0.10 5 0.012 0Ramp Southbound Off-Ramp 2035 19 30,263 0.14 5 0.012 0
Mainline Northbound Mainline 2036 20 536,722 0.51 60 0.005 3Mainline Southbound Mainline 2036 20 1,500,935 0.51 55 0.005 8Ramp Northbound On-Ramp 2036 20 48,466 0.10 5 0.011 0Ramp Northbound Off-Ramp 2036 20 33,185 0.14 5 0.011 0Ramp Southbound On-Ramp 2036 20 32,312 0.10 5 0.011 0Ramp Southbound Off-Ramp 2036 20 30,566 0.14 5 0.011 0
Mainline Northbound Mainline 2037 21 542,089 0.51 60 0.004 3Mainline Southbound Mainline 2037 21 1,515,945 0.51 55 0.004 7Ramp Northbound On-Ramp 2037 21 48,951 0.10 5 0.011 0Ramp Northbound Off-Ramp 2037 21 33,517 0.14 5 0.011 0Ramp Southbound On-Ramp 2037 21 32,635 0.10 5 0.011 0Ramp Southbound Off-Ramp 2037 21 30,872 0.14 5 0.011 0
Mainline Northbound Mainline 2038 22 547,510 0.51 60 0.004 3Mainline Southbound Mainline 2038 22 1,531,104 0.51 55 0.004 7Ramp Northbound On-Ramp 2038 22 49,440 0.10 5 0.011 0Ramp Northbound Off-Ramp 2038 22 33,853 0.14 5 0.011 0Ramp Southbound On-Ramp 2038 22 32,962 0.10 5 0.011 0Ramp Southbound Off-Ramp 2038 22 31,180 0.14 5 0.011 0
Mainline Northbound Mainline 2039 23 552,985 0.51 60 0.004 3Mainline Southbound Mainline 2039 23 1,546,415 0.51 55 0.004 7Ramp Northbound On-Ramp 2039 23 49,935 0.10 5 0.011 0Ramp Northbound Off-Ramp 2039 23 34,191 0.14 5 0.011 0Ramp Southbound On-Ramp 2039 23 33,291 0.10 5 0.011 0Ramp Southbound Off-Ramp 2039 23 31,492 0.14 5 0.011 0
Mainline Northbound Mainline 2040 24 558,515 0.51 60 0.004 3Mainline Southbound Mainline 2040 24 1,561,879 0.51 55 0.004 7Ramp Northbound On-Ramp 2040 24 50,434 0.10 5 0.010 0Ramp Northbound Off-Ramp 2040 24 34,533 0.14 5 0.010 0Ramp Southbound On-Ramp 2040 24 33,624 0.10 5 0.010 0Ramp Southbound Off-Ramp 2040 24 31,807 0.14 5 0.010 0
Mainline Northbound Mainline 2041 25 564,100 0.51 60 0.004 3Mainline Southbound Mainline 2041 25 1,577,498 0.51 55 0.004 7Ramp Northbound On-Ramp 2041 25 50,939 0.10 5 0.010 0Ramp Northbound Off-Ramp 2041 25 34,878 0.14 5 0.010 0Ramp Southbound On-Ramp 2041 25 33,961 0.10 5 0.010 0Ramp Southbound Off-Ramp 2041 25 32,125 0.14 5 0.010 0
Annual Emissions (EMFAC2014)_042715.xlsx Page 3 of 4 3:04 PM 9/24/2015

5750 Hollywood101 Freeway Health Risk Assessment
Emissions Inventory5750 Hollywood Blvd. Health Risk AssessmentEmissions Inventory ‐ Annual (2018‐2048)
Vehicle Mix Ramps
% Light Duty Vehicle Growth Rate 1% per year
99% * 5750 Hollywood Blvd. Traffic Study% Heavy Duty Trucks
1%
Roadway Road Segment Year Year ID Truck Flow (vehicles/yr) Length (mile) Speed (mph) Diesel EF
(g/mi)PM10 Emissions
(lbs/yr)Mainline Northbound Mainline 2042 26 569,741 0.51 60 0.004 3Mainline Southbound Mainline 2042 26 1,593,273 0.51 55 0.004 7Ramp Northbound On-Ramp 2042 26 51,448 0.10 5 0.010 0Ramp Northbound Off-Ramp 2042 26 35,227 0.14 5 0.010 0Ramp Southbound On-Ramp 2042 26 34,300 0.10 5 0.010 0Ramp Southbound Off-Ramp 2042 26 32,446 0.14 5 0.010 0
Mainline Northbound Mainline 2043 27 575,439 0.51 60 0.004 3Mainline Southbound Mainline 2043 27 1,609,206 0.51 55 0.004 7Ramp Northbound On-Ramp 2043 27 51,962 0.10 5 0.010 0Ramp Northbound Off-Ramp 2043 27 35,579 0.14 5 0.010 0Ramp Southbound On-Ramp 2043 27 34,643 0.10 5 0.010 0Ramp Southbound Off-Ramp 2043 27 32,771 0.14 5 0.010 0
Mainline Northbound Mainline 2044 28 581,193 0.51 60 0.004 3Mainline Southbound Mainline 2044 28 1,625,298 0.51 55 0.004 8Ramp Northbound On-Ramp 2044 28 52,482 0.10 5 0.010 0Ramp Northbound Off-Ramp 2044 28 35,935 0.14 5 0.010 0Ramp Southbound On-Ramp 2044 28 34,990 0.10 5 0.010 0Ramp Southbound Off-Ramp 2044 28 33,099 0.14 5 0.010 0
Mainline Northbound Mainline 2045 29 587,005 0.51 60 0.004 3Mainline Southbound Mainline 2045 29 1,641,551 0.51 55 0.004 8Ramp Northbound On-Ramp 2045 29 53,007 0.10 5 0.009 0Ramp Northbound Off-Ramp 2045 29 36,294 0.14 5 0.009 0Ramp Southbound On-Ramp 2045 29 35,339 0.10 5 0.009 0Ramp Southbound Off-Ramp 2045 29 33,430 0.14 5 0.009 0
Mainline Northbound Mainline 2046 30 592,875 0.51 60 0.004 3Mainline Southbound Mainline 2046 30 1,657,966 0.51 55 0.004 8Ramp Northbound On-Ramp 2046 30 53,537 0.10 5 0.009 0Ramp Northbound Off-Ramp 2046 30 36,657 0.14 5 0.009 0Ramp Southbound On-Ramp 2046 30 35,693 0.10 5 0.009 0Ramp Southbound Off-Ramp 2046 30 33,764 0.14 5 0.009 0
Mainline Northbound Mainline 2047 31 598,804 0.51 60 0.004 3Mainline Southbound Mainline 2047 31 1,674,546 0.51 55 0.004 8Ramp Northbound On-Ramp 2047 31 54,072 0.10 5 0.009 0Ramp Northbound Off-Ramp 2047 31 37,024 0.14 5 0.009 0Ramp Southbound On-Ramp 2047 31 36,050 0.10 5 0.009 0Ramp Southbound Off-Ramp 2047 31 34,101 0.14 5 0.009 0
Mainline Northbound Mainline 2048 32 604,792 0.51 60 0.004 3Mainline Southbound Mainline 2048 32 1,691,292 0.51 55 0.004 8Ramp Northbound On-Ramp 2048 32 54,613 0.10 5 0.009 0Ramp Northbound Off-Ramp 2048 32 37,394 0.14 5 0.009 0Ramp Southbound On-Ramp 2048 32 36,410 0.10 5 0.009 0Ramp Southbound Off-Ramp 2048 32 34,442 0.14 5 0.009 0
Annual Emissions (EMFAC2014)_042715.xlsx Page 4 of 4 3:04 PM 9/24/2015

5750 Hollywood101 Freeway Health Risk Assessment
Emissions Inventory ‐ Summary
5750 Hollywood Blvd. Health Risk AssessmentEmissions Inventory Summary ‐ Annual (2018‐2048)
Year Mainline (lbs/year)
Ramp (lbs/year)
2018 69 2.82019 60 2.42020 48 1.72021 32 1.42022 28 1.22023 20 0.92024 19 0.82025 18 0.82026 17 0.72027 16 0.72028 15 0.62029 14 0.62030 14 0.62031 13 0.52032 12 0.52033 12 0.52034 11 0.52035 11 0.42036 10 0.42037 10 0.42038 10 0.42039 10 0.42040 10 0.42041 10 0.42042 10 0.42043 10 0.42044 10 0.42045 10 0.42046 11 0.42047 11 0.4
Average 18.4 0.7
Totals / Average
Annual Emissions (EMFAC2014)_042715.xlsx Page 1 of 1 3:08 PM9/24/2015

AppendixA.2AERMODDispersionModeling

5750 Hollywood Blvd. Health Risk AssessmentAERMOD Input ‐ Variable Hourly Emissions
Segment Time Length (m) Truck Flow (vehicle/hr) Speed (mph) Diesel EF (g/mi)DPM Emissions
(g/s) DPM ScalarMainline 12:00:00 AM 816 130 65 0.039 7.07E-04 0.7
1:00:00 AM 816 110 65 0.039 5.99E-04 0.62:00:00 AM 816 109 65 0.039 5.91E-04 0.63:00:00 AM 816 106 65 0.039 5.77E-04 0.64:00:00 AM 816 125 70 0.040 6.97E-04 0.75:00:00 AM 816 160 70 0.040 8.95E-04 0.96:00:00 AM 816 172 65 0.039 9.35E-04 0.97:00:00 AM 816 178 60 0.038 9.44E-04 1.08:00:00 AM 816 202 55 0.035 1.01E-03 1.09:00:00 AM 816 214 55 0.035 1.07E-03 1.1
10:00:00 AM 816 241 60 0.038 1.27E-03 1.311:00:00 AM 816 251 55 0.035 1.26E-03 1.312:00:00 PM 816 250 60 0.038 1.32E-03 1.3
1:00:00 PM 816 251 55 0.035 1.25E-03 1.32:00:00 PM 816 253 55 0.035 1.26E-03 1.33:00:00 PM 816 254 40 0.031 1.12E-03 1.14:00:00 PM 816 250 35 0.032 1.14E-03 1.25:00:00 PM 816 251 30 0.035 1.22E-03 1.26:00:00 PM 816 266 35 0.032 1.21E-03 1.27:00:00 PM 816 232 45 0.032 1.03E-03 1.08:00:00 PM 816 174 60 0.038 9.19E-04 0.99:00:00 PM 816 163 65 0.039 8.82E-04 0.9
10:00:00 PM 816 164 65 0.039 8.89E-04 0.911:00:00 PM 816 164 65 0.039 8.89E-04 0.9
9.87E-04Average Hourly
AERMOD View - Lakes Environmental Software C:\ISC Runs\5750 Revised (052815)\5750 Revised_emission rates.isc
SCALE:
0 0.2 km
1:5,408
PROJECT TITLE:
5750 Hollywood101 Freeway Health Risk Assessment
COMMENTS:
Source Receptor Configuration
COMPANY NAME:
MODELER:
DATE:
9/24/2015
PROJECT NO.:
5750 Hollywood Blvd.
SOURCES:
3
RECEPTORS:
57

AppendixA.3HARPOutputFiles

5750 Hollywood101 Freeway Health Risk Assessment
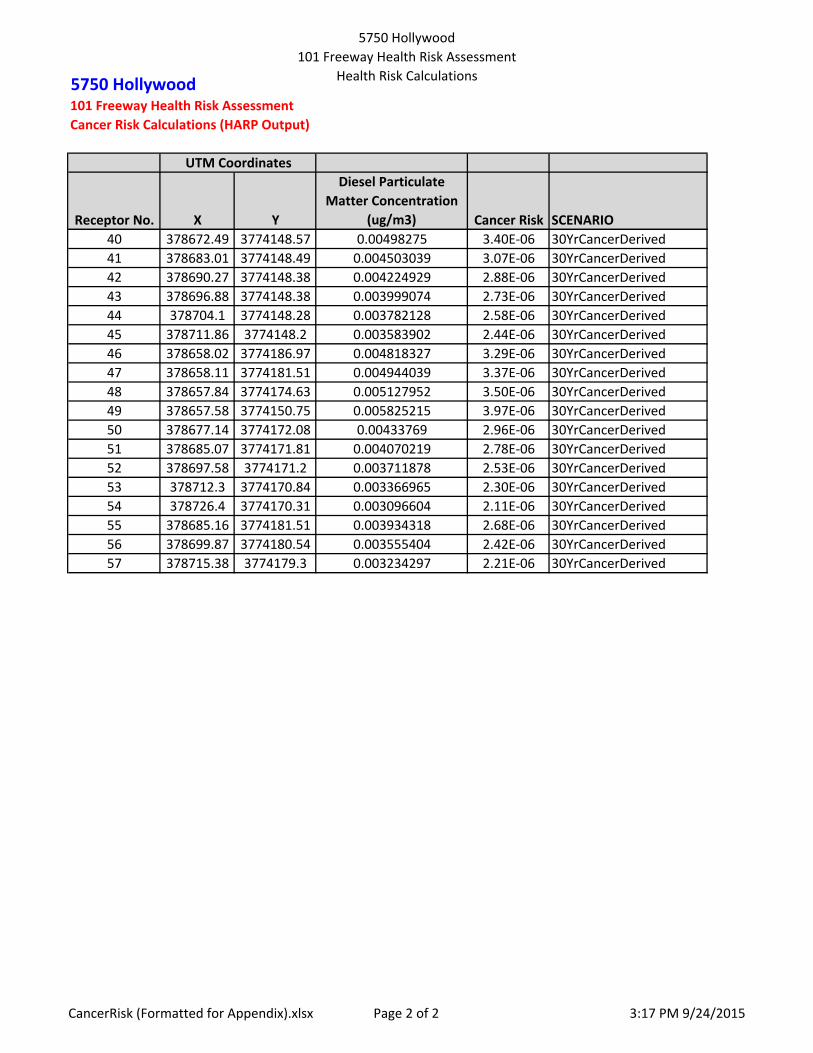
Health Risk Calculations5750 Hollywood101 Freeway Health Risk AssessmentCancer Risk Calculations (HARP Output)
Receptor No. X Y
Diesel Particulate Matter Concentration
(ug/m3) Cancer Risk SCENARIO1 378657.93 3774194 0.00774447 5.28E‐06 30YrCancerDerived2 378672.49 3774148.57 0.008464497 5.77E‐06 30YrCancerDerived3 378683.01 3774148.49 0.007543787 5.14E‐06 30YrCancerDerived4 378690.27 3774148.38 0.007023436 4.79E‐06 30YrCancerDerived5 378696.88 3774148.38 0.006601566 4.50E‐06 30YrCancerDerived6 378704.1 3774148.28 0.006186491 4.22E‐06 30YrCancerDerived7 378711.86 3774148.2 0.005802036 3.96E‐06 30YrCancerDerived8 378658.02 3774186.97 0.008053429 5.49E‐06 30YrCancerDerived9 378658.11 3774181.51 0.008313716 5.67E‐06 30YrCancerDerived10 378657.84 3774174.63 0.008694299 5.93E‐06 30YrCancerDerived11 378657.58 3774150.75 0.0101741 6.94E‐06 30YrCancerDerived12 378677.14 3774172.08 0.00714783 4.87E‐06 30YrCancerDerived13 378685.07 3774171.81 0.00663573 4.52E‐06 30YrCancerDerived14 378697.58 3774171.2 0.005965656 4.07E‐06 30YrCancerDerived15 378712.3 3774170.84 0.005319811 3.63E‐06 30YrCancerDerived16 378726.4 3774170.31 0.004818656 3.29E‐06 30YrCancerDerived17 378685.16 3774181.51 0.006345826 4.33E‐06 30YrCancerDerived18 378699.87 3774180.54 0.005643503 3.85E‐06 30YrCancerDerived19 378715.38 3774179.3 0.005046809 3.44E‐06 30YrCancerDerived20 378657.93 3774194 0.006080178 4.15E‐06 30YrCancerDerived21 378672.49 3774148.57 0.006561471 4.47E‐06 30YrCancerDerived22 378683.01 3774148.49 0.005886029 4.01E‐06 30YrCancerDerived23 378690.27 3774148.38 0.005493931 3.75E‐06 30YrCancerDerived24 378696.88 3774148.38 0.005175687 3.53E‐06 30YrCancerDerived25 378704.1 3774148.28 0.004875215 3.32E‐06 30YrCancerDerived26 378711.86 3774148.2 0.004622942 3.15E‐06 30YrCancerDerived27 378658.02 3774186.97 0.006308778 4.30E‐06 30YrCancerDerived28 378658.11 3774181.51 0.006490586 4.43E‐06 30YrCancerDerived29 378657.84 3774174.63 0.006752864 4.60E‐06 30YrCancerDerived30 378657.58 3774150.75 0.007738314 5.28E‐06 30YrCancerDerived31 378677.14 3774172.08 0.005691945 3.88E‐06 30YrCancerDerived32 378685.07 3774171.81 0.005327833 3.63E‐06 30YrCancerDerived33 378697.58 3774171.2 0.004837229 3.30E‐06 30YrCancerDerived34 378712.3 3774170.84 0.004378082 2.99E‐06 30YrCancerDerived35 378726.4 3774170.31 0.004022564 2.74E‐06 30YrCancerDerived36 378685.16 3774181.51 0.005151094 3.51E‐06 30YrCancerDerived37 378699.87 3774180.54 0.004640318 3.16E‐06 30YrCancerDerived38 378715.38 3774179.3 0.004214853 2.87E‐06 30YrCancerDerived39 378657.93 3774194 0.004660404 3.18E‐06 30YrCancerDerived
UTM Coordinates
CancerRisk (Formatted for Appendix).xlsx Page 1 of 2 3:17 PM 9/24/2015
5750 Hollywood101 Freeway Health Risk Assessment
Health Risk Calculations5750 Hollywood101 Freeway Health Risk AssessmentCancer Risk Calculations (HARP Output)
Receptor No. X Y
Diesel Particulate Matter Concentration
(ug/m3) Cancer Risk SCENARIO
UTM Coordinates
40 378672.49 3774148.57 0.00498275 3.40E‐06 30YrCancerDerived41 378683.01 3774148.49 0.004503039 3.07E‐06 30YrCancerDerived42 378690.27 3774148.38 0.004224929 2.88E‐06 30YrCancerDerived43 378696.88 3774148.38 0.003999074 2.73E‐06 30YrCancerDerived44 378704.1 3774148.28 0.003782128 2.58E‐06 30YrCancerDerived45 378711.86 3774148.2 0.003583902 2.44E‐06 30YrCancerDerived46 378658.02 3774186.97 0.004818327 3.29E‐06 30YrCancerDerived47 378658.11 3774181.51 0.004944039 3.37E‐06 30YrCancerDerived48 378657.84 3774174.63 0.005127952 3.50E‐06 30YrCancerDerived49 378657.58 3774150.75 0.005825215 3.97E‐06 30YrCancerDerived50 378677.14 3774172.08 0.00433769 2.96E‐06 30YrCancerDerived51 378685.07 3774171.81 0.004070219 2.78E‐06 30YrCancerDerived52 378697.58 3774171.2 0.003711878 2.53E‐06 30YrCancerDerived53 378712.3 3774170.84 0.003366965 2.30E‐06 30YrCancerDerived54 378726.4 3774170.31 0.003096604 2.11E‐06 30YrCancerDerived55 378685.16 3774181.51 0.003934318 2.68E‐06 30YrCancerDerived56 378699.87 3774180.54 0.003555404 2.42E‐06 30YrCancerDerived57 378715.38 3774179.3 0.003234297 2.21E‐06 30YrCancerDerived
CancerRisk (Formatted for Appendix).xlsx Page 2 of 2 3:17 PM 9/24/2015

OutputHARP2 - HRACalc (dated 15065) 5/5/2015 3:31:39 PM - Output Log
GLCs loaded successfullyPollutants loaded successfullyPathway receptors loaded successfully**********************************Start Age: -0.25Total Exposure Duration: 30
**********************************Exposure Duration Bin Distribution3rd Trimester Bin: 0.250<2 Years Bin: 22<9 Years Bin: 02<16 Years Bin: 1416<30 Years Bin: 1416 to 70 Years Bin: 0
**********************************Pathways EnabledInhalation: TrueSoil: FalseDermal: FalseMother's Milk: FalseWater: FalseFish: FalseHomegrown Crops: FalseBeef: FalseDairy: FalsePig: FalseChicken: FalseEgg: False
Calculating cancer riskCancer risk saved to: C:\HARP2\Project\5750_01\hra\CancerRisk.csvHRA ran successfully
Page 1