appendix e plots from the evaluation of …€¦ · plots from the evaluation of the cnrfc...
TRANSCRIPT

APE‐1
APPENDIX E
PLOTS FROM THE EVALUATION OF THE CNRFC OPERATIONAL HYDROLOGIC MODEL
APE‐2
500 1000 1500 2000 25000
500
1000
1500
2000
2500Trinity Lake Inflow
Observed
Sim
ulat
ed
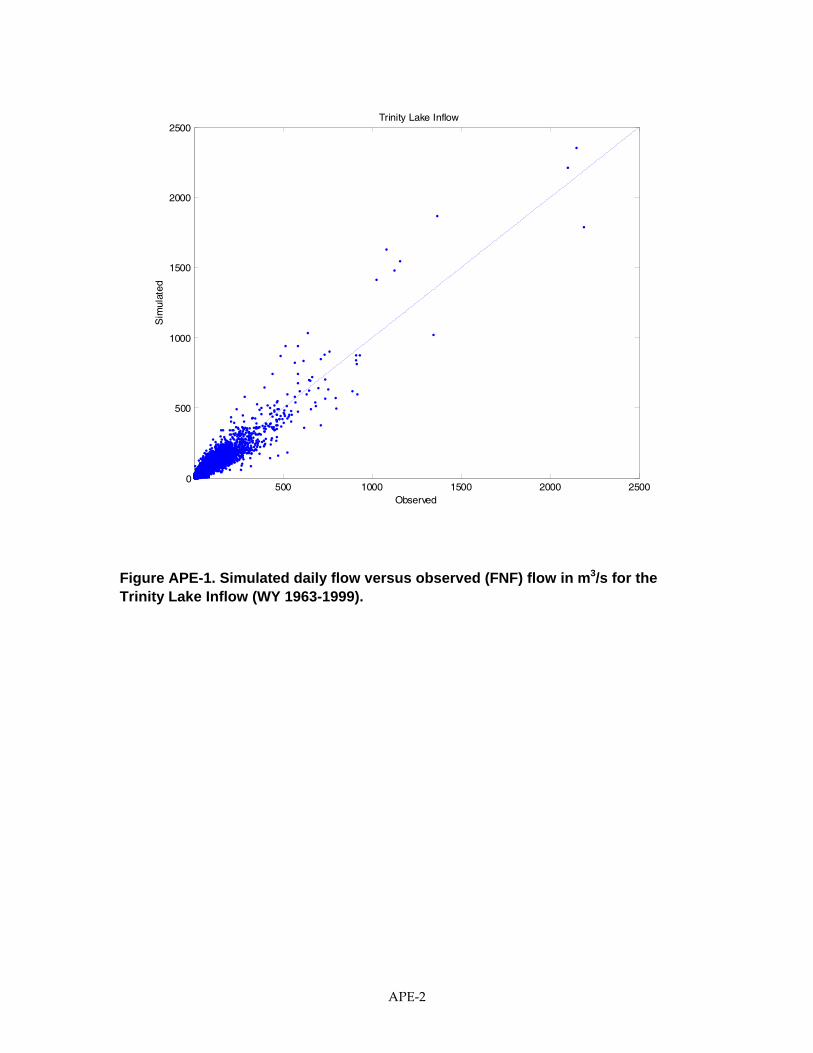
Figure APE-1. Simulated daily flow versus observed (FNF) flow in m3/s for the Trinity Lake Inflow (WY 1963-1999).
APE‐3
500 1000 1500 2000 25000
500
1000
1500
2000
2500Shasta Lake Inflow
Sim
ulat
ed
500 1000 1500 2000 25000
500
1000
1500
2000
2500Delta
Sim
ulat
ed
500 1000 1500 2000 25000
500
1000
1500
2000
2500McCloud
Sim
ulat
ed
500 1000 1500 2000 25000
500
1000
1500
2000
2500Pit
Sim
ulat
ed
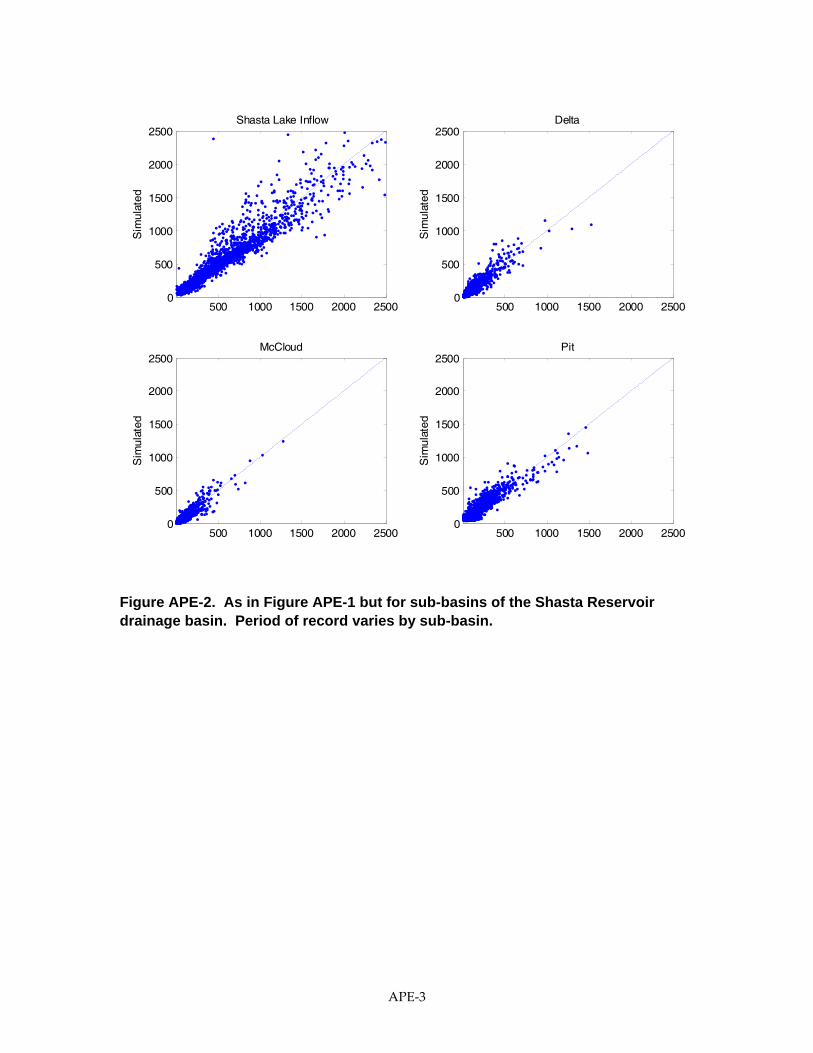
Figure APE-2. As in Figure APE-1 but for sub-basins of the Shasta Reservoir drainage basin. Period of record varies by sub-basin.

APE‐4
Figure APE-3. As in Figure APE-1 but for sub-basins of the Oroville Reservoir drainage basin on the Feather River. Period of record varies by sub-basin.

APE‐5
0 2000 4000 6000 8000 10000 12000 140000
1
2
3
4
5
6
7x 10
10 Trinity Lake Inflow
Days
Cum
ulat
ive
flow
(m3 )
SimulationFull Natural Flow
Figure APE-4. Full Natural Flow (blue) and simulated (red) of cumulative flow for the length of the simulation for the Trinity Lake inflow.

APE‐6
Figure APE-5. As in Figure APE-4 except for the sub-basins of the Shasta Reservoir drainage basin.
APE‐7
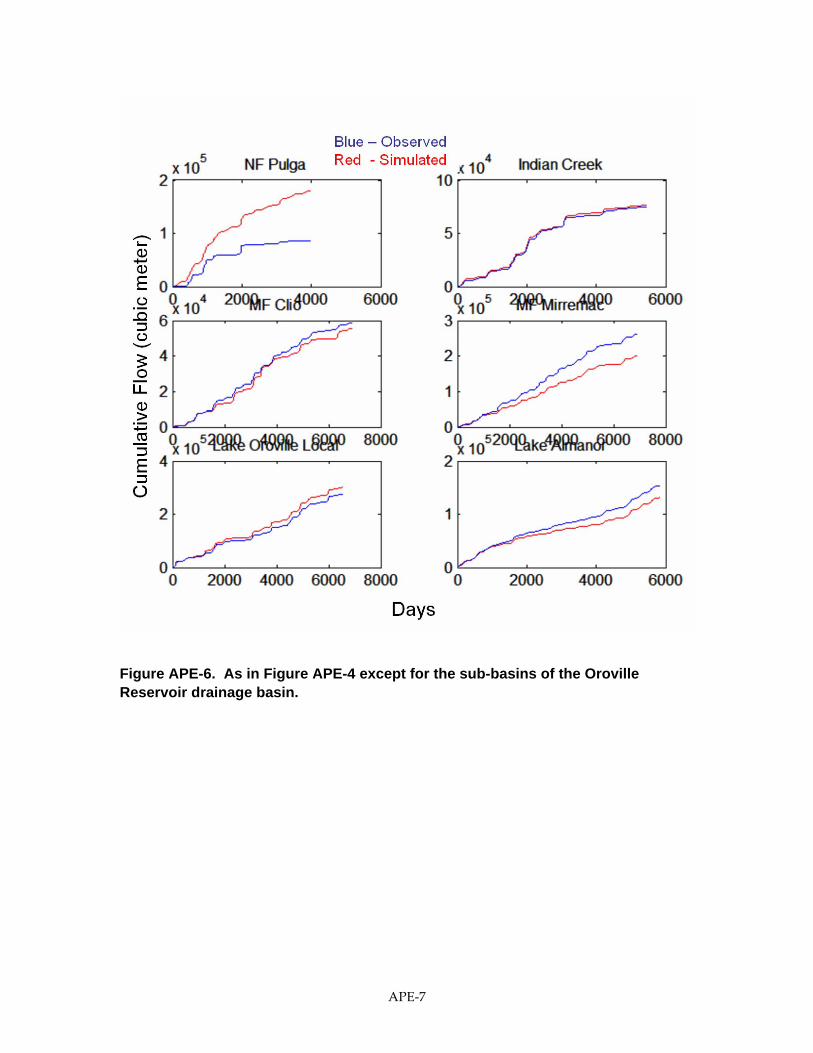
Figure APE-6. As in Figure APE-4 except for the sub-basins of the Oroville Reservoir drainage basin.
APE‐8
0 10 20 30 40 50 60 70 80 90 1000
5
10
15
20
25
30
35Trinity Lake Inflow
Percent Exceedance
Box
-Cox
Tra
nsfo
rmed
Flo
w
SimulationObservation
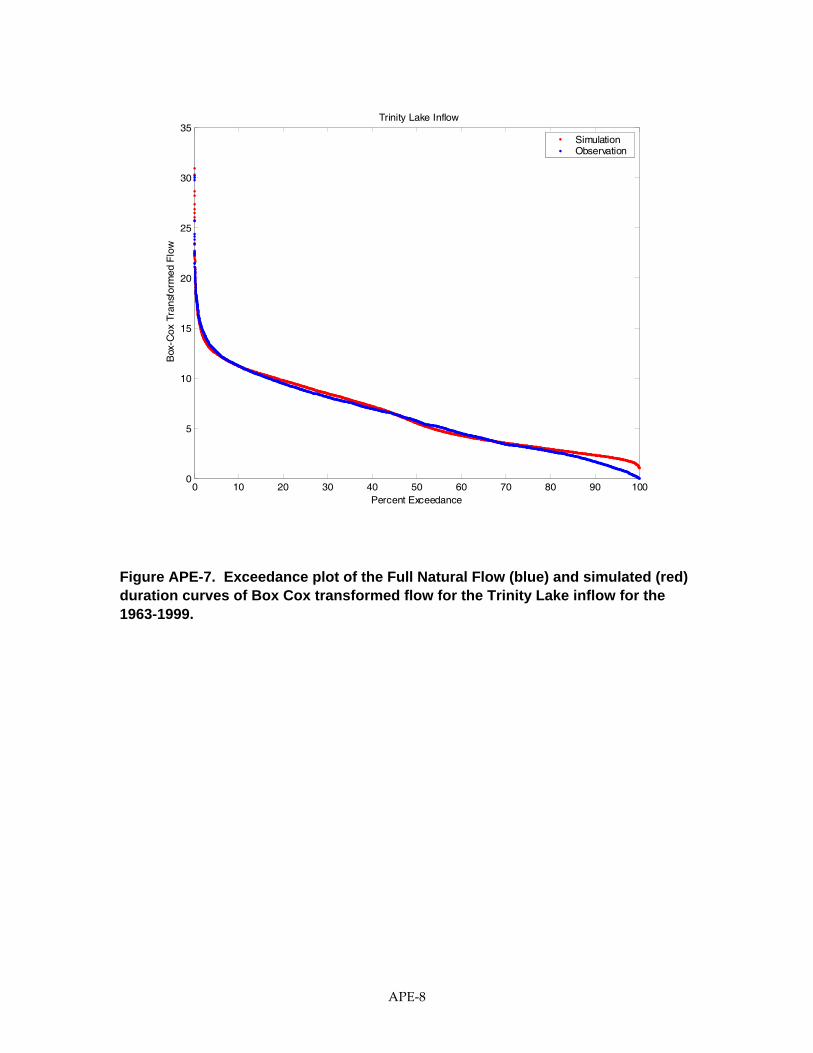
Figure APE-7. Exceedance plot of the Full Natural Flow (blue) and simulated (red) duration curves of Box Cox transformed flow for the Trinity Lake inflow for the 1963-1999.
APE‐9
0 20 40 60 80 1000
10
20
30
40
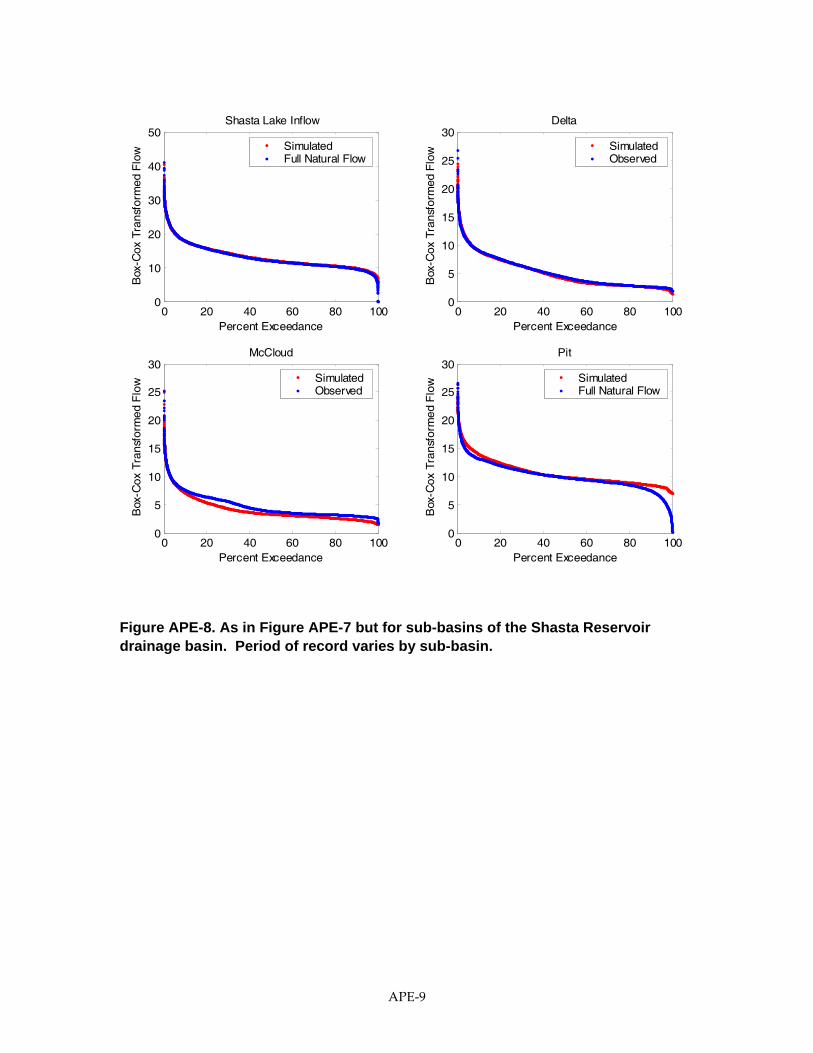
50Shasta Lake Inflow
Percent Exceedance
Box
-Cox
Tra
nsfo
rmed
Flo
w SimulatedFull Natural Flow
0 20 40 60 80 1000
5
10
15
20
25
30Delta
Percent Exceedance
Box
-Cox
Tra
nsfo
rmed
Flo
w SimulatedObserved
0 20 40 60 80 1000
5
10
15
20
25
30McCloud
Percent Exceedance
Box
-Cox
Tra
nsfo
rmed
Flo
w SimulatedObserved
0 20 40 60 80 1000
5
10
15
20
25
30Pit
Percent Exceedance
Box
-Cox
Tra
nsfo
rmed
Flo
w SimulatedFull Natural Flow
Figure APE-8. As in Figure APE-7 but for sub-basins of the Shasta Reservoir drainage basin. Period of record varies by sub-basin.

APE‐10
Figure APE-9. As in Figure APE-7 but for sub-basins of the Oroville Reservoir drainage basin. Period of record varies by sub-basin.
APE‐11
10 20 30
5
10
15
20
25
30Jan
5 10 15 20
5
10
15
20Feb
5 10 15 20 25
5
10
15
20
25
Mar
5 10 15
5
10
15
Apr
5 10 15 20
5
10
15
20
Box
-Cox
Tra
nsfo
rmed
Sim
ulat
ed M
onth
ly F
low
May
5 10 15
5
10
15
Jun
2 4 6 8 10 12
2
4
6
8
10
12Jul
2 4 6 8
2
4
6
8
Aug
2 4 6 8
2
4
6
8
Sep
5 10 15
5
10
15
Box-Cox Transformed Observed Monthly Flow
Oct
5 10 15 20
5
10
15
20
Nov
10 20 30
5
10
15
20
25
30Dec
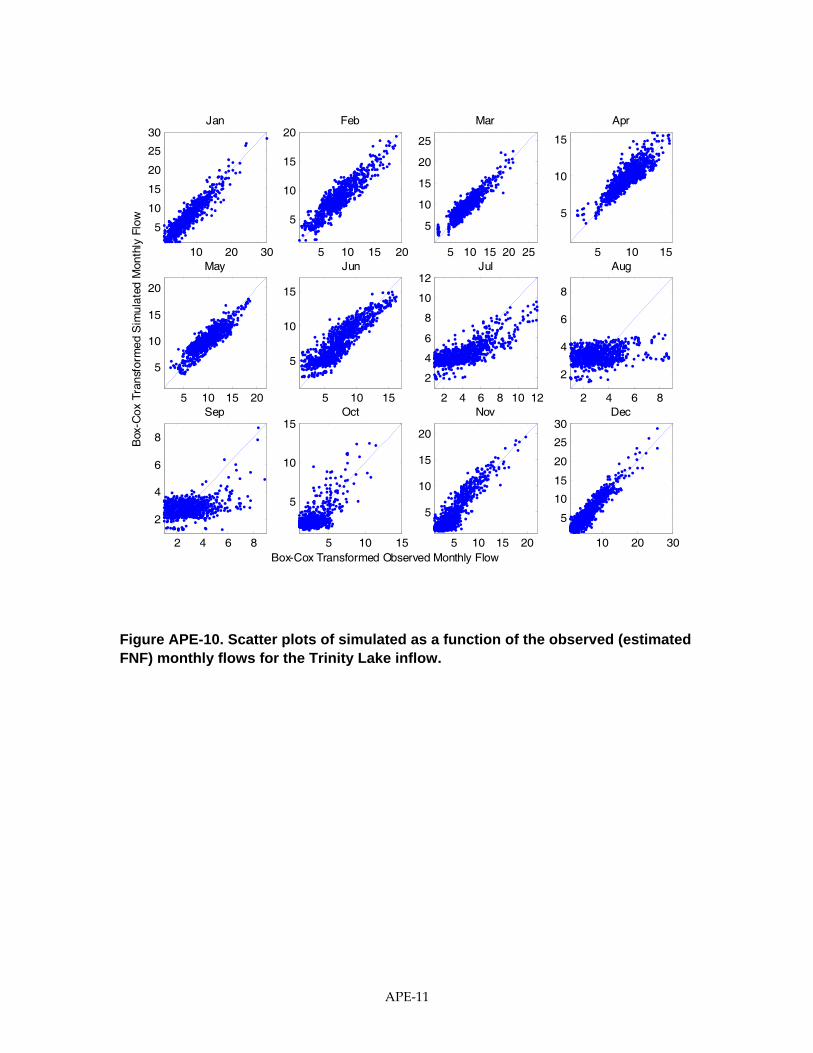
Figure APE-10. Scatter plots of simulated as a function of the observed (estimated FNF) monthly flows for the Trinity Lake inflow.
APE‐12
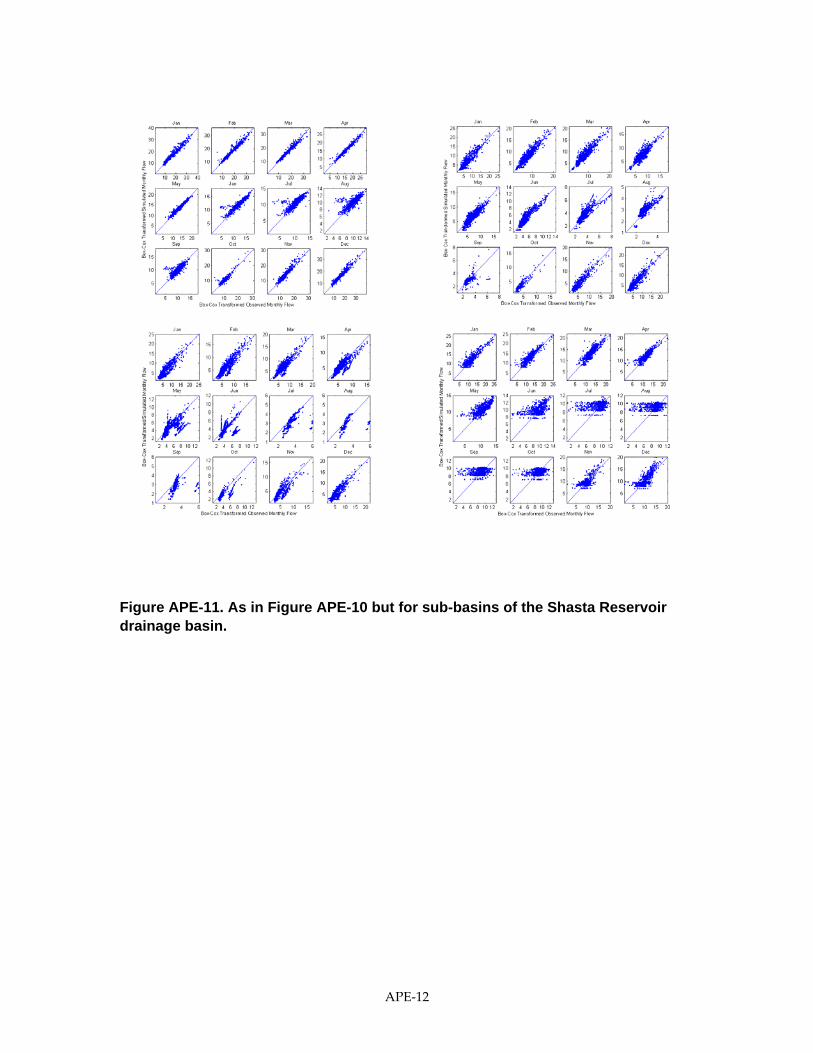
Figure APE-11. As in Figure APE-10 but for sub-basins of the Shasta Reservoir drainage basin.
Lake Shasta
McCloud
Delta
Pit
APE‐13
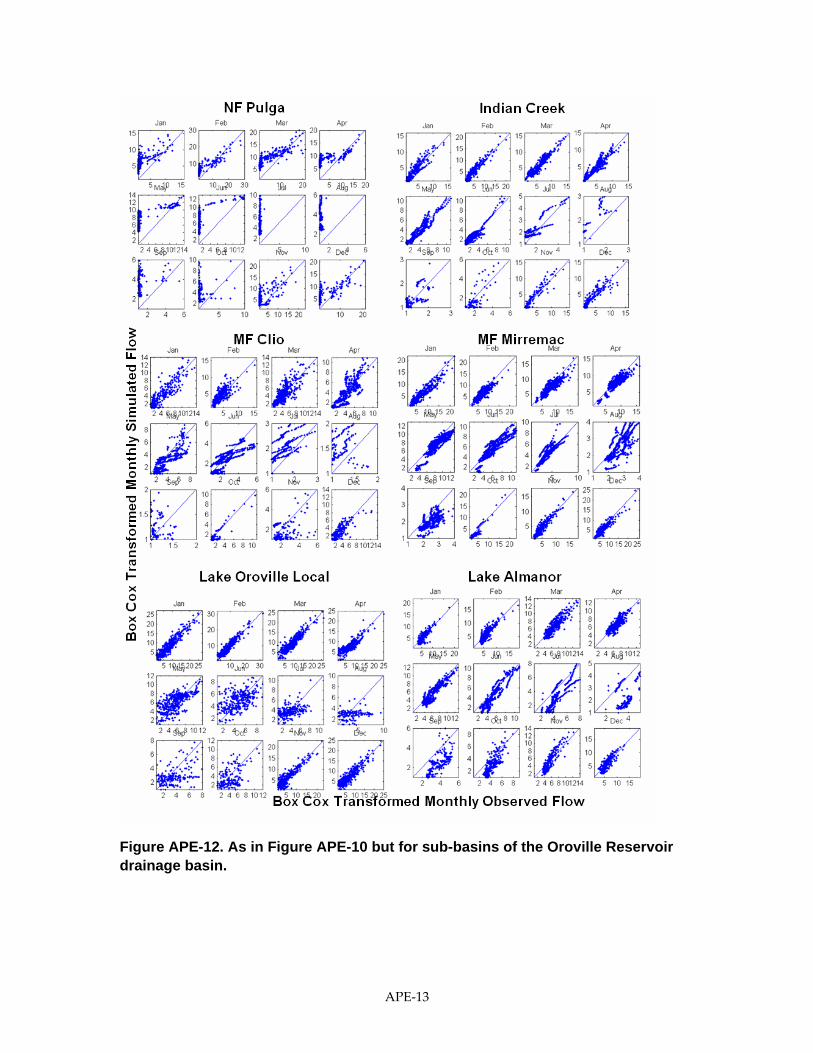
Figure APE-12. As in Figure APE-10 but for sub-basins of the Oroville Reservoir drainage basin.

APE‐14
1 2 3 4 5 6 7 8 9 10 11 120
0.05
0.1
0.15
0.2
0.25
0.3
0.35
0.4
Water year
Mon
thly
Fra
ctio
n of
the
Ann
ual
Figure APE-13. Observed and simulated monthly mean (± 1 standard deviation) flow expressed as a fraction of annual flow volume for the Trinity Lake inflow.

APE‐15
Figure APE-14. As in Figure APE-13 but for sub-basins of the Shasta Reservoir drainage basin.
Lake Shasta
McCloud
Delta
Pit

APE‐16
Figure APE-15. As in Figure APE-13 but for sub-basins of the Oroville Reservoir drainage basin.

APE‐17
Figure APE-16. Daily snow water equivalent from snow sensors and simulated model snow water equivalent (thick black line) for water years 1990 -1999 for Trinity River basin.
0 100 200 3000
500
1000
1500
2000
2500
Water Year 90 - 910 100 200 300
0
500
1000
1500
2000
2500
Water Year 91 - 920 100 200 300
0
500
1000
1500
2000
2500
Water Year 92 - 93
0 100 200 3000
500
1000
1500
2000
2500
Water Year 93 - 94
SW
E (
mm
)
0 100 200 3000
500
1000
1500
2000
2500
Water Year 94 - 950 100 200 300
0
500
1000
1500
2000
2500
Water Year 95 - 96
0 100 200 3000
500
1000
1500
2000
2500
Water Year 96 - 970 100 200 300
0
500
1000
1500
2000
2500
Water Year 97 - 980 100 200 300
0
500
1000
1500
2000
2500
Water Year 98 - 99
PET 2180RRM 2043BNK 1966SHM 1951HIG 1838MUM 1723BFL 1555Simulation

APE‐18
0 100 200 3000
500
1000
1500
2000
2500
Water Year 90 - 91
STM 1646Simulation
0 100 200 3000
500
1000
1500
2000
2500
Water Year 91 - 92
McCloud
0 100 200 3000
500
1000
1500
2000
2500
Water Year 92 - 93
0 100 200 3000
500
1000
1500
2000
2500
Water Year 93 - 94
SW
E (
mm
)
0 100 200 3000
500
1000
1500
2000
2500
Water Year 94 - 950 100 200 300
0
500
1000
1500
2000
2500
Water Year 95 - 96
0 100 200 3000
500
1000
1500
2000
2500
Water Year 96 - 970 100 200 300
0
500
1000
1500
2000
2500
Water Year 97 - 980 100 200 300
0
500
1000
1500
2000
2500
Water Year 98 - 99
Figure APE-17. As in Figure APE-16 except for stations within the McCloud River sub-watershed of the Shasta Reservoir basin.

APE‐19
0 100 200 3000
500
1000
1500
2000
2500
Water Year 90 - 91
BLA 2150MED 2040ADM 1890ANM 1814Simulation
0 100 200 3000
500
1000
1500
2000
2500
Water Year 91 - 92
Pit
0 100 200 3000
500
1000
1500
2000
2500
Water Year 92 - 93
0 100 200 3000
500
1000
1500
2000
2500
Water Year 93 - 94
SW
E (
mm
)
0 100 200 3000
500
1000
1500
2000
2500
Water Year 94 - 950 100 200 300
0
500
1000
1500
2000
2500
Water Year 95 - 96
0 100 200 3000
500
1000
1500
2000
2500
Water Year 96 - 970 100 200 300
0
500
1000
1500
2000
2500
Water Year 97 - 980 100 200 300
0
500
1000
1500
2000
2500
Water Year 98 - 99
Figure APE-18. As in Figure APE-16 except for stations within the Pit River sub-watershed of the Shasta Reservoir basin.

APE‐20
0 100 200 3000
500
1000
1500
2000
2500
Water Year 90 - 91
CDP 2165Simulation
0 100 200 3000
500
1000
1500
2000
2500
Water Year 91 - 92
CNB
0 100 200 3000
500
1000
1500
2000
2500
Water Year 92 - 93
0 100 200 3000
500
1000
1500
2000
2500
Water Year 93 - 94
SW
E (
mm
)
0 100 200 3000
500
1000
1500
2000
2500
Water Year 94 - 950 100 200 300
0
500
1000
1500
2000
2500
Water Year 95 - 96
0 100 200 3000
500
1000
1500
2000
2500
Water Year 96 - 970 100 200 300
0
500
1000
1500
2000
2500
Water Year 97 - 980 100 200 300
0
500
1000
1500
2000
2500
Water Year 98 - 99
Figure APE-19. As in Figure APE-16 except for stations within the Pit River at Canby sub-watershed of the Shasta Reservoir basin.

APE‐21
0 100 200 3000
500
1000
1500
2000
2500
Water Year 90 - 91
SDF 2058SLT 1739Simulation
0 100 200 3000
500
1000
1500
2000
2500
Water Year 91 - 92
Delta
0 100 200 3000
500
1000
1500
2000
2500
Water Year 92 - 93
0 100 200 3000
500
1000
1500
2000
2500
Water Year 93 - 94
SW
E (
mm
)
0 100 200 3000
500
1000
1500
2000
2500
Water Year 94 - 950 100 200 300
0
500
1000
1500
2000
2500
Water Year 95 - 96
0 100 200 3000
500
1000
1500
2000
2500
Water Year 96 - 970 100 200 300
0
500
1000
1500
2000
2500
Water Year 97 - 980 100 200 300
0
500
1000
1500
2000
2500
Water Year 98 - 99
Figure APE-20. As in Figure APE-16 except for stations within the Sacramento River near Delta sub-watershed of the Shasta Reservoir basin.

APE‐22
Figure APE-21. As in Figure APE-16 except for stations within the North Fork of the American River sub-watershed of the Folsom Reservoir basin and for Water Years 1998-1991.

APE‐23
Figure APE-22. As in Figure APE-16 except for stations within the Middle Fork of the American River sub-watershed of the Folsom Reservoir basin and for Water Years 1998-1991.

APE‐24
Figure APE-23. As in Figure APE-16 except for stations within the South Fork of the American River sub-watershed of the Folsom Reservoir basin and for Water Years 1998-1991.

APE‐25
North Fork Feather, Pulga
Indian Creek
Figure APE-24. As in Figure APE-16 except for stations within the North Fork of the Feather River sub-watershed of the Orovile Reservoir basin and for Water Years 1986-1987.
50 100 150 200 250 300 3500
100
200
300
400
500
600
700
800
900
1000
water year 86
SW
E (
mm
)
plghmbforrtlbkl
50 100 150 200 250 300 3500
100
200
300
400
500
600
water year 87
SW
E (
mm
)
plghmbforrtlbkl
50 100 150 200 250 300 3500
100
200
300
400
500
600
700
water year 86
SW
E (
mm
)
iifktlgrz
50 100 150 200 250 300 3500
50
100
150
200
250
300
350
400
water year 87
SW
E (
mm
)
iifktlgrz

APE‐26
Middle Fork Feather, Clio
Middle Fork Feather, Merrimac
Figure APE-25. As in Figure APE-16 except for stations within the Middle Fork of the Feather River sub-watershed of the Orovile Reservoir basin and for Water Years 1986-1987.
50 100 150 200 250 300 3500
100
200
300
400
500
water year 87
SW
E (
mm
)
mrmforgolgrzplp
50 100 150 200 250 300 3500
200
400
600
800
1000
water year 86
SW
E (
mm
)
mrmforgolgrzplp
50 100 150 200 250 300 3500
200
400
600
800
1000
water year 86
SW
E (
mm
)
ftcgolgrz
50 100 150 200 250 300 3500
100
200
300
400
500
water year 87
SW
E (
mm
)
ftcgolgrz