appendix f evaluation of the availability of low sulfur ... · pdf filelisa williams carolyn...
TRANSCRIPT
Appendix F
Evaluation of the Availability of Low Sulfur Marine Distillate Fuel for Ocean-Going Vessels that Visit California
This page is intentionally blank.

F-i
Evaluation of the Availability of Low Sulfur Marine Distillate Fuel for Ocean-Going Vessels that Visit California
Prepared by:
Michelle Komlenic Yan-Ping Zuo Lisa Williams Carolyn Suer
California Air Resources Board California Environmental Protection Agency
F-ii
TABLE OF CONTENTS Contents Page Executive Summary .....................................................................................................F-1 I. Introduction and Background.............................................................................F-4 A Purpose and Objectives..........................................................................F-4 II. Marine Distillate Fuels .......................................................................................F-6 A. Fuel Specifications for Marine Distillate Fuels ........................................F-6 B. Expected Volumes of LSMDF Required to Comply with the Proposed Regulation .................................................................F-8 C. Current and Projected Volumes of LSMDF.............................................F-8 D. Current Costs and Trends for Low Sulfur Marine Fuels........................F-11 E. Marine Fuel Suppliers and Distribution Systems ..................................F-12 III. Production of Low Sulfur Marine Distillate Fuels .............................................F-15 A. Petroleum Refining ...............................................................................F-15 IV. Availability of Low Sulfur Marine Distillate Fuels..............................................F-18 A. Availability of Marine Distillate Fuels to Meet the Phase 1 Fuel-Use Requirements in the Proposed Regulation ...........................................F-18 B. Availability of Marine Distillate Fuels to Meet the Phase 2 Fuel-Use Requirements in the Proposed Regulation ...........................................F-23 V. Conclusions.....................................................................................................F-57 List of Tables Page Table 1: Marine Fuel Types ......................................................................................F-6 Table 2: Fuel Specifications for Marine Distillate Fuels ............................................F-7 Table 3: Estimated Volumes of LSMDF Required for OGV to Comply with the Proposed OGV Regulation .........................................................................F-8 Table 4: Expected Distillate and Heavy Fuel Oil Consumption for a Business- As-Usual Case and the 0.1% S Case (Corbett and Winebrake) ...............F-10 Table 5: Current and Proposed Sulfur Levels for Vehicle Diesel Fuel in Asia, the European Union, and the United States....................................................F-17 Table 6: Current Average Sulfur Content of Marine Distillate Fuels from ARB Inspections and DNV Data........................................................................F-18 Table 7: Tabulation of Current Average Sulfur Levels for MGO and MDO at Pacific Rim Ports ......................................................................................F-22 Table 8: Pacific Rim Ports Selection for Evaluation................................................F-24 Table 9: Range of Sulfur Content for Marine Distillate Fuel at Busan in 2007 ........F-26 Table 10: Range of Sulfur Content for Marine Distillate Fuel at Hong Kong in 2007......................................................................................................F-30

F-iii
TABLE OF CONTENTS (CONT.) List of Tables (cont.) Page Table 11: Range of Sulfur Content for Marine Distillate Fuel at Kaohsiung in 2007......................................................................................................F-33 Table 12: Range of Sulfur Content for Marine Distillate Fuel at Los Angeles in 2007......................................................................................................F-36 Table 13: Range of Sulfur Content for Marine Distillate Fuel at Ningbo in 2007......................................................................................................F-40 Table 14: Range of Sulfur Content for Marine Distillate Fuel at Panama Canal in 2007......................................................................................................F-42 Table 15: Range of Sulfur Content for Marine Distillate Fuel at San Francisco in 2007......................................................................................................F-45 Table 16: Range of Sulfur Content for Marine Distillate Fuel at Singapore in 2007......................................................................................................F-47 Table 17: Range of Sulfur Content for Marine Distillate Fuel at Vancouver in 2007......................................................................................................F-50 Table 18: Range of Sulfur Content for Marine Distillate Fuel at Yokohama in 2007......................................................................................................F-53 List of Figures Page Figure 1: Bunkerworld MDO Monthly Average Price per Metric Ton History For Port of Los Angeles (Sep 2001-Apr 2008)..........................................F-11 Figure 2: Price vs. Sulfur Content of MGO and MDO at Selected Ports ..................F-12 Figure 3: Marine Vessel Fuel Supply Chain.............................................................F-13 Figure 4: Distillation of Crude Oil .............................................................................F-15 Figure 5: Refining Processes for Complex Refinery ................................................F-16 Figure 6: Current Sulfur Levels for DMA and DMB by Country................................F-19 Figure 7: Percentage of DNV Samples for DMA and DMB Within Phase 1 Fuel Sulfur Specifications by Country ...............................................................F-20 Figure 8: Current Average Sulfur Levels for MGO and MDO at Pacific Rim Ports...F-21 Figure 9: Average Sulfur Content of MGO for Selected Ports..................................F-25 Figure 10: Average Sulfur Content for MDO for Selected Ports.................................F-25 Figure 11: Fuel Sulfur Content Distribution for DMA at Busan in 2007 ......................F-27 Figure 12: Fuel Sulfur Content Distribution for DMB at Busan in 2007 ......................F-27 Figure 13: Fuel Sulfur Content Distribution for DMA and DMB at Busan in 2007 ......F-28 Figure 14: Fuel Sulfur Content Distribution for DMA at Hong Kong in 2007 ..............F-30 Figure 15: Fuel Sulfur Content Distribution for DMB at Hong Kong in 2007 ..............F-31 Figure 16: Fuel Sulfur Content Distribution for DMA and DMB at Hong Kong in 2007......................................................................................................F-31 Figure 17: Fuel Sulfur Content Distribution for DMA at Kaohsiung in 2007 ...............F-33 Figure 18: Fuel Sulfur Content Distribution for DMB at Kaohsiung in 2007 ...............F-34

F-iv
TABLE OF CONTENTS (CONT.) List of Figures (cont.) Page Figure 19: Fuel Sulfur Content Distribution for DMA and DMB at Kaohsiung in 2007......................................................................................................F-34 Figure 20: Fuel Sulfur Content Distribution for DMA at Los Angeles in 2007.............F-37 Figure 21: Fuel Sulfur Content Distribution for DMB at Los Angeles in 2007.............F-37 Figure 22: Fuel Sulfur Content Distribution for DMA and DMB at Los Angeles in 2007......................................................................................................F-38 Figure 23: Fuel Sulfur Content Distribution for DMA at Panama Canal in 2007.........F-42 Figure 24: Fuel Sulfur Content Distribution for DMB at Panama Canal in 2007.........F-43 Figure 25: Fuel Sulfur Content Distribution for DMA and DMB at Panama Canal in 2007......................................................................................................F-43 Figure 26: Fuel Sulfur Content Distribution for DMA at San Francisco in 2007 .........F-45 Figure 27: Fuel Sulfur Content Distribution for DMB at San Francisco in 2007 .........F-46 Figure 28: Fuel Sulfur Content Distribution for DMA and DMB at San Francisco in 2007......................................................................................................F-46 Figure 29: Fuel Sulfur Content Distribution for DMA at Singapore in 2007 ................F-48 Figure 30: Fuel Sulfur Content Distribution for DMB at Singapore in 2007 ................F-48 Figure 31: Fuel Sulfur Content Distribution for DMA and DMB at Singapore in 2007......................................................................................................F-49 Figure 32: Fuel Sulfur Content Distribution for DMA at Vancouver in 2007 ...............F-51 Figure 33: Fuel Sulfur Content Distribution for DMB at Vancouver in 2007 ...............F-51 Figure 34: Fuel Sulfur Content Distribution for DMA and DMB at Vancouver in 2007......................................................................................................F-52 Figure 35: Fuel Sulfur Content Distribution for DMA at Yokohama in 2007 ...............F-54 Figure 36: Fuel Sulfur Content Distribution for DMB at Yokohama in 2007 ...............F-54 Figure 37: Fuel Sulfur Content Distribution for DMA and DMB at Yokohama in 2007......................................................................................................F-55
F-1
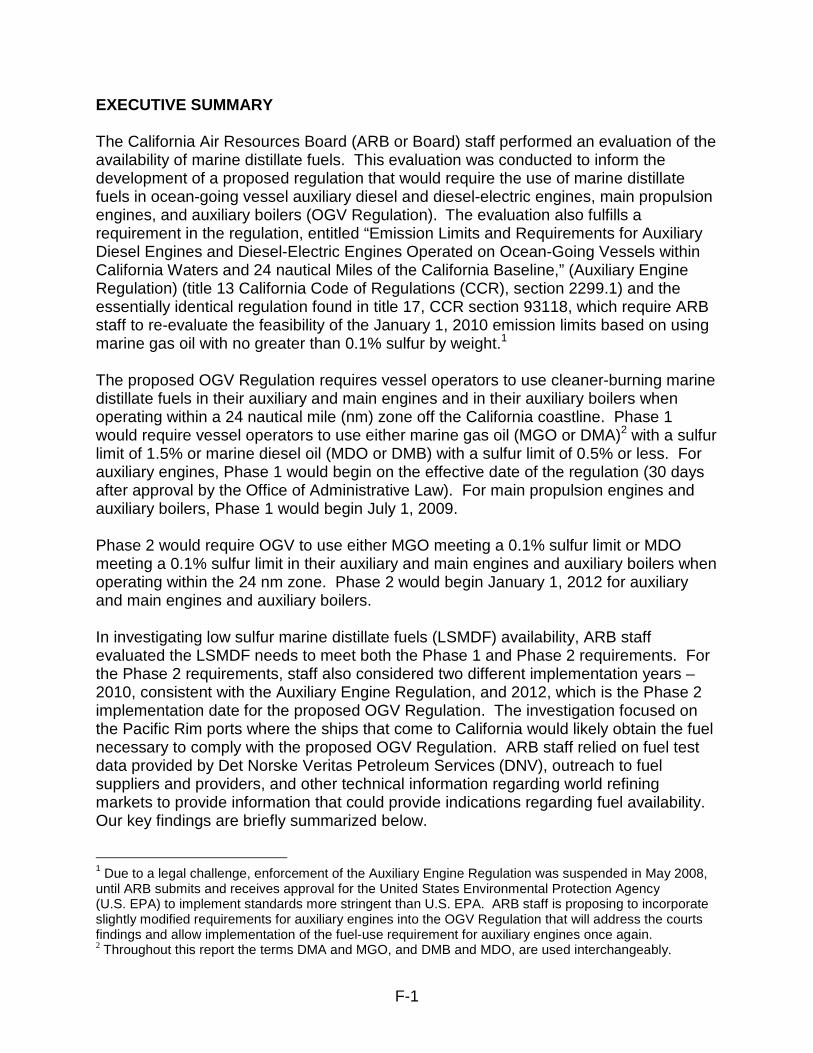
EXECUTIVE SUMMARY The California Air Resources Board (ARB or Board) staff performed an evaluation of the availability of marine distillate fuels. This evaluation was conducted to inform the development of a proposed regulation that would require the use of marine distillate fuels in ocean-going vessel auxiliary diesel and diesel-electric engines, main propulsion engines, and auxiliary boilers (OGV Regulation). The evaluation also fulfills a requirement in the regulation, entitled “Emission Limits and Requirements for Auxiliary Diesel Engines and Diesel-Electric Engines Operated on Ocean-Going Vessels within California Waters and 24 nautical Miles of the California Baseline,” (Auxiliary Engine Regulation) (title 13 California Code of Regulations (CCR), section 2299.1) and the essentially identical regulation found in title 17, CCR section 93118, which require ARB staff to re-evaluate the feasibility of the January 1, 2010 emission limits based on using marine gas oil with no greater than 0.1% sulfur by weight.1 The proposed OGV Regulation requires vessel operators to use cleaner-burning marine distillate fuels in their auxiliary and main engines and in their auxiliary boilers when operating within a 24 nautical mile (nm) zone off the California coastline. Phase 1 would require vessel operators to use either marine gas oil (MGO or DMA)2 with a sulfur limit of 1.5% or marine diesel oil (MDO or DMB) with a sulfur limit of 0.5% or less. For auxiliary engines, Phase 1 would begin on the effective date of the regulation (30 days after approval by the Office of Administrative Law). For main propulsion engines and auxiliary boilers, Phase 1 would begin July 1, 2009. Phase 2 would require OGV to use either MGO meeting a 0.1% sulfur limit or MDO meeting a 0.1% sulfur limit in their auxiliary and main engines and auxiliary boilers when operating within the 24 nm zone. Phase 2 would begin January 1, 2012 for auxiliary and main engines and auxiliary boilers. In investigating low sulfur marine distillate fuels (LSMDF) availability, ARB staff evaluated the LSMDF needs to meet both the Phase 1 and Phase 2 requirements. For the Phase 2 requirements, staff also considered two different implementation years – 2010, consistent with the Auxiliary Engine Regulation, and 2012, which is the Phase 2 implementation date for the proposed OGV Regulation. The investigation focused on the Pacific Rim ports where the ships that come to California would likely obtain the fuel necessary to comply with the proposed OGV Regulation. ARB staff relied on fuel test data provided by Det Norske Veritas Petroleum Services (DNV), outreach to fuel suppliers and providers, and other technical information regarding world refining markets to provide information that could provide indications regarding fuel availability. Our key findings are briefly summarized below.
1 Due to a legal challenge, enforcement of the Auxiliary Engine Regulation was suspended in May 2008, until ARB submits and receives approval for the United States Environmental Protection Agency (U.S. EPA) to implement standards more stringent than U.S. EPA. ARB staff is proposing to incorporate slightly modified requirements for auxiliary engines into the OGV Regulation that will address the courts findings and allow implementation of the fuel-use requirement for auxiliary engines once again. 2 Throughout this report the terms DMA and MGO, and DMB and MDO, are used interchangeably.

F-2
While overall, we believe the fuel specified in the proposed OGV Regulation will be available for vessel operators to purchase, there is some uncertainty surrounding our findings, particularly with respect to the availability of fuels to meet the Phase 2 specifications. There are thousands of ports throughout the world where OGV can obtain fuel and, out of necessity, we focused our investigation on selected Pacific Rim ports, and assumed that our findings also represent the ports not addressed. It was also difficult to obtain definitive fuel volume data, and many marine fuel suppliers’ responses hinged on whether or not the demand would be sufficient to warrant a change in fueling infrastructure or supply from the refiners. In some cases, language barriers existed, and it is not certain if the fuel supplier fully understood our questions or discussions. Other times, there was hesitancy in providing data due to confidentiality concerns. Last, and probably one of the more significant concerns, is that given the current global fuel and economic issues, constraints on supply, and uncertainty with the overall fuel markets, predicting future marine fuel markets is risky at best. It will be important to monitor implementation of the regulation and be prepared to make mid-course adjustments in the event the fuel is not available or if the fuels available cannot meet the ISO specifications for marine distillate fuels. Key Findings – Phase 1 Fuel Availability
• The amount of fuel needed to comply with the proposed regulation, about 1 million tons or about 1% of the worldwide volume of marine distillate fuels, is unlikely to have a significant impact on worldwide supply or demand for LSMDF.
• There is, and should continue to be a sufficient worldwide supply of LSMDF meeting the Phase 1 fuel specifications and this fuel should be available at all key fueling ports servicing California-bound OGVs. Most ports worldwide have MGO that meets the Phase 1 fuel specifications. About half of the ports worldwide have MDO that can meet the Phase 1 0.5% sulfur specification for MDO.
• Overall, we expect the average fuel sulfur content of MDO or MGO purchased to be about 0.3%.
• There may be some limited logistical or spot supply issues in obtaining Phase 1 fuel at some ports. However, we expect the number of ports that do not have marine distillate fuels to be very small.
Key Findings – Phase 2 Fuel Availability (2010)
• We expect in 2010, the worldwide volume of LSMDF that can meet the Phase 2 fuel specifications will exceed the 1 million tons required for implementation of the proposed regulation.
• For 2010, there will not be sufficient supply of the Phase 2 LSMDF at key Pacific Rim ports serving California-bound OGVs.
• The average sulfur content of MGO and MDO in 2007 at 25 of the 31 Pacific Rim ports exceeded the Phase 2 fuel sulfur specifications.

F-3
• It is unlikely that a sufficient supply will be available prior to 2012 due to crude supply, refining capacity, and fueling infrastructure improvements that will be needed.
Key Findings – Phase 2 Fuel Availability (2012)
• For 2012, the issues outlined above for 2010 should be lessened due to the additional time for fuel providers and suppliers to develop and implement the necessary fueling infrastructure.
• We expect supplies of LSMDF across the world to increase as refinery upgrades are made to meet the increasing demands for cleaner diesel fuels for land-based equipment, including on- and off-road vehicles. However, while there will be increases in lower sulfur fuels for land-based equipment, we cannot assume that this same fuel could also be used for marine (due to specifications, price premium, and competition).
• There are significant refinery projects underway and planned that are expected to provide additional refining capacity near those bunkering ports where LSMDF will be in demand. Refineries have a strong economic incentive to produce higher-value products, such as LSDMF, over residual fuel as long as the demand is present.
F-4
I. INTRODUCTION AND BACKGROUND In this report, ARB staff summarizes their evaluation of the availability of LSMDF. This evaluation was undertaken to support the development of the proposed regulation to require the use of cleaner low sulfur distillate fuels in OGV main engines, diesel-electric engines, auxiliary diesel engines, and auxiliary boilers (OGV engines and auxiliary boilers). In addition, this evaluation fulfills a requirement in the previously adopted Auxiliary Engine Regulation (title 13, section 22991.1 and title 17, section 99138) to re-evaluate the feasibility of the emission limits based on using MGO with no greater than 0.1% sulfur by weight in OGV auxiliary diesel engines. This evaluation must take into consideration the availability of 0.1% sulfur MGO at bunkering ports worldwide and the ability of petroleum refiners and marine fuel suppliers to deliver 0.1% sulfur fuel by January 1, 2010.3 The proposed regulation for OGV engines and boilers has a two-phase approach. Specifically, the proposed regulation requires OGVs operating within the 24 nm zone of the California coastline to switch from using heavy fuel oil in their main engines and boilers to MGO with a 1.5% sulfur limit or MDO with a 0.5% sulfur limit by July 1, 2009 in Phase 1 (for auxiliary engines, this phase would begin on the effective date of the regulation). In Phase 2, both the MGO and MDO must meet a 0.1% sulfur limit by January 1, 2012. A. Purpose and Objectives The purpose of the study is to fulfill our regulatory obligations and to support and inform the decision-making process for the proposed LSMDF requirements for OGV engines and auxiliary boilers within 24 nm of the California coastline. Our objective in this fuel availability evaluation is to assess the availability of LSMDF, both currently and in the future, at key bunkering ports for vessels that come to California ports. For the purposes of this study, LSMDF includes either MGO or MDO with fuel sulfur contents as specified by the proposed OGV engine and auxiliary boiler regulation. For successful implementation of the proposed fuel requirements in the OGV engine and boiler regulation, it is important that ship operators have the ability to purchase compliant fuels at the ports they visit in California or prior to coming to California.
3 In 2005, the ARB approved the Auxiliary Engine Regulation that, beginning on January 1, 2007, required cleaner marine distillate fuels to be used in OGV auxiliary engines visiting California. Due to a successful legal challenge, enforcement of the Auxiliary Engine Regulation was suspended in May 2008, and cannot resume until ARB obtains approval, called a wavier, from the United States Environmental Protection Agency (U.S. EPA) to implement state level standards. Given the lengthy time and uncertainty involved in obtaining U.S. EPA approval of waiver requests, staff is proposing to incorporate requirements for the fuel used in auxiliary engines into the proposed regulation for OGV engines and auxiliary boilers.

F-5
To fulfill our study objective, we: • identified key fueling ports for ships that visit California and evaluated the refinery
and supplier markets to determine their ability to provide MGO/MDO at various fuel sulfur levels;
• estimated the volumes of LSMDF needed to comply with California regulations
between the years of 2009 and 2020. This expected increase in demand was then compared with the overall total future demand for marine distillate fuels and the projected production volumes to determine if the volume of distillate fuels needed to comply with California regulations is likely to be available; and
• evaluated the current fuel sulfur contents of distillate fuels used throughout the
world using available data from DNV. This evaluation took into consideration data on the average fuel sulfur content of marine distillate fuels currently available, information from fuel suppliers/brokers regarding their ability to supply 0.1% sulfur distillate fuels now and in the future, and land-based regulations that may impact current and future supplies.

F-6
Table 1: Marine Fuel Types
Fuel Type Fuel Grades Common Industry Name Distillate DMX, DMA,
DMB, DMC Gas Oil or Marine Gas Oil
Intermediate IFO, 180, 380 Marine Diesel Fuel or Intermediate Fuel Oil
Residual RMA-RML Fuel oil or Residual Fuel oil US. EPA In-Use Marine Diesel Fuel, August 1999, EPA420-R-99-027
II. MARINE DISTILLATE FUELS A brief description of marine distillate fuels, including fuel specifications, volumes in California and worldwide, costs, suppliers, and distribution systems are discussed below. A. Fuel Specifications for Marine Distillate Fuels
Marine distillate fuels are generally referred to as DMX, DMA, DMB, and DMC, with the overall lowest sulfur content being the DMX fuel, and the highest sulfur content being the DMC fuel. DMX fuel represents a very small amount of marine fuel that is used, and it is only used for special applications, such as life boat engines and emergency generators. DMX is a very clean fuel that can be stored for longer periods of time with little concern about its quality deteriorating over the long term.
DMA is sometimes referred to as marine gas oil, or MGO, and is used when a cleaner or less polluting fuel is desired. MGO is the heavier middle fraction of distillate from the atmospheric distillation of crude oil. It has similar properties to on-road diesel fuels; specifically, the density, viscosity, heating value (caloric content), and carbon content of MGO are very similar to conventional fuel that is used for on- and off-road diesel engines.
DMB, often referred to as marine diesel oil, or MDO, is generally a blend of distillate fuel with residual fuel oil. DMB does not burn as cleanly as either DMX or DMA. The main difference between MGO and MDO is the sulfur content. DMC is the lowest quality grade of MDO and has the cheapest price of marine fuel available.
The International Standards Organization (ISO) sets standards for petroleum fuels. ISO 8217 includes quality parameters for marine distillate fuels, which are identified in Table 2.

F-7
Table 2: Fuel Specifications for Marine Distillate Fuels
Parameter Unit Limit DMX DMA DMB DMC
Density at 15 °C kg/m³ Max - 890.0 900.0 920.0
Viscosity at 40 ° C mm²/s Max 5.5 6.0 11.0 14.0
Viscosity at 40 °C mm²/s Min 1.4 1.5 - -
Micro Carbon Residue at 10% Residue
% m/m Max 0.30 0.30 - -
Micro Carbon Residue % m/m Max - - 0.30 2.50
Water % V/V Max - - 0.3 0.3
Sulfur c % (m/m) Max 1.0 1.5 2.0 2.0
Total Sediment Existent % m/m Max - - 0.10 0.10
Ash % m/m Max 0.01 0.01 0.01 0.05
Vanadium mg/kg Max - - - 100
Aluminum + Silicon mg/kg Max - - - 25
Flash point °C Min 43 60 60 60
Pour point, Summer °C Max - 0 6 6
Pour point, Winter °C Max - -6 0 0
Cloud point °C Max -16 - - -
Calculated Cetane Index
Min 45 40 35 -
Appearance Clear & Bright - -
Zinc d mg/kg Max - - 15
Phosphorus d mg/kg Max - - 15
Calcium d mg/kg Max - - 30
c
A sulfur limit of 1.5% m/m will apply in SOx Emission Control Areas designated by the International Maritime Organization, when its relevant Protocol comes into force. There may be local variations
d
The fuel shall be free of ULO. A fuel is considered to be free of ULO if one or more of the elements are below the limits. All three elements shall exceed the limits before deemed to contain ULO.
Source: ISO 8217 Third Edition 2005-11-01 Petroleum products - Fuels (class F) - Specifications of marine fuels

F-8
B. Expected Volumes of LSMDF Required to Comply wit h Proposed Regulation The ARB staff estimated the amount of fuel needed to switch from residual oil to marine distillate fuels within the 24 nm zone off the California coastline to comply with the proposed regulatory requirements. Fuel consumption was estimated by the same method used to estimate emissions, except that instead of multiplying estimated power usage for each engine, fuel, and mode by a pollutant emission factor, it was multiplied by a brake specific fuel consumption factor in grams per kilowatt-hour. The fuel consumption factors were obtained from a report prepared by Entec UK Ltd. (Entec, 2002) As shown in Table 3, the amount of LSMDF that will be required to service OGVs coming into California ports for compliance with the proposed OGV Regulation is estimated to be about 975,000 tons in 2012. The demand increases to a little over 1,000,000 tons in 2015 and 1,250,000 tons in 2020.
Table 3: Estimated Volumes of LSMDF Required for O GV to Comply with the Proposed OGV Regulation
Year Estimated LSMDF
(tons) 2009 926,943 2010 926,417 2011 950,145 2012 974,461 2013 999,338 2014 1,024,743 2015 1,060,522 2016 1,097,994 2017 1,137,229 2018 1,178,302 2019 1,221,289 2020 1,266,267
C. Current and Projected Volumes of LSMDF To put the current and projected volumes of LSMDF in perspective, it is useful to look at how marine fuels fit into total fuel oil demand worldwide. Marine fuels account for about 20 percent of the total fuel demand. Demand for marine fuels is projected to grow from an estimated 278 million tons in 2001 to an expected 500 million tons by 2020. (EPA, 2006) About 80 percent of this demand will be for residual oil, and the remaining 20 percent will be for marine distillate fuel. (Starcrest, 2005) Phase 1 of the proposed regulation requires OGV operators to use MGO with a 1.5% sulfur limit or MDO with a 0.5% sulfur limit oil in their OGV engines and auxiliary boilers. For auxiliary engines, the requirement begins upon the effective date of the regulation

F-9
and for main engines and auxiliary boilers, the fuel-use requirements begins on July 1, 2009. As previously shown in Table 3, we estimate about 925,000 tons of marine distillate fuels are needed by OGVs for compliance with the fuel-use requirement in the proposed regulation. With 20 percent of the world’s marine fuel sales being attributed to distillate it was estimated that about 80 million tons of marine distillate fuel will be used worldwide in 2010 and 100 million tons of is projected to be used in 2020. (EPA, 2006) If we assume that supply and demand are equal, on a worldwide basis, there appears to be adequate supply of marine distillate fuel available to meet the needs of California’s Phase 1 regulatory requirements of approximately a million tons per year. The California demand is about 1% of the total demand for marine distillate fuels. And, as will be discussed later in Chapter IV, it is readily available at ports throughout the world, including those Pacific Rim ports where the California ship trade typically obtains their fuel. The second phase, Phase 2, of the proposed regulation requires lower sulfur limits, MDO or MGO with 0.1% sulfur by January 1, 2012. While the volume of fuel required in 2012 is still a relatively small component of the overall demand for marine distillate fuels, it is difficult to determine what portion of the total marine distillate fuels will have fuel sulfur levels of 0.1% or less and if the ships coming to California will have access to an adequate volume of this fuel having 0.1% sulfur or less at ports where they typically fuel. In this section, we will only address the volume of 0.1% sulfur fuel available. In Chapter IV, we will discuss availability of 0.1% sulfur fuel at ports where the California ship trade typically fuel. There is no one single source of data that we can use to draw a definitive conclusion regarding the volume of 0.1% sulfur marine distillate fuels available in 2010 or 2012. However, there are trends and limited data that indicate that the volume of 0.1% LSMDF should increase globally over time. Historically, the demand for LSMDF has been low on a worldwide basis, however, this is beginning to change. Internationally there is a greater emphasis on LSMDF. The European Commissions (EU) Directive 2005/33/EC includes a 0.1% sulfur limit on fuel used by seagoing ships at berth in EU ports starting January 1, 2010. Because of this directive and an earlier directive (2005/32/ED) which introduced the MGO sulfur limit, there appears to be ample supply in Europe of MGO meeting the 0.1% sulfur limit for the EU. (Sustainable Shipping, 2008)4 At the International Maritime Organization (IMO), the Marine Environmental Protection Committee recently agreed to a proposal that would, if adopted, allow the creation of Emission Control Areas (ECA) that could limit the fuel sulfur to 0.1% beginning January 1, 2015. Here in California, there have also been several initiatives that have or will increase the demand for LSMDF, including adoption of the Auxiliary Engine Regulation, voluntary environmental programs by shipping companies, port programs that incentivize the use of LSMDF, and port lease requirements that require the use of
4 Even though 0.1% sulfur fuel is available in the EU, we cannot assume that it would be logistically feasible for California-bound vessels to obtain fuel in Europe. Most California-bound vessels appear to have routes that are primarily between Pacific Rim ports.
F-10
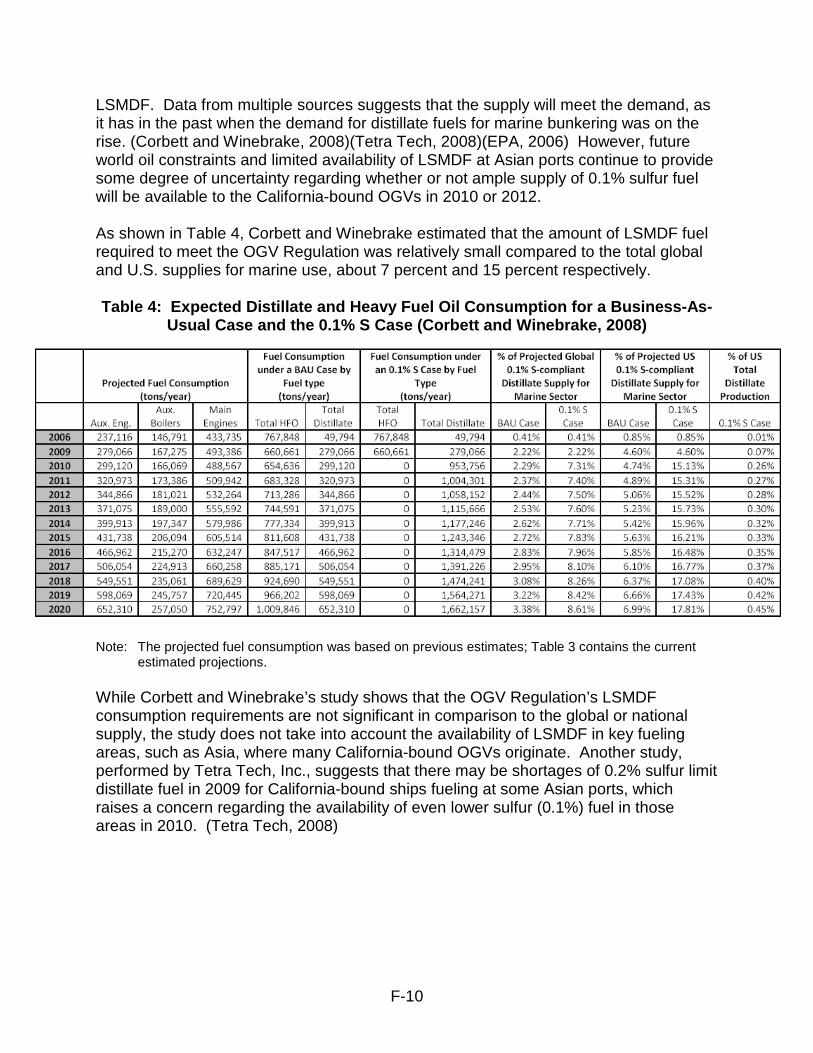
LSMDF. Data from multiple sources suggests that the supply will meet the demand, as it has in the past when the demand for distillate fuels for marine bunkering was on the rise. (Corbett and Winebrake, 2008)(Tetra Tech, 2008)(EPA, 2006) However, future world oil constraints and limited availability of LSMDF at Asian ports continue to provide some degree of uncertainty regarding whether or not ample supply of 0.1% sulfur fuel will be available to the California-bound OGVs in 2010 or 2012. As shown in Table 4, Corbett and Winebrake estimated that the amount of LSMDF fuel required to meet the OGV Regulation was relatively small compared to the total global and U.S. supplies for marine use, about 7 percent and 15 percent respectively. Table 4: Expected Distillate and Heavy Fuel Oil Co nsumption for a Business-As-
Usual Case and the 0.1% S Case (Corbett and Winebra ke, 2008)
Note: The projected fuel consumption was based on previous estimates; Table 3 contains the current
estimated projections.
While Corbett and Winebrake’s study shows that the OGV Regulation’s LSMDF consumption requirements are not significant in comparison to the global or national supply, the study does not take into account the availability of LSMDF in key fueling areas, such as Asia, where many California-bound OGVs originate. Another study, performed by Tetra Tech, Inc., suggests that there may be shortages of 0.2% sulfur limit distillate fuel in 2009 for California-bound ships fueling at some Asian ports, which raises a concern regarding the availability of even lower sulfur (0.1%) fuel in those areas in 2010. (Tetra Tech, 2008)

F-11
D. Current Costs and Trends for Low Sulfur Marine F uels The price of distillate fuels has risen along with the price of all petroleum products in the last several years. Figure 1 below shows the monthly price increase in MDO over the past seven years at the Port of Los Angeles. As shown, the price of MDO has risen over the past seven years from less than $200 per metric ton to over $900 per metric ton.
Figure 1: Bunkerworld MDO Monthly Average Price pe r Metric Ton History for Port of Los Angeles (Sep 2001 – Apr 2008)
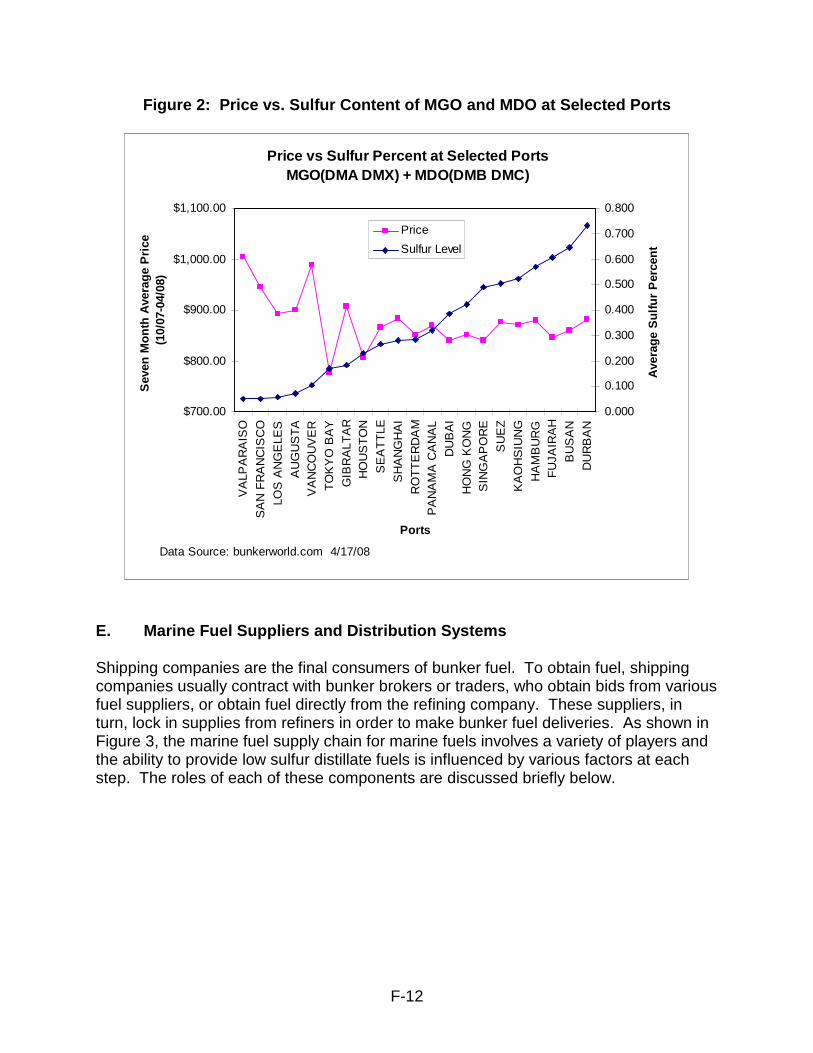
Examination of the current price difference between ports selling high and low sulfur distillate fuels can provide an indication of the price premium for the purchase of LSMDF at 0.1% sulfur or less. To do this, we compared the average price from Bunkerworld.com over a seven month period from October, 2007 through April, 2008 and the average sulfur content from 2007 fuel testing performed by Det Norske Veritas Petroleum Services at 21 ports worldwide with a range in average sulfur content. As shown in Figure 2 below, we did see a trend toward higher prices at ports offering lower sulfur fuel. Specifically, we found that the average price ($946/tonne) at the five ports selling low sulfur marine distillate fuel at or below 0.1% sulfur (Valparaiso, San Francisco, Los Angeles, Augusta, and Vancouver) was about $89 per tonne higher than the price ($857/tonne) at the16 ports selling fuel that averaged above 0.1% sulfur. This analysis does not necessarily indicate that there will be a premium on the order of $89 to purchase 0.1% sulfur fuel. For the ports that already sell marine distillate fuel that averages below 0.1% sulfur there may be little price premium. However, it does indicate that the lower sulfur fuel commands a higher price.
F-12
Figure 2: Price vs. Sulfur Content of MGO and MDO at Selected Ports
E. Marine Fuel Suppliers and Distribution Systems
Shipping companies are the final consumers of bunker fuel. To obtain fuel, shipping companies usually contract with bunker brokers or traders, who obtain bids from various fuel suppliers, or obtain fuel directly from the refining company. These suppliers, in turn, lock in supplies from refiners in order to make bunker fuel deliveries. As shown in Figure 3, the marine fuel supply chain for marine fuels involves a variety of players and the ability to provide low sulfur distillate fuels is influenced by various factors at each step. The roles of each of these components are discussed briefly below.
Price vs Sulfur Percent at Selected PortsMGO(DMA DMX) + MDO(DMB DMC)
$700.00
$800.00
$900.00
$1,000.00
$1,100.00
VA
LPA
RA
ISO
SA
N F
RA
NC
ISC
O
LOS
AN
GE
LES
AU
GU
ST
AV
AN
CO
UV
ER
TO
KY
O B
AY
GIB
RA
LTA
RH
OU
ST
ON
SE
AT
TLE
SH
AN
GH
AI
RO
TT
ER
DA
MP
AN
AM
A C
AN
AL
DU
BA
I
HO
NG
KO
NG
SIN
GA
PO
RE
SU
EZ
KA
OH
SIU
NG
HA
MB
UR
GF
UJA
IRA
H
BU
SA
N
DU
RB
AN
Ports
Sev
en M
onth
Ave
rage
Pric
e
(1
0/07
-04/
08)
0.000
0.100
0.200
0.300
0.400
0.500
0.600
0.700
0.800
Ave
rage
Sul
fur
Per
cent
Price
Sulfur Level
Data Source: bunkerworld.com 4/17/08

F-13
Figure 3: Marine Vessel Fuel Supply Chain
Adapted from (Starcrest, 2005)
Producers/Suppliers: The refinery is the first step in the process to supply marine fuels. Crude oil is refined (as discussed in the next section) using many different processes to make different petroleum products including LSMDF. In some cases, the refining company is the direct supplier of fuels to the shipping company or the marine market. More commonly, refiners will sell the marine fuels to a fuel supplier who will then arrange sales directly or through a broker or trader to the shipping company.
Trader/Brokers: Bunker fuel sales are arranged through one of several different types of traders and brokers. While these businesses may act simply as brokers to facilitate the sale and purchase of bunker fuel, many firms also engage in related financial services in order to assist purchasers in managing risk and exposure to changing fuel prices. For example, they may offer credit, spot purchasing, fuel contract design services, price risk management, forward purchase contracts (such as options), and arbitrage arrangements. Once a fuel purchase is confirmed, independent agents are typically hired by the shipping company to negotiate and coordinate the delivery of the fuel.
Bunker Delivery Service: Tug and barge companies facilitate the delivery of bunker fuel from the pier to the ship. The bunker fuel may either be already blended with necessary fuel additives or may be blended by the barge operators during the transportation and loading of the bunker fuel. Tug boats are involved in bringing the barges from the terminal area, taking the barges alongside the ships where the bunkers are discharged, and then bringing them back to the berthing facilities at the port terminal. Fuel can also be provided by truck or by barrel depending on the volume ordered, the ability of the supplier to fill fuel orders with existing fuel delivery systems, and if the fuel has unique specifications that could be compromised by transport in a barge that may have had a

F-14
different fuel. Companies providing both heavy fuel oil and marine distillate fuels need to insure that the fuel provided meets the ISO specifications. To ensure no cross contamination, fuel providers in many cases must have segregated systems for handling the different fuels. This will be even more critical once Phase 2 of the proposed regulation for OGV engines and auxiliary boilers is implemented. It is likely that additional fuel storage tanks, supply piping systems, transfer pumps, and fuel barges will be necessary to ensure the 0.1% sulfur fuel is not contaminated with higher sulfur fuel.

F-15
III. PRODUCTION OF LOW SULFUR MARINE DISTILLATE FUE LS The refining process used in making LSMDF is described in this section. Refineries are typically located at major consumption areas around the world. There are a variety of factors, from the type of crude oil to the complexity of the refinery that may influence the availability of LSMDF. These factors are discussed briefly below. A. Petroleum Refining
Petroleum refining is the process of making higher value products, such as gasoline and diesel, out of crude oil. The type and amount of products depends upon the complexity of the refinery and the crude oil stock that is being used. Crude oil can be thick or thin, and as such, has different densities, referred to as the API gravity. The API gravity is an index developed by the American Petroleum Institute to indicate the quality of the crude. High-gravity crudes usually have more of the lighter products and lower sulfur contents and make them easier to refine. Low-gravity crudes, with higher sulfur contents, requires more processing to take the sulfur out and needs a more complex refinery. A brief description of the refining process is presented below.
The refining process can be divided into three basic categories. The first is the separation process, or distillation, where the crude oil is separated usually by its boiling point into various fractions. The second process is upgrading where undesirable compounds are removed. An example of a common upgrading process is hydrotreating to remove sulfur. Finally, a third process is conversion where the fundamental molecular structure of the feedstock is changed. This is done typically in a hydrocracking unit where large hydrocarbon molecules are broken down into smaller ones to make more valuable lighter products such as gasoline. (Chevron, 2007) In the distillation process, crude oil is pumped into a distillation column or unit and the lightest hydrocarbons, such as gasoline, rise to the top and are removed. The middle weight products are successively removed at lower points on the column, such as kerosene and diesel. The bottom product is called residual. A simple diagram of the process is shown below in Figure 4.
Figure 4: Distillation of Crude Oil
Source: Chevron; Everything You Need to Know About Marine Fuels

F-16
The amount of sulfur present in fuels is directly related to the sulfur content of the crude oil from which it is processed. Efforts to remove sulfur at the refinery are done in the upgrading processes by hydrotreating, hydrodesulfurization, or other methods. High sulfur, or ‘sour’ crude oils require more processing to extract the higher amounts of sulfur. Lower sulfur, or ‘sweet’ crudes, are easier to refine and is less corrosive. A diagram of the processes that the crude goes through in a complex refinery is shown in Figure 5.
Figure 5: Refining Processes for Complex Refinery
Source: ARB, Enforcement Division Compliance Training Program
Refining Trends: Throughout the world there are trends towards more complex refining processes. This is in large part due to the increasingly more stringent regulations being imposed on transportation fuels. As shown in the following table, nations across the world are implementing standards requiring lower sulfur fuels for on-road vehicles, which will require more complex refining processes.
FlasherTops
FlasherBottoms
Kerosene
Light Gas Oil
Naphtha
Heavy Gas Oil
SulfurRecovery
VacuumDistillation
Hydro-Treating
Coker
Hydro-Treating
Hydro-Treating
Flu
id C
atal
ytic
Cra
ckin
g
Hydro-Cracking
Hydro-Treating
Alky-lation
SaturatedGasPlant
CatalyticReforming
Atm
osph
eric
Dis
tilla
tion
Residue
Sulfur
Fuel GasFuel GasPropaneButane
StraightRunGasoline
Reformate
Alkylate
HeavyCat.Gasoline
Hydro-crackate
Asphalt/ResidualFuels
Gas
Turbine Fuel
Diesel Fuel
LightCatGasoline

F-17
Table 5: Current and Proposed Sulfur Levels for Ve hicle Diesel Fuel in Asia, the European Union, and the United States
Source: Courtis, 2008 Refineries across the world are increasing capacity to meet the global oil product demand, including the demand for distillates. According to the International Energy Agency (IEA) global oil product demand is expected to increase by 1.9 million barrels per day (mb/d) while global crude distillation capacity is expected to increase by 10.6 by mb/d by 2012 (IEA, July 2007). Refineries are also investing heavily in hydrotreating capacity to remove sulfur from refined products. Hydrotreating capacity is expected to increase by 8.1 mb/d through to 2012. More than half of this total is reported to meet lower sulfur requirements (IEA, July, 2007). While many investments have been made, additional investments may be needed in upgrading refining capacities worldwide to meet not only ARB proposed regulatory requirements, but international sulfur oxide emission control areas (SECA).
F-18
IV. AVAILABILITY OF LOW SULFUR MARINE DISTILLATE FU EL In this section we describe our investigation of the availability of LSMDF for Phase 1 and Phase 2 of the proposed regulations. A. Availability of Marine Distillate Fuels to Meet the Phase 1 Fuel-Use
Requirements in the Proposed Regulation
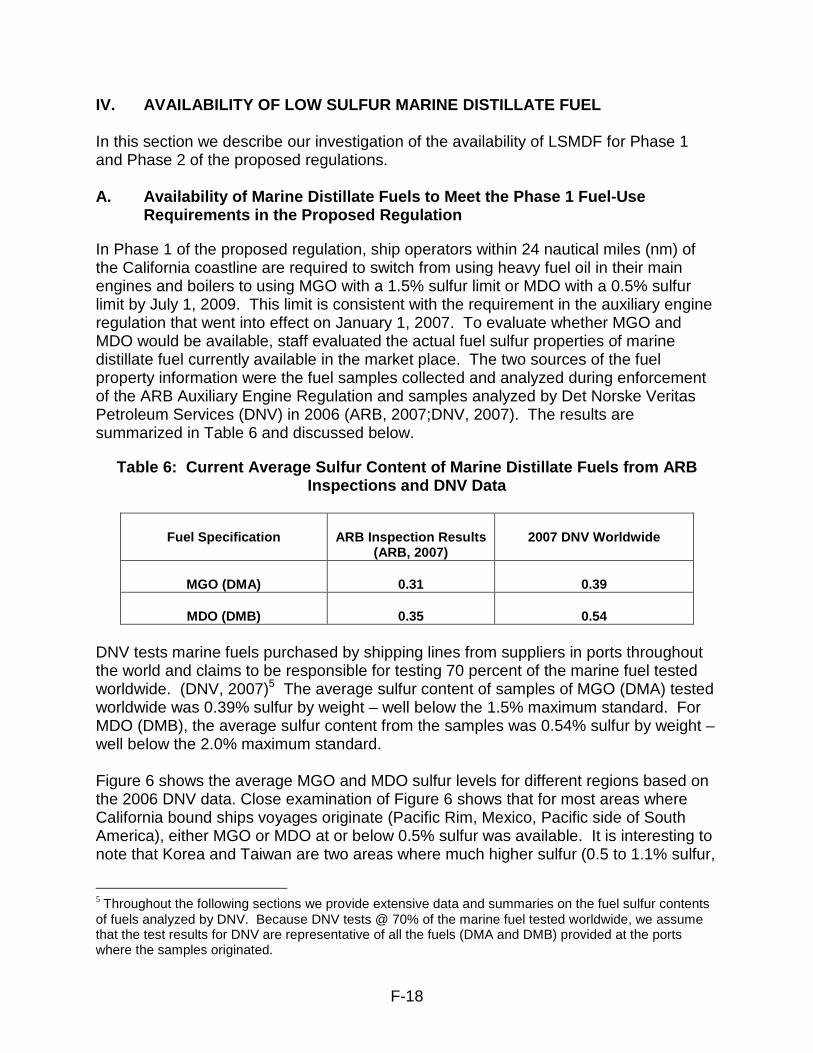
In Phase 1 of the proposed regulation, ship operators within 24 nautical miles (nm) of the California coastline are required to switch from using heavy fuel oil in their main engines and boilers to using MGO with a 1.5% sulfur limit or MDO with a 0.5% sulfur limit by July 1, 2009. This limit is consistent with the requirement in the auxiliary engine regulation that went into effect on January 1, 2007. To evaluate whether MGO and MDO would be available, staff evaluated the actual fuel sulfur properties of marine distillate fuel currently available in the market place. The two sources of the fuel property information were the fuel samples collected and analyzed during enforcement of the ARB Auxiliary Engine Regulation and samples analyzed by Det Norske Veritas Petroleum Services (DNV) in 2006 (ARB, 2007;DNV, 2007). The results are summarized in Table 6 and discussed below.
Table 6: Current Average Sulfur Content of Marine Distillate Fuels from ARB Inspections and DNV Data
Fuel Specification ARB Inspection Results (ARB, 2007)
2007 DNV Worldwide
MGO (DMA) 0.31 0.39
MDO (DMB) 0.35 0.54 DNV tests marine fuels purchased by shipping lines from suppliers in ports throughout the world and claims to be responsible for testing 70 percent of the marine fuel tested worldwide. (DNV, 2007)5 The average sulfur content of samples of MGO (DMA) tested worldwide was 0.39% sulfur by weight – well below the 1.5% maximum standard. For MDO (DMB), the average sulfur content from the samples was 0.54% sulfur by weight – well below the 2.0% maximum standard. Figure 6 shows the average MGO and MDO sulfur levels for different regions based on the 2006 DNV data. Close examination of Figure 6 shows that for most areas where California bound ships voyages originate (Pacific Rim, Mexico, Pacific side of South America), either MGO or MDO at or below 0.5% sulfur was available. It is interesting to note that Korea and Taiwan are two areas where much higher sulfur (0.5 to 1.1% sulfur,
5 Throughout the following sections we provide extensive data and summaries on the fuel sulfur contents of fuels analyzed by DNV. Because DNV tests @ 70% of the marine fuel tested worldwide, we assume that the test results for DNV are representative of all the fuels (DMA and DMB) provided at the ports where the samples originated.
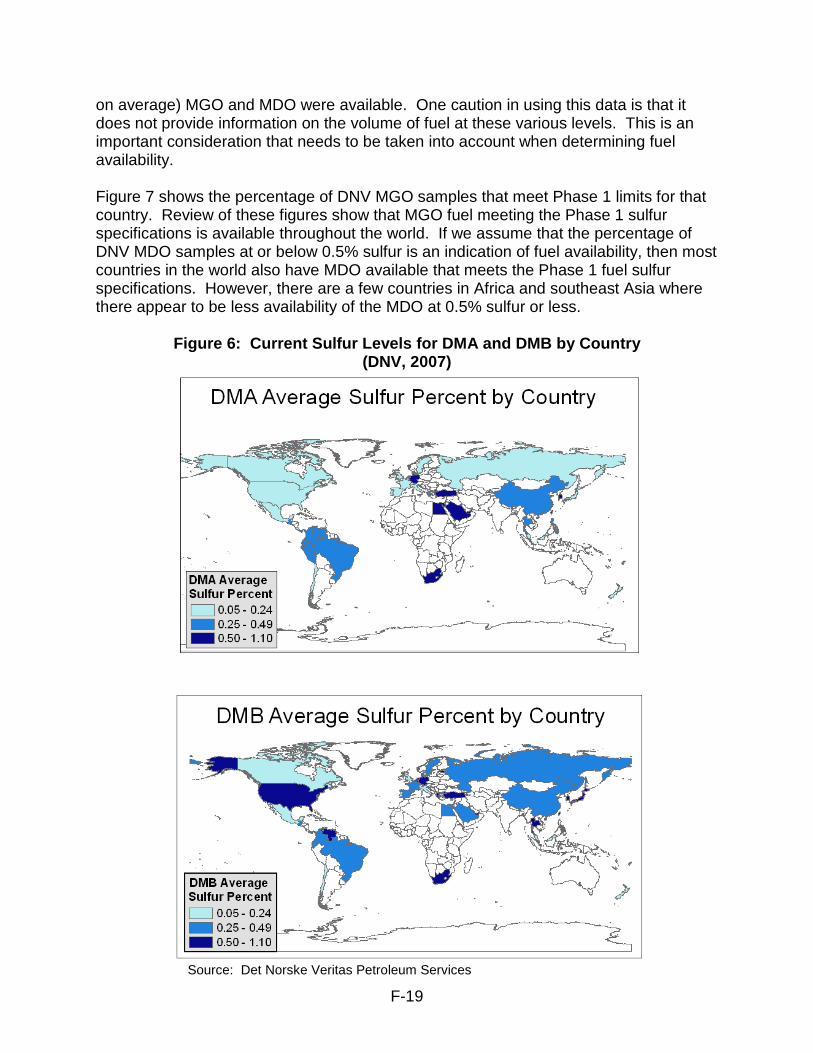
F-19
on average) MGO and MDO were available. One caution in using this data is that it does not provide information on the volume of fuel at these various levels. This is an important consideration that needs to be taken into account when determining fuel availability. Figure 7 shows the percentage of DNV MGO samples that meet Phase 1 limits for that country. Review of these figures show that MGO fuel meeting the Phase 1 sulfur specifications is available throughout the world. If we assume that the percentage of DNV MDO samples at or below 0.5% sulfur is an indication of fuel availability, then most countries in the world also have MDO available that meets the Phase 1 fuel sulfur specifications. However, there are a few countries in Africa and southeast Asia where there appear to be less availability of the MDO at 0.5% sulfur or less.
Figure 6: Current Sulfur Levels for DMA and DMB by Country (DNV, 2007)
Source: Det Norske Veritas Petroleum Services

F-20
Figure 7: Percentage of DNV Samples for DMA and DMB Within Ph ase 1 Fuel Sulfur Specifications by Country
Source: Det Norske Veritas Petroleum Services

F-21
Since most California-bound vessel voyages originate in the Pacific Rim, we also looked at DNV data from Pacific Rim ports. As shown in Figure 8 and tabulated in Table 7, the West Coast of North America clearly has the lowest average percent sulfur marine distillate available. However, there are a few additional ports where lower sulfur marine distillates are available such as Tauranga and Caldera.
Figure 8: Current Average Sulfur Levels for MGO an d MDO at Pacific Rim Ports (DNV, 2007)
Source: Det Norske Veritas Petroleum Services
F-22
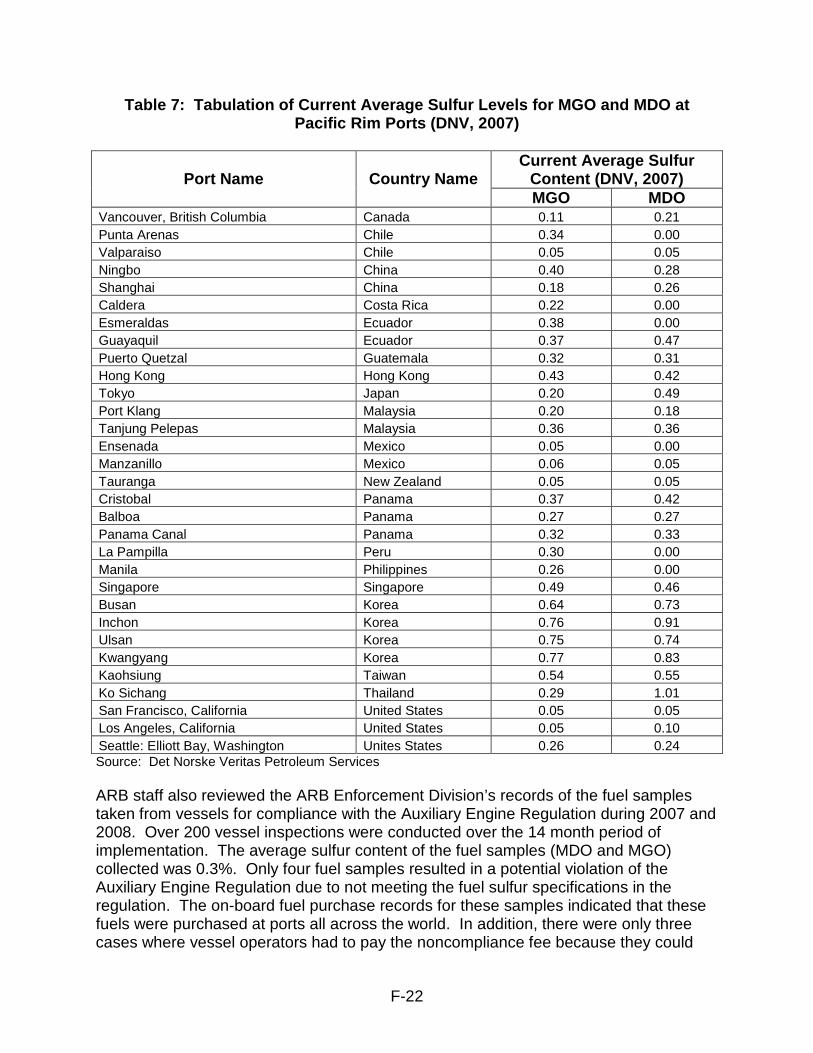
Table 7: Tabulation of Current Average Sulfur Levels for MGO and MDO at Pacific Rim Ports (DNV, 2007)
Current Average Sulfur
Content (DNV, 2007) Port Name Country Name MGO MDO
Vancouver, British Columbia Canada 0.11 0.21 Punta Arenas Chile 0.34 0.00 Valparaiso Chile 0.05 0.05 Ningbo China 0.40 0.28 Shanghai China 0.18 0.26 Caldera Costa Rica 0.22 0.00 Esmeraldas Ecuador 0.38 0.00 Guayaquil Ecuador 0.37 0.47 Puerto Quetzal Guatemala 0.32 0.31 Hong Kong Hong Kong 0.43 0.42 Tokyo Japan 0.20 0.49 Port Klang Malaysia 0.20 0.18 Tanjung Pelepas Malaysia 0.36 0.36 Ensenada Mexico 0.05 0.00 Manzanillo Mexico 0.06 0.05 Tauranga New Zealand 0.05 0.05 Cristobal Panama 0.37 0.42 Balboa Panama 0.27 0.27 Panama Canal Panama 0.32 0.33 La Pampilla Peru 0.30 0.00 Manila Philippines 0.26 0.00 Singapore Singapore 0.49 0.46 Busan Korea 0.64 0.73 Inchon Korea 0.76 0.91 Ulsan Korea 0.75 0.74 Kwangyang Korea 0.77 0.83 Kaohsiung Taiwan 0.54 0.55 Ko Sichang Thailand 0.29 1.01 San Francisco, California United States 0.05 0.05 Los Angeles, California United States 0.05 0.10 Seattle: Elliott Bay, Washington Unites States 0.26 0.24 Source: Det Norske Veritas Petroleum Services ARB staff also reviewed the ARB Enforcement Division’s records of the fuel samples taken from vessels for compliance with the Auxiliary Engine Regulation during 2007 and 2008. Over 200 vessel inspections were conducted over the 14 month period of implementation. The average sulfur content of the fuel samples (MDO and MGO) collected was 0.3%. Only four fuel samples resulted in a potential violation of the Auxiliary Engine Regulation due to not meeting the fuel sulfur specifications in the regulation. The on-board fuel purchase records for these samples indicated that these fuels were purchased at ports all across the world. In addition, there were only three cases where vessel operators had to pay the noncompliance fee because they could
F-23
not obtain the fuel required by the Auxiliary Engine Regulation. This is a very small number when compared to the estimated 13,000 vessel visits that occurred during the Auxiliary Engine Regulation implementation period. Based on the information discussed above, ARB staff believes Phase 1 LSMDF is expected to be available at most ports worldwide in 2009 and beyond. B. Availability of Marine Distillate Fuels to Meet the Phase 2 Fuel-Use
Requirements in the Proposed Regulation In Phase 2 of the proposed regulation, both MGO and MDO must meet a 0.1% sulfur limit by January 1, 2012. In addition, the Auxiliary Engine Regulation also includes a requirement that ARB staff reevaluate the feasibility of the January 1, 2010 fuel specification (0.1% sulfur MGO or MDO) in 2008. To evaluate the availability of 0.1% sulfur MGO and MDO, ARB staff identified key ports where California-bound vessels could potentially and investigated the ability of fuel providers to provide the fuel within the timeframe specified in the regulations. 1. Identification of Key Ports There are more than 400 ports around the world that have marine fuel bunkering operations. Since this report is intended to focus on the availability of LSMDF for OGVs that are visiting California, ARB staff narrowed the focus from a world-wide study of LSMDF availability to a more probable scenario of investigating ports with a higher likelihood of sourcing OGVs coming into California ports. ARB staff relied on information available from the California State Land Commission and information on the top twenty bunkering locations in the world (based upon the volume of bunkering fuel purchased and delivered) to select thirteen ports for further investigation. The California State Land Commission maintains records on originating ports for California-bound vessels. Data from the California State Land Commission for the years 2005 and 2006 indicated that 98 percent of all ship traffic coming into California ports originated from Pacific Rim ports. Using this data ARB ranked each port by the number of vessels that reported it as the last port-of-call prior to coming to California. From this list, we selected the 9 Pacific Rim ports that were consistently within the top 12 reported ports. In addition, Singapore and Panama were selected for evaluation due to the volume of bunkering that occurs at those ports. And, Los Angeles and San Francisco were selected to represent California bunkering ports. A summary of the thirteen ports selected is provided in Table 8 below.
F-24
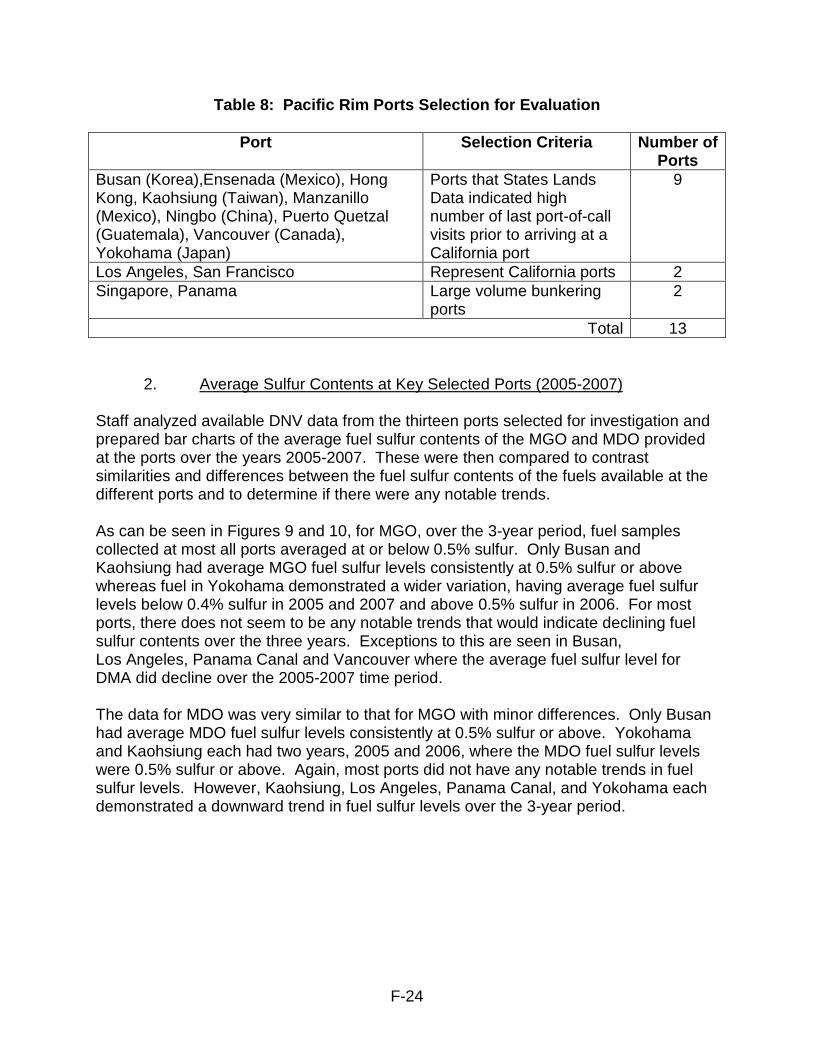
Table 8: Pacific Rim Ports Selection for Evaluatio n
Port Selection Criteria Number of Ports
Busan (Korea),Ensenada (Mexico), Hong Kong, Kaohsiung (Taiwan), Manzanillo (Mexico), Ningbo (China), Puerto Quetzal (Guatemala), Vancouver (Canada), Yokohama (Japan)
Ports that States Lands Data indicated high number of last port-of-call visits prior to arriving at a California port
9
Los Angeles, San Francisco Represent California ports 2 Singapore, Panama Large volume bunkering
ports 2
Total 13 2. Average Sulfur Contents at Key Selected Ports (2005-2007) Staff analyzed available DNV data from the thirteen ports selected for investigation and prepared bar charts of the average fuel sulfur contents of the MGO and MDO provided at the ports over the years 2005-2007. These were then compared to contrast similarities and differences between the fuel sulfur contents of the fuels available at the different ports and to determine if there were any notable trends. As can be seen in Figures 9 and 10, for MGO, over the 3-year period, fuel samples collected at most all ports averaged at or below 0.5% sulfur. Only Busan and Kaohsiung had average MGO fuel sulfur levels consistently at 0.5% sulfur or above whereas fuel in Yokohama demonstrated a wider variation, having average fuel sulfur levels below 0.4% sulfur in 2005 and 2007 and above 0.5% sulfur in 2006. For most ports, there does not seem to be any notable trends that would indicate declining fuel sulfur contents over the three years. Exceptions to this are seen in Busan, Los Angeles, Panama Canal and Vancouver where the average fuel sulfur level for DMA did decline over the 2005-2007 time period. The data for MDO was very similar to that for MGO with minor differences. Only Busan had average MDO fuel sulfur levels consistently at 0.5% sulfur or above. Yokohama and Kaohsiung each had two years, 2005 and 2006, where the MDO fuel sulfur levels were 0.5% sulfur or above. Again, most ports did not have any notable trends in fuel sulfur levels. However, Kaohsiung, Los Angeles, Panama Canal, and Yokohama each demonstrated a downward trend in fuel sulfur levels over the 3-year period.

F-25
Figure 9: Average Sulfur Content of MGO for Select ed Ports (2005-2007 DNV)
Figure 10: Average Sulfur Content for MDO for Sele cted Ports (2005-2007 DNV)
0
0.1
0.2
0.3
0.4
0.5
0.6
0.7
0.8
0.9
Bus
an
Ens
enad
a
Hon
g K
ong
Kao
hsiu
ng
Los
Ang
eles
Man
zani
llo
Nin
gbo
Pan
ama
Can
al
Pue
rto
Que
tzal
San
Fra
ncis
co
Sin
gapo
re
Van
couv
er
Yok
oham
a
Port Name
Per
cent
of S
ulfu
r C
onte
nt*
2005
2006
2007
*Sulfur content 0 means data are not available
0
0.1
0.2
0.3
0.4
0.5
0.6
0.7
0.8
0.9
Bus
an
Ens
enad
a
Hon
g K
ong
Kao
hsiu
ng
Los
Ang
eles
Man
zani
llo
Nin
gbo
Pan
ama
Can
al
Pue
rto
Que
tzal
San
Fra
ncis
co
Sin
gapo
re
Van
couv
er
Yok
oham
a
Port Name
Per
cent
of S
ulfu
r C
onte
nt
2005
2006
2007
*Sulfur content 0 means data are not available
F-26
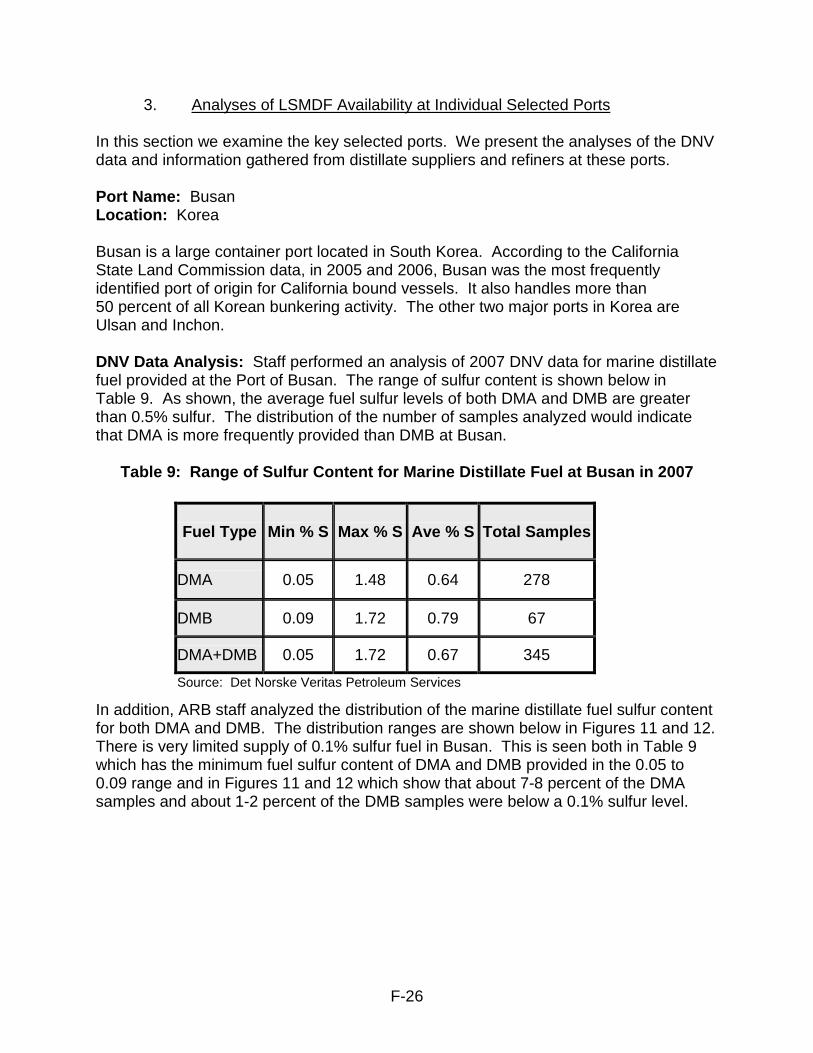
3. Analyses of LSMDF Availability at Individual Selected Ports In this section we examine the key selected ports. We present the analyses of the DNV data and information gathered from distillate suppliers and refiners at these ports. Port Name: Busan Location: Korea Busan is a large container port located in South Korea. According to the California State Land Commission data, in 2005 and 2006, Busan was the most frequently identified port of origin for California bound vessels. It also handles more than 50 percent of all Korean bunkering activity. The other two major ports in Korea are Ulsan and Inchon. DNV Data Analysis: Staff performed an analysis of 2007 DNV data for marine distillate fuel provided at the Port of Busan. The range of sulfur content is shown below in Table 9. As shown, the average fuel sulfur levels of both DMA and DMB are greater than 0.5% sulfur. The distribution of the number of samples analyzed would indicate that DMA is more frequently provided than DMB at Busan.
Table 9: Range of Sulfur Content for Marine Distil late Fuel at Busan in 2007
In addition, ARB staff analyzed the distribution of the marine distillate fuel sulfur content for both DMA and DMB. The distribution ranges are shown below in Figures 11 and 12. There is very limited supply of 0.1% sulfur fuel in Busan. This is seen both in Table 9 which has the minimum fuel sulfur content of DMA and DMB provided in the 0.05 to 0.09 range and in Figures 11 and 12 which show that about 7-8 percent of the DMA samples and about 1-2 percent of the DMB samples were below a 0.1% sulfur level.
Fuel Type Min % S Max % S Ave % S Total Samples
DMA 0.05 1.48 0.64 278
DMB 0.09 1.72 0.79 67
DMA+DMB 0.05 1.72 0.67 345
Source: Det Norske Veritas Petroleum Services

F-27
Figure 11: Fuel Sulfur Content Distribution for DM A at Busan in 2007
Percent of Samples by Sulfur Level DMA, BUSAN
0%
10%
20%
30%
40%
50%
60%
70%
80%
90%
100%
0.05 0.1
0.2
0.3
0.4
0.5
0.6
0.7
0.8
0.9
1.0
1.1
1.2
1.3
1.4
1.5
1.6
1.7
1.8
1.9
2.0
2.1
2.2
Percent Fuel Sulfur Level
Per
cent
of S
ampl
es
0%
10%
20%
30%
40%
50%
60%
70%
80%
90%
100%
Cum
ulat
ive
Per
cent
age
Percent of Samples
Cumulative Percentage
Total Samples: 278Det Norske Veritas 2007 Data
Figure 12: Fuel Sulfur Content Distribution for DM B at Busan in 2007
Percent of Samples by Sulfur Level DMB, BUSAN
0%
10%
20%
30%
40%
50%
60%
70%
80%
90%
100%
0.05 0.1
0.2
0.3
0.4
0.5
0.6
0.7
0.8
0.9
1.0
1.1
1.2
1.3
1.4
1.5
1.6
1.7
1.8
1.9
2.0
2.1
2.2
Percent Fuel Sulfur Level
Per
cent
of S
ampl
es
0%
10%
20%
30%
40%
50%
60%
70%
80%
90%
100%C
umul
ativ
e P
erce
ntag
e
Percent of Samples
Cumulative Percentage
Total Samples: 67Det Norske Veritas 2007 Data
F-28
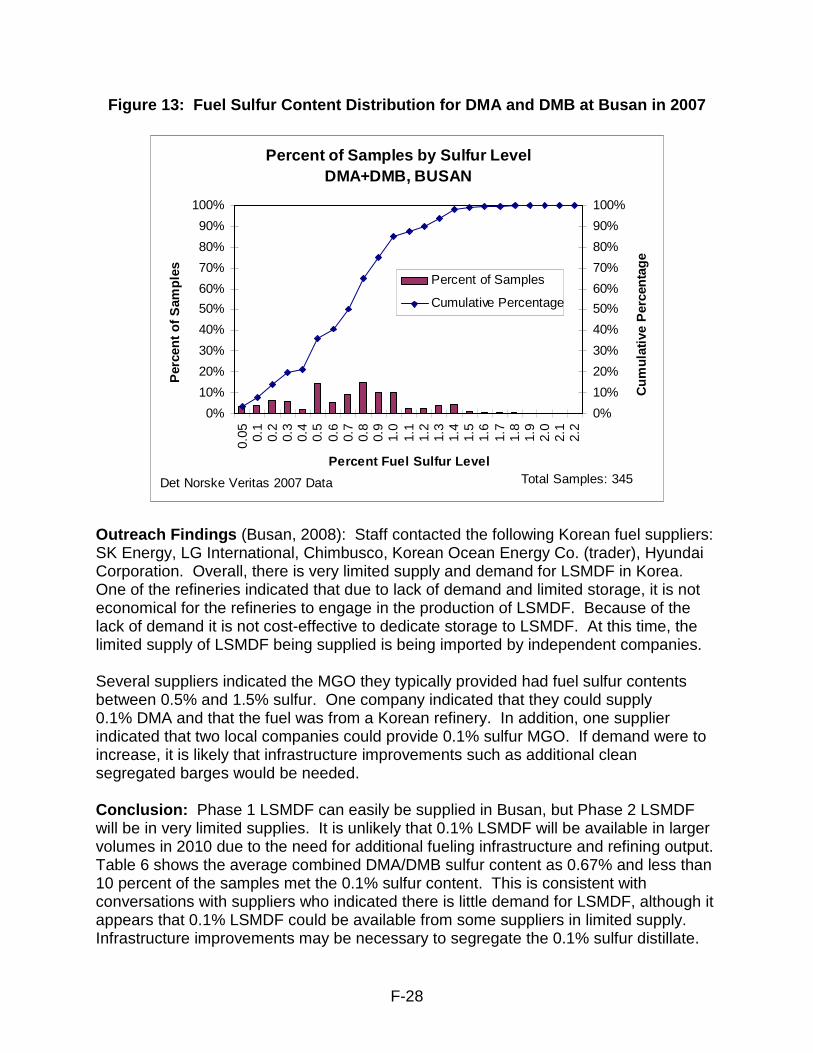
Figure 13: Fuel Sulfur Content Distribution for DM A and DMB at Busan in 2007
Outreach Findings (Busan, 2008): Staff contacted the following Korean fuel suppliers: SK Energy, LG International, Chimbusco, Korean Ocean Energy Co. (trader), Hyundai Corporation. Overall, there is very limited supply and demand for LSMDF in Korea. One of the refineries indicated that due to lack of demand and limited storage, it is not economical for the refineries to engage in the production of LSMDF. Because of the lack of demand it is not cost-effective to dedicate storage to LSMDF. At this time, the limited supply of LSMDF being supplied is being imported by independent companies. Several suppliers indicated the MGO they typically provided had fuel sulfur contents between 0.5% and 1.5% sulfur. One company indicated that they could supply 0.1% DMA and that the fuel was from a Korean refinery. In addition, one supplier indicated that two local companies could provide 0.1% sulfur MGO. If demand were to increase, it is likely that infrastructure improvements such as additional clean segregated barges would be needed. Conclusion: Phase 1 LSMDF can easily be supplied in Busan, but Phase 2 LSMDF will be in very limited supplies. It is unlikely that 0.1% LSMDF will be available in larger volumes in 2010 due to the need for additional fueling infrastructure and refining output. Table 6 shows the average combined DMA/DMB sulfur content as 0.67% and less than 10 percent of the samples met the 0.1% sulfur content. This is consistent with conversations with suppliers who indicated there is little demand for LSMDF, although it appears that 0.1% LSMDF could be available from some suppliers in limited supply. Infrastructure improvements may be necessary to segregate the 0.1% sulfur distillate.
Percent of Samples by Sulfur Level DMA+DMB, BUSAN
0%
10%
20%
30%
40%
50%
60%
70%
80%
90%
100%
0.05 0.1
0.2
0.3
0.4
0.5
0.6
0.7
0.8
0.9
1.0
1.1
1.2
1.3
1.4
1.5
1.6
1.7
1.8
1.9
2.0
2.1
2.2
Percent Fuel Sulfur Level
Per
cent
of S
ampl
es
0%
10%
20%
30%
40%
50%
60%
70%
80%
90%
100%
Cum
ulat
ive
Per
cent
age
Percent of Samples
Cumulative Percentage
Total Samples: 345Det Norske Veritas 2007 Data

F-29
However, as demand increases, there may be financial incentives for the refineries and suppliers to provide low sulfur distillate in the future and we would expect greater availability of 0.1% sulfur marine distillate fuels in 2012. Port Name: Ensenada Port Location: Mexico
The Port of Ensenada is located on an inlet of the Pacific Ocan in the Mexican State of Baja, California. According to the California State Land Commission data, Ensenada is one of the most common ports of origin for California-bound vessels due to its high concentration of passenger (cruise ship) OGVs. Outreach Findings (Ensenada/Manzanillo, 2008): PEMEX is Mexico’s state-owned refinery and there are four suppliers under contract with PEMEX that are authorized to supply MGO. Staff was able to successfully contact one supplier, Marinoil Servicios Maritimos SA de CV, who indicated that PEMEX produces one MGO product (DMA) which is very clean, approximately 300-400 ppm (0.03% sulfur – 0.04% sulfur). DMB is not supplied. It does not appear that there are any constraints on the current supply at the ports of Manzanillo and Ensenada. Fuel deliveries are delivered by clean barge, tankers, truck, dedicated to the clean DMA product. This supplier also indicated that the vessel operator only needs to provide two to three days of lead time when placing their order. According to the supplier, the infrastructure to supply LSMDF currently exists. This supplier also indicated that they are working with the cruise ship industry to try to provide additional infrastructure at the port of Ensenada to handle the cruise ships’ future LSMDF needs. They are in the process of evaluating what those future needs will be. ARB staff was unable to acquire the data to prepare charts comparing the percent of DMA or DMB samples at various sulfur levels. However, we do have the combined DNV data for the Port of Ensenada which is shown earlier in Figure 9. As can be seen, the average sulfur content for DMA in Ensenada is well below 0.1% sulfur for 2005-2007. There was no DMB data for Ensenada. Conclusion: Although staff was only able to contact one supplier, it appears as though Phase 1 and Phase 2 LSMDF is available in adequate supplies and that the infrastructure currently exists to continue to supply the increased demand. One supplier is currently evaluating the infrastructure at the port of Ensenada to determine if infrastructure changes are needed to accommodate future demand. DNV data also confirms that LSMDF is currently available and that the average sample is well below 0.1% sulfur.
F-30
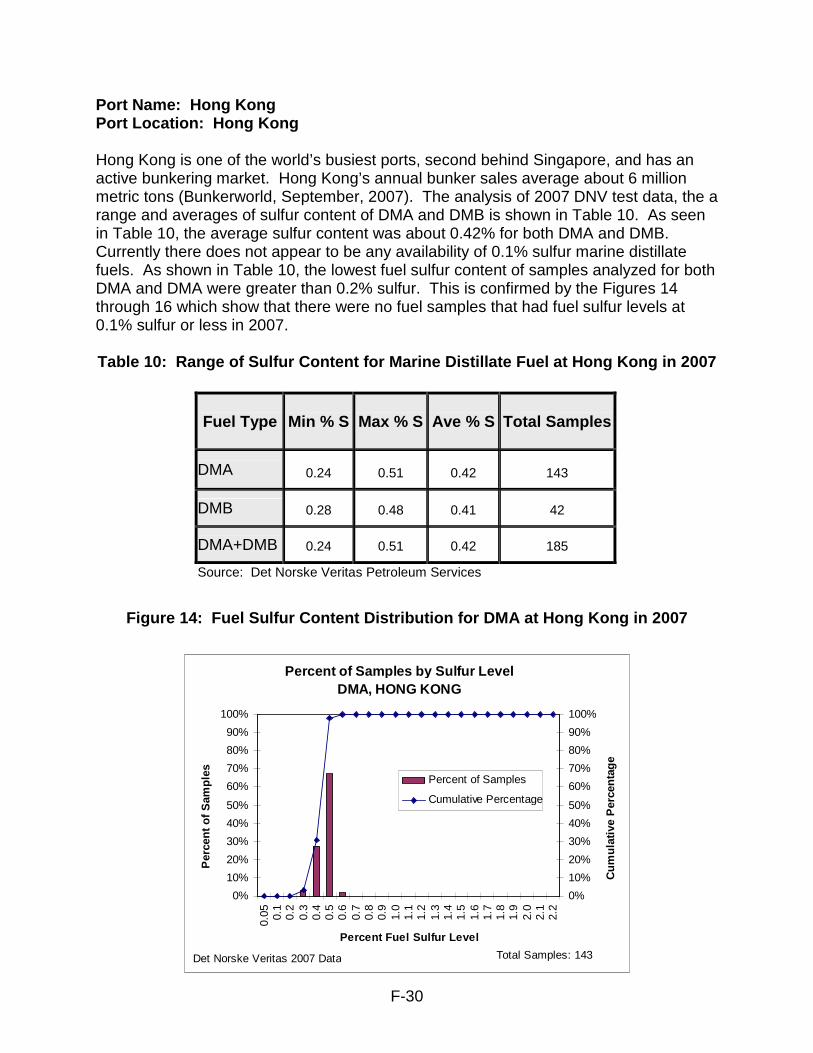
Port Name: Hong Kong Port Location: Hong Kong Hong Kong is one of the world’s busiest ports, second behind Singapore, and has an active bunkering market. Hong Kong’s annual bunker sales average about 6 million metric tons (Bunkerworld, September, 2007). The analysis of 2007 DNV test data, the a range and averages of sulfur content of DMA and DMB is shown in Table 10. As seen in Table 10, the average sulfur content was about 0.42% for both DMA and DMB. Currently there does not appear to be any availability of 0.1% sulfur marine distillate fuels. As shown in Table 10, the lowest fuel sulfur content of samples analyzed for both DMA and DMA were greater than 0.2% sulfur. This is confirmed by the Figures 14 through 16 which show that there were no fuel samples that had fuel sulfur levels at 0.1% sulfur or less in 2007. Table 10: Range of Sulfur Content for Marine Disti llate Fuel at Hong Kong in 2007
Figure 14: Fuel Sulfur Content Distribution for DM A at Hong Kong in 2007
Fuel Type Min % S Max % S Ave % S Total Samples
DMA 0.24 0.51 0.42 143
DMB 0.28 0.48 0.41 42
DMA+DMB 0.24 0.51 0.42 185
Source: Det Norske Veritas Petroleum Services
Percent of Samples by Sulfur Level DMA, HONG KONG
0%
10%
20%
30%
40%
50%
60%
70%
80%
90%
100%
0.05 0.1
0.2
0.3
0.4
0.5
0.6
0.7
0.8
0.9
1.0
1.1
1.2
1.3
1.4
1.5
1.6
1.7
1.8
1.9
2.0
2.1
2.2
Percent Fuel Sulfur Level
Per
cent
of S
ampl
es
0%
10%
20%
30%
40%
50%
60%
70%
80%
90%
100%
Cum
ulat
ive
Per
cent
age
Percent of Samples
Cumulative Percentage
Total Samples: 143Det Norske Veritas 2007 Data

F-31
Figure 15: Fuel Sulfur Content Distribution for DM B at Hong Kong in 2007
Figure 16: Fuel Sulfur Content Distribution for DM A and DMB at
Hong Kong in 2007
Percent of Samples by Sulfur Level DMA+DMB, HONG KONG
0%
10%
20%
30%
40%
50%
60%
70%
80%
90%
100%
0.05 0.1
0.2
0.3
0.4
0.5
0.6
0.7
0.8
0.9
1.0
1.1
1.2
1.3
1.4
1.5
1.6
1.7
1.8
1.9
2.0
2.1
2.2
Percent Fuel Sulfur Level
Per
cent
of S
ampl
es
0%
10%
20%
30%
40%
50%
60%
70%
80%
90%
100%
Cum
ulat
ive
Per
cent
age
Percent of Samples
Cumulative Percentage
Total Samples: 185Det Norske Veritas 2007 Data
Percent of Samples by Sulfur Level DMB, HONG KONG
0%
10%
20%
30%
40%
50%
60%
70%
80%
90%
100%
0.05 0.1
0.2
0.3
0.4
0.5
0.6
0.7
0.8
0.9
1.0
1.1
1.2
1.3
1.4
1.5
1.6
1.7
1.8
1.9
2.0
2.1
2.2
Percent Fuel Sulfur Level
Per
cent
of S
ampl
es
0%
10%
20%
30%
40%
50%
60%
70%
80%
90%
100%
Cum
ulat
ive
Per
cent
age
Percent of Samples
Cumulative Percentage
Total Samples: 42Det Norske Veritas 2007 Data

F-32
Outreach findings (Hong Kong, 2008): ARB staff contacted the following bunker suppliers: Sino PC Hong Kong Petroleum Ltd., Shell Hong Kong Ltd., ExxonMobil Marine Fuels (Singapore), and Bomin Bunker Oil Ltd. One additional company was also contacted, but requested confidentiality. For marine distillate fuels being supplied currently, most of the suppliers reported the MGO they provide has fuel sulfur contents less than or equal to 0.5%. One reported that they supplied MGO with fuel sulfur contents of 1.0% or less. One company reported that they do not supply MGO, only MDO and that the fuel sulfur content is typically 0.5% or less. Regarding the availability of 0.1% MGO or MDO, there currently is not much demand for the fuel. Some of the companies reported that they could provide the fuel if requested, however, others said that they do not supply the 0.1% LSMDF. Sources of the fuels supplied in Hong Kong vary. Fuel is obtained from refineries in Hong Kong and Singapore. It was also reported that fuel is imported from Korea or fuel suppliers in Singapore. It was difficult to obtain information regarding the additional infrastructure or fuel supply needs in the event there is more demand for 0.1% LSMDF. There were some indications that fuel storage may be an issue as space for additional fueling infrastructure is limited. Conclusion: Based on the data from DNV and the outreach, we believe fuels that can meet the Phase 1 LSMDF specifications are available at Hong Kong. No 0.1% LSMDF was supplied in 2007 and we do not anticipate the fuel being readily available in 2010. It is also uncertain if the 0.1% LSMDF will be available for Phase 2 in adequate volumes. It is difficult to predict what needs to happen to increase the supply based on our outreach efforts. However, there is some indication that additional fueling infrastructure may be needed. Port Name: Kaohsiung Port Location: Taiwan
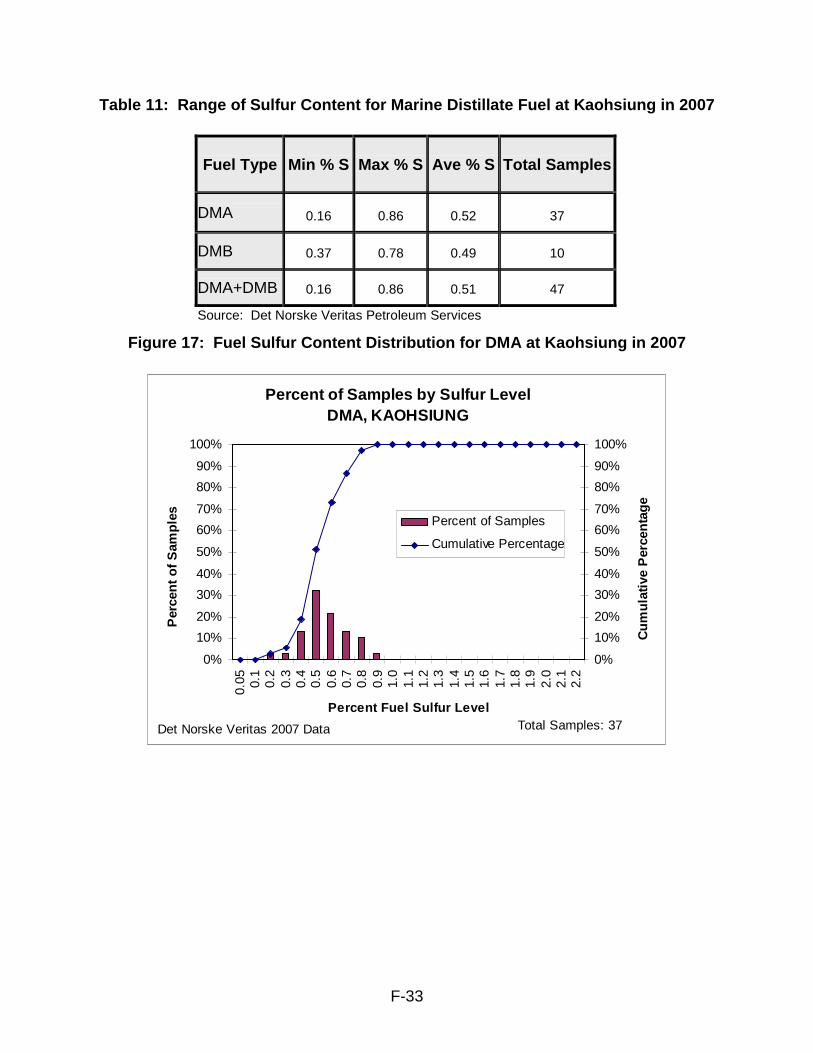
The Port of Kaohsiung is one of the top ten largest container ports of the world. As such, it has a large bunkering market. As domestic production of crude oil is insufficient to meet Taiwan’s demand for crude oil, almost all of the crude oil refined by the Chinese Petroleum Corporation (CPC – Taiwan’s only oil company) has to be imported. As seen in Table 11, the average sulfur content for DMA and DMB was higher than for other Pacific Rim ports, about 0.9% sulfur for DMA and 0.8% sulfur for DMB. Currently there does not appear to be any availability of 0.1% sulfur marine distillate fuels. As shown in Table 11, the lowest fuel sulfur content of samples analyzed for both DMA and DMA were greater than 0.1% sulfur. This is confirmed by the Figures 17 through 19 which show that there were no fuel samples that had fuel sulfur levels at 0.1% sulfur or less in 2007.
F-33
Table 11: Range of Sulfur Content for Marine Disti llate Fuel at Kaohsiung in 2007
Figure 17: Fuel Sulfur Content Distribution for DM A at Kaohsiung in 2007
Percent of Samples by Sulfur Level DMA, KAOHSIUNG
0%
10%
20%
30%
40%
50%
60%
70%
80%
90%
100%
0.05 0.1
0.2
0.3
0.4
0.5
0.6
0.7
0.8
0.9
1.0
1.1
1.2
1.3
1.4
1.5
1.6
1.7
1.8
1.9
2.0
2.1
2.2
Percent Fuel Sulfur Level
Per
cent
of S
ampl
es
0%
10%
20%
30%
40%
50%
60%
70%
80%
90%
100%
Cum
ulat
ive
Per
cent
age
Percent of Samples
Cumulative Percentage
Total Samples: 37Det Norske Veritas 2007 Data
Fuel Type Min % S Max % S Ave % S Total Samples
DMA 0.16 0.86 0.52 37
DMB 0.37 0.78 0.49 10
DMA+DMB 0.16 0.86 0.51 47
Source: Det Norske Veritas Petroleum Services

F-34
Figure 18: Fuel Sulfur Content Distribution for DM B at Kaohsiung in 2007
Percent of Samples by Sulfur Level DMB, KAOHSIUNG
0%
10%
20%
30%
40%
50%
60%
70%
80%
90%
100%
0.05 0.1
0.2
0.3
0.4
0.5
0.6
0.7
0.8
0.9
1.0
1.1
1.2
1.3
1.4
1.5
1.6
1.7
1.8
1.9
2.0
2.1
2.2
Percent Fuel Sulfur Level
Per
cent
of S
ampl
es
0%
10%
20%
30%
40%
50%
60%
70%
80%
90%
100%
Cum
ulat
ive
Per
cent
age
Percent of Samples
Cumulative Percentage
Total Samples: 10Det Norske Veritas 2007 Data
Figure 19: Fuel Sulfur Content Distribution for DM A and DMB at Kaohsiung in 2007
Percent of Samples by Sulfur Level DMA+DMB, KAOHSIUNG
0%
10%
20%
30%
40%
50%
60%
70%
80%
90%
100%
0.05 0.1
0.2
0.3
0.4
0.5
0.6
0.7
0.8
0.9
1.0
1.1
1.2
1.3
1.4
1.5
1.6
1.7
1.8
1.9
2.0
2.1
2.2
Percent Fuel Sulfur Level
Per
cent
of S
ampl
es
0%
10%
20%
30%
40%
50%
60%
70%
80%
90%
100%C
umul
ativ
e P
erce
ntag
e
Percent of Samples
Cumulative Percentage
Total Samples: 47Det Norske Veritas 2007 Data

F-35
Outreach findings (Kaohsiung, 2008): There are several bunker suppliers in Taiwan. ARB staff was able to contact one of the largest suppliers, Chinese Petroleum Corporation (CPC), and one international bunker supplier, Shell Marine Products. One of Taiwan’s smaller suppliers was also contacted but requested confidentiality. CPC dominates the marine fuel market in Taiwan and supplies marine fuel to the Ports of Keelung, Taichung, Kaohsiung, SUAO, and Hualien. These ports comprise the majority of ports in Taiwan. Other bunker suppliers in Taiwan are either small suppliers or traders associated with CPC. According to CPC, all the marine fuels supplied in Taiwan meet ISO 2817 (maximum sulfur content for MGO is 1.5%), however most MGO has sulfur contents of 1.0% or less. CPC also indicated they can provide MGO with sulfur contents as low as 0.4%. The small company reported that they provide MGO with 1.0% sulfur and MDO with 1.5% sulfur; however they primarily supply residual fuels. CPC owns two refineries and supplies their own fuel. The small company reported they obtain fuel from suppliers in Taiwan and in other countries. They also blends fuels. Currently none of the suppliers contacted indicated that they supply 0.1% LSMDF. In order to supply 0.1% LSMDF available, the suppliers in Taiwan stated that the MARPOL convention, European Union (EU), and all ports in the United States must require the low sulfur distillate fuel. Since new refinery equipment would need to be added, LSMDF costs would increase. CPC also expressed concern that the MGO sulfur requirement jumps too quickly from 1.5% in 2009 to 0.1% in 2012. Barges are used to deliver fuels to ships in Taiwan, and orders are usually placed 3 to 10 days in advance. Contamination is not a concern for now at the fuel sulfur levels they are providing, and the small company also indicated that there are authorities in Taiwan to test the fuel to make sure there is no contamination problem. The sulfur requirement for land based fuels in Taiwan is 0.005%. CPC indicated that they can mix the land based fuel for marine fuel which meets the ISO standards. Conclusion : Phase 1 LSMDF can currently be supplied. It is unlikely that Phase 2 LSMDF can be available in 2010 due to the need for refinery upgrades and associated fueling infrastructure. However, there appears to be a willingness to meet the demand if regulations are in place. Because of this, and the fact that there are several initiative or regulatory proposals under consideration throughout the world, we believe that there is the possibility that the needed refinery upgrades and fueling infrastructure will eventually be in place, increasing the probability of Phase 2 0.1% LSMDF availability in 2012.
F-36
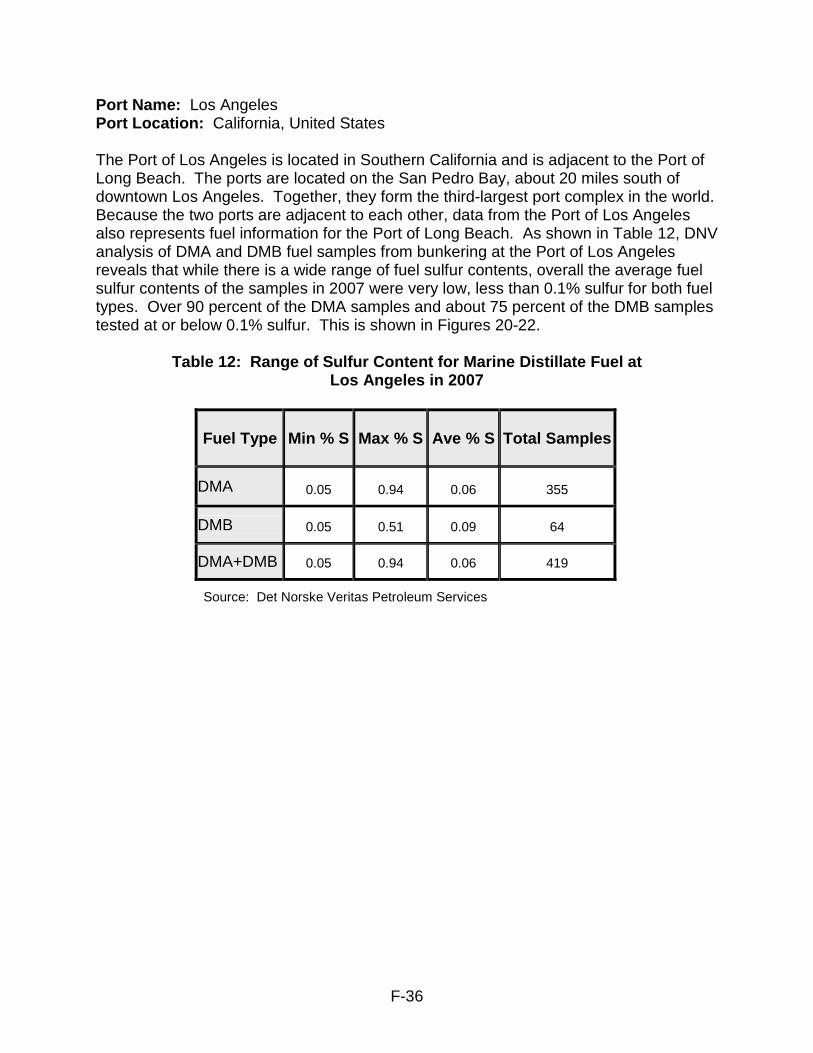
Port Name: Los Angeles Port Location: California, United States The Port of Los Angeles is located in Southern California and is adjacent to the Port of Long Beach. The ports are located on the San Pedro Bay, about 20 miles south of downtown Los Angeles. Together, they form the third-largest port complex in the world. Because the two ports are adjacent to each other, data from the Port of Los Angeles also represents fuel information for the Port of Long Beach. As shown in Table 12, DNV analysis of DMA and DMB fuel samples from bunkering at the Port of Los Angeles reveals that while there is a wide range of fuel sulfur contents, overall the average fuel sulfur contents of the samples in 2007 were very low, less than 0.1% sulfur for both fuel types. Over 90 percent of the DMA samples and about 75 percent of the DMB samples tested at or below 0.1% sulfur. This is shown in Figures 20-22.
Table 12: Range of Sulfur Content for Marine Disti llate Fuel at Los Angeles in 2007
Source: Det Norske Veritas Petroleum Services
Fuel Type Min % S Max % S Ave % S Total Samples
DMA 0.05 0.94 0.06 355
DMB 0.05 0.51 0.09 64
DMA+DMB 0.05 0.94 0.06 419

F-37
Figure 20: Fuel Sulfur Content Distribution for DM A at Los Angeles in 2007
Percent of Samples by Sulfur Level DMA, LOS ANGELES
0%
10%
20%
30%
40%
50%
60%
70%
80%
90%
100%
0.05 0.1
0.2
0.3
0.4
0.5
0.6
0.7
0.8
0.9
1.0
1.1
1.2
1.3
1.4
1.5
1.6
1.7
1.8
1.9
2.0
2.1
2.2
Percent Fuel Sulfur Level
Per
cent
of S
ampl
es
0%
10%
20%
30%
40%
50%
60%
70%
80%
90%
100%
Cum
ulat
ive
Per
cent
age
Percent of Samples
Cumulative Percentage
Total Samples: 355Det Norske Veritas 2007 Data
Figure 21: Fuel Sulfur Content Distribution for DM B at Los Angeles in 2007
Percent of Samples by Sulfur Level DMB, LOS ANGELES
0%
10%
20%
30%
40%
50%
60%
70%
80%
90%
100%
0.05 0.1
0.2
0.3
0.4
0.5
0.6
0.7
0.8
0.9
1.0
1.1
1.2
1.3
1.4
1.5
1.6
1.7
1.8
1.9
2.0
2.1
2.2
Percent Fuel Sulfur Level
Per
cent
of S
ampl
es
0%
10%
20%
30%
40%
50%
60%
70%
80%
90%
100%C
umul
ativ
e P
erce
ntag
e
Percent of Samples
Cumulative Percentage
Total Samples: 64Det Norske Veritas 2007 Data
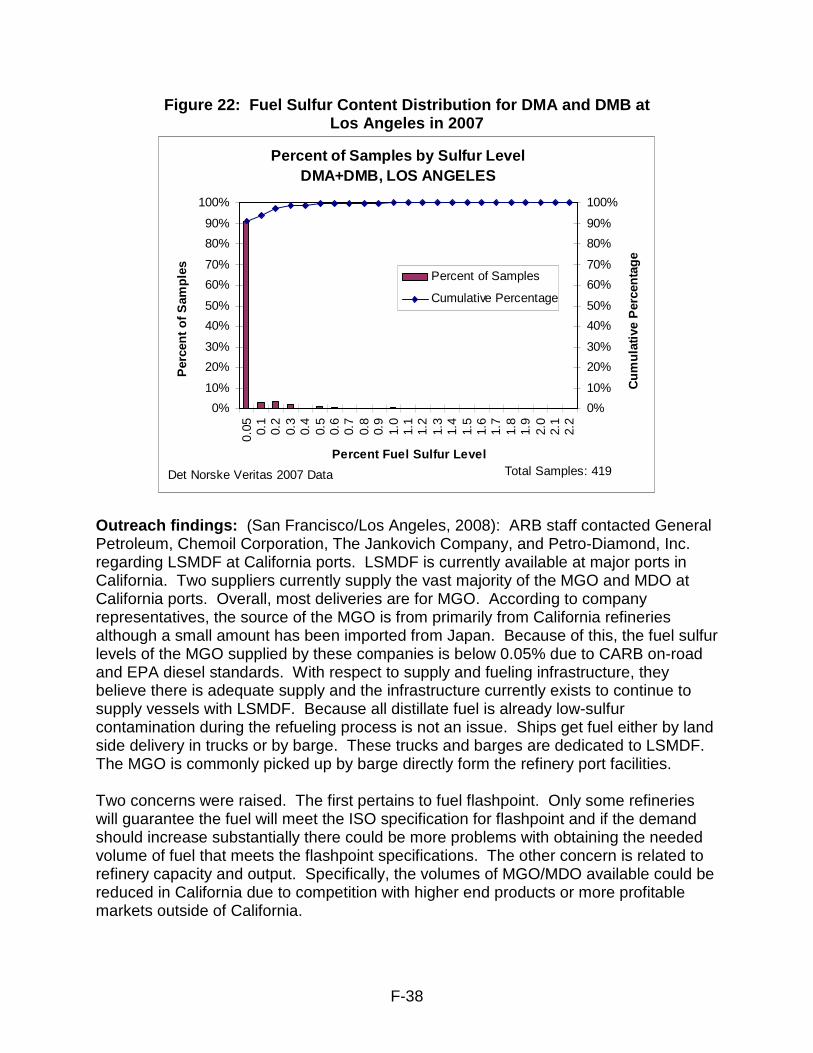
F-38
Figure 22: Fuel Sulfur Content Distribution for DM A and DMB at Los Angeles in 2007
Percent of Samples by Sulfur Level DMA+DMB, LOS ANGELES
0%
10%
20%
30%
40%
50%
60%
70%
80%
90%
100%
0.05 0.1
0.2
0.3
0.4
0.5
0.6
0.7
0.8
0.9
1.0
1.1
1.2
1.3
1.4
1.5
1.6
1.7
1.8
1.9
2.0
2.1
2.2
Percent Fuel Sulfur Level
Per
cent
of S
ampl
es
0%
10%
20%
30%
40%
50%
60%
70%
80%
90%
100%
Cum
ulat
ive
Per
cent
age
Percent of Samples
Cumulative Percentage
Total Samples: 419Det Norske Veritas 2007 Data
Outreach findings: (San Francisco/Los Angeles, 2008): ARB staff contacted General Petroleum, Chemoil Corporation, The Jankovich Company, and Petro-Diamond, Inc. regarding LSMDF at California ports. LSMDF is currently available at major ports in California. Two suppliers currently supply the vast majority of the MGO and MDO at California ports. Overall, most deliveries are for MGO. According to company representatives, the source of the MGO is from primarily from California refineries although a small amount has been imported from Japan. Because of this, the fuel sulfur levels of the MGO supplied by these companies is below 0.05% due to CARB on-road and EPA diesel standards. With respect to supply and fueling infrastructure, they believe there is adequate supply and the infrastructure currently exists to continue to supply vessels with LSMDF. Because all distillate fuel is already low-sulfur contamination during the refueling process is not an issue. Ships get fuel either by land side delivery in trucks or by barge. These trucks and barges are dedicated to LSMDF. The MGO is commonly picked up by barge directly form the refinery port facilities. Two concerns were raised. The first pertains to fuel flashpoint. Only some refineries will guarantee the fuel will meet the ISO specification for flashpoint and if the demand should increase substantially there could be more problems with obtaining the needed volume of fuel that meets the flashpoint specifications. The other concern is related to refinery capacity and output. Specifically, the volumes of MGO/MDO available could be reduced in California due to competition with higher end products or more profitable markets outside of California.
F-39
In addition, other suppliers did indicate an interest in supplying LSMDF, but that it would be costly to develop the infrastructure. These costs include segregated pumps, pipelines, and barges. For this reason, other suppliers contract out to one of the two companies who currently maintain such an infrastructure. Conclusion: Phase 1 and Phase 2 LSMDF availability is not an issue and is currently available in adequate supply. DNV data confirms that ships refueling at the Port of Los Angeles are receiving 0.1% LSMDF. As the demand increases, it is expected that the suppliers will be able to provide additional 0.1% LSMDF. However, much of that is dependent on whether the refineries will have the capacity to meet the demand. In addition, supplying MGO or MDO that meets the marine fuel flashpoint specification could be problematic. Port Name: Manzanillo Port Location: Mexico Manzanillo is Mexico’s largest port. Almost 90 percent of Mexico’s export trade goes to the United States or Canada. Manzanillo’s access to the western coast, as well as to the eastern seaboard through the Panama Canal make it a key port. ARB staff was unable to acquire the data to prepare charts comparing the percent of DMA or DMB samples at various sulfur levels. However, we do have the combined DNV data for the Port of Manzanillo which is shown in Figures 9 and 10. As can be seen, for both DMA and DMB, the average sulfur content is below 0.1% sulfur for 2005 to 2007. The suppliers that service the Port of Manzanillo also supply to Ensenada. The staff outreach and conclusions for Ensenada also apply to Manzanillo. Port Name: Ningbo Port Location: China
Ningbo is located mid-coastline of China on the Pacific Ocean. It is the fourth largest port in the world in terms of cargo volume and fifteenth largest in terms of container traffic. (Shipping Statistics Yearbook, 2006). China has several ports on its eastern coastline. The marine fuel bunker supply system is government-owned in China. . China has a supply of domestic marine fuel oil, but imports much of its marine fuel oil to keep pace with its rapid economic growth. As shown in Table 13, the fuel sulfur contents for DMA and DMB fuel samples analyzed by DNV from Ningbo ranged from a low of 0.1% sulfur to a high of 1.48% sulfur. DMA on average had a higher fuel sulfur content, 0.4% sulfur whereas DMB averaged about 0.3% sulfur. Based on this data set, it appears there is limited LSMDF at 0.1% sulfur or less in Ningbo.

F-40
Table 13: Range of Sulfur Content for Marine Disti llate Fuel at Ningbo in 2007
Fuel Type Min % S Max % S Ave % S
Total Samples
DMA 0.10 1.48 0.40 N/A
DMB 0.15 0.39 0.28 N/A DMA + DMB 0.10 1.48 N/A N/A Source: Det Norske Veritas Petroleum Services
Outreach findings (Ningbo, 2008): Staff was able to talk several bunker suppliers, including the largest fuel supplier in China, China Marine Bunker Supply Co, and one of the smaller suppliers, Brightway Petroleum (Holdings) Co Ltd. International bunker suppliers such as Shell Marine Products and Bomin Bunker Oil Ltd. were also contacted. The biggest fuel supplier in China is dominating the marine fuel market in China, and they provide marine fuels to almost all the ports in China. These international bunker suppliers collaborate with this biggest supplier to provide marine fuel to their clients that need fuel from China. In general, the MGO supplied by China meets ISO 8217 (including max sulfur, flash point, and lubricity). The biggest supplier indicated that the sulfur content in the MGO they provide is 0.45%. They haven’t seen any demand of 0.1% sulfur MGO yet, and they currently don’t have 0.1% sulfur MGO available. However, there is a low demand of 0.2% sulfur MGO in Shanghai, and it is about 5,000 metric tonnes per month. One of the international bunker suppliers stated that they provide various sulfur level marine fuels world-wide based on the needs of the ports and the regulations applied to the ports they serve. If they have clients that need 0.1% sulfur MGO, they can provide it. Marine fuels in China are mainly imported from Singapore, Korea, Malaysia, and Japan. The suppliers indicated that, in order to make the 0.1% sulfur fuel available, policies and regulations must be in place, which consequently will yield demands for the low sulfur fuel. And more importantly, refineries must be able to produce the low sulfur fuel. Besides the availability of the low sulfur fuel, all the suppliers expressed concerns about the high price of the low sulfur fuel. Pipes, barges, and trucks are used to deliver the marine fuel to the ships in China. Orders are typically placed 3 to 5 days in advance, whereas the smaller supplier indicated that the orders from their clients are usually placed 7 to14 days in advance. Since the suppliers in China mainly supply only one type of fuel, they don’t have much concern about contamination for now. Currently, the land based fuels are not used or blended for marine fuel in China. In the event additional grades of fuel are provided, such as the 0.1% LSMDF, it is conceivable that additional fueling infrastructure would need to be developed to avoid cross-contamination.
F-41
Conclusion: Phase 1 LSMDF can be supplied, but for Phase 2 there is no demand and suppliers in China do not currently supply 0.1% sulfur distillate. However, there is limited demand and availability for 0.2% sulfur MGO in China. It appears that suppliers will respond to the demand provided there are mandates in place and that the refineries have the capability to produce and deliver the fuel. For this reason, we think it is unlikely that the 0.1% LSMDF will be available in 2010 due to fuel supply constraints and infrastructure needs. However, with the increasing number of regulations and mandates calling for 0.1% LSMDF, we expect that within 3 years the fuel supply and infrastructure limitations would be lessened. Port Name: Puerto Quetzal Port Location: Guatemala This non-land based port provides significant numbers of OGVs into California. Puerto Quetzal is located off the coast of Guatemala in the Pacific Ocean in Central America. It is mainly a dry bulk cargo terminal, but can also handle container, RoRos, general and liquid bulk cargo and passenger ships. Although no DNV raw data is available for Puerto Quetzal, Figures 9 and 10 show the 2005 and 2007 average sulfur content for DMA is approximately 0.3% sulfur. For DMB, data for 2007 shows the sulfur content is approximately 0.3% sulfur. No DMB averages were available for DMB for 2005 and 2007. Outreach Findings (Puerto Quetzal, 2008): ARB staff was only able to successfully contact one supplier, Exxon-Mobile, which supplies MGO that meets ISO specifications. This supplier provided minimal information and indicated that they could not provide 0.1% LSMDF. They stated that the infrastructure was limited and it was unlikely that LSMDF could be provided. Conclusion : It is likely that Phase 1 LSMDF could be provided given the average DMA and DMB sulfur contents around 0.3% sulfur. However, with limited data and information, it is unknown whether Phase 2 LSMDF could be supplied currently or in the future. Port Name: Panama Canal Port Location: Central America OGVs have increased their usage of Panama for bunkering as a result of longer canal waiting times and competitively priced bunker fuel prices. The bunker market in Panama is one of the most competitive and open markets in Latin America. As shown previously in Figures 9 and 10, DNV data does show both DMA and DMB sulfur levels decreasing from 2005 through 2007. Figure 9 shows average DMA sulfur levels decreasing from 0.5% sulfur in 2005 to approximately 0.3% sulfur in 2007.

F-42
Similarly, Figure 10 shows DMB average sulfur levels decreasing from 0.5% sulfur in 2005 to 0.3% sulfur in 2007. In 2007,the average fuel sulfur content for both DMA and DMB was about 0.3%S (Table 14). A very small percentage, less than 2% had fuel sulfur levels at 0.1% sulfur or less (Figures 23-25).
Table 14: Range of Sulfur Content for Marine Dist illate Fuel at Panama Canal in 2007
Figure 23: Fuel Sulfur Content Distribution for DM A at Panama Canal in 2007
Percent of Samples by Sulfur Level DMA, PANAMA CANAL
0%
10%
20%
30%
40%
50%
60%
70%
80%
90%
100%
0.05 0.1
0.2
0.3
0.4
0.5
0.6
0.7
0.8
0.9
1.0
1.1
1.2
1.3
1.4
1.5
1.6
1.7
1.8
1.9
2.0
2.1
2.2
Percent Fuel Sulfur Level
Per
cent
of S
ampl
es
0%
10%
20%
30%
40%
50%
60%
70%
80%
90%
100%
Cum
ulat
ive
Per
cent
age
Percent of Samples
Cumulative Percentage
Total Samples: 163Det Norske Veritas 2007 Data
Fuel Type Min % S Max % S Ave % S Total Samples
DMA 0.07 0.70 0.32 163
DMB 0.06 0.51 0.32 91
DMA+DMB 0.06 0.70 0.32 254
Source: Det Norske Veritas Petroleum Services
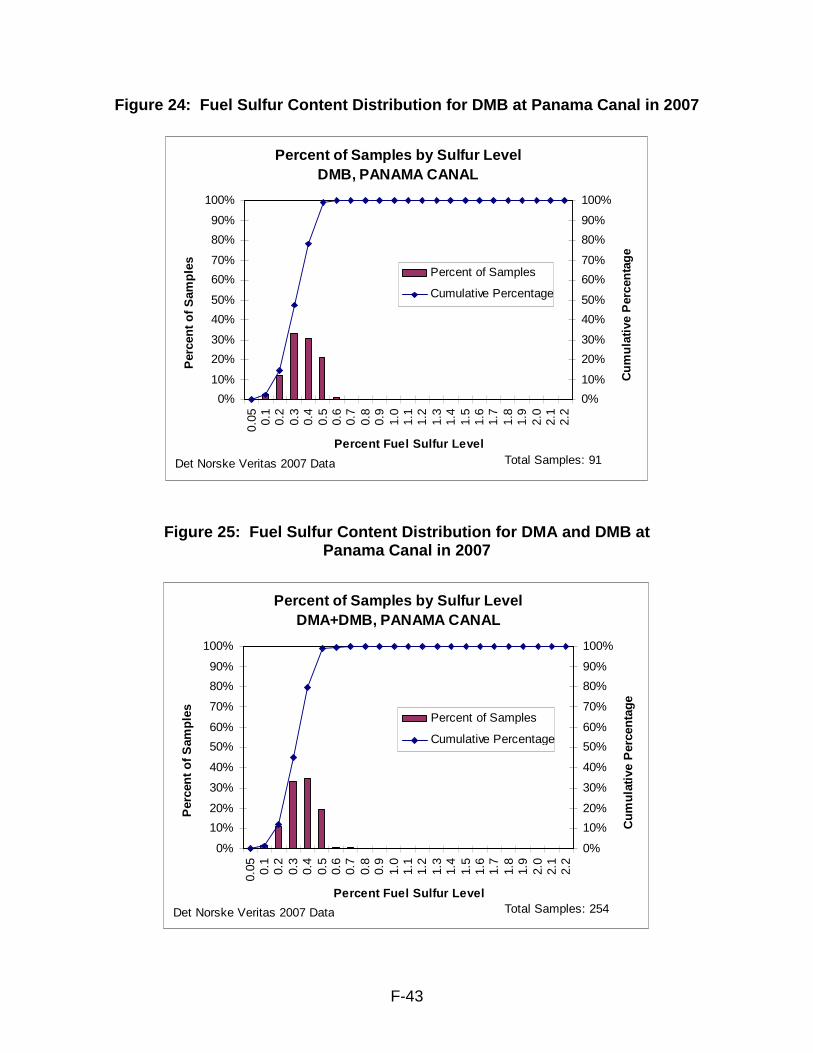
F-43
Figure 24: Fuel Sulfur Content Distribution for DM B at Panama Canal in 2007
Percent of Samples by Sulfur Level DMB, PANAMA CANAL
0%
10%
20%
30%
40%
50%
60%
70%
80%
90%
100%
0.05 0.1
0.2
0.3
0.4
0.5
0.6
0.7
0.8
0.9
1.0
1.1
1.2
1.3
1.4
1.5
1.6
1.7
1.8
1.9
2.0
2.1
2.2
Percent Fuel Sulfur Level
Per
cent
of S
ampl
es
0%
10%
20%
30%
40%
50%
60%
70%
80%
90%
100%
Cum
ulat
ive
Per
cent
age
Percent of Samples
Cumulative Percentage
Total Samples: 91Det Norske Veritas 2007 Data
Figure 25: Fuel Sulfur Content Distribution for DM A and DMB at Panama Canal in 2007
Percent of Samples by Sulfur Level DMA+DMB, PANAMA CANAL
0%
10%
20%
30%
40%
50%
60%
70%
80%
90%
100%
0.05 0.1
0.2
0.3
0.4
0.5
0.6
0.7
0.8
0.9
1.0
1.1
1.2
1.3
1.4
1.5
1.6
1.7
1.8
1.9
2.0
2.1
2.2
Percent Fuel Sulfur Level
Per
cent
of S
ampl
es
0%
10%
20%
30%
40%
50%
60%
70%
80%
90%
100%
Cum
ulat
ive
Per
cent
age
Percent of Samples
Cumulative Percentage
Total Samples: 254Det Norske Veritas 2007 Data
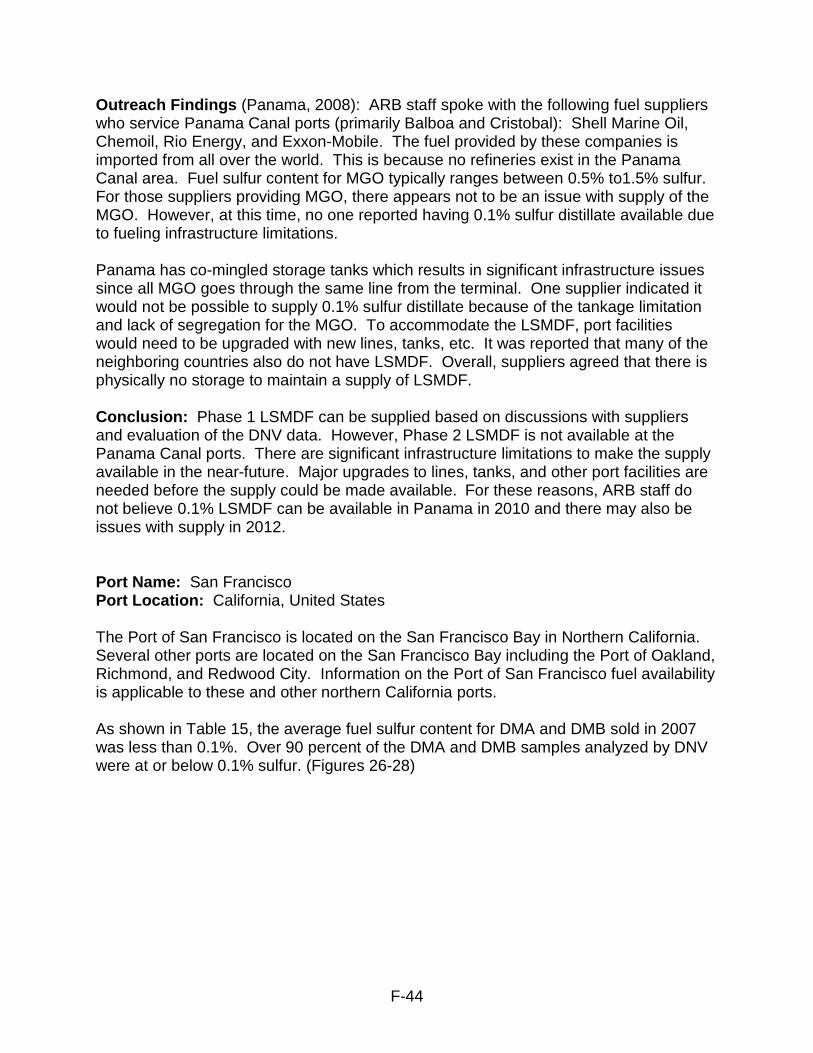
F-44
Outreach Findings (Panama, 2008): ARB staff spoke with the following fuel suppliers who service Panama Canal ports (primarily Balboa and Cristobal): Shell Marine Oil, Chemoil, Rio Energy, and Exxon-Mobile. The fuel provided by these companies is imported from all over the world. This is because no refineries exist in the Panama Canal area. Fuel sulfur content for MGO typically ranges between 0.5% to1.5% sulfur. For those suppliers providing MGO, there appears not to be an issue with supply of the MGO. However, at this time, no one reported having 0.1% sulfur distillate available due to fueling infrastructure limitations. Panama has co-mingled storage tanks which results in significant infrastructure issues since all MGO goes through the same line from the terminal. One supplier indicated it would not be possible to supply 0.1% sulfur distillate because of the tankage limitation and lack of segregation for the MGO. To accommodate the LSMDF, port facilities would need to be upgraded with new lines, tanks, etc. It was reported that many of the neighboring countries also do not have LSMDF. Overall, suppliers agreed that there is physically no storage to maintain a supply of LSMDF. Conclusion: Phase 1 LSMDF can be supplied based on discussions with suppliers and evaluation of the DNV data. However, Phase 2 LSMDF is not available at the Panama Canal ports. There are significant infrastructure limitations to make the supply available in the near-future. Major upgrades to lines, tanks, and other port facilities are needed before the supply could be made available. For these reasons, ARB staff do not believe 0.1% LSMDF can be available in Panama in 2010 and there may also be issues with supply in 2012. Port Name: San Francisco Port Location: California, United States The Port of San Francisco is located on the San Francisco Bay in Northern California. Several other ports are located on the San Francisco Bay including the Port of Oakland, Richmond, and Redwood City. Information on the Port of San Francisco fuel availability is applicable to these and other northern California ports. As shown in Table 15, the average fuel sulfur content for DMA and DMB sold in 2007 was less than 0.1%. Over 90 percent of the DMA and DMB samples analyzed by DNV were at or below 0.1% sulfur. (Figures 26-28)
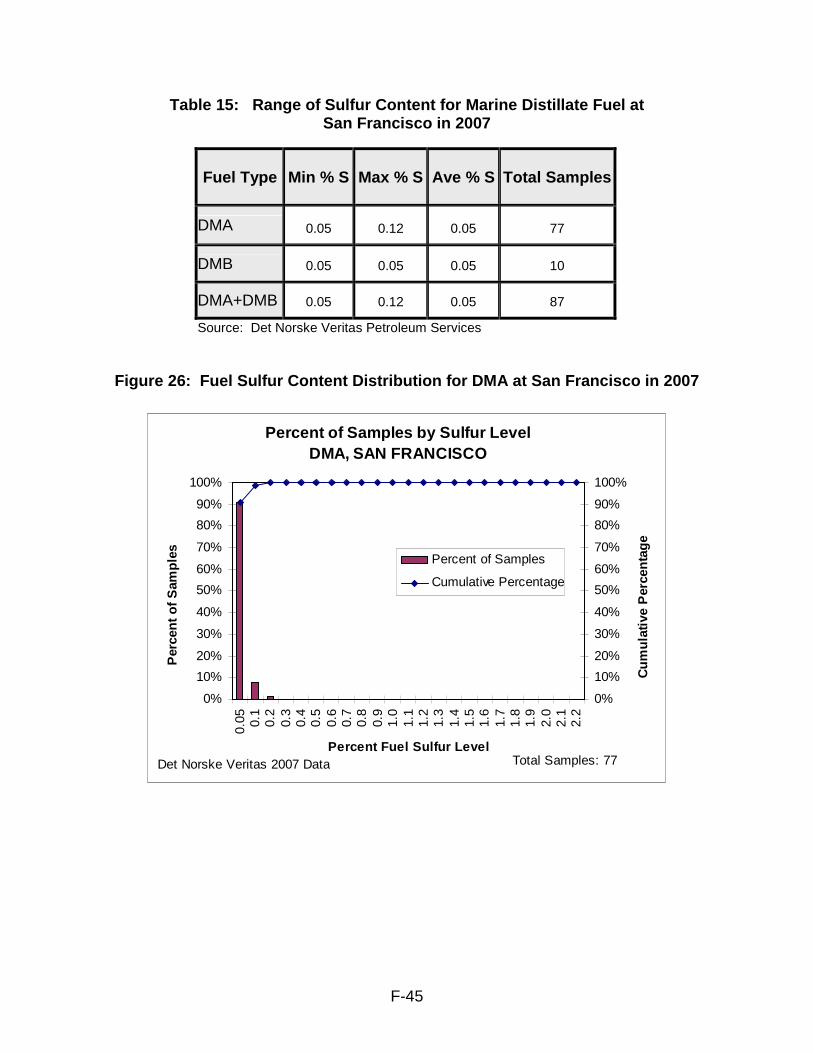
F-45
Table 15: Range of Sulfur Content for Marine Dist illate Fuel at San Francisco in 2007
Figure 26: Fuel Sulfur Content Distribution for DM A at San Francisco in 2007
Percent of Samples by Sulfur Level DMA, SAN FRANCISCO
0%
10%
20%
30%
40%
50%
60%
70%
80%
90%
100%
0.05 0.1
0.2
0.3
0.4
0.5
0.6
0.7
0.8
0.9
1.0
1.1
1.2
1.3
1.4
1.5
1.6
1.7
1.8
1.9
2.0
2.1
2.2
Percent Fuel Sulfur Level
Per
cent
of S
ampl
es
0%
10%
20%
30%
40%
50%
60%
70%
80%
90%
100%
Cum
ulat
ive
Per
cent
age
Percent of Samples
Cumulative Percentage
Total Samples: 77Det Norske Veritas 2007 Data
Fuel Type Min % S Max % S Ave % S Total Samples
DMA 0.05 0.12 0.05 77
DMB 0.05 0.05 0.05 10
DMA+DMB 0.05 0.12 0.05 87
Source: Det Norske Veritas Petroleum Services
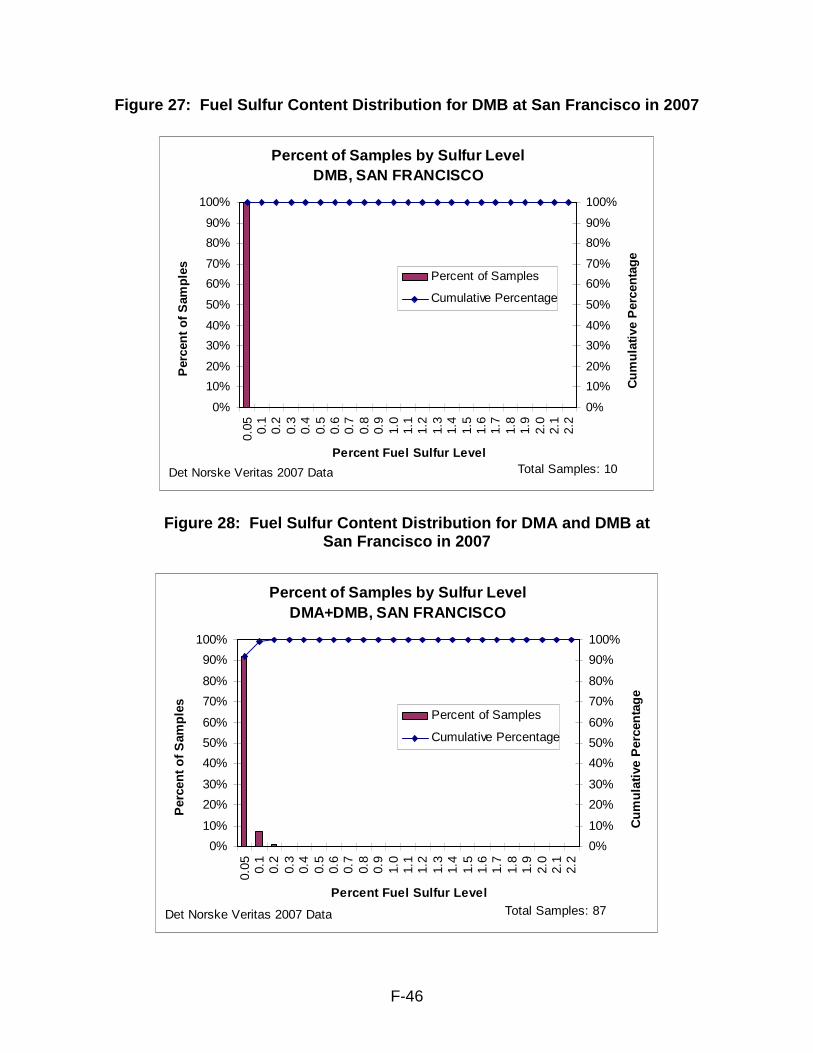
F-46
Figure 27: Fuel Sulfur Content Distribution for DM B at San Francisco in 2007
Percent of Samples by Sulfur Level DMB, SAN FRANCISCO
0%
10%
20%
30%
40%
50%
60%
70%
80%
90%
100%
0.05 0.1
0.2
0.3
0.4
0.5
0.6
0.7
0.8
0.9
1.0
1.1
1.2
1.3
1.4
1.5
1.6
1.7
1.8
1.9
2.0
2.1
2.2
Percent Fuel Sulfur Level
Per
cent
of S
ampl
es
0%
10%
20%
30%
40%
50%
60%
70%
80%
90%
100%
Cum
ulat
ive
Per
cent
age
Percent of Samples
Cumulative Percentage
Total Samples: 10Det Norske Veritas 2007 Data
Figure 28: Fuel Sulfur Content Distribution for DM A and DMB at San Francisco in 2007
Percent of Samples by Sulfur Level DMA+DMB, SAN FRANCISCO
0%
10%
20%
30%
40%
50%
60%
70%
80%
90%
100%
0.05 0.1
0.2
0.3
0.4
0.5
0.6
0.7
0.8
0.9
1.0
1.1
1.2
1.3
1.4
1.5
1.6
1.7
1.8
1.9
2.0
2.1
2.2
Percent Fuel Sulfur Level
Per
cent
of S
ampl
es
0%
10%
20%
30%
40%
50%
60%
70%
80%
90%
100%C
umul
ativ
e P
erce
ntag
e
Percent of Samples
Cumulative Percentage
Total Samples: 87Det Norske Veritas 2007 Data

F-47
Outreach findings (San Francisco/Los Angeles, 2008): ARB staff contacted General Petroleum, Chemoil Corporation, The Jankovich Company, and Petro-Diamond, Inc. regarding LSMDF at California ports. DMA and DMB at or below 0.1% sulfur is currently available at the Port of San Francisco. One supplier currently provides most if not all of the MGO fuel at the Port of San Francisco. For additional information see the Outreach findings for the Ports of Los Angeles. Conclusion : Phase 1 and Phase 2 availability is not an issue and is currently available in adequate supply. DNV data confirms that ships refueling at the Port of San Francisco are receiving LSMDF. As the demand increases, it is expected that the suppliers will be able to provide additional LSMDF. However, much of that is dependent on whether the refineries will have the capacity to meet the demand. In addition, supplying MGO or MDO that meets the marine fuel flashpoint specification could be problematic. Port Name: Singapore Port Location: Singapore Singapore is the busiest port in the world and also the largest based upon the volume of bunker fuels sold. Bunker sales in Singapore are the highest in the world, posting 29 million tonnes in 2006 (Tetra Tech, Inc, 2008). Based on an analysis of DNV test data, a range of sulfur content of DMA and DMB is shown below in Table 16 for fuel samples in 2007. As seen, the average sulfur content was just below 0.5% for both DMA and DMB. Table16: Range of Sulfur Content for Marine Disti llate Fuel at Singapore in 2007
The sulfur content distribution is shown in Figures 29-31. As shown, very little DMA of DMB, about 1 to 2%, was available with a sulfur content less than 0.1%.
Fuel Type Min % S Max % S Ave % S Total Samples
DMA 0.05 1.42 0.49 893
DMB 0.05 0.99 0.47 187
DMA+DMB 0.05 1.42 0.49 1080
Source: Det Norske Veritas Petroleum Services

F-48
Figure 29: Fuel Sulfur Content Distribution for DM A at Singapore in 2007
Percent of Samples by Sulfur Level DMA, SINGAPORE
0%
10%
20%
30%
40%
50%
60%
70%
80%
90%
100%
0.05 0.1
0.2
0.3
0.4
0.5
0.6
0.7
0.8
0.9
1.0
1.1
1.2
1.3
1.4
1.5
1.6
1.7
1.8
1.9
2.0
2.1
2.2
Percent Fuel Sulfur Level
Per
cent
of S
ampl
es
0%
10%
20%
30%
40%
50%
60%
70%
80%
90%
100%
Cum
ulat
ive
Per
cent
age
Percent of Samples
Cumulative Percentage
Total Samples: 893Det Norske Veritas 2007 Data
Figure 30: Fuel Sulfur Content Distribution for DM B at Singapore in 2007
Percent of Samples by Sulfur Level DMB, SINGAPORE
0%
10%
20%
30%
40%
50%
60%
70%
80%
90%
100%
0.05 0.1
0.2
0.3
0.4
0.5
0.6
0.7
0.8
0.9
1.0
1.1
1.2
1.3
1.4
1.5
1.6
1.7
1.8
1.9
2.0
2.1
2.2
Percent Fuel Sulfur Level
Per
cent
of S
ampl
es
0%
10%
20%
30%
40%
50%
60%
70%
80%
90%
100%C
umul
ativ
e P
erce
ntag
e
Percent of Samples
Cumulative Percentage
Total Samples: 187Det Norske Veritas 2007 Data
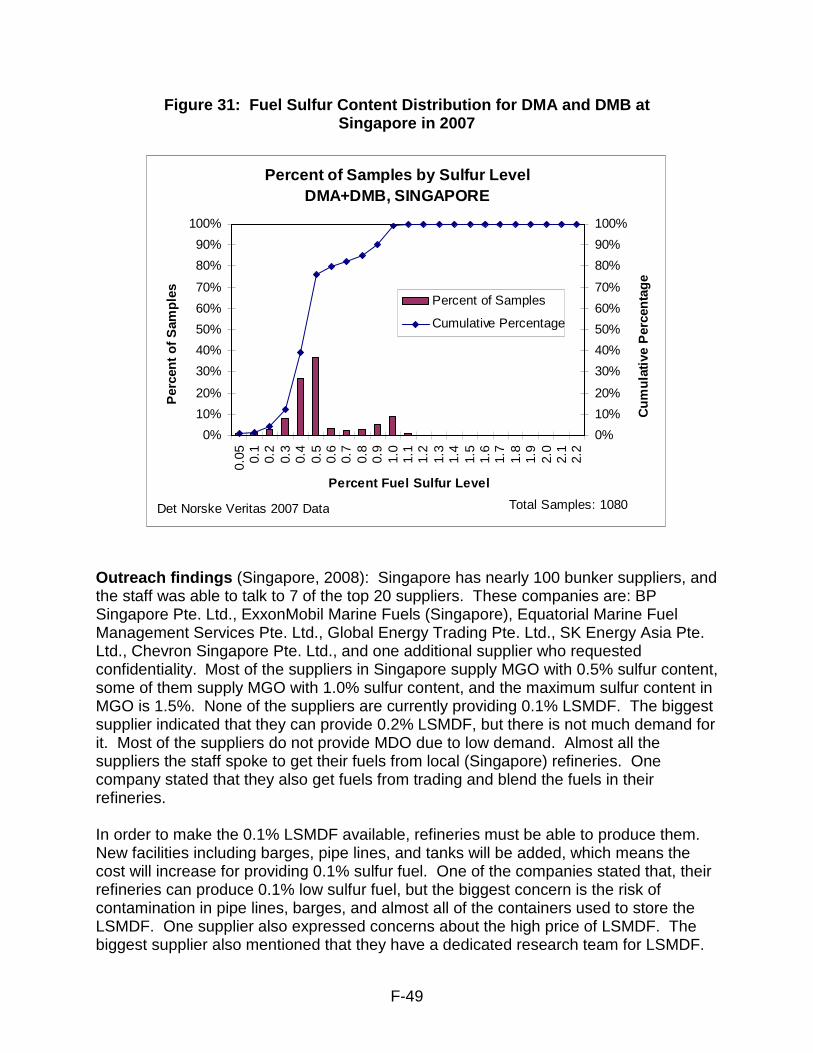
F-49
Figure 31: Fuel Sulfur Content Distribution for DM A and DMB at Singapore in 2007
Percent of Samples by Sulfur Level DMA+DMB, SINGAPORE
0%
10%
20%
30%
40%
50%
60%
70%
80%
90%
100%0.
05 0.1
0.2
0.3
0.4
0.5
0.6
0.7
0.8
0.9
1.0
1.1
1.2
1.3
1.4
1.5
1.6
1.7
1.8
1.9
2.0
2.1
2.2
Percent Fuel Sulfur Level
Per
cent
of S
ampl
es
0%
10%
20%
30%
40%
50%
60%
70%
80%
90%
100%
Cum
ulat
ive
Per
cent
age
Percent of Samples
Cumulative Percentage
Total Samples: 1080Det Norske Veritas 2007 Data
Outreach findings (Singapore, 2008): Singapore has nearly 100 bunker suppliers, and the staff was able to talk to 7 of the top 20 suppliers. These companies are: BP Singapore Pte. Ltd., ExxonMobil Marine Fuels (Singapore), Equatorial Marine Fuel Management Services Pte. Ltd., Global Energy Trading Pte. Ltd., SK Energy Asia Pte. Ltd., Chevron Singapore Pte. Ltd., and one additional supplier who requested confidentiality. Most of the suppliers in Singapore supply MGO with 0.5% sulfur content, some of them supply MGO with 1.0% sulfur content, and the maximum sulfur content in MGO is 1.5%. None of the suppliers are currently providing 0.1% LSMDF. The biggest supplier indicated that they can provide 0.2% LSMDF, but there is not much demand for it. Most of the suppliers do not provide MDO due to low demand. Almost all the suppliers the staff spoke to get their fuels from local (Singapore) refineries. One company stated that they also get fuels from trading and blend the fuels in their refineries. In order to make the 0.1% LSMDF available, refineries must be able to produce them. New facilities including barges, pipe lines, and tanks will be added, which means the cost will increase for providing 0.1% sulfur fuel. One of the companies stated that, their refineries can produce 0.1% low sulfur fuel, but the biggest concern is the risk of contamination in pipe lines, barges, and almost all of the containers used to store the LSMDF. One supplier also expressed concerns about the high price of LSMDF. The biggest supplier also mentioned that they have a dedicated research team for LSMDF.

F-50
Barges, pipes, and ports are used to deliver fuels to ships. Currently, fuel contamination is not a problem. It appears land-based fuel is not used for marine fuel in Singapore. Conclusion: Phase 1 is available, but Phase 2 is not available from bunker suppliers in Singapore. It is unlikely that 0.1% LSMDF will be available in 2010 due to the need for additional fueling infrastructure and refining output. Suppliers have indicated that once regulations require 0.1% sulfur and the demand increases, the Singapore refineries may be able to produce the 0.1% LSDMF. However, infrastructure upgrades such as pipes, barges, and tanks will need to be added to minimize contamination. It is possible that due to the increasing number of regulations and mandates calling for 0.1% LSMDF, the fuel supply and infrastructure limitations would be lessened by 2012. Port Name: Vancouver Port Location: Canada The Port of Vancouver is the closest North American port to Asia, and one of the busiest. Federal regulations for sulfur in diesel fuel have been adopted that align with U.S. requirements for the allowable level of sulfur in diesel fuels for on-road vehicles, off-road engine, locomotive engines and vessel engines. Figures 8 and 9 previously provided show a trend toward decreasing levels of sulfur in both the DMA and DMB fuels. This trend may be due in part to implementation of the fuel sulfur regulations. In 2007, the average DMA and DMB sulfur content was 0.1% sulfur and 0.17% sulfur, respectively (Table 17). The average sulfur content when combining both the DMA and DMB was 0.14%. Table 17: Range of Sulfur Content for Marine Disti llate Fuel at Vancouver in 2007
Fuel Type Min % S Max % S Ave % S Total Samples
DMA 0.05 0.31 0.11 44
DMB 0.05 0.44 0.17 46
DMA+DMB 0.05 0.44 0.14 90
Source: Det Norske Veritas Petroleum Services
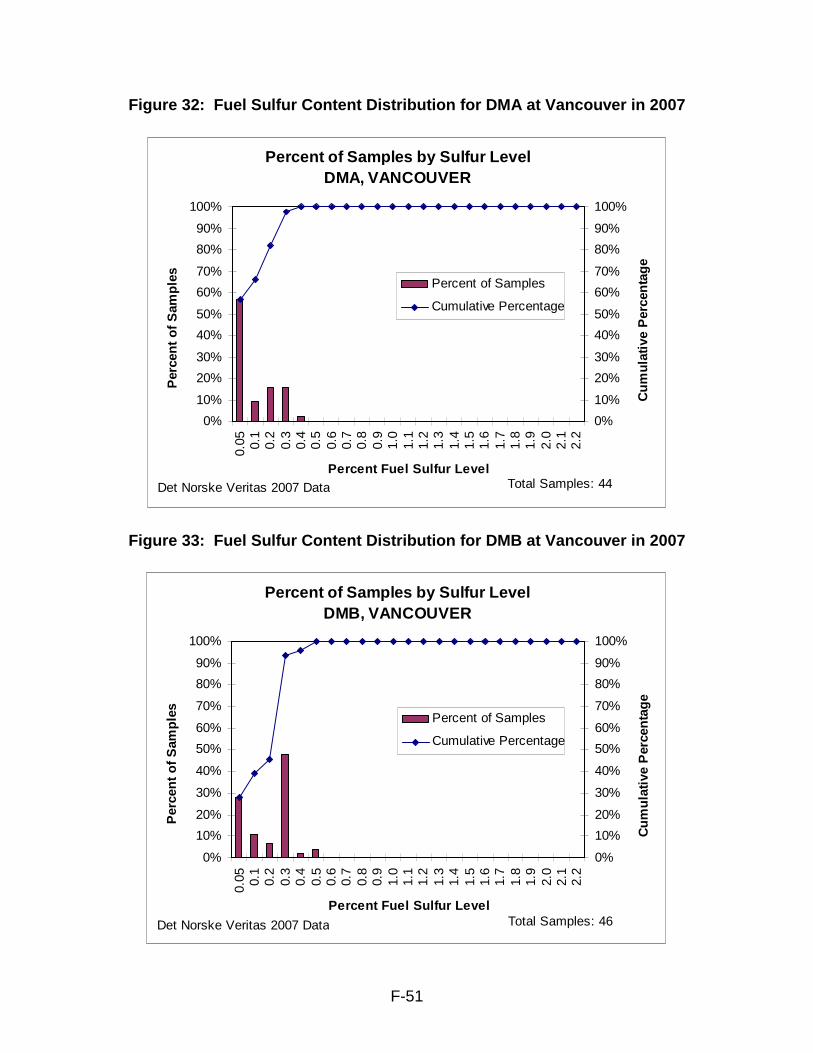
F-51
Figure 32: Fuel Sulfur Content Distribution for DM A at Vancouver in 2007
Percent of Samples by Sulfur Level DMA, VANCOUVER
0%
10%
20%
30%
40%
50%
60%
70%
80%
90%
100%
0.05 0.1
0.2
0.3
0.4
0.5
0.6
0.7
0.8
0.9
1.0
1.1
1.2
1.3
1.4
1.5
1.6
1.7
1.8
1.9
2.0
2.1
2.2
Percent Fuel Sulfur Level
Per
cent
of S
ampl
es
0%
10%
20%
30%
40%
50%
60%
70%
80%
90%
100%
Cum
ulat
ive
Per
cent
age
Percent of Samples
Cumulative Percentage
Total Samples: 44Det Norske Veritas 2007 Data
Figure 33: Fuel Sulfur Content Distribution for DM B at Vancouver in 2007
Percent of Samples by Sulfur Level DMB, VANCOUVER
0%
10%
20%
30%
40%
50%
60%
70%
80%
90%
100%
0.05 0.1
0.2
0.3
0.4
0.5
0.6
0.7
0.8
0.9
1.0
1.1
1.2
1.3
1.4
1.5
1.6
1.7
1.8
1.9
2.0
2.1
2.2
Percent Fuel Sulfur Level
Per
cent
of S
ampl
es
0%
10%
20%
30%
40%
50%
60%
70%
80%
90%
100%C
umul
ativ
e P
erce
ntag
e
Percent of Samples
Cumulative Percentage
Total Samples: 46Det Norske Veritas 2007 Data
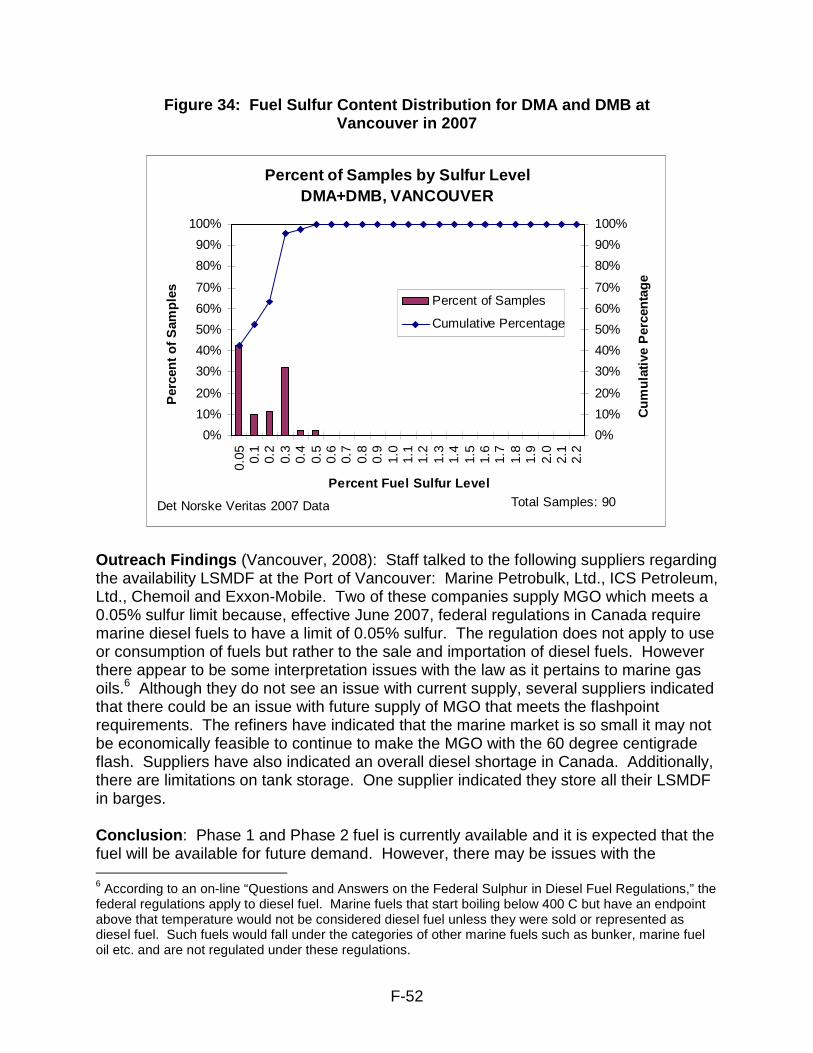
F-52
Figure 34: Fuel Sulfur Content Distribution for DM A and DMB at Vancouver in 2007
Percent of Samples by Sulfur Level DMA+DMB, VANCOUVER
0%
10%
20%
30%
40%
50%
60%
70%
80%
90%
100%0.
05 0.1
0.2
0.3
0.4
0.5
0.6
0.7
0.8
0.9
1.0
1.1
1.2
1.3
1.4
1.5
1.6
1.7
1.8
1.9
2.0
2.1
2.2
Percent Fuel Sulfur Level
Per
cent
of S
ampl
es
0%
10%
20%
30%
40%
50%
60%
70%
80%
90%
100%
Cum
ulat
ive
Per
cent
age
Percent of Samples
Cumulative Percentage
Total Samples: 90Det Norske Veritas 2007 Data
Outreach Findings (Vancouver, 2008): Staff talked to the following suppliers regarding the availability LSMDF at the Port of Vancouver: Marine Petrobulk, Ltd., ICS Petroleum, Ltd., Chemoil and Exxon-Mobile. Two of these companies supply MGO which meets a 0.05% sulfur limit because, effective June 2007, federal regulations in Canada require marine diesel fuels to have a limit of 0.05% sulfur. The regulation does not apply to use or consumption of fuels but rather to the sale and importation of diesel fuels. However there appear to be some interpretation issues with the law as it pertains to marine gas oils.6 Although they do not see an issue with current supply, several suppliers indicated that there could be an issue with future supply of MGO that meets the flashpoint requirements. The refiners have indicated that the marine market is so small it may not be economically feasible to continue to make the MGO with the 60 degree centigrade flash. Suppliers have also indicated an overall diesel shortage in Canada. Additionally, there are limitations on tank storage. One supplier indicated they store all their LSMDF in barges. Conclusion : Phase 1 and Phase 2 fuel is currently available and it is expected that the fuel will be available for future demand. However, there may be issues with the 6 According to an on-line “Questions and Answers on the Federal Sulphur in Diesel Fuel Regulations,” the federal regulations apply to diesel fuel. Marine fuels that start boiling below 400 C but have an endpoint above that temperature would not be considered diesel fuel unless they were sold or represented as diesel fuel. Such fuels would fall under the categories of other marine fuels such as bunker, marine fuel oil etc. and are not regulated under these regulations.

F-53
availability of MGO that meets the fuel flashpoint specification and additional storage capacities may be needed if demand increases significantly. Port Name: Yokohama Port Location: Japan Yokohama is the largest and leading Japanese port in terms of volume and ship visits. The port has a large bunker barge fleet of more than 50 vessels, so availability is relatively good. There are about 20 major players in the bunker market. Based on the DNV data for 2007, a significant portion, about 70 percent, of the DMA samples analyzed had fuel sulfur levels at or below 0.1% sulfur. (see Figure 35) As shown in Table 18, the average for DMA was about 0.2% sulfur which is relatively low. For DMB, as seen in Figure 36, very little has fuel sulfur contents at or below 0.1% sulfur and when looking at the combined DMA and DMB distribution, overall only about 25 percent of the samples met the 0.1% sulfur limit indicating that DMB was more prevalent in Yokohama in 2007. Table 18: Range of Sulfur Content for Marine Disti llate Fuel at Yokohama in 2007
Fuel Type Min % S Max % S Ave % S Total Samples
DMA 0.05 0.73 0.17 19
DMB 0.05 1.00 0.47 34
DMA+DMB 0.05 1.00 0.36 53
Source: Det Norske Veritas Petroleum Services

F-54
Figure 35: Fuel Sulfur Content Distribution for DM A at Yokohama in 2007
Percent of Samples by Sulfur Level DMA, YOKOHAMA(TOKYO BAY)
0%
10%
20%
30%
40%
50%
60%
70%
80%
90%
100%
0.05 0.1
0.2
0.3
0.4
0.5
0.6
0.7
0.8
0.9
1.0
1.1
1.2
1.3
1.4
1.5
1.6
1.7
1.8
1.9
2.0
2.1
2.2
Percent Fuel Sulfur Level
Per
cent
of S
ampl
es
0%
10%
20%
30%
40%
50%
60%
70%
80%
90%
100%
Cum
ulat
ive
Per
cent
age
Percent of Samples
Cumulative Percentage
Total Samples: 19Det Norske Veritas 2007 Data
Figure 36: Fuel Sulfur Content Distribution for DM B at Yokohama in 2007
Percent of Samples by Sulfur Level DMB, YOKOHAMA(TOKYO BAY)
0%
10%
20%
30%
40%
50%
60%
70%
80%
90%
100%
0.05 0.1
0.2
0.3
0.4
0.5
0.6
0.7
0.8
0.9
1.0
1.1
1.2
1.3
1.4
1.5
1.6
1.7
1.8
1.9
2.0
2.1
2.2
Percent Fuel Sulfur Level
Per
cent
of S
ampl
es
0%
10%
20%
30%
40%
50%
60%
70%
80%
90%
100%C
umul
ativ
e P
erce
ntag
e
Percent of Samples
Cumulative Percentage
Total Samples: 34Det Norske Veritas 2007 Data

F-55
Figure 37: Fuel Sulfur Content Distribution for DM A and DMB at Yokohama in 2007
Percent of Samples by Sulfur Level DMA+DMB, YOKOHAMA(TOKYO BAY)
0%
10%
20%
30%
40%
50%
60%
70%
80%
90%
100%
0.05 0.1
0.2
0.3
0.4
0.5
0.6
0.7
0.8
0.9
1.0
1.1
1.2
1.3
1.4
1.5
1.6
1.7
1.8
1.9
2.0
2.1
2.2
Percent Fuel Sulfur Level
Per
cent
of S
ampl
es
0%
10%
20%
30%
40%
50%
60%
70%
80%
90%
100%
Cum
ulat
ive
Per
cent
age
Percent of Samples
Cumulative Percentage
Total Samples: 53Det Norske Veritas 2007 Data
Outreach findings (Yokahama, 2008): Staff had discussions with the following suppliers regarding LSMDF fuel availability in Yokahama: Marubeni, Itochu, International Bunker Services, and Petro-Diamond, Japan. Most suppliers indicated that they could provide 0.1% sulfur marine distillate. One supplier indicated that all DMA supplied throughout Japan is less than 0.1% sulfur. Whereas, one supplier indicated they could only guarantee 0.5% sulfur DMA and 1.0% sulfur DMB. Japan’s DMA tends to be very clean as it is produced from Japan’s automotive gas oil which is well below 0.1% sulfur. It was mentioned that because the MGO is derived from automotive gas oils, periodically flashpoint can be an issue. Regarding fueling infrastructure, they do have dedicated barges for distillates, however, the biggest issue is finding a clean barge to minimize contamination. Several suppliers expressed concern with the availability to find clean barges for LSMDF that had previously been used for MDO. One supplier indicated it would take additional time to find a clean barge for LSMDF. Refineries produce their LSMDF through the domestic market. There is a limited domestic supply of oil in Japan. Certain times during the year there can be a lack of fuel oil in Japan’s main ports. In addition, 70 percent to 80 percent of the marine fuel is already tied up in contract with several large carriers. Much of the fuel is in high demand for land-side sources such as power plants. In general, Japan has not been an attractive market due to the high cost of fuel.
F-56
Conclusion: It appears that Phase 1 and Phase 2 is currently available; however, there is a limited amount of fuel oil produced by domestic refineries so it is unknown whether Japan refiners could meet the additional demand. Given that there is not a strong market for refueling in Japan, the existing supply and infrastructure may be able to manage the incremental increase in demand. The majority of marine fuel is contracted to several of the large ocean carriers, which may make it difficult for other companies to acquire the LSMDF. Finally, future infrastructure improvements (more clean, dedicated barges) may also be needed to minimize contamination issues.
4. Overall Conclusions Regarding Ability to Provide Phase 2 LSMDF Of the thirteen ports evaluated, there were five ports along the Pacific coast of North America that currently have Phase 2 LSMDF available and that are expected to continue to have this fuel available in 2010 and 2012. These are the Ports of Vancouver in Canada, San Francisco and Los Angeles in the United States, and Ensenada, and Manzanillo in Mexico. For the other eight ports investigated (Bussan, Hong Kong, Ningbo, Kaohsiung, Panama, Puerto Quetzal, Singapore, and Yokohama) in reaching our conclusions, we assumed that the current information obtained, both from our outreach efforts and from analysis of the DNV data provides a strong indication of what would be available in 2010. With this in mind, we have concluded that for these eight ports there is very limited supply or no supply of Phase 2 LSMDF now and it is not expected to be available in 2010. Based on our discussions with fuel providers at these ports, in most cases fueling infrastructure improvements are needed as well as a dependable fuel stream supply for them to be able to provide the fuel. Obtaining the fuel and implementing infrastructure improvements is feasible if the demand is present and the economics are favorable but time is needed to make the necessary changes to make the fuel available. Given the overall trends for LSMDF and the three-year lead time we anticipate that many of these ports will be able to increase the availability of Phase 2 LSMDF by 2012.

F-57
V. CONCLUSIONS
Overall, we believe the fuel specified in the proposed OGV Regulation will be available for vessel operators to purchase; however, there is some uncertainty in our findings, particularly with respect to the availability of fuels to meet the Phase 2 specifications. There are thousands of ports throughout the world where OGV can obtain fuel and, out of necessity, we focused our investigation on selected Pacific Rim ports and assumed that our findings also represent the ports not addressed. Below we summarize our overall conclusions regarding the availability of fuels to meet the Phase 1 and Phase 2 fuel sulfur specifications of the proposed regulation. Conclusions Regarding Phase 1 Fuel Availability
• Based on data from Det Norske Veritas Petroleum Services, experience with implementation of the Auxiliary Engine Regulation over a 14-month period, and on discussions with fuel suppliers, ARB staff does not anticipate difficulty with availability of fuels to meet the Phase 1 fuel sulfur specifications.
• Data from multiple sources has suggested that the supply will meet the demand, as it has in the past when the demand for distillate fuels for marine bunkering was on the rise.
• Most ports worldwide have MGO that meets the Phase 1 fuel specifications. About half of the ports worldwide have MDO that can meet the Phase 1 0.5% sulfur specification for MDO. Overall, we expect the average fuel sulfur content of MDO or MGO purchased to be about 0.3%.
• Based on information gathered during implementation of the Auxiliary Engine Regulation, there are some ports that do not have marine distillate fuel at all. We expect this to be the case in the future as well; however, we expect the number of ports that do not have marine distillate fuels to be very small.
Conclusions Regarding Phase 2 Fuel Availability in 2010
• For 2010, the availability of 0.1% sulfur MGO or MDO is uncertain, both in terms of fueling locations and volume. While a study conducted for the ARB stated that the impact of the OGV Regulation on the global and U.S. projected supply of 0.1% sulfur fuel is relatively small, other studies have suggested a potential for shortages of 0.1% MGO or MDO in key fueling areas, such as China, from which many California-bound OGVs ships originate. Staff does not expect 0.1% sulfur MGO or MDO to be available at all Pacific Rim ports, and there could be constraints on the volumes available at the ports that do carry the fuel.
• Segregated fueling infrastructure and storage, as well as fuel-stream supplies, also add to the availability concerns in Asia. Additionally availability is uncertain in Puerto Quetzal (Guatemala) and in Panama.
• Availability will be greatest along North America’s Pacific Coast, including ports in California, Vancouver (British Columbia), and Mexico. However, depending on the demand in these areas, there is concern regarding the availability of MGO or MDO that meets the ISO 8217 specifications for marine fuel flashpoint.

F-58
Conclusions Regarding Phase 2 Fuel Availability in 2012
• For 2012, the issues outlined above for 2010 should be lessened due to the additional time for fuel providers and suppliers to develop and implement the necessary fueling infrastructure.
• We expect supplies of low sulfur marine distillate fuels across the world to increase as refinery upgrades are made to meet the increasing demands for cleaner diesel fuels for land-based equipment, including on- and off-road vehicles. However, while there will be increases in lower sulfur fuels for land-based equipment, we cannot assume that this same fuel could also be used for marine (due to specifications, price premium, and competition).
• There are significant refinery projects underway and planned that are expected to provide additional refining capacity near those bunkering ports where 0.1% MGO or MDO will be in demand. As noted, refineries have a strong economic incentive to produce higher-value products, such as low sulfur marine distillate fuel, over residual fuel as long as the demand is present.

F-59
REFERENCES (ARB, 2007) Air Resources Board Auxiliary Engine Inspection Results (Bunkerworld, 2007). Aggressive Strategy Brews Price War in China’s Bunker Market, Bunkerworld, September 2007, pgs. 4-5. (Busan, 2008). Telephone conversations with various fuel suppliers. April-May 2008. (Chevron, 2007). Diesel Fuels Technical Review. www.chevron.com/prodcuts/prodserv/fuels/bulletin/diesel. (Chevron, 2008). Everything You Need to Know About Marine Fuels. (Corbett and Winebrake, 2008). Corbett, James J., Winebrake, James. Energy and Environmental Research Associates, LLC. Total Fuel Cycle Analysis for Alternative Marine Fuels: Sulfur and CO2 Emissions Tradeoffs of California’s Proposed Low-Sulfur Marine Fuel Rule. Final Report. May 2008. (Courtis, 2008). Courtis, John, et.al., A Roadmap for Cleaner Fuels and Vehicles in Asia, ADB Clean Air Initiatives for Asian Cities, Draft, April 2008. (DNV, 2007) Det Norske Ventas. Worldwide Sulfur Content, Viscosity, and Flashpoint Data for DMA and DMB, 2005-2007 Data. (EIA, 2006). Energy Information Administration. Office of Oil and Gas. Fuel Oil and Kerosene Sales 2006. Washington, D.C. 20585 December 2007. (Ensenada/Manzanillo, 2008). Telephone conversations with various fuel suppliers. April-May 2008. (Entec, 2002) Quantification of emissions from Ships Associated with Ship Movements between Ports in the European Community, Entec UK Ltd, July 2002 (EPA, 1999) United States Environmental Protection Agency. In-Use Marine Diesel Fuel. EPA420-R-99-027. August 1999. (EPA, 2006). United States Environmental Protection Agency. Global Trade and Fuels Assessent Future Trends and Effects of Designating Requiring Clean Fuels in the Marine Sector: Task Order No. 1. Draft Report. April 2006. (Hong Kong, 2008). Telephone conversations with various fuel suppliers. April-May 2008. (IEA, July 2007). International Energy Agency. Medium-Term Oil Market Report. July 2007. www.oilmarketreport.org
F-60
(Kaohsiung, 2008). Telephone conversations with various fuel suppliers. April-May 2008. (Ningbo, 2008). Telephone conversations with various fuel suppliers. April-May 2008. (Panama, 2008). Telephone conversations with various fuel suppliers. April-May 2008. (Puerto Quetzal, 2008). Telephone conversations with various fuel suppliers. April-May 2008. (San Francisco/Los Angeles, 2008). Telephone conversations with various fuel suppliers. April-May 2008. (Shipping Statistics Yearbook, 2006). Shipping Statistics Yearbook. 2006 (Singapore, 2008). Telephone conversations with various fuel suppliers. April-May 2008. (Starcrest, 2005). Anderson, Bruce, et al. Starcrest Consulting Group, LLC. Evaluation of Low Sulfur Marine Fuel Availability – Pacific Rim. ADP # 030507-513. July 2005. (State Lands Commission, 2005, 2006). California State Lands Commission, ocean going vessel data on California ports visited, arrival port, last port, next port, 2005-2006. (SustainableShipping, 2008). Sustainable Shipping News. http://www.sustainableshipping.com/news/2008/01/70260. January 4, 2008. Accessed June 2, 2008. (Tetra Tech, 2008). Charng-Ching Lin, Ph.D.; Rogozen, Michael. Tetra Tech, Inc and UltraSystems. Low-Sulfur Marine Fuel Availabillity Study. Prepared for the Port of Long Beach and Port of Los Angeles. April 14, 2008. (Vancouver, 2008). Telephone conversations with various fuel suppliers. April-May 2008. (Yokahama, 2008). Telephone conversations with various fuel suppliers. April-May 2008.