appendix f:full health economics report
TRANSCRIPT

Parkinson's disease (update) Full health economics report
1
Appendix F: Full health economics report
Acknowledgements
The guideline committee and the NICE Internal Clinical Guidelines team are extremely grateful to the following people for giving their time, expertise and data in supporting the preparation of this analysis:
Aberdeen University staff (Angus Macleod and Carl Counsell) for preparing and sharing the PINE individual level dataset and their analyses based on that dataset
Birmingham University staff (Adrian Williams, Caroline Rick and Smitaa Patel) for
preparing and sharing the PDSURG individual level dataset and their expertise and
experience
Glasgow University staff (Emma McIntosh) for sharing knowledge underpinning the
PDSURG economic evaluation
NICE Clinical Guidelines Technical Support Unit (Edna Keeney and Sofia Dias), who
advised on the potential for multi-comparator evidence synthesis and suggested the simple analytic solution adopted (see F.3.1.5)
Any errors and omissions that remain are the responsibility of the NICE Internal Clinical
Guidelines team and the guideline committee.
NICE Internal Clinical Guidelines, 2016
Parkinson's disease (update)

Parkinson's disease (update) Full health economics report
NICE Internal Clinical Guidelines, 2016 2
Contents Contents.......................................................................................................................................... 2 F.1 Introduction ..................................................................................................................... 3 F.1.1 Decision problem ........................................................................................................... 3 F.2 Systematic review of published cost–utility analyses ............................................ 5 F.2.1.1 Methods............................................................................................................................ 5 F.2.1.2 Multiple comparison CUAs........................................................................................... 5 F.2.1.3 LCIG versus BMT CUAs ................................................................................................ 6 F.2.1.4 DBS versus BMT CUAs ................................................................................................. 7 F.2.1.5 Early DBS versus BMT CUAs..................................................................................... 10 F.2.1.6 Discussion of existing economic evidence ............................................................ 10 F.3 Original cost–utility model – methods ..................................................................... 12 F.3.1.1 Overview of the model ................................................................................................ 12 F.3.1.2 Parameters – general approach ................................................................................ 14 F.3.1.3 Baseline cohort characteristics................................................................................. 15 F.3.1.4 Imputation of missing data......................................................................................... 15 F.3.1.5 Treatment effects ......................................................................................................... 16 F.3.1.6 Adverse events ............................................................................................................. 17 F.3.1.7 Progression of clinical variables over time............................................................. 19 F.3.1.8 Transitions..................................................................................................................... 21 F.3.1.9 Transitions – time to full-time care ........................................................................... 22 F.3.1.10 Transitions – time to death......................................................................................... 23 F.3.1.11 Resource use ................................................................................................................ 25 F.3.1.12 Unit costs ....................................................................................................................... 31 F.3.1.13 State costs ..................................................................................................................... 35 F.3.1.14 Quality of life ................................................................................................................. 36 F.3.1.15 Probabilistic sensitivity analyses ............................................................................. 39 F.4 Original cost–utility model – results ........................................................................ 40 F.4.1.1 Model outputs – disaggregated effects ................................................................... 40 F.4.1.2 Model outputs – disaggregated costs ...................................................................... 40 F.4.1.3 Base-case cost–utility results.................................................................................... 41 F.4.1.4 Probabilistic sensitivity analysis .............................................................................. 42 F.4.1.5 One-way sensitivity analysis ..................................................................................... 43 F.4.1.6 Scenario analysis – choice of time-to-event models ............................................ 49 F.4.1.7 Other scenario analyses ............................................................................................. 52 F.5 Discussion ..................................................................................................................... 59 F.5.1.1 Strengths of the analysis ............................................................................................ 59 F.5.1.2 Weaknesses of the analysis ....................................................................................... 59 F.5.1.3 Comparison with other CUAs .................................................................................... 60 F.6 References..................................................................................................................... 66 F.7 Economic evidence tables ......................................................................................... 70 F.7.1 First-line pharmacological treatment of motor symptoms .................................. 70 F.7.2 Adjuvant pharmacological treatment of motor symptoms .................................. 72 F.7.3 Orthostatic hypertension ............................................................................................ 79 F.7.4 Pharmacological management of dementia associated with Parkinson ’s
disease ........................................................................................................................... 80 F.7.5 Physiotherapy and physical activity ........................................................................ 82 F.7.6 Occupational therapy .................................................................................................. 84 F.7.7 Deep brain stimulation, levodopa–carbidopa intestinal gel and best
medical treatment for advanced Parkinson’s disease .......................................... 86 F.7.8 Deep brain stimulation compared with best medical treatment for earlier
Parkinson’s disease..................................................................................................... 96
Parkinson's disease (update) Full health economics report
NICE Internal Clinical Guidelines, 2016 3
F.1 Introduction
This appendix sets out the original health economic evaluation undertaken to assess the cost effectiveness of deep brain stimulation (DBS), levodopa–carbidopa intestinal gel (LCIG,
tradename Duodopa®) and best medical treatment (BMT, which may or may not include continuous subcutaneous apomorphine infusion [CSAI]) for the treatment of advanced Parkinson’s disease. It was developed by the Internal Clinical Guidelines team at the
National Institute for Health and Care Excellence (NICE).
F.1.1 Decision problem
The health economic analysis was designed primarily to answer 1 main review question from the Parkinson’s disease clinical guideline scope. This question posed a 3-way comparison
between DBS, LCIG and BMT for people with advanced Parkinson’s disease who are clinically suitable for all 3 interventions.
Whilst not a primary aim, it was planned that the analysis could also give insight to 3 other review questions – those undertaking 2-way comparisons for people with advanced
Parkinson’s who are clinically unsuitable for 1 of the 3 interventions and also potentially for the early DBS review question (see Table 1)
Table 1: Research questions
Primary review question
RQ15: In people with advanced PD for whom deep brain stimulation (DBS) and levodopa–carbidopa intestinal gel (LCIG) are treatment options, what is the
comparative effectiveness of DBS, LCIG and best medical treatment (BMT)?
Review questions that could potentially
be addressed
RQ17: In people who are contraindicated for BMT, what is the effectiveness of LCIG plus BMT, compared with LCIG alone in people with Parkinson’s disease?
RQ18: In people who are contraindicated for LCIG, what is the effectiveness of DBS plus BMT, compared with BMT alone in people with Parkinson’s disease?
RQ16: Is there a benefit in receiving DBS in earlier, rather than later, stages of Parkinson’s disease compared with usual care?
The model structure, inputs and assumptions were designed to address RQ15. If the clinical
evidence was available in a similar format, and if model inputs could be altered accordingly, the intention was to use the model to address the secondary review questions.
The committee took the view that the interventions (DBS, LCIG, BMT with or without CSAI) are indicated in the same population – levodopa-responsive people with advanced
Parkinson’s disease whose symptoms are no longer controlled using available combinations of conventional anti-Parkinson's medicinal products. This analysis did not attempt to further define when people were defined as having advanced Parkinson’s disease, beyond
assuming trial participants for these interventions and an a priori assumption that people with Hoehn and Yahr stage 3 and above (Hoehn and Yahr, 1967) were classified as having
advanced Parkinson’s disease.
The committee prioritised this review question as they felt all the interventions had the potential to be effective but incur substantial costs.
The populations, interventions, comparators and outcomes are shown in Table 2. Whilst the full clinical list of interventions potentially included a range of DBS targets, it became
apparent that the evidence only contained trials of globus pallidus interna (GPi) and subthalamic nucleus (STN) surgery. In this appendix, DBS will refer to these surgical targets.
Clinical outcomes were included in the health economic analysis as prioritised by the
committee. Their prioritisation included quality of life outcomes for both people with advanced
Parkinson's disease (update) Full health economics report
NICE Internal Clinical Guidelines, 2016 4
Parkinson’s disease and their carers. In line with the NICE guidelines manual (NICE, 2012), this economic analysis adopted a cost–utility approach.
Table 2: PICO format for health economic analysis
Population Patients with a confirmed diagnosis of Parkinson’s disease who are
suitable candidates for both LCIG and DBS (RQ15), or
suitable candidates for LCIG but contraindicated for DBS (RQ17), or
suitable candidates for DBS but contraindicated for LCIG (RQ18)
Intervention DBS surgery of STN or GPI, with best medical treatment (RQ15, RQ18)
LCIG + best medical treatment (RQ15, RQ17)
Comparator Each other (RQ15)
Best medical treatment (all RQs)
Outcomes Adverse events – perioperative
Adverse events – long-term complications (including falls)
Symptom severity:
o UPDRS
o dyskinesia
o 'on' and 'off' time
Disease progression: Hoehn & Yahr score
Neuropsychiatric non-motor features:
o Cognitive impairment
o Sleep disorder
o Suicidal ideation
Health-related quality of life – patient
Health-related quality of life – carer
Information to inform decision making
Resource use and cost (including medication load)
Time to full-time institutional care
Parkinson's disease (update) Full health economics report
NICE Internal Clinical Guidelines, 2016 5
F.2 Systematic review of published cost–utility analyses
F.2.1.1 Methods
Literature searches were undertaken to find any existing cost utility analyses (CUAs) comparing any combination of deep brain stimulation, levodopa carbidopa intestinal gel and best medical treatment (including apomorphine infusion) for people with advanced
Parkinson’s disease (see appendix I for the search strategy). In total, 2910 articles were returned, of which 15 were ordered and 9 were retained (see Table 3 for exclusion reasons). Studies that met the eligibility criteria were assessed using the quality appraisal criteria as
outlined in the NICE guidelines manual (NICE, 2012).
Table 3: Health economic literature search - excluded studies
Comparison Paper Reason for exclusion
DBS versus BMT
Espay et al. . (2010) No costs modelled
Shan et al. (2011) Full text not available in English
Stroupe et al. (2014) Compares methods of DBS (out of scope)
Zhu et al. (2014) Main outcome cost per UPDRS point. Cost per QALY via regression only
LCIG versus BMT
Lundqvist et al. (2014) One year before/after study with societal perspective
Kamusheva et al. (2013) Outcomes not QALYs
F.2.1.2 Multiple comparison CUAs
One CUA comparing all 3 interventions met the NICE reference case (NICE, 2012). Walter and Odin (2015, see Table 47) used a lifetime Markov model to compare deep brain
stimulation (DBS), levodopa carbidopa intestinal gel (LCIG), continuous subcutaneous apomorphine infusion (CSAI) and standard care (SC). Whilst this CUA modelled both DBS and LCIG, it treated CSAI and SC as separate interventions, rather than a single
intervention.
States were defined by Hoehn and Yahr stages and off-time categories. State transitions were taken from Lowin et al. (2011) and assumed to be independent of each other. By
delaying disease progression, LCIG was modelled to have a 20% survival gain over SC (6.9 years versus 5.8 years). Effects for each intervention were taken from a range of studies, ranging from a single non-UK RCT that is included in this clinical evidence review for DBS
(Deuschl et al. 2006) to a number of open label studies for LCIG and unspecified sources for CSAI and SC. Despite noting a range of reported intervention effects for LCIG (29%-87% reduction in off-time) and CSAI (40%-85% reduction in off-time), no justification was given for
the intervention effect size used for off-times or Hoehn and Yahr stage improvements. No details were given of any methods used to synthesise disparate intervention effect estimates or to indirectly compare the interventions.
Walter and Odin (2015) present results for both the UK and Germany, using different resource use and unit cost data for each country. Here, the model for Germany will not be considered. For the UK, resource use estimates were not well detailed, but often relied on previous CUAs rather than primary sources. LCIG drug costs were 25% lower than that
shown in the NHS drugs tariff (Joint Formulary Committee, 2016); it was unclear whether adverse event costs and DBS complication costs were per event or per person. State costs
were based on UK resource use reported in Findley et al. (2011).
Utility estimates did not consider the impact of receiving the interventions, but did include decrements for pain, motor function, depression, drug-induced dyskinesias from unspecified sources. State utilities were rescaled from Lowin et al. (see section F.2.1.3 for comments on
Parkinson's disease (update) Full health economics report
NICE Internal Clinical Guidelines, 2016 6
Lowin et al. 2011) to ensure values were greater than zero, but this decision was not justified. It does mean that incremental utility differences modelled were smaller than other CUAs that used Lowin et al. (2011) values directly.
CSAI was found to be cost-effective compared with SC, with an ICER of £6400 per QALY. DBS was dominated by CSAI and SC; LCIG compared with CSAI produced an ICER of £244,700 per QALY. In limited one-way sensitivity analyses, the model was found to be most
sensitive to intervention effect magnitude. Only pairwise probabilistic sensitivity analyses were reported; input distributions were not reported so their appropriateness could not be verified. CSAI was cost-effective compared with SC in 87% of 500 iterations at a
£20,000/QALY threshold. The study was funded by the makers of CSAI.
F.2.1.3 LCIG versus BMT CUAs
Two studies were found comparing LCIG with standard care (see Table 48).
Kristiansen et al. (2009) used a 2 year decision tree to compare LCIG and the likelihood of switching to standard care due to dissatisfaction with LCIG. Standard care included 25% of people using apomorphine. A lack of longer term outcome data was cited as the reason
for not using a lifetime horizon.
Intervention effects at 6 months were taken from the end point of a 6 week, small (n=24) crossover RCT that used naso-jejunal drug delivery rather than (like UK clinical practice)
percutaneous endoscopic gastrostomy drug delivery and also exhibited high drop-out levels (>20%). Differences between interventions were assumed to remain for the 2 year
time horizon of the model.
Resource use was based on that collected within the RCT and on usual practice and assumption (for adverse events) for the remainder of the modelled period. Utilities were
estimated using 15D rather than EQ5D, using Finnish population weights. Gains measured in the 6 week RCT were assumed to be sustained for the 2 year horizon of the
model. Both costs and outcomes were discounted at 3%, not at 3.5% as required by the NICE reference case (NICE, 2012) and societal perspective was reported.
LCIG was found to be more expensive and more beneficial than standard care, but with an ICER (SEK6,100,000 per QALY) over 10 times the suggested Swedish threshold (SEK500,000 per QALY). No one-way sensitivity analysis reduced the ICER to less than
SEK2,800,000 per QALY. In probabilistic sensitivity analysis, LCIG was cost-effective compared with standard care in 50% of iterations at a threshold at SEK6,224,000. The study was funded by the makers of LCIG.
Lowin et al. (2011) used a lifetime Markov model to compare LCIG with standard care.
LCIG was assumed to be used for 5.0 of the 5.3 years modelled. It was not stated whether standard care could include apomorphine use.
States were defined by Hoehn and Yahr stages and off-time categories – a structure first adopted by Palmer et al. (2002) that has since been taken forward in advanced Parkinson's disease by a number of other CUAs (Dams et al. 2013, Eggington et al. 2014,
Walter and Odin 2015). Hoehn and Yahr state transitions (including to death) were taken from an early stage Parkinson’s disease CUA; off-time transitions taken from a different early stage Parkinson’s disease CUA and assumed to be independent of Hoehn and Yahr
stage transitions.
Common to all CUAs which use a combined off-time and Hoehn and Yahr stage structure,
this CUA did not consider any relationship between the 2 measures. It seems clinically unlikely that state transitions for these 2 disease measures are not related; even more so that intervention effects could be modelled independently.
Also, assigning very different mortality risks to each Hoehn and Yahr state (2% in stage 3, 7% in stage 4, 22.5% in stage 5) meant large differences in life years and hence QALYs
were generated by such models.

Parkinson's disease (update) Full health economics report
NICE Internal Clinical Guidelines, 2016 7
The initial intervention effects and adverse event rates were taken from a single small (n=8) non-UK case series (Nyholm et al. 2008). An ongoing benefit of 50% slower deterioration on LCIG compared with standard care was assumed from unpublished
analyses of 2 6-week non-UK trials.
Intervention resource use was assumed, with the exception of drug use which was RCT
based and costs appeared to allow for apomorphine use. Standard unit costs were applied. State costs were taken from a linear regression model based on a UK based observational study. Utility estimates did not consider the impact of receiving the
interventions or of experiencing intervention related adverse events. State utilities were taken from unpublished data that only measured 3 of the 12 model states; utilities were linearly extrapolated from these 3 states for the 9 other states. It was not stated, but it was
unlikely that the EQ-5D responses were valued using the UK population tariff.
LCIG was found to generate more benefits than standard care, with a 17% gain in life
expectancy. However, LCIG had an ICER of £36,000 per QALY compared with standard care. In one-way sensitivity analyses, ICERs were much more likely to be worse than the base case, with a skewed collection of ICERs reported (ICERs ranging from £32,100 per
QALY (only slightly better than the base case) to £66,400 per QALY (almost double the base case). The ICER was most sensitive to intervention effect length and magnitude. No
probabilistic sensitivity analysis was reported and it was not clear that the uncertainties arising from the cost and utility regression models were incorporated into the model. The study was funded by the makers of LCIG and similar models have been used for
submissions to Scottish and Welsh technology appraisals (AWMSG 2007, SMC 2006).
F.2.1.4 DBS versus BMT CUAs
Seven studies were found comparing DBS with BMT (Dams et al., 2013, Eggington et al., 2014; Kawamoto et al., 2016; McIntosh et al., 2016; NICE 2006; Tomaszweski and Holloway 2001; Zhu et al. 2014; see Table 49).
One CUA (McIntosh et al., 2016) presented 1-year CUA results based on a UK RCT
(Williams et al. 2010), with 5- and 10-year extrapolated results. BMT could include either subcutaneous injection or intravenous infusion of apomorphine.
The PDSURG RCT (Williams et al., 2010) was conducted in the early 2000s, so clinical
practice in both arms may have changed in the intervening period. In particular, surgical procedures, adverse event rates, lengths of stay and pre- and post-operative follow-up
procedure may have changed. Despite having almost a decade of follow-up, no randomised results are available beyond 1 year, as the majority of people in the BMT arm received DBS after the 1-year randomised period.
Extrapolation to 5 and 10 years relied on existing DBS literature. It assumed surgical complications occurred within the first 6 months and that within-trial cost and utility
differences were maintained over the length of the extrapolation. No disease progression was modelled.
Person-level micro-costing resource use and outcome data (including EQ-5D utility data)
were collected within the RCT. Unit costs were taken from standard UK sources. RCT-based operative resource use appeared lower than the equivalent HRG cost. Costs
included apomorphine pump costs, which may not be borne by the NHS. Capital equipment costs were annuitized and appear to have included the full costs of equipment (for example stereotactic frame and robot) used for operations other than DBS for people
with Parkinson’s disease. Despite collecting PSS costs, these were not included in the incremental cost calculations.
An intention-to-treat analysis was undertaken, which meant the BMT arm included some DBS operations (12 operations in 183 people). The inclusion of DBS surgical costs, effects and adverse events will have lessened incremental differences between arms.
Compared with BMT, DBS was found to be substantially more expensive but with only a small QALY gain at 1 year, with an ICER of £468,150 per QALY. Extrapolated to 5 and 10

Parkinson's disease (update) Full health economics report
NICE Internal Clinical Guidelines, 2016 8
years, ICERs were reduced to £45,200 per QALY and £70,500 per QALY respectively, due to ongoing lower apomorphine costs in the DBS arm. In one-way sensitivity analyses, the ICER at 1 year was sensitive to the overall surgery costs and the utility gain. 5 and 10
year extrapolated results were sensitive to IPG lifespan, drug costs and utility gains.
Dams et al. (2013), Eggington et al. (2014) and Kawamoto et al. (2016) all used Markov
models to compare DBS with BMT. Dams et al. (2013) modelled a lifetime horizon and
used German costs; Eggington et al. (2014) chose a 5-year time horizon and used UK costs; Kawamoto et al. (2016) had a 10-year time horizon and a Japanese payer perspective. None of the studies stated whether apomorphine use was allowed in BMT.
All 3 CUAs used a combination of Hoehn and Yahr stages and on/off time to define their model states. Dams et al. (2013) nested on-times within Hoehn and Yahr states to reflect
intervention effects, whereas Eggington et al. (2014) followed Lowin et al. (2011) and used off-time categories. Kawamoto et al. (2016) dichotomised on/off experience into ≤25% off and >25% off.
Hoehn and Yahr state transitions in Eggington et al. (2014) were taken from a prospective community-based Singapore data, whereas Dams et al. (2013) used older cross-sectional
Finnish data. Kawamoto et al. (2016) used a mixture of observational evidence from Japan and Singapore. Off-time progressions appear to have been assumed independent and Eggington et al. (2014) took from an earlier CUA (Palmer et al. 2000). Dams et al.
(2013) and Kawamoto et al. (2016) did not model increased mortality with increasing disease severity; Eggington et al. (2014) used Taiwanese Hoehn-and-Yahr-based mortality data.
Dams et al. (2013) and Eggington et al. (2014) largely took intervention effects from a single non-UK RCT that is included in this clinical evidence review for DBS (Deuschl et al.
2006). Eggington et al. (2014) did not use direct clinical effects to drive their intervention effects but used disease progression. Dams et al. (2013) assumed a 4-year intervention effect length, whereas Eggington et al. (2014) used a 6-month intervention effect.
Kawamoto et al. (2016) used evidence from a Japanese case series for immediate DBS effects, assuming no change in their modelled control arm.
Intervention resource-use and costs in Dams et al. (2010) were sourced from local hospitals; Eggington et al. (2014) used expert opinion to select appropriate NHS tariffs. Kawamoto et al. (2016) based their estimate of resource use on Japanese guidelines.
Eggington et al. (2014) did not model further state or progression costs but did include rates and costs (but not utilities) of falls that increased with disease severity. Dams et al. (2013) used regression to model state and motor complication costs. Concomitant drug
use was taken from PDSURG abstract (Eggington et al. 2014); Dams et al. (2013) included these in their state costs; Kawamoto et al. (2016) assumed that drug costs would
be 20% lower following DBS implantation.
Utility estimates in Eggington et al. (2014) did not consider the impact of receiving the interventions or of experiencing intervention-related adverse events. Dams et al. (2013)
was the only published modelled CUA to consider the impact of receiving DBS and assumed post-surgery utility reductions for 3 months. State utilities in Eggington et al.
(2014) were based on non-DBS-specific utilities extrapolated from unpublished data for 3 of the 12 states in Lowin et al. (2011). Kawamoto et al. (2016) used a variety of sources for their health-state utility estimates: some were taken from previous non-DBS economic
evaluations (Lowin et al. 2011; Palmer et al. 2000), and 3 came from de novo EQ-5D estimates from healthy volunteers based on vignettes of state descriptions.
Dams et al. (2013) used linear regression to model state and motor complication utilities and discounted both costs and outcomes at 3%, not at 3.5% as required by the NICE reference case (NICE, 2012). Kawamoto et al. (2016) do not state what discount rate they
used but, from one-way sensitivity analysis, it appears to be approximately 3%.
Compared with BMT, Dams et al. (2013) found DBS produced an ICER of €6700 per
QALY, Eggington et al. (2014) estimated an ICER of £20,700 per QALY and Kawamoto et al. (2016) arrived at ICERs of US$70,200 per QALY for people with Hoehn and Yahr
Parkinson's disease (update) Full health economics report
NICE Internal Clinical Guidelines, 2016 9
stage 3 disease at baseline, US$25,600 per QALY for Hoehn and Yahr stage 4 and $27,200 per QALY for Hoehn and Yahr stage 5.
In one-way sensitivity analyses, the ICERs were found to be sensitive to the effect size modelled (motor score, utility gains and concomitant drug reductions), IPG lifespan, assumed utility values and time horizons. Dams et al. (2013) and Eggington et al. (2014)
did not report probabilistic sensitivity analyses; Kawamoto et al. (2016) performed rudimentary PSA with arbitrary (non evidence-based) bounds for parameters; they estimated that the probability that the ICER for DBS compared with BMT was <¥5 million
(c$41,000) was 93%. Eggington et al. (2014) was funded by the makers of DBS implant equipment.
The previous NICE clinical guideline (NICE, 2006) included a simplified costs and benefits
calculation over a 5-year time horizon comparing DBS with standard care in the UK. Very few details were provided for either arm, so it is not possible to establish whether standard care included the use of apomorphine. No disease-based model structure or disease
progression was employed. Intervention effect was modelled using utility only and assumed to last the entire 5 years of the analysis. No adverse events were modelled and mortality was only applied to the DBS arm.
Disease costs were taken from a UK paper (Findley et al. 2003) but those listed did not match those in the original paper. Intervention costs included the implanted device but not
the operative costs. Concomitant medication costs were assumed to be zero for 27% of people. Baseline and improvements in utility were taken from a French case series using a non-utility scale (PDQ-L, Lagrange et al., 2002). Drug reduction and utility gain were
assumed to continue for the 5 years of the analysis. Both costs and utilities were stated to be discounted at 3.5%, but this was not consistently applied.
DBS was found to be cost effective compared with standard care, with an ICER of £19,500 per QALY. In limited one-way sensitivity analyses, the ICER was sensitive to the treatment effect – if the gain was less than 27% (base case 38%), the ICER was greater
than £30,000 per QALY – and to the implantation costs (which in the base case did not include the operative costs). No probabilistic sensitivity analysis was reported.
Tomaszewski and Holloway (2001) used a residence-based model (outside or in nursing
home) with a lifetime horizon and American costs to compare DBS with BMT (apomorphine use not discussed). Transitions were taken from a large American cohort study. Intervention effects (including utility) were taken from a non-systematic evidence
synthesis, assumed from magnitude of UPDRS change and assumed to maintain for 4 year and then taper for 5 more years. IPG replacements were modelled to occur every 3 years.
Intervention costs were taken from standard American and localised sources; drug costs were assumed. Baseline utility was derived using a visual analogue scale and was not
reduced when people entered nursing homes. Both costs and utilities were discounted at 3%, not at 3.5% as required by the NICE reference case (NICE, 2012).
Compared with BMT, DBS was found to be associated with an ICER of $49,200 per QALY. In one-way sensitivity analyses, the ICER was sensitive the utility gain, intervention effect length, surgery costs and IPG replacement frequency. No probabilistic sensitivity
analysis was reported.
Valldeoriola et al. (2007) reported costs and outcomes from a small (n=29) waiting-list-
based, non-randomised, 1-year Spanish trial of DBS versus BMT. Costs and utilities (EQ-
5D using the Spanish tariff) were collected prospectively. Valldeoriola et al. (2007) found, at 1 year, DBS was reasonably cost effective compared with BMT, with an ICER of €34,400. Limited one-way sensitivity analyses found the ICER to be sensitive to the
inclusion of certain high-cost people in the BMT arm – the incremental cost difference rose when 1 person with a prolonged hospital stay (ICER €44,100 per QALY) and 2 people on apomorphine infusions (ICER €62,100 per QALY) were excluded from BMT
cost calculations. No other one-way sensitivity analyses were reported and no probabilistic sensitivity analysis was reported.

Parkinson's disease (update) Full health economics report
NICE Internal Clinical Guidelines, 2016 10
Zhu et al. (2014) report a rudimentary before-and-after analysis of a very small (n=13)
population of people undergoing DBS. They use costs and EQ-5D measured in the 2 years after implantation to estimate DBS costs and effects. For a comparator, they use each participant's costs over the year before DBS (multiplied by 2) and their EQ-5D
immediately before surgery (which is assumed to have applied for the previous 2 years). They estimate an ICER of US$123,110 per QALY for DBS compared with previous care over a 1-year time horizon and US$62,846 per QALY for a 2-year analysis.
F.2.1.5 Early DBS versus BMT CUAs
No CUAs comparing early DBS with BMT were found in the literature searches. However, as part of the Call for Evidence (see full guideline section 10.1 and appendix N), 2 papers were
submitted that met the inclusion criteria (Dams et al. 2016, Medtronic AIC, see Table 50).
Dams et al. (2016) used their previous economic model (Dams et al. 2013, see F.2.1.4) to model the results of the included non-UK EARLYSTIM RCT (Schuepbach et al. 2013). Using
the same model structure, Dams et al. (2016) updated baseline population characteristics, intervention effects, costs and utilities to reflect the early DBS RCT evidence. They also altered some cost inputs (surgery and IPG replacement costs) to better reflect current
practice and mapped PDQ-39 to EQ-5D (using the German tariff) using a tool that was not available when the original model was published. Notably Dams et al. (2016), despite noting the lack of long term clinical evidence on early DBS, assumed a lifetime intervention effect on
utility and drug reductions. Costs and utilities were discounted at 3%, not at 3.5% as required by the NICE reference case (NICE, 2012).
Dams et al. (2016) found early DBS to be cost effective compared with best medical treatment with an ICER of €22,700 per QALY. In one-way sensitivity analyses, the ICER was
found to be sensitive to IPG lifespan and the time horizon. No probabilistic sensitivity analysis was reported.
Medtronic (AIC) used a simplified version of their previous economic model (Eggington et al. 2014, see F.2.1.4) to model the results of the included non- UK EARLYSTIM RCT (Schuepbach et al. 2013). Xxxxxxxxxxxxxxxxxxxxxxxxxxxxxxxxxxxxxxxxxxxxxxxxxxxxxxxxx xxxxxxxxxxxxxxxxxxxxxxxxxxxxxxxxxxxxxxxxxxxxxxxxxxxxxxxxxxxxxxxxxxxxxxxxxxxxxxxxxx
xxxxxxxxxxxxxxxxxxxxxxxxxxxxxxxxxxxxxxxxxxxxxxxxxxxxxxxxxxxxxxxxxxxxxxxxxxxxxxxxxxxxxxxxxxxxxxxxxxxxxxxxxxxxxxxxxxxxxxxxxxxxxxxxxxxxxxxxxxxxxxxxxxxxxxxxxxxxxxxxxxxxxxxxxxxxxxxxxxxxxxxxxxxxxxxxxxxxxxxxxxxxxxxxxxxxxxxxxxxxxxxxxxxxxxxxxxxxxxxxxxxxxx
xxxxxxxxxxxxxxxxxxxxxxxxxxxxxxxxxxxxxxxxxxxxxxxxxxxxxxxxxxxxxxxxxxxxxxxxxxxxxxxxxxxxxxxxxxxxxxxxxxxxxxxxxxxxxxxxxxxxxxxxxxxxxxxxxxxxxxxxxxxxxxxxxxxxxxxxxxxxxxxxxxxxxxxxxxxxxxxxxxxxxxxxxxxxxxxxxxxxxxxxxxxxxxxxxxxxxxxxxxxxxxxxxxxxxxxxxxxxxxxxxxxxxx
xxxxxxxxxxxxxxxxxxxxxxxxxxxxxxxxxxxxxxxxxxxxxxxxxxxxxxxxxxxxxxxxxxxxxxxxxxxxxxxxxxxxxxxxxxxxxxxxxxxxxxxxxxxxxxxxxxxxxxxxxxxxxxxxxxxxxxxxxxxxxxxxxxxxxxxxxxxxxxxxxxxx
xxxxxxxxxxxxxxxxxxxxxxxxxxxxxxxxxxxxxxxxxxxxxxxxxxxxxxxxxxxxxxxxxxxxxxxxxxxxxxxxxxxxxxxxxxxxxxxxxxxxxxxxxxxxxxxxxxxxxxxxxxxxxxxxxxxxxxxxxxxxxxxxxxxxxxxxxxxxxxxxxxxxxxxxxxxxxxxxxxxxxxxxxxxxxxxxxxxxxxxxxxxxxxxxxxxxxxxxxxxxxxxxxxxxxxxxxxxxxxxxxxxxxx
xxxxxxxxxxxxxxxxxxxxxxxxxxxxxxxxxxxxxxxxxxxxxxxxxxxxxxxxxxxxxxxxxxa
F.2.1.6 Discussion of existing economic evidence
A number of CUAs that cover comparisons in the decision space were found. Only 1 CUA that covered all 3 comparators (DBS, LCIG and BMT) was found with others conducting two way comparisons between one of the interventions of interest and BMT.
CUAs were characterised by a lack of detail as to what BMT included, short term horizons, assumptions regarding the magnitude and duration of intervention benefits, no consideration
a Academic-in-confidence material removed

Parkinson's disease (update) Full health economics report
NICE Internal Clinical Guidelines, 2016 11
of the short term utility impact of receiving the modelled interventions, a lack of full probabilistic sensitivity analyses and potential conflicts of interest.
Whilst a variety of model structures were employed, many CUAs (Dams et al. 2013,
Eggington et al. 2014, Lowin et al. 2011, Walter and Odin 2015) used a combination of Hoehn and Yahr stages and off-time, following the earlier example of Palmer et al. (2002). The assumption that these measures are independent has not been explored and these
measures are not usually primary outcomes in related RCTs. Each of these CUAs has also used state based utility values from Lowin et al. (2011), from data covering only 3 of the 12 states.
There was limited consistency in the results of included CUAs. Both CUAs comparing LCIG with BMT (Kristiansen et al. 2009, Lowin et al. 2011) and the most directly applicable CUA comparing DBS with BMT (McIntosh et al. 2016) found ICERs above commonly accepted willingness-to-pay thresholds for the interventions, whereas the multiple comparison between
DBS, LCIG, CSAI and BMT (Walter and Odin, 2015) found CSAI to be cost effective. Model based CUAs found DBS was cost-effective compared with BMT (Dams et al., 2013, Eggington et al. 2014, NICE 2006, Tomaszewski and Holloway 2001) but generally with
ICERs very close to accepted thresholds.
Partly due to methodological differences to model based CUAs, shorter-term RCT based CUAs tended to report much higher or more sensitive ICERs (Kristiansen et al. 2009,
McIntosh et al. 2016, Valldeoriola et al. 2007). Here, ICERs were sensitive to magnitude and duration of intervention and utility effect, intervention costs and battery lifespan. Only 2 CUAs (Walter and Odin 2015, McIntosh et al. 2016) reported full probabilistic sensitivity analyses.
Two CUAs, both based on the EARLYSTIM RCT (Schupbach et al. 2013) both found early DBS to be cost effective compared with best medical treatment. They found similar incremental costs, but Dams et al. (2016) modelled greater QALY gains due to their inclusion
of a state based mortality benefit. Both CUAs found their results were sensitive to IPG lifespan and the time horizon – long term (greater than 2 year) data for both these inputs are currently lacking.
The absence of a directly applicable UK based CUA with only minor limitations including all 3 comparators confirmed the GDG’s view that an original economic analysis should be undertaken.
Parkinson's disease (update) Full health economics report
NICE Internal Clinical Guidelines, 2016 12
F.3 Original cost–utility model – methods
F.3.1.1 Overview of the model
We built a Markov model with 3-month cycle-length and a lifetime time-horizon. The cycle length was determined by the length of the shortest clinically included trial (Olanow et al. 2014). Some existing models adopt a shorter time horizon (Eggington et al. 2014, McIntosh
et al. 2016, NICE 2006); however there appeared to be no reason not to extend our model to lifetime.
Preliminary consideration of model structure
The committee discussed a variety of potential model structures, some of which were based on the existing economic literature (see F.2). They considered the following factors when selecting their preferred model structure:
Clinical relevance and biological plausibility
Ability to capture relevant patient experience
Ability to capture potentially important outcome differences between interventions
Data availability
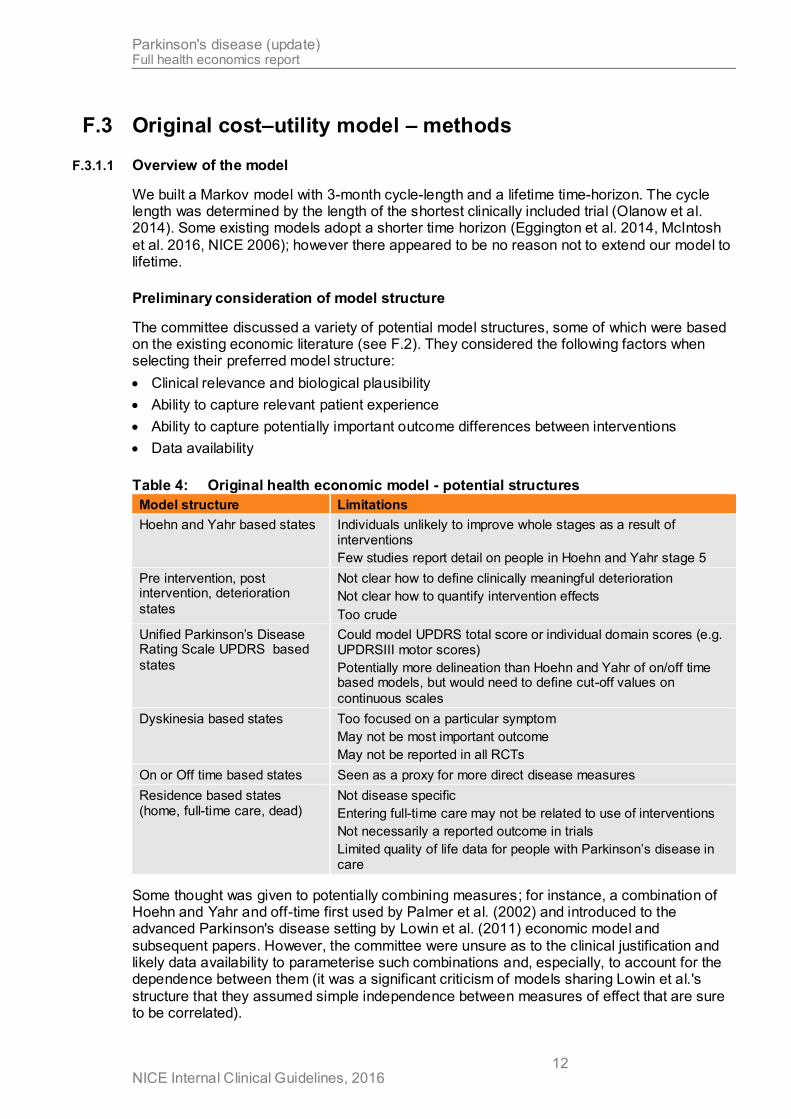
Table 4: Original health economic model - potential structures
Model structure Limitations
Hoehn and Yahr based states Individuals unlikely to improve whole stages as a result of interventions
Few studies report detail on people in Hoehn and Yahr stage 5
Pre intervention, post intervention, deterioration
states
Not clear how to define clinically meaningful deterioration
Not clear how to quantify intervention effects
Too crude
Unified Parkinson’s Disease Rating Scale UPDRS based
states
Could model UPDRS total score or individual domain scores (e.g. UPDRSIII motor scores)
Potentially more delineation than Hoehn and Yahr of on/off time based models, but would need to define cut-off values on
continuous scales
Dyskinesia based states Too focused on a particular symptom
May not be most important outcome
May not be reported in all RCTs
On or Off time based states Seen as a proxy for more direct disease measures
Residence based states (home, full-time care, dead)
Not disease specific
Entering full-time care may not be related to use of interventions
Not necessarily a reported outcome in trials
Limited quality of life data for people with Parkinson’s disease in care
Some thought was given to potentially combining measures; for instance, a combination of Hoehn and Yahr and off-time first used by Palmer et al. (2002) and introduced to the advanced Parkinson's disease setting by Lowin et al. (2011) economic model and
subsequent papers. However, the committee were unsure as to the clinical justification and likely data availability to parameterise such combinations and, especially, to account for the dependence between them (it was a significant criticism of models sharing Lowin et al.'s
structure that they assumed simple independence between measures of effect that are sure to be correlated).

Parkinson's disease (update) Full health economics report
NICE Internal Clinical Guidelines, 2016 13
The committee favoured a residence-based model structure. Despite the lack of disease-specific states, they felt that avoiding or delaying entry to full-time care was a critical aim of Parkinson’s disease treatment, for people with Parkinson’s disease, their carers, clinicians
and health care commissioners. The loss of independence when a person with Parkinson’s disease that causes or is associated with entering full-time care has a big impact on both costs and quality of life.
In its broadest sense, deteriorating motor function was seen to be a key driver of entering full-time care and it is on this outcome the interventions were felt to act. Improving, or delaying decline in motor function (as measured by UPDRS-III) could maintain independence
and delay entry to care. Age was also assumed to be a key driver of entering full-time care and this would be modelled as time progression in the model. It is noted that other symptoms, particularly cognition could also be key drivers of entry to care however the
interventions being modelled are not expected to impact these symptoms. Indeed, Williams et al. (2010) showed no impact on dementia.
Selected model structure
Figure 1 provides a schematic depiction of the model structure. Everyone starts the model in the “home” state and the “home” state could encapsulate the costs of home-based social services and support. There is no arrow between “full-time care” and “home” as it was
assumed that once people with Parkinson’s disease entered full-time care, they could not leave. This is consistent with assumptions in other model structures that only model disease worsening progression (e.g. Hoehn and Yahr stage or off-time). In the base case, it was
assumed that full-time care was nursing home care. The committee felt a small minority of people with Parkinson’s disease in full-time care may require only residential care; a scenario
analysis was prespecified to vary the costs associated with this state.
The interventions were applied to everyone at the start of the model, in the home state. Interventions will delay entry to full-time care and the cost and quality of life associated with being in full-time care.
Full-time
care
Dead
Home
Red arrow indicates transition that depends on time-to-event model for entry to care
Blue arrows indicate transitions that depend on time-to-event model for death
Figure 1: Original cost–utility model: basic structure
A residence-based model structure was noted to be different to the majority of the existing economic studies. With the exception of an early American paper (Tomaszewski and Holloway 2001), most model papers used a combination of Hoehn and Yahr and on- or off-
time states (Dams et al. 2013, Dams et al. 2016, Eggington et al. 2014, Lowin et al. 2011, Medtronic AIC, Walter and Odin 2015). These papers have not explicitly modelled interventions delay entry to full-time care; most indirectly incorporate the costs of full-time
Parkinson's disease (update) Full health economics report
NICE Internal Clinical Guidelines, 2016 14
care via earlier Hoehn and Yahr based costings of Parkinson’s disease (for instance using Findley et al. 2011). Quality of life by Hoehn and Yahr state in many of these papers are assumed for many states and do not appear to capture the utility changes that may be
associated with entering full-time care.
None of the key trials reported rates of people with Parkinson’s disease entering full-time care and these data were not provided in response to the call for evidence.
A conference abstract outlined the relationship between covariates and entering care for people with Parkinson’s dissease (Macleod and Counsell 2014). The Parkinsonism Incidence in North-east Scotland study (PINE) covers an incident community cohort of people with Parkinson’s disease, their carers and age and gender matched controls. Data on disease
progression, complications and quality of life have been collected over their remaining lifetime for an incidence cohort of 200 people (Caslake et al. 2013). In univariate analysis, the abstract identified age, dependence, UPDRSIII (motor score), timed walk, MMSE score
(cognition) and co-morbidities as predictive of institutionalisation.
The committee felt age, dependence, MMSE and co-morbidities would not be directly influenced by the interventions being modelled. UPDRSIII (motor score) was seen by the
committee as a primary and validated disease progression measure that was a key clinical outcome in trials of the modelled interventions. Unlike disease measures such as on/off time and quality of life (assessed solely by people with Parkinson’s disease) and Hoehn and Yahr
stage (assessed solely by clinicians), UPDRSIII motor score is assessed jointly by people with Parkinson’s disease and clinicians. Moreover, UPDRSIII motor score has reported associations with quality of life (Dams et al. 2013b), residence (Porter et al. 2010) and
mortality (Forsaa et al. 2010, Marras et al. 2005).
The PINE investigators made their patient-level dataset available to us. Therefore, we were able to explore the relationship between clinical variables including UPDRSIII and transitions
from home to care, using data from a recent UK cohort of people with Parkinson’s disease.
F.3.1.2 Parameters – general approach
Identifying sources of parameters
With the exception of the 1-year clinical effectiveness data, which were drawn from the systematic review conducted for this research question (see below), parameters were
identified through informal searches that aimed to satisfy the principle of ‘saturation’ (that is, to ‘identify the breadth of information needs relevant to a model and sufficient information such that further efforts to identify more information would add nothing to the analysis’
[Kaltenthaler et al., 2011]). We conducted searches in a variety of general databases, including Medline (via PubMed), the Cochrane Database of Systematic Reviews and GoogleScholar.
When searching for quality of life , resource use and cost parameters in particular searches were conducted in specific databases designed for this purpose, the CEA (Cost-Effectiveness Analysis) Registry and the NHS Economic Evaluation Database (NHS EED) for example.
In cases where there was paucity of published literature for values essential to parameterise key aspects of the model, data were obtained from unpublished sources; further details are provided below.
Selecting parameters
Our overriding selection criteria were as follows:

Parkinson's disease (update) Full health economics report
NICE Internal Clinical Guidelines, 2016 15
The selected studies should report outcomes that correspond as closely as possible to the
health states and events simulated in the model.
The selected studies should report a population that closely matches the UK population
(ideally, they should be drawn from the UK population).
All other things being equal, more powerful studies (based on sample size and/or number
of events) were preferred.
Where there was no reason to discriminate between multiple possible sources for a given
parameter, we gave consideration to quantitative synthesis (meta-analysis), to provide a single summary estimate.
F.3.1.3 Baseline cohort characteristics
Two separate sources were available for baseline demographic and clinical variables. Our
preferred source was a weighted average of data from the 2 key included RCTs (PDSURG HY≥3 and Olanow et al. 2014). Data were also available from the participants in PINE who had Hoehn and Yahr scores of 3 or greater at baseline. These were used in a scenario
analysis. The GDG thought the RCT data were closer to their expectations, so these were preferred in the base case. See Table 5.
Table 5: Baseline cohort characteristics
Weighted RCT
baseline values
(base case) PINE (HY≥3 at baseline)
Age 60.91 75.6
Sex (% male) 68.9% Not used
Activities of daily living: UPDRSII (on) 13.17 15.0
Motor symptoms: UPRDSIII (on) 20.72 36.0
Off-time (hrs) 5.64 Not estimable
PDQ-39 SI 39.73 29.7
EQ-5D 0.41 0.54
Hoehn and Yahr (off) 3.09 3.3
F.3.1.4 Imputation of missing data
The model relied on analyses performed on patient-level data from PINE and/or PDSURG for many of its treatment effects (see F.3.1.5) and long-term transitions (see F.3.1.8–F.3.1.10).
Owing to the high level of missing data in both datasets (especially as follow-up extended
beyond a few years), it was necessary to impute some missing values in order to fit the relevant models. Two approaches were explored. Firstly, a simple last-observation-carried-forward (LOCF) strategy was used, in which each participant's covariate value was assumed
to be equal to their last observed value. This had the advantage of being straightforward to calculate. It was also thought to be consistent with the underlying rationale of time-to-event analysis, in which observations are assumed to maintain their status until an empirical
change (that is, an event) is observed.
The second approach relied on multiple imputation using chained equations (mi package
v1.0 in R). In each dataset, 10 chains of 500 imputation iterations were run, with a predictive
mean matching algorithm used to substitute observed values for missing ones. The relevant models (ANCOVA for treatment effects; proportional hazards for time-to-event) were then estimated for each chain, with Rubin's rules used to combine the models into a single set of
averaged coefficients and variance–covariance matrix. This approach had the theoretical advantage of adopting a more sophisticated relationship between known data to inform missing values. On the other hand, because it uses future data as well as past and current

Parkinson's disease (update) Full health economics report
NICE Internal Clinical Guidelines, 2016 16
values to impute missing values, it could run foul of a central precept of time-to-event analysis (Therneau et al. [2016] state that ' The key rule for time dependent covariates in a Cox model is simple and essentially the same as that for gambling: you cannot look into the
future.')
Because the 2 imputation approaches could only be performed using slightly different datasets (for example, multiple imputation will estimate missing baseline values, whereas
LOCF is only feasible once a value has been observed to carry forward), it was not possible to perform direct model comparison (using, e.g., Akaike's Information Criterion). As neither could be strongly preferred as a matter of clinical or methodological theory, the HE model
was configured to explore how the use of each model affected outputs.
F.3.1.5 Treatment effects
The short-term effectiveness of the interventions – in terms of UPDRS II, UPDRS III, off-time, PDQ-39 and EQ-5D – was modelled using data from included RCTs.
For DBS, particular reliance was placed on PDSURG, not only because it was a UK-based trial that provided the longest follow-up in the assembled evidence but also
because patient-level data were available to the developers, which enabled the estimation of treatment effects in participants of direct relevance to the question. For these reasons, 1-year DBS effectiveness was estimated using the PDSURG HY≥3 analyses alone,
although the model was also configured to optionally use data from the other included RCTs with shorter follow-up to estimate effectiveness over the first year following surgery.
Various effect estimates could be derived from the PDSURG data. In line with the clinical effectiveness review, we preferred results from an ANCOVA model based on multiply imputed data (see full guideline section 10.3), adjusted for baseline score. Data for all trial
participants, regardless of baseline HY score, were entered into these models, but Hoehn and Yahr status (<3 -v- ≥3), treatment allocation and an interaction between the 2 were specified as covariates of final score. In this way, final estimates of DBS -v- BMT effect in
the target HY≥3 population are a function of the estimated effect of Hoehn and Yahr status, the estimated effect of treatment allocation and the extent to which these factors interact. This is a more robust way of identifying subgroup effects than to limit the
underlying dataset to people with the characteristic of interest (see Altman and Bland, 2003).
For LCIG, only 1 RCT was available (Olanow et al., 2014), and this was limited to
12 weeks' follow-up. In order to estimate 1-year treatment effects, these 12-week data were supplemented by data from a case series of 354 people followed for 54 weeks following insertion of a percutaneous endoscopic gastro-jejunostomy (PEG-J) to deliver
LCIG (Fernandez et al., 2015). These data suggest that, in all relevant outcomes, all improvement takes place within the initial 12 weeks of treatment. Therefore, it was considered reasonable to assume that the difference between LCIG and BMT would, on
average, be similar at 1 year as observed after 12 weeks. However, to quantify the increased uncertainty inherent in this assumption, 2 separate 12–52 week 'drift' rates were estimated for the treatment and control arms, using the observed 12–52-week effects from
Fernandez et al. (2015). Because the same data were used for treatment and control arms, this did not result in any change to the expected treatment effect; however, it appropriately reduced the precision of the 1-year estimate. It was initially planned to
perform this analysis as a Bayesian indirect comparison, with independent Monte-Carlo sampling for the 2 'drift' parameters. However, it can be shown that such an approach produces results that are simple to calculate analytically:
MD(LCIGvBMT52wk) = MD(LCIGvBMT12wk)
Var(MD[LCIGvBMT52wk]) = Var(MD[LCIGvBMT12wk]) + 2 × Var(drift12–52wk) (1)

Parkinson's disease (update) Full health economics report
NICE Internal Clinical Guidelines, 2016 17
In other words, the point estimate of the 1-year effect is identical to the 12-week effect,
and its variance is equal to the variance of the 12-week effect plus twice the variance of the 12–52-week drift estimate.
The treatment effects used in the model are summarised in Table 6.
Table 6: 1-year treatment effects used in model
Mean difference compared with BMT at 1 year
DBS (PDSURG HY≥3a)
LCIG (Olanow et al., 2014)
UPDRS-II -2.92 (-5.02, -0.82) -3.00 (-5.44, -0.56)b
UPDRS-III -6.48 (-9.93, -3.03) 1.40 (-3.19, 5.99)b
Off-time -2.62 (-3.65, -1.60) -1.91 (-3.11, -0.71)b
PDQ-39 -7.21 (-12.10, -2.32) -7.00 (-12.96, -1.04)b
EQ-5D 0.12 (0.02, 0.22) 0.07 (-0.02, 0.16)b a multiply imputed data; ANCOVA model with baseline score, Hoehn and Yahr status (<3 -v- ≥3) and treatment
allocation as covariates of final score
b variance adjusted to quantify additional uncertainty in projecting 12-week results to 1 year
Dropouts
On advice from GDG, it was assumed that there is no dropout from DBS treatment, as it is extremely rare for patients to have their devices turned off or removed.
For LCIG, dropout rates were calculated for 3 periods, based on data sourced from 2 published case series. Fernandez et al. (2015) was used to estimate the probability that
candidates would successfully complete the naso-testing phase. The same study was used for the probability of withdrawal in the first year following implantation, because the series commences with the insertion surgery. Slevin et al. (2015) was used for subsequent years,
because this series presents follow-up of people following the immediate post-insertion period. Rates used are tabulated in Table 7.
Table 7: Dropout rates for LCIG
No. events/N = %rate (95%CI) Source
% receiving naso-test prior to PEG 25% GDG assumption
% converting from naso-test to PEG 324/354 = 91.5% (88.4%, 94.2%) Fernandez et al. (2015)
Dropouts
Year 1 (post NJ stage) 52/324 = 16.0% (12.3%, 20.2%) Fernandez et al. (2015)
Year 2+ 7/62 = 11.3% (4.7%, 20.2%) Slevin et al. (2015)
In an additional scenario analysis, we configured the model to make use of data from Nyholm et al.'s case series (2012). This provides a time-to-event estimate of discontinuation
probability over follow-up of up to 16 years, censoring for death (which is helpful, for our purposes: if death were treated as a discontinuation event, using these data in a model that simulates mortality separately would double-count discontinuations due to death). This
publication shows a lower rate of discontinuations than Fernandez et al. (2015) and Slevin et al. (2015). We fitted a parametric (Weibull) function to the published Kaplan–Meier curve, and estimated the time-dependent probability of discontinuation from this. The first 10 years
were used to estimate the function; the last 6 years' data were provided by very few participants and, without access to patient-level data, it is not straightforward to account for the true uncertainty in the labile tails of survival functions. Figure 2 shows the fitted function
overlaid on the published data.

Parkinson's disease (update) Full health economics report
NICE Internal Clinical Guidelines, 2016 18
Figure 2: Probability of discontinuing LCIG – data extracted from Nyholm et al. (2012)
with fitted Weibull function
F.3.1.6 Adverse events
Adverse events of DBS and LCIG were handled in terms of their costs and quality of life impact; see relevant sections below. Individual AEs were not modelled for DBS; instead, direct evidence from PDSURG on their cost impact at aggregate level was used (seeTable
22, below). For LCIG, for which no such data exist, the incidence of individual complication was modelled using the same 2 case series as for dropouts (Fernandez et al., 2015; Slevin
et al., 2015). Rates used are tabulated in Table 8.
Table 8: Adverse event rates for LCIG
Year 1 (Fernandez et al., 2015)
Year 2+ (Slevin et al., 2015)
Pump 116/324 = 35.8% (30.7%, 41.1%) 34/62 = 55.0% (42.6%, 67.1%)
PEG 114/324 = 35.2% (30.1%, 40.5%) 22/62 = 36.0% (24.6%, 48.2%)
Stoma 116/324 = 35.8% (30.7%, 41.1%) 27/62 = 44.0% (32.0%, 56.4%)
J tube 165/324 = 50.9% (45.5%, 56.3%) 31/62 = 50.0% (37.7%, 62.3%)
Other 114/324 = 35.2% (30.1%, 40.5%) 10/62 = 16.0% (8.1%, 26.0%)
For DBS, perioperative mortality was also modelled. The probability was estimated by combining data from all 4 included DBS RCTs in a fixed-effects meta-analysis (with logistic transformation – that is, estimates were combined on a log-odds scale). A value of 0.0077 (95%CI: 0.003, 0.022) resulted.

Parkinson's disease (update) Full health economics report
NICE Internal Clinical Guidelines, 2016 19
F.3.1.7 Progression of clinical variables over time
The GDG advised on the most plausible assumptions for extrapolating 1-year treatment effects to the lifetime horizon of the model.
This comprised 2 components: a baseline progression trajectory, and an assumed relative effect associated with treatment.
The baseline absolute rates of progression over time were estimated from patient-level data (PINE or PDSURG). For PINE analyses, progress was measured from the first measurement at which the participant's Hoehn and Yahr score was 3 or greater. For PDSURG, the HY≥3
subgroup was used, and only values more than 1 year after DBS surgery were included (in order to avoid double-counting the treatment effect that is estimated in the RCT). GDG advice was that people would not experience increasing benefit from DBS beyond the initial
effect measure in year 1; therefore, it was considered appropriate to use post-1-year data to estimate the trajectory for people receiving any treatment being simulated. All trajectories
were estimated using linear mixed-effects models, with a random effect for each participant
and a fixed effect for time (package nlme v3.1-128 in R). Results are tabulated in Table 9
and depicted in Figure 3.
The model was configured to use either PINE or PDSURG data for its baselines; we did not calculate results using different baselines for different arms. In particular, although it might be superficially attractive to use PDSURG data to estimate DBS progression and PINE data for BMT, such an approach would effectively discard the robust, randomised evidence on which
the initial treatment effect is based and replace it with a nonrandomised comparison between heterogeneous datasources. This was judged inappropriate.
Table 9: Baseline yearly progression in clinical variables
PINE PDSURG
UPDRSII (on) -0.787 (-1.542, -0.032) 0.937 (0.588, 1.287)
UPDRSIII (on) 1.901 (1.574, 2.229) 0.482 (-0.061, 1.025)
Off-time (hrs) 0.167 (0.131, 0.203) 0.046 (-0.094, 0.186)
PDQ-39 SI 2.010 (1.566, 2.453) 1.381 (0.871, 1.891)
EQ-5D -0.033 (-0.043, -0.022) -0.035 (-0.048, -0.022)
Data were sparse for UPDRSII in PINE, leading to an uncertain trajectory that, in its point estimate, was slightly negative (that is, it suggests people get better over time, in this
domain). This was an obviously counterintuitive finding that was explored in sensitivity analysis.
The estimate of UPDRS-III decline in PDSURG was significantly lower than that observed in
the PINE dataset. This may reflect differences in underlying populations (in particular, the PINE cohort was more than a decade older than the PDSURG population and had much more pronounced impairment of motor function at baseline). Again, the impact of this
discrepancy was explored in sensitivity analysis.
In both PDSURG and PINE, off-time was not recorded as continuous data. Instead, values were approximated using question 39 of the UPDRS battery, which estimates off-time in quartiles. We assumed that a waking day was 16 hours long to calculate approximate
continuous values. The impact of these approximations is uncertain, but is most likely to underestimate true off-time

Parkinson's disease (update) Full health economics report
NICE Internal Clinical Guidelines, 2016 20
PINE PDSURG
UP
DR
S-I
I
UP
DR
S-I
II
Off
-tim
e
PD
Q-3
9
EQ
-5D
Figure 3: Original cost–utility model: trajectories for extrapolating clinical variables over time

Parkinson's disease (update) Full health economics report
NICE Internal Clinical Guidelines, 2016 21
When it came to extrapolating treatment benefits into the future, the group agreed that different assumptions should be adopted for the different variables. It felt that, for motor symptoms – UPDRS-III and off-time – it was reasonable to assume that the benefit of DBS
and LCIG over BMT that was observed in the RCTs would persist indefinitely. However, in other domains – activities of daily living (UPDRS-II) and quality of life (PDQ-39 and EQ-5D) – an attenuation of benefit over time was a more realistic assumption. This reflects group
members' experience (particularly of DBS) that, while the motor effect of treatment does not diminish, its contribution to overall quality of life is gradually reduced by the development of
non-motor symptoms over time. In the base case, it was assumed that these outcomes would gradually revert to the same level as modelled in the BMT arm over a period of 7 years, with this value tested in sensitivity analysis. Modelled trajectories are shown in Figure
4.
0
5
10
15
20
25
30
35
40
45
50
0 1 2 3 4 5 6 7 8 9
10
UP
DR
S II
Years
DBS
LCIG
BMT
0
5
10
15
20
25
30
35
40
45
50
0 1 2 3 4 5 6 7 8 9
10
UP
DR
S III
Years
DBS
LCIG
BMT
0
1
2
3
4
5
6
7
8
9
10
0 1 2 3 4 5 6 7 8 9
10
Off
tim
e
Years
DBS
LCIG
BMT
0
10
20
30
40
50
60
0 1 2 3 4 5 6 7 8 9
10
PD
Q-3
9
Years
DBS
LCIG
BMT
0
0.1
0.2
0.3
0.4
0.5
0.6
0 1 2 3 4 5 6 7 8 9
10
EQ
-5D
Years
DBS
LCIG
BMT
Figure 4: Diminishing (UPDRS-II; PDQ-39; EQ-5D) and constant (UPDRS-III; off-time)
benefit over time in extrapolated treatment effects
F.3.1.8 Transitions
Transitions from home to full-time care and from home and full-time care to death were estimated using time-to-event analysis based on patient level data from PINE and PDSURG. This approach requires 2 elements: an estimate of baseline hazard to which 1 of the
Parkinson's disease (update) Full health economics report
NICE Internal Clinical Guidelines, 2016 22
modelled arms is subject, and an estimate of relative effect induced by changes in modelled clinical variables. These components combine to quantify the hazard of event given treatment-related changes in clinical variables.
Cox proportional hazards models were fitted to PINE time-to-care data and PINE and PDSURG time-to-death data using our key clinical variables – UPDRS-III (on), UPDRS-II (on), off-time, EQ-5D and PDQ-39 – as time-varying covariates. Because UPDRS-III
appeared to be the strongest predictor of both time to care and time to death, univariable versions of each model were also developed, in which transitions were estimated as functions of UPDRS-III effect alone.
All proportional hazards analyses were also adjusted for baseline age of study participants (in order to isolate the independent effects of the covariates of interest, which are likely to be correlated with age). However, it was not necessary to apply this as an independent effect in the HE model, as it was already accounted for in the baseline functions to which the
proportional hazards were applied.
F.3.1.9 Transitions – time to full-time care
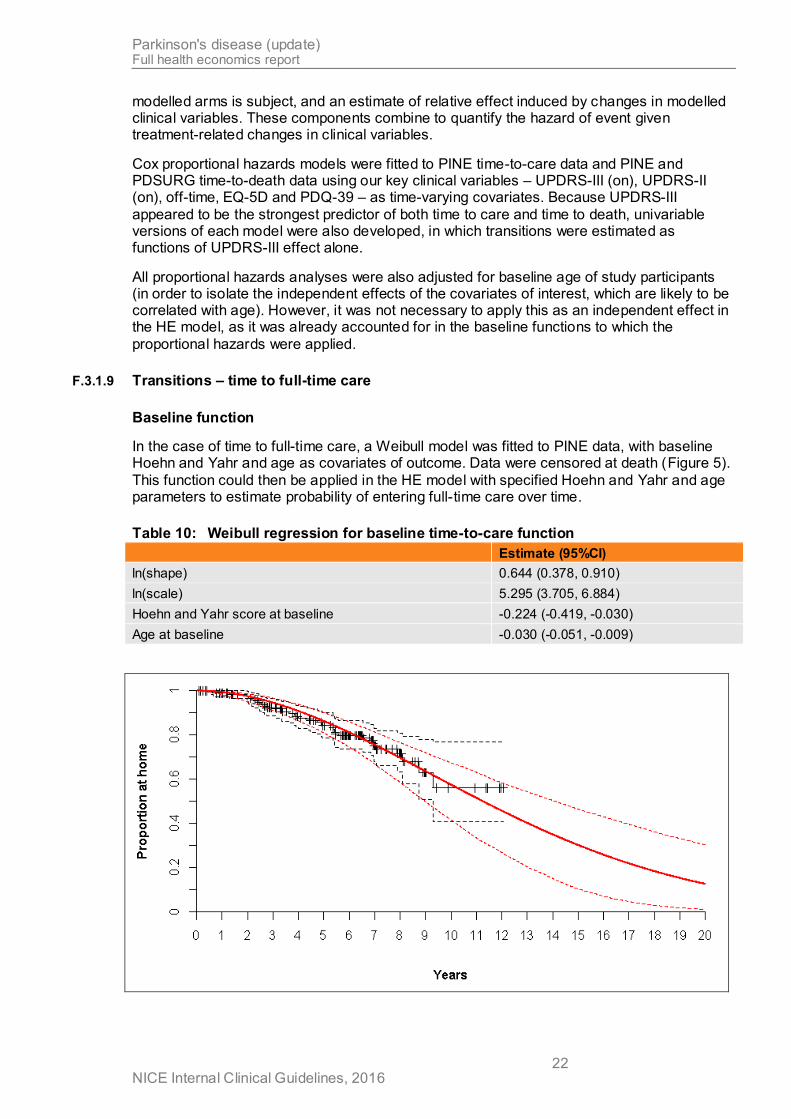
Baseline function
In the case of time to full-time care, a Weibull model was fitted to PINE data, with baseline Hoehn and Yahr and age as covariates of outcome. Data were censored at death (Figure 5).
This function could then be applied in the HE model with specified Hoehn and Yahr and age parameters to estimate probability of entering full-time care over time.
Table 10: Weibull regression for baseline time-to-care function
Estimate (95%CI)
ln(shape) 0.644 (0.378, 0.910)
ln(scale) 5.295 (3.705, 6.884)
Hoehn and Yahr score at baseline -0.224 (-0.419, -0.030)
Age at baseline -0.030 (-0.051, -0.009)

Parkinson's disease (update) Full health economics report
NICE Internal Clinical Guidelines, 2016 23
Figure 5: Original cost–utility model: baseline time-to-care function (PINE dataset)
with fitted Weibull function
This curve was assumed to represent the probability of entering full-time care in the BMT
arm of the model.
Proportional hazards
Hazard ratios estimating the relative effect associated with differences in clinical parameters for DBS v. BMT and LCIG v. BMT were estimated using the proportional hazards models
shown in Table 11. We could only estimate this model using PINE data, as PDSURG contains very sparse data on care outcomes.
Table 11: Cox proportional hazards models: time to full-time care
PINE PDSURG
LOCF Multiply imputed LOCF Multiply imputed
HR (95%CI) HR (95%CI) HR (95%CI) HR (95%CI)
Univariable
UPDRS III 1.081 (1.047, 1.116) 1.064 (1.030, 1.100)
Multivariable (inc. EQ-5D)
UPDRS_III 1.060 (1.018, 1.104) 1.055 (1.009, 1.102)
UPDRS_II 1.026 (0.953, 1.104) 1.028 (0.962, 1.097)
OffTime 1.095 (0.756, 1.588) 0.880 (0.563, 1.376)
PDQ39 1.024 (0.990, 1.060) 1.002 (0.970, 1.036)
EQ5D 0.325 (0.060, 1.770) 1.346 (0.214, 8.465)
Multivariable (exc. EQ-5D)
UPDRS_III 1.064 (1.021, 1.108) 1.054 (1.009, 1.102)
UPDRS_II 1.025 (0.953, 1.102) 1.024 (0.959, 1.094)
OffTime 1.110 (0.774, 1.592) 0.876 (0.558, 1.373)
PDQ39 1.035 (1.005, 1.066) 1.048 (1.006, 1.093)
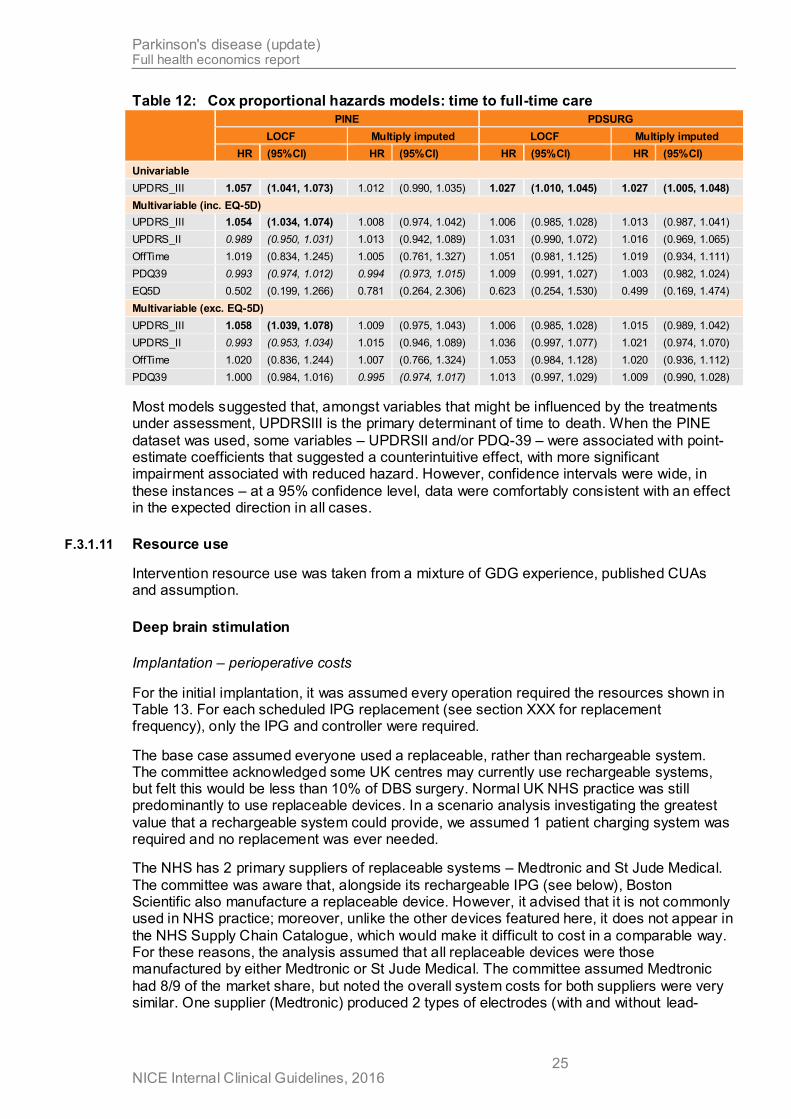
All models suggested that, amongst variables that might be influenced by the treatments
under assessment, UPDRSIII is the primary determinant of time to full-time care. When multiply imputed data were used, some variables – off-time and/or EQ-5D – were associated with point-estimate coefficients that suggested a counterintuitive effect, with more significant
impairment associated with reduced hazard; however, confidence intervals were wide, in these instances – at a 95% confidence level, data were comfortably consistent with an effect in the expected direction in all cases.
F.3.1.10 Transitions – time to death
Baseline function
In the case of time to death, patient-level data on survival following DBS surgery (regardless of initial treatment allocation, but limited to people with Hoehn and Yahr scores of 3 or more at the time of surgery) were extracted from the PDSURG dataset, and a Weibull model was
fitted to these data (Figure 6).

Parkinson's disease (update) Full health economics report
NICE Internal Clinical Guidelines, 2016 24
Figure 6: Original cost–utility model: baseline time-to-death function (PDSURG dataset [all HY≥3 participants undergoing DBS surgery, regardless of initial
allocation]) with fitted Weibull function
This curve was used to represent the probability of death in the DBS arm of the model, to which hazard ratios estimating the relative effect associated with differences in clinical parameters for BMT v. DBS and LCIG v. DBS were applied.
The model was also configured to use an alternative method to estimate baseline survival probability. This was based on standard UK lifetables, to which a hazard ratio estimating the increased mortality risk associated with advanced Parkinson's disease was applied. This
hazard ratio could either be drawn from the literature (the GDG's favoured estimate was 3.34 [Kaltenboeck et al. 2012]) or calibrated within the model so that median (or mean) survival of the simulated DBS cohort matched that observed in the PDSURG HY≥3 population. In
practice, using the published HR resulted in much longer survival (median = 17.2 LYs) than observed in PDSURG and, using the calibration approach, it was necessary to apply a
hazard ratio of 9.13 to match the median survival of the PDSURG cohort. Even when the median (or mean) survival was matched, the resulting survival function produced a poor fit to the observed data. For these reasons, the direct fit to the PDSURG data was preferred in all
base-case analyses.
Proportional hazards
Hazard ratios estimating the relative effect associated with differences in clinical parameters for DBS v. BMT and LCIG v. BMT were estimated using the proportional hazards models
shown in Table 12.
Parkinson's disease (update) Full health economics report
NICE Internal Clinical Guidelines, 2016 25
Table 12: Cox proportional hazards models: time to full-time care
PINE PDSURG
LOCF Multiply imputed LOCF Multiply imputed
HR (95%CI) HR (95%CI) HR (95%CI) HR (95%CI)
Univariable
UPDRS_III 1.057 (1.041, 1.073) 1.012 (0.990, 1.035) 1.027 (1.010, 1.045) 1.027 (1.005, 1.048)
Multivariable (inc. EQ-5D)
UPDRS_III 1.054 (1.034, 1.074) 1.008 (0.974, 1.042) 1.006 (0.985, 1.028) 1.013 (0.987, 1.041)
UPDRS_II 0.989 (0.950, 1.031) 1.013 (0.942, 1.089) 1.031 (0.990, 1.072) 1.016 (0.969, 1.065)
OffTime 1.019 (0.834, 1.245) 1.005 (0.761, 1.327) 1.051 (0.981, 1.125) 1.019 (0.934, 1.111)
PDQ39 0.993 (0.974, 1.012) 0.994 (0.973, 1.015) 1.009 (0.991, 1.027) 1.003 (0.982, 1.024)
EQ5D 0.502 (0.199, 1.266) 0.781 (0.264, 2.306) 0.623 (0.254, 1.530) 0.499 (0.169, 1.474)
Multivariable (exc. EQ-5D)
UPDRS_III 1.058 (1.039, 1.078) 1.009 (0.975, 1.043) 1.006 (0.985, 1.028) 1.015 (0.989, 1.042)
UPDRS_II 0.993 (0.953, 1.034) 1.015 (0.946, 1.089) 1.036 (0.997, 1.077) 1.021 (0.974, 1.070)
OffTime 1.020 (0.836, 1.244) 1.007 (0.766, 1.324) 1.053 (0.984, 1.128) 1.020 (0.936, 1.112)
PDQ39 1.000 (0.984, 1.016) 0.995 (0.974, 1.017) 1.013 (0.997, 1.029) 1.009 (0.990, 1.028)
Most models suggested that, amongst variables that might be influenced by the treatments under assessment, UPDRSIII is the primary determinant of time to death. When the PINE
dataset was used, some variables – UPDRSII and/or PDQ-39 – were associated with point-estimate coefficients that suggested a counterintuitive effect, with more significant impairment associated with reduced hazard. However, confidence intervals were wide, in
these instances – at a 95% confidence level, data were comfortably consistent with an effect in the expected direction in all cases.
F.3.1.11 Resource use
Intervention resource use was taken from a mixture of GDG experience, published CUAs and assumption.
Deep brain stimulation
Implantation – perioperative costs
For the initial implantation, it was assumed every operation required the resources shown in Table 13. For each scheduled IPG replacement (see section XXX for replacement frequency), only the IPG and controller were required.
The base case assumed everyone used a replaceable, rather than rechargeable system. The committee acknowledged some UK centres may currently use rechargeable systems, but felt this would be less than 10% of DBS surgery. Normal UK NHS practice was still predominantly to use replaceable devices. In a scenario analysis investigating the greatest
value that a rechargeable system could provide, we assumed 1 patient charging system was required and no replacement was ever needed.
The NHS has 2 primary suppliers of replaceable systems – Medtronic and St Jude Medical.
The committee was aware that, alongside its rechargeable IPG (see below), Boston Scientific also manufacture a replaceable device. However, it advised that it is not commonly used in NHS practice; moreover, unlike the other devices featured here, it does not appear in
the NHS Supply Chain Catalogue, which would make it difficult to cost in a comparable way. For these reasons, the analysis assumed that all replaceable devices were those manufactured by either Medtronic or St Jude Medical. The committee assumed Medtronic
had 8/9 of the market share, but noted the overall system costs for both suppliers were very similar. One supplier (Medtronic) produced 2 types of electrodes (with and without lead-

Parkinson's disease (update) Full health economics report
NICE Internal Clinical Guidelines, 2016 26
anchoring technology) – in the absence of any evidence to the contrary, the base case assumed equal usage.
Table 13: Deep brain stimulation implantable resource use
Resoure Initial implantation IPG replacement
Implantable pulse generator 1 1
Controller 1 1
Electrodes 2 0
Extensions 2 0
In addition to the implantable system, DBS surgery requires substantial hospital resource
use. This was split into preoperative, operative and postoperative resource use. All DBS surgery hospital resource use was modelled to occur in the first cycle. It is noted that this will potentially model the postoperative follow up costs earlier (in the first quarter) than they will
occur (over the first 4 quarters).
Preoperative DBS surgery hospital resource consisted of a series of outpatient appointments and an overnight stay. The resource used modelled was assumed to represent an average person in an average UK neurosurgery centre, acknowledging different centres may have
different schedules (including not all centres having access to neuropsychology).
Table 14: Deep brain stimulation surgery pre-operative hospital resource use
Resource Use
Neurology outpatient appointments 2
Neurosurgeon outpatient appointment 1
Neurosurgery multi-disciplinary team outpatient appointment 1
Psychology outpatient appointments 2
Neuropsychology outpatient appointment 1
Preoperative assessment (outpatient appointment) 1
Overnight levodopa challenge (inpatient stay) 2 nights
DBS operative resource use were based on elective HRG AA53 “Major Intracranial
Procedures, 19 years and over”. This HRG was selected following mapping from OPCS code A09 “neurostimulation of brain” and similar to that used in the existing UK-based CUA (Eggington et al. 2014). This HRG has a mean length of stay of 4.4 days, which the
committee felt looked reasonable. Their experience was that DBS operations were planned to have a 3-day length of stay – very few would be shorter, but some would be longer.
Resource use included an overnight stay (2 inpatient days) for DBS programming. Some centres may include programming as part of the initial episode, but either way will incur an
increased length of stay.
There was an option to use the operative costs from the PDSURG CUA (McIntosh et al. 2016) as this would have closely matched the effectiveness data modelled. However,
McIntosh et al. (2016) reports initial surgical episodes that took place in 2000–2007 and, as a result, it includes a number of resource use estimates that the GDG felt were not representative of current practice. Suggested changes included:
Balance between operations undertaken using local and general anaesthesia and associated staff time
Intra-operative testing, recording and scanning (including now standard use of planning
stations in all operations)
Use of robotic surgical equipment not standard NHS practice

Parkinson's disease (update) Full health economics report
NICE Internal Clinical Guidelines, 2016 27
Updated implantable equipment used (eg Activa rather than Kinetra IPGs, better quality
leads mean fewer subsequent surgeries)
Shorter LoS (PDSURG had extended LoS (9.7 days) for all the tests to be run, LoS
funded from within RCT)
The authors included a mean theatre time of 4 hours 20 minutes, with no indication of staff
numbers or time required. A stereotactic frame, planning station and controller were used in only 99%, 62% and 52% (not 100%) of operations respectively, whereas accessory kits were felt to be rarely used.
Also, McIntosh et al. (2016) annuitised capital costs over their lifespan, including the IPG, stereotactic frame, robot and planning station. Whilst some authorities recommend this practice when conducting CUAs alongside RCTs, it is less clear how such resource use should be handled in modelled CUAs. Capital equipment such as stereotactic frames and
planning stations are not solely used for DBS surgery in people with Parkinson’s disease. So if resource use for this model were to be calculated using capital costs, some estimation of the proportion of their total usage for DBS operations over their lifetime would be required.
In addition to the equipment listed in Table 13, IPG replacement surgery was assumed to require 1 preoperative appointment (Neurosurgery multi-disciplinary team outpatient appointment) and a day-case procedure (HRG DZ71Z “minor thoracic procedure”, similar to
that used in Eggington et al. 2014). No adverse events or subsequent surgeries were modelled for IPG replacement.
On GDG advice, postoperative DBS-related hospital follow up appointments in the first year were assumed to be greater than those included in McIntosh et al. (2016). Neurosurgical
multidisciplinary team follow-up appointments were assumed to occur at 2, 4, 6 and 8 weeks then 3, 6, 9 and 12 months following initial surgery. One neuropsychology follow-up appointment within the first 2 months was also included.
Resources used to deal with adverse events and subsequent surgeries associated with the initial DBS surgery were costed using the cost per person calculated in the PDSURG CUA (McIntosh et al. 2016). Notwithstanding the issues listed with this paper, it was felt these data
provided an adequate resource use and cost estimate that was closely allied to the clinical evidence modelled. To use other resource use and cost sources (such as those used in Eggington et al. 2014) would have required further assumptions or evidence from other
studies about event rates, event types and resources required to deal with the range of recorded events.
Like with postoperative follow-up appointments, all adverse events and subsequent surgeries
were modelled in the first cycle. The committee were content to assume all adverse events and subsequent surgeries occurred within the first year, so no further data beyond 1 year (the length of the PDSURG randomised trial data) were required.
Battery replacement
Owing to battery degradation, the implantable pulse generators (IPGs) that are implanted during DBS surgery require periodic replacement. Because the IPG represents the bulk of
the cost associated with DBS, it is important to account for these replacements accurately. Device-level data were available from PDSURG for time to failure of each IPG. These were well modelled with a Weibull distribution, with observations censored at loss to follow-up or
death of the patient (Table 15; Figure 6).
Table 15: Weibull regression for time to battery replacement
Estimate (95%CI)
ln(shape) 1.01 (0.89, 1.13)
ln(scale) 7.76 (7.70, 7.81)

Parkinson's disease (update) Full health economics report
NICE Internal Clinical Guidelines, 2016 28
Figure 7: Original cost–utility model: time to replacement of IPG
This could be used easily to model time to first IPG failure; however, accounting for the
probability of multiple failures over time within the model is not straightforward, as it implies the convolution of multiple Weibull distributions, which has no practical analytical solution. To solve this problem, 2 approaches were explored. Firstly, the model was configured to
perform a simulation in which, for each of 100,000 simulated patients, random variates for multiple consecutive instances of the distribution were generated, and the resulting probability of replacement for each cycle calculated and applied in the cost calculations.
Secondly, a much simpler approach was tried: the mean of the distribution was calculated (5.7 years) and costs of replacement were applied periodically at this frequency for everyone in the simulated cohort who remained alive, with no costs applied in the intervening cycles.
These 2 approaches yielded extremely similar results. Therefore, the second approach was preferred, as it was much less computationally intensive.
Concomitant medication (other than apomorphine)
Concomitant medication resource use was taken from the PDSURG CUA end of year 1 data (McIntosh et al. 2016). Medication use was split into 3 categories – anti-parkinsonian drugs, apomorphine and other drugs. Anti-parkinsonian and other drugs were used as reported for
both the DBS and BMT arms (see Table 4) and were not reported to be significantly different. These costs were assumed to apply in future cycles without change. The committee felt that
over time, some people would increase medication use and some – particularly towards the end of life – would reduce, so keeping the costs the same in future years was felt to be a reasonable cohort average.
Table 16: PDSURG CUA reported medication resource use (per person)
Category DBS arm BMT arm
Year 1
Anti-parkinsonian drugs £3,515.72 £3,789.01
Other drugs £85.80 £101.69
Total £3,601.52 £3,890.70
Subsequent years £3746.11 a Costs inflated to 2014 prices (PSSRU 2015)

Parkinson's disease (update) Full health economics report
NICE Internal Clinical Guidelines, 2016 29
Apomorphine
The use of continuous subcutaneous apomorphine infusion was part of best medical treatment in PDSURG, and the RCT suggested that DBS may reduce the need for
apomorphine, thereby reducing significant costs. To account for this in the model, data were extracted from the PDSURG dataset for, with DBS and BMT, the proportion of participants using apomorphine at baseline who discontinued it during year 1 and, similarly, the
proportion not using apomorphine at baseline who commenced using it during the same period. For people who had been randomised to DBS, it was also possible to calculate subsequent rates of discontinuing or commencing apomorphine for years 2–3, and >3. In the
base case, it was assumed that the transition matrix implied by these probabilities would continue to apply beyond the observed periods (meaning a simple Markov model could be calculated to estimate the proportion of people requiring apomorphine at any one time). See
Table 17.
Table 17: Probabilities of starting or discontinuing apomorphine, derived from
PDSURG patient-level data
DBS BMT
Starting Discontinuing Starting Discontinuing
Year 1 0.011 0.769 0.253 0.208
Years 2–3 0.023 0.250 0.253a 0.208a
Years 4+ 0.023a 0.333 0.253a 0.208a a assumed same as previous period, in absence of empirical data
When starting on apomorphine infusion, 20% of people were assumed to require an overnight hospital stay (2 days). All people starting apomorphine infusion were modelled to receive domperidone tablets for the first month, starting with 2 weeks on 20mg thrice daily,
then dropping to 2 weeks on 10mg thrice daily and then discontinuing (as recommended by the Association of British Neurologists).
Ongoing, people were assumed to require 1 pump and 1 each of an infusion line, connector
and syringe per day. The committee advised there was variation in practice as to whether basic or soft infusion lines were used; a base case assumption of 80% of people using basic infusion lines was modelled.
An average daily apomorphine infusion dose of 67.4mg was calculated using the PDSURG IPD. In the absence of randomised evidence to the contrary, the same average dose was assumed for both DBS and BMT across all time points. Beyond the initial serious adverse event and subsequent surgery costs from the BMT arm of PDSURG, no further adverse
events costs for apomorphine were modelled. No apomorphine infusion use was modelled in the LCIG arm.
No analogous data were available for LCIG; however the GDG advised that it is unlikely that
people would be given LCIG and apomorphine infusions at the same time. Therefore, it was assumed that LCIG has a 100% apomorphine-sparing effect.
Other healthcare
McIntosh et al. (2016) reported “other annual healthcare use”, covering non-intervention related healthcare use. Helpfully, personal social service resource use was also reported. Other healthcare use was similar for most categories, but significant differences were
reported for Parkinson’s disease nurse, speech and language therapist and hospital outpatient visits (all higher for people receiving DBS).

Parkinson's disease (update) Full health economics report
NICE Internal Clinical Guidelines, 2016 30
LCIG
LCIG resource use covered the naso-testing phase, PEG tube insertion (applied in the first cycle only), ongoing LCIG drug costs, adverse events, concomitant medications and other
health and care use (applied in all cycles).
It was not obvious which HRG was appropriate for the hospital resource use for the naso-testing period. On the basis of clinical advice, description and length of stay, YF01A “elective inpatient radiological insertion of gastrostomy tube, 19 years and over” was selected.
Recognising that naso-testing is not carried out in all cases, it was assumed naso-testing would be undertaken in 25% of cases. The LCIG drugs used during the naso-testing period were assumed to be funded by the company.
PEG tube insertion resource use was represented by HRG FZ93A “elective inpatient Endoscopic Insertion of Gastrostomy Tube, 19 years and over”. Given this HRG had a relatively short average length of stay (48% done as day cases, average length of inpatient
stay 1.24 days) an additional 5 days length of stay was assumed. This covered the fitting, dosing, monitoring and adjustment period.
Ongoing LCIG drug resource use was based on dosage information taken from a large open label multi-country 54 week study (Fernandez et al. 2015). This study gave an average dose
of 1572mg per day but did not given any information as to dose range or variability. LCIG cassettes contain 2000mg of drug must be discarded at end of each day, irrespective of any unused drug still within the cassette. It has been assumed in previous CUAs (Lowin et al.
2011) that 10% of people require 2 cassettes per day, but no evidence was given to support this assumption. A commentary paper (Lew et al. 2015) on the open label study gave the same mean dose and reported a standard deviation of ±566mg. Similar daily dose and
standard deviation at 12 months was reported in a large registry based study (1412mg ±650mg, Antonini et .al. 2015).
The included LCIG RCT (Olanow et al. 2014) gave a mean dose at 12 weeks of 1181mg ±480mg but dose adjustment was only allowed in the titration period
Using the mean and SD from Fernandez et al. and Lew et al., and assuming the data had a log-normal distribution, we calculated that 19.4% of people would require 2 cassettes per day. We tested other plausible distributions (e.g. gamma) and found similar percentages
requiring the additional cassette. Performing the same lognormal estimation using mean and SD dose information from Antonini et al. (2015) predicted 15.5% of people would require 2 cassettes per day.
It was assumed this mean (and standard deviation) LCIG dose would continue in future years for people who continued to use LCIG.
LCIG pump equipment and any consumables were assumed to be funded by the company, as were any additional visits required to set up and maintain the pump. Conservatively,
people receiving LCIG were not assumed to require any additional routine follow up appointments.
Adverse events associated with LCIG infusion were categorised according to their reports in
the literature (see F.3.1.5). Assumed resource use and unit cost for each event are shown in Table 18.

Parkinson's disease (update) Full health economics report
NICE Internal Clinical Guidelines, 2016 31
Table 18: LCIG adverse event resource use and unit costs
Adverse event type Resource use Unit cost
Pump issues 1 specialist nurse appointment Assume funded by company
PEG issues 1 gastroenterology non consultant led outpatient appointment £97.40
Stoma issues 1 gastroenterology non consultant led outpatient appointment £97.40
J tube issues 1 elective day case FZ93A Endoscopic Insertion of Gastrostomy Tube, 19 years and over
£561.01
Other issues 1 gastroenterology non consultant led outpatient appointment £97.40
PEG removal due to treatment withdrawal
1 gastroenterology non consultant led outpatient appointment £97.40
LCIG concomitant medications were assumed not to include apomorphine use. Fernandez et al. (2015) reported the percentages of people using different medications at the end of year 1 of LCIG treatment. The committee felt people would require increasing levels of concomitant
medication (overnight oral levodopa and other Parkinson’s disease medications) over the period of LCIG treatment effectiveness; year 1 rates were tapered over the specified treatment period to the committee specified end points and then maintained (see Table 19).
Given this increasing use, the dose of overnight oral levodopa was held constant throughout the model and taken to be 175mg (Fernandez et al. 2015). Levels of other Parkinson’s disease medications were not fully reported in Fernandez et al. (2015), therefore the similar category from PDSURG (McIntosh et al. 2016) was used. The committee felt people on LCIG
would use substantially fewer other Parkinson’s disease medications than those in the BMT arm of PDSURG, so assumed resource use was 1/3 of BMT.
Table 19: LCIG concomitant medication usage
Concomitant medication category End of year 1 End of treatment period
LCIG monotherapy 27.8% 10.0%
LCIG with overnight oral levodopa 48.8% 50.0%
LCIG with other Parkinson’s disease medications 23.5% 40.0%
Other healthcare use was assumed to be equal to that in the BMT arm of PDSURG and assumed across all arms to increase at 10% per year.
When people discontinued LCIG treatment (whether at home or in care), they were assumed to immediately revert to BMT arm levels of concomitant medication (excluding apomorphine
use) and other healthcare use. Whilst an immediate reversion may not favour LCIG, excluding any possibility of future apomorphine use does favour LCIG.
Best medical treatment resource use was limited to concomitant medication, apomorphine
and other health care use. All categories were taken from McIntosh et al. (2016) and are detailed in the DBS section (see above). The PDSURG CUA most clearly represented best medical treatment in the UK.
F.3.1.12 Unit costs
The cost of each of the resource use elements within the model are obtained from a number of standard sources. Where these sources do not provide the unit cost needed to
parameterise the cost of a resource use variable within the model then a search is conducted for unit costs generated from costing studies or within trials. Where the parameter is a key component of the model, a tailored systematic review can be conducted to locate the most
appropriate unit cost.

Parkinson's disease (update) Full health economics report
NICE Internal Clinical Guidelines, 2016 32
The Prescription Pricing Authority drug tariff database is used for prices of drugs. The database is updated monthly therefore a single month’s tariff is used for all analysis to maintain consistency.
NHS Reference costs are used as the source of unit costs for inpatient and outpatient procedures as well as hospital stay information.
The Personal Social Services Research Unit (PSSRU) generates the Unit Costs for Health and Social Care report which includes costs for both community and hospital-based
healthcare staff.
Where necessary, unit costs were adjusted to 2014 prices (PSSRU, 2015).
DBS costs
The unit costs of DBS implantations were taken from the NHS supply catalogue, extracted in July 2015. It is noted that all other model prices related to 2014, but there is no evidence that the prices taken from the NHS supply chain catalogue altered between 2014 and 2015.
PDSURG unit costs were based on Medtronic alone, but reflected a range of unit costs across the length of the trial.
Table 20: Deep brain stimulation implants unit costs
Resource Medtronic St Jude Medical Boston Scientific
Implantable pulse generator £10,093.15 £10,157.14 £16,686.00
Controller £330.61 £606.12 £1,145.77
Electrodes (without lead anchoring device) £1,104.00 £1,377.55 £2,472.00
Electrodes (with lead anchoring device) £1,428.00 Not applicable
Extensions £966.00 £728.57 £882.86
Patient charging system Not applicable Not applicable £1,914.56
Total initial implant cost £14,887.76 £14,975.50 £26,456.05
Total IPG replacement costs £10,423.76 £10,763.26 Not applicable
Unit costs for hospital resource use were taken from NHS reference costs. For preoperative and postoperative outpatient appointments, no unit cost was available for neuropsychology
outpatient appointments; these were assumed to have the same unit cost as clinical psychology outpatient appointments. The preoperative assessment was costed using the neurosurgery non-consultant led multidisciplinary team outpatient appointment unit cost. The
unit cost for the preoperative overnight levodopa challenge was costed using the excess bed day costs for HRG AA25 “Cerebral Degenerations or Miscellaneous Disorders of Nervous System” weighted according to recorded activity.
Combining resource use (Table 14) and unit costs gave a total DBS surgery preoperative hospital cost of £2,027.11.
Table 21: Deep brain stimulation surgery – preoperative hospital unit costs
Resource Unit cost
Neurology outpatient appointment (consultant led) £159.42
Neurosurgery outpatient appointment (consultant led) £192.19
Neurosurgery multi-disciplinary team outpatient appointment (non-consultant led) £173.09
Psychology outpatient appointment (consultant led) £209.99
Overnight levodopa challenge (overnight, weighted cost per day) £269.96
DBS operative costs were an average of unit costs for HRG AA53 “Major Intracranial Procedures, 19 years and over” weighted according to recorded activity, giving a HRG unit

Parkinson's disease (update) Full health economics report
NICE Internal Clinical Guidelines, 2016 33
cost of £6,986.82. This HRG was assumed to include appropriate levels of capital, equipment and staffing costs. The overnight stay for DBS programming was costed using the same weighted bed day cost (£269.96 per day) as for the preoperative overnight levodopa
challenge (see Table 21). The overall DBS operative cost was £7,526.73.
Postoperative follow-up outpatient appointments cost £1,594.72 in the first year. The unit costs of serious adverse event costs and subsequent surgeries are shown in Table 22.
Table 22: Deep brain stimulation surgery serious adverse event and subsequent surgery costs (per person, 2014 prices)
Arm Deep brain stimulation BMT including apomorphine
Serious adverse events £2,039.09 £251.05
Subsequent surgeries £773.27 £0.00 a Costs are per person, rather than per event; costs inflated to 2014 prices using PSSRU indices
Apomorphine infusion unit costs were the same in both the DBS and BMT arms and are shown in Table 23. The initial overnight hospital stay for 20% of candidates was costed using the unit cost as for the DBS preoperative levodopa challenge (£270 per day). Apomorphine
infusion start-up costs were £115.00; ongoing costs were £2,296.38 per cycle, or around £25 per day.
Table 23: Apomorphine unit costs
Resource Unit cost Source
Overnight hospital stay (cost per
day)
£269.96 NHS reference costs
Domperidone (30 tablet pack, 10mg tablets)
£1.67 NHS Drugs tariff
Pump Assume funded by company Not applicable
Connectors Assume funded by company Not applicable
Syringes Assume funded by company Not applicable
Infusion line – basic £4.63 NHS Drugs tariff
Infusion line – soft £8.60 NHS Drugs tariff
Apomorphine pre-filled syringes (50mg/10ml, pack of 5)
£73.11 NHS Drugs tariff
Other annual healthcare use costs were taken from the reported totals in McIntosh et al.
(2016) (see Table 24). These totals were calculated excluding any personal social service costs, as it was not clear which costs were incurred by the NHS and by the people themselves. Also only 1 person was reported to enter full-time care during the RCT and
these costs were excluded from those modelled here, allowing care costs to be considered separately (see below).
Table 24: PDSURG CUA reported other annual healthcare use (per person)
Category DBS arm BMT arm
Year 1 £2,886.51 £2,242.47
Subsequent years £2,242.47×(1+year×0.1) a Costs inflated to 2014 prices (PSSRU 2015)
The committee felt other annual health care use would increase over time in all arms and chose to assume a 10% annual cost increase in all arms. An increase over time is supported
by previous UK resource use research that found NHS costs increased with increasing disease severity (Findley et al. 2011).
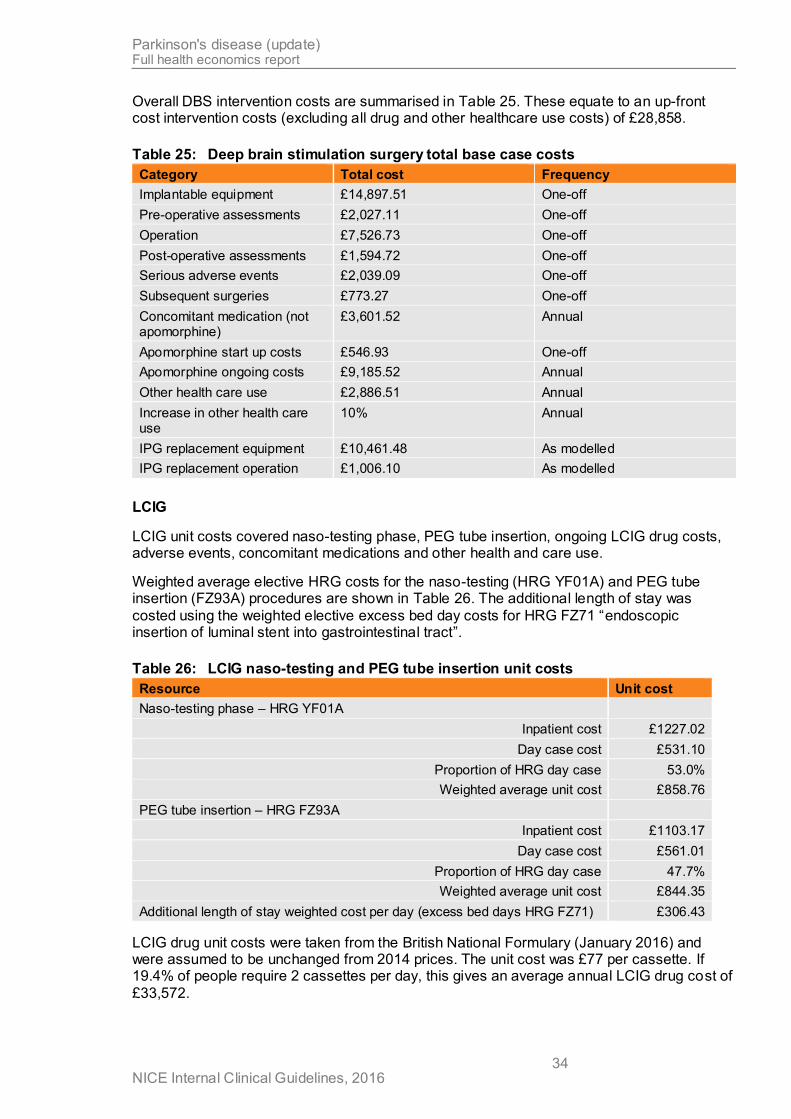
Parkinson's disease (update) Full health economics report
NICE Internal Clinical Guidelines, 2016 34
Overall DBS intervention costs are summarised in Table 25. These equate to an up-front cost intervention costs (excluding all drug and other healthcare use costs) of £28,858.
Table 25: Deep brain stimulation surgery total base case costs
Category Total cost Frequency
Implantable equipment £14,897.51 One-off
Pre-operative assessments £2,027.11 One-off
Operation £7,526.73 One-off
Post-operative assessments £1,594.72 One-off
Serious adverse events £2,039.09 One-off
Subsequent surgeries £773.27 One-off
Concomitant medication (not apomorphine)
£3,601.52 Annual
Apomorphine start up costs £546.93 One-off
Apomorphine ongoing costs £9,185.52 Annual
Other health care use £2,886.51 Annual
Increase in other health care use
10% Annual
IPG replacement equipment £10,461.48 As modelled
IPG replacement operation £1,006.10 As modelled
LCIG
LCIG unit costs covered naso-testing phase, PEG tube insertion, ongoing LCIG drug costs, adverse events, concomitant medications and other health and care use.
Weighted average elective HRG costs for the naso-testing (HRG YF01A) and PEG tube insertion (FZ93A) procedures are shown in Table 26. The additional length of stay was
costed using the weighted elective excess bed day costs for HRG FZ71 “endoscopic insertion of luminal stent into gastrointestinal tract”.
Table 26: LCIG naso-testing and PEG tube insertion unit costs
Resource Unit cost
Naso-testing phase – HRG YF01A
Inpatient cost £1227.02
Day case cost £531.10
Proportion of HRG day case 53.0%
Weighted average unit cost £858.76
PEG tube insertion – HRG FZ93A
Inpatient cost £1103.17
Day case cost £561.01
Proportion of HRG day case 47.7%
Weighted average unit cost £844.35
Additional length of stay weighted cost per day (excess bed days HRG FZ71) £306.43
LCIG drug unit costs were taken from the British National Formulary (January 2016) and were assumed to be unchanged from 2014 prices. The unit cost was £77 per cassette. If 19.4% of people require 2 cassettes per day, this gives an average annual LCIG drug cost of
£33,572.

Parkinson's disease (update) Full health economics report
NICE Internal Clinical Guidelines, 2016 35
The cost of oral levodopa was calculated using a weighted average of prescribed formulations weighted according to empirical prescription data (NHSBA Prescription Cost Analysis Feb 2016) and found to be 0.13 pence per milligram, or using an average overnight
dose of 175mg was 24 pence per day. Taking 1/3 of the PDSURG BMT arm, other Parkinson’s disease medications cost gave a daily cost for this category of £3.55.
Applying the percentages in each category (see Table 19) gave somewhat higher daily
concomitant medication costs at year 1 (154 pence per day) than reported in other CUAs (30 pence per day in Lowin et al. 2011; 75 pence per day in Walter and Odin 2015). However, we also used different costs per day in the BMT arm (£6.14 per day) than these papers
(£5.60 per day in Lowin et al. 2011; £9.74 per day in Walter and Odin 2015). It is not clear whether the existing studies include the cost of apomorphine in their BMT arms.
Adverse event unit costs were based on NHS reference costs and are shown in Table 18.
BMT
Ongoing best medical treatment unit costs were limited to concomitant medication, apomorphine and other healthcare use. All categories were taken from McIntosh et al. (2016) and are detailed in the DBS section (see above). In the first cycle, potential serious adverse
event costs (£251 per person) and subsequent surgery costs (£0 per person) from the BMT arm of the PDSURG ITT analyses were included to represent potential adverse events
associated with people starting apomorphine infusions. It is noted that people could start apomorphine in any model cycle, but the majority of people started in the first cycle.
F.3.1.13 State costs
The home and dead states incurred no further costs beyond those detailed for each intervention. Care state costs for various type of care home were taken from Curtis et al. (2016) (see Table 27). Using reported care funding categories (Laing Busson 2013), the
proportion of people whose care was fully or partially paid for by the NHS or social services was calculated to be 57% (see Table 28). The committee saw no reason for the funding split of people Parkinson’s disease to be different to the general population in care.
Overall, the cost per day for the care state was £66, which is similar to that in the NICE Falls guideline (CG161), using older splits (Netten 1998).
For the base case, it was assumed that all people with advanced Parkinson’s disease who had transitioned a care home would require nursing home care. This was varied in sensitivity
analyses.
Table 27: Care state unit costs
Category Unit cost per week
Private nursing home £821.00
Private residential home £595.00
Local authority residential home £1140.40
(a) Unit costs per week exclude personal living expenses
Table 28: Care state funding weightings
Category Weighting
Self funded 0.434
Part self, part NHS/PSS funded 0.139
PSS funded 0.355
NHS continuing care funded 0.072

Parkinson's disease (update) Full health economics report
NICE Internal Clinical Guidelines, 2016 36
F.3.1.14 Quality of life
General
Baseline quality of life was taken as an average across both arms of the PDSURG IPD dataset for people with Parkinson’s disease and HY≥3. This gave a baseline EQ-5D of 0.41. It would have been ideal to use a weighted average of these data and the Olanow et al. (2014) LCIG RCT, but only change from baseline and not baseline data were available in
Olanow et al. (2014). Attempts were made to contact the authors, but no response was received.
The effect of interventions on HRQoL over the first year of treatment was modelled directly using reported EQ-5D data from the systematic review of clinical effectiveness data (see F.3.1.5).
Beyond the first year, alternative scenarios were developed to extrapolate EQ-5D progression into the future.
The most straightforward approach is that adopted for other clinical variables as detailed in 0: a baseline linear decline trajectory was adopted (from either PINE or PDSURG data), and observed treatment benefit at 1 year was modelled to attenuate over time, so that it
converged with BMT over an assumed average period of benefit (in the base case, 7 years).
One characteristic of this approach was that quality of life progression was independent of other treatment effects; this had the consequence that estimated EQ-5D could quite rapidly become negative, introducing a paradoxical disincentive for treatments that were associated
with projected survival gains. To minimise this problem, an alternative approach to estimating health-related quality of life was adopted in the base case. Using patient-level data, models to estimate EQ-5D as a function of the other clinical variables were developed. These were
linear mixed-effects models, with a random effect for each participant and fixed effects for UPDRS II, UPDRS III, off-time, PDQ-39, time and (where available) residential status
(dummy variable for being in full-time care) (package nlme v3.1-128 in R). It was possible to
estimate these in both the PINE and PDSURG datasets. As with the time-to-event analyses detailed above, LOCF and multiply imputed datasets were available. Results are shown in
Table 29. When multiply imputed data were used to estimate models, we followed the recommendations of von Hippel (2007), and included the dependent variable in the imputation model, but then excluded any cases with imputed values for the dependent
variable from the prediction model.
Table 29: Patient’s health-related quality of life (EQ-5D) as a function of clinical
variables
PINE PDSURG
LOCF Multiply imputed LOCF Multiply imputed
β (95%CI) β (95%CI) β (95%CI) β (95%CI)
(Intercept) 0.972 (0.917, 1.026) 0.890 (0.834, 0.947) 0.937 (0.897, 0.977) 0.942 (0.901, 0.982)
UPDRS_III −0.004 (−0.006, −0.002) −0.003 (−0.005, −0.001) 0.001 (−0.001, 0.002) 0.000 (−0.002, 0.001)
UPDRS_II −0.003 (−0.006, 0.001) −0.005 (−0.008, −0.001) −0.007 (−0.009, −0.004) −0.006 (−0.009, −0.002)
OffTime 0.002 (−0.013, 0.017) −0.002 (−0.022, 0.018) −0.009 (−0.014, −0.005) −0.006 (−0.011, −0.002)
PDQ39 −0.009 (−0.011, −0.008) −0.007 (−0.008, −0.005) −0.009 (−0.010, −0.008) −0.009 (−0.010, −0.008)
InCare −0.122 (−0.188, −0.056) −0.111 (−0.198, −0.024)
Years −0.011 (−0.018, −0.005) −0.008 (−0.017, 0.001) 0.000 (−0.005, 0.004) 0.001 (−0.006, 0.007)
The use of model-projected EQ-5D made it inappropriate to use EQ-5D as a predictor of
events in time-to-event analyses; therefore, time-to-event models that omitted EQ-5D were

Parkinson's disease (update) Full health economics report
NICE Internal Clinical Guidelines, 2016 37
used when the model was configured – as in the base case – to treat EQ-5D as a function of the other clinical variables (see F.3.1.9 and F.3.1.10).
When this approach was adopted, the resulting HRQoL trajectory (Figure 8) fell, as would be
expected, between the diminishing and constant profiles adopted for predictor variables (see Figure 4). The GDG endorsed this as a realistic simulation of their experience: while committee members would expect factors beyond the influence of the interventions to
attenuate short-term gains over the longer term, they would not expect the HRQoL benefit of DBS, in particular, to diminish to zero.
For these reasons, EQ-5D was modelled as a function of other variables in the base case.
0
0.1
0.2
0.3
0.4
0.5
0.6
0 1 2 3 4 5 6 7 8 9
10
EQ
-5D
Years
DBS
LCIG
BMT
Figure 8: Extrapolated EQ-5D benefit over time when modelled as a function of other
clinical variables rather than independently (cf. Figure 4)
Event-related decrements
Very little attention has been paid in the existing economic literature to the potential quality of life impacts of receiving the interventions modelled here. The economic literature focusses on quality of life months or years after the intervention, whereas it seemed reasonable to
assume that DBS surgery or PEG tube insertion would incur short term utility decrements. Existing included CUAs, the TUFTs database for topic related CUAs and other NICE guidance revealed no existing evidence on the disutilities associated with brain surgery or
PEG tube placement. A review of quality of life papers on Parkinson’s disease (Dowding et al. 2006) also did not provide any data.
Only 1 existing CUA has included disutility associated with DBS surgery (Dams et al. 2013). The authors assumed 80% disutility in the first month and 50% in the second and third
months.
The committee were asked to estimate the magnitude and duration of utility losses associated with various stages of receiving the interventions modelled (see Table 30). The
committee included a patient representative who had received DBS surgery.

Parkinson's disease (update) Full health economics report
NICE Internal Clinical Guidelines, 2016 38
DBS surgery utility decrements covered the first month post-surgery, at which point the committee felt utility would have returned to previous levels or improved. They did not feel DBS surgery was painful, or the disutility of long duration. When severity and duration of
disutility are combined, a QALY loss of 0.013 is estimated for the cycle in which DBS surgery takes place; for LCIG insertion, the analogous figure is 0.0092.
The committee noted serious adverse events could have variable magni tude and duration of
disutility, but felt the figures chosen provided a reasonable estimate. LCIG adverse events incurred a large disutility, as the committee felt the device malfunction would lead to substantial loss of symptom control in the short term.
Table 30: Utility decrements due to receiving interventions
Intervention Category Proportion utility loss
Duration (days)
DBS Pre-operative testing and surgical implant 0.50 5
Post-operative recuperation at home 0.75 7
0.85 18
Subsequent surgical events (for those experiencing)
0.70 7
Serious adverse events (for those experiencing) 0.50 7
IPG replacement surgery 0.80 3
LCIG Naso-testing phase (for those experiencing) 0.50 3
PEG tube placement (for those experiencing) 0.50 7
0.75 7
Loss due to adverse events (for those experiencing)
Pump issues 0.25 2
PEG issues 0.25 2
Stoma issues 0.25 2
J tube issues 0.25 3
Other issues 0.25 2
PEG removal due to withdrawal 0.25 2
These multipliers were applied to total utility values as calculated at the relevant cycle of the model for people receiving the intervention in question.
Carer quality of life
As the PINE study collected some data on the quality of life of carers of people with Parkinson's disease, it was also possible to explore whether their EQ-5D could be predicted from the patient's characteristics. Models estimating this relationship were developed in the
same as way as for patients' quality of life (Table 31). It was noted that none of the clinical variables could be said, at the 95% confidence level, to have an effect on carer quality of life. Nevertheless, the model was configured so that it could optionally incorporate this estimate
in its calculations (noting that, as the model functions probabilistically, the lack of covariates meeting an arbitrary level of 'significance' need not undermine its outputs). For simplicity, when this effect was applied, it was assumed that each patient has an average of 1 affected
carer.

Parkinson's disease (update) Full health economics report
NICE Internal Clinical Guidelines, 2016 39
Table 31: Original cost–utility model: carer’s health-related quality of life (EQ-5D) as a
function of patient’s clinical variables
PINE PDSURG
LOCF Multiply imputed LOCF Multiply imputed
β (95%CI) β (95%CI) β (95%CI) β (95%CI)
(Intercept) 0.865 (0.791, 0.939) 0.843 (0.775, 0.912)
UPDRS_III 0.001 (−0.001, 0.002) 0.000 (−0.001, 0.002)
UPDRS_II −0.003 (−0.007, 0.000) −0.001 (−0.003, 0.002)
EQ5D 0.019 (−0.035, 0.072) 0.014 (−0.041, 0.069)
OffTime 0.003 (−0.009, 0.014) 0.000 (−0.013, 0.014)
PDQ39 −0.001 (−0.002, 0.000) −0.001 (−0.002, 0.000)
InCare 0.003 (−0.056, 0.062) 0.016 (−0.053, 0.084)
Years −0.010 (−0.016, −0.004) −0.008 (−0.014, −0.002)
State-related utility
The model using PINE data to estimate the relationship between clinical variables and quality of life estimated a decrement of a little over 0.1 for people in full-time care compared with
those living at home (see Table 29). These values were used in the model for all people in full-time care (regardless of approach to modelling underlying EQ-5D). We note that, in the previous NICE clinical guideline on falls (CG161), the committee agreed to assume a relative
utility multiplier of 0.8 for full-time care (which is closely comparable to an absolute decrement of 0.1 in people whose quality of life starts at 0.4 and can rise to a little over 0.5
following treatment). One small American study noted the limitations of using SF-36 in nursing home residents, but can be shown to produce a decrement similar to a multiplier of 0.8 (Andresen, 1999).
F.3.1.15 Probabilistic sensitivity analyses
We configured the models to perform probabilistic sensitivity analysis to quantify uncertainty in the true values of input parameters.
Probability distributions were estimated for all input variables with the exception of the direct (drug) costs, which were presumed fixed. Distribution parameters were sourced from the study in which the value was obtained, where possible, or were estimated based on the usual properties of data of that type.

Parkinson's disease (update) Full health economics report
NICE Internal Clinical Guidelines, 2016 40
F.4 Original cost–utility model – results
As discussed above and in 'Evidence to recommendations' in full guideline section 10.3.7, several combinations of assumptions underpinning the time-to-event and HRQoL models on
which the HE model relies could be made, as regards underlying dataset (PINE -v- PDSURG), method for handling missing data (LOCF -v- multiple imputation) and/or model selection (univariable -v- multivariable). However, there was no strong clinical or
methodological reason to prefer any one of the possible approaches. For this reason, it was appropriate to characterise our uncertainty about the choices that would lead to the 'truest'
model as structural uncertainty (see Bojke et al. 2009). Therefore, base-case results are the mean of 10,000 probabilistic iterations, including random selection of time-to-event models (PINE -v- PDSURG; univariable -v- multivariable; LOCF -v- MI) and EQ-5D model (PINE -v-
PDSURG; LOCF -v- MI).
F.4.1.1 Model outputs – disaggregated effects
Table 32 shows base-case health state occupancy and QALY outputs averaged across all scenarios.
Table 32: Base-case effects – modelled life expectancy and QALYs
LYs (undiscounted) QALYs (discounted)
Home Full-time
care Total LYs
Patient Carer Total
QALYs
BMT 7.789 1.626 9.414 2.325 - 2.325
DBS 8.889 1.488 10.377 3.065 -0.004 3.061
LCIG 7.648 1.733 9.381 2.529 0.013 2.542
Both DBS and LCIG are predicted to confer gains in quality-adjusted life expectation, when compared with BMT. DBS is associated with a little under three-quarters of a QALY gained, and LCIG slightly more than one-fifth of a QALY.
In the case of DBS, the gain is a function of both improved quality of life and longer duration of life. The model predicts that the average person receiving DBS is likely to gain around 1 year's life expectancy compared with BMT alone, and can expect to spend proportionally
less of their life in full-time care.
For LCIG, quality but not length of life is predicted to be increased. There is no benefit in time to care or life expectancy compared with BMT; this is because these transitions were found to be primarily influenced by UPDRS-III, an outcome for which LCIG showed no benefit in the
RCT (Olanow et al., 2014). However, QALY gains are evident compared with BMT, because people receiving LCIG have better quality of life while they are alive.
Carer quality of life makes a relatively negligible contribution to overall estimated effects.
F.4.1.2 Model outputs – disaggregated costs
Costs associated with the treatments and their consequences are summarised in Table 33. The lifetime costs of initial DBS surgery, AEs and IPG replacements amount to around
£40,000 for the average patient. Some of this money is offset by reductions in apomorphine and full-time care costs (around £16,000 and £3,500, respectively, less than BMT); however, the net estimate is that DBS costs a little under £25,000 more than BMT, in the typical case.
LCIG surgery costs much less than DBS, and substantial savings over BMT could be expected as the need for other medication is reduced and the need for apomorphine is removed. However, these amounts are dwarfed by the very high costs of LCIG itself. It is

Parkinson's disease (update) Full health economics report
NICE Internal Clinical Guidelines, 2016 41
estimated that the discounted cost of LCIG over an average patient's lifetime would be over £150,000 (around £33,500 per year).
Table 33: Original cost–utility model: breakdown of costs
BMT DBS LCIG
Initial surgery - £26,819 £2,595
AEs £247 £2,009 £2,107
Replacement / dropout - £11,060 £53
Costs LCIG - - £150,257
Apomorphine £21,663 £5,561 -
OtherMeds £29,441 £30,651 £14,913
OtherNHS £25,869 £29,653 £25,798
Care £28,212 £25,094 £30,313
Total £105,432 £130,847 £226,037
F.4.1.3 Base-case cost–utility results
When cost and QALY data are combined (Table 34, Figure 9), DBS is associated with an ICER of around £34,500 per QALY gained. LCIG is dominated by DBS (this is, it is predicted to cost more and confer less benefit).
Table 34: Original cost–utility model: incremental cost–utility results
Costs
(£) Effects
(QALYs)
Incremental
Costs
(£)
Effects
(QALYs)
ICER
(£/QALY)
BMT £105,432 2.325
DBS £130,847 3.061 £25,415 0.736 £34,524
LCIG £226,037 2.542 £95,190 -0.519 dominated
If DBS is excluded from the decision space, to provide results for people who cannot have
DBS but are candidates for LCIG, the model estimates that, compared with BMT, LCIG provides 0.217 QALYs at an incremental cost of £120,605, leading to an ICER of £555,201 per QALY gained.
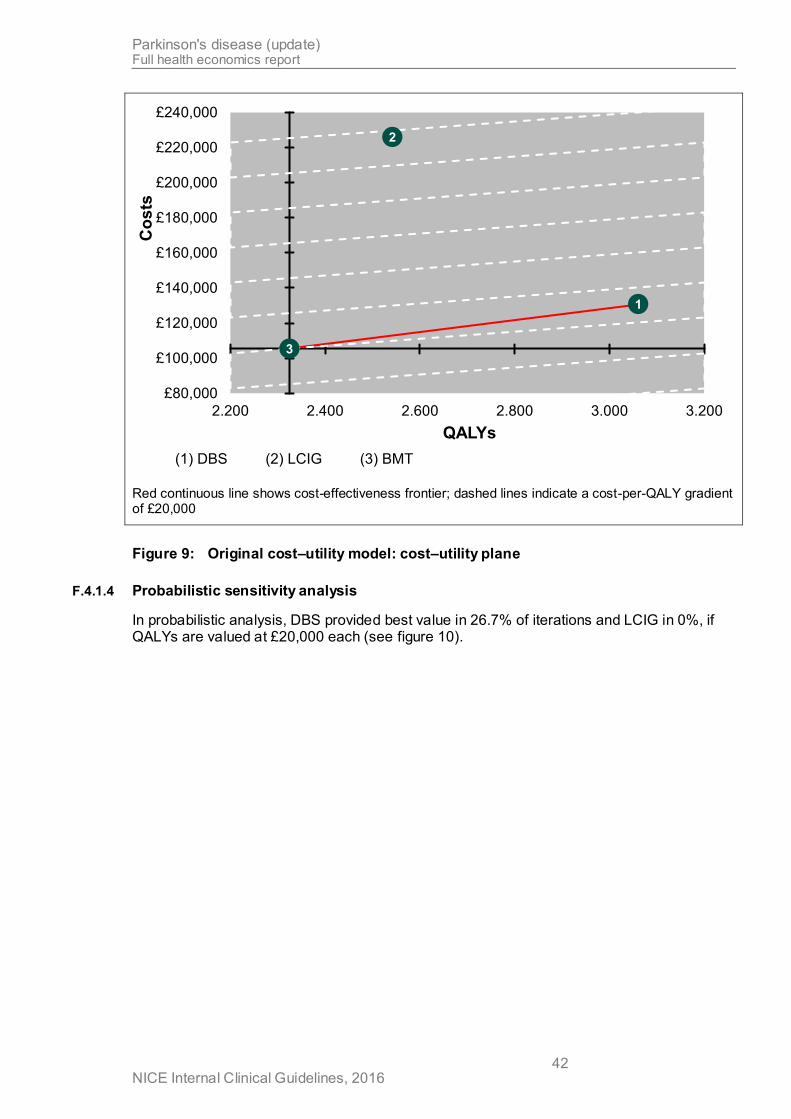
Parkinson's disease (update) Full health economics report
NICE Internal Clinical Guidelines, 2016 42
1
2
3
£80,000
£100,000
£120,000
£140,000
£160,000
£180,000
£200,000
£220,000
£240,000
2.200 2.400 2.600 2.800 3.000 3.200
Co
sts
QALYs
(1) DBS (2) LCIG (3) BMT
Red continuous line shows cost-effectiveness frontier; dashed lines indicate a cost-per-QALY gradient of £20,000
Figure 9: Original cost–utility model: cost–utility plane
F.4.1.4 Probabilistic sensitivity analysis
In probabilistic analysis, DBS provided best value in 26.7% of iterations and LCIG in 0%, if QALYs are valued at £20,000 each (see figure 10).
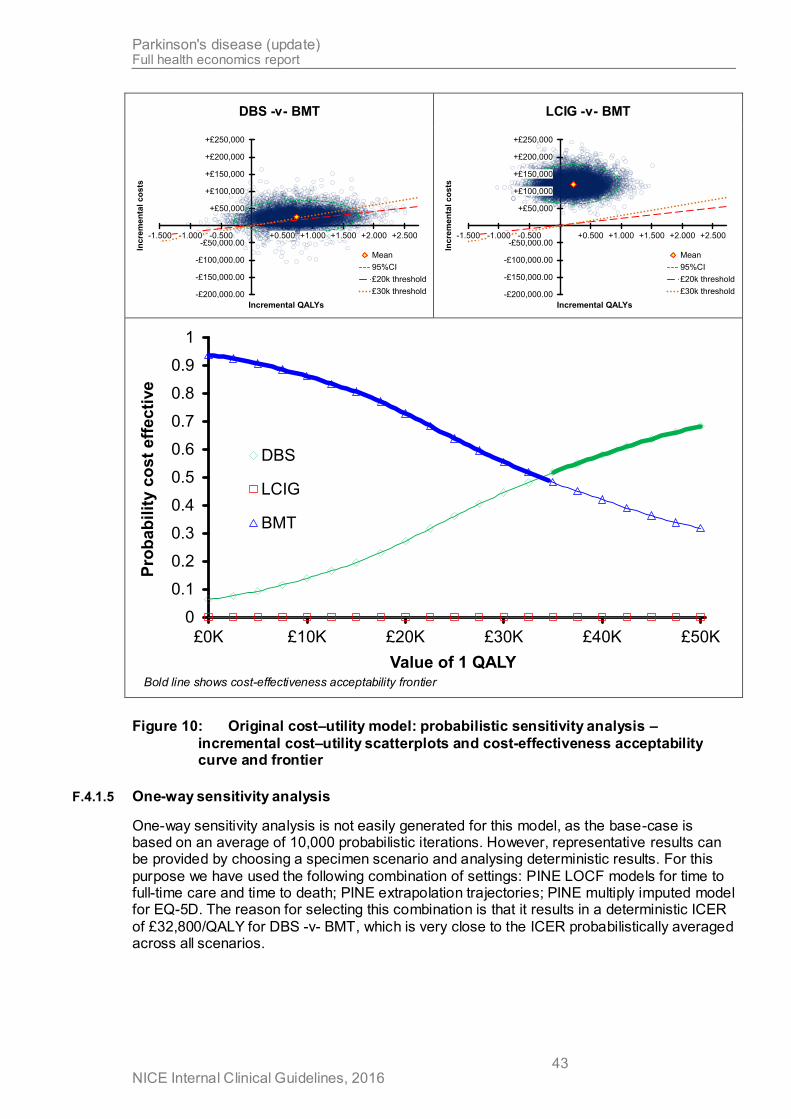
Parkinson's disease (update) Full health economics report
NICE Internal Clinical Guidelines, 2016 43
DBS -v- BMT LCIG -v- BMT
-£200,000.00
-£150,000.00
-£100,000.00
-£50,000.00
+£50,000
+£100,000
+£150,000
+£200,000
+£250,000
-1.500 -1.000 -0.500 +0.500 +1.000 +1.500 +2.000 +2.500
Incre
men
tal
co
sts
Incremental QALYs
Mean
95%CI
£20k threshold
£30k threshold
-£200,000.00
-£150,000.00
-£100,000.00
-£50,000.00
+£50,000
+£100,000
+£150,000
+£200,000
+£250,000
-1.500 -1.000 -0.500 +0.500 +1.000 +1.500 +2.000 +2.500
Incre
men
tal
co
sts
Incremental QALYs
Mean
95%CI
£20k threshold
£30k threshold
0
0.1
0.2
0.3
0.4
0.5
0.6
0.7
0.8
0.9
1
£0K £10K £20K £30K £40K £50K
Pro
ba
bil
ity c
os
t e
ffec
tive
Value of 1 QALY
DBS
LCIG
BMT
Bold line shows cost-effectiveness acceptability frontier
Figure 10: Original cost–utility model: probabilistic sensitivity analysis –
incremental cost–utility scatterplots and cost-effectiveness acceptability curve and frontier
F.4.1.5 One-way sensitivity analysis
One-way sensitivity analysis is not easily generated for this model, as the base-case is based on an average of 10,000 probabilistic iterations. However, representative results can be provided by choosing a specimen scenario and analysing deterministic results. For this
purpose we have used the following combination of settings: PINE LOCF models for time to full-time care and time to death; PINE extrapolation trajectories; PINE multiply imputed model for EQ-5D. The reason for selecting this combination is that it results in a deterministic ICER
of £32,800/QALY for DBS -v- BMT, which is very close to the ICER probabilistically averaged across all scenarios.
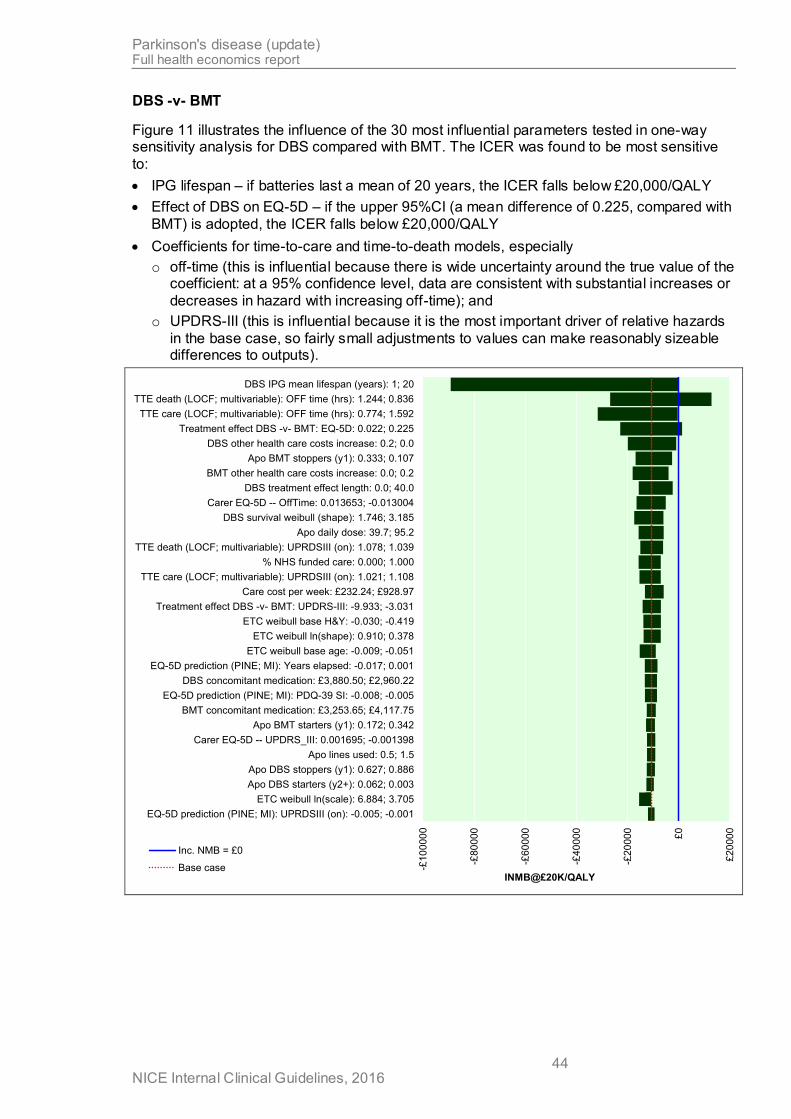
Parkinson's disease (update) Full health economics report
NICE Internal Clinical Guidelines, 2016 44
DBS -v- BMT
Figure 11 illustrates the influence of the 30 most influential parameters tested in one-way sensitivity analysis for DBS compared with BMT. The ICER was found to be most sensitive
to:
IPG lifespan – if batteries last a mean of 20 years, the ICER falls below £20,000/QALY
Effect of DBS on EQ-5D – if the upper 95%CI (a mean difference of 0.225, compared with
BMT) is adopted, the ICER falls below £20,000/QALY
Coefficients for time-to-care and time-to-death models, especially
o off-time (this is influential because there is wide uncertainty around the true value of the coefficient: at a 95% confidence level, data are consistent with substantial increases or
decreases in hazard with increasing off-time); and
o UPDRS-III (this is influential because it is the most important driver of relative hazards
in the base case, so fairly small adjustments to values can make reasonably sizeable differences to outputs).
-£1
00
00
0
-£80
000
-£60
000
-£40
000
-£20
000
£0
£2
000
0
EQ-5D prediction (PINE; MI): UPRDSIII (on): -0.005; -0.001
ETC weibull ln(scale): 6.884; 3.705
Apo DBS starters (y2+): 0.062; 0.003
Apo DBS stoppers (y1): 0.627; 0.886
Apo lines used: 0.5; 1.5
Carer EQ-5D -- UPDRS_III: 0.001695; -0.001398
Apo BMT starters (y1): 0.172; 0.342
BMT concomitant medication: £3,253.65; £4,117.75
EQ-5D prediction (PINE; MI): PDQ-39 SI: -0.008; -0.005
DBS concomitant medication: £3,880.50; £2,960.22
EQ-5D prediction (PINE; MI): Years elapsed: -0.017; 0.001
ETC weibull base age: -0.009; -0.051
ETC weibull ln(shape): 0.910; 0.378
ETC weibull base H&Y: -0.030; -0.419
Treatment effect DBS -v- BMT: UPDRS-III: -9.933; -3.031
Care cost per week: £232.24; £928.97
TTE care (LOCF; multivariable): UPRDSIII (on): 1.021; 1.108
% NHS funded care: 0.000; 1.000
TTE death (LOCF; multivariable): UPRDSIII (on): 1.078; 1.039
Apo daily dose: 39.7; 95.2
DBS survival weibull (shape): 1.746; 3.185
Carer EQ-5D -- OffTime: 0.013653; -0.013004
DBS treatment effect length: 0.0; 40.0
BMT other health care costs increase: 0.0; 0.2
Apo BMT stoppers (y1): 0.333; 0.107
DBS other health care costs increase: 0.2; 0.0
Treatment effect DBS -v- BMT: EQ-5D: 0.022; 0.225
TTE care (LOCF; multivariable): OFF time (hrs): 0.774; 1.592
TTE death (LOCF; multivariable): OFF time (hrs): 1.244; 0.836
DBS IPG mean lifespan (years): 1; 20
INMB@£20K/QALY
Inc. NMB = £0
Base case

Parkinson's disease (update) Full health economics report
NICE Internal Clinical Guidelines, 2016 45
-£10
000
0
-£80
000
-£60
000
-£40
000
-£20
000
£0
£2
000
0
Apo DBS stoppers (y4): 0.053; 0.716
ETC weibull ln(scale): 6.884; 3.705
Apo DBS starters (y2+): 0.062; 0.003
Apo DBS stoppers (y1): 0.627; 0.886
Apo lines used: 0.5; 1.5
Carer EQ-5D -- UPDRS_III: 0.001695; -0.001398
BMT concomitant medication: £3,253.65; £4,117.75
Apo BMT starters (y1): 0.172; 0.342
EQ-5D prediction (PINE; MI): PDQ-39 SI: -0.008; -0.005
DBS concomitant medication: £3,880.50; £2,960.22
EQ-5D prediction (PINE; MI): Years elapsed: -0.017; 0.001
ETC weibull base age: -0.009; -0.051
ETC weibull ln(shape): 0.910; 0.378
ETC weibull base H&Y: -0.030; -0.419
Treatment effect DBS -v- BMT: UPDRS-III: -9.933; -3.031
Care cost per week: £232.24; £928.97
TTE care (LOCF; multivariable): UPRDSIII (on): 1.021; 1.108
% NHS funded care: 0.000; 1.000
TTE death (LOCF; multivariable): UPRDSIII (on): 1.078; 1.039
Apo daily dose: 39.7; 95.2
DBS survival weibull (shape): 1.746; 3.185
Carer EQ-5D -- OffTime: 0.013653; -0.013004
DBS treatment effect length: 0.0; 40.0
BMT other health care costs increase: 0.0; 0.2
Apo BMT stoppers (y1): 0.333; 0.107
DBS other health care costs increase: 0.2; 0.0
Treatment effect DBS -v- BMT: EQ-5D: 0.022; 0.225
TTE care (LOCF; multivariable): OFF time (hrs): 0.774; 1.592
TTE death (LOCF; multivariable): OFF time (hrs): 1.244; 0.836
DBS IPG mean lifespan (years): 1; 20
Incremental NMB @ £20K/QALY
Inc. NMB = £0
Base case
Parameter variations that cause incremental net monetary benefit to rise above £0 would be associated with
ICERs of less than £20,000 per QALY
Figure 11: One-way sensitivity analysis – DBS -v- BMT: 30 most influential parameters
(using PINE LOCF models for time to full-time care and time to death; PINE extrapolation trajectories; PINE multiply imputed model for EQ-5D)
Because battery lifespan looked like a critical parameter, it was investigated more closely.
Figure 12 shows cost–utility outputs for a range of mean lifespans between 1 year and 20 years. It shows that IPG lifespan would have to be 19 years or greater before DBS would be considered cost effective compared with BMT, if QALYs are valued at £20,000 each.
However, if the choice of time-to-event models is also changed, so that the combination that is most favourable to DBS is adopted (see Figure 13), a battery life of 7 years or more would be enough to bring the ICER for DBS -v- BMT to below £20,000 / QALY (Figure 13).
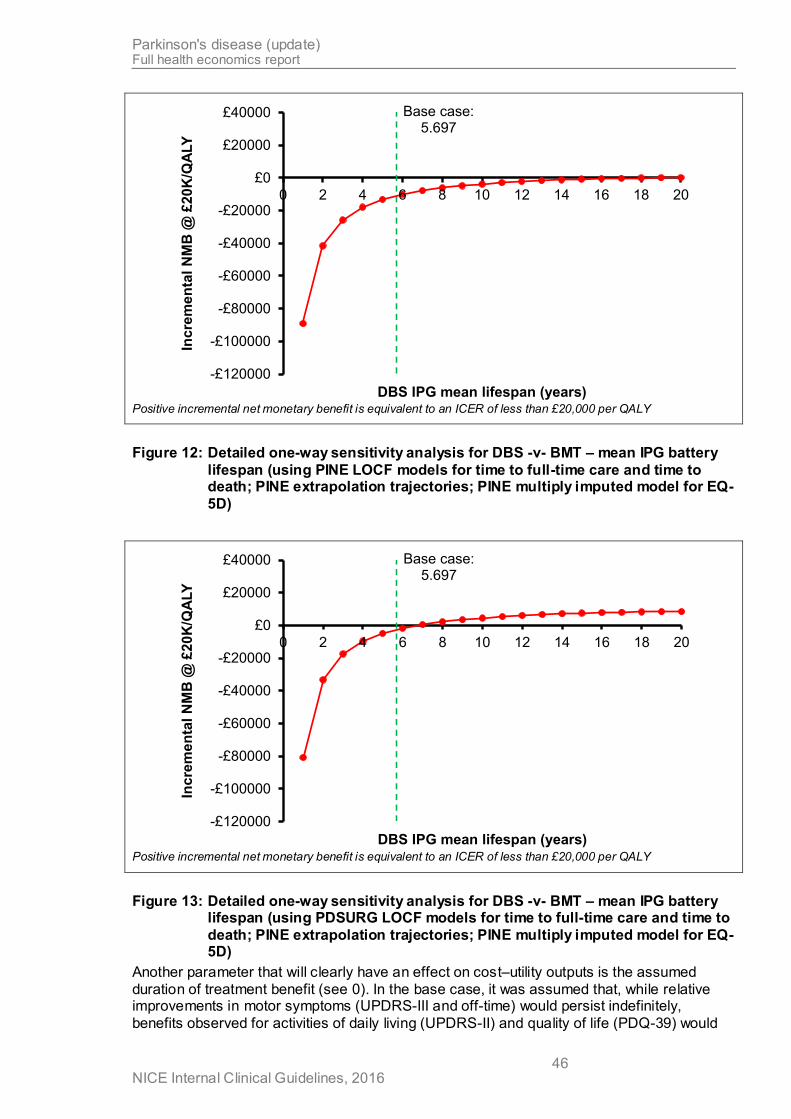
Parkinson's disease (update) Full health economics report
NICE Internal Clinical Guidelines, 2016 46
Base case: 5.697
-£120000
-£100000
-£80000
-£60000
-£40000
-£20000
£0
£20000
£40000
0 2 4 6 8 10 12 14 16 18 20In
cre
me
nta
l N
MB
@ £
20
K/Q
ALY
DBS IPG mean lifespan (years) Positive incremental net monetary benefit is equivalent to an ICER of less than £20,000 per QALY
Figure 12: Detailed one-way sensitivity analysis for DBS -v- BMT – mean IPG battery
lifespan (using PINE LOCF models for time to full-time care and time to death; PINE extrapolation trajectories; PINE multiply imputed model for EQ-
5D)
Base case: 5.697
-£120000
-£100000
-£80000
-£60000
-£40000
-£20000
£0
£20000
£40000
0 2 4 6 8 10 12 14 16 18 20
Inc
rem
en
tal
NM
B @
£20
K/Q
ALY
DBS IPG mean lifespan (years) Positive incremental net monetary benefit is equivalent to an ICER of less than £20,000 per QALY
Figure 13: Detailed one-way sensitivity analysis for DBS -v- BMT – mean IPG battery lifespan (using PDSURG LOCF models for time to full-time care and time to
death; PINE extrapolation trajectories; PINE multiply imputed model for EQ-5D)
Another parameter that will clearly have an effect on cost–utility outputs is the assumed
duration of treatment benefit (see 0). In the base case, it was assumed that, while relative improvements in motor symptoms (UPDRS-III and off-time) would persist indefinitely,
benefits observed for activities of daily living (UPDRS-II) and quality of life (PDQ-39) would

Parkinson's disease (update) Full health economics report
NICE Internal Clinical Guidelines, 2016 47
attenuate over time, with a mean duration of 7 years' benefit. Figure 14 shows what effect lengthening the assumed duration of benefit has on outputs. It can be seen that, although longer benefit obviously improves the cost effectiveness of DBS compared with BMT, even if
a 40-year duration is adopted, QALY gains come at a cost exceeding £20,000 each. If treatment benefit is assumed to persist indefinitely for all outcomes, the ICER for DBS -v- BMT is £20,237.97 / QALY.
Base case: 7.00
-£18000
-£16000
-£14000
-£12000
-£10000
-£8000
-£6000
-£4000
-£2000
£0
£2000
£4000
0.00 5.00 10.00 15.00 20.00 25.00 30.00 35.00 40.00
Inc
rem
en
tal
NM
B @
£20
K/Q
ALY
DBS treatment effect length Positive incremental net monetary benefit is equivalent to an ICER of less than £20,000 per QALY
Figure 14: Detailed one-way sensitivity analysis for DBS -v- BMT – duration of
treatment benefit (using PINE LOCF models for time to full-time care and time to death; PINE extrapolation trajectories; PINE multiply imputed model
for EQ-5D)
LCIG -v- BMT
When LCIG was compared with BMT alone, no plausible variations to parameters resulted in an ICER lower than £200,000 per QALY (see Figure 15). Even when all effectiveness parameters are set to the favourable bound of their 95% confidence intervals and all effects are assumed to last indefinitely, LCIG is associated with an ICER in the region of £80,000
per QALY when compared with BMT. Similarly, if LCIG is assumed to be identically effective as DBS, it has an ICER of £150,000 per QALY gained compared with BMT.
The only circumstance under which LCIG would have an ICER lower than £20,000 per QALY, compared with BMT, is if it is assumed that cassettes cost £20 or less (and the
current assumption that the pump and its maintenance are provided without charge to the NHS can be maintained). See Figure 16.

Parkinson's disease (update) Full health economics report
NICE Internal Clinical Guidelines, 2016 48
-£140000
-£120000
-£100000
-£80
000
-£60
000
-£40
000
-£20
000
£0
DBS concomitant medication: £2,960.22; £3,880.50
LCIG other health care costs: £2,388.85; £1,861.36
LCIG concomitant medication % of BMT arm: 0.667; 0.000
BMT other health care costs: £1,861.36; £2,388.85
Apo BMT starters (y1): 0.172; 0.342
ETC weibull ln(shape): 0.910; 0.378
Apo lines used: 0.5; 1.5
LCIG % receiving NJ test phase: 0.000; 0.500
LCIG other health care costs increase: 0.20; 0.00
BMT other health care costs increase: 0.0; 0.2
Treatment effect DBS -v- BMT: UPDRS-III: -3.031; -9.933
TTE death (LOCF; multivariable): UPRDSIII (on): 1.039; 1.078
Care cost per week: £232.24; £928.97
Carer EQ-5D -- OffTime: 0.013653; -0.013004
% NHS funded care: 0.000; 1.000
ETC weibull base H&Y: -0.030; -0.419
LCIG treatment effect length: 1.0; 13.0
LCIG % drop outs y1: 0.123; 0.202
DBS survival weibull (shape): 3.185; 1.746
Apo daily dose: 39.7; 95.2
ETC weibull base age: -0.009; -0.051
ETC weibull ln(scale): 6.884; 3.705
Apo BMT stoppers (y1): 0.333; 0.107
DBS survival weibull (scale): 5057.9; 3489.4
Treatment effect LCIG -v- BMT: UPDRS-III: -3.194; 5.994
Treatment effect LCIG -v- BMT: EQ-5D: -0.019; 0.159
TTE care (LOCF; multivariable): OFF time (hrs): 0.774; 1.592
TTE death (LOCF; multivariable): OFF time (hrs): 1.244; 0.836
LCIG % using 2 cassettes per day: 0.387; 0.000
LCIG % drop outs y2: 0.047; 0.202
INMB@£20K/QALY
Inc. NMB = £0
Base case
Parameter variations that cause incremental net monetary benefit to rise above £0 would be associated with ICERs of less than £20,000 per QALY
Figure 15: One-way sensitivity analysis – LCIG -v- BMT: 30 most influential parameters
(using PINE LOCF models for time to full-time care and time to death; PINE extrapolation trajectories; PINE multiply imputed model for EQ-5D)
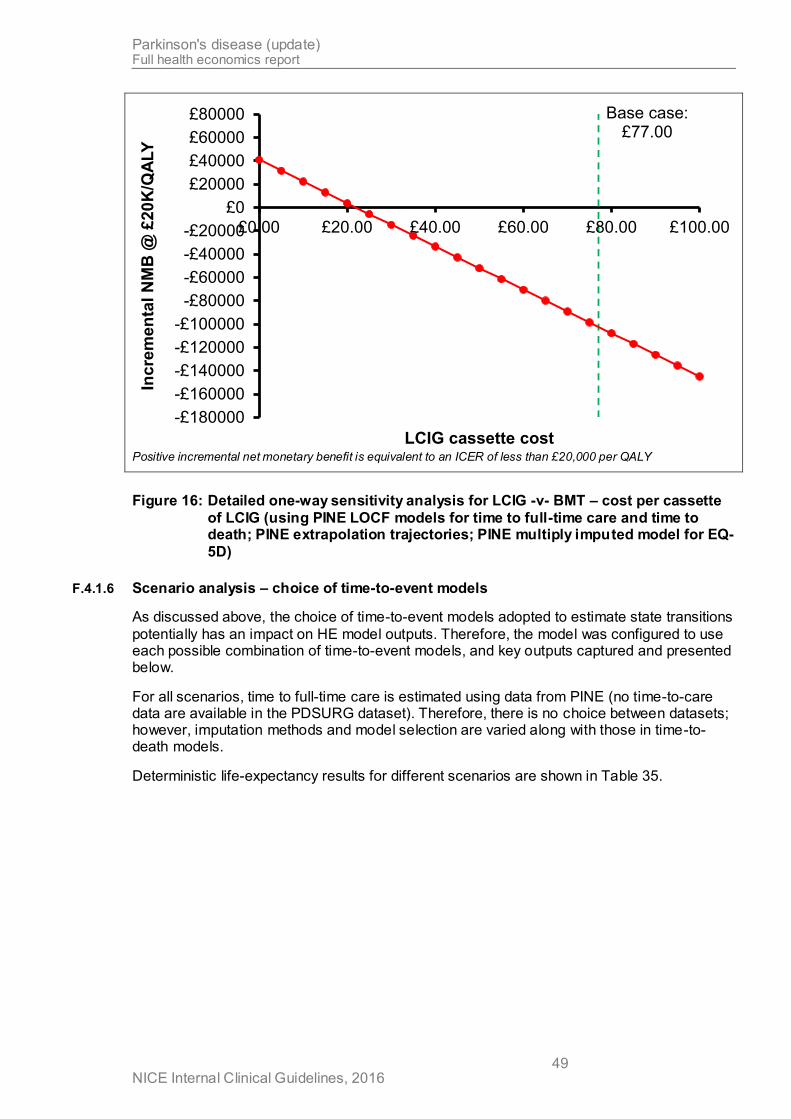
Parkinson's disease (update) Full health economics report
NICE Internal Clinical Guidelines, 2016 49
Base case: £77.00
-£180000
-£160000
-£140000
-£120000
-£100000
-£80000
-£60000
-£40000
-£20000
£0
£20000
£40000
£60000
£80000
£0.00 £20.00 £40.00 £60.00 £80.00 £100.00
Inc
rem
en
tal
NM
B @
£20
K/Q
ALY
LCIG cassette cost Positive incremental net monetary benefit is equivalent to an ICER of less than £20,000 per QALY
Figure 16: Detailed one-way sensitivity analysis for LCIG -v- BMT – cost per cassette
of LCIG (using PINE LOCF models for time to full-time care and time to death; PINE extrapolation trajectories; PINE multiply imputed model for EQ-
5D)
F.4.1.6 Scenario analysis – choice of time-to-event models
As discussed above, the choice of time-to-event models adopted to estimate state transitions
potentially has an impact on HE model outputs. Therefore, the model was configured to use each possible combination of time-to-event models, and key outputs captured and presented below.
For all scenarios, time to full-time care is estimated using data from PINE (no time-to-care data are available in the PDSURG dataset). Therefore, there is no choice between datasets; however, imputation methods and model selection are varied along with those in time-to-death models.
Deterministic life-expectancy results for different scenarios are shown in Table 35.

Parkinson's disease (update) Full health economics report
NICE Internal Clinical Guidelines, 2016 50
Table 35: Scenario analysis: deterministically modelled life expectancy according to
different time-to-event models
Time to death = PINE Time to death = PDSURG
At home In care Total At home In care Total
LOCF
Multivariable
BMT 7.483 1.200 8.683 7.908 1.507 9.416
DBS 9.248 0.993 10.241 9.248 0.993 10.241
LCIG 7.570 0.947 8.517 8.503 1.445 9.948
Univariable
BMT 7.610 1.277 8.887 8.038 1.553 9.591
DBS 9.008 1.233 10.241 9.008 1.233 10.241
LCIG 7.321 1.283 8.605 7.816 1.625 9.441
Multiply imputed
Multivariable
BMT 8.275 1.729 10.004 8.023 1.571 9.594
DBS 8.412 1.829 10.241 8.412 1.829 10.241
LCIG 7.842 2.172 10.015 7.723 2.044 9.767
Univariable
BMT 8.264 1.718 9.981 8.050 1.561 9.612
DBS 8.901 1.340 10.241 8.901 1.340 10.241
LCIG 8.105 1.805 9.910 7.857 1.609 9.465
It is expected that total life expectancy for DBS is not affected by any of the choices, because mortality is modelled against a baseline of DBS data (from PDSURG; see F.3.1.10). For the
same reason, there is no difference between time-to-care estimates for DBS when PINE and PDSURG datasets are used for death.
To illustrate these findings, Figure 17 shows predicted full-time-care-free survival for each combination of settings.

Parkinson's disease (update) Full health economics report
NICE Internal Clinical Guidelines, 2016 51
Time to death = PINE Time to death = PDSURG
LO
CF
Mu
ltiv
ari
ab
le
0.0
0.1
0.2
0.3
0.4
0.5
0.6
0.7
0.8
0.9
1.0
0 1 2 3 4 5 6 7 8 9 10 11 12 13 14 15 16 17 18 19 20
Pro
po
rtio
n o
f co
ho
rt a
live
an
d n
ot
req
uir
ing
fu
ll-t
ime
care
Years
DBS
LCIG
BMT
0.0
0.1
0.2
0.3
0.4
0.5
0.6
0.7
0.8
0.9
1.0
0 1 2 3 4 5 6 7 8 9 10 11 12 13 14 15 16 17 18 19 20
Pro
po
rtio
n o
f co
ho
rt a
live
an
d n
ot
req
uir
ing
fu
ll-t
ime
care
Years
DBS
LCIG
BMT
Un
iva
ria
ble
0.0
0.1
0.2
0.3
0.4
0.5
0.6
0.7
0.8
0.9
1.0
0 1 2 3 4 5 6 7 8 9 10 11 12 13 14 15 16 17 18 19 20
Pro
po
rtio
n o
f co
ho
rt a
live
an
d n
ot
req
uir
ing
fu
ll-t
ime
care
Years
DBS
LCIG
BMT
0.0
0.1
0.2
0.3
0.4
0.5
0.6
0.7
0.8
0.9
1.0
0 1 2 3 4 5 6 7 8 9 10 11 12 13 14 15 16 17 18 19 20
Pro
po
rtio
n o
f co
ho
rt a
live
an
d n
ot
req
uir
ing
fu
ll-t
ime
care
Years
DBS
LCIG
BMT
Mu
ltip
ly im
pu
ted
Mu
ltiv
ari
ab
le
0.0
0.1
0.2
0.3
0.4
0.5
0.6
0.7
0.8
0.9
1.0
0 1 2 3 4 5 6 7 8 9 10 11 12 13 14 15 16 17 18 19 20
Pro
po
rtio
n o
f co
ho
rt a
live
an
d n
ot
req
uir
ing
fu
ll-t
ime
care
Years
DBS
LCIG
BMT
0.0
0.1
0.2
0.3
0.4
0.5
0.6
0.7
0.8
0.9
1.0
0 1 2 3 4 5 6 7 8 9 10 11 12 13 14 15 16 17 18 19 20
Pro
po
rtio
n o
f co
ho
rt a
live
an
d n
ot
req
uir
ing
fu
ll-t
ime
care
Years
DBS
LCIG
BMT
Un
iva
ria
ble
0.0
0.1
0.2
0.3
0.4
0.5
0.6
0.7
0.8
0.9
1.0
0 1 2 3 4 5 6 7 8 9 10 11 12 13 14 15 16 17 18 19 20
Pro
po
rtio
n o
f co
ho
rt a
live
an
d n
ot
req
uir
ing
fu
ll-t
ime
care
Years
DBS
LCIG
BMT
0.0
0.1
0.2
0.3
0.4
0.5
0.6
0.7
0.8
0.9
1.0
0 1 2 3 4 5 6 7 8 9 10 11 12 13 14 15 16 17 18 19 20
Pro
po
rtio
n o
f co
ho
rt a
live
an
d n
ot
req
uir
ing
fu
ll-t
ime
care
Years
DBS
LCIG
BMT
Figure 17: Original cost–utility model: predicted full-time-care-free survival according
to choice of time-to-event models
Deterministic cost–utility results for each scenario are shown in Table 36. In all scenarios, DBS is associated with an ICER of between £23,000 per QALY and £44,000 per QALY,
compared with BMT, and LCIG is dominated by DBS. Pairwise ICERs for LCIG -v- BMT exceed £300,000 per QALY in all scenarios.

Parkinson's disease (update) Full health economics report
NICE Internal Clinical Guidelines, 2016 52
Table 36: Scenario analysis: deterministic cost–utility results according to different
time-to-event models
Time to death = PINE Time to death = PDSURG
Costs (£)
Effects (QALYs)
Incremental
Costs
(£)
Effects (QALYs)
Incremental
Costs
(£)
Effects
(QALYs)
ICER
(£/QALY)
Costs
(£)
Effects
(QALYs)
ICER
(£/QALY)
LOCF
Multivariable
BMT £93,747 2.220 £103,359 2.286
DBS £121,445 3.069 £27,697 0.849 £32,621 £121,445 3.069 £18,086 0.783 £23,111
LCIG £201,131 2.481 £79,686 -0.588 dominated £226,256 2.644 £104,812 -0.425 dominated
Univariable
BMT £96,361 2.242 £105,445 2.316
DBS £125,707 3.052 £29,346 0.810 £36,234 £125,707 3.052 £20,263 0.736 £27,526
LCIG £208,433 2.470 £82,726 -0.583 dominated £224,181 2.565 £98,474 -0.487 dominated
Multiply imputed
Multivariable
BMT £110,850 2.353 £105,606 2.308
DBS £136,037 3.012 £25,187 0.658 £38,252 £136,037 3.012 £30,431 0.703 £43,274
LCIG £239,918 2.601 £103,881 -0.411 dominated £235,090 2.579 £99,053 -0.433 dominated
Univariable
BMT £110,552 2.352 £105,710 2.318
DBS £127,563 3.045 £17,012 0.693 £24,546 £127,563 3.045 £21,853 0.727 £30,064
LCIG £232,373 2.613 £104,810 -0.431 dominated £224,149 2.570 £96,585 -0.475 dominated
F.4.1.7 Other scenario analyses
A range of other scenarios was explored. As in F.4.1.5, the time-to-event models used for these analyses are the following: PINE LOCF models for time to full-time care and time to death; PINE extrapolation trajectories (except where noted); PINE multiply imputed model for EQ-5D (except where noted).
Baseline progression trajectories
As described in F.3.1.7, the model could be configured to use either PINE or PDSURG data
for its baseline absolute rates of progression over time in the clinical variables of interest. We found that this choice made very little difference to incremental model outputs; see Table 37.
Table 37: Scenario analysis: baseline progression trajectories from PINE or PDSURG
Costs
(£) Effects
(QALYs)
Incremental
Costs
(£)
Effects
(QALYs)
ICER
(£/QALY)
Baseline progression trajectories from PINE dataset (base case)
BMT £93,747 2.220
DBS £121,445 3.069 £27,697 0.849 £32,621
LCIG £201,131 2.481 £79,686 -0.588 dominated
Baseline progression trajectories from PDSURG dataset
BMT £93,747 2.246
DBS £121,445 3.108 £27,697 0.862 £32,136
LCIG £201,131 2.507 £79,686 -0.601 dominated
Parkinson's disease (update) Full health economics report
NICE Internal Clinical Guidelines, 2016 53
Projection of EQ-5D
As described in F.3.1.14, for periods beyond the first year (for which RCT data were available), the model could be configured either to predict EQ-5D as a function of other
variables (this was our base case) or to project it in the same way as for other variables (independently from the values of those other variables; see 0). When EQ-5D is predicted as a function of other clinical variables, there are 4 different models that could be used – in the
base case, these are selected randomly, as we have no strong reason for preferring 1 dataset or approach over the others.
Table 38 gives cost–utility results for each possible approach individually. It shows that all prediction models provide similar incremental results, with the exception of the PINE LOCF
model, which results in lower overall QALYs leading to smaller incrementa l gains and worse value for money for the active interventions.
When EQ-5D is projected independently of other variables, QALYs are notably lower. This is
because quality of life becomes negative fairly rapidly using this approach, so treatments that result in extension of life – as a result of improvement in clinical predictor variables – are penalised. This results in worse estimated value for money. However, if EQ-5D is projected
independently and the relative benefit seen at 1 year is preserved indefinitely (as in the one-way sensitivity analysis above), DBS is associated with a much more favourable ICER compared with BMT alone.

Parkinson's disease (update) Full health economics report
NICE Internal Clinical Guidelines, 2016 54
Table 38: Scenario analysis: EQ-5D progression scenarios
Costs
(£)
Effects
(QALYs)
Incremental
Costs
(£)
Effects
(QALYs)
ICER
(£/QALY)
Predict EQ-5D as a function of clinical variables
Use model estimated from PINE multiply imputed data (base case)
BMT £93,747 2.220
DBS £121,445 3.069 £27,697 0.849 £32,621
LCIG £201,131 2.481 £79,686 -0.588 dominated
Use model estimated from PINE LOCF data
BMT £93,747 1.888
DBS £121,445 2.560 £27,697 0.672 £41,220
LCIG £201,131 2.119 £79,686 -0.441 dominated
Use model estimated from PDSURG multiply imputed data
BMT £93,747 2.499
DBS £121,445 3.410 £27,697 0.912 £30,382
LCIG £201,131 2.730 £79,686 -0.681 dominated
Use model estimated from PDSURG LOCF data
BMT £93,747 2.539
DBS £121,445 3.464 £27,697 0.926 £29,923
LCIG £201,131 2.770 £79,686 -0.694 dominated
Use linear mapping function from PDQ-39 summary index (Young et al., 2013)
BMT £93,747 3.028
DBS £121,445 3.605 £27,697 0.577 £47,965
LCIG £201,131 3.242 £79,686 -0.364 dominated
Use estimate via estimated Hoehn and Yahr score and off time (Lowin et al., 2011)
BMT £93,747 2.542
DBS £121,445 3.752 £27,697 1.210 £22,889
LCIG £201,131 3.167 £79,686 -0.586 dominated
Project EQ-5D independently of clinical variables
Base-case duration of benefit (7 years)
BMT £94,807 1.827
DBS £122,239 2.318 £27,432 0.491 £55,852
LCIG £202,553 2.065 £80,314 -0.253 dominated
Permanent benefit
BMT £94,694 1.827
DBS £118,971 2.966 £24,278 1.139 £21,323
LCIG £197,024 2.355 £78,053 -0.611 dominated
Carer quality of life
As described in F.3.1.14, the model included an estimate of carer quality of life, based on an uncertain prediction model with no significant covariates. The inclusion of this factor (and the data on which the prediction model was based) had a negligible impact on cost–utility outputs; see Table 39.

Parkinson's disease (update) Full health economics report
NICE Internal Clinical Guidelines, 2016 55
Table 39: Scenario analysis: carer quality of life
Costs
(£)
Effects
(QALYs)
Incremental
Costs
(£)
Effects
(QALYs)
ICER
(£/QALY)
Include carer QoL
Use model estimated from PINE multiply imputed data (base case)
BMT £93,747 2.220
DBS £121,445 3.069 £27,697 0.849 £32,621
LCIG £201,131 2.481 £79,686 -0.588 dominated
Use model estimated from PINE LOCF data
BMT £93,747 2.220
DBS £121,445 3.032 £27,697 0.812 £34,105
LCIG £201,131 2.482 £79,686 -0.550 dominated
Exclude carer QoL
BMT £93,747 2.220
DBS £121,445 3.055 £27,697 0.835 £33,157
LCIG £201,131 2.454 £79,686 -0.601 dominated
Use of DBS RCTs other than PDSURG to estimate <1 year treatment effects
As described in F.3.1.5, while 1-year effectiveness data were derived from PDSURG alone, other included RCTs – all of which had less than 1 year's follow-up – could be used to specify treatment effects year 1. This had an entirely trivial impact on results; see Table 40.
Table 40: Scenario analysis: additional DBS data
Costs
(£) Effects
(QALYs)
Incremental
Costs
(£)
Effects
(QALYs)
ICER
(£/QALY)
Do not use data from additional included DBS RCTs (base case)
BMT £93,747 2.220
DBS £121,445 3.069 £27,697 0.849 £32,621
LCIG £201,131 2.481 £79,686 -0.588 dominated
Use data from additional included DBS RCTs
BMT £93,767 2.220
DBS £121,460 3.069 £27,694 0.849 £32,617
LCIG £201,172 2.481 £79,711 -0.588 dominated
Effectiveness data from PDSURG
As described in F.3.1.5, various effect estimates could be derived from the PDSURG data and, in our base case, we preferred results from an ANCOVA model based on multiply imputed data. The impact of other possible effectiveness results was explored in a scenario analysis and found to have some influence on cost–utility outputs – see Table 41.
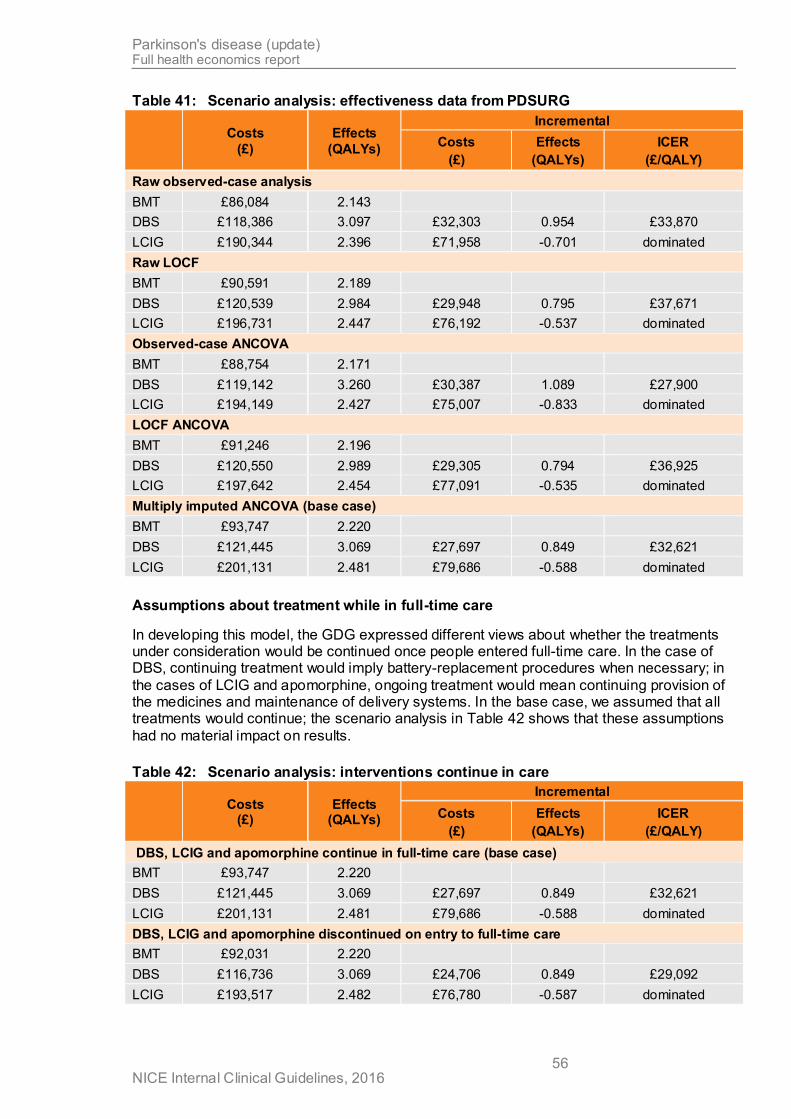
Parkinson's disease (update) Full health economics report
NICE Internal Clinical Guidelines, 2016 56
Table 41: Scenario analysis: effectiveness data from PDSURG
Costs
(£)
Effects
(QALYs)
Incremental
Costs
(£)
Effects
(QALYs)
ICER
(£/QALY)
Raw observed-case analysis
BMT £86,084 2.143
DBS £118,386 3.097 £32,303 0.954 £33,870
LCIG £190,344 2.396 £71,958 -0.701 dominated
Raw LOCF
BMT £90,591 2.189
DBS £120,539 2.984 £29,948 0.795 £37,671
LCIG £196,731 2.447 £76,192 -0.537 dominated
Observed-case ANCOVA
BMT £88,754 2.171
DBS £119,142 3.260 £30,387 1.089 £27,900
LCIG £194,149 2.427 £75,007 -0.833 dominated
LOCF ANCOVA
BMT £91,246 2.196
DBS £120,550 2.989 £29,305 0.794 £36,925
LCIG £197,642 2.454 £77,091 -0.535 dominated
Multiply imputed ANCOVA (base case)
BMT £93,747 2.220
DBS £121,445 3.069 £27,697 0.849 £32,621
LCIG £201,131 2.481 £79,686 -0.588 dominated
Assumptions about treatment while in full-time care
In developing this model, the GDG expressed different views about whether the treatments under consideration would be continued once people entered full-time care. In the case of DBS, continuing treatment would imply battery-replacement procedures when necessary; in
the cases of LCIG and apomorphine, ongoing treatment would mean continuing provision of the medicines and maintenance of delivery systems. In the base case, we assumed that all treatments would continue; the scenario analysis in Table 42 shows that these assumptions
had no material impact on results.
Table 42: Scenario analysis: interventions continue in care
Costs
(£) Effects
(QALYs)
Incremental
Costs
(£)
Effects
(QALYs)
ICER
(£/QALY)
DBS, LCIG and apomorphine continue in full-time care (base case)
BMT £93,747 2.220
DBS £121,445 3.069 £27,697 0.849 £32,621
LCIG £201,131 2.481 £79,686 -0.588 dominated
DBS, LCIG and apomorphine discontinued on entry to full-time care
BMT £92,031 2.220
DBS £116,736 3.069 £24,706 0.849 £29,092
LCIG £193,517 2.482 £76,780 -0.587 dominated

Parkinson's disease (update) Full health economics report
NICE Internal Clinical Guidelines, 2016 57
Rechargeable IPGs
As discussed in F.3.1.11 and F.3.1.12, rechargeable IPGs are now available for DBS. We did not have any evidence on the true lifespan of such devices, but we undertook a sensitivity
analysis using the costs of rechargeable equipment and assuming that they never need replacing, to give an estimate of the greatest value that a rechargeable system could provide. Results (Table 43) indicate that the additional up-front cost of the device would be almost
completely cancelled out by saved replacement costs; however, this is only on the assumption that the devices truly never need replacing.
Table 43: Scenario analysis: additional DBS data
Costs
(£) Effects
(QALYs)
Incremental
Costs
(£)
Effects
(QALYs)
ICER
(£/QALY)
Standard IPGs (base case)
BMT £93,747 2.220
DBS £121,445 3.069 £27,697 0.849 £32,621
LCIG £201,131 2.481 £79,686 -0.588 dominated
Rechargeable IPGs
BMT £93,747 2.220
DBS £122,002 3.070 £28,255 0.850 £33,249
LCIG £201,131 2.481 £79,129 -0.588 dominated
Scenario analyses for LCIG
A series of additional scenario analyses was undertaken focusing on assumptions in the modelling of LCIG. These included: the proportion of people requiring 2 cassettes per day, the evidence used to estimate dropout rates (Nyholm et al. 2012 instead of our base case of Fernandez et al. 2015 and Slevin et al. 2015), whether the costs of additional nurse visits
and/or pump AE events are met by the manufacturer and levels of concomitant medication. None had any material impact on cost–utility results: LCIG was always dominated by DBS and always associated with an ICER of more than £300,000 per QALY when compared with
BMT alone.
An additional scenario analysis sought to explore how cost effective LCIG might be under circumstances in which it had the biggest possible effects. As a matter of theory, it might be
assumed that, if people could be identified with some sort of characteristics that make them particularly good candidates for LCIG, it might become cost effective to treat them compared with BMT. While the GDG were unable to suggest any a priori characteristics that would
make the identification of such people possible, it is of interest to estimate the greatest possible value LCIG could provide. To explore this, we configured the model's LCIG input parameters to reflect the positive 99.9% confidence bound of the observed effect in Olanow
et al.'s RCT (2014) in every domain (that is, upper 99.9%CI for EQ-5D; lower 99.9%CI for UPDRS scores, off-time and PDQ-39). Results are shown in Table 44. The analysis shows a substantial rise in effectiveness from that estimated in the base case, with over 1.2 QALYs
gained compared with BMT (note that this suggests LCIG is much more effective than DBS). However, even when assuming treatment effects that are very much more positive than those seen, on average, in the RCT, LCIG still costs over £100,000 for every QALY it
provides, compared with BMT.

Parkinson's disease (update) Full health economics report
NICE Internal Clinical Guidelines, 2016 58
Table 44: Scenario analysis: LCIG -v- BMT when all effectiveness parameters are set
at upper 99.9% confidence interval of observed effect
Costs
(£) Effects
(QALYs)
Incremental
Costs
(£)
Effects
(QALYs)
ICER
(£/QALY)
BMT £93,747 2.220
LCIG £218,823 3.430 £125,075 1.210 £103,395
One final exploratory scenario analysis was undertaken in which the model was configured to be as similar as possible to the evaluation sponsored by the manufacturer of LCIG (Lowin et al., 2011). We have multiple criticisms of this model (see F.2.1.3), and believe that our base-
case approach provides a much more robust, evidence-based and credible simulation of advanced Parkinson's disease and its treatments. Nevertheless, it is of interest to question whether any of the structural decisions taken in the development of our model resulted in an
accidental structural bias against LCIG.
To do this, it was necessary to estimate the HY effects of treatments, which were not previously part of the model. For DBS, we were able to use patient-level data from PDSURG (HY≥3) to estimate that the HY score of the average participant receiving DBS (MD = -0.66
[95%CI: -1.00, -0.31]). For LCIG, no randomised data (or even well powered case series) are available. Therefore, noting that this was merely an exploratory analysis, we used the
before–after difference from a pooled analysis of 2 3-week case series of nasoduodenal LCIG infusion and 1 6-month case series (Neville et al., 2012), to estimate that, under Lowin et al.'s assumptions, LCIG might be associated with a reduction of HY score in the order of -
0.38 (95%CI: -0.640, -0.120).
We then used Lowin et al.'s published linear model for estimating direct medical costs and direct care costs from HY and off-time, and their method of extrapolating utility values from a few empirical datapoints, which is also equivalent to a linear model: 1.499 − 0.256HY −
0.088OffCat (where OffCat [1,2,3,4] represents 25%-wide categories of the proportion of the waking day spent in the off state).
We found that applying medical costs only makes the ICER for LCIG -v- BMT go up
somewhat (to £521,659/QALY). Including care costs as well brings it down to £236,065/QALY (at this point, DBS becomes a dominant option, which emphasises the degree to which the analysis favours interventions over BMT). Finally, using Lowin et al.'s
quality of life extrapolation on top of these assumptions reduces the ICER further, to £98,618/QALY. Under this assumption, LCIG would be expected to confer 0.624 QALYs more than BMT for the average patient – a little under a threefold increase from our base
case. However, this is still less than Lowin et al.'s analysis suggests (their base case suggests a 1.1 QALY gain for LCIG).
Therefore, we attempted to configure our model to be as close to Lowin et al.'s as possible (given structural differences). We did the following: (a) estimated medical and care costs
using Lowin et al.'s method relying on predicted HY score and off-time state; (b) based QoL on Lowin et al.'s extrapolated HY and off-time function; (c) used the same before–after
observational data source cited by Lowin et al. to parameterise the effect of LCIG on HY score; (d) assumed all treatment effects last indefinitely (as Lowin et al. do); (e) assumed that 10% of people require 2 cassettes of LCIG per day (as Lowin et al. do; cf. our base case of
19%). It is not straightforward for us to replicate Lowin et al.'s assumption that off -time benefit increases over time; however, they provide a sensitivity analysis in which this assumption is removed, which provides a point of comparison for this exercise. Our model, configured to
imitate Lowin et al.'s assumptions, estimated that, compared with BMT, LCIG generates an extra 0.98 QALYs at an additional cost of £48,949, leading to an ICER of £49,987 / QALY. This is strikingly similar to Lowin et al.'s sensitivity analysis (1.00 incremental QALYs;
£48,283 incremental costs; ICER £48,233).

Parkinson's disease (update) Full health economics report
NICE Internal Clinical Guidelines, 2016 59
F.5 Discussion
F.5.1.1 Strengths of the analysis
This is the first cost–utility analysis to compare DBS, LCIG and BMT based on a systematic review of evidence, with effectiveness evidence drawn from appropriately identified and
synthesised RCTs. In this respect, it takes maximal strength from best available evidence, which previous attempts at modelling this decision space have failed to do.
It benefits very significantly from the developer's access to 2 rich patient-level datasources. PINE has extensive detail on the epidemiology and longitudinal progression of Parkinson's
disease. PDSURG provides the most directly applicable source of randomised evidence on the effectiveness of DBS, over its first year; over the remainder of its 9-year follow up, it represents a detailed case series of long-term outcome of people undergoing DBS.
The model structure uses relevant data from the synthesised evidence-base to represent critical events in the experience of people living with advanced Parkinson's disease. The surrogate relationship between clinical variables and time to care, time to death and quality
of life is well characterised and provides a plausible simulation of long-term outcomes.
Previous models have given little attention to the cost savings that may be associated with advanced therapies for Parkinson's disease. We have addressed this by accounting for full-time care requirements and the apomorphine-sparing effect of DBS and LCIG.
We have modelled treatment-related adverse events, which receive little or no attention in existing models. Our model also includes an estimate of the disutility of undergoing DBS or LCIG placement, which has been entirely overlooked in the past.
The model provides fully probabilistic results, which most published analyses have either failed to do completely, or only attempted using approximations of real parameter uncertainty. In contrast, every parameter in our model is subject to appropriate characterisation of uncertainty, and structural uncertainty was also addressed
probabilistically.
The model was developed iteratively with detailed input from a wide range of clinical and patient experts on the GDG, and its results were discussed and interpreted in the same
context.
F.5.1.2 Weaknesses of the analysis
The overriding uncertainty with which models of therapies for advanced Parkinson's disease
must contend relates to the long-term extrapolation of treatment effects into the future. Almost all other models assume that benefits demonstrated in short-term evidence persist indefinitely. The GDG was clear that this was not a realistic expectation – especially as
regards non-motor features of the disease – and, in discussion, the group informed model assumptions about likely course of events. However, these are untestable assumptions – unless a long-term randomised trial were to become available (and the GDG was clear that it
would be very difficult to recruit to such a trial, given the very clear effectiveness of DBS, in particular).
The time-to-event models underpinning the HE model are based on a variety of assumptions
and approaches, with no clear way of identifying the optimal approach. While it might have been hoped that one of these approaches would produce a model that was clearly superior to others, no such clarity emerged. We handled this appropriately, by characterising our
uncertainty as structural, and incorporating it into our base-case findings. However, it is quite possible that analysis based on an even fuller dataset would be able to characterise the
Parkinson's disease (update) Full health economics report
NICE Internal Clinical Guidelines, 2016 60
relationship between clinical variables and outcomes of interest with a single model that is more obviously convincing than other possible approaches.
In the particular case of time to full-time care, we were reliant on a single dataset (PINE) and
could not validate this by comparing model outputs with those generated from PDSURG (as there are insufficient care-admission events recorded in the latter dataset to enable meaningful analysis). This concern may be somewhat heightened because the PINE dataset
is based on a Scottish cohort experiencing the Scottish health and social care systems, and these data are then applied to a decision problem that focuses exclusively on England. It is well known that the provision of residential care is subject to regional variation, and it is
possible that the experience described in the PINE dataset features more or fewer entry-to-care events than would be expected, on average, in England. Moreover, the shape and scale parameters of the Weibull function used to estimate entry to care were found to be among
the 30 most influential parameters in our one-way sensitivity analyses (see F.4.1.5), suggesting that the HE model has some sensitivity to this issue. However, the kind of variation observed was not so great as to move ICERs into a qualitatively different realm.
Therefore, we can be confident that, if entry to care happens at a slower or quicker rate in England, it would not change things so much as to jeopardise the validity of the GDG’s decision-making (unless the difference is so great that it substantially exceeds the range over
which these parameters were tested, corresponding to their – relatively wide – 95% confidence intervals).
F.5.1.3 Comparison with other CUAs
DBS -v- BMT
Table 45 provides a comparison of key features and outputs of our model and the other CUAs of DBS -v- BMT identified in our systematic review of published economic evaluations (see F.2).
There are some notable dissimilarities between the analyses:
A huge range of total QALYs is estimated. In some cases, higher QALY estimates are clearly a result of much longer simulated life expectancy: the discounted QALYs estimated by Dams et al. (2013) exceed the undiscounted life-years estimated in our model so, even if we set all our health-state utilities to 1, our model would still generate substantially lower
QALYs than theirs. The evidence we have from PDSURG suggests that life expectancy of the magnitude implied by this result is implausible.
On the whole, our total QALYs are somewhat lower than most CUAs estimate. We think this is for 2 reasons: firstly, our model projects overall survival of around 10 years, which could be somewhat lower than other models. Few other models report their estimated life-
years (and several provide little detail on how they simulate mortality). However, when we configured our model to match observed survival from PDSURG using standard lifetables
and an increased hazard of death associated with PD, it was necessary to adopt a hazard ratio of around 9, which is much higher than reported in epidemiological literature on life expectancy with PD (see F.3.1.10). Therefore, we believe that any models that have
adopted this fairly common approach to modelling survival are likely to have significantly overestimated expected life years. Secondly, our model projects a consistent decline in quality of life after the initial treatment benefit, whereas some other models do not. For
example, the PDSURG economic evaluation (McIntosh et al. 2016) assumes that the EQ-5D benefit observed in the 1-year randomised phase of the RCT persists indefinitely without attenuation. GDG advice was that this is not a realistic assumption. Indeed, in our
model, it is possible for health-related utility to become negative, as follow-up extends. This happens after about 20 years in the DLB arm of our model, by which time less than 3% of the cohort remain alive. However, some of the QALYs accrued by the cohort will be
attenuated by this factor, which we believe is an appropriate reflection of the inexorable decline faced by people living with advanced Parkinson's disease.

Parkinson's disease (update) Full health economics report
NICE Internal Clinical Guidelines, 2016 61
A wide variety of evidence has been used to estimate treatment benefits associated with
DBS, including authors' assumptions, observational evidence (sometimes different sources of observational evidence for DBS and BMT arms), small patient-level series and RCTs. Notably, the CUAs that base their intervention effects on randomised evidence
tend to produce higher ICERs. We believe strongly that RCTs are the optimal form of evidence on which to base the immediate effect of an intervention and, in this field, there is reasonable-quality randomised evidence that can be used to this end. Therefore, we
have greater faith in analyses – like ours – that take maximal advantage of this evidence (indeed, as described above, our model was explicitly designed to make best use of available randomised evidence).
Despite these dissimilarities, we note that some common conclusions are shared between
most or all analyses:
Although there are big differences in absolute QALYs (see above), most CUAs agree that DBS is associated with an incremental gain of between 0.6 and 1 QALY (the exceptions
being 2 CUAs with short time-horizons, 1 that estimates much higher gains of over 3 QALYs [Kawamoto et al., 2016] and 1 that estimates much lower QALY gains for reasons that are unclear [Walter and Odin, 2015]). Our estimate of 0.729 QALYs is in the middle of
the range.
The costs of DBS surgery are not very different, despite the wide range of healthcare
systems and eras simulated. Estimates in the range £20,000–£26,000 are most common.
The previous NICE guideline clearly underestimated the cost of the procedure (possibly because it was based on evidence collected in 1998, and it is not clear that those costs were uprated to account for inflation). Our estimate is at the high end of those reported;
however, it was based on careful enumeration of relevant resource use with the surgical experts on the GDG and uses up-to-date NHS reference costs for its unit costs. Therefore, we are confident that our estimate is appropriate, and it follows that we believe
other analyses somewhat underestimate the true costs of present-day DBS insertion.
All analyses agree that DBS increases both costs and QALYs compared with BMT. No
one has found that the costs incurred in acquiring and inserting the device are wholly
recouped by savings in downstream costs. Therefore, the value provided by DBS becomes, in every case, a judgement about the acceptability of costs incurred to deliver QALY gains. With the single exception of Dams et al. (2013), all CUAs estimate a base-
case cost-per QALY of DBS compared with BMT that is either very close to or unambiguously above common thresholds for adoption in the healthcare system simulated. We can explain the outlying estimate of Dams et al. (2013) because of its very
high quality-adjusted life expectancy (see above) and what appears to be an underestimate on ongoing costs (most notably, those associated with battery replacement, which the authors based on the cost of replacing the battery in a cardiac
pacemaker). As noted in 0, our model produces an ICER of £21300 per QALY gained for DBS compared with BMT if it is configured to project indefinitely the quality of life gain observed in the year following DBS insertion. This brings it closer to some of the CUAs
that have adopted a similarly anticonservative assumption (although it takes it further from some others, notably the PDSURG economic evaluation).
Having reviewed these similarities and differences, we believe that most discrepancies
between our analysis and those produced by others can be explained. Moreover, where differences in approach appear meaningful in this way, we remain confident that the choices we have made are optimal for the representation of the disease and its treatment.
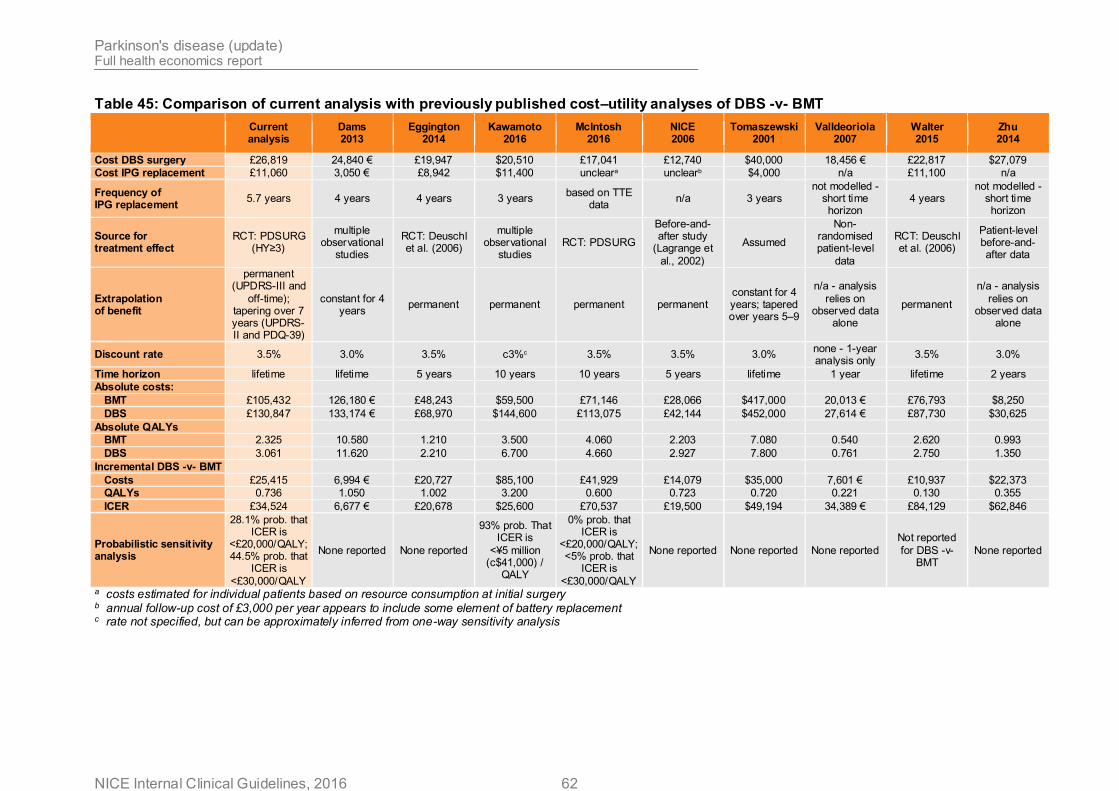
Parkinson's disease (update) Full health economics report
NICE Internal Clinical Guidelines, 2016 62
Table 45: Comparison of current analysis with previously published cost–utility analyses of DBS -v- BMT
Current analysis
Dams 2013
Eggington 2014
Kawamoto 2016
McIntosh 2016
NICE 2006
Tomaszewski 2001
Valldeoriola 2007
Walter 2015
Zhu 2014
Cost DBS surgery £26,819 24,840 € £19,947 $20,510 £17,041 £12,740 $40,000 18,456 € £22,817 $27,079
Cost IPG replacement £11,060 3,050 € £8,942 $11,400 uncleara unclearb $4,000 n/a £11,100 n/a
Frequency of IPG replacement
5.7 years 4 years 4 years 3 years based on TTE
data n/a 3 years
not modelled - short time horizon
4 years not modelled -
short time horizon
Source for treatment effect
RCT: PDSURG (HY≥3)
multiple observational
studies
RCT: Deuschl et al. (2006)
multiple observational
studies RCT: PDSURG
Before-and-after study
(Lagrange et
al., 2002)
Assumed
Non-randomised patient-level
data
RCT: Deuschl et al. (2006)
Patient-level before-and-after data
Extrapolation of benefit
permanent (UPDRS-III and
off-time); tapering over 7 years (UPDRS-II and PDQ-39)
constant for 4 years
permanent permanent permanent permanent constant for 4 years; tapered over years 5–9
n/a - analysis
relies on observed data
alone
permanent
n/a - analysis
relies on observed data
alone
Discount rate 3.5% 3.0% 3.5% c3%c 3.5% 3.5% 3.0% none - 1-year analysis only
3.5% 3.0%
Time horizon lifetime lifetime 5 years 10 years 10 years 5 years lifetime 1 year lifetime 2 years
Absolute costs:
BMT £105,432 126,180 € £48,243 $59,500 £71,146 £28,066 $417,000 20,013 € £76,793 $8,250
DBS £130,847 133,174 € £68,970 $144,600 £113,075 £42,144 $452,000 27,614 € £87,730 $30,625
Absolute QALYs
BMT 2.325 10.580 1.210 3.500 4.060 2.203 7.080 0.540 2.620 0.993
DBS 3.061 11.620 2.210 6.700 4.660 2.927 7.800 0.761 2.750 1.350
Incremental DBS -v- BMT
Costs £25,415 6,994 € £20,727 $85,100 £41,929 £14,079 $35,000 7,601 € £10,937 $22,373
QALYs 0.736 1.050 1.002 3.200 0.600 0.723 0.720 0.221 0.130 0.355
ICER £34,524 6,677 € £20,678 $25,600 £70,537 £19,500 $49,194 34,389 € £84,129 $62,846
Probabilistic sensitivity analysis
28.1% prob. that ICER is
<£20,000/QALY; 44.5% prob. that
ICER is
<£30,000/QALY
None reported None reported
93% prob. That ICER is
<¥5 million (c$41,000) /
QALY
0% prob. that ICER is
<£20,000/QALY; <5% prob. that
ICER is
<£30,000/QALY
None reported None reported None reported
Not reported
for DBS -v- BMT
None reported
a costs estimated for individual patients based on resource consumption at initial surgery b annual follow-up cost of £3,000 per year appears to include some element of battery replacement c rate not specified, but can be approximately inferred from one-way sensitivity analysis
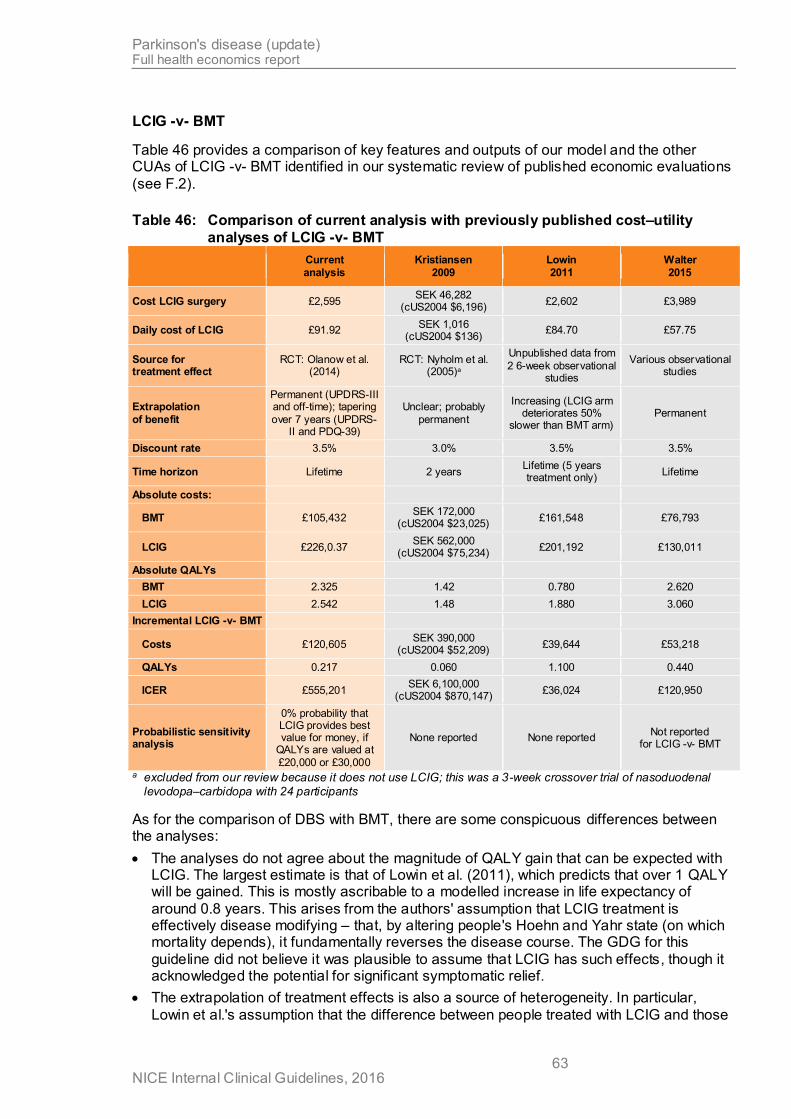
Parkinson's disease (update) Full health economics report
NICE Internal Clinical Guidelines, 2016 63
LCIG -v- BMT
Table 46 provides a comparison of key features and outputs of our model and the other CUAs of LCIG -v- BMT identified in our systematic review of published economic evaluations
(see F.2).
Table 46: Comparison of current analysis with previously published cost–utility
analyses of LCIG -v- BMT
Current
analysis
Kristiansen
2009
Lowin
2011
Walter
2015
Cost LCIG surgery £2,595 SEK 46,282
(cUS2004 $6,196) £2,602 £3,989
Daily cost of LCIG £91.92 SEK 1,016
(cUS2004 $136) £84.70 £57.75
Source for treatment effect
RCT: Olanow et al. (2014)
RCT: Nyholm et al. (2005)a
Unpublished data from
2 6-week observational studies
Various observational studies
Extrapolation
of benefit
Permanent (UPDRS-III and off-time); tapering
over 7 years (UPDRS-II and PDQ-39)
Unclear; probably
permanent
Increasing (LCIG arm deteriorates 50%
slower than BMT arm) Permanent
Discount rate 3.5% 3.0% 3.5% 3.5%
Time horizon Lifetime 2 years Lifetime (5 years treatment only)
Lifetime
Absolute costs:
BMT £105,432 SEK 172,000
(cUS2004 $23,025) £161,548 £76,793
LCIG £226,0.37 SEK 562,000
(cUS2004 $75,234) £201,192 £130,011
Absolute QALYs
BMT 2.325 1.42 0.780 2.620
LCIG 2.542 1.48 1.880 3.060
Incremental LCIG -v- BMT
Costs £120,605 SEK 390,000
(cUS2004 $52,209) £39,644 £53,218
QALYs 0.217 0.060 1.100 0.440
ICER £555,201 SEK 6,100,000
(cUS2004 $870,147) £36,024 £120,950
Probabilistic sensitivity analysis
0% probability that LCIG provides best value for money, if
QALYs are valued at
£20,000 or £30,000
None reported None reported Not reported
for LCIG -v- BMT
a excluded from our review because it does not use LCIG; this was a 3-week crossover trial of nasoduodenal levodopa–carbidopa with 24 participants
As for the comparison of DBS with BMT, there are some conspicuous differences between the analyses:
The analyses do not agree about the magnitude of QALY gain that can be expected with LCIG. The largest estimate is that of Lowin et al. (2011), which predicts that over 1 QALY will be gained. This is mostly ascribable to a modelled increase in life expectancy of
around 0.8 years. This arises from the authors' assumption that LCIG treatment is effectively disease modifying – that, by altering people's Hoehn and Yahr state (on which mortality depends), it fundamentally reverses the disease course. The GDG for this
guideline did not believe it was plausible to assume that LCIG has such effects, though it acknowledged the potential for significant symptomatic relief.
The extrapolation of treatment effects is also a source of heterogeneity. In particular,
Lowin et al.'s assumption that the difference between people treated with LCIG and those
Parkinson's disease (update) Full health economics report
NICE Internal Clinical Guidelines, 2016 64
treated with BMT will not only persist but grow year-by-year appears to lack plausible foundation.
Our model estimates that the daily cost of LCIG is somewhat greater than other authors
have acknowledged. This is because we calculate that a little under 20% of patients will require 2 cassettes of gel per day; other CUAs either overlook this complexity or rely on a lower estimate (e.g. Lowin et al., 2014, assume that the proportion is 10%).
It is notable that ours is the only model to rely on the only RCT of LCIG compared with
BMT to derive its treatment effects. This is self-evidently a much more robust basis for estimating benefits that can be expected with treatment than any of the observational data (or RCTs of interventions that are assumed to be analogous) on which other authors have
relied.
These considerations, along with the absence of relevant probabilistic analysis in other
authors' analyses, lead us to be confident that our analysis presents a more accurate
estimate of the balance of benefits, harms and costs provided by LCIG.
However, the scenario analysis described in F.4.1.7, in which we configured our model to be as similar as possible to Lowin et al.'s (2011), produced results that were strikingly similar to that analysis. We emphasise that we do not believe that this is a valid estimate of the
balance of costs and benefits provided by LCIG: for all the reasons discussed above, we strongly believe that these assumptions substantially and inappropriately bias analyses in favour of intervention (we note that, under the same conditions, DBS becomes hugely
dominant). They also necessitate reliance on very low-quality data that are likely to exaggerate treatment effects. Nevertheless, this exercise makes it clear that the substantial
differences between Lowin et al.'s analysis (2011) and ours arise from the assumptions and data we have relied on (which we assert are more realistic and robust), and not because our model is structurally incapable of arriving at estimates that appear somewhat more
favourable for LCIG.
Scottish Medicines Consortium 2016 advice
While we were in the later stages of preparing this guideline for consultation, we were made aware that the Scottish Medicines Consortium (SMC) published advice recommending LCIG as an option for people with ‘advanced levodopa-responsive Parkinson’s disease with severe motor fluctuations and hyper-/dyskinesia when available combinations of Parkinson
medicinal products have not given satisfactory results,’ with the additional restriction that it should only be available for patients who are not eligible for DBS (SMC 2016). The decision was largely based on a submission by the manufacturer of LCIG, and is contingent on the
availability of a confidential discount (‘patient access scheme’ [PAS]) offered by the manufacturer to NHS Scotland. There are multiple differences between the SMC’s principles and procedures and those followed by NICE, including that the SMC may consider additional
factors when it judges that a technology qualifies for ‘orphan’ status (as in the case of LCIG).
The manufacturer’s submission included an original health economic model that, in its base case, suggested that LCIG is associated with a health gain of 1.26 QALYs at an incremental
cost of £73,291 (without PAS), when compared with BMT, leading to a cost-per-QALY gained of £58,250 (without PAS). Equivalent figures for the analysis with PAS applied are not available, owing to the confidentiality of the discount.
We have not had access to the model itself or to a full description of its methods and results, though we sought access to any new economic models in our call for evidence (see full guideline section 10.1).
Without access to the model and/or full write up it is difficult to be certain, but from the
description of the manufacturer’s model in the SMC documentation, it appears likely that it is substantially based on the CUA published by Lowin et al. (2011). If this is the case, it is subject to many of the significant limitations of Lowin et al.’s analysis, including: reliance on
Parkinson's disease (update) Full health economics report
NICE Internal Clinical Guidelines, 2016 65
observational evidence to estimate treatment effects (noting that good-quality randomised evidence now exists); assumed independence of Hoehn and Yahr transition and off-time reduction; a base-case assumption that short-term treatment benefit is preserved indefinitely
for Hoehn and Yahr state, whereas off-time benefit increases as time goes on (at least in Lowin et al.’s formulation, this assumption is poorly substantiated). In common with Lowin et al.’s model discussed above, the model also structurally assumes that LCIG has a large
disease-modifying effect, so it is also very likely that a substantial impact on average life expectancy is predicted (which the GDG for this guideline found implausible).
However, some of the other limitations of Lowin et al.’s analysis that are noted elsewhere in this appendix are not present in this model: the derivation of health-state utilities appears to be different (and may well represent an improvement over Lowin et al.’s methods, which used unpublished data based on very few people measured in a quarter of the model’s
possible states) and SMC documentation notes that probabilistic sensitivity analysis was provided (though no details of methods or results are given).
On balance, it appears (from the incomplete information available to us) that the limitations of the analysis presented to the SMC would tend to bias results in favour of LCIG and,
therefore, it is unsurprising that the results of the analysis are more favourable to LCIG than those we estimated. It is possible that the PAS offered by the manufacturer provides a
significant enough discount that the SMC could be confident that adoption would represent a reasonable use of NHS Scotland’s resources. However, our model suggests that LCIG would have to be made available at a cost not exceeding 20% of its current list price before it could
be recommended for use in the English NHS.

Parkinson's disease (update) Full health economics report
NICE Internal Clinical Guidelines, 2016 66
F.6 References
All Wales Medicines Strategy Group (AWMSG). Final Appraisal Report – Co-careldopa intestinal gel (Duodopa®) August 2007.
http://www.awmsg.org/awmsgonline/app/appraisalinfo/94
Altman DG, Bland JM. Interaction revisited: the difference between two estimates. BMJ. 2003 Jan 25;326(7382):219.
Bojke L, Claxton K, Sculpher M, Palmer S. Characterizing structural uncertainty in decision analytic models: a review and application of methods. Value in Health. 2009 Jul 1;12(5):739-49.
Caslake R, Taylor K, Scott N, Gordon J, Harris C, Wilde K, Murray A, Counsell C. Age-, gender-, and socioeconomic status-specific incidence of Parkinson's disease and
parkinsonism in northeast Scotland: the PINE study. Parkinsonism Relat Disord. 2013 May;19(5):515-21
Dams,J., Siebert,U., Bornschein,B., Volkmann,J., Deuschl,G., Oertel,W.H., Dodel,R. Cost-effectiveness of deep brain stimulation in patients with Parkinson's disease. Mov.Disord. 2013;28(6):763-71.
Dams J, Klotsche J, Bornschein B, i in. Mapping the EQ-5D index by UPDRS and PDQ-8 in patients with Parkinson’s disease. Health and Quality of Life Outcomes. 2013; 11(1):35.
Dams,J. et al. Cost-Effectiveness of Subthalamic Deep Brain Stimulation in Patients with Early Complications of Parkinson’s Disease (EARLYSTIM-Study). Mov.Disord. 2016 (in print).
Deuschl,G., Schade-Brittinger,C., Krack,P., Volkmann,J., Schafer,H., Botzel,K., Daniels,C., Deutschlander,A., Dillmann,U., Eisner,W., Gruber,D., Hamel,W., Herzog,J., Hilker,R., Klebe,S., Kloss,M., Koy,J., Krause,M., Kupsch,A., Lorenz,D., Lorenzl,S., Mehdorn,H.M., Moringlane,J.R., Oertel,W., Pinsker,M.O., Reichmann,H., Reuss,A., Schneider,G.H.,
Schnitzler,A., Steude,U., Sturm,V., Timmermann,L., Tronnier,V., Trottenberg,T., Wojtecki,L., Wolf,E., Poewe,W., Voges,J., German Parkinson Study Group,Neurostimulation Section, A randomized trial of deep-brain stimulation for Parkinson's disease. New England Journal of
Medicine. 2006 355 p896-908
Eggington,S., Valldeoriola,F., Chaudhuri,K.R., Ashkan,K., Annoni,E. The cost-effectiveness of deep brain stimulation in combination with best medical therapy, versus best medical
therapy alone, in advanced Parkinson's disease. J Neurol 2014;261(1):106-16.
Espay,A.J., Vaughan,J.E., Marras,C., Fowler,R. Early versus delayed bilateral subthalamic deep brain stimulation for parkinson's disease: a decision analysis. Mov.Disord. 2010;25(10):1456-63.
Fernandez HH, Standaert DG, Hauser RA, Lang AE, Fung VS, Klostermann F, Lew MF, Odin P, Steiger M, Yakupov EZ, Chouinard S. Levodopa‐carbidopa intestinal gel in advanced
Parkinson's disease: Final 12‐month, open‐label results. Movement Disorders. 2015 Apr
1;30(4):500-9.
Findley,L.J.; Wood,E.; Lowin.J.; Roeder,C.; Bergman,A.; Schifflers,M. The economic burden of advanced PD: an analysis of a UK patient dataset. Journal of Medical Economics (2011) 14(1).p130-9
Forsaa EB, Larsen JP, Wentzel-Larsen T, i in. What predicts mortality in Parkinson disease?: a prospective population-based long-term study. Neurology. 2010; 75(14):1270–1276.

Parkinson's disease (update) Full health economics report
NICE Internal Clinical Guidelines, 2016 67
Hoehn MM, Yahr MD. Parkinsonism: onset, progression and mortality. Neurology. 1967 May;17(5):427-42.
Joint Formulary Committee. NHS Drugs Tariff (2016).
Lagrange E, Krack P, Moro E, Ardouin C, Van Blercom N, Chabardes S, Benabid AL, Pollak P. Bilateral subthalamic nucleus stimulation improves health-related quality of life in PD. Neurology December 24, 2002 vol. 59 no. 12 1976-1978
Lowin,J.; Bergman,A.; Chaudhuri,K.R.; Findley,L.J.; Roeder,C.; Schifflers,M.; Wood,E.; Morris,S. A cost-effectiveness analysis of levodopa/carbidopa intestinal gel compared to
standard care in late stage Parkinson's disease in the UK. Journal of Medical Economics 2011;14(5):584-93
Lundqvist,C., Beiske,A.G., Reiertsen,O. Real life cost and quality of life associated with
continuous intraduodenal levodopa infusion compared with oral treatment in Parkinson patients. Journal of Neurology 2014;261(12):2438-45.
Kaltenboeck,A., Johnson,S.J., Davis,M.R., Birnbaum,H.G., Carroll,C.A., Tarrants,M.L. Direct costs and survival of medicare beneficiaries with early and advanced Parkinson's
disease. Parkinsonism & Related Disorders 2012;18(4):321-26
Kamusheva,M.S. & Gerasimov,N. Intestinal gel Levodopa + Carbidopa in Parkinson's patients with frequent and prolonged akinesia - an economic evaluation. International Journal
of Pharmaceutical Sciences Review and Research.22 (1) (pp 244-246), 2013.
Kristiansen,I.S.; Bingefors,K.; Nyholm,D.; Isacson,D. Short-term cost and health consequences of duodenal levodopa infusion in advanced Parkinson’s Disease in Sweden: an exploratory study. Applied Health Economics and Health Policy 2009; 7 (3): 167-80
Macleod AD, Taylor KS, Counsell CE. Mortality in Parkinson's disease: a systematic review and meta-analysis. Mov Disord. 2014 Nov;29(13):1615-22.
Macleod, A.D., Counsell, C.E.; Predictors of institutionalisation in an incidence‐based cohort
of Parkinson's disease [abstract]. Movement Disorders 2015;30 Suppl 1 :2017
Marras C, McDermott MP, Rochon PA, i in. Survival in Parkinson disease: thirteen-year follow-up of the DATATOP cohort. Neurology. 2005; 64(1):87–93.
Marttila RJ, Rinne UK. Disability and progression in Parkinson's disease. Acta Neurol Scand. 1977 Aug;56(2):159-69.
McIntosh, E., Gray, A., Daniels, J., Gill, S., Ives, N., Jenkinson, C., Mitchell, R., Pall, H., Patel, S., Quinn, N., Rick, C., Wheatley, K., Williams, A. and on behalf of The PD SURG Collaborators Group (2016), Cost-utility analysis of deep brain stimulation surgery plus best
medical therapy versus best medical therapy in patients with Parkinson's: Economic evaluation alongside the PD SURG trial. Mov. Disord. doi: 10.1002/mds.26423
National Institute for Health and Clinical Excellence (NICE) (2006) Parkinson’s disease: diagnosis and management in primary and secondary care. Clinical Guideline No. 35
National Institute for Health and Care Excellence (NICE) (2012) The Guidelines Manual
Nyholm D, Nilsson R, Dizdar N, Constantinescu R, Holmberg B, Jansson R, Aquilonius SM, Askmark H. Duodenal levodopa infusion monotherapy vs oral polypharmacy in advanced
Parkinson Disease. Neurology 2005; 64: 216-23
Nyholm D, Lewander T, Johansson A, Lewitt PA, Lundqvist C, Aquilonius SM. Enteral levodopa/carbidopa infusion in advanced Parkinson disease: long-term exposure. Clin Neuropharmacol. 2008 Mar-Apr;31(2):63-73

Parkinson's disease (update) Full health economics report
NICE Internal Clinical Guidelines, 2016 68
Olanow CW, Kieburtz K, Odin P, Espay AJ, Standaert DG, Fernandez HH, Vanagunas A, Othman AA, Widnell KL, Robieson WZ, Pritchett Y, Chatamra K, Benesh J, Lenz RA, Antonini A; LCIG Horizon Study Group. Continuous intrajejunal infusion of levodopa-
carbidopa intestinal gel for patients with advanced Parkinson's disease: a randomised, controlled, double-blind, double-dummy study. Lancet Neurol. 2014 Feb;13(2):141-9.
Palmer C, Schmier J, Snyder EH, Scott B. Patient preferences and utilities for ‘off-time’
outcomes in the treatment of Parkinson’s disease. Qual Life Res 2000; 9: 819-27
Palmer CS, Nuijten MJ, Schmier JK, Subedi P, Snyder EH. Cost effectiveness of treatment of Parkinson’s disease with entacapone in the United States. Pharmacoeconomics. 2002 Aug 1;20(9):617-28.
Porter B, Henry SR, Gray WK, i in. Care requirements of a prevalent population of people with idiopathic Parkinson’s disease. Age and Ageing. 2010; 39(1):57–61.
Scottish Medicines Consortium (SMC). Co-careldopa intestinal gel, 20mg/5mg levodopa/carbidopa per ml for continuous intestinal infusion, (Duodopa). No. (316/06). 2006
https://www.scottishmedicines.org.uk/files/co-careldopa_intestinal_gel_Duodopa_316_06.pdf
Schuepbach WM, Rau J, Knudsen K, Volkmann J, Krack P, Timmermann L, Hälbig TD, Hesekamp H, Navarro SM, Meier N, Falk D, Mehdorn M, Paschen S, Maarouf M, Barbe MT, Fink GR, Kupsch A, Gruber D, Schneider GH, Seigneuret E, Kistner A, Chaynes P, Ory-
Magne F, Brefel Courbon C, Vesper J, Schnitzler A, Wojtecki L, Houeto JL, Bataille B, Maltête D, Damier P, Raoul S, Sixel-Doering F, Hellwig D, Gharabaghi A, Krüger R, Pinsker MO, Amtage F, Régis JM, Witjas T, Thobois S, Mertens P, Kloss M, Hartmann A, Oertel WH,
Post B, Speelman H, Agid Y, Schade-Brittinger C, Deuschl G; EARLYSTIM Study Group. Neurostimulation for Parkinson's disease with early motor complications. N Engl J Med. 2013
Feb 14;368(7):610-22.
Shan,D.E., Wu,H.C., Chan,L.Y. Cost-utility analysis of Parkinson's disease. Acta neurol.taiwan. 2011;20(1):65-72.
Slevin JT, Fernandez HH, Zadikoff C, Hall C, Eaton S, Dubow J, Chatamra K, Benesh J. Long-term safety and maintenance of efficacy of levodopa-carbidopa intestinal gel: an open-
label extension of the double-blind pivotal study in advanced Parkinson's disease patients. Journal of Parkinson's disease. 2015 Jan 1;5(1):165-74.
Stroupe,K.T., Weaver,F.M., Cao,L., Ippolito,D., Barton,B.R., Burnett-Zeigler,I.E., et al. Cost of deep brain stimulation for the treatment of Parkinson's disease by surgical stimulation sites. Mov.Disord. 2014;29(13):1666-74.
Therneau T, Crowson C, Atkinson E. Using time dependent covariates and time dependent coefficients in the cox model. Survival Vignettes. 2016 May 10.
Tomaszewski KJ, Holloway RG. Deep brain stimulation in the treatment of Parkinson’s disease: A cost effectiveness analysis. Neurology. 2001; 57(4):663–671
Valldeoriola,F., Morsi,O., Tolosa,E., Rumia,J., Marti,M.J. Prospective comparative study on cost-effectiveness of subthalamic stimulation and best medical treatment in advanced
Parkinson's disease. Mov.Disord. 2007;22(15):2183-91.
Von Hippel PT. Regression with missing Ys: An improved strategy for analyzing multiply imputed data. Sociological Methodology. 2007 Dec 1;37(1):83-117.
Walter,E. and Odin,P. Cost-effectiveness of continuous subcutaneous apomorphine in the
treatment of Parkinson's disease in the UK and Germany. Journal of Medical Economics 2015;18(2):155-65

Parkinson's disease (update) Full health economics report
NICE Internal Clinical Guidelines, 2016 69
Williams,A., Gill,S., Varma,T., Jenkinson,C., Quinn,N., Mitchell,R., et al. Deep brain stimulation plus best medical therapy versus best medical therapy alone for advanced Parkinson's disease (PD SURG trial): a randomised, open-label trial. Lancet Neurology
2010;9(6):581-91.
Zhu,X.L., Chan,D.T., Lau,C.K., Poon,W.S., Mok,V.C., Chan,A.Y., et al. Cost-effectiveness of subthalmic nucleus deep brain stimulation for the treatment of advanced Parkinson disease
in Hong Kong: a prospective study. World Neurosurg 2014;82(6):987-93.

Parkinson's disease (update) Full health economics report
NICE Internal Clinical Guidelines, 2016 70
F.7 Economic evidence tables
F.7.1 First-line pharmacological treatment of motor symptoms
Study, Population, Country and
Quality Data Sources Other Comments
Incremental
Conclusions Uncertainty Cost Effect ICER
Farkouh et al.2012
People with early Parkinson’s disease
rasagiline, pramipexole, ropinirole (std and
XL) or levodopa
USA
Effects: Hauser et al. 2009 (rasagiline v placebo); Rascol et al. 2000 (ropinirole v levodopa). Not synthesised
Costs: USA drug costs and non-drug costs. 1.7x higher for with dyskinesias (based on
European data). $2010
Utilities: Via assumed H&Y stage and off time (Palmer et al. 2000)
Markov model, 5 year horizon
All therapies switched to other single drugs rather than adding
levodopa
People assumed to be
H&Y stage 1.5
Discounted at 3%
Funded by industry
versus
Pramipexole
-$833
Ropinirole
(std)
$2692
Ropinirole (XL)
-$3140
Levodopa
-$571
versus
Pramipexole
0.10
Ropinirole
(std)
0.10
Ropinirole (XL)
0.10
Levodopa
0.24
versus
Pramipexole
Dominates
Ropinirole
(std)
$25,900/ QALY
Ropinirole (XL)
Dominates
Levodopa
Dominates
Rasagiline is predicted to be a cost-effective strategy ropinirole (XL), pramipexole, ropinirole (std) or
levodopa
In limited OSA (rasagiline v. ropinirole (std)), ICER sensitive to dyskinesia cost (ICER $52,500 if no multiplier) and utility weights (ICER $52,400 if
alternatives used)
In pairwise PSA, rasagiline cost-effective compared with ropinirole (std) in
61% of iterations
Partially applicable a,b,c.d
Very serious limitations g,h,i,j,k,p,q,r,s,t,v
Haycox et al.2009
People with early Parkinson’s disease
Rasagiline versus pramipexole
UK
Effects: Hauser et al. 2009 (rasagiline v placebo), Holloway et al. 2004 (pramipexole v
placebo)
Costs: Findley et al. (2003) and other sources. Include private
expenditure. £2007
Utilities: Palmer et al.
Markov model, 5 year horizon
All therapies switched to other drugs rather than adding
levodopa
People assumed to be
-£3931 0.83 QALYs Dominated Rasagiline is a dominant therapy in early idiopathic Parkinson’s disease compared with
pramipexole
In limited OSA (pramipexole dosage and utilities only) the dominance of rasagiline over pramipexole was
maintained
No PSA reported
Partially applicable b,c,d,e,f

Parkinson's disease (update) Full health economics report
NICE Internal Clinical Guidelines, 2016 71
Study, Population, Country and
Quality Data Sources Other Comments
Incremental
Conclusions Uncertainty Cost Effect ICER
Very serious limitations g,h,i,l,m,n,o,p,s,u,v
(2000). Assumed same when on monotherapy, reduces when dyskinesias occur (on
levodopa only)
H&Y stage 2
Discounted at 6% (costs) and
1.5% (utilities)
Funded by industry
a Not UK based analysis
b Utilities taken from study used visual analogue and standard gamble techniques, not EQ-5D
c Costs and QALYs not discounted at 3.5%
d Analysis does not cover all options within decision space
e Baseline populations differ between RCTs used
f Timing of ability to add levodopa monotherapy differed between RCTs used
g Potentially short time horizon for given condition
h Clinical evidence not selected systematically, may be prone to selection bias
i RCTs not synthesised appropriately
j Only development of dyskinesias considered as clinical outcome
k Costs taken from USA sources, may not be relevant to UK setting
l Costs indirectly assumed from H&Y and off times to treatment based model states
m Costs include private expenditure
n No cost given for levodopa treatment
o Costs not inflated correctly
p Utilities indirectly assumed from H&Y and off times to treatment based model states
q Unable to calculate fully incremental comparison from results presented
r Limited OSA reported
s OSA only varied parameters by 10%, may not capture full extent of variation
t Limited PSA reported
u No PSA reported
v Potential conflict of interest
Abbreviations
H&Y: Hoehn and Yahr stage
ICER: incremental cost-effectiveness ratio
OSA: one way sensitivity analysis
PSA: probabilistic sensitivity analysis
QALY: quality adjusted life year
RCT: randomised controlled trial
Std: standard release
UK: United Kingdom
USA: United States of America
XL: extended release

Parkinson's disease (update) Full health economics report
NICE Internal Clinical Guidelines, 2016 72
F.7.2 Adjuvant pharmacological treatment of motor symptoms
Study, population, country and quality Data sources
Other comments
Incremental
Conclusions Uncertainty Cost Effect (QALYs) ICER
Findley et al. 2005
People with Parkinson’s disease and end-of-dose motor
fluctuations
Stalevo (LCE)
versus “standard care” (levodopa/carbidopa)
UK
Effects: Parkinson Study Group 1997 (entacapone vs placebo); Rinne et al. 1998 (entacapone vs placebo). Transition probabilities based on
H&Y
Costs: 1998 UK cross-sectional study for H&Y
costs inflated to 2003
Medication doses from studies “adjusted in accordance with the authors’ personal clinical expertise.” NHS drug prices from January 2005. Two analyses; one from an NHS and one a societal
perspective
Utilities: Estimated via H&Y stage (Schrag et
al. 2000)
Markov model, 10-year horizon, 6-month cycle
length
Both arms could be “with or without other antiparkinsonian
medications”
Stalevo assumed to reduce daily levodopa requirement by
10%
Initial H&Y distribution from fluctuating PD patients in a Finnish burden
of illness study
Discounted at 3.5%
Funded by manufacturer of Stalevo
Based on Linna et al. model described below
NHS perspective
Standard care
£22,517
Stalevo
£25,756
Incremental
£3,239
Standard care
1.524
Stalevo
2.567
Incremental
1.043
£3,105 per QALY
“It would seem reasonable to anticipate from these UK-derived estimates that LCE therapy is likely to be a highly cost-effective therapy for
PD”
Univariate sensitivity analysis of discount rates and time horizon. Using 0% discount rate, 5% discount rates or a 5-year time horizon, Stalevo remains
cost-effective
In the PSA, Stalevo has a 93% probability of being cost-effective versus
standard care Partially
applicablea,b,c
Very serious limitationsf,g,h,i,j,k,l,m,n
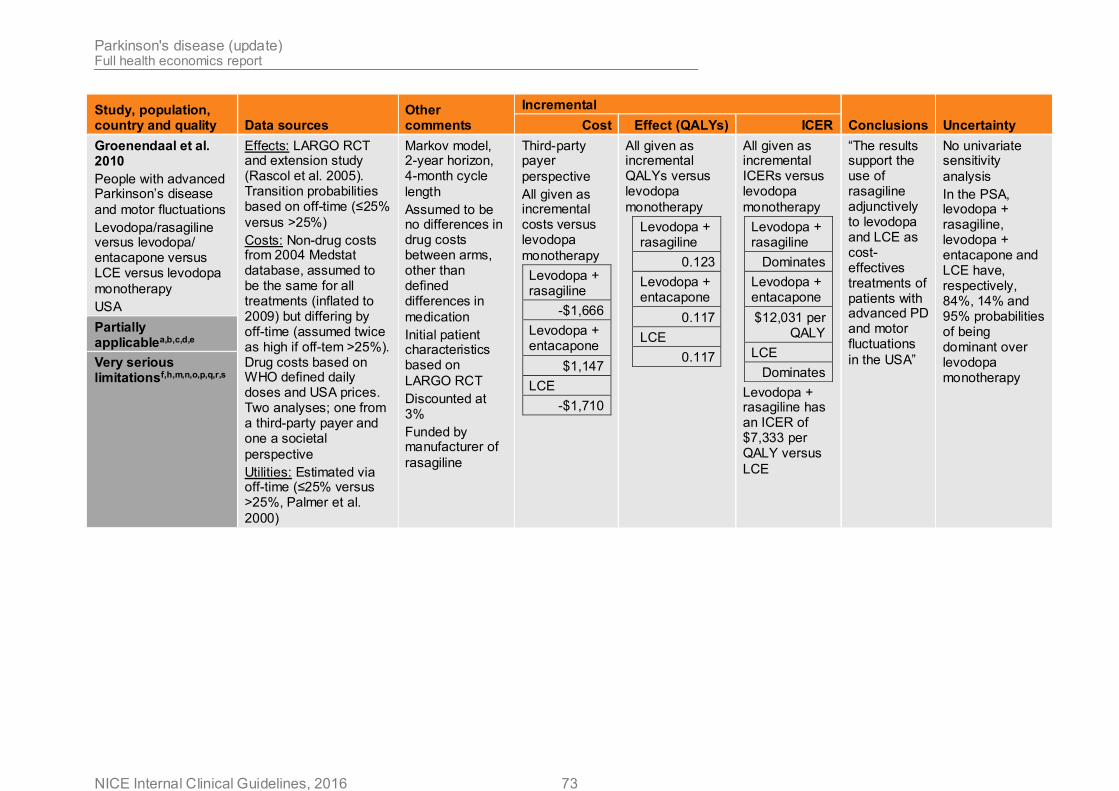
Parkinson's disease (update) Full health economics report
NICE Internal Clinical Guidelines, 2016 73
Study, population, country and quality Data sources
Other comments
Incremental
Conclusions Uncertainty Cost Effect (QALYs) ICER
Groenendaal et al. 2010
People with advanced Parkinson’s disease
and motor fluctuations
Levodopa/rasagiline versus levodopa/ entacapone versus LCE versus levodopa
monotherapy
USA
Effects: LARGO RCT and extension study (Rascol et al. 2005). Transition probabilities based on off-time (≤25%
versus >25%)
Costs: Non-drug costs from 2004 Medstat database, assumed to be the same for all treatments (inflated to 2009) but differing by off-time (assumed twice as high if off-tem >25%). Drug costs based on WHO defined daily doses and USA prices. Two analyses; one from a third-party payer and one a societal
perspective
Utilities: Estimated via off-time (≤25% versus >25%, Palmer et al.
2000)
Markov model, 2-year horizon, 4-month cycle
length
Assumed to be no differences in drug costs between arms, other than defined differences in
medication
Initial patient characteristics based on
LARGO RCT
Discounted at 3%
Funded by manufacturer of
rasagiline
Third-party payer
perspective
All given as incremental costs versus levodopa
monotherapy
Levodopa + rasagiline
-$1,666
Levodopa + entacapone
$1,147
LCE
-$1,710
All given as incremental QALYs versus levodopa
monotherapy
Levodopa + rasagiline
0.123
Levodopa + entacapone
0.117
LCE
0.117
All given as incremental ICERs versus levodopa
monotherapy
Levodopa + rasagiline
Dominates
Levodopa + entacapone
$12,031 per QALY
LCE
Dominates
Levodopa + rasagiline has an ICER of $7,333 per QALY versus
LCE
“The results support the use of rasagiline adjunctively to levodopa and LCE as cost-effectives treatments of patients with advanced PD and motor fluctuations
in the USA”
No univariate sensitivity
analysis
In the PSA, levodopa + rasagiline, levodopa + entacapone and LCE have, respectively, 84%, 14% and 95% probabilities of being dominant over levodopa monotherapy
Partially applicablea,b,c,d,e
Very serious limitationsf,h,m,n,o,p,q,r,s

Parkinson's disease (update) Full health economics report
NICE Internal Clinical Guidelines, 2016 74
Study, population, country and quality Data sources
Other comments
Incremental
Conclusions Uncertainty Cost Effect (QALYs) ICER
Hudry et al. 2006
People with Parkinson’s disease
and motor fluctuations
Levodopa/rasagiline versus levodopa/ entacapone versus
levodopa monotherapy
Finland
Effects: LARGO RCT (Rascol et al. 2005). Transition probabilities based on off-time (≤25%
versus >25%)
Costs: Non-drug costs from 2003 Finnish burden of illness study, differing by off-time (assumed twice as high if off-tem >25%). Drug costs based on WHO defined daily doses and
Finnish prices
Two analyses; one from a third-party payer and one a societal
perspective
Utilities: Estimated via off-time (≤25% versus >25%, Palmer et al.
2000)
Markov model, 2-year horizon, 4-month cycle
length
Assumed to be no differences in drug costs between arms, other than defined differences in
medication
Initial patient characteristics taken from Palmer et al.
2000
Discounted at 5%
Funded by manufacturer of
rasagiline
Third-party payer
perspective
All given as incremental costs versus levodopa
monotherapy
Levodopa + rasagiline
€2,130
Levodopa + entacapone
€2,170
All given as incremental QALYs versus levodopa
monotherapy
Levodopa + rasagiline
0.13
Levodopa + entacapone
0.21
All given as incremental ICERs versus levodopa
monotherapy
Levodopa + rasagiline
€17,800 per QALY
Levodopa + entacapone
€18,600 per
QALY
Levodopa + rasagiline dominates levodopa +
entacapone
“Despite some inherent limitations, this economic model supports the use of rasagiline and entacapone as cost-effective treatments alternatives in PD patients with motor
fluctuations”
Best and worst- case scenarios
reported only.
In worst-case scenario, levodopa + rasagiline has an ICER of €51,700
per QALY
No PSA reported
Partially applicablea,b,c,d,e
Very serious
limitationsf,h,i,n,o,p,q,s,t

Parkinson's disease (update) Full health economics report
NICE Internal Clinical Guidelines, 2016 75
Study, population, country and quality Data sources
Other comments
Incremental
Conclusions Uncertainty Cost Effect (QALYs) ICER
Linna et al. 2002
People with Parkinson’s disease
and motor fluctuations
Levodopa/entacapone versus levodopa
monotherapy
Finland
Effects: Parkinson Study Group 1997 (entacapone vs placebo); Rinne et al. 1998 (entacapone vs placebo). Transition probabilities based on
H&Y
Costs: Non-drug costs from 2003 Finnish burden of illness study, stratified by H&Y. Healthcare payer perspective. Analysed in 1998 Finnish Marks and converted to Euros
Utilities: Based on a 2004 Finnish burden of illness stud - used the 15D utility instrument
Markov model, 5-year horizon, 6-month cycle
length
Assumed to be no differences in drug costs between arms, other than defined differences in
medication
Initial patient characteristics
not specified
Discounted at 3% and 5%
No conflicts of interest reported
3% discount rate
Levodopa
€53,100
Levodopa + entacapone
€37,600
Incremental
-€15,500
5% discount
rate
Levodopa
€46,300
Levodopa + entacapone
€34,800
Incremental
-€15,500
3% discount rate
Levodopa
2.625
Levodopa + entacapone
2.731
Incremental
0.106
5% discount rate
Levodopa
2.391
Levodopa + entacapone
2.475
Incremental
0.084
Using either discount rate, levodopa + entacapone dominates levodopa
monotherapy
“Entacapone as an adjunctive treatment to levodopa is both cost-saving and increases the quality of life of Parkinson’s disease
patients”
No univariate sensitivity
analysis
In the PSA, at discount rates of 3% and 5% respectively, levodopa + entacapone has 86% and 83% probabilities of dominating levodopa
monotherapy
Partially applicablea,b,c,d,e
Very serious limitationsf,g,i,j,k,m,r,s
Palmer et al. 2002
Patients with Parkinson’s disease who experience “off-
time”
Levodopa/entacapone versus levodopa
monotherapy
USA
Effects: Parkinson Study Group 1997 (entacapone vs placebo); Rinne et al. 1998 (entacapone vs placebo). Transition probabilities based on off-time (≤25% versus >25%)
Markov model, 5-year horizon, 6-month cycle
length
Assumed to be no differences in drug costs between arms, other than
Direct medical costs
Levodopa
$41,020
Levodopa + entacapone
$44,202
Levodopa
2.44
Levodopa + entacapone
2.59
Incremental
0.15
$21,213 per QALY
“Treatment with entacapone appear to be cost-effective when compared with standard treatment”
Results from univariate sensitivity analyses show that the model is most sensitive to the amount of off-time experienced by

Parkinson's disease (update) Full health economics report
NICE Internal Clinical Guidelines, 2016 76
Study, population, country and quality Data sources
Other comments
Incremental
Conclusions Uncertainty Cost Effect (QALYs) ICER
Partially applicablea,b,c,d,e
Costs: Drug doses taken from administrative database. Healthcare resource use, stratified by off-time, estimated from mail survey of clinical experts. Unit costs applied to these estimates. Two analyses; one direct medical costs and one a
societal perspective
Utilities: Estimated via off-time (≤25% versus >25%, Palmer et al.
2000)
defined differences in
medication
Initial patient characteristics taken from
efficacy RCTs
Discounted at 3%
Funded by manufacturer of
entacapone
Incremental
$3,183
people in the
model
No PSA reported Very serious limitationsf,g,h,n,o,p,q,s,t
van Boven et al. 2014
Patients with Parkinson’s disease who experience “off-
time”
Ropinirole prolonged release versus ropinirole immediate
release
Netherlands
Effects: Taken from the PREPARED study (Stocchi et al. 2011). Transition probabilities based on H&Y and off-time (≤25% versus >25%). Also includes data on dyskinesia (based on levodopa dose) and adherence (based on number of doses) from external
Markov model, 5-year horizon, 6-month cycle
length
Initial patient characteristics taken from
efficacy RCT
Costs discounted at 4%. QALYs discounted at
Immediate release
ropinirole
€87,300
Prolonged release
ropinirole
€78,400
Incremental
-€8,900
Immediate release
ropinirole
2.31
Prolonged release
ropinirole
2.39
Incremental
0.08
Prolonged release ropinirole dominates immediate release
ropinirole
“Ropinirole prolonged release has the potential to be a cost-saving treatment compared with ropinirole immediate release in the
Results from univariate sensitivity analyses show that the model is most sensitive to utilities in H&Y 2 and 3, and assumptions made about improvements in dyskinesia and Partially
applicableb,d,e
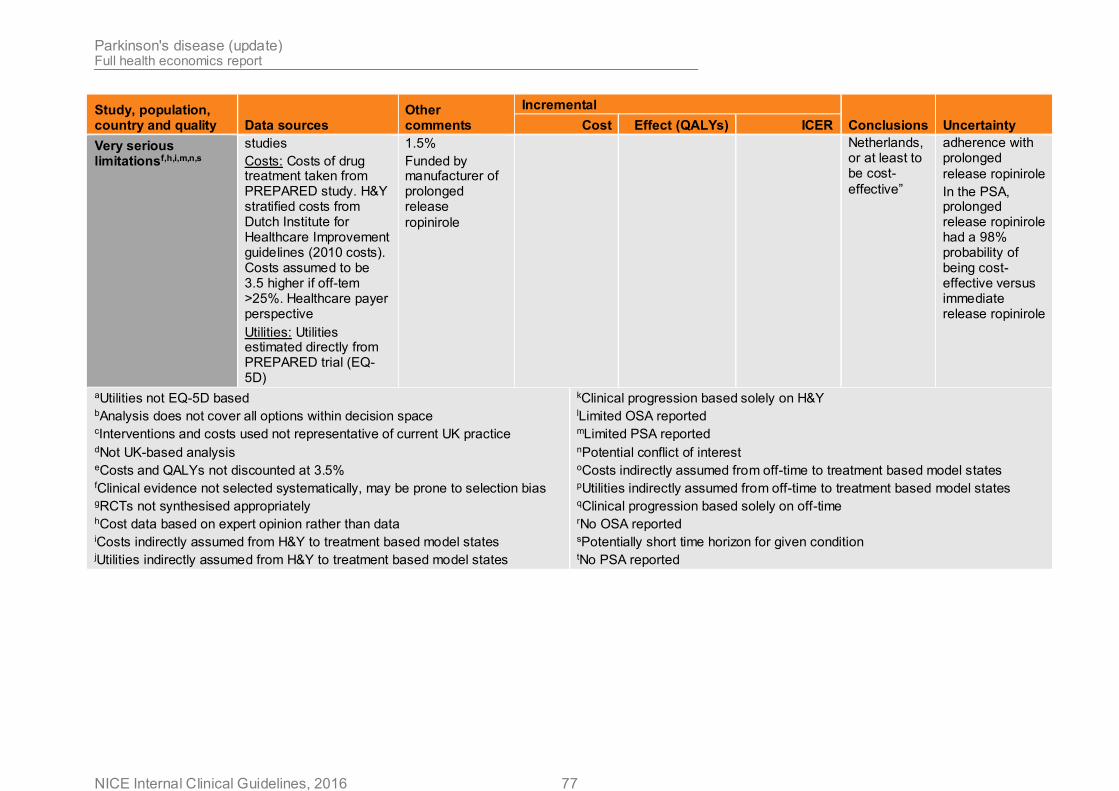
Parkinson's disease (update) Full health economics report
NICE Internal Clinical Guidelines, 2016 77
Study, population, country and quality Data sources
Other comments
Incremental
Conclusions Uncertainty Cost Effect (QALYs) ICER
Very serious limitationsf,h,i,m,n,s
studies
Costs: Costs of drug treatment taken from PREPARED study. H&Y stratified costs from Dutch Institute for Healthcare Improvement guidelines (2010 costs). Costs assumed to be 3.5 higher if off-tem >25%. Healthcare payer perspective
Utilities: Utilities estimated directly from PREPARED trial (EQ-5D)
1.5%
Funded by manufacturer of prolonged release
ropinirole
Netherlands, or at least to be cost-
effective”
adherence with prolonged
release ropinirole
In the PSA, prolonged release ropinirole had a 98% probability of being cost-effective versus immediate release ropinirole
aUtilities not EQ-5D based bAnalysis does not cover all options within decision space
cInterventions and costs used not representative of current UK practice dNot UK-based analysis eCosts and QALYs not discounted at 3.5% fClinical evidence not selected systematically, may be prone to selection bias gRCTs not synthesised appropriately hCost data based on expert opinion rather than data iCosts indirectly assumed from H&Y to treatment based model states jUtilities indirectly assumed from H&Y to treatment based model states
kClinical progression based solely on H&Y lLimited OSA reported mLimited PSA reported nPotential conflict of interest oCosts indirectly assumed from off-time to treatment based model states pUtilities indirectly assumed from off-time to treatment based model states qClinical progression based solely on off-time rNo OSA reported sPotentially short time horizon for given condition tNo PSA reported

Parkinson's disease (update) Full health economics report
NICE Internal Clinical Guidelines, 2016 78
Study, population, country and quality Data sources
Other comments
Incremental
Conclusions Uncertainty Cost Effect (QALYs) ICER
Abbreviations
H&Y: Hoehn and Yahr stage
ICER: incremental cost-effectiveness ratio
OSA: one way sensitivity analysis
PSA: probabilistic sensitivity analysis
QALY: quality adjusted life year
RCT: randomised controlled trial
UK: United Kingdom
USA: United States of America
Parkinson's disease (update) Full health economics report
NICE Internal Clinical Guidelines, 2016 79
F.7.3 Orthostatic hypertension
Study, population, country and quality Data sources Other comments
Incremental
Conclusions Uncertainty Cost Effect ICER
François et al. 2016
Droxidopa -v- standard care for patients with symptomatic neurogenic orthostatic hypotension caused by primary autonomic
failure
USA
Effects: 2 10-wk RCTs; Hauser et al. 2014; Hauser et al. 2015; synthesis
methods not stated
Costs: 2014$US; direct payer perspective with assumed patient co-payment for droxidopa prescriptions. Cost of falls from multiple sources (inc. 1 Australian paper with costs converted
to $US)
Utilities: Baseline utility (PD H&Y2; 0.7) from Siderowf et al. 2002. Disutilities associated with falls and subsequent fear of falling (assumed to have an impact for 26 weeks) (Iglesias et al., 2009). Improvement in symptomatic control for responders assumed equivalent to difference between
H&Y2.5 and H&Y1.5.
Not explicitly a model of PD, but based on RCTs in
people with PD.
1-week cycle length; 1-year time horizon (hence no
discounting)
Droxidopa arm = 6 months of treatment (extrapolated from 10-wk evidence) followed by 6 months of standard
care.
Funded by industry
$15,587
(+$30,112 for droxidopa; −$14,574 for fall-related
costs)
0.33 QALYs
$47,001 /QALY
'Using 10-week clinical trial data, droxidopa appears to be a cost-effective option compared with standard of care for the treatment of patients with nOH from a US payer perspective, based on the savings associated with avoiding falls and fall- related injuries.'
PSA: 53.4% probability ICER is
≤$50,000/QALY
OSA: Limited range of variables explored. Lower
underlying fall probabilities, shorter fear of falling duration and lower fear disutilities were associated with ICERs >$70,000/QALY.
Partially applicablea,b,c.d,e
Very serious limitationsf,g,h,i
Notes
a Not UK-based analysis
b Theoretical population appears to include people without PD
c Patient co-payment assumed
d Relevant comparators omitted (esp. midodrine, fludrocortisone and domperidone)
e Heterogeneous sources of utility data; some appear not to match reference case requirements for societal valuation
f HRQoL benefit of response to treatment assumed without evidence
g Short time horizon, especially since fall-related mortality is considered
h Limited OSA reported
i Potential conflict of interest
Abbreviations
H&Y: Hoehn and Yahr stage
ICER: incremental cost-effectiveness ratio
OSA: one-way sensitivity analysis
PSA: probabilistic sensitivity analysis
QALY: quality-adjusted life year

Parkinson's disease (update) Full health economics report
NICE Internal Clinical Guidelines, 2016 80
F.7.4 Pharmacological management of dementia associated with Parkinson’s disease
Study, population, country and
quality Data sources Other comments
Incremental
Conclusions Uncertainty Cost Effect ICER
Gustavsson et al., 2009
DLB (PDD excluded)
UK perspective
Effects: MMSE for AChEIs from UK observational audit for 4-mo treatment effect; MMSE for controls assumed. Extrapolated to 5 years using Scandinavian longitudinal study in AD. Additional noncognitive symptoms (extra-pyramidal and psychosis) assumed for
DLB.
Costs: Largely based on SHTAC AD model £2005; not specified which AChEIs are assumed (cost appears
to relate to donepezil)
Utilities: based on SHTAC AD model (MMSE-based in
models 2 & 3)
5-yr time horizon
Model 1 was a reconstruction of
SHTAC AD model
Model 2 was a micro-simulation
model
Model 3 was a Markov model with
4 MMSE states
All cases; model 1: 'The cost per QALY gained of cholinesterase treatment of all patients with DLB… is comparable to that of patients with moderate AD,
and is probably cost saving.'
No deterministic or probabilistic sensitivity analysis
undertaken.
+£461 +0.170 +£2,706
All cases; model 2:
+£1,845 +0.039 +£46,794
All cases; model 3:
+£2,766 +0.077 +£35,922
Moderate dementia; model 1:
−£7,722 +0.392 Dominant
Moderate dementia; model 2:
−£39 +0.085 Dominant
NICE £2016f; all cases; model 1:
−£4,681 +0.170 Dominant
NICE £2016f; all cases; model 2:
−£1,098 +0.039 Dominant
NICE £2016f; all cases; model 3:
−£1,338 +0.077 Dominant
Partially applicablec,g,h
NICE £2016f; moderate; model 1:
−£14,556 +0.392 Dominant
Very serious limitationsi,j,k
NICE £2016f; moderate; model 2:
−£3,192 +0.085 Dominant

Parkinson's disease (update) Full health economics report
NICE Internal Clinical Guidelines, 2016 81
Study, population, country and
quality Data sources Other comments
Incremental
Conclusions Uncertainty Cost Effect ICER
Willan et al., 2006
PDD (PD + MMSE 20–24) Multinational evidence; UK
perspective
Effects: MMSE from EXPRESS RCT (Emre et al. 2004); IPD assuming linear progression from baseline to
24wk.
Costs: Resource use from EXPRESS; unit costs from experts (BNF; NHS RefCosts; PSSRU). £2003–
04
Utilities: mapped from MMSE to EQ-5D (using Scandinavian mapping
study)
24-wk time horizon Authors' results: 'although no between-treatment differences in cost were seen, the small sample size and highly variable cost distributions prevent us from making strong conclusions with regard to the effect of rivastigmine on total costs and, by inference, on cost
effectiveness.'
PSA: 55% probability cost effective at £20,000/QALY; 59% probability cost effective at
£40,000/QALY
−£26.18 +0.0077 Dominant
Excluding patient/carer costs:
+£451.17 +0.0077 £58,642
NICE £2016 approximationa:
+£124.45 +0.0077 £16,176
Partially applicableb,c
Very serious limitationsd,e
a approximation removes costs borne by patients and caregivers; reestimates rivastigmine drug cost assuming it is proportional to change in price of 28x3mg pack (£2004=£34.02 [BNF 47]; £2016=£2.57 [NHS Drug Tariff Feb 2016]; reduction of 92.4%); inflates all other costs from £2004/05 to £2015/16 using
PSSRU hospital & community health services inflators b includes costs borne by patients and caregivers (can be removed from some analyses but not PSA, etc.) c utility valuation via mapping algorithm with only one dimension (MMSE) estimated in Scandinavian population d short time horizon, in context of chronic condition with potential long-term effects (e.g. requirement for full-time care; possible survival impact) e potential conflict of interest f approximation reestimates AChEI drug cost assuming original model used cost of donepezil 10mg daily and 2 monitoring visits per year, and that drug costs
are proportional to change in price of 28x10mg pack (£2005=£89.06 [BNF 49]; £2016=£1.45 [NHS Drug Tariff Feb 2016] ; reduction of 98.4%); inflates all other
costs from £2005/06 to £2015/16 using PSSRU hospital & community health services inflators g PDD specifically excluded from effectiveness data h discounted at 6% / 1.5% i primary effectiveness data (MMSE) drawn from uncontrolled observational evidence j evidence used to extrapolate long-term effects drawn from AD populations k no consideration of uncertainty

Parkinson's disease (update) Full health economics report
NICE Internal Clinical Guidelines, 2016 82
F.7.5 Physiotherapy and physical activity
Study, population, country and
quality Data sources Other comments
Incremental
Conclusions Uncertainty Cost Effect ICER
Fletcher et al. (2012)
People with Parkinson’s disease and a
history of falling
10 week group exercise
programme
England
Effects: RCT (Goodwin et al., 2011 included in
Cochrane review)
Costs: resource use from hospital records and personal social services; standard unit costs. Costs included patient
travel costs
£2008
Utilities: EQ5D
10 week group exercise programme with further 10 week follow up versus
standard care
Mean age 71 years
Parkinson’s disease duration 9 years
H&Y 2.5
RCT found no significant difference in fall rates but improvement in balance and physical activity
levels
-£1385 +0.03 QALYs
Physiotherapy dominated no
physiotherapy
Over an 80% probability that the intervention is a cost-effective option compared with standard care at
£20,000/QALY
Wide confidence intervals around costs and QALYs, suggesting the analysis was underpowered to detect such
differences
ICER sensitive to data imputation methods, but
intervention still dominant
RCT found no statistically significant differences in costs
or QALYs at 20 weeks follow up
In PSA, intervention cost-effective compared to no intervention in over 80% of
iterations
No OSA reported
Partially applicablea,b,c,d
Potentially serious
limitationse,f,g
Farag et al.
(2012)
People with Parkinson’s disease and a history of falling or judged at risk of falls
6-month group +individual exercise
programme
Australia
Effects: RCT (Canning et al.,
2015)
Costs: AUS$2012 resource use collected alongside RCT; unit costs from standard
Australian sources
Utilities: SF12 from RCT converted to SF6D to which UK societal tariff is
6mo: monthly group exercise class + 2–4 home visits from physio (8–10 home sessions if group classes unfeasible) versus
standard care
Mean age 71 years
Parkinson’s disease duration 8 years
Mean H&Y 2.7
RCT found no difference
Whole population 'The exercise intervention appeared cost-effective with regard to fall prevention in the whole sample and cost saving in the low disease severity group, when compared with
usual care.'
PSA: in whole population, probability the intervention is cost-effective was below 20% at all QALY thresholds
≤AUS$100,000.
PSA: in low-severity subgroup, probability the intervention is cost-effective was 45–55% at all QALY thresholds
≤AUS$100,000.
+AUS $1694
+0.005 QALYs
AUS $338,800
/QALY
Low-severity subgroup
−AUS$2 +0.003 QALYs
dominant

Parkinson's disease (update) Full health economics report
NICE Internal Clinical Guidelines, 2016 83
Study, population, country and
quality Data sources Other comments
Incremental
Conclusions Uncertainty Cost Effect ICER
Partially applicablea,b,c,d,h
applied (Brazier et
al. 2002)
in falls in full population, but a benefit in the low-severity subgroup
(UPDRSIII ≤26) Potentially serious
limitationse,g,i
a Does not include all people with Parkinson’s disease
b Does not include effect on carers
c Costs did not include NHS community services (e.g. physiotherapy)
d Costs included patient travel costs
e Short time-horizon – no lifetime extrapolation
f Underpowered to detect differences in costs and QALYs (partly due to high level of missing economic data (37/130 participants)
g No OSA reported
h Non-UK setting
i Only falls considered as main outcome; other potentially relevant outcomes omitted
Abbreviations
ICER: incremental cost-effectiveness ratio
OSA: one way sensitivity analysis
PSA: probabilistic sensitivity analysis
QALY: quality adjusted life year
RCT: randomised controlled trial

Parkinson's disease (update) Full health economics report
NICE Internal Clinical Guidelines, 2016 84
F.7.6 Occupational therapy
Study, Population, Country and
Quality Data Sources Other Comments
Incremental
Conclusions Uncertainty Cost Effect ICER
Sturkenboom et al (2015)
People with Parkinson’s disease and carers living at home and reporting difficulties in daily
activities
10 week individualised OT
programme
The Netherlands
Effects: multicentre RCT (Sturkenboom et
al. 2014)
Costs: resource use from 3 month retrospective surveys, standard Dutch unit
costs
€2014 (assumed)
Utilities: EQ5D with Dutch tariff
10 week individualised intervention with 6 month follow up versus no
intervention (2:1)
Mean age 71 years
Parkinson’s disease duration 6 years
Hoehn and Yahr stage 2
Patients
-€125
Carers
-€29
Patient-caregiver
pairs
€122
Patients
0.02
Carers
0.04
Patient-caregiver
pairs
0.05
Patients
€305
Carers
€866
Patient-caregiver
pairs
€845
(All net monetary benefit at
€40,000 per
QALY)
OT did not significantly impact on total costs compared with usual care. Positive cost-effectiveness of the intervention was only significant for
caregivers
All cost differences non-significant. Only significant difference was for patient institutional care (-€1458
in favour of intervention)
EQ5D differences not significant, but favour
intervention
Large amounts of missing data, particularly for caregivers costs. Sensitivity analyses showed results were not
sensitive to this.
No OSA or PSA reported
Partially
applicablea,b,d,h
Very serious limitationsc,e,f,g,i,j,k
a Not a UK based study
b 10 week intervention may be too short to sustain benefit
c Single RCT powered on primary efficacy endpoint (perceived performance in daily activities), not cost effectiveness
d Societal perspective presented. Whilst categorised costs are presented, other perspectives cannot be calculated from median costs
e Retrospective 3 month cost questionnaire may be too long a recall period to be fully reliable
f Cost year not clearly stated
g Inconsistencies in reported costs and ICERs
h Dutch EQ5D tariffs used to value utility
i 6 month horizon not lifetime
j No OSA presented
k No PSA presented
Abbreviations

Parkinson's disease (update) Full health economics report
NICE Internal Clinical Guidelines, 2016 85
Study, Population, Country and
Quality Data Sources Other Comments
Incremental
Conclusions Uncertainty Cost Effect ICER
EQ5D: European quality of life 5 domain index
ICER: incremental cost-effectiveness ratio
OSA: one way sensitivity analysis
OT: occupational therapy
PSA: probabilistic sensitivity analysis
QALY: quality adjusted life year
RCT: randomised controlled trial
Parkinson's disease (update) Full health economics report
NICE Internal Clinical Guidelines, 2016 86
F.7.7 Deep brain stimulation, levodopa–carbidopa intestinal gel and best medical treatment for advanced Parkinson’s disease
Table 47: Economic evidence table for multiple comparison with DBS, LCIG, CSAI and BMT
Study, Population, Country and
Quality Data Sources Other Comments
Incremental
Conclusions Uncertainty Cost Effect ICER
Walter and
Odin, 2015
People with advanced
PD
DBS, LCIG, CSAI or standard
care
UK and Germany
Effects: LCIG from open label studies; DBS from single RCT (Deuschl et al. 2006); CSAI unclear. SC effect and transitions assumed from Lowin et
al. (2011).
Costs: State costs based on Findley et al (2011) regression. Intervention and AE (including non-motor AE) costs not detailed, varied concomitant
drug costs. £2014
Utilities: State utilities rescaled (>0) from those extrapolated in Lowin et al. (2011). AE
source unknown
Markov model with lifetime horizon (H&Y stages and quartile off-time categories, based
on Lowin et al. 2011)
Baseline age: 59 years
Disease duration: 14 years
Includes non-motor AEs
CSAI and LCIG AEs cause switch to DBS
UK model reported, German model used
different costs
Discounted at 3.5%
Funded by industry
SC -
CSAI £1458
DBS £9479
LCIG £42,281
SC -
CSAI 0.23
DBS -0.10
LCIG 0.31
All results are QALYs
SC -
CSAI £6440
DBS Dom.
LCIG £244,685
All results are £ per QALY
CSAI is a cost-effective therapy and could be seen as an alternative treatment to LCIG or DBS for people with
advanced PD
ICERs most sensitive to intervention effect and discount rate. A 10% increase in intervention effect increased ICER for CSAI to SC to £34,400
/QALY
In pairwise PSA (500 iterations), 87% chance of CSAI being cost-effective compared with SC £20,000
/QALY
Partially applicable a
Very serious limitations b,c,d,e,f,g,h,i,j,k,l

Parkinson's disease (update) Full health economics report
NICE Internal Clinical Guidelines, 2016 87
Study, Population, Country and
Quality Data Sources Other Comments
Incremental
Conclusions Uncertainty Cost Effect ICER
a Interventions differ slightly from guideline. In guideline, standard care and DBS can include apomorphine; here apomorphine is a separate comparator
b H&Y and off-time transitions and effects assumed to be independent
c Intervention effects from a variety of study types (including open label and unknown sources) and not synthesised
d LCIG drugs not costed using NHS tariff (price is 25% lower than NHS tariff)
f Lack of detail surrounding intervention resource use and cost
g No utility impact of receiving interventions modelled
h Utility values for 12 state model extrapolated from data for 3 of the 12 states
i Health state utility values rescaled to ensure no negative values
j Adverse event utilities sources unknown
k PSA only reported pairwise comparisons
l Potential conflict of interest
Abbreviations
AE: adverse event
CSAI: continuous subcutaneous apomorphine infusion
DBS: deep brain stimulation
Dom.: Dominated (other option(s) cost less and are more effective)
H&Y: Hoehn and Yahr disease rating scale
ICER: incremental cost-effectiveness ratio
LCIG: levodopa/carbidopa intestinal gel
OSA: one way sensitivity analysis
PD: Parkinson's disease
PSA: probabilistic sensitivity analysis
QALY: quality adjusted life year
RCT: randomised controlled trial
SC: standard care
UK: United Kingdom
Table 48: Economic evidence table for LCIG compared with BMT
Study, Population, Country and
Quality Data Sources Other Comments
Incremental
Conclusions Uncertainty Cost Effect ICER

Parkinson's disease (update) Full health economics report
NICE Internal Clinical Guidelines, 2016 88
Study, Population, Country and
Quality Data Sources Other Comments
Incremental
Conclusions Uncertainty Cost Effect ICER
Kristiansen et al. 2009
People with advanced PD
LCIG v standard care
Sweden
Effects: DIREQT RCT (Nyholm et al. 2005). 6 week crossover RCT, effect assumed to last for 2 year
model duration.
Costs: RCT based. Includes PEG and device related AEs.
SEK2004
Utilities: 15D. Effect maintained for 2 years of
model
Decision tree with 2 year horizon (no long term effect
data available)
Baseline age: 65 years
Disease duration: Unk
AEs disutility assumed measured by utility tool
Standard care included 4 people on apomorphine
therapy (2 injection, 2 pump)
Discounted at 3%
Funded by industry
SEK 390,000
0.06 QALYs
SEK 6,100,000
/QALY
If society adopts a cost-effectiveness threshold of SEK 500,000 per QALY … LCIG cannot be considered
cost effective
Device related AEs may reduce as technology
improves
ICER most sensitive to drug costs and intervention effect (utility). No OSA reduced ICER to less than SEK 2,800,000/ QALY. ICER SEK1,200,000/ QALY if all
people on apomorphine
Partially applicable a,b
Very serious limitations e,f,g,h,j,m,q,s,t,u
Lowin et al. 2011
People with
advanced PD
LCIG v standard care
United Kingdom
Effects: unpublished analysis of two 6 week studies. Transitions from earlier studies. LCIG arm assumed to deteriorate 50% slower than
standard care arm (off-time)
Costs: resource use DIREQT study and assumptions. Health state costs based on regression from Findley et al (2011). Standard unit costs.
£2009
Utilities: Unpublished extrapolated (9/12 states) trial
EQ5D data
Markov model with lifetime horizon, but LCIG only used
for 5 years
Baseline age: Unk
Disease duration: Unk
Discounted at 3.5%
Funded by industry
£39,644 1.1 QALYs
£36,024/ QALY
LCIG could be considered cost-effective in comparison to standard care when other treatment options are either ineffective or
unsuitable
High degree of uncertainty around key model
parameters.
ICER sensitive to model assumptions with ICERs from £32,127 to
£66,421/QALY.
ICER most sensitive to shorter intervention duration, intervention effect magnitude (first cycle and ongoing deterioration) and cohort characteristics (all produced ICERs >
£48,000/QALY)
No PSA reported
Partially applicablea,b,c
Very serious limitations d,f,i,j,k,l,n,o,p,r,u
a No indication whether people were eligible for other interventions (e.g. deep l No utility impact of receiving interventions modelled

Parkinson's disease (update) Full health economics report
NICE Internal Clinical Guidelines, 2016 89
Study, Population, Country and
Quality Data Sources Other Comments
Incremental
Conclusions Uncertainty Cost Effect ICER
brain stimulation surgery)
b Intervention used naso-jejunal therapy only, not PEG therapy as per UK clinical practice
c Unclear whether standard care included apomorphine. Drug costs indicate some apomorphine, but no indication whether included in intervention effect
d HY and off-time transitions and effects assumed to be independent
e Limited time horizon due to lack of longer term outcomes data
f Relative intervention effects taken from small (n=24) 6 week cross over trial with high levels of withdrawal (n=5)
g Relative intervention effect data at 6 weeks assumed to be sustained for 2 year horizon of model
h Relative intervention effect data at 6 weeks assumed to last for 6 month cycles
i Adverse event rates from very small non-comparative study (n=8)
j Resource use includes PEG treatment, but treatment effect data based on naso-jejunal treatment only
k Some resource use assumed
m Utilities measured by 15D not EQ5D
n Utilities taken from unpublished study
o Population tariff used to value EQ5D responses not stated
p Utility values for 12 state model extrapolated from data for 3 of the 12 states
q Discounted at 3%
r No PSA reported
s In PSA, normal distributions assumed for cost parameters
t Societal perspective reported
u Potential conflict of interest
Abbreviations
15D: 15-dimensional utility instrument
AEs: adverse events
DIREQT: Duodopa Infusion – Randomised Efficacy and Quality of life Trial
EQ5D: EuroQoL 5 dimension quality of life tool
H&Y: Hoehn and Yahr disease rating scale
ICER: incremental cost effectiveness ratio
LCIG: levodopa carbidopa intestinal gel
OSA: one way sensitivity analysis
PD: Parkinson's disease
PEG: percutaneous endoscopic gastrostomy
PSA: probabilistic sensitivity analysis
QALY: quality adjusted life year
RCT: randomised controlled trial
SEK: Swedish kroner (SEK9.17 ≈ $ €1)
Unk: unknown

Parkinson's disease (update) Full health economics report
NICE Internal Clinical Guidelines, 2016 90
Table 49: Economic evidence table for DBS compared with BMT
Study, Population,
Country and Quality Data Sources Other Comments
Incremental
Conclusions Uncertainty Cost Effect ICER
Dams et al., 2013
People with Parkinson’s disease
DBS versus standard medical treatment
Germany
Effects: Various effect sources. Validated conditional transitions
(Martilla & Rinne, 1977)
Costs: DBS from local hospital, adverse event from standard sources. H&Y (on) via linear regression; motor complications via logistic
regression. €2010
Utilities: EQ5D as linear regression of H&Y (on) and motor complication. Post-DBS reduction
assumed for 3 months
Markov model (H&Y (off) for disease progression with nested H&Y (on) for treatment) with
lifetime horizon
4 year intervention effect
Also models cost per UPDRSII and
UPDRSIII changes
Battery replaced every 4 years
Discounted at 3%
€6994 1.05 QALYs
€6677/ QALY DBS could be considered a cost-effective
treatment option
ICER most sensitive to motor effect (approx. €19,000/QALY) and battery lifespan (€19,300/QALY if 2 years). A shorter time horizon increased the ICER (between €27,958/ QALY at 5 years and €393,071/ QALY at 1 year). For early DBS (50% people with H&Y2)
ICER €3443/ QALY
No PSA reported
Partially applicable a,c,e,g
Potentially serious limitations a,e,n,o,ab
Eggington et al., 2014
People with advanced
Parkinson’s disease
DBS in combination with BMT versus
BMT alone
United Kingdom
Effects: Individual level single centre RCT data (Deuschl et al. 2006). Transitions not from UK
or DBS populations
Costs: Resource use from RCT and other sources. Drug costs from PDSURG. Unit costs from standard
sources. £2011
Utilities: Model states
Markov model (H&Y and % off-time) with 5 year
time horizon
6 month intervention effect
Drop outs progress to next off-time
stage
Includes impact on fall rates and costs
Battery replaced
£20,727 1.002 QALYs
£20,678/ QALY DBS may be considered a cost-effective intervention from a UK payer perspective when compared with BMT alone.
The high up-front device and surgery costs were outweighed
Minimal survival gain, QoL benefit via improved H&Y and % off-time. Over-predicted 2 year H&Y gains (0.7 stages vs, 0.4) and survival times (no details) compared with other RCTs.
Different utility weights (less variation and only applied to H&Y) increased ICER to £64,170/ QALY.
Partially applicable c, h

Parkinson's disease (update) Full health economics report
NICE Internal Clinical Guidelines, 2016 91
Study, Population, Country and Quality Data Sources Other Comments
Incremental
Conclusions Uncertainty Cost Effect ICER
Very serious limitations q,r,t,x,y,z,ab,ac
(and intervention effect) from previous non DBS economic evaluations (Lowin et. al 2011;
Palmer et al. 2000)
every 4 years
Discounted at 3.5%
Funded by industry
by gains in QoL and reduced drug
use
If no reduction in drug costs ICER increased to
£33,079/ QALY
No PSA reported
Kawamoto et al., 2016
People with Parkinson’s (various levels of severity explored in different
scenarios)
DBS versus best medical therapy
Japan
Effects: Case series from Japan (Tanei et al. 2009; Sato et al. 2006) and Singapore (Zhao et
al., 2010)
Costs: Direct medical costs, from Japanese payer perspective ¥2014, with US$ conversion. Assumed that medical treatment costs following DBS are 20% lower. Device and
implantation $17,740.
Utilities: EQ-5D estimated from vignettes by healthy volunteers, supplemented with evidence from other published sources (Palmer et al. 2000;
Lowin et al. 2011)
Discount rate not stated (appears to be approximately
3%)
10-year time horizon
3-yearly battery replacement
Mortality associated
with HY stage
HY3 $83,400
HY4 $85,100
HY5
$85,900
HY3 1.2
HY4 3.2
HY5
3.1
HY3 $70,200/QALY
HY4
$25,600/QALY
HY5
$27,200/QALY
'Our model suggests that DBS is cost- effective in the Japanese health care system. DBS is more cost-effective if performed in the intermediate rather than early or late stages of
PD.'
PSA with arbitrary (non evidence-based) bounds for parameters. Probability that ICER was <¥5 million (c$41,000)
was found to be 93%.
Limited OSA suggested the model was most sensitive to cost of DBS and assumed QoL of
HY4.
Partially applicablead,ae,af
Very serious limitationso,x,z,ag,ai
McIntosh et al .,
2016
People with advanced
Parkinson’s
Effects: 1 year RCT (Williams et al., 2010). Extrapolation based on existing literature and assumed intervention
RCT based analysis extrapolated to 5
and 10 years
Assumed all
1 year
£9256
1 year
0.02
QALYs
1 year
£468,528/
QALY
At 1 year follow up, the difference in costs was substantial while the difference in
Extrapolation highly sensitive to assumptions. Any of 10 year IPG lifespan, 30% extra DBS QALY gains, 30% higher

Parkinson's disease (update) Full health economics report
NICE Internal Clinical Guidelines, 2016 92
Study, Population, Country and Quality Data Sources Other Comments
Incremental
Conclusions Uncertainty Cost Effect ICER
DBS versus best medical therapy
UK
differences remain.
Costs: ITT person specific RCT micro costing; health and social service resource use via 12 month retrospective survey. Unit costs from standard
sources. £2010
Utilities: ITT EQ5D measured in RCT; between arm differences
preserved.
surgical complications occurred within 6
months
Battery lifespan estimated via
survival curve
Discounted at 3.5%
5 years
£14,558
10 years
£41,929
5 years
0.33
QALYs
10 years
0.60
QALYs
5 years
£45,180/
QALY
10 years
£70,537/
QALY
QALYs was small. DBS surgery had a very low probability of being cost-effective at 1
year.
IPG lifespan combined with quality of life were important predictors of cost-
effectiveness.
standard care drug costs, 50% lower DBS follow up costs made DBS cost effective (at £30,000/
QALY at 5 years).
Increased surgical experience may reduce
adverse events
In PSA (bootstrapping), only when threshold reaches greater than £750,000 does probability of being cost effective
reach around 70%.
Directly applicable d
Potentially serious limitations l,rs,t,v
NICE, 2006
Later stages of Parkinson’s disease unresponsive to changes in medical
therapy
DBS-STN versus standard care
United Kingdom
Effects: QoL gain from French case series
(Lagrange et al., 2002)
Costs: UK based but do not match original paper
(Findley et al., 2003)
£1998 (assumed)
Utilities: PDQL scale from French case series
Simplified costs and benefits over 5 year
horizon
5 year intervention effect and drug cost
reductions
Side effects of DBS and battery replacement
excluded
Mortality only applied to DBS arm
Discounted at 3.5%, but not
consistently applied
£14,079 0.723 QALYs
£19,500/ QALY Costs and benefits of DBS-STN accrued over greater lengths of time (5 years) in comparison to standard care indicate the potential for cost-effective use of
the technology
In OSA, QALY gains most uncertain. If QoL improvement less than 27% (base case 38%), ICER was greater than £30,000/QALY. DBS procedure and stimulator adjustment costs increased ICER to £29,000/ QALY and £31,000/ QALY
respectively.
No PSA reported
Partially applicable b,f,g,i,
Very serious limitations i,l,m,r,u,w,x,aa,ab
Parkinson's disease (update) Full health economics report
NICE Internal Clinical Guidelines, 2016 93
Study, Population, Country and Quality Data Sources Other Comments
Incremental
Conclusions Uncertainty Cost Effect ICER
Tomaszewski and Holloway 2001
People with later stage Parkinson’s
disease (H&Y 3-5)
DBS versus BMT
USA
Effects: Intervention effect assumed from magnitude of UPDRS changes; adverse events from published studies. Care entry from
large USA cohort
Costs: DBS used standard and local hospital sources and opinion. Drug resource
use assumed. $2000
Utilities: Baseline via VAS; effect assumed from UPDRS changes. Not reduced when people enter nursing
home
Markov model (outside nursing home, within nursing home, dead) with lifetime
horizon
Intervention effect stable for 4 years then tapers for 5
years
Battery replaced every 3 years
Discounted at 3%
$35,000 0.72 QALYs
$49,194/ QALY DBS is a more cost-effective method for treating people with late-stage Parkinson’s disease than
BMT
ICER most sensitive to QoL gain. Reducing QoL from 30% to 17.5% increased ICER to
$100,000/QALY.
ICER also sensitive to shorter intervention effect, higher DBS surgery costs and higher battery replacement frequency
(further details not given)
No PSA reported
Partially applicable c,g,j
Potentially serious limitations j,k,p,x,ab
Valldeoriola et al., 2007
Advanced PD with sever disability in which drugs had proved to be
insufficient
STN-DBS versus BMT.
Spain
Effects: EQ-5D from non-randomised
prospective trial
Costs: Prospective trial collection
€Unknown
Utilities: EQ-5D with
Spanish tariff
Prospective open study over 1 year
horizon (n=29)
Non randomised – first 14 people on waiting list in DBS arm, next 15 people waited 1 year (BMT
arm)
Discounted at 3%,
€7601 0.221 QALYs
€34,389/ QALY The cost-effectiveness results for STN-DBS … reasonably support the efficiency of STN-DBS in a Spanish
setting
ICER sensitive to inclusion of 2 people in BMT with extreme costs – 1 with a prolonged hospital stay (ICER €44,078/QALY when removed) and 2 people in BMT who required apomorphine infusions (ICER €62,148/QALY
when removed).
No PSA reported Partially applicable c,g

Parkinson's disease (update) Full health economics report
NICE Internal Clinical Guidelines, 2016 94
Study, Population, Country and Quality Data Sources Other Comments
Incremental
Conclusions Uncertainty Cost Effect ICER
Very serious limitations l,m,r,aa,ab
Zhu et al., 2014
People with dopa-responsive PD and disabling or troubling motor symptoms, including motor fluctuation or dyskinesia despite optimised pharmacological
treatment
DBS versus best medical therapy
(before-and-after)
Hong Kong
Effects: Before-and-after study of 13 patients receiving DBS
Costs: Direct medical costs for DBS and following 2 years compared with costs in the year prior to surgery
x 2.
HK$(2009), with US$ conversion.
Utilities: EQ-5D at baseline (with UK valuation), 1 year and 2 years post-DBS.
3% discount rate
2-year study
No battery replacements
1 year $24,992
2 years
$22,373
1 year 0.203
QALYs
2 years 0.356
QALYs
1 year $123,110/QALY
2 years
$62,846/QALY
'The set-up cost for STN DBS for treatment of advanced PD is high during the first year of treatment.… During the second treatment year…, total treatment costs decrease significantly whilst the treatment effect remains constant. The result of this study suggests that… bilateral STN DBS for patients with advanced PD is cost-effective in
Hong Kong.'
No sensitivity analysis reported. Linear regression on patient-specific ICERs produced a 95% confidence interval of $5,778–$43,959; however, the upper bound of this interval is below the base-case point
estimate.
Partially applicableg,i,ad
Very serious limitationsr,ab,ah
a Starting H&Y distributions assumed
b Details of interventions not specified
c Non UK based RCT and transitions data
d RCT conducted over a long period a number of years ago so all interventions may not reflect current UK clinical practice
s Costs and utilities calculated on an ITT basis
t Includes costs of falls but no other disease progression costs
u No battery replacement costs modelled
v Equipment costs annuitized and include apomorphine pump costs which may not be borne by NHS

Parkinson's disease (update) Full health economics report
NICE Internal Clinical Guidelines, 2016 95
Study, Population, Country and Quality Data Sources Other Comments
Incremental
Conclusions Uncertainty Cost Effect ICER
e Modelled two intervention effects (HY and motor complications)
f Direct adverse events of DBS excluded
g Costs and outcomes not discounted at 3.5%
h Utility values from general Parkinson’s disease populations, rather than DBS specific population
i Utility values and intervention effect taken from non-randomised, non-controlled, non-UK case series
j Baseline utility values obtained using VAS not EQ5D
k Model structure is residence, not disease based
l No disease based model structure
m Model does not reflect disease progression
n Modelling on- and off-times may double count costs and benefits
o Intervention effects from a number of non-randomised studies and not appropriately synthesised
p Intervention effect and duration assumed from non-systematic evidence synthesis
q Model does not directly use RCT primary outcomes (UPDRSIII score, PDQ39); HY and off-time transitions and effects assumed to be independent
r Limited time horizon due to lack of longer term outcomes data
w Mortality, costs and discounting not consistently applied to all arms
x No utility impact of receiving interventions modelled
y Utilities taken from unpublished study
z Utility values for 12 state model extrapolated from data for 3 of the 12 states
aa Cost year not specified
ab No PSA reported
ac Potential conflict of interest
ad Non-UK setting
ae Discount rate not stated
af Changes in health-related quality of life not reported directly from patients and/or carers
ag Not UK based EQ5D tariff
ah Based on very small sample (13 patients), with no contemporary controls (before-and-after design)
ai DBS effect data from very small (HY3 n=7; HY4 n=11; HY5 n=4), non-comparative case series
Abbreviations
BMT: best medical treatment
DBS: deep brain stimulation
DBS-STN: bilateral deep brain stimulation of the subthalamic nucleus
H&Y: Hoehn and Yahr stage
ICER: incremental cost effectiveness ratio
IPG: implantable pulse generator
ITT: intention to treat analysis
NICE: National Institute for Health and Care Excellence
OSA: one-way sensitivity analysis
PDQL: Parkinson’s disease quality of life scale
PDQ39: Parkinson’s disease questionnaire
PDSURG: Parkinson’s disease deep brain stimulation surgery trial
PSA: probabilistic sensitivity analysis
QALY: quality adjusted life year
QoL: quality of life
RCT: randomised controlled trial
UK: United Kingdom
UPDRS: United Parkinson’s Disease Rating Scale
USA: United States of America
Parkinson's disease (update) Full health economics report
NICE Internal Clinical Guidelines, 2016 96
Study, Population, Country and Quality Data Sources Other Comments
Incremental
Conclusions Uncertainty Cost Effect ICER
VAS: visual analogue scale
F.7.8 Deep brain stimulation compared with best medical treatment for earlier Parkinson’s disease
Table 50: Economic evidence table for early DBS compared with BMT
Study, population, country and
quality Data sources Other comments
Incremental
Conclusions Uncertainty Cost Effect ICER
Dams et al., 2016
People with PD under 61, HYon <3 Early DBS
versus BMT
Germany
Effects: Included RCT (Schuepbach et al. 2013). Validated conditional transitions (Martilla
& Rinne, 1977)
Costs: DBS, AEs from RCT and standard sources. H&Y via linear regression; motor complications via logistic regression.
€2013
Utilities: RCT based PDQ39 mapped to EQ-5D with German tariffs. Post-DBS reduction assumed for 3
months
Markov model (H&Y (off) for disease progression with nested H&Y (on) for treatment) with
lifetime horizon
Lifetime intervention effect
IPG replaced every 5 years
Discounted at 3%
€36,400 1.60 QALYs €22,700/ QALY
DBS should be considered cost-effective in younger patients with earlier stages of
Parkinson’s disease
ICER most sensitive to battery lifespan (€13,800/QALY if 9 years; €49,200/QALY if 3 years). A shorter time horizon increased the ICER (between €51,400/ QALY at 10 years, €101,900/ QALY at 10 years and €3,135,600/ QALY at 1
year).
No PSA reported
Partially
applicable a,b,c
Very serious limitations a,d,e,h,j

Parkinson's disease (update) Full health economics report
NICE Internal Clinical Guidelines, 2016 97
Study, population, country and
quality Data sources Other comments
Incremental
Conclusions Uncertainty Cost Effect ICER
Medtronic, AIC
xxxxxx xxxx xx xxxxx xxx xx xx xx xxxxx xxx xxxxxx
xxxxxxxxxxxb
xxxxxxxx xxxxxxxx xxx xxxxxxxxxxx xx xxx xxxxxx xxxxxxxxxxx xxx xxxx xx xx xxx xxxxxxxxxxxxxxxxxx xxxx xxx xxxxxx xxxxx xxxx xxx xxx xxxxxxxx xxxxxxxx xx xxxxx xxxxx xxxxxx xxxxxxxxxxxxxxx xxx xxxxx xxxxx xxxxxx xx xxxxx xxx xxxxxx xxx xxxxxxx xxxx xxxxxx
xxxxxxxx b
xxxxxx xxxxx xxxx xxx xxxxxxx xxxxxxxxxxx xxxx xx xxxx xxxxxxxxx xxxx xxxxxxxxxxxx xxxxxxxxxx xxxxxxxx xxxxx xxx xxxxxxxxxxxxxxxx xx xxxxxxxxx xx
xxxxxxxxb
Xxxxxxxb xxxx xxxxxb Xxxxxxxxxxxxxb xxx xxxx xx xxxxxxxxxxxxxx xxxx
xxxxxxxx xx xxx xxxxxb
xxxx xxxxxx xxxxxxxxx xx xxxx xxxxxxxx xxxxxxxxx xxxxxx xxxxxxx xxxxxxxx xxxxxxxxxx xxxx xxxxxx xxxxxxxxxxxxxxxx xxx xxx xxxxxxxx xxxxx xxxxx xxxxxxx xx xxxxxxxxxxxx xx xxxxxxx xxxx xxxxxxx xxxxxxx xxxxxxx xxxx xxxxx xxx xxxx xxxx xx xxxxxxx xxxxxxxx xxx xxxxx xxxxxxxxxxxx xxx xxxxxx xx xxxxx xxx xxxxx xxxxxxxxxxxxxx xxxxxxxx xxxx xxx xx
xxxxxxx xxxxxb
Partially applicable a,b
Potentially serious
limitationsf,g,h,i,k
b Academic-in-confidence material removed
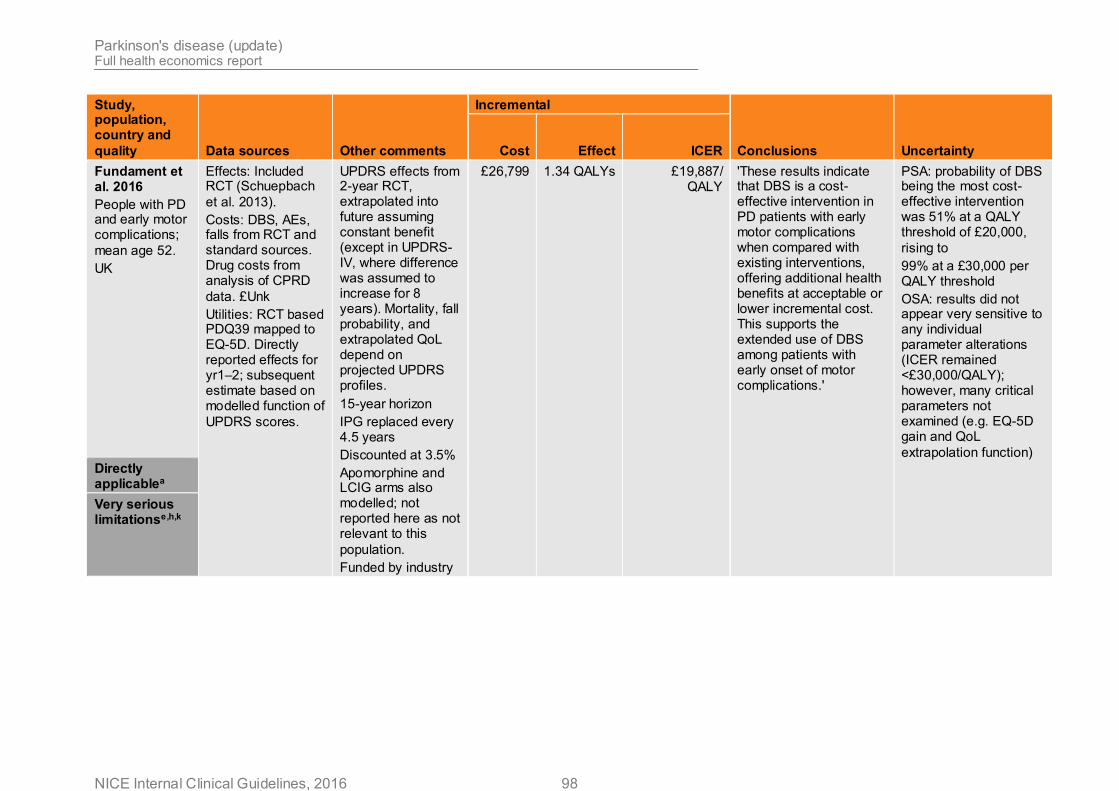
Parkinson's disease (update) Full health economics report
NICE Internal Clinical Guidelines, 2016 98
Study, population, country and
quality Data sources Other comments
Incremental
Conclusions Uncertainty Cost Effect ICER
Fundament et al. 2016
People with PD and early motor complications;
mean age 52.
UK
Effects: Included RCT (Schuepbach
et al. 2013).
Costs: DBS, AEs, falls from RCT and standard sources. Drug costs from analysis of CPRD
data. £Unk
Utilities: RCT based PDQ39 mapped to EQ-5D. Directly reported effects for yr1–2; subsequent estimate based on modelled function of
UPDRS scores.
UPDRS effects from 2-year RCT, extrapolated into future assuming constant benefit (except in UPDRS-IV, where difference was assumed to increase for 8 years). Mortality, fall probability, and extrapolated QoL depend on projected UPDRS profiles.
15-year horizon
IPG replaced every 4.5 years
Discounted at 3.5%
Apomorphine and LCIG arms also modelled; not reported here as not relevant to this
population.
Funded by industry
£26,799 1.34 QALYs £19,887/ QALY
'These results indicate that DBS is a cost-effective intervention in PD patients with early motor complications when compared with existing interventions, offering additional health benefits at acceptable or lower incremental cost. This supports the extended use of DBS among patients with early onset of motor complications.'
PSA: probability of DBS being the most cost-effective intervention was 51% at a QALY threshold of £20,000,
rising to
99% at a £30,000 per QALY threshold
OSA: results did not appear very sensitive to any individual parameter alterations (ICER remained <£30,000/QALY); however, many critical parameters not examined (e.g. EQ-5D gain and QoL
extrapolation function)
Directly applicablea
Very serious limitationse,h,k

Parkinson's disease (update) Full health economics report
NICE Internal Clinical Guidelines, 2016 99
Study, population, country and
quality Data sources Other comments
Incremental
Conclusions Uncertainty Cost Effect ICER
a Non UK based data
b Costs and outcomes not discounted at 3.5%
c Modelled two intervention effects (HY and motor complications)
d Modelling on- and off-times may double count costs and benefits
e Lifetime intervention effect
f Limited time horizon due to lack of longer term outcomes data
g Includes costs of falls but no other disease progression costs
h Cost year not specified
i Not UK based EQ5D tariff
j No PSA reported
k Potential conflict of interest
Abbreviations
AEs: adverse events
BMT: best medical treatment
DBS: deep brain stimulation
EQ5D: EuroQoL 5 dimension quality of life tool
H&Y: Hoehn and Yahr stage
ICER: incremental cost effectiveness ratio
IPG: implantable pulse generator
PDQ39: Parkinson’s disease questionnaire
PSA: probabilistic sensitivity analysis
QALY: quality adjusted life year
RCT: randomised controlled trial
UPDRS: United Parkinson’s Disease Rating Scale
UK: United Kingdom