appendix g: aquaculture carrying capacity...
TRANSCRIPT

Coast Seafoods Company Recirculated Draft EIR Appendices Humboldt Bay Harbor District
July 2016
Appendix G:
Aquaculture Carrying Capacity Analysis

Humboldt Bay Mariculture Carrying Capacity Analysis
Prepared by: Humboldt Bay Harbor, Recreation and Conservation District
601 Startare Drive Eureka, CA 95501
and
SHN Consulting Engineers and Geologists
812 W Wabash Ave Eureka, CA 95501
October 21, 2015
Humboldt Bay Mariculture – Carrying Capacity Analysis October 21, 2015
Page 2
Introduction
In Humboldt Bay, California, there are two current proposals to expand intertidal and subtidal shellfish culture operations: the Humboldt Bay Mariculture Pre-permitting Project (Pre-Permitting Project), (Humboldt Bay Harbor, Recreation and Conservation District [HBHRCD] 2014) and the Coast Seafoods Company Permit Renewal and Amendment Project (“Coast Project”, HBHRCD 2015). Proposed shellfish culture expansion, along with existing culture, could potentially affect food resources and ecosystems in the bay. This document presents an analysis of the effects to food resources of (1) the Pre-Permitting Project, (2) the Coast Project, and (3) other existing shellfish culture in the bay, including culture maintained by Coast Seafoods Company. The specific research question guiding this analysis is “what cumulative impact will the Pre-Permitting Project and Coast Project have on food resources available to filter feeding organisms in Humboldt Bay?” To assess this question, the analysis uses Gibbs’ (2007) indicators of how cultured shellfish affect their food sources. Cultured shellfish consume natural foods suspended in the water column, including phytoplankton and other organic matter, and potentially compete with other filter feeders for this food. Therefore, shellfish farms may affect naturally occurring species and food webs in the growing region. Various approaches can be taken to assess these effects. Gibbs (2007) noted:
From a technical perspective, an obvious way forward is to develop complex numerical hydrodynamic-NPZ (nutrient, phytoplankton, zooplankton) carrying capacity models with embedded shellfish energetic models to understand these interactions. However, these models are technically complex, are extremely data hungry, and many argue do not have a particularly good performance record (Herman 1993).
In light of these challenges, Gibbs (2007) developed a set of “sustainability performance indicators for assessing the environmental performance of shellfish farms.” These indicators provide quantitative guidance on answering the following questions (modified from Gibbs [2007]):
• Does the proposed amount of shellfish culture, when considered in connection with existing shellfish culture, significantly change any other ecological processes, species, populations, or communities within the growing region?
• Does the proposed amount of shellfish culture, when considered in connection with existing shellfish culture, represent a quantity that would control phytoplankton dynamics in the growing region?
• Are the current and proposed levels of shellfish culture at the ecological carrying capacity of the region?

Humboldt Bay Mariculture – Carrying Capacity Analysis October 21, 2015
Page 3
Approach/Methods
Gibbs’ (2007) indicators use linear combinations and ratios that compare inlet total volume, tidal exchange volume, the mean clearance rate of cultured shellfish, mean phytoplankton biomass, phytoplankton production, and cultured shellfish biomass. Each of these variables, and the data used to describe them, are presented below.
Inlet Total Volume
The volume of water that occupies an inlet is a value used for several calculations in this analysis. Humboldt Bay consists of three sub-basins: Arcata Bay (North Bay), Entrance Bay, and South Bay (Figure 1). Arcata Bay, where aquaculture occurs and is proposed, has an inlet total volume of 48 and 85 million cubic meters (m3) at mean low water and mean high water, respectively (Table 1) (Barnhart et al. 1992).
Figure 1. Humboldt Bay is Often Described as Three Bays (Arcata Bay, Entrance Bay, and South Bay); Aquaculture Occurs in Arcata Bay.
Humboldt Bay Mariculture – Carrying Capacity Analysis October 21, 2015
Page 4
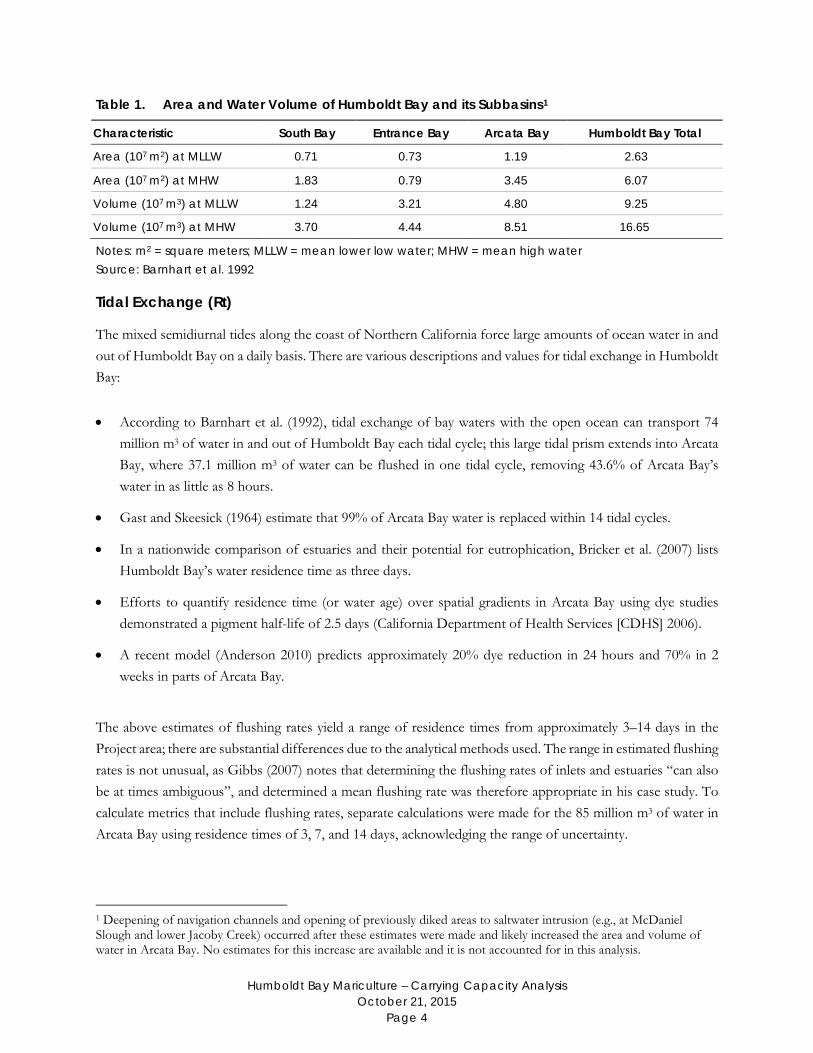
Table 1. Area and Water Volume of Humboldt Bay and its Subbasins1
Characteristic South Bay Entrance Bay Arcata Bay Humboldt Bay Total
Area (107 m2) at MLLW 0.71 0.73 1.19 2.63
Area (107 m2) at MHW 1.83 0.79 3.45 6.07
Volume (107 m3) at MLLW 1.24 3.21 4.80 9.25
Volume (107 m3) at MHW 3.70 4.44 8.51 16.65
Notes: m2 = square meters; MLLW = mean lower low water; MHW = mean high water Source: Barnhart et al. 1992
Tidal Exchange (Rt)
The mixed semidiurnal tides along the coast of Northern California force large amounts of ocean water in and out of Humboldt Bay on a daily basis. There are various descriptions and values for tidal exchange in Humboldt Bay:
• According to Barnhart et al. (1992), tidal exchange of bay waters with the open ocean can transport 74 million m3 of water in and out of Humboldt Bay each tidal cycle; this large tidal prism extends into Arcata Bay, where 37.1 million m3 of water can be flushed in one tidal cycle, removing 43.6% of Arcata Bay’s water in as little as 8 hours.
• Gast and Skeesick (1964) estimate that 99% of Arcata Bay water is replaced within 14 tidal cycles.
• In a nationwide comparison of estuaries and their potential for eutrophication, Bricker et al. (2007) lists Humboldt Bay’s water residence time as three days.
• Efforts to quantify residence time (or water age) over spatial gradients in Arcata Bay using dye studies demonstrated a pigment half-life of 2.5 days (California Department of Health Services [CDHS] 2006).
• A recent model (Anderson 2010) predicts approximately 20% dye reduction in 24 hours and 70% in 2 weeks in parts of Arcata Bay.
The above estimates of flushing rates yield a range of residence times from approximately 3–14 days in the Project area; there are substantial differences due to the analytical methods used. The range in estimated flushing rates is not unusual, as Gibbs (2007) notes that determining the flushing rates of inlets and estuaries “can also be at times ambiguous”, and determined a mean flushing rate was therefore appropriate in his case study. To calculate metrics that include flushing rates, separate calculations were made for the 85 million m3 of water in Arcata Bay using residence times of 3, 7, and 14 days, acknowledging the range of uncertainty.
1 Deepening of navigation channels and opening of previously diked areas to saltwater intrusion (e.g., at McDaniel Slough and lower Jacoby Creek) occurred after these estimates were made and likely increased the area and volume of water in Arcata Bay. No estimates for this increase are available and it is not accounted for in this analysis.
Humboldt Bay Mariculture – Carrying Capacity Analysis October 21, 2015
Page 5
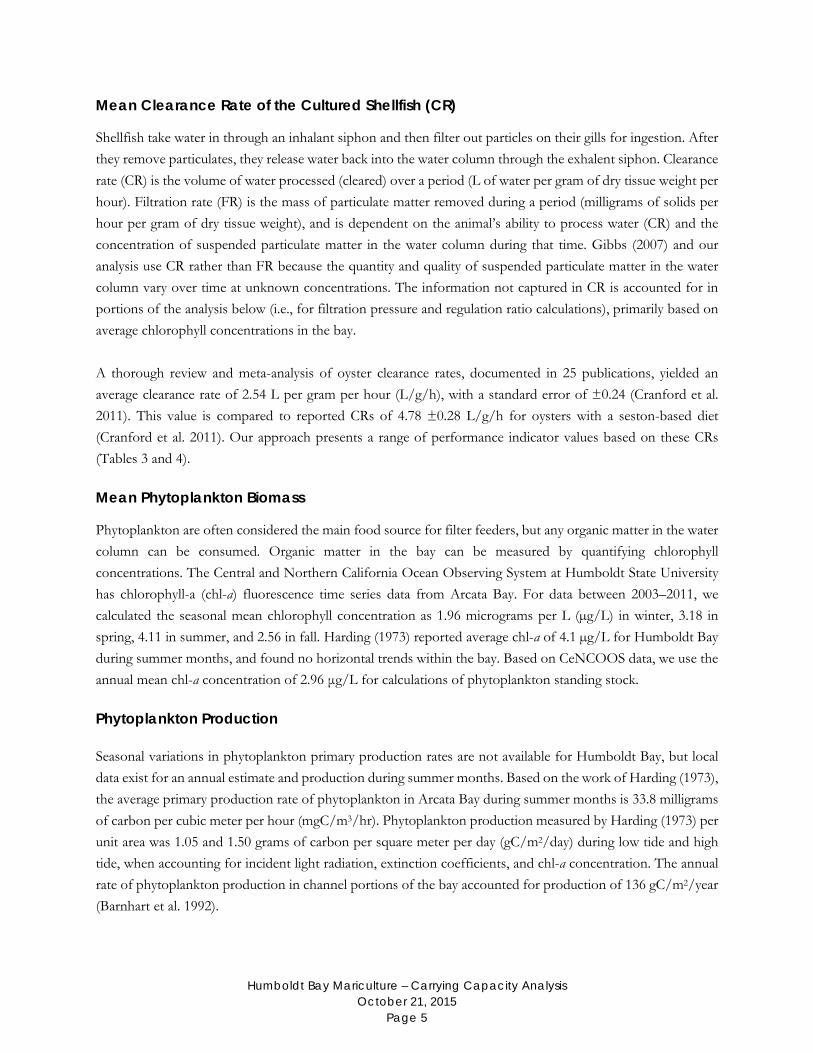
Mean Clearance Rate of the Cultured Shellfish (CR)
Shellfish take water in through an inhalant siphon and then filter out particles on their gills for ingestion. After they remove particulates, they release water back into the water column through the exhalent siphon. Clearance rate (CR) is the volume of water processed (cleared) over a period (L of water per gram of dry tissue weight per hour). Filtration rate (FR) is the mass of particulate matter removed during a period (milligrams of solids per hour per gram of dry tissue weight), and is dependent on the animal’s ability to process water (CR) and the concentration of suspended particulate matter in the water column during that time. Gibbs (2007) and our analysis use CR rather than FR because the quantity and quality of suspended particulate matter in the water column vary over time at unknown concentrations. The information not captured in CR is accounted for in portions of the analysis below (i.e., for filtration pressure and regulation ratio calculations), primarily based on average chlorophyll concentrations in the bay. A thorough review and meta-analysis of oyster clearance rates, documented in 25 publications, yielded an average clearance rate of 2.54 L per gram per hour (L/g/h), with a standard error of ±0.24 (Cranford et al. 2011). This value is compared to reported CRs of 4.78 ±0.28 L/g/h for oysters with a seston-based diet (Cranford et al. 2011). Our approach presents a range of performance indicator values based on these CRs (Tables 3 and 4).
Mean Phytoplankton Biomass
Phytoplankton are often considered the main food source for filter feeders, but any organic matter in the water column can be consumed. Organic matter in the bay can be measured by quantifying chlorophyll concentrations. The Central and Northern California Ocean Observing System at Humboldt State University has chlorophyll-a (chl-a) fluorescence time series data from Arcata Bay. For data between 2003–2011, we calculated the seasonal mean chlorophyll concentration as 1.96 micrograms per L (µg/L) in winter, 3.18 in spring, 4.11 in summer, and 2.56 in fall. Harding (1973) reported average chl-a of 4.1 µg/L for Humboldt Bay during summer months, and found no horizontal trends within the bay. Based on CeNCOOS data, we use the annual mean chl-a concentration of 2.96 μg/L for calculations of phytoplankton standing stock.
Phytoplankton Production
Seasonal variations in phytoplankton primary production rates are not available for Humboldt Bay, but local data exist for an annual estimate and production during summer months. Based on the work of Harding (1973), the average primary production rate of phytoplankton in Arcata Bay during summer months is 33.8 milligrams of carbon per cubic meter per hour (mgC/m3/hr). Phytoplankton production measured by Harding (1973) per unit area was 1.05 and 1.50 grams of carbon per square meter per day (gC/m2/day) during low tide and high tide, when accounting for incident light radiation, extinction coefficients, and chl-a concentration. The annual rate of phytoplankton production in channel portions of the bay accounted for production of 136 gC/m2/year (Barnhart et al. 1992).
Humboldt Bay Mariculture – Carrying Capacity Analysis October 21, 2015
Page 6
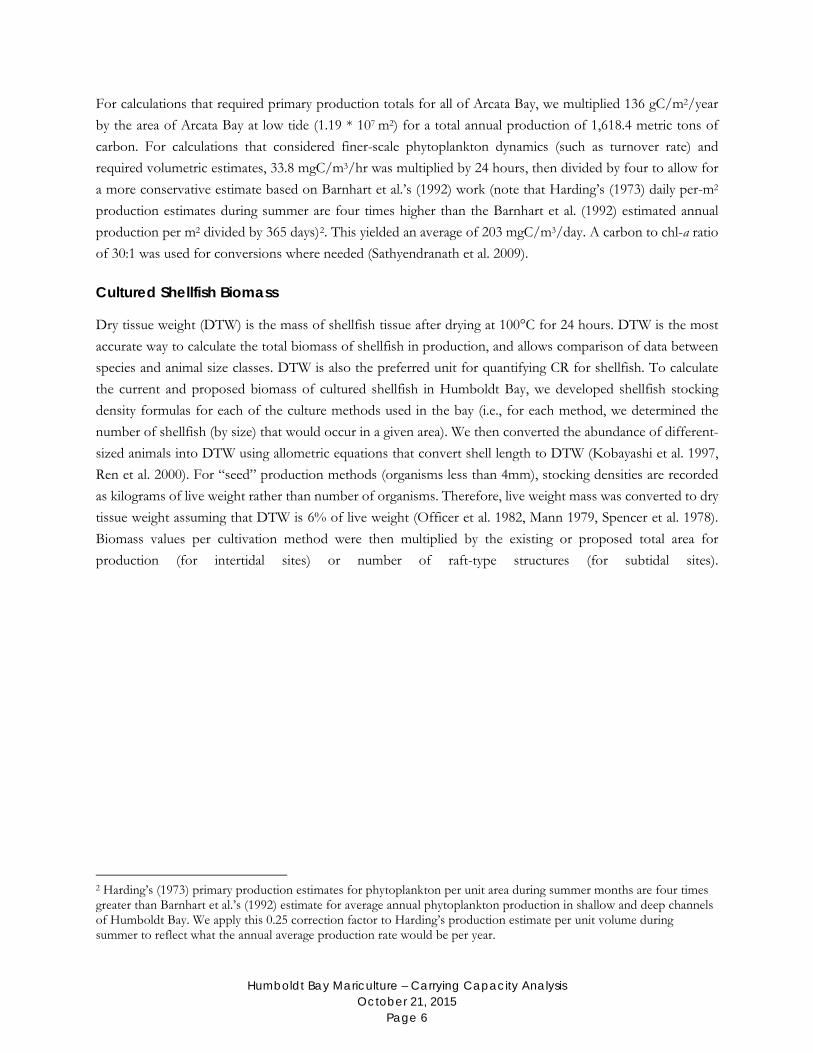
For calculations that required primary production totals for all of Arcata Bay, we multiplied 136 gC/m2/year by the area of Arcata Bay at low tide (1.19 * 107 m2) for a total annual production of 1,618.4 metric tons of carbon. For calculations that considered finer-scale phytoplankton dynamics (such as turnover rate) and required volumetric estimates, 33.8 mgC/m3/hr was multiplied by 24 hours, then divided by four to allow for a more conservative estimate based on Barnhart et al.’s (1992) work (note that Harding’s (1973) daily per-m2 production estimates during summer are four times higher than the Barnhart et al. (1992) estimated annual production per m2 divided by 365 days)2. This yielded an average of 203 mgC/m3/day. A carbon to chl-a ratio of 30:1 was used for conversions where needed (Sathyendranath et al. 2009).
Cultured Shellfish Biomass
Dry tissue weight (DTW) is the mass of shellfish tissue after drying at 100°C for 24 hours. DTW is the most accurate way to calculate the total biomass of shellfish in production, and allows comparison of data between species and animal size classes. DTW is also the preferred unit for quantifying CR for shellfish. To calculate the current and proposed biomass of cultured shellfish in Humboldt Bay, we developed shellfish stocking density formulas for each of the culture methods used in the bay (i.e., for each method, we determined the number of shellfish (by size) that would occur in a given area). We then converted the abundance of different-sized animals into DTW using allometric equations that convert shell length to DTW (Kobayashi et al. 1997, Ren et al. 2000). For “seed” production methods (organisms less than 4mm), stocking densities are recorded as kilograms of live weight rather than number of organisms. Therefore, live weight mass was converted to dry tissue weight assuming that DTW is 6% of live weight (Officer et al. 1982, Mann 1979, Spencer et al. 1978). Biomass values per cultivation method were then multiplied by the existing or proposed total area for production (for intertidal sites) or number of raft-type structures (for subtidal sites).
2 Harding’s (1973) primary production estimates for phytoplankton per unit area during summer months are four times greater than Barnhart et al.’s (1992) estimate for average annual phytoplankton production in shallow and deep channels of Humboldt Bay. We apply this 0.25 correction factor to Harding’s production estimate per unit volume during summer to reflect what the annual average production rate would be per year.

Humboldt Bay Mariculture – Carrying Capacity Analysis October 21, 2015
Page 7
Figure 2. Allometric Relationships between Shell Length and Biomass for Pacific Oysters
(Kobayashi et al. 1997, Ren et al. 2000)
The current standing stock of Existing Culture in Humboldt Bay is approximately 13.46 metric tons DTW. This value includes all intertidal locations producing adult oysters as well as subtidal locations producing oyster and clam seed in raft-like structures. Unlike the Coast Project description (HBHRCD 2015), the Pre-Permitting Project description (HBHRCD 2014) does not specify the proportion of specific intertidal culture methods that would be used. For this carrying capacity assessment we assumed 1/3 basket-on-longline, 1/3 cultch-on-longline and 1/3 rack-and-bag methods3. The Coast Project and Pre-Permitting Project would add approximately 18.44 and 23.12 metric tons DTW respectively (Table 3)4. Hence, the total biomass of cultured shellfish in the bay, including from existing culture, the Pre-Permitting Project and the Coast Project would be approximately 55.02 metric tons DTW (Tables 3 and 4)5.
3 Also note that the Gibbs model is based on suspended shellfish culture whereas existing and proposed Humboldt Bay culture is elevated off the bottom (not suspended from the water surface) or suspended from rafts. However, the Gibbs model is ultimately based on biomass of cultured bivalves and is applicable to Humboldt Bay culture methods. 4 Biomass estimates presented here are lower than reported in the Pre-Permitting Project’s DEIR due to changes in assumptions of cultivation methods types, line spacing, and project sizes. 5 Calculations presented in this analysis utilize the shell length to DTW conversion equation presented by Kobayashi et al. (1997). Kobayashi’s equation results in a higher total biomass (55.02 metric tons) than the shell length to DTW conversion equation presented by Ren et al. (2000) (39.14 metric tons). Our use of the Kobayashi conversion results in a higher estimate of biomass.
0
0.5
1
1.5
2
2.5
3
3.5
4
4.5
0 20 40 60 80 100 120 140
Dry
Tis
sue
Wei
ght (
g)
Shell Length (mm)
Ren et al. (2000) Kobayashi et al. (1997)
Humboldt Bay Mariculture – Carrying Capacity Analysis October 21, 2015
Page 8
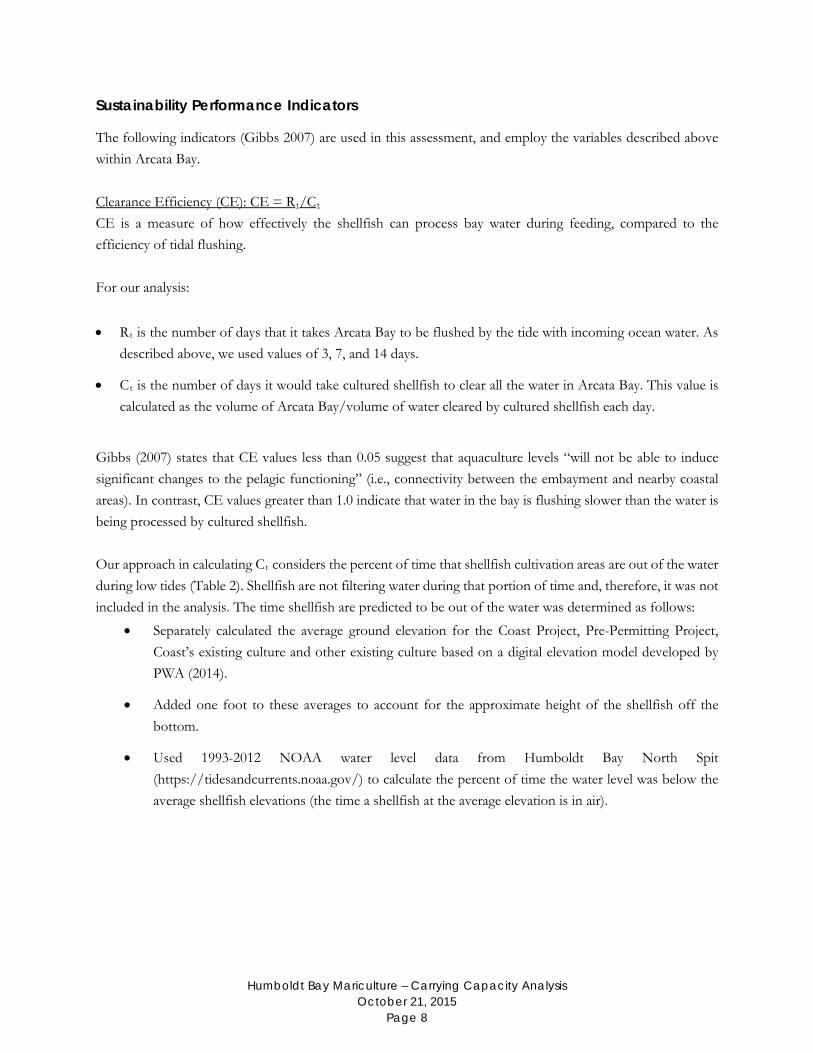
Sustainability Performance Indicators
The following indicators (Gibbs 2007) are used in this assessment, and employ the variables described above within Arcata Bay. Clearance Efficiency (CE): CE = Rt/Ct CE is a measure of how effectively the shellfish can process bay water during feeding, compared to the efficiency of tidal flushing. For our analysis:
• Rt is the number of days that it takes Arcata Bay to be flushed by the tide with incoming ocean water. As described above, we used values of 3, 7, and 14 days.
• Ct is the number of days it would take cultured shellfish to clear all the water in Arcata Bay. This value is calculated as the volume of Arcata Bay/volume of water cleared by cultured shellfish each day.
Gibbs (2007) states that CE values less than 0.05 suggest that aquaculture levels “will not be able to induce significant changes to the pelagic functioning” (i.e., connectivity between the embayment and nearby coastal areas). In contrast, CE values greater than 1.0 indicate that water in the bay is flushing slower than the water is being processed by cultured shellfish. Our approach in calculating Ct considers the percent of time that shellfish cultivation areas are out of the water during low tides (Table 2). Shellfish are not filtering water during that portion of time and, therefore, it was not included in the analysis. The time shellfish are predicted to be out of the water was determined as follows:
• Separately calculated the average ground elevation for the Coast Project, Pre-Permitting Project, Coast’s existing culture and other existing culture based on a digital elevation model developed by PWA (2014).
• Added one foot to these averages to account for the approximate height of the shellfish off the bottom.
• Used 1993-2012 NOAA water level data from Humboldt Bay North Spit (https://tidesandcurrents.noaa.gov/) to calculate the percent of time the water level was below the average shellfish elevations (the time a shellfish at the average elevation is in air).

Humboldt Bay Mariculture – Carrying Capacity Analysis October 21, 2015
Page 9
Table 2. Percent of Time Out of Water for Existing and Proposed Shellfish Culture
Condition Percent of year out of water
Pre-Permitting Project 32%
Coast Expansion 11%
Coast Existing 16%
Other Existing 26%
Filtration Pressure (FP): FP = Bf/Pp FP is an indicator of the consumption of phytoplankton-derived carbon by cultured shellfish compared to the total carbon generated by phytoplankton in the bay. FP also gives an estimate of how much of this energy has been redirected to aquaculture rather than other consumers of this resource. This indicator encompasses the carbon resource flows in a region, but does not account for connectivity with nearby coastal regions, as CE does. For our analysis:
• Bf is the total carbon extracted from the water column by the shellfish culture every year, and is calculated as follows:
Total volume cleared per year * amount of carbon in that volume = (total volume cleared per hour * 24 hours * 365 days) * (2.96 µg chl-a/L * 30:1 carbon ratio/ 1,000,000 µg per gram)
• Pp is the total carbon fixed by autotrophs in the bay each year, and is calculated as follows:
Production rate * area = 136 gC/m2/year * 1.19 * 107 m2 at low tide in Arcata Bay Gibbs (2007) states that FP values less than 0.05 indicate that very little of the carbon resources generated in the growing region is passing through the culture, suggesting that the culture is having little impact on the system. Values close to 1.0 indicate that the level of culture is nearing the production capacity. Regulation Ratio (RR): RR = Tc/Tp RR gives a measure of how much control cultured shellfish have on the algal population in the bay by comparing how fast the phytoplankton are turning over (doubling time) to their extraction by cultured shellfish (i.e., finding what percent of phytoplankton is being consumed by shellfish). For our analysis:
• Tc is the ratio of the daily volume of water cleared by the shellfish to the total volume of water in the growing region, and is calculated as follows:
(CR * biomass * 24 hours)/volume of Arcata Bay
• Tp is the phytoplankton turnover rate, and is calculated from the ratio of the daily mean phytoplankton production (gC/m3/day) to the daily mean phytoplankton concentration (mg/m3) converted to carbon (gC/m3). This is calculated as follows:

Humboldt Bay Mariculture – Carrying Capacity Analysis October 21, 2015
Page 10
Daily mean phytoplankton production/daily mean phytoplankton concentration = (33.88 mgC/m3/hr * 24 hours * 0.25 [correction factor])6/(2.96 mg/m3 average chl concentration * 30:1 carbon ratio)
Based on Gibbs (2007), values less than 0.05 suggest that cultured shellfish are playing a minor role in phytoplankton dynamics (i.e., growth regulation). Values closer to 1.0 suggest that the cultured shellfish control the phytoplankton dynamics in the growing region, implying that there may be costs to competitors that rely on phytoplankton.
Results and Discussion
The objective of the work presented here is to use Gibbs’ (2007) sustainability performance indicators to assess, from three perspectives, the potential impacts of cultured shellfish on their food sources (Tables 3 and 4):
• CE accounts for the percent of the total water volume in an embayment that shellfish filter in comparison to the rate at which it is flushed with the ocean.
• FP accounts for the amount of carbon that is fixed by phytoplankton in the system compared to the amount removed by cultured shellfish through feeding.
• RR accounts for the percent of the bay that is filtered by shellfish each day and the ability of that filtration to regulate phytoplankton growth.
Table 3. Analysis of Cultured Shellfish Biomass and Related Sustainability Performance Indicator Values (Assuming a Clearance Rate of 2.54 L/g/h)
Condition Biomass
(DTW MT)
Clearance Efficiency Filtration Pressure
Regulation Ratio
CE3 CE7 CE14 FP RR
Coast Existing 10.09 0.018 0.042 0.085 0.010 0.003
Coast Proposed 18.44 0.035 0.082 0.165 0.020 0.005
Other Existing 3.38 0.005 0.013 0.025 0.003 0.001
Mariculture Pre-Permitting Intertidal 19.83 0.029 0.068 0.135 0.016 0.004
Mariculture Pre-Permitting Subtidal 3.29 0.005 0.011 0.022 0.003 0.001
All Projects 55.02 0.088 0.205 0.410 0.050 0.013
6 See footnote 2 above for explanation of the 0.25 correction factor.

Humboldt Bay Mariculture – Carrying Capacity Analysis October 21, 2015
Page 11
Table 4. Analysis of Cultured Shellfish Biomass and Related Sustainability Performance Indicator Values (Assuming a Clearance Rate of 4.78 L/g/h)
Condition Biomass
(DTW MT)
Clearance Efficiency Filtration Pressure
Regulation Ratio
CE3 CE7 CE14 FP RR
Coast Existing 10.09 0.034 0.080 0.160 0.019 0.005
Coast Proposed 18.44 0.066 0.155 0.310 0.038 0.010
Other Existing 3.38 0.010 0.024 0.047 0.006 0.001
Mariculture Pre-Permitting Intertidal 19.83 0.055 0.127 0.254 0.031 0.008
Mariculture Pre-Permitting Subtidal 3.29 0.009 0.021 0.042 0.005 0.001
All Projects 55.02 0.165 0.386 0.771 0.094 0.024
Clearance Efficiency
CE was calculated three ways, using flushing rates of 3, 7, and 14 days, to address different estimates of flushing rates based on several different flushing estimates (Tables 3 and 4). Total CE values calculated assuming a CR of 2.54 L/g/h range between 0.09 and 0.41, and CE values calculated assuming a CR of 4.78 L/g/h range between 0.17 and 0.77. The highest CE value occurs when including all potential and existing culture, with the assumption of the higher clearance rate and longer residence time of 14 days. Although this maximum value suggests that just over ¾ of Arcata Bay will be filtered by cultivated shellfish each day, it is important to consider that this metric only considers the water itself and does not account for phytoplankton (food) abundance or production in the bay.
Filtration Pressure
Total FP values for proposed and existing culture range between 0.05 and 0.09 when analyzed with 2.54 and 4.78 CRs respectively, indicating that the vast majority of carbon fixed by phytoplankton remains available to non-cultured species. Additionally, the primary production estimates used to calculate FP are conservative, in that they assume that production occurs only in the area of Arcata Bay occupied by water all day (i.e. low tide area), and do not account for productivity in waters over mudflats during high tide, a situation which could add 30% more carbon to the system during ideal conditions (Headstrom 1994). Moreover, including other sources of particulate organic matter, such as detritus and benthic microalgae, to the total carbon available in the bay would be appropriate, but a lack of local data prevents us from including these resources in the analysis with reasonable confidence. By not including detritus and benthic microalgae in our analysis, our estimates of FP are likely higher than the actual filtration pressure. Additionally, some resources in the bay are generated in response to the presence of the shellfish, through nutrient recycling in the microbial loop, and a large proportion of the carbon passing through the shellfish culture gets recycled through the ecosystem again (Gibbs 2007) (Figure 3).

Humboldt Bay Mariculture – Carrying Capacity Analysis October 21, 2015
Page 12
To check our estimates of biomass for accuracy, we compared them to estimates made by Gibbs (2007). Gibbs (2007) commented that bivalves consume five times their biomass (5:1). We compared our shellfish carbon-biomass calculations to our calculations of the amount of carbon consumed, resulting in an average 3.8:1 ratio at a CR of 2.54 L/g/h and 7.1:1 at a CE of 4.78. Our estimates correspond well with Gibbs (2007).
Figure 3. Theoretical Food Web in Aquaculture Area, with Culture Included; Arrows Represent Flow of Energy (Carbon) through the Web; Only the Major Energy Pathways are Shown. Source: Modified from Gibbs 2007
Regulation Ratio
All RR values in this analysis are well below the 0.05 threshold (Tables 3 and 4). The fast phytoplankton turnover rate (Tp=2.28) creates conditions under which the standing stock could replace itself several times per day. RR values suggest that the existing and proposed shellfish culture would have a negligible role in phytoplankton dynamics.
Conclusions
The sustainability performance indicators used in this analysis address the potential effects of current and proposed shellfish culture in Arcata Bay. As described above, where there is data uncertainty, all our assumptions err conservatively towards higher potential effects to phytoplankton abundance (food resources). For example:

Humboldt Bay Mariculture – Carrying Capacity Analysis October 21, 2015
Page 13
• The primary production estimates used to calculate FP do not account for productivity in waters over mudflats during high tide, a situation which could add 30% more carbon to the system during ideal conditions (Headstrom 1994).
• Particulate organic matter types other than phytoplankton, such as detritus and benthic microalgae, are potentially important food sources that are not considered in this analysis due to a lack of local data on which to base the analysis.
• We assume that all shellfish are constantly feeding while submerged under water, which is an overestimate because shellfish particulate consumption varies with sediment concentration. For example, when total particulate matter in the water column is over 5 mg/L, gills start to clog, affecting respiration and triggering a reduction in the clearance rate (Cranford et al. 2011; Galimany et al. 2013).
• Nutrient recycling by the shellfish is not considered, where excreted inorganic nutrients can be taken up by phytoplankton directly or regenerated by bacteria into inorganic nutrients that can stimulate phytoplankton growth.
CE values indicate that the amount of filtration by cultured shellfish in Arcata Bay may already be greater than 5% of the bay’s flushing rate with adjacent waters, and that with the quantity of shellfish proposed by the Pre-Permitting Project and Coast Project, filtration could approach the flushing rate (i.e., CE value of 0.77 assuming a worst-case scenario flushing rate and the higher of the two CRs). However, unlike the other metrics, it is not necessarily detrimental for an ecosystem to have CE values this high. CE does not account for the amount of organic matter in the water, primary production rates, and the ability of the resources being consumed to be rapidly recirculated into the ecosystem though fecal decomposition, the microbial loop, and subsequent new primary production. While a CE value above one indicates that the clearance rate exceeds the flushing rate, it does not answer the more pertinent question of what impact that flushing has on available amounts of carbon and phytoplankton within the ecological system. While all metrics must be considered together, FP and RR are better metrics to specifically address what cumulative impact the projects will have on available food resources in Humboldt Bay. The FP calculations based on the higher CR indicate that 9% of the carbon fixed by phytoplankton in the bay would be diverted to cultured shellfish and 5% would be diverted assuming the lower CR. It is noteworthy that these calculations do not take into account a large portion of carbon consumed by shellfish that doesn’t leave the bay when the shellfish are harvested, but is recycled in the ecosystem7. Lastly, the RR value is below 0.05 for all levels of shellfish culture analyzed. This metric directly pertains to the regulation of phytoplankton dynamics and best answers our research question. The phytoplankton turnover rate is too fast to be significantly affected by current and proposed shellfish culture, and therefore the
7 This includes feces and pseudo-feces produced by shellfish.

Humboldt Bay Mariculture – Carrying Capacity Analysis October 21, 2015
Page 14
cumulative impact from existing culture and the proposed projects appears to be negligible as measured by this metric. These performance indicator metrics provide useful guidance for assessing the cumulative effects of current and proposed shellfish culture on food resources in Arcata Bay. CE values are relatively high, particularly when employing the conservative assumptions of slow flushing rates and a higher CR. However, CE does not consider the actual food resources (e.g., phytoplankton). Values for the metrics that do consider food resources (i.e., for FP and RR) are substantially lower. This provides an indication that, for its size, Humboldt Bay is highly productive and this productivity can withstand a substantial cultured shellfish density without affecting food resources available to other organisms in the bay. This is likely due to strong upwelling events in nearby ocean waters coupled with rapid phytoplankton turnover rates. Considered together, the performance indicators provide an indication that existing and proposed shellfish culture would have some effect on bay conditions but that food resources are abundant enough that non-cultured (wild) species will not be significantly affected by changes in food availability resulting from the Coast Project and Pre-Permitting Project.
References
Anderson, J. 2010. A Three-dimensional Hydrodynamic and Transport Model of Humboldt Bay. Poster session presented at the 2010 Humboldt Bay Symposium. Eureka, California.
Barnhart, R. A., M. J. Boyd, and J. E. Pequegnat. 1992. The Ecology of Humboldt Bay, California: An Estuarine
Profile (No. FWS-1). California Cooperative Fishery Research Unit, Arcata, California. Bricker, S., B. Longstaff, W. Dennison, A. Jones, K. Boicourt, C. Wicks, and J. Woerner. 2007. Effects of
Nutrient Enrichment in the Nation’s Estuaries: A Decade of Change. NOAA Coastal Ocean Program Decision Analysis Series No. 26. National Centers for Coastal Ocean Science, Silver Spring, Maryland.
[CDHS] California Department of Health Services. 2006. Twelve-year Sanitary Report: Shellfish Growing Area
Classification for Humboldt Bay. Technical Report # 06-11. [online]. http://coastalwatersheds .ca.gov/portals/1/humboldtbay/monitor/docs/WtQual_CDPH_sanitary1.pdf.
Cranford, P. J., J. E. Ward, and S. E. Shumway. 2011. Shellfish filter feeding: Variability and limits of the
aquaculture biofilter. In S. E. Shumway, Editor. Shellfish aquaculture and the environment. p 81-124. John Wiley & Sons, Inc.
Galimany, E., J. M. Rose, M. S. Dixon, and G. H. Wikfors. 2013. Quantifying feeding behavior of ribbed
mussels (Geukensia demissa) in two urban sites (Long Island Sound, USA) with different seston characteristics. Estuaries and Coasts 36(6):1265-1273.

Humboldt Bay Mariculture – Carrying Capacity Analysis October 21, 2015
Page 15
Gast, J. A, and D. G. Skeesick. 1964. The circulation, water quality, and sedimentation of Humboldt Bay. Special Report, Humboldt State College, Department of Oceanography. Issue 2.
Gibbs, M. T. 2007. Sustainability performance indicators for suspended shellfish aquaculture
activities. Ecological Indicators 7(1):94-107. Harding, L. W. 1973. Primary Production in Humboldt Bay. Master’s thesis. Humboldt State University, Arcata,
California. Headstrom, W. 1994. The Effects of Tides on the Inception of Phytoplankton Blooms in Lagoon-type
Estuaries. Master’s thesis. Humboldt State University, Arcata, California. Herman, P. M. J. 1993. A set of models to investigate the role of benthic suspension feeders in estuarine
ecosystems. In R. F. Dame, Editor. Bivalve filter feeders in estuarine and coastal ecosystem processes. p 421-454. Springer-Verlag, Heidelberg.
[HBHRCD] Humboldt Bay Harbor, Recreation and Conservation District. 2014. Notice of Preparation of a
Draft Environmental Impact Report for the Humboldt Bay Mariculture Pre-Permitting Project. Humboldt Bay Harbor, Recreation and Conservation District. Eureka, California.
[HBHRCD] Humboldt Bay Harbor, Recreation and Conservation District. 2015. Draft Environmental Impact
Report for the Coast Seafoods Company Humboldt Bay Permit Renewal and Expansion Project. Humboldt Bay Harbor, Recreation and Conservation District. Eureka, California.
Kobayashi, M., E. E. Hofmann, E. N. Powell, J. M. Klinck, and K. Kusaka. 1997. A population dynamics model
for the Japanese oyster, Crassostrea gigas. Aquaculture 149(3):285-321. Mann, R. 1979. The effect of temperature on growth, physiology, and gametogenesis in the Manila clam Tapes
philippinarum (Adams and Reeve 1850). Journal of Experimental Marine Biology and Ecology 38(2):121-133.
Officer, C. B., T. J. Smayda, and R. Mann. 1982. Benthic filter feeding: a natural eutrophication control. Marine
Ecology Progress Series, 9(2), 203-210. Pacific Watershed Associates (PWA). 2014. Humboldt Bay Sea Level Rise Vulnerability Assessment: DEM
Development Report, Final Draft. Prepared for Northern Hydrology & Engineering. PWA, McKinleyville, CA. PWA Report No. 14100351, February 2014.
Ren, J. S., A. H. Ross, and D. R. Schiel. 2000. Functional descriptions of feeding and energetics of the Pacific
oyster Crassostrea gigas in New Zealand. Marine Ecology Progress Series, 208, 119-130.

Humboldt Bay Mariculture – Carrying Capacity Analysis October 21, 2015
Page 16
Sathyendranath, S., V. Stuart, A. Nair, K. Oka, T. Nakane, H. Bouman, M. Forget, H. Maass, and T Platt. 2009.
Carbon-to-chlorophyll ratio and growth rate of phytoplankton in the sea. Marine Ecology Progress Series 383:73-84.
Spencer, B. E., D. Key, P. F. Millican, and M. J. Thomas. 1978. The effect of intertidal exposure on the growth
and survival of hatchery-reared Pacific oysters (Crassostrea gigas Thunberg) kept in trays during their first ongrowing season. Aquaculture, 13(3), 191-203.
Humboldt Bay Mariculture – Carrying Capacity Analysis October 21, 2015
Page 17
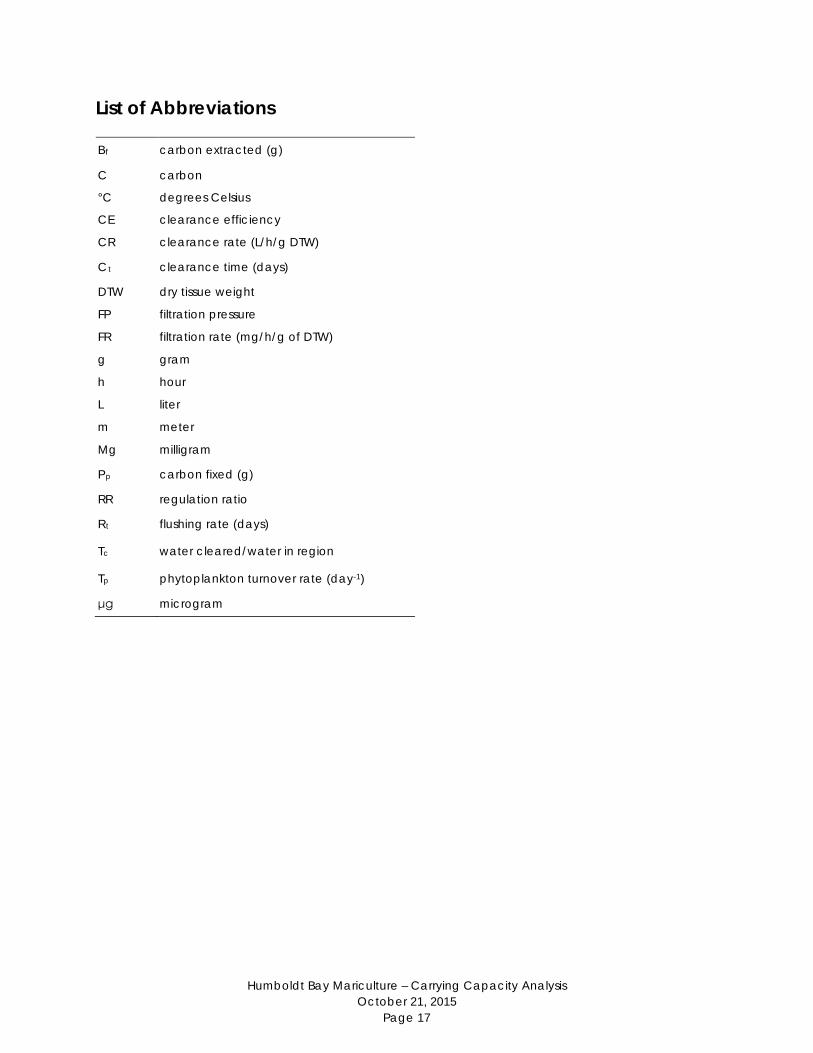
List of Abbreviations
Bf carbon extracted (g)
C carbon
°C degrees Celsius
CE clearance efficiency
CR clearance rate (L/h/g DTW)
Ct clearance time (days)
DTW dry tissue weight
FP filtration pressure
FR filtration rate (mg/h/g of DTW)
g gram
h hour
L liter
m meter
Mg milligram
Pp carbon fixed (g)
RR regulation ratio
Rt flushing rate (days)
Tc water cleared/water in region
Tp phytoplankton turnover rate (day-1)
μg microgram