appendix g: nccu station refinement supplemental...
TRANSCRIPT

APPENDIX G: NCCU Station Refinement Supplemental Noise and Vibration Analysis
Durham-Orange Light Rail Transit Project
October 2016
NCCU Stat ion Refinement Supplemental Noise and Vibration Analysis
Durham-Orange Light Rail Transit Project | October 2016 | 1
1. IntroductionThis Durham-Orange Light Rail Transit (D-O LRT) Project Supplemental Noise and Vibration Analysis evaluates the potential noise and vibration impacts of the proposed North Carolina Central University (NCCU) Station Refinement (referred to herein as the NCCU Station Refinement). This analysis reviews the noise and vibration impacts previously disclosed for the D-O LRT Project in the D-O LRT Noise and Vibration Technical Report, Draft Environmental Impact Statement (DEIS), and the Combined Final Environmental Impact Statement (FEIS)/Record of Decision (ROD). These impacts are then compared to the impacts anticipated for the NCCU Station Refinement.
The NCCU Station Refinement includes the following changes and new information with the potential to affect adjacent noise and vibration receptors:
Reconfigured Alston Avenue Station and Park and Ride Lot: The original alignment terminatedon Pettigrew Street with a station west of Alston Avenue. The station’s parking deck included atotal of 980 spaces. The reconfigured alignment would pass Grant Street along Pettigrew Street,and veer south diagonally towards Alston Avenue and Highway 147. The new proposed AlstonAvenue Station would be located between Grant Street and Gillette Avenue, with approximately280 surface parking spaces. A new parking deck would be located on the southeast corner ofPettigrew Street and Alston Avenue with approximately 920 parking spaces.
Extension of the light rail alignment along South Alston Avenue to new NCCU Station at EastLawson Street: The refined alignment would leave the Alston Avenue Station, crossing overHighway 147 on aerial structure, with elevated track touching back to grade at the existingintersection of Linwood Avenue. The tracks would continue between the northbound andreconstructed southbound lanes until just north of East Lawson Street where it will terminate atthe NCCU Station between Dupree Street and East Lawson Street. Widening of Alston Avenue toaccommodate the light rail guideway will occur on the west side. Except for the aerial structure,the tracks will be constructed on a ballast base. The aerial structure will include direct fixationtracks on the structure’s deck.
2. Noise AnalysisThe noise analysis follows the same methodology presented in the D-O LRT Noise and Vibration Technical Report, which complies with the FTA Transit Noise and Vibration Impact Assessment, May 2006 (FTA guidance manual). The D-O LRT Noise and Vibration Technical Report evaluated the D-O LRT Project and project alternatives presented in the Draft Environmental Impact Statement (DEIS). The Combined FEIS/ROD provides a summary of impacts and mitigation commitments for the D-O LRT Project.
The track alignment plan and profile drawings for the NCCU Station Refinement were used to evaluate the proximity between the centerline of the proposed light rail track and the adjacent noise sensitive receptors. Noise sensitive receptor locations used to determine the distance of a receptor from the proposed transit facility are located at the closest usable space on the receptor property. The closest usable space is defined as the portion of a receptor property closest to the proposed transit facility where residents or property users would normally be impacted by noise and/or vibration. Where the proposed alignment change varies from the alignment disclosed in the Combined FEIS/ROD, the greatest shift in track alignment was used as a worst-case condition.

NCCU Stat ion Refinement Supplemental Noise and Vibration Analysis
Durham-Orange Light Rail Transit Project | October 2016 | 2
In addition to the proximity of the track alignment, other noise generating elements were considered in this noise analysis, including: increases in traffic near station park and ride lots, the introduction of new at-grade crossings, and the addition of other project elements like traction power substations and crossovers.
It is anticipated that the increased number of parking spaces and change in location of the park and ride garage would result in changes to traffic, which may increase noise levels. In addition, the operation of the train would introduce new sounds associated with the steel wheels operating on the rail, the sounding of bells before an at-grade crossing, and before entering the station. However, the use of horns in regular rail operations are not anticipated, as the light rail vehicles will only sound horns in emergency situations. For this reason, horns are not included in this analysis.
Finally, light rail vehicle specifications were assumed to include damped or resilient wheels such that noise from wheel squeal on tight radii curves would be minimized. Other elements that contribute to ground borne noise or vibration are discussed under the Vibration Analysis section of this document.
Figures 1 and 2 show the location of noise and vibration sensitive receptors, new noise monitoring locations, and impact areas from vibration and/or ground-borne noise.
2.1 September 2016 Noise Measurements
As shown in Figure 1, ambient noise measurements were performed at three representative locations along light rail alignment for the NCCU Station Refinement. These measurements were conducted on Tuesday September 13th and Wednesday September 14th 2016 using a Larson Davis 712 Type II sound level meter. Monitoring was conducted for approximately 20 minute periods at each site during the morning peak hours (6:30 a.m. to 8:00 a.m.), midday (11:30 a.m. to 1:00 p.m.), evening peak hours (5:00 p.m. to 6:30 p.m.), and late night (8:30 p.m. to 10:00 p.m.) periods during the week. Additional detail on the noise monitoring sites and the data collected is included in Appendix A of this report.
This information was then extrapolated to 1 hour for the Leq and to 24 hours for the Ldn equivalents. In order to compute the Ldn and ensure a conservative estimate, the lowest measurement from AM and PM measurements was used. Table 1 summarizes the results of the noise measurements and calculation of Ldn.
Table 1: Monitored Existing Noise Levels (dBA)
Monitoring Sites Peak Hour (Leq)
Ldn AM Midday PM Night
M1. Alston Avenue at Fleetwood Street 63.1 62.7 63.6 60.7 67.4 M2. Russell Memorial CME Church 71.4 69.4 72.0 67.7 74.5 M3. Gann Street 65.2 61.8 62.6 59.1 66.0
2.2 Reconfigured Alston Avenue Station and Park and Ride Lot
Under the proposed NCCU Station Refinement, the Alston Avenue Station and light rail alignment would shift from the location documented in the Combined FEIS/ROD on the north side of Pettigrew Street. Instead, the alignment would cross Pettigrew Street at-grade and diagonally east of Grant Street to run toward NC 147, west of the Alston Avenue NC 147 Bridge.
NCCU Stat ion Refinement Supplemental Noise and Vibration Analysis
Durham-Orange Light Rail Transit Project | October 2016 | 3
The reconfigured platform for the Alston Avenue Station would be located between Pettigrew Street and the Alston Avenue/NC 147 westbound on-ramp. Approximately 280 surface parking spaces would surround the station platform. Approximately 920 spaces of additional parking would be constructed in a new parking garage, which would be located in the southeast quadrant of Alston Avenue and Pettigrew Street.
The Alston Avenue station plan previously contained a parking garage, which would accommodate up to 980 parking spaces. This garage was originally proposed to be located within the footprint of the new surface parking and reconfigured station platform for the NCCU Station Refinement. However, the surface parking spaces would extend closer to the existing residential buildings on Colfax Street and Gillette Avenue than the garage location proposed under the Combined FEIS/ROD. Regardless of the park and ride configuration, it is not anticipated that the automobile traffic would differ from the existing traffic, and therefore traffic is not expected to be a significant source of noise.
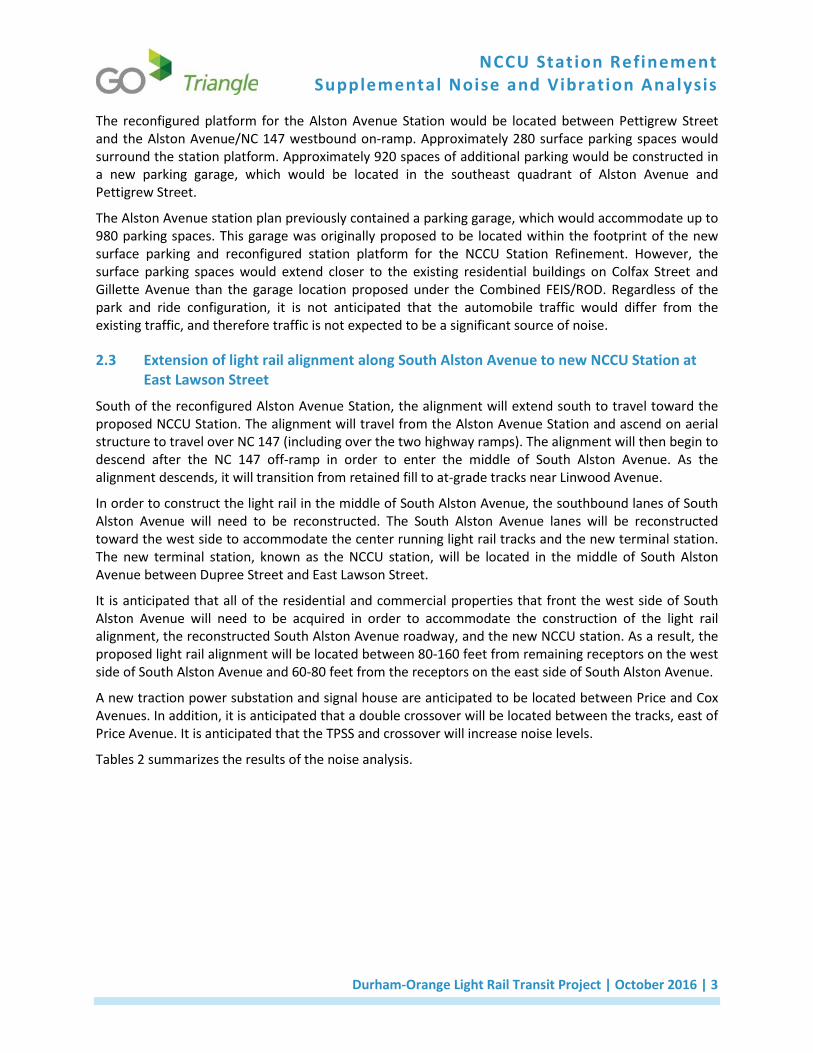
2.3 Extension of light rail alignment along South Alston Avenue to new NCCU Station at East Lawson Street
South of the reconfigured Alston Avenue Station, the alignment will extend south to travel toward the proposed NCCU Station. The alignment will travel from the Alston Avenue Station and ascend on aerial structure to travel over NC 147 (including over the two highway ramps). The alignment will then begin to descend after the NC 147 off-ramp in order to enter the middle of South Alston Avenue. As the alignment descends, it will transition from retained fill to at-grade tracks near Linwood Avenue.
In order to construct the light rail in the middle of South Alston Avenue, the southbound lanes of South Alston Avenue will need to be reconstructed. The South Alston Avenue lanes will be reconstructed toward the west side to accommodate the center running light rail tracks and the new terminal station. The new terminal station, known as the NCCU station, will be located in the middle of South Alston Avenue between Dupree Street and East Lawson Street.
It is anticipated that all of the residential and commercial properties that front the west side of South Alston Avenue will need to be acquired in order to accommodate the construction of the light rail alignment, the reconstructed South Alston Avenue roadway, and the new NCCU station. As a result, the proposed light rail alignment will be located between 80-160 feet from remaining receptors on the west side of South Alston Avenue and 60-80 feet from the receptors on the east side of South Alston Avenue.
A new traction power substation and signal house are anticipated to be located between Price and Cox Avenues. In addition, it is anticipated that a double crossover will be located between the tracks, east of Price Avenue. It is anticipated that the TPSS and crossover will increase noise levels.
Tables 2 summarizes the results of the noise analysis.

NCCU Stat ion Refinement Supplemental Noise and Vibration Analysis
Durham-Orange Light Rail Transit Project | October 2016 | 4
Table 2: Summary of Noise Impacts of NCCU Station Refinement
Receptor ID Receptors Name Distance to Track
& Bell (feet) Distance to
Source 2* (feet) Existing Noise
(dBA) Project
Noise (dBA) Impact Range
(dBA) Type of Impact
Reconfigured Alston Avenue Station and Park and Ride Lot R1 Grant Street House 470 200 66 50 62-67 No Impact R2 Colfax St. House 210 25 66 51 62-67 No Impact R3 Gillette Ave House 1 330 160 66 51 62-67 No Impact R4 Gillette Ave House 2 220 70 66 51 62-67 No Impact
Light Rail Alignment to NCCU Station R5 S. Alston East House E1 70 N/A 74 57 66-72 No Impact R6 CME Church 70 N/A 71 57 71-75 No Impact R7 S. Alston East House E2 60 N/A 67 57 63-67 No Impact R8 S. Alston East House E3 65 N/A 67 57 63-67 No Impact R9 S. Alston West House W1 80 N/A 74 55 66-72 No Impact
R10 S. Alston West House W2 160 100 67 54 63-67 No Impact R11 S. Alston West House W3 160 30 67 54 63-67 No Impact
Notes: * Source 2 represents surface parking, traction power substation, signal house, or crossover tracks.
NCCU Stat ion Refinement Supplemental Noise and Vibration Analysis
Durham-Orange Light Rail Transit Project | October 2016 | 5
2.4 Summary
As shown in Table 2, the NCCU Station Refinement would not result in noise impacts to the surrounding community.
3. Vibration Impacts The receptors used in the noise analysis were evaluated for potential vibration and ground borne noise impacts. Based on the vibration screening criteria (FTA Transit Noise and Vibration Impact Assessment, 2006) Category 2 residential land uses within 150 feet of the source of vibration and Category 3 (churches) within 100 feet of the source of vibration have a potential for vibration impacts. All other receptors at farther distances do not have the potential for vibration impacts. As a result, none of the receptors in the vicinity of the Alston Station were included in the analysis, and five new receptors along South Alston Avenue were evaluated, as shown in Table 3.
The primary ground-borne noise and vibration inducing elements of the extended alignment along South Alston Avenue include the placement of crossover tracks between Price Avenue and Cox Avenue, which results in an increase of 10 vibration decibels (VdB). As was the case in the original analysis document in the D-O LRT Noise and Vibration Technical Report, efficient soils were assumed within the study area, which result in 10 additional VdB added to all receptors. Conversely, the elevated structure over Highway 147 results in a reduction of 10 VdB to adjacent receptors.
Where receptors showed that an impact from ground-borne noise or vibration would occur, further analysis was conducted to determine the extent of impacted areas. Figures 1 and 2 show the location of noise and vibration sensitive receptors and impact areas from vibration and/or ground-borne noise.
3.1 Summary
As shown in Table 3, Receptors 7, 8 and 9 would result in either ground-borne noise and/or vibration impacts. The combination of both efficient soils and the placement of crossover track increases vibration levels by 20 VdB, resulting in greater impacts.
As noted above, based on the identification of impacted receptor areas, further analysis was done to determine the extent of impacts and the total number of potentially impacted receptors for each significant source of vibration. Based on that analysis, all wood-framed residential houses within 260 feet of the crossover tracks would be impacted by either vibration or ground-borne noise. This impact determination is based upon the additional vibration and ground-borne noise generated from light rail vehicles passing over the crossover tracks and the assumption of efficient soils transmission. Furthermore, for receptors located outside of the 260-foot impact zone from the crossover tracks, all wood-framed houses within 95 feet of the at-grade light rail alignment would be impacted by the light rail system, assuming the use of efficient soils. In total 26 residential properties would be impacted by either ground-borne noise or vibration, as a result of the extension of the alignment.
The assumption of efficient soil transmission is a major contributing factor to impacts at 23 residential properties along South Alston Avenue. For ten of the residential properties impacted, the placement of crossover tracks at the proposed location combined with the assumption of efficient soils are both contributing factors to the impact Figure 3 identifies the locations of potential vibration impacts.
As noted in the D-O LRT Noise and Vibration Technical Report, the FTA guidance requires projects that show impacts due to the use of efficient soils to conduct a detailed geotechnical analysis during final

NCCU Stat ion Refinement Supplemental Noise and Vibration Analysis
Durham-Orange Light Rail Transit Project | October 2016 | 6
design. The detailed analysis should also evaluate the effectiveness of appropriate mitigation measures, such as floating slabs, resiliently supported ties, high-resilience fasteners, and ballast mats, which are commonly used on transit systems to reduce vibration levels. This mitigation was included in the Combined FEIS/ROD; therefore, no additional mitigation is anticipated to be required.

NCCU Stat ion Refinement Supplemental Noise and Vibration Analysis
Durham-Orange Light Rail Transit Project | October 2016 | 7
Table 3: Summary of Vibration and Ground-Borne Noise Impacts of NCCU Station Refinement
Site #
Name/Location of Receptor Site
Distance (feet)
Base Curve1 (VdB)
Adjustments2 Vibration
VdB
Ground-Borne Noise
Ground-borne
Vibration impact?
Ground-borne Noise
impact? Speed Elevated
Structure Special Track Building Soils
(Efficient)
R5 S. Alston East House E1 70 70 -3 -10 -5 +10 62 27 No No
R6 CME Church 70 70 -3 -10 +10 67 32 No No R7 S. Alston East
House E2 60 71 -3 +10 -5 +10 83 48 Yes Yes
R8 S. Alston East House E3 65 71 -3 -5 +10 73 38 Yes Yes
R9 S. Alston West House W1 80 69 -3 -5 +10 71 36 No Yes
Notes: 1 FTA Guidance Manual, Figure 10-1, Generalized Ground Surface Vibration Curves. 2 FTA Guidance Manual, Table 10-1, Adjustment Factors for Generalized Predictions of Ground-Borne Vibration and Noise.

NCCU Stat ion Refinement Supplemental Noise and Vibration Analysis
Durham-Orange Light Rail Transit Project | October 2016 | 8
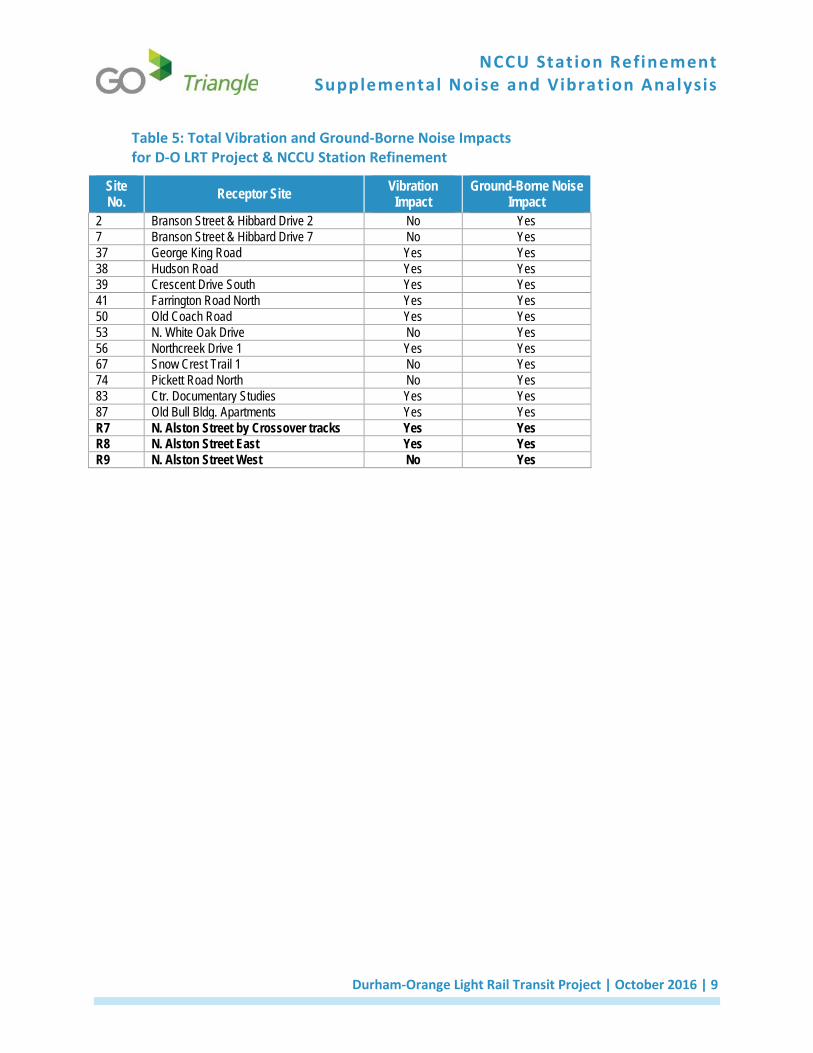
4. Comparison of Impacts to Combined FEIS/ROD Tables 4 and 5 identify the noise and vibration impacted sites from the D-O LRT Project summarized in the Combined FEIS/ROD and compares the impact to the anticipated impact for the NCCU Station Refinement. Since no new noise impacts are anticipated for the NCCU Station Refinement, there is no change to the impacts or mitigation documented in the Combined FEIS/ROD. As noted in Table 5, there are additional vibration and ground-borne noise impacts anticipated as a result of the NCCU Station Refinement. However, the existing mitigation to conduct geotechnical surveys to confirm the presence of efficient soils, would still apply.
Table 4: Total Noise Impacts D-O LRT Project & NCCU Station Refinement
Site No. Name/Location of Receptor Site Project
Noise Ambient
Noise Impact
Range dBA Impact1 Impact Source
2 UNC Odum Village Branson Street & Hibbard Drive 2 57 58 57-62 Moderate LRT, Bell
7 UNC Odum Village Branson Street & Hibbard Drive 7 64 58 57-62 Severe LRT, Bells
8 UNC Odum Village Branson Street & Hibbard Drive 8 61 58 57-62 Moderate LRT
37 Residence George King Road 60 59 58-63 Moderate LRT
52 Residence N. White Oak Drive 60 59 58-63 Moderate Park-and-
Ride Lot Source: Noise and Vibration Technical Report (appendix K.24). Notes: 1 There is no change to the noise impacts previously disclosed in the Combined FEIS/ROD, no new noise impacts are identified for the NCCU Station
Refinement.
NCCU Stat ion Refinement Supplemental Noise and Vibration Analysis
Durham-Orange Light Rail Transit Project | October 2016 | 9
Table 5: Total Vibration and Ground-Borne Noise Impacts for D-O LRT Project & NCCU Station Refinement
Site No. Receptor Site Vibration
Impact Ground-Borne Noise
Impact 2 Branson Street & Hibbard Drive 2 No Yes 7 Branson Street & Hibbard Drive 7 No Yes 37 George King Road Yes Yes 38 Hudson Road Yes Yes 39 Crescent Drive South Yes Yes 41 Farrington Road North Yes Yes 50 Old Coach Road Yes Yes 53 N. White Oak Drive No Yes 56 Northcreek Drive 1 Yes Yes 67 Snow Crest Trail 1 No Yes 74 Pickett Road North No Yes 83 Ctr. Documentary Studies Yes Yes 87 Old Bull Bldg. Apartments Yes Yes R7 N. Alston Street by Crossover tracks Yes Yes R8 N. Alston Street East Yes Yes R9 N. Alston Street West No Yes
NCCU Stat ion Refinement Supplemental Noise and Vibration Analysis
Durham-Orange Light Rail Transit Project | October 2016 | 10
Figure 1: Noise and Vibration Receptor Locations

NCCU Stat ion Refinement Supplemental Noise and Vibration Analysis
Durham-Orange Light Rail Transit Project | October 2016 | 11
Figure 2: Vibration or Ground-borne Noise Impacts
NCCU Stat ion Refinement Supplemental Noise and Vibration
Analysis
Durham-Orange Light Rail Transit Project | October 2016 | 12
Appendix A: Noise Monitoring Sites

Monitoring Sites
Sites
9 STl
9 ST2
9 ST3
St 0 �
0(.) Simmons st
Monument of.�.Faith Church
0u Massey 4
ve
Price4ve
'ST1/;::C
-, ox 4ve ..S
-S..£2? North Carolina Central ;:; e, University Bookstore
'so/"J St
a
@
il.l O'Kelly-Riddick Stadium DaYton Stts
q !I
� c:f •
Lovett Square
ST2 i; c;; c;;... ClJ "t, QI $ c::: ts:: - ..!g O Pl <21 -"'=
a. Jj � fMathison St -.J c5?
m
Burton ElerrGrant Park -ei School
�/.. Q'11son Stt5 � "fi Map data �016 Google �-


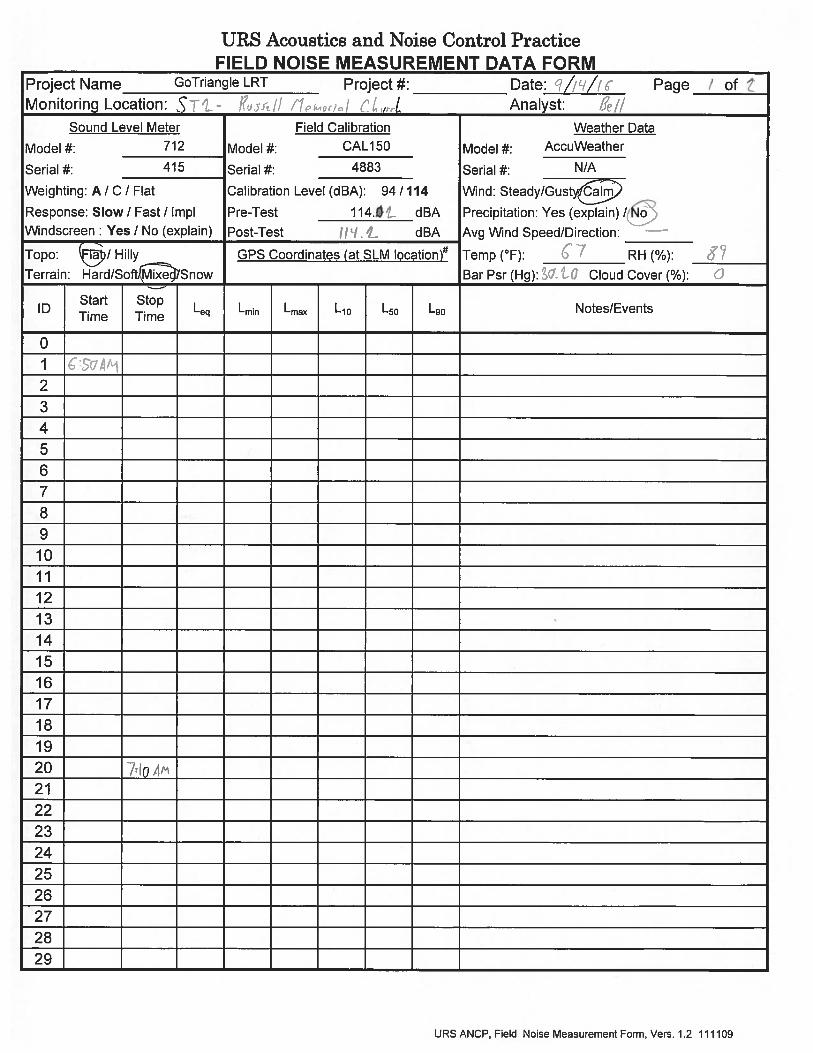
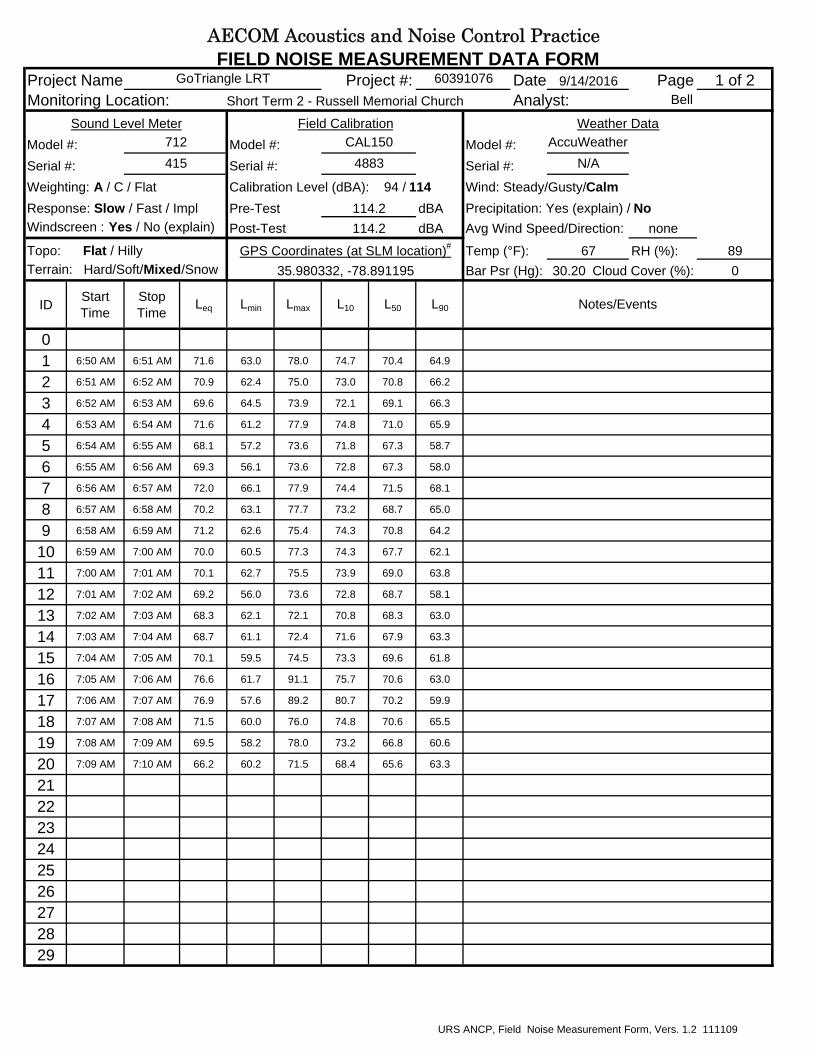
AECOM Acoustics and Noise Control PracticeFIELD NOISE MEASUREMENT DATA FORM
Project Name Project #: Date Page 1 of 2Monitoring Location: Analyst:
Model #: Model #: Model #:Serial #: Serial #: Serial #:Weighting: A / C / Flat Calibration Level (dBA): 94 / 114 Wind: Steady/Gusty/CalmResponse: Slow / Fast / Impl Pre-Test dBA Precipitation: Yes (explain) / NoWindscreen : Yes / No (explain) Post-Test dBA Avg Wind Speed/Direction: none
Topo: Flat / Hilly Temp (°F): RH (%): 89Terrain: Hard/Soft/Mixed/Snow Bar Psr (Hg): 30.22 Cloud Cover (%): 0
ID Start Time
Stop Time
Leq Lmin Lmax L10 L50 L90
01 6:25 AM 6:26 AM 60.5 51.0 65.9 63.6 59.9 52.6
2 6:26 AM 6:27 AM 63.5 55.4 71.2 67.0 60.9 57.1
3 6:27 AM 6:28 AM 65.5 57.6 74.0 69.5 63.2 59.0
4 6:28 AM 6:29 AM 62.6 55.5 68.1 65.9 60.8 57.0
5 6:29 AM 6:30 AM 61.1 53.0 66.0 63.8 60.9 54.7
6 6:30 AM 6:31 AM 57.8 49.7 65.5 61.6 54.6 50.6
7 6:31 AM 6:32 AM 61.2 52.7 67.3 64.5 59.8 54.6
8 6:32 AM 6:33 AM 64.0 52.2 72.2 66.9 62.3 54.7
9 6:33 AM 6:34 AM 62.0 50.4 71.2 65.8 56.5 50.9
10 6:34 AM 6:35 AM 61.5 50.9 65.8 64.6 61.3 52.0
11 6:35 AM 6:36 AM 64.2 52.4 73.9 68.4 59.5 53.8
12 6:36 AM 6:37 AM 60.2 51.8 67.5 64.0 57.9 53.6
13 6:37 AM 6:38 AM 65.1 51.8 71.5 69.5 61.6 54.3
14 6:38 AM 6:39 AM 65.4 53.5 75.7 68.7 61.5 55.6
15 6:39 AM 6:40 AM 61.0 53.4 68.3 64.5 59.4 54.6
16 6:40 AM 6:41 AM 63.6 55.0 70.1 66.0 62.8 57.5
17 6:41 AM 6:42 AM 64.5 50.0 72.5 69.6 58.5 50.6
18 6:42 AM 6:43 AM 61.8 54.3 65.6 64.5 61.6 55.8
19 6:43 AM 6:44 AM 63.4 51.8 73.4 67.7 59.4 55.1
20 6:44 AM 6:45 AM 64.5 52.6 70.1 67.3 63.8 54.9
212223242526272829
67
9/14/2016Short Term 1 - Alston Avenue at Fleetwood St
114.2114.2
GPS Coordinates (at SLM location)#
35.976969, -78.892513
Notes/Events
712 CAL150 AccuWeather415 4883 N/A
GoTriangle LRT 60391076Bell
Sound Level Meter Field Calibration Weather Data
URS ANCP, Field Noise Measurement Form, Vers. 1.2 111109
AECOM Acoustics and Noise Control PracticeFIELD NOISE MEASUREMENT DATA FORM
Speed (post/obs)*Number of LanesWidth (pave/row)
1- or 2- wayGrade
Bus StopsStoplights
Motorcycles
Automobiles
Medium TrucksHeavy TrucksBusesCount duration
# - note coordinate system * - Speed estimated by Radar / Driving / Observation
Yes/NoAdditional Notes/Comments:
Additional Notes and Sketches on Reverse
10 minutes
See hand-drawn sketch
nonenone
none
nonenonenone
1 NB/1 SB2 NB/2 SB3 NB/2 SB10 minutes
25 mph1/124'
2nonenone
2none
1none
1 NB/0 SB
78 NB93 SB
Photos Taken?
Other Noise Sources: distant: aircraft/roadway traffic/trains/landscaping/rustling leaves/children playing/dogs barking/birds vocalizing/Insects
Alston NB/SB Fleetwood EB/WB
35 mph2/248'
Monitoring Location: ST1 - Morning
Roadway Name/Dir compass Site Diagram:
URS ANCP, Field Noise Measurement Form, Vers. 1.2 111109


AECOM Acoustics and Noise Control PracticeFIELD NOISE MEASUREMENT DATA FORM
Project Name Project #: Date Page 1 of 2Monitoring Location: Analyst:
Model #: Model #: Model #:Serial #: Serial #: Serial #:Weighting: A / C / Flat Calibration Level (dBA): 94 / 114 Wind: Steady/Gusty/CalmResponse: Slow / Fast / Impl Pre-Test dBA Precipitation: Yes (explain) / NoWindscreen : Yes / No (explain) Post-Test dBA Avg Wind Speed/Direction: none
Topo: Flat / Hilly Temp (°F): RH (%): 32Terrain: Hard/Soft/Mixed/Snow Bar Psr (Hg): 33.09 Cloud Cover (%): 0
ID Start Time
Stop Time
Leq Lmin Lmax L10 L50 L90
01 11:35 AM 11:36 AM 57.4 51.9 63.6 59.8 56.6 53.3
2 11:36 AM 11:37 AM 56.7 47.6 63.5 59.7 55.8 49.2
3 11:37 AM 11:38 AM 62.5 47.6 70.6 64.7 61.4 53.6
4 11:38 AM 11:39 AM 68.2 47.6 78.8 72.7 58.7 50.8
5 11:39 AM 11:40 AM 58.7 48.4 66.7 63.6 54.8 49.8
6 11:40 AM 11:41 AM 61.3 47.7 69.8 65.3 58.3 50.9
7 11:41 AM 11:42 AM 65.3 51.4 73.5 68.8 61.7 54.5
8 11:42 AM 11:43 AM 57.3 47.8 66.9 60.2 55.9 49.7
9 11:43 AM 11:44 AM 65.8 48.9 79.2 66.7 57.3 51.6
10 11:44 AM 11:45 AM 59.3 46.9 66.1 63.3 56.6 49.0
11 11:45 AM 11:46 AM 59.0 51.9 63.5 61.5 58.7 54.1
12 11:46 AM 11:47 AM 60.5 51.3 67.8 64.6 58.0 53.2
13 11:47 AM 11:48 AM 61.3 46.9 70.6 65.0 56.6 49.6
14 11:48 AM 11:49 AM 63.2 50.9 75.0 64.1 58.1 53.2
15 11:49 AM 11:50 AM 60.7 52.5 69.0 63.7 57.8 54.6
16 11:50 AM 11:51 AM 60.1 49.2 65.5 63.2 59.8 53.1
17 11:51 AM 11:52 AM 62.5 53.9 69.3 65.9 61.0 57.3
18 11:52 AM 11:53 AM 59.2 48.7 65.9 62.4 58.1 51.8
19 11:53 AM 11:54 AM 66.4 49.6 76.3 71.1 55.1 51.1
20 11:54 AM 11:55 AM 64.3 55.1 70.6 69.3 61.1 56.4
212223242526272829
91
car horn
114.2114.2
GPS Coordinates (at SLM location)#
35.976969, -78.892513
Notes/Events
Weather Data712 CAL150 AccuWeather415 4883 N/A
GoTriangle LRT 60391076 9/14/2016Short Term 1 - Alston Avenue at Fleetwood St Wargo/Cater
Sound Level Meter Field Calibration
URS ANCP, Field Noise Measurement Form, Vers. 1.2 111109
AECOM Acoustics and Noise Control PracticeFIELD NOISE MEASUREMENT DATA FORM
Speed (post/obs)*Number of LanesWidth (pave/row)
1- or 2- wayGrade
Bus StopsStoplights
Motorcycles
Automobiles
Medium TrucksHeavy TrucksBusesCount duration
# - note coordinate system * - Speed estimated by Radar / Driving / Observation
Yes/NoAdditional Notes/Comments:
Additional Notes and Sketches on ReverseOther Noise Sources: distant: aircraft/roadway traffic/trains/landscaping/rustling leaves/children playing/dogs barking/birds vocalizing/Insects
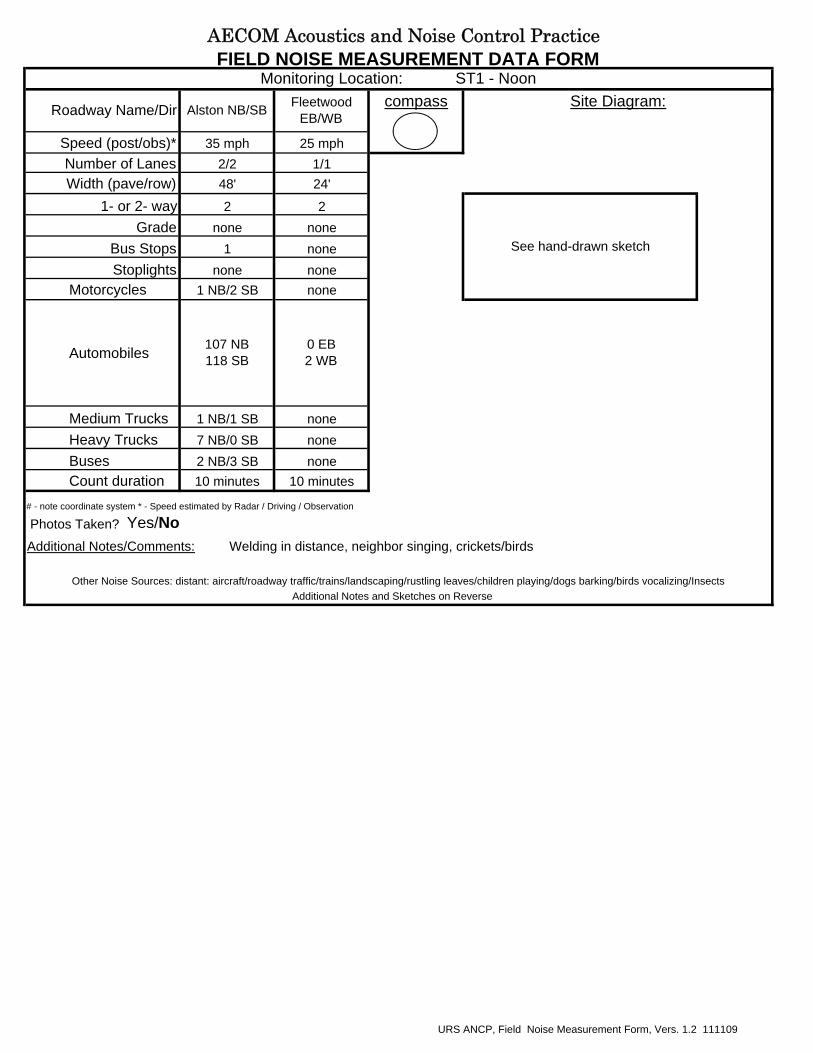
2 NB/3 SB none10 minutes 10 minutes
Photos Taken?
Welding in distance, neighbor singing, crickets/birds
107 NB118 SB
0 EB2 WB
1 NB/1 SB none7 NB/0 SB none
See hand-drawn sketchnone none
1 nonenone none
1 NB/2 SB none
2/2 1/148' 24'
2 2
Roadway Name/Dir Alston NB/SB Fleetwood EB/WB
compass Site Diagram:
35 mph 25 mph
Monitoring Location: ST1 - Noon
URS ANCP, Field Noise Measurement Form, Vers. 1.2 111109


AECOM Acoustics and Noise Control PracticeFIELD NOISE MEASUREMENT DATA FORM
Project Name Project #: Date Page 1 of 2Monitoring Location: Analyst:
Model #: Model #: Model #:Serial #: Serial #: Serial #:Weighting: A / C / Flat Calibration Level (dBA): 94 / 114 Wind: Steady/Gusty/CalmResponse: Slow / Fast / Impl Pre-Test dBA Precipitation: Yes (explain) / NoWindscreen : Yes / No (explain) Post-Test dBA Avg Wind Speed/Direction: none
Topo: Flat / Hilly Temp (°F): RH (%): 38Terrain: Hard/Soft/Mixed/Snow Bar Psr (Hg): 30.05 Cloud Cover (%): 60
ID Start Time
Stop Time
Leq Lmin Lmax L10 L50 L90
01 5:22 PM 5:23 PM 59.3 50.7 70.0 61.3 57.3 54.9
2 5:23 PM 5:24 PM 61.7 53.5 70.0 63.7 60.2 56.3
3 5:24 PM 5:25 PM 64.8 52.5 73.3 68.7 61.4 55.6
4 5:25 PM 5:26 PM 58.3 50.5 62.7 61.8 57.4 52.2
5 5:26 PM 5:27 PM 60.0 49.1 67.5 62.7 59.0 52.5
6 5:27 PM 5:28 PM 61.2 57.3 64.6 62.7 61.1 58.4
7 5:28 PM 5:29 PM 60.8 52.1 65.1 63.9 60.5 54.4
8 5:29 PM 5:30 PM 60.5 49.6 70.2 63.9 58.2 50.9
9 5:30 PM 5:31 PM 66.3 52.7 73.8 71.3 62.8 58.0
10 5:31 PM 5:32 PM 72.1 45.1 85.2 75.3 60.8 47.0
11 5:32 PM 5:33 PM 58.1 46.4 62.4 60.7 57.6 53.4
12 5:33 PM 5:34 PM 63.1 50.6 71.3 64.8 61.7 57.4
13 5:34 PM 5:35 PM 60.3 50.9 66.6 63.6 58.9 55.3
14 5:35 PM 5:36 PM 61.9 53.6 69.3 64.2 61.3 55.1
15 5:36 PM 5:37 PM 64.2 55.9 71.6 68.5 61.6 56.7
16 5:37 PM 5:38 PM 60.2 56.7 69.3 61.6 58.7 57.3
17 5:38 PM 5:39 PM 62.5 57.9 70.9 64.7 60.7 58.6
18 5:39 PM 5:40 PM 63.3 56.2 70.3 65.3 62.3 58.9
19 5:40 PM 5:41 PM 60.1 51.2 65.1 62.4 59.9 52.8
20 5:41 PM 5:42 PM 61.3 53.8 66.2 64.1 59.6 57.1
212223242526272829
89
113.9
GPS Coordinates (at SLM location)#
35.976969, -78.892513
Notes/Events
CAL150 AccuWeather415 4883 N/A
114.1
GoTriangle LRT 60391076 9/14/2016Short Term 1 - Alston Avenue at Fleetwood St Wargo/Cater
Sound Level Meter Field Calibration Weather Data712
URS ANCP, Field Noise Measurement Form, Vers. 1.2 111109

AECOM Acoustics and Noise Control PracticeFIELD NOISE MEASUREMENT DATA FORM
Speed (post/obs)*Number of LanesWidth (pave/row)
1- or 2- wayGrade
Bus StopsStoplights
Motorcycles
Automobiles
Medium TrucksHeavy TrucksBusesCount duration
# - note coordinate system * - Speed estimated by Radar / Driving / Observation
Yes/NoAdditional Notes/Comments:
Additional Notes and Sketches on ReverseOther Noise Sources: distant: aircraft/roadway traffic/trains/landscaping/rustling leaves/children playing/dogs barking/birds vocalizing/Insects
none none10 minutes 10 minutes
Photos Taken?
Neighbors talking, rooster
none
176 NB186 SB
1 EB2 WB
3 NB/0 SB none0 NB/1 SB none
2 2
See hand-drawn sketchnone none
1 nonenone none
3 NB/1 SB
35 mph 25 mph2/2 1/148' 24'
Monitoring Location: ST1 - Afternoon
Roadway Name/Dir Alston NB/SB Fleetwood EB/WB
compass Site Diagram:
URS ANCP, Field Noise Measurement Form, Vers. 1.2 111109


AECOM Acoustics and Noise Control PracticeFIELD NOISE MEASUREMENT DATA FORM
Project Name Project #: Date Page 1 of 2Monitoring Location: Analyst:
Model #: Model #: Model #:Serial #: Serial #: Serial #:Weighting: A / C / Flat Calibration Level (dBA): 94 / 114 Wind: Steady/Gusty/CalmResponse: Slow / Fast / Impl Pre-Test dBA Precipitation: Yes (explain) / NoWindscreen : Yes / No (explain) Post-Test dBA Avg Wind Speed/Direction: none
Topo: Flat / Hilly Temp (°F): RH (%): 60Terrain: Hard/Soft/Mixed/Snow Bar Psr (Hg): 30.10 Cloud Cover (%): 0
ID Start Time
Stop Time
Leq Lmin Lmax L10 L50 L90
01 8:30 PM 8:31 PM 59.7 51.8 63.1 62.3 60.2 53.1
2 8:31 PM 8:32 PM 59.4 51.4 64.6 62.9 58.1 52.4
3 8:32 PM 8:33 PM 59.7 51.6 64.2 63.4 58.0 52.3
4 8:33 PM 8:34 PM 59.3 53.3 64.0 62.4 58.0 54.1
5 8:34 PM 8:35 PM 60.3 52.2 64.7 62.8 60.1 54.0
6 8:35 PM 8:36 PM 60.0 52.3 64.9 63.6 57.9 53.5
7 8:36 PM 8:37 PM 61.3 51.1 66.2 64.9 60.7 51.8
8 8:37 PM 8:38 PM 58.5 51.4 62.8 61.7 57.5 52.9
9 8:38 PM 8:39 PM 58.7 51.3 66.5 61.3 57.4 52.0
10 8:39 PM 8:40 PM 60.5 53.1 66.5 63.8 59.2 55.5
11 8:40 PM 8:41 PM 59.9 53.9 63.9 61.8 59.8 56.3
12 8:41 PM 8:42 PM 59.1 50.9 63.5 62.7 57.8 51.5
13 8:42 PM 8:43 PM 59.4 52.1 65.9 63.1 57.3 53.6
14 8:43 PM 8:44 PM 60.5 53.0 64.8 63.8 59.8 54.6
15 8:44 PM 8:45 PM 61.6 53.8 69.2 65.8 59.2 55.9
16 8:45 PM 8:46 PM 66.2 56.7 77.1 71.2 60.5 57.6
17 8:46 PM 8:47 PM 62.0 53.3 70.8 65.6 59.9 54.1
18 8:47 PM 8:48 PM 60.6 52.4 65.6 63.8 59.6 53.8
19 8:48 PM 8:49 PM 58.4 52.4 62.7 61.5 57.5 52.9
20 8:49 PM 8:50 PM 59.8 52.4 64.8 63.1 58.5 54.0
212223242526272829
84
114.1
GPS Coordinates (at SLM location)#
35.976969, -78.892513
Notes/Events
CAL150 AccuWeather415 4883 N/A
114.0
GoTriangle LRT 60391076 9/13/2016Short Term 1 - Alston Avenue at Fleetwood St Bell
Sound Level Meter Field Calibration Weather Data712
URS ANCP, Field Noise Measurement Form, Vers. 1.2 111109
AECOM Acoustics and Noise Control PracticeFIELD NOISE MEASUREMENT DATA FORM
Speed (post/obs)*Number of LanesWidth (pave/row)
1- or 2- wayGrade
Bus StopsStoplights
Motorcycles
Automobiles
Medium TrucksHeavy TrucksBusesCount duration
# - note coordinate system * - Speed estimated by Radar / Driving / Observation
Yes/NoAdditional Notes/Comments:
Additional Notes and Sketches on ReverseOther Noise Sources: distant: aircraft/roadway traffic/trains/landscaping/rustling leaves/children playing/dogs barking/birds vocalizing/Insects
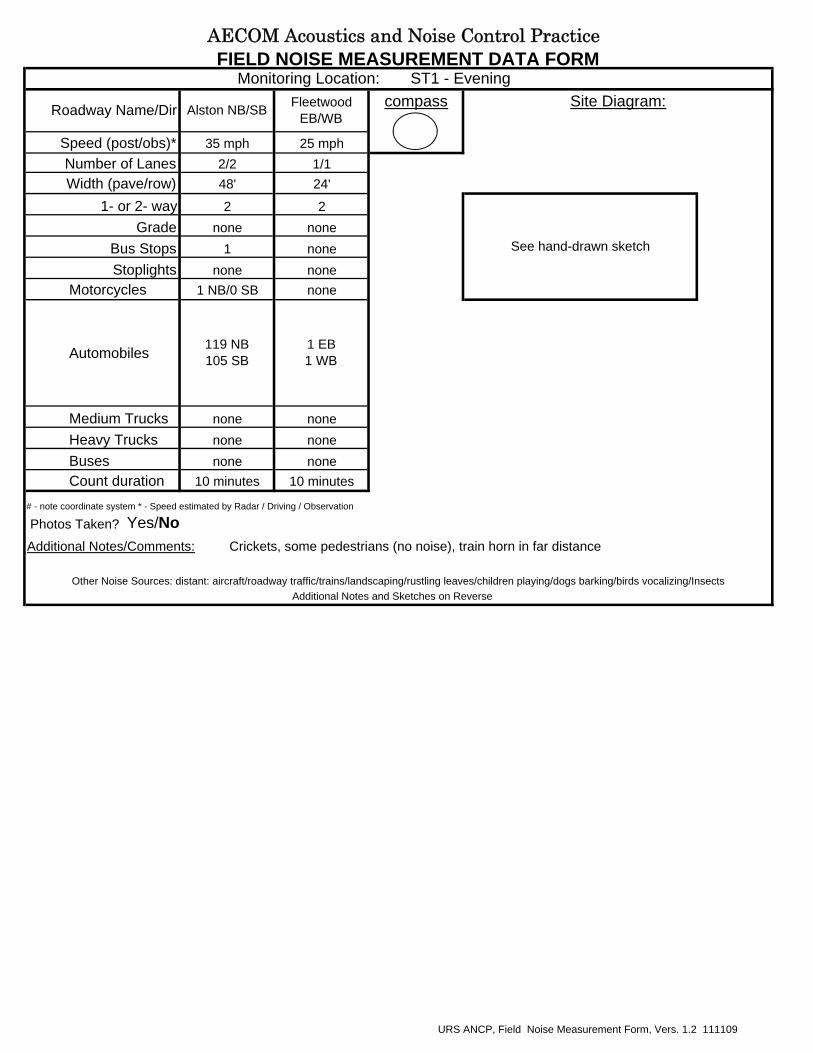
none none10 minutes 10 minutes
Photos Taken?
Crickets, some pedestrians (no noise), train horn in far distance
none
119 NB105 SB
1 EB1 WB
none nonenone none
2 2
See hand-drawn sketchnone none
1 nonenone none
1 NB/0 SB
35 mph 25 mph2/2 1/148' 24'
Monitoring Location: ST1 - Evening
Roadway Name/Dir Alston NB/SB Fleetwood EB/WB
compass Site Diagram:
URS ANCP, Field Noise Measurement Form, Vers. 1.2 111109
AECOM Acoustics and Noise Control PracticeFIELD NOISE MEASUREMENT DATA FORM
Project Name Project #: Date Page 1 of 2Monitoring Location: Analyst:
Model #: Model #: Model #:Serial #: Serial #: Serial #:Weighting: A / C / Flat Calibration Level (dBA): 94 / 114 Wind: Steady/Gusty/CalmResponse: Slow / Fast / Impl Pre-Test dBA Precipitation: Yes (explain) / NoWindscreen : Yes / No (explain) Post-Test dBA Avg Wind Speed/Direction: none
Topo: Flat / Hilly Temp (°F): RH (%): 89Terrain: Hard/Soft/Mixed/Snow Bar Psr (Hg): 30.20 Cloud Cover (%): 0
ID Start Time
Stop Time
Leq Lmin Lmax L10 L50 L90
01 6:50 AM 6:51 AM 71.6 63.0 78.0 74.7 70.4 64.9
2 6:51 AM 6:52 AM 70.9 62.4 75.0 73.0 70.8 66.2
3 6:52 AM 6:53 AM 69.6 64.5 73.9 72.1 69.1 66.3
4 6:53 AM 6:54 AM 71.6 61.2 77.9 74.8 71.0 65.9
5 6:54 AM 6:55 AM 68.1 57.2 73.6 71.8 67.3 58.7
6 6:55 AM 6:56 AM 69.3 56.1 73.6 72.8 67.3 58.0
7 6:56 AM 6:57 AM 72.0 66.1 77.9 74.4 71.5 68.1
8 6:57 AM 6:58 AM 70.2 63.1 77.7 73.2 68.7 65.0
9 6:58 AM 6:59 AM 71.2 62.6 75.4 74.3 70.8 64.2
10 6:59 AM 7:00 AM 70.0 60.5 77.3 74.3 67.7 62.1
11 7:00 AM 7:01 AM 70.1 62.7 75.5 73.9 69.0 63.8
12 7:01 AM 7:02 AM 69.2 56.0 73.6 72.8 68.7 58.1
13 7:02 AM 7:03 AM 68.3 62.1 72.1 70.8 68.3 63.0
14 7:03 AM 7:04 AM 68.7 61.1 72.4 71.6 67.9 63.3
15 7:04 AM 7:05 AM 70.1 59.5 74.5 73.3 69.6 61.8
16 7:05 AM 7:06 AM 76.6 61.7 91.1 75.7 70.6 63.0
17 7:06 AM 7:07 AM 76.9 57.6 89.2 80.7 70.2 59.9
18 7:07 AM 7:08 AM 71.5 60.0 76.0 74.8 70.6 65.5
19 7:08 AM 7:09 AM 69.5 58.2 78.0 73.2 66.8 60.6
20 7:09 AM 7:10 AM 66.2 60.2 71.5 68.4 65.6 63.3
212223242526272829
Notes/Events
35.980332, -78.891195GPS Coordinates (at SLM location)# 67
114.2114.2
415 4883 N/A712 CAL150 AccuWeather
Sound Level Meter Field Calibration Weather Data
Short Term 2 - Russell Memorial Church BellGoTriangle LRT 60391076 9/14/2016
URS ANCP, Field Noise Measurement Form, Vers. 1.2 111109

AECOM Acoustics and Noise Control PracticeFIELD NOISE MEASUREMENT DATA FORM
Speed (post/obs)*Number of LanesWidth (pave/row)
1- or 2- wayGrade
Bus StopsStoplights
Motorcycles
Automobiles
Medium TrucksHeavy TrucksBusesCount duration
# - note coordinate system * - Speed estimated by Radar / Driving / Observation
Yes/NoAdditional Notes/Comments:
Additional Notes and Sketches on ReverseOther Noise Sources: distant: aircraft/roadway traffic/trains/landscaping/rustling leaves/children playing/dogs barking/birds vocalizing/Insects
Photos Taken?
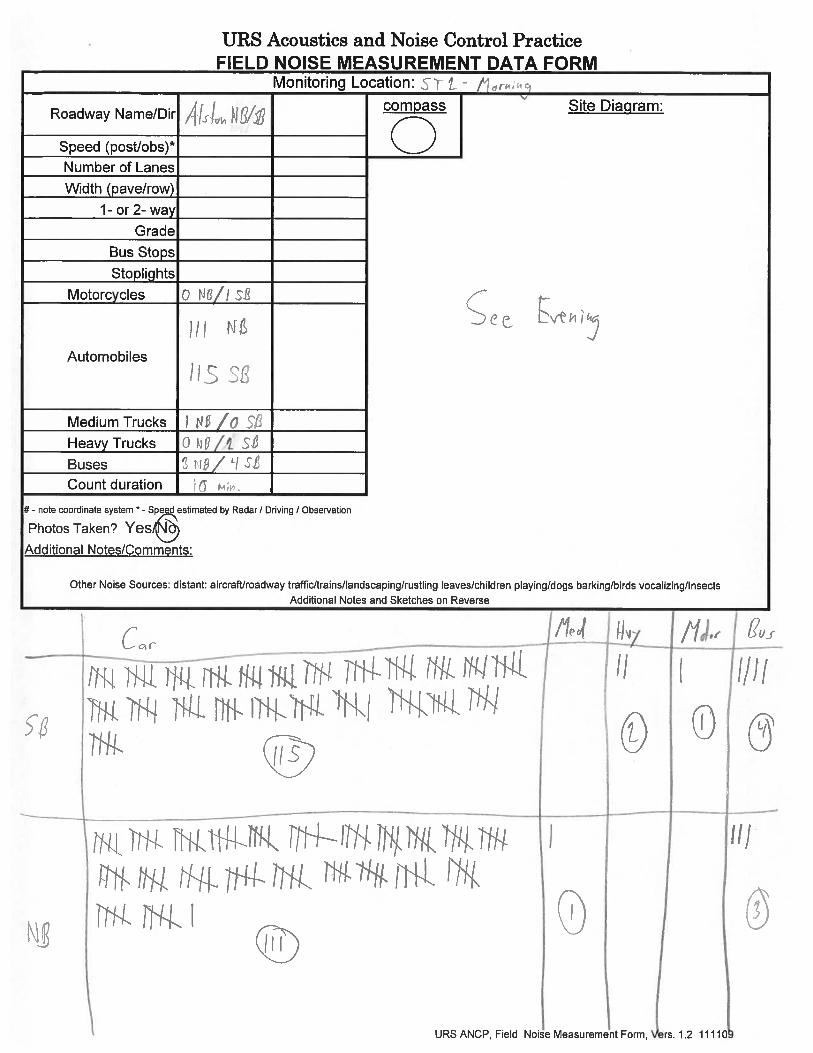
10 minutes3 NB/4 SB0 NB/2 SB1 NB/0 SB
111 NB115 SB
0 NB/1 SBnone
1
2
See hand-drawn sketchnone
60'2/1/2
35 mph
Roadway Name/Dir Alston NB/SB compass Site Diagram:Monitoring Location: ST2 - Morning
URS ANCP, Field Noise Measurement Form, Vers. 1.2 111109
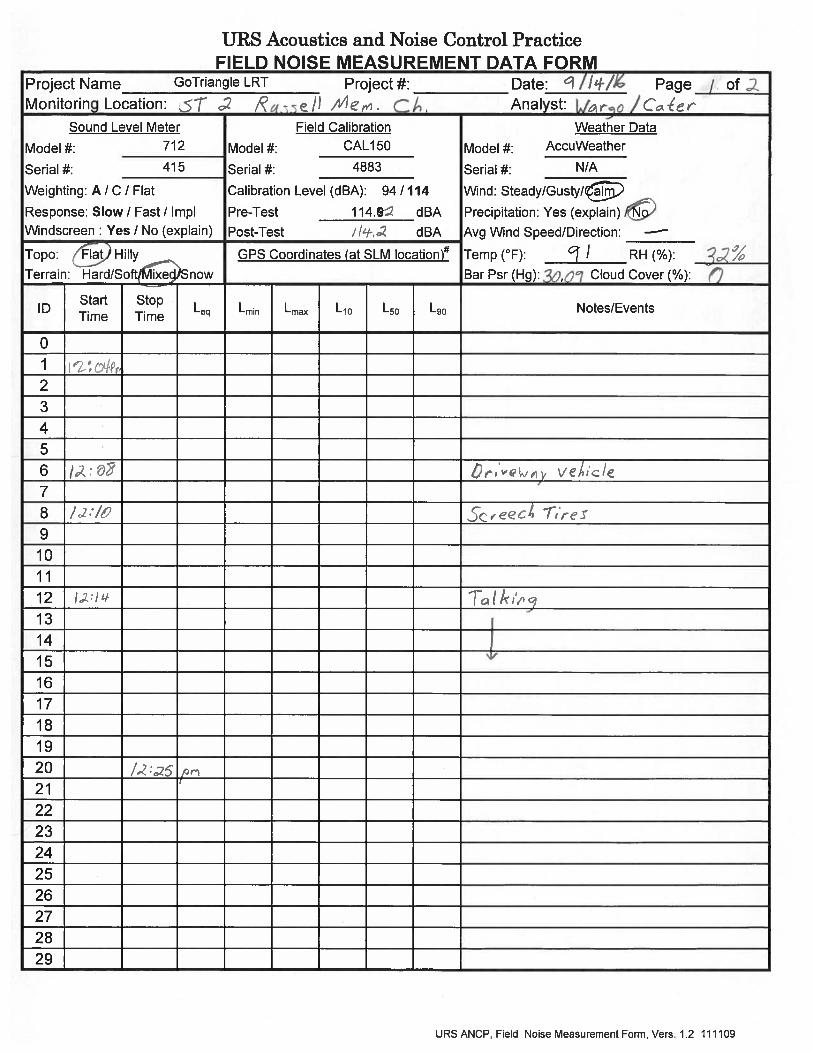


AECOM Acoustics and Noise Control PracticeFIELD NOISE MEASUREMENT DATA FORM
Project Name Project #: Date Page 1 of 2Monitoring Location: Analyst:
Model #: Model #: Model #:Serial #: Serial #: Serial #:Weighting: A / C / Flat Calibration Level (dBA): 94 / 114 Wind: Steady/Gusty/CalmResponse: Slow / Fast / Impl Pre-Test dBA Precipitation: Yes (explain) / NoWindscreen : Yes / No (explain) Post-Test dBA Avg Wind Speed/Direction: none
Topo: Flat / Hilly Temp (°F): RH (%): 32Terrain: Hard/Soft/Mixed/Snow Bar Psr (Hg): 30.09 Cloud Cover (%): 0
ID Start Time
Stop Time
Leq Lmin Lmax L10 L50 L90
01 12:04 PM 12:05 PM 71.5 63.5 77.8 75.8 68.1 65.3
2 12:05 PM 12:06 PM 72.1 61.9 82.3 75.5 68.0 64.0
3 12:06 PM 12:07 PM 69.7 62.8 73.8 72.6 68.8 64.4
4 12:07 PM 12:08 PM 68.6 64.1 73.0 70.8 68.3 65.2
5 12:08 PM 12:09 PM 68.9 61.6 76.2 71.4 67.4 62.9
6 12:09 PM 12:10 PM 69.6 60.5 76.3 73.3 67.8 62.1
7 12:10 PM 12:11 PM 68.9 64.0 77.0 70.3 68.4 65.2
8 12:11 PM 12:12 PM 68.7 59.4 76.9 71.6 67.5 60.8
9 12:12 PM 12:13 PM 68.4 55.2 75.2 71.8 66.4 59.5
10 12:13 PM 12:14 PM 70.7 63.7 78.6 72.9 69.4 66.6
11 12:14 PM 12:15 PM 67.9 55.6 72.2 70.6 67.9 59.6
12 12:15 PM 12:16 PM 69.2 64.2 75.6 71.6 67.9 65.3
13 12:16 PM 12:17 PM 67.8 56.6 71.4 70.3 67.9 61.4
14 12:17 PM 12:18 PM 68.3 52.3 75.5 71.5 66.7 56.2
15 12:18 PM 12:19 PM 67.2 58.9 73.1 70.0 66.4 62.2
16 12:19 PM 12:20 PM 70.8 61.9 77.8 73.5 70.1 64.1
17 12:20 PM 12:21 PM 68.6 55.7 77.7 71.9 65.7 58.9
18 12:21 PM 12:22 PM 67.3 62.0 71.4 69.2 67.4 63.5
19 12:22 PM 12:23 PM 72.2 62.8 82.8 73.8 69.4 63.9
20 12:23 PM 12:24 PM 66.8 61.3 73.7 69.5 65.6 63.2
212223242526272829
Talking
Talking
Talking
Talking
Screech of tires
Driveway vehicle
Notes/Events
35.980332, -78.891195GPS Coordinates (at SLM location)# 91
114.2114.2
415 4883 N/A712 CAL150 AccuWeather
Sound Level Meter Field Calibration Weather Data
Short Term 2 - Russell Memorial Church Wargo/CaterGoTriangle LRT 60391076 9/14/2016
URS ANCP, Field Noise Measurement Form, Vers. 1.2 111109

AECOM Acoustics and Noise Control PracticeFIELD NOISE MEASUREMENT DATA FORM
Speed (post/obs)*Number of LanesWidth (pave/row)
1- or 2- wayGrade
Bus StopsStoplights
Motorcycles
Automobiles
Medium TrucksHeavy TrucksBusesCount duration
# - note coordinate system * - Speed estimated by Radar / Driving / Observation
Yes/NoAdditional Notes/Comments:
Additional Notes and Sketches on ReverseOther Noise Sources: distant: aircraft/roadway traffic/trains/landscaping/rustling leaves/children playing/dogs barking/birds vocalizing/Insects
Photos Taken?
10 minutes1 NB/6 SB5 NB/7 SB2 NB/4 SB
101 NB155 SB
nonenone
1
2
See hand-drawn sketchnone
60'2/1/2
35 mph
Alston NB/SB compass Site Diagram:Roadway Name/Dir
Monitoring Location: ST2 - Noon
URS ANCP, Field Noise Measurement Form, Vers. 1.2 111109


AECOM Acoustics and Noise Control PracticeFIELD NOISE MEASUREMENT DATA FORM
Project Name Project #: Date Page 1 of 2Monitoring Location: Analyst:
Model #: Model #: Model #:Serial #: Serial #: Serial #:Weighting: A / C / Flat Calibration Level (dBA): 94 / 114 Wind: Steady/Gusty/CalmResponse: Slow / Fast / Impl Pre-Test dBA Precipitation: Yes (explain) / NoWindscreen : Yes / No (explain) Post-Test dBA Avg Wind Speed/Direction: none
Topo: Flat / Hilly Temp (°F): RH (%): 38Terrain: Hard/Soft/Mixed/Snow Bar Psr (Hg): 30.05 Cloud Cover (%): 60
ID Start Time
Stop Time
Leq Lmin Lmax L10 L50 L90
01 4:30 PM 4:31 PM 67.5 61.0 71.2 69.8 67.3 63.1
2 4:31 PM 4:32 PM 71.5 61.8 82.2 75.0 67.2 63.1
3 4:32 PM 4:33 PM 70.3 60.0 75.9 72.8 69.5 66.1
4 4:33 PM 4:34 PM 75.5 59.0 86.0 79.8 68.9 62.0
5 4:34 PM 4:35 PM 72.4 63.4 79.5 76.4 69.7 64.7
6 4:35 PM 4:36 PM 73.3 65.9 83.0 77.0 70.6 67.8
7 4:36 PM 4:37 PM 69.0 59.7 74.3 73.1 67.0 61.9
8 4:37 PM 4:38 PM 68.4 60.8 74.6 71.1 67.5 63.7
9 4:38 PM 4:39 PM 73.1 55.2 82.7 77.2 70.1 60.4
10 4:39 PM 4:40 PM 77.4 63.1 86.1 82.7 70.5 65.8
11 4:40 PM 4:41 PM 74.0 65.1 80.7 77.0 72.9 68.6
12 4:41 PM 4:42 PM 67.0 61.8 71.2 70.2 65.5 63.1
13 4:42 PM 4:43 PM 69.9 60.2 78.7 71.4 68.6 61.7
14 4:43 PM 4:44 PM 67.7 59.6 70.9 69.9 67.7 62.8
15 4:44 PM 4:45 PM 69.4 59.7 74.8 71.4 69.0 65.4
16 4:45 PM 4:46 PM 73.2 66.9 83.1 74.9 71.4 68.7
17 4:46 PM 4:47 PM 72.1 61.5 80.4 76.0 69.3 64.1
18 4:47 PM 4:48 PM 70.6 60.0 76.1 74.1 69.6 62.7
19 4:48 PM 4:49 PM 68.5 60.0 77.5 70.8 66.2 62.8
20 4:49 PM 4:50 PM 70.0 59.4 76.7 74.0 67.9 60.9
212223242526272829
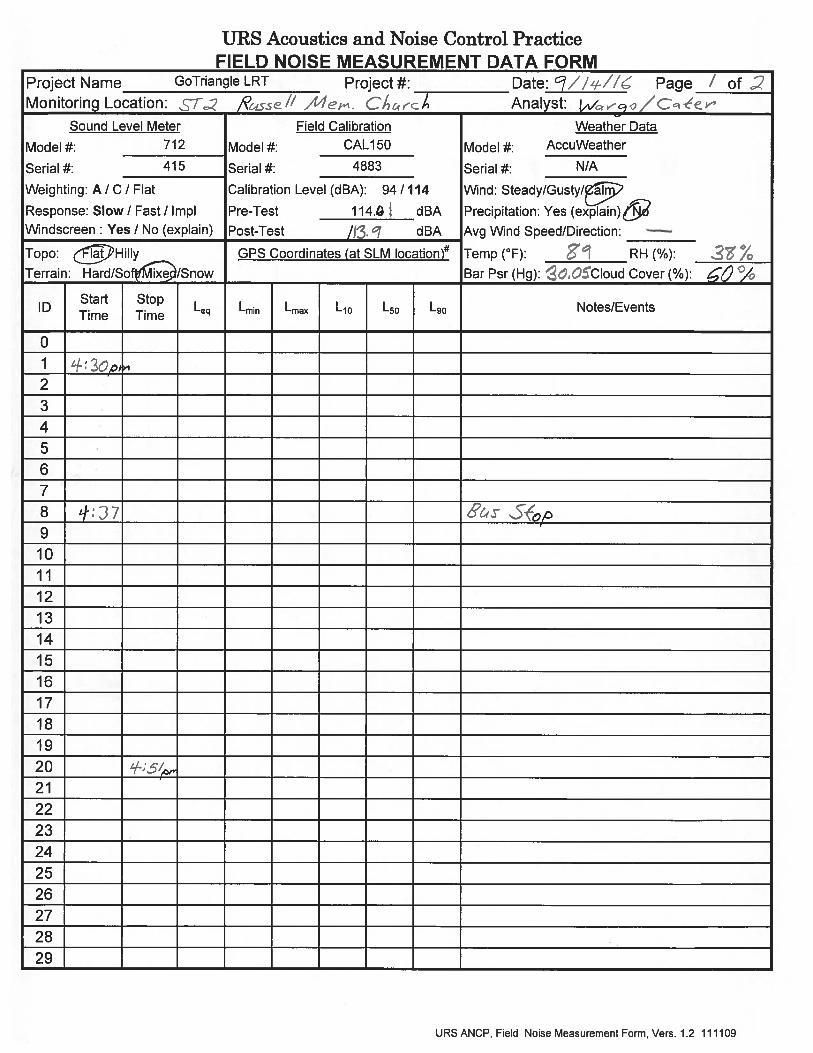
Bus Stop
Notes/Events
35.980332, -78.891195GPS Coordinates (at SLM location)# 89
114.1113.9
415 4883 N/A712 CAL150 AccuWeather
Weather DataSound Level Meter Field Calibration
Short Term 2 - Russell Memorial Church Wargo/CaterGoTriangle LRT 60391076 9/14/2016
URS ANCP, Field Noise Measurement Form, Vers. 1.2 111109

AECOM Acoustics and Noise Control PracticeFIELD NOISE MEASUREMENT DATA FORM
Speed (post/obs)*Number of LanesWidth (pave/row)
1- or 2- wayGrade
Bus StopsStoplights
Motorcycles
Automobiles
Medium TrucksHeavy TrucksBusesCount duration
# - note coordinate system * - Speed estimated by Radar / Driving / Observation
Yes/NoAdditional Notes/Comments:
Additional Notes and Sketches on ReverseOther Noise Sources: distant: aircraft/roadway traffic/trains/landscaping/rustling leaves/children playing/dogs barking/birds vocalizing/Insects
Photos Taken?
10 minutes1 NB/2 SB2 NB/1 SB3 NB/1 SB
189 NB185 SB
0 NB/1 SBnone
1
2
See hand-drawn sketchnone
60'2/1/2
35 mph
compass Site Diagram:Roadway Name/Dir Alston NB/SB
Monitoring Location: ST2 - Afternoon
URS ANCP, Field Noise Measurement Form, Vers. 1.2 111109


AECOM Acoustics and Noise Control PracticeFIELD NOISE MEASUREMENT DATA FORM
Project Name Project #: Date Page 1 of 2Monitoring Location: Analyst:
Model #: Model #: Model #:Serial #: Serial #: Serial #:Weighting: A / C / Flat Calibration Level (dBA): 94 / 114 Wind: Steady/Gusty/CalmResponse: Slow / Fast / Impl Pre-Test dBA Precipitation: Yes (explain) / NoWindscreen : Yes / No (explain) Post-Test dBA Avg Wind Speed/Direction: none
Topo: Flat / Hilly Temp (°F): RH (%): 60Terrain: Hard/Soft/Mixed/Snow Bar Psr (Hg): 30.10 Cloud Cover (%): 0
ID Start Time
Stop Time
Leq Lmin Lmax L10 L50 L90
01 8:55 PM 8:56 PM 65.1 58.3 70.3 68.1 64.2 60.0
2 8:56 PM 8:57 PM 66.9 51.3 70.6 69.7 67.2 52.7
3 8:57 PM 8:58 PM 65.4 59.4 70.8 67.8 64.8 61.6
4 8:58 PM 8:59 PM 68.0 55.9 78.3 69.9 65.8 59.9
5 8:59 PM 9:00 PM 67.5 55.8 73.1 71.0 66.5 57.9
6 9:00 PM 9:01 PM 68.5 58.1 72.6 71.1 68.0 62.7
7 9:01 PM 9:02 PM 64.8 54.1 71.7 68.4 63.8 57.4
8 9:02 PM 9:03 PM 71.6 56.9 81.9 73.5 67.9 61.5
9 9:03 PM 9:04 PM 67.8 60.6 72.7 71.4 65.6 62.5
10 9:04 PM 9:05 PM 66.3 52.7 73.3 69.5 64.7 54.8
11 9:05 PM 9:06 PM 71.7 56.5 79.0 76.9 68.6 62.3
12 9:06 PM 9:07 PM 67.0 56.1 77.5 70.5 63.4 57.6
13 9:07 PM 9:08 PM 66.2 52.1 72.5 69.7 64.5 52.9
14 9:08 PM 9:09 PM 67.7 64.2 71.6 70.1 66.7 65.0
15 9:09 PM 9:10 PM 67.5 59.3 72.3 71.0 66.4 61.9
16 9:10 PM 9:11 PM 67.8 60.0 75.3 70.7 65.6 62.7
17 9:11 PM 9:12 PM 65.6 54.0 69.6 69.1 65.4 55.5
18 9:12 PM 9:13 PM 67.6 55.6 72.5 70.9 67.0 58.7
19 9:13 PM 9:14 PM 65.9 57.3 73.2 69.2 64.6 58.6
20 9:14 PM 9:15 PM 66.5 57.5 73.1 69.6 65.2 61.0
212223242526272829
Notes/Events
GPS Coordinates (at SLM location)# 8435.980332, -78.891195
114.0114.1
415 4883 N/A712 CAL150 AccuWeather
Sound Level Meter Field Calibration Weather Data
Short Term 2 - Russell Memorial Church BellGoTriangle LRT 60391076 9/13/2016
URS ANCP, Field Noise Measurement Form, Vers. 1.2 111109
AECOM Acoustics and Noise Control PracticeFIELD NOISE MEASUREMENT DATA FORM
Speed (post/obs)*Number of LanesWidth (pave/row)
1- or 2- wayGrade
Bus StopsStoplights
Motorcycles
Automobiles
Medium TrucksHeavy TrucksBusesCount duration
# - note coordinate system * - Speed estimated by Radar / Driving / Observation
Yes/NoAdditional Notes/Comments:
Additional Notes and Sketches on ReverseOther Noise Sources: distant: aircraft/roadway traffic/trains/landscaping/rustling leaves/children playing/dogs barking/birds vocalizing/Insects
Photos Taken?
0 NB/1 SB10 minutes
1 NB/0 SBnone
none
103 NB108 SB
1none
2
See hand-drawn sketchnone
2/1/260'
compass Site Diagram:
35 mph
Roadway Name/Dir Alston NB/SB
Monitoring Location: ST2 - Evening
URS ANCP, Field Noise Measurement Form, Vers. 1.2 111109

AECOM Acoustics and Noise Control PracticeFIELD NOISE MEASUREMENT DATA FORM
Project Name Project #: Date Page 1 of 2Monitoring Location: Analyst:
Model #: Model #: Model #:Serial #: Serial #: Serial #:Weighting: A / C / Flat Calibration Level (dBA): 94 / 114 Wind: Steady/Gusty/CalmResponse: Slow / Fast / Impl Pre-Test dBA Precipitation: Yes (explain) / NoWindscreen : Yes / No (explain) Post-Test dBA Avg Wind Speed/Direction: none
Topo: Flat / Hilly Temp (°F): RH (%): 89Terrain: Hard/Soft/Mixed/Snow Bar Psr (Hg): 30.18 Cloud Cover (%): 0
ID Start Time
Stop Time
Leq Lmin Lmax L10 L50 L90
01 7:16 AM 7:17 AM 65.4 61.9 68.6 68.0 64.7 62.4
2 7:17 AM 7:18 AM 62.7 60.8 65.0 64.1 62.7 61.3
3 7:18 AM 7:19 AM 62.4 59.0 66.4 63.8 62.2 59.8
4 7:19 AM 7:20 AM 63.2 59.9 68.8 66.0 62.0 60.4
5 7:20 AM 7:21 AM 64.2 62.0 70.5 65.0 63.5 62.3
6 7:21 AM 7:22 AM 65.0 59.1 72.1 69.9 62.3 60.1
7 7:22 AM 7:23 AM 66.1 62.5 71.3 68.4 65.3 64.0
8 7:23 AM 7:24 AM 65.9 61.3 71.6 68.6 64.9 61.5
9 7:24 AM 7:25 AM 65.3 60.8 72.6 68.6 63.5 61.3
10 7:25 AM 7:26 AM 63.4 59.8 67.1 65.6 63.4 60.3
11 7:26 AM 7:27 AM 67.2 60.3 72.1 70.2 67.2 61.4
12 7:27 AM 7:28 AM 65.7 61.1 71.9 67.8 64.4 62.0
13 7:28 AM 7:29 AM 66.5 61.9 70.8 69.4 65.3 62.4
14 7:29 AM 7:30 AM 67.7 62.2 72.8 71.4 64.7 62.4
15 7:30 AM 7:31 AM 64.1 59.9 70.4 67.2 62.6 61.2
16 7:31 AM 7:32 AM 61.2 58.0 65.8 63.6 60.6 58.6
17 7:32 AM 7:33 AM 63.1 57.0 66.7 65.5 62.9 57.7
18 7:33 AM 7:34 AM 62.8 57.0 69.2 64.8 61.8 58.4
19 7:34 AM 7:35 AM 62.2 57.9 70.5 64.2 60.6 59.2
20 7:35 AM 7:36 AM 69.6 60.3 77.2 73.4 66.4 61.8
212223242526272829
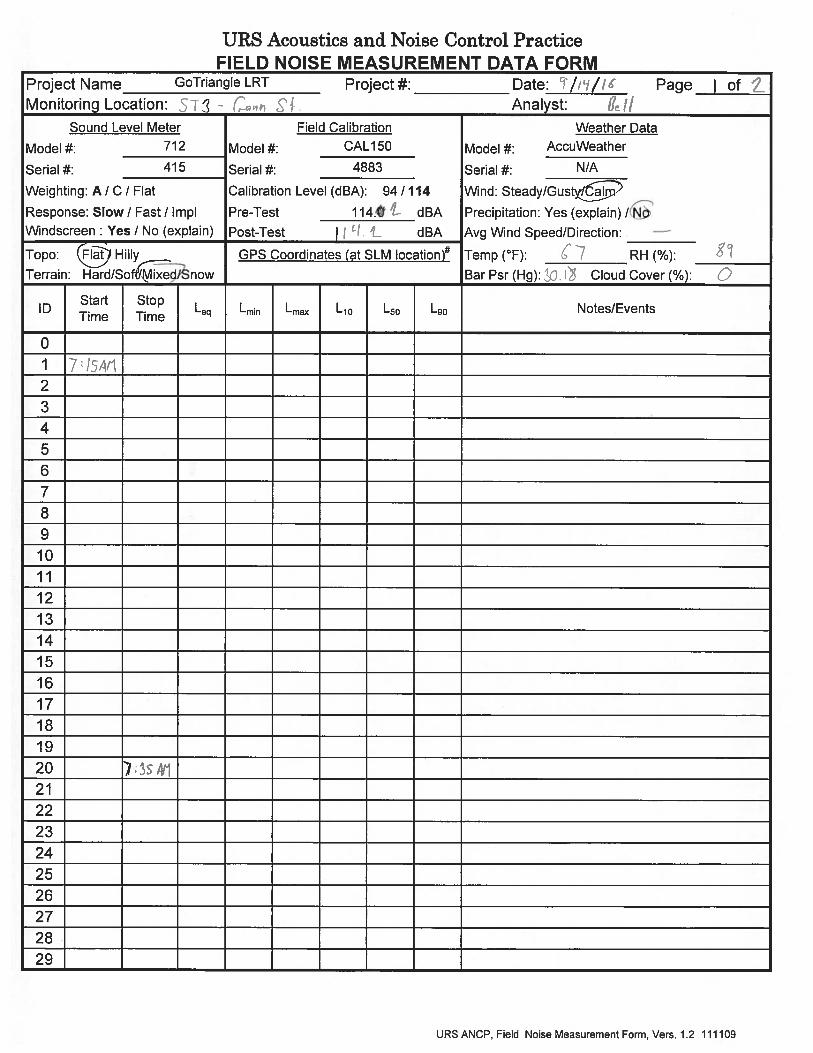
GoTriangle LRT 60391076 9/14/2016Short Term 3 - Gann St Bell
Sound Level Meter Field Calibration Weather Data712 CAL150 AccuWeather415 4883 N/A
114.2114.2
35.983302, -78.890592GPS Coordinates (at SLM location)# 67
Notes/Events
URS ANCP, Field Noise Measurement Form, Vers. 1.2 111109

AECOM Acoustics and Noise Control PracticeFIELD NOISE MEASUREMENT DATA FORM
Speed (post/obs)*Number of LanesWidth (pave/row)
1- or 2- wayGrade
Bus StopsStoplights
Motorcycles
Automobiles
Medium TrucksHeavy TrucksBusesCount duration
# - note coordinate system * - Speed estimated by Radar / Driving / Observation
Yes/NoAdditional Notes/Comments:
Additional Notes and Sketches on Reverse
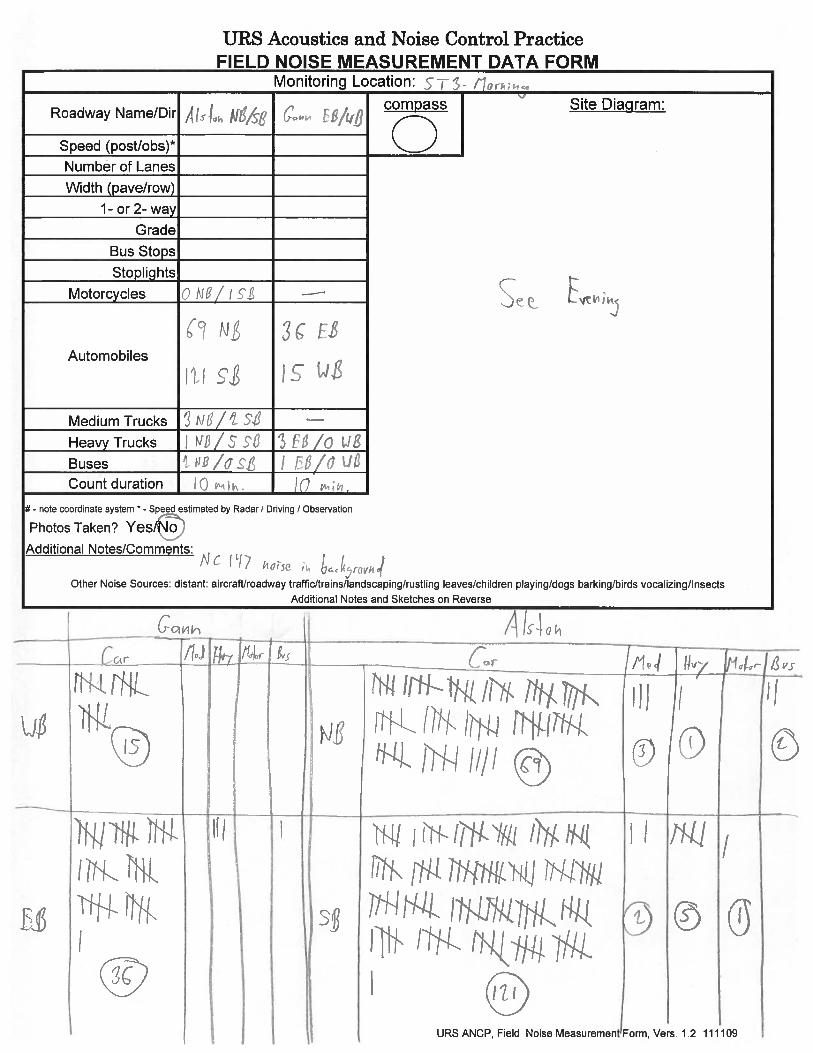
Monitoring Location: ST3 - Morning
Roadway Name/Dir Alston NB/SB Gann EB/WB compass Site Diagram:
35 mph 25 mph2/1/1 1/148' 24'
2 2
See hand-drawn sketchnone nonenone none
1 10 NB/1 SB none
69 NB121 SB
36 EB15 WB
3 NB/2 SB none1 NB/5 SB 3 EB/0 WB2 NB/0 SB 1 EB/0 WB10 minutes 10 minutes
Other Noise Sources: distant: aircraft/roadway traffic/trains/landscaping/rustling leaves/children playing/dogs barking/birds vocalizing/Insects
Photos Taken?
NC 147 noise in background
URS ANCP, Field Noise Measurement Form, Vers. 1.2 111109

AECOM Acoustics and Noise Control PracticeFIELD NOISE MEASUREMENT DATA FORM
Project Name Project #: Date Page 1 of 2Monitoring Location: Analyst:
Model #: Model #: Model #:Serial #: Serial #: Serial #:Weighting: A / C / Flat Calibration Level (dBA): 94 / 114 Wind: Steady/Gusty/CalmResponse: Slow / Fast / Impl Pre-Test dBA Precipitation: Yes (explain) / NoWindscreen : Yes / No (explain) Post-Test dBA Avg Wind Speed/Direction: none
Topo: Flat / Hilly Temp (°F): RH (%): 32Terrain: Hard/Soft/Mixed/Snow Bar Psr (Hg): 30.09 Cloud Cover (%): 0
ID Start Time
Stop Time
Leq Lmin Lmax L10 L50 L90
01 12:31 PM 12:32 PM 61.1 56.9 67.1 63.5 60.2 58.1
2 12:32 PM 12:33 PM 60.3 55.9 63.9 62.9 60.1 57.1
3 12:33 PM 12:34 PM 60.3 56.4 63.5 61.7 60.4 57.7
4 12:34 PM 12:35 PM 59.9 58.1 63.1 61.4 59.6 58.7
5 12:35 PM 12:36 PM 60.3 56.1 63.7 62.5 60.3 56.6
6 12:36 PM 12:37 PM 60.7 57.1 65.0 62.6 60.6 58.0
7 12:37 PM 12:38 PM 60.1 55.0 66.1 62.0 60.0 56.1
8 12:38 PM 12:39 PM 59.4 55.4 62.3 61.6 59.9 56.1
9 12:39 PM 12:40 PM 64.7 55.8 73.1 68.1 61.8 57.4
10 12:40 PM 12:41 PM 59.3 55.5 63.4 61.8 58.6 56.2
11 12:41 PM 12:42 PM 61.3 57.1 65.9 64.0 60.5 58.0
12 12:42 PM 12:43 PM 63.0 58.8 69.9 65.6 61.5 59.4
13 12:43 PM 12:44 PM 64.4 59.3 72.0 69.5 60.9 59.5
14 12:44 PM 12:45 PM 62.9 58.3 67.7 65.1 62.4 59.6
15 12:45 PM 12:46 PM 60.7 54.8 65.7 62.8 60.3 56.2
16 12:46 PM 12:47 PM 62.3 56.8 67.3 65.6 60.7 58.1
17 12:47 PM 12:48 PM 61.8 54.3 68.9 66.5 59.3 55.4
18 12:48 PM 12:49 PM 60.6 54.6 66.9 62.7 60.1 56.9
19 12:49 PM 12:50 PM 62.9 58.4 70.0 67.6 60.2 59.1
20 12:50 PM 12:51 PM 63.8 60.8 68.9 65.7 63.5 61.5
212223242526272829
GoTriangle LRT 60391076 9/14/2016Short Term 3 - Gann St Wargo/Cater
Sound Level Meter Field Calibration Weather Data712 CAL150 AccuWeather415 4883 N/A
114.2114.2
35.983302, -78.890592GPS Coordinates (at SLM location)# 91
Notes/Events
Truck left area
Car horn
Music
School buses on Gann St.
School buses on Gann St.
Car music
Bus
URS ANCP, Field Noise Measurement Form, Vers. 1.2 111109

AECOM Acoustics and Noise Control PracticeFIELD NOISE MEASUREMENT DATA FORM
Speed (post/obs)*Number of LanesWidth (pave/row)
1- or 2- wayGrade
Bus StopsStoplights
Motorcycles
Automobiles
Medium TrucksHeavy TrucksBusesCount duration
# - note coordinate system * - Speed estimated by Radar / Driving / Observation
Yes/NoAdditional Notes/Comments:
Additional Notes and Sketches on Reverse
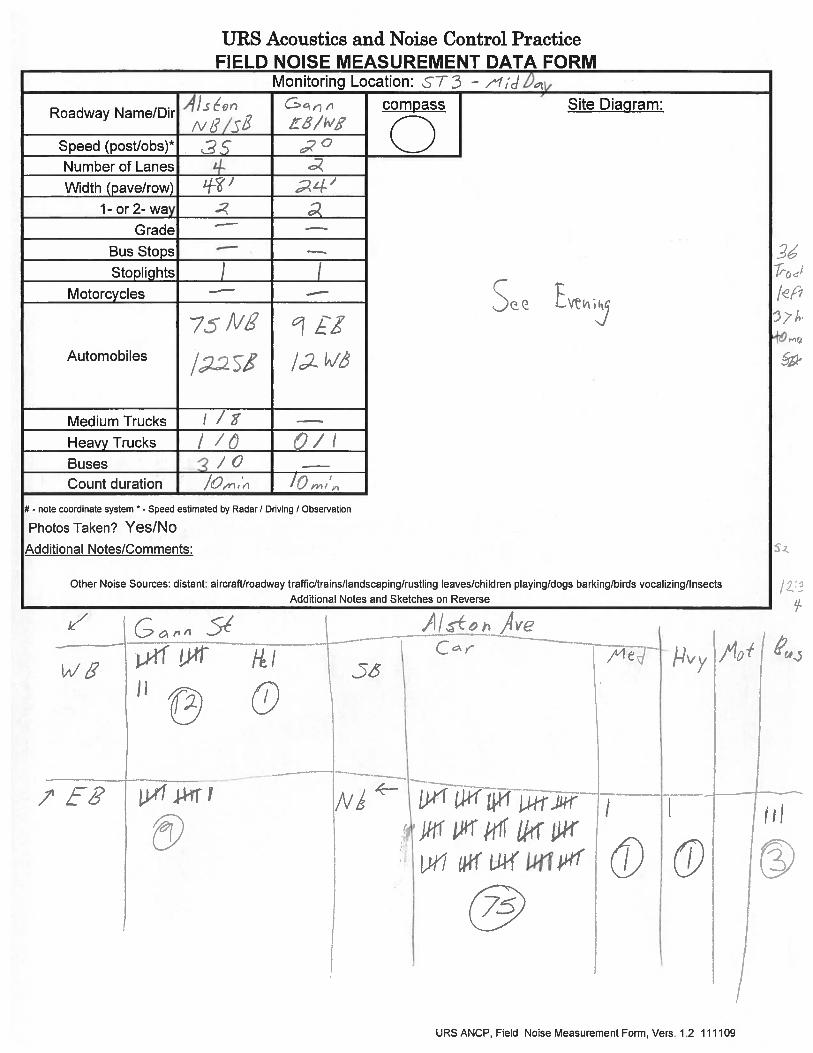
Monitoring Location: ST3 - Noon
Roadway Name/Dir Alston NB/SB Gann EB/WB compass Site Diagram:
35 mph 25 mph2/1/1 1/148' 24'
2 2
See hand-drawn sketchnone nonenone none
1 1none none
75 NB122 SB
9 EB12 WB
1 NB/8 SB none1 NB/0 SB 0 NB/1 SB3 NB/0 SB none10 minutes 10 minutes
Other Noise Sources: distant: aircraft/roadway traffic/trains/landscaping/rustling leaves/children playing/dogs barking/birds vocalizing/Insects
Photos Taken?
URS ANCP, Field Noise Measurement Form, Vers. 1.2 111109
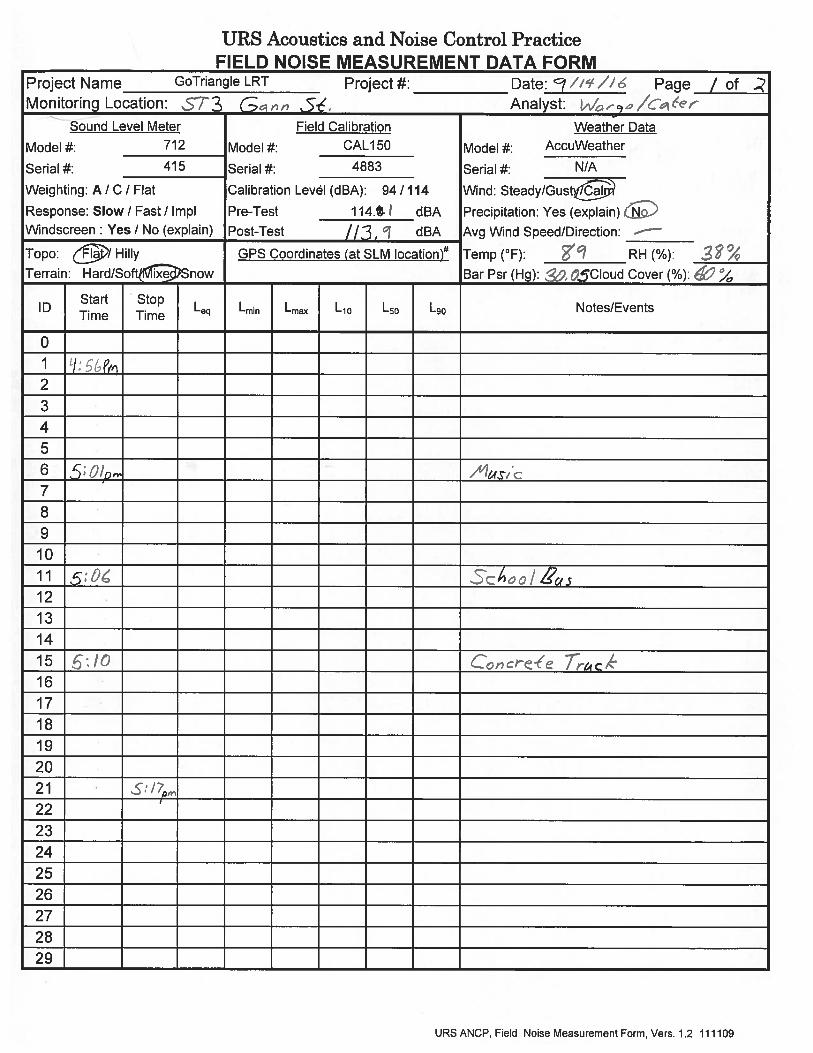
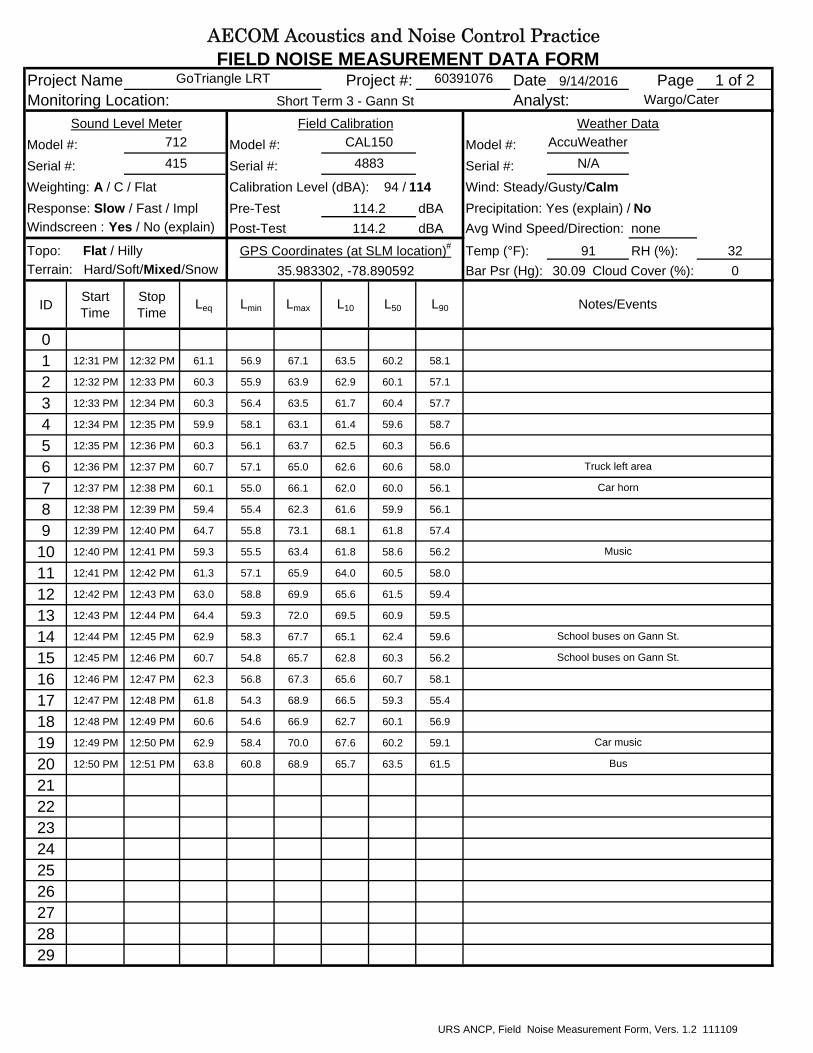
AECOM Acoustics and Noise Control PracticeFIELD NOISE MEASUREMENT DATA FORM
Project Name Project #: Date Page 1 of 2Monitoring Location: Analyst:
Model #: Model #: Model #:Serial #: Serial #: Serial #:Weighting: A / C / Flat Calibration Level (dBA): 94 / 114 Wind: Steady/Gusty/CalmResponse: Slow / Fast / Impl Pre-Test dBA Precipitation: Yes (explain) / NoWindscreen : Yes / No (explain) Post-Test dBA Avg Wind Speed/Direction: none
Topo: Flat / Hilly Temp (°F): RH (%): 38Terrain: Hard/Soft/Mixed/Snow Bar Psr (Hg): 30.05 Cloud Cover (%): 60
ID Start Time
Stop Time
Leq Lmin Lmax L10 L50 L90
01 4:56 PM 4:57 PM 63.3 59.9 70.3 65.6 62.3 60.5
2 4:57 PM 4:58 PM 67.2 60.6 75.6 71.1 63.6 61.1
3 4:58 PM 4:59 PM 60.7 57.9 63.9 62.7 60.3 58.3
4 4:59 PM 5:00 PM 61.5 59.1 63.6 62.9 61.3 59.6
5 5:00 PM 5:01 PM 61.3 58.0 63.5 62.8 61.4 58.6
6 5:01 PM 5:02 PM 59.5 57.2 62.5 61.6 58.8 57.3
7 5:02 PM 5:03 PM 61.4 57.0 66.1 64.3 60.5 57.7
8 5:03 PM 5:04 PM 60.6 58.2 65.0 61.6 60.4 59.3
9 5:04 PM 5:05 PM 63.7 58.6 70.3 68.1 61.1 59.2
10 5:05 PM 5:06 PM 61.5 59.9 66.2 62.8 61.3 60.3
11 5:06 PM 5:07 PM 60.2 57.2 64.2 62.3 59.5 57.7
12 5:07 PM 5:08 PM 59.0 57.3 61.0 60.5 58.9 57.5
13 5:08 PM 5:09 PM 60.9 58.1 66.2 63.2 60.0 58.8
14 5:09 PM 5:10 PM 64.8 56.6 72.1 70.5 60.7 57.5
15 5:10 PM 5:11 PM 61.6 56.7 65.1 63.9 61.1 58.3
16 5:11 PM 5:12 PM 61.6 56.2 66.8 63.6 61.3 58.0
17 5:12 PM 5:13 PM 59.3 56.0 61.5 61.0 59.3 56.8
18 5:13 PM 5:14 PM 58.8 55.5 64.1 60.8 58.6 55.9
19 5:14 PM 5:15 PM 61.1 57.8 65.5 64.1 59.9 58.6
20 5:15 PM 5:16 PM 68.1 59.0 81.6 64.8 61.7 59.7
212223242526272829
GoTriangle LRT 60391076 9/14/2016Short Term 3 - Gann St Wargo/Cater
Sound Level Meter Field Calibration Weather Data712 CAL150 AccuWeather415 4883 N/A
GPS Coordinates (at SLM location)# 89
114.1113.9
35.983302, -78.890592
Notes/Events
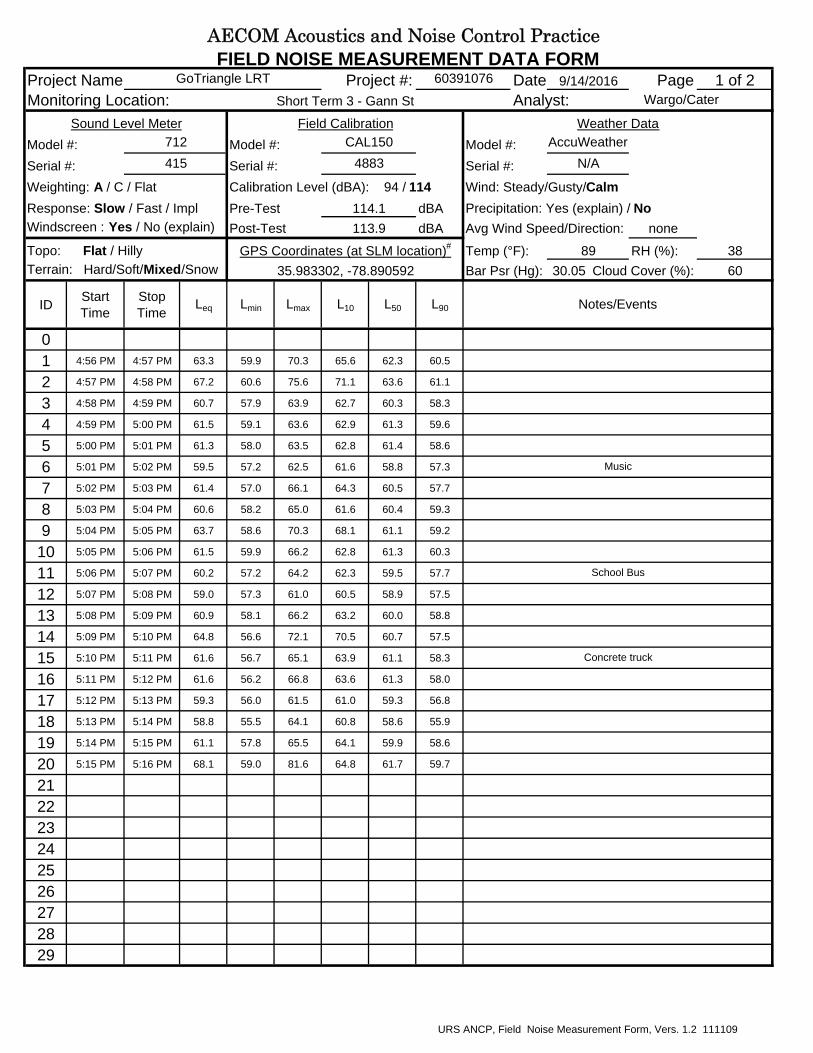
Music
School Bus
Concrete truck
URS ANCP, Field Noise Measurement Form, Vers. 1.2 111109

AECOM Acoustics and Noise Control PracticeFIELD NOISE MEASUREMENT DATA FORM
Speed (post/obs)*Number of LanesWidth (pave/row)
1- or 2- wayGrade
Bus StopsStoplights
Motorcycles
Automobiles
Medium TrucksHeavy TrucksBusesCount duration
# - note coordinate system * - Speed estimated by Radar / Driving / Observation
Yes/NoAdditional Notes/Comments:
Additional Notes and Sketches on Reverse
Monitoring Location: ST3 - Afternoon
Roadway Name/Dir Alston NB/SB Gann EB/WB compass Site Diagram:
35 mph 25 mph2/1/1 1/148' 24'
2 2
See hand-drawn sketchnone nonenone none
1 1none none
110 NB145 SB
38 EB19 WB
3 NB/2 SB none0 NB/1 SB none0 NB/1 SB 1 EB/0 WB10 minutes 10 minutes
Other Noise Sources: distant: aircraft/roadway traffic/trains/landscaping/rustling leaves/children playing/dogs barking/birds vocalizing/Insects
Photos Taken?
URS ANCP, Field Noise Measurement Form, Vers. 1.2 111109

AECOM Acoustics and Noise Control PracticeFIELD NOISE MEASUREMENT DATA FORM
Project Name Project #: Date Page 1 of 2Monitoring Location: Analyst:
Model #: Model #: Model #:Serial #: Serial #: Serial #:Weighting: A / C / Flat Calibration Level (dBA): 94 / 114 Wind: Steady/Gusty/CalmResponse: Slow / Fast / Impl Pre-Test dBA Precipitation: Yes (explain) / NoWindscreen : Yes / No (explain) Post-Test dBA Avg Wind Speed/Direction: none
Topo: Flat / Hilly Temp (°F): RH (%): 60Terrain: Hard/Soft/Mixed/Snow Bar Psr (Hg): 30.10 Cloud Cover (%): 0
ID Start Time
Stop Time
Leq Lmin Lmax L10 L50 L90
01 9:18 PM 9:19 PM 58.2 55.7 63.2 59.8 57.8 56.3
2 9:19 PM 9:20 PM 58.8 53.0 62.3 60.9 59.2 53.9
3 9:20 PM 9:21 PM 60.2 57.2 63.0 62.1 59.8 58.0
4 9:21 PM 9:22 PM 60.0 56.7 64.7 62.5 59.2 57.4
5 9:22 PM 9:23 PM 58.2 56.1 61.3 59.7 57.9 56.4
6 9:23 PM 9:24 PM 60.4 55.3 66.5 62.3 59.6 56.9
7 9:24 PM 9:25 PM 56.9 55.0 60.1 58.4 56.6 55.3
8 9:25 PM 9:26 PM 58.8 55.3 61.5 60.8 58.5 56.0
9 9:26 PM 9:27 PM 59.0 56.2 61.8 60.9 58.8 56.5
10 9:27 PM 9:28 PM 59.6 55.5 62.6 61.6 59.3 56.2
11 9:28 PM 9:29 PM 58.0 54.7 61.0 60.0 57.5 55.4
12 9:29 PM 9:30 PM 60.2 56.7 68.1 62.0 59.0 57.2
13 9:30 PM 9:31 PM 58.9 54.3 64.8 60.9 57.8 55.0
14 9:31 PM 9:32 PM 60.4 55.0 67.2 63.3 59.3 55.4
15 9:32 PM 9:33 PM 60.1 56.6 62.8 61.7 60.2 57.4
16 9:33 PM 9:34 PM 58.7 55.2 65.0 60.8 57.8 56.1
17 9:34 PM 9:35 PM 57.5 55.1 60.8 58.9 57.1 55.9
18 9:35 PM 9:36 PM 57.9 55.8 61.8 59.4 57.5 56.2
19 9:36 PM 9:37 PM 59.4 55.5 64.6 61.7 58.4 56.4
20 9:37 PM 9:38 PM 58.8 56.0 63.6 60.6 57.9 56.7
212223242526272829
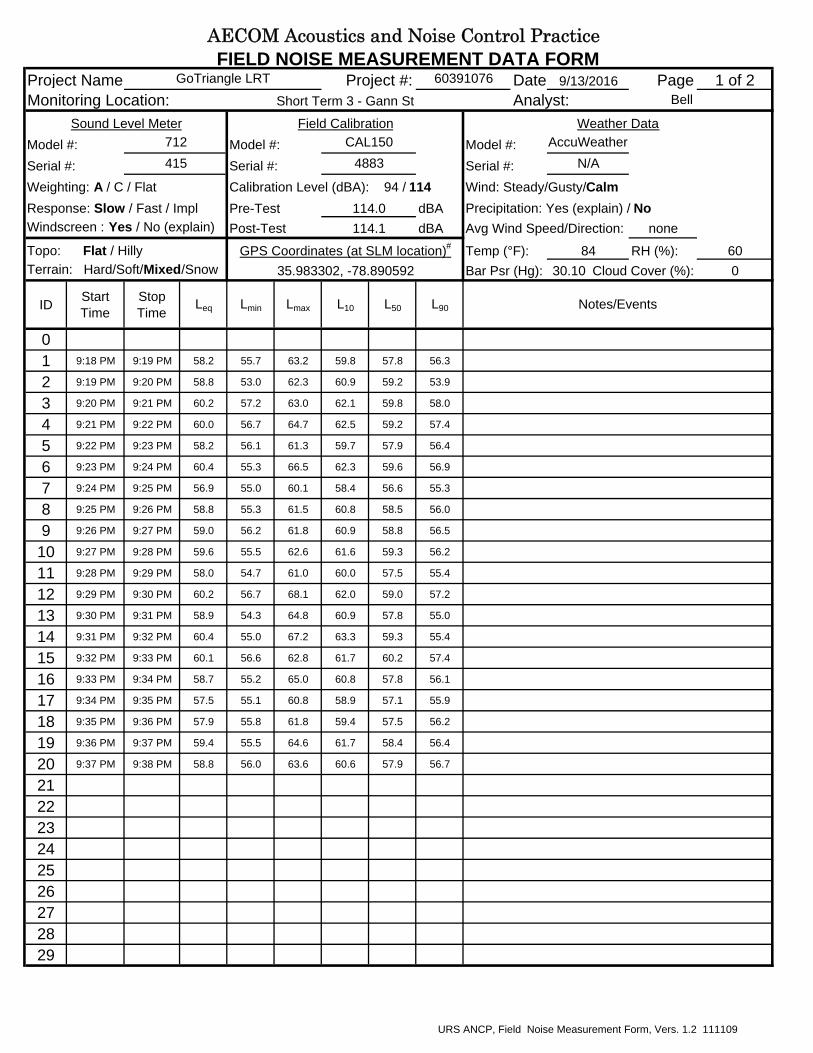
GoTriangle LRT 60391076 9/13/2016Short Term 3 - Gann St Bell
Sound Level Meter Field Calibration Weather Data712 CAL150 AccuWeather415 4883 N/A
114.0114.1
GPS Coordinates (at SLM location)# 8435.983302, -78.890592
Notes/Events
URS ANCP, Field Noise Measurement Form, Vers. 1.2 111109

AECOM Acoustics and Noise Control PracticeFIELD NOISE MEASUREMENT DATA FORM
Speed (post/obs)*Number of LanesWidth (pave/row)
1- or 2- wayGrade
Bus StopsStoplights
Motorcycles
Automobiles
Medium TrucksHeavy TrucksBusesCount duration
# - note coordinate system * - Speed estimated by Radar / Driving / Observation
Yes/NoAdditional Notes/Comments:
Additional Notes and Sketches on Reverse
Monitoring Location: ST3 - Evening
Roadway Name/Dir Alston NB/SB Gann EB/WB compass Site Diagram:
35 mph 25 mph2/1/1 1/148' 24'
2 2
See hand-drawn sketchnone nonenone none
1 11 NB/0 SB none
65 NB61 SB
14 EB11 WB
none nonenone none
10 minutes 10 minutesnone none
Other Noise Sources: distant: aircraft/roadway traffic/trains/landscaping/rustling leaves/children playing/dogs barking/birds vocalizing/Insects
Photos Taken?
URS ANCP, Field Noise Measurement Form, Vers. 1.2 111109