appendix g quality control summary report g quality control summary report ... (1) to describe the...
TRANSCRIPT

01/069(doc)/121102
APPENDIX G QUALITY CONTROL SUMMARY REPORT
Phase II Remedial Investigation of Load Line 1
at the Ravenna Army Ammunition Plant
Ravenna, Ohio
March 2001
01/069(doc)/121102 G-3
1.0 PURPOSE OF THIS REPORT
The purpose of this Quality Control Summary Report (QCSR) is (1) to describe the Quality Control (QC) procedures followed to ensure data generated by SAIC during these investigations at RVAAP would meet project requirements; (2) to describe the quality of the data collected; and (3) to describe problems encountered during the course of the study and their solutions. A separate Chemical Quality Assessment Report (CQAR) will be completed by USACE’s QA representative covering data generated from QA split samples remanded to their custody.
This report provides an assessment of the analytical information gathered during the course of the RVAAP Phase II RI for LL1 performed during 2000. It documents that the quality of the data employed for the RI report and evaluation met the project objectives. Evaluation of field and laboratory QC measures will constitute the majority of this assessment; however, references will also be directed toward those QA procedures that establish data credibility. The primary intent of this assessment is to illustrate that data generated for these studies can withstand scientific scrutiny, are appropriate for their intended purpose, are technically defensible, and are of known and acceptable sensitivity, precision, and accuracy.
Multiple activities must be performed to achieve the desired data quality in this project. As discussed in the report, decisions were made during the initial scoping of the RI to define the quality and quantity of data required. DQOs were established to guide the implementation of the field sampling and laboratory analysis (refer to the RVAAP SAP Addendum September 2000). A QA program was established to standardize procedures and to document activities (refer to the RVAAP Facility-Wide QAPjP April 1996 and the Addendum of October 1999). This program provided a means to detect and correct any deficiencies in the process. Upon receipt by the project team, data was subjected to verification and validation review that identified and qualified problems related to the analysis. The findings of these review steps contribute to this final data quality assessment, which defines that data used in the investigation met the criteria and are employed appropriately.
01/069(doc)/121102 G-4
THIS PAGE INTENTIONALLY LEFT BLANK

01/069(doc)/121102 G-5
2.0 QUALITY ASSURANCE PROGRAM
A Facility-Wide Quality Assurance Project Plan (QAPjP) and a Phase II RI QAPjP Addendum for the Load Line 1 Area were developed to guide the investigation. These plans are found in Part II of the Facility-Wide SAP (SAIC, April 1996) and the Phase II Remedial Investigation of Load Line 1, SAP Addendum No. 2 (SAIC, September 2000) for the RVAAP, Ravenna, Ohio. The purposes of these documents were to enumerate the quantity and type of samples to be taken to investigate the AOC and to define the quantity and type of QA/QC samples to be used to evaluate the quality of the data obtained.
The QAPjP established requirements for both field and laboratory QC procedures. In general, field QC duplicates and QA split samples were required for each environmental sample matrix collected in the area being investigated; VOC trip blanks were to accompany each cooler containing water samples for VOC determinations; and analytical laboratory QC duplicates, matrix spikes, laboratory control samples, and method blanks were required for every 20 samples or less of each matrix and analyte.
A primary goal of the RVAAP QA program is to ensure that the quality of results for all environmental measurements are appropriate for their intended use. To this end, the QAPjP and standardized field procedures were compiled to guide the investigation. Through the process of readiness review, training, equipment calibration, QC implementation, and detailed documentation, the project has successfully accomplished the goals set for the QA Program. Surveillances were conducted to determine the adequacy of field performance as evaluated against the QA plan and procedures.
2.1 MONTHLY PROGRESS REPORTS
Monthly Progress Reports (MPRs) were completed by the SAIC project manager for each month of the project’s duration. The MPRs contained the following information: work completed, problems encountered, corrective actions/solutions, summary of findings, and upcoming work. These reports were issued to the USACE Louisville District project manager with copies forwarded to the Ohio EPA. Access to these reports can be obtained through the Corp project manager.
2.2 DAILY QUALITY CONTROL REPORTS (DQCRS)
The field team leader produced all Daily Quality Control Reports. These include information such as, but not limited to, on-site sub-tier contractors, on-site equipment, work performed summaries, QC activities, health and safety activities, problems encountered, and corrective actions. The DQCRs were submitted to the USACE Louisville District project manager and may be obtained through his office.
2.3 LABORATORY “DEFINITIVE” LEVEL DATA REPORTING
The QAPjP for this project identified requirements for laboratory data reporting and identified Severn Trent Laboratories (STL) of North Canton, Ohio, as the lab for the project. During the execution of the project, the North Canton facility took the lead and performed the majority of the analyses, while STL, Knoxville performed explosives by High Pressure Liquid Chromatograhy (HPLC) and STL, Sacramento performed nitroguanidine and nitrocellulose determinations. EPA “definitive” data have been reported, including the following basic information:
1. laboratory case narratives

01/069(doc)/121102 G-6
2. sample results (soils/sediments reported per dry weight) 3. laboratory method blank results 4. laboratory control standard results 5. laboratory sample matrix spike recoveries 6. laboratory duplicate results 7. surrogate recoveries (VOCs, SVOCs, PCBs, Explosives) 8. sample extraction dates 9. sample analysis dates
This information from the laboratory, along with field information, provides the basis for subsequent data evaluation relative to sensitivity, precision, accuracy, representativeness, and completeness. These have been presented in Chapter 4.0.
01/069(doc)/121102 G-7
3.0 DATA VERIFICATION
When evaluating the project data quality, the objective is to determine its usability. The evaluation is based on the interpretation of laboratory QC measures, field QC measures, and the project DQOs. This project implemented data verification checklists to facilitate laboratory data verification. These checklists were completed by the project designated verification staff and were reviewed by the project laboratory coordinator. Data verification checklists for each laboratory sample delivery group (SDG) have been retained with laboratory data deliverables in the project files.
3.1 FIELD DATA VERIFICATION
DQCRs were completed by the field team leader. The DQCRs and other field-generated documents, such as sampling logs, boring logs, daily health and safety summaries, daily safety inspections, equipment calibration and maintenance logs, and sample management logs, were peer reviewed on-site. These logs and all associated field information have been delivered to the Louisville Corp project manager and can be obtained through his office.
3.2 LABORATORY DATA VERIFICATION
Analytical data generated for this project have been subjected to a process of data verification and review. The following describes this systematic process and the evaluation activities performed. Several criteria have been established against which the data were compared and from which a judgment was rendered regarding the acceptance and qualification of the data. Because it is beyond the scope of this report to cite those criteria, the reader is directed to the following documents for specific detail:
• SAIC Technical Support Contractor QA Technical Procedure (TP-DM-300-7) Data Verification and Validation;
• EPA – National Functional Guidelines for Inorganic Data Review, EPA 540/R-94/013, February 1994;
• EPA – National Functional Guidelines for Organic Data Review, EPA-540/R-94/012, February 1994; and
• Phase II Remedial Investigation at Load Line 1 at the RVAAP, Ravenna, Ohio, Sampling and Analysis Plan Addendum No. 2, SAIC, September 2000.
Upon receipt of field and analytical data, verification staff performed a systematic examination of the reports, following standardized data package checklists to ensure the content, presentation, and administrative validity of the data. Discrepancies identified during this process were recorded and documented utilizing the checklists. As part of data verification, standardized laboratory electronic data deliverables were subjected to review. This technical evaluation ensured that all contract-specified requirements had been met and that electronic information conformed to reported hard-copy data. QA program NCR and Corrective Action systems were implemented as required.
During the verification phase of the review and evaluation process, data were subjected to a systematic technical review by examining all field and analytical QC results and laboratory documentation, following EPA functional guidelines and SAIC internal procedures for laboratory data validation. These data validation

01/069(doc)/121102 G-8
guidelines define the technical review criteria, methods for evaluation of the criteria, and actions to be taken resulting from the review of these criteria. The primary objective of this phase was to assess and summarize the quality and reliability of the data for the intended use and to document factors that may affect the usability of the data. This process did not include in-depth review of raw data instrument output or recalculation of results from the primary instrument output. This data verification and analytical review process included, but was not necessarily limited to, the following parameters:
• Data completeness • Analytical holding times and sample preservation • Calibration (initial and continuing) • Method blanks • Sample results verification • Surrogate recovery • Laboratory control standard (LCS) analysis • Internal standard performance • Matrix spike (MS) recovery • Duplicate analysis comparison • Reported detection limits • Compound, element, isotope quantification • Reported detection levels • Secondary dilutions.
As an end result of this phase of the review, the data were qualified based on the technical assessment of the verification/review criteria. Qualifiers were applied to each field and analytical result to indicate the usability of the data for its intended purpose.
3.3 DEFINITION OF DATA QUALIFIERS (FLAGS)
During the data verification process, all laboratory data were assigned appropriate data qualification flags and reason codes. Qualification flags are defined as follows:
“U” Indicates the analyte was analyzed for, but not detected above, the level of the associated value.
“J” Indicates the analyte was positively identified; however, the associated numerical value is an approximate concentration of the analyte in the sample.
“UJ” Indicates the analyte was analyzed for, but not detected, above the associated value; however, the reported value is an estimate and demonstrates a decreased knowledge of its accuracy or precision.
“R” Indicates the analyte value reported is unusable. The integrity of the analyte’s identification, accuracy, precision, or sensitivity has raised significant questions as to the reality of the information presented.
“=” Indicates the analyte has been reviewed and positively identified, and the associated concentration value is accurate.
SAIC qualification reason codes have been provided as Attachment 1, while copies of verification/validation checklists and qualified data forms are on file with the analytical laboratory deliverable.

01/069(doc)/121102 G-9
3.4 DATA ACCEPTABILITY
More than 450 environmental soil, sediment, surface water, groundwater, and field QC samples were collected with approximately 24,000 discrete analyses (i.e., analytes) being obtained, reviewed, and integrated into the assessment (these totals do not include field measurements and field descriptions). The on-site field laboratory processed more than 380 soil and sediment samples to produce more than 660 trinitrotoluene and RDX screening measurements. A hand-held field XRF unit collected in-situ metal data at 126 locations, providing screening results for more than 12,000 elemental data points, while more than 11,000 elemental determinations were performed on prepared composite samples from the area. The project produced acceptable results for more than 99 percent of the sample analyses performed and successfully collected investigation samples under the direction of the SAP and the USACE, Louisville District. Data that were rejected are relegated primarily to a few SVOC compound determinations.
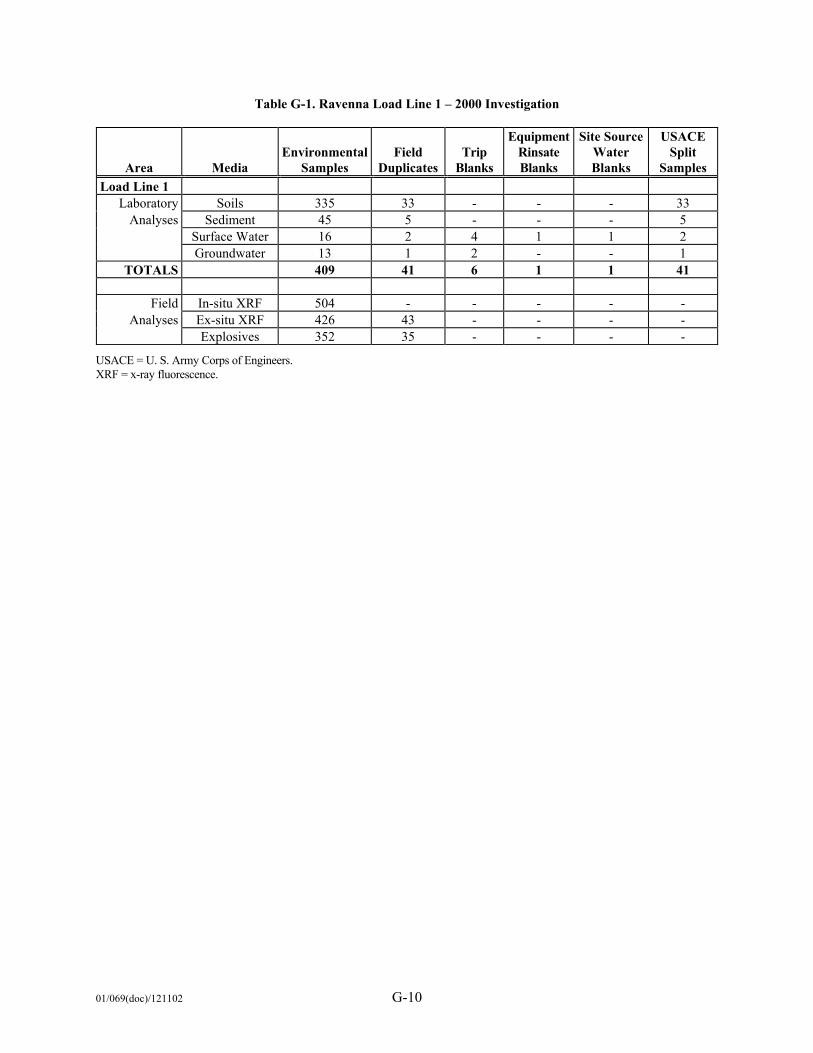
Table G-1 presents a summary of the collected investigation samples. It tallies the successful collection of all targeted field QC and QA split samples, while Table G-2 identifies a cross-reference for duplicate and QA split sample pair numbers. Table G-3 provides a summary of rejected analyses grouped by media and analyte category.
For this RVAAP study, a total of 41 field duplicates were analyzed for soil, sediment, groundwater, and surface water media. One equipment rinsate was collected and analyzed for this project. The site potable water source was sampled as LL11152. Trip blanks for VOC determinations were analyzed relative to each shipment of VOC water samples, totaling six analyses for this report.
SVOCs (3,3’-dichlorobenzidine, 4-chlorobenzenamine, and hexachlorocyclopentadiene) results in several soil and a few water samples were rejected due to sample matrix interferences as demonstrated by very poor matrix spike recoveries. Two hexavalent chromium values, two nitrocellulose concentrations, and one PCB result were also rejected during the verification process. These deviations increase the possibility of false negative results and warrant rejection of these low and undetected values.
The majority of estimated values were based on values observed between the laboratory method detection levels and the project reporting levels. Values determined in this region have an inherently higher variability and need to be considered estimated, at best.
01/069(doc)/121102 G-10
Table G-1. Ravenna Load Line 1 – 2000 Investigation
Area Media Environmental
Samples Field
DuplicatesTrip
Blanks
Equipment Rinsate Blanks
Site Source Water Blanks
USACE Split
Samples Load Line 1
Laboratory Soils 335 33 - - - 33 Analyses Sediment 45 5 - - - 5
Surface Water 16 2 4 1 1 2 Groundwater 13 1 2 - - 1
TOTALS 409 41 6 1 1 41
Field In-situ XRF 504 - - - - - Analyses Ex-situ XRF 426 43 - - - -
Explosives 352 35 - - - -
USACE = U. S. Army Corps of Engineers. XRF = x-ray fluorescence.

01/069(doc)/121102 G-11
Table G-2. Ravenna Load Line 1 – Primary, Duplicate, and Split Sample Correlation Table
Media Station # Sample #/
Duplicate # SDG #
Metals, etc. SDG #
Explosives SDG #
Propellants Split # Surface Soil LL1-276 LL11004
LL11107 A0I190150 A0I190150
A0I190150 A0I190150
A0I190234 A0I190234
LL11157
Surface Soil LL1-143 LL10799 LL11111
A0I190199 A0I190215
A0I210169 A0I190215
A0I210223 A0I190246
LL11161
Surface Soil LL1-186 LL10893 LL11110
A0I190215 A0I190215
A0I270155 A0I2190215
A0I270168 A0I190246
LL11160
Surface Soil LL1-198 LL10907 LL11119
A0I280137 A0I280137
NONE NONE
NONE NONE
LL11169
Sediment LL1-050 LL11052 LL11134
A0I190190 A0I190190
A0I210169 A0I190190
A0I210223 A0I190234
LL11184
Surface Soil LL1-171 LL10872 LL11114
A0I210168 A0I210168
A0I210168 A0I210168
A0I210230 A0I210230
LL11164
Surface Soil LL1-011 LL10838 LL11115
A0210211 A0210211
A0210211 A0210211
A0I210230 A0I210230
LL11165
Sediment LL1-048 LL11050 LL11135
A0I190226 A0I190226
A0I270144 A0I190226
A0I270168 A0I190246
LL11184
Sediment LL1-310 LL11040 LL11139
A0I210211 A0I210211
A0I210211 A0I210211
A0I210230 A0I210230
LL11189
Subsurface Soil LL1-008 LL10818 LL11113
A0I210169 A0I210169
A0I270155 A0I210169
A0I210168 A0I210223
LL11163
Surface Soil LL1-345 LL11242 LL11130
A0I300105 A0I300105
A0J030154 A0I300105
A0J030188 A0I300108
LL11180
Surface Soil LL1-213 LL10926 LL11123
A0I280176 A0I280176
A0J030146 A0I280176
A0J030180 A0I280184
LL11173
Surface Soil LL1-099 LL10740 LL11118
A0I280137 A0I280137
A0I300101 A0I280137
A0I300107 A0I280184
LL11168
Surface Soil LL1-108 LL10753 LL11120
A0I270155 A0I270155
A0I300101 A0I270155
A0I300107 A0I270168
LL11170
Surface Soil LL1-024 LL10981 LL11112
A0I270155 A0I270155
A0I300101 A0I270155
A0I300107 A0I270168
LL11162
Surface Water LL1-053 LL11071 LL11140
A0I210169 A0I210169
A0I210169 A0I210169
A0I210223 A0I210223
LL11190
Surface Soil LL1-088 LL10724 LL11117
A0I270144 A0I270144
A0J030154 A0I270144
A0J030188 A0I270168
LL11167
Surface Soil LL1-199 LL10908 LL11125
A0I300101 A0I300101
A0J030146 A0I300101
A0J030180 A0I300107
LL11175
Surface Soil LL1-406 LL11249 LL11280
A0J030154 A0J030154
A0J050176 A0J030154
A0J050213 A0J030188
LL11287
Surface Soil LL1-368 LL11258 LL11128
A0I300103 A0I300103
A0J030140 A0I300103
A0J030173 A0I300108
LL11178
Surface Soil LL1-385 LL11237 LL11278
A0I300103 A0I300103
A0J030146 A0I300103
A0J030180 A0I300108
LL11285
Surface Soil LL1-129 LL10782 LL11116
A0I300102 A0I300102
A0I300102 A0I300102
A0I300108 A0I300107
LL11166
Surface Soil LL1-130 LL10783 LL11121
A0I300102 A0I300102
A0I300102 A0I300102
A0I300107 A0I300108
LL11171

01/069(doc)/121102 G-12
Table G-2. Ravenna Load Line 1 – Primary, Duplicate, and Split Sample Correlation Table (continued)
Media Station # Sample #/
Duplicate # SDG #
Metals, etc. SDG #
Explosives SDG #
Propellants Split # Surface Soil LL1-125 LL10777
LL11122 A0I300102 A0I300102
A0J030140 A0I300102
A0J030173 A0I300108
LL11172
Subsurface Soil LL1-325 LL11245 LL11133
A0J030133 A0J030133
A0J030133 A0J030133
A0J030161 A0J030161
LL11183
Surface Soil LL1-358 LL11314 LL11129
A0J030140 A0J030140
A0J050176 A0J030140
A0J050205 A0J030173
LL11179
Subsurface Soil LL1-265 LL11233 LL11279
A0J030140 A0J030140
A0J030140 A0J030140
A0J030173 A0J030173
LL11286
Surface Soil LL1-327 LL11199 LL11109
A0I190199 A0I190199
A0I210169 A0I190199
A0I210223 A0I190246
LL11159
Sediment LL1-397 LL11274 LL11136
A0I300101 A0I300101
A0J050176 A0I300101
A0J050213 A0I300107
LL11186
Surface Soil LL1-210 LL10921 LL11124
A0I300101 A0I300101
A0J030146 A0I300101
A0J030180 A0I300107
LL11174
Subsurface Soil LL1-241 LL11339 LL11293
A0J050176 A0J050153
A0J050176 A0J050153
A0J050205 A0J050205
LL11296
Subsurface Soil LL1-242 LL11338 LL11294
A0J050176 A0J050153
A0J050176 A0J050153
A0J050205 A0J050205
LL11297
Groundwater LL1MW-065
LL11082 LL11145
A0J050153 A0J050153
A0J050153 A0J050153
A0J050205 A0J050205
LL11194
Surface Soil LL1-190 LL10897 LL11132
A0I300104 A0I300104
A0J030146 A0I300104
A0J030180 A0I300108
LL11182
Surface Soil LL1-362 LL11333 LL11281
A0J050153 A0J050153
A0J050153 A0J050153
A0J050205 A0J050205
LL11288
Surface Soil LL1-195 LL10903 LL11126
A0I300104 A0I300104
A0J030146 A0I300104
A0J030180 A0I300108
LL11176
Surface Soil LL1-196 LL10905 LL11127
A0I300104 A0I300104
NONE A0I300104
NONE A0I300108
LL11177
Surface Soil LL1-375 LL11223 LL11131
A0I300105 A0I300104
A0J050176 A0I300104
A0J050213 A0I300108
LL11181
Subsurface Soil LL1-243 LL11337 LL11292
A0J050176 A0J050153
A0J050176 A0J050153
A0J050205 A0J050205
LL11295
Sediment LL1-323 LL11103 LL11137
A0K080133 A0K080133
A0K080133 A0K080133
A0K080153 A0K080153
LL11187
Surface Water LL1-323 LL11097 LL11142
A0K080133 A0K080133
A0K080133 A0K080133
A0K080153 A0K080153
LL11192

01/069(doc)/121102 G-13
Table G-3. Ravenna Load Line 1 – 2000 Investigation Summary of Rejected Analytes (Laboratory)
(grouped by medium and analysis group)
Media Analysis Group Rejected/ Total Percent
Rejected Soil (surface and subsurface
Metals Volatile Organics Semivolatile Organics Pesticides/PCBs Explosives Miscellaneous Subtotal
0/ 0/
20/ 1/ 2/ 2/
25/
8,418 1,330 2,432 1,064 3,213 205 16,662
0.0 0.0 0.8 0.1 0.1 1.0
0.2
Sediment
Metals Volatile Organics Semivolatile Organics Pesticides/PCBs Explosives Miscellaneous Subtotal
0/ 0/ 0/ 0/ 0/ 0/
0/
1,127 315 576 252 408 55 2,733
0.0 0.0 0.0 0.0 0.0 0.0
0.0
Surface Water, Groundwater, and QC
Metals Volatile Organics Semivolatile Organics Pesticides/PCBs Explosives Miscellaneous Subtotal
0/ 0/
16/ 0/ 0/ 0/
16/
782 1,015 1,472 644 629 34 4,576
0.0 0.0 1.1 0.0 0.0 0.0
0.3
Project Total
41/
23,971
0.2
QC = quality control.

01/069(doc)/121102 G-14
THIS PAGE INTENTIONALLY LEFT BLANK

01/069(doc)/121102 G-15
4.0 DATA QUALITY EVALUATION
4.1 METALS
4.1.1 Soils and Sediments
Analytical holding times were met for all samples. Initial calibration and continuing calibration criteria were achieved for the majority of the data, although a few thallium and manganese values were qualified as estimated “J or UJ” due to continuing calibration verification results being slightly elevated. Minor method blank levels did result in qualification of sodium and beryllium values in many samples as non-detect or estimated non-detect “U or UJ.” Occasionally, aluminum, cadmium, calcium, mercury, potassium, thallium, and zinc concentrations were also qualified as non-detect or estimated due to method blank levels. Antimony concentrations were consistently qualified as estimated “J, UJ” due to low matrix spike results. Most of the other metals were occasionally estimated due to matrix spike values being low or high relative to criteria. None of these deviations were considered significant enough to reject any of the data. Post-digestion spike recoveries for thallium contributed to its consistent estimation “J or UJ” in the soil and sediment data. Occasional serial dilution variations caused aluminum, beryllium, calcium, iron, lead, magnesium, manganese, nickel, potassium, selenium, vanadium, and zinc levels to be estimated in various samples. Laboratory Control Sample (LCS) determinations were considered acceptable, with the exception of slightly elevated iron in one sample delivery group. This caused a few positive iron values to be qualified as estimated “J.” Reporting levels are considered to be consistent with the QAPP goals. Some of this data were qualified as estimated; however, none of the deviations were considered severe enough to reject any of the data. Although some analyses were qualified as estimated, the deviations observed should not have a primary influence on the results, and the values are considered technically sound and defensible. Complete data summary tables, with associated qualifiers, are provided in Chapter 4.0 of the main text for the LL1 report.
4.1.2 Groundwater, Surface Water, and Field QC Samples
Analytical holding times were met for all samples. Initial calibration and continuing calibration criteria were achieved. Minor method blank levels did result in the occasional qualification of aluminum, barium, beryllium, calcium, chromium, magnesium, manganese, nickel, potassium, sodium, and zinc concentrations in samples as non-detect or estimated non-detect “U or UJ.” Thallium concentrations were consistently qualified as estimated “J, UJ” due to low matrix spike results. Antimony and mercury were occasionally estimated due to matrix spike values being low or high relative to criteria. None of these deviations were considered significant enough to reject any of the data. Post-digestion spike recoveries for thallium contributed to its consistent estimation “J or UJ” in the water data. Occasional serial dilution variations caused potassium and zinc levels to be estimated in various samples. LCS determinations were considered acceptable throughout the data set. Reporting levels are considered to be consistent with the QAPP goals. Some of this data were qualified as estimated; however, none of the deviations were considered severe enough to reject any of the data. Although some analyses were qualified as estimated, the deviations observed should not have a primary influence on the results, and the values are considered technically sound and defensible. Complete data summary tables, with associated qualifiers, are provided in Chapter 4.0 of the main text for the LL1 report.

01/069(doc)/121102 G-16
4.2 VOLATILE ORGANIC ANALYSES
4.2.1 Soils and Sediments
Analytical holding times were met for all samples. All surrogate recoveries were acceptable with the exception of one sample 1,2-dichloroethene recovery. This only qualified results as estimated for a few compounds in one sample. Internal standard area counts were acceptable with the exception of a few samples 1,1,2,2-tetrachloroethane results, causing these compound values to be qualified as estimated “J or UJ.” Initial calibration criteria and continuing calibration criteria were met for all compounds. Method blanks were clear of contamination with the exception of measurable levels of acetone and methylene chloride. Sample data for most observed low acetone and methylene chloride concentrations were therefore qualified as non-detect “U” based on a 5× action level for these compounds. LCS and MS/MSD evaluations included the project-targeted analytes. Consistently elevated LCS recoveries were observed for acetone, 2-butanone, 2-hexanone, 4-methyl-2-pentanone, and styrene, while there were occasional low LCS recoveries for chloroethane and methlyene chloride. Associated compound values were qualified as estimated “J or UJ.” All other LCS recoveries were within criteria. MS recoveries and MS/MSD RPD values were acceptable with the exception of a few instances for trans-1,2-dichloroethene, trichloroethene, acetone, and toluene. Associated values were estimated “J or UJ,” as required. Although some analyses were qualified as estimated, the deviations observed should not have a primary influence on the results, and the values are considered technically sound and defensible.
4.2.2 Groundwater, Surface Water, and Field QC Samples
Analytical holding times were met for all samples. All surrogate recoveries and internal standard areas were acceptable. Initial calibration criteria and continuing calibration criteria were met for all compounds. Method blanks and trip blanks were clear of contamination with the exception of measurable levels of acetone and toluene. Sample data for most observed low acetone and toluene concentrations were therefore qualified as non-detect “U” based on a 5× action level for these compounds. LCS and MS/MSD evaluations included the project-targeted analytes. Occasionally, elevated LCS recoveries were observed for carbon disulfide and chloroethane. Associated compound values were qualified as estimated “J or UJ.” All other LCS recoveries were within criteria. MS recoveries and MS/MSD RPD values were acceptable for the water matrices. Although some analyses were qualified as estimated, the deviations observed should not have a primary influence on the results, and the values are considered technically sound and defensible.
4.3 SEMIVOLATILE ORGANIC ANALYSES
4.3.1 Soils and Sediments
Analytical holding times were met for all samples, with the exception of the need for re-analyses of sample LL11211 when initial analyses surrogate recoveries failed. All surrogate recoveries and internal standard area counts were acceptable with the exception of an elevated surrogate for polyaromatic hydrocarbon compounds in a few samples, causing values to be estimated. Continuing calibration verification percent differences greater than 25 caused several 2,4-dinitrophenol and 2,2-oxybis(1-chloropropane) concentrations to be estimated. All other initial calibration criteria and continuing calibration criteria were met for all compounds. Method blanks were clear of contamination. LCS and MS/MSD evaluations included the project-targeted analytes. 4-Chloroaniline and 3,3’dichlorobenzidine were estimated “UJ” in a few samples due to elevated LCS recoveries. Other LCS recoveries were within criteria. Poor MS recoveries caused data for seven compounds in sample LL11106 and 3,3’-dichlorobenzidine values in samples LL10753 and LL10981 to be rejected “R.” Other soil MS recoveries were acceptable. While some of this data were qualified as estimated, only a few data points exhibited enough significant deviations to be rejected. Although some analyses were

01/069(doc)/121102 G-17
qualified as estimated, the deviations observed should not have a primary influence on the results, and the values are considered technically sound and defensible.
4.3.2 Groundwater, Surface Water, and Field QC Samples
Analytical holding times were met for all samples. All surrogate recoveries and internal standard area counts were acceptable. All initial calibration criteria and continuing calibration criteria were met for all compounds. Method blanks were clear of contamination. LCS and MS/MSD evaluations included the project-targeted analytes. Poor LCS or MS recovery information did create the need to reject “R” many 3,3’-dichlorobenzidine, hexachlorocyclopentadiene, and 4-chlorobenzamine values in multiple samples. Rejected results for all analyses are itemized in Table G-4. Other LCS and MS water matrix recoveries were within criteria. While some of this water data were qualified as estimated, only a few data points exhibited enough significant deviations to be rejected. Although some analyses were qualified as estimated, the deviations observed should not have a primary influence on the results, and the values are considered technically sound and defensible.
4.4 PESTICIDE/PCB ANALYSES
4.4.1 Soils and Sediments
Analytical holding times were met for all samples. Surrogate recoveries were predominantly acceptable, with the exception of an elevated surrogate for PCBs in one sample, causing values to be estimated. Continuing calibration verification percent differences greater than 25 caused sporadic qualification of pesticide compounds as estimated “J or UJ” in the data set. All other initial calibration criteria and continuing calibration criteria were met for all compounds. Method blanks were clear of contamination. LCS and MS/MSD evaluations included the project-targeted pesticides; however, PCB evaluations only included Aroclors 1016 and 1260. Dieldrin, endrin, 4,4-DDT, 4,4-DDD, and alpha-BHC were estimated “UJ” in a few samples due to elevated LCS recoveries. Other LCS recoveries were within criteria. Poor MS recoveries caused Aroclor-1016 data in sample LL10753 to be rejected “R.” Other soil MS recoveries were acceptable. Positive compound results were consistently qualified as estimated “J” based on the percent difference between the primary column quantification and the secondary column quantification. While some of this data was qualified as estimated, only a few data points exhibited enough significant deviations to be rejected. Although some analyses were qualified as estimated, the deviations observed should not have a primary influence on the results, and the values are considered technically sound and defensible.
4.4.2 Groundwater, Surface Water, and Field QC Samples
Analytical holding times were met for all samples. All surrogate recoveries were acceptable with the exception of the PCB surrogate in sample LL11150. PCB values in this sample were estimated “J or UJ.” All initial calibration criteria and continuing calibration criteria were met for all compounds, with the exception of elevated CCV percent differences in two instances. Toxaphene and alpha-BHC data were estimated “UJ” in these isolated cases. Method blanks were clear of contamination. LCS and MS/MSD evaluations included the project-targeted pesticides; however, PCB evaluations only included Aroclors 1016 and 1260. Water LCS and MS recoveries were within criteria. Although some analyses were qualified as estimated, the deviations observed should not have a primary influence on the results, and the values are considered technically sound and defensible

01/069(doc)/121102 G-18
4.5 EXPLOSIVE ANALYSES
4.5.1 Soils and Sediments
Analytical holding times were met for all samples. Continuing calibration verification percent differences greater than 25 caused a few isolated qualifications of tetryl, 2,6-dinitrotoluene, 4-nitrotoluene, and 2-amino-4,6-dinitrotoluene as estimated “J or UJ” in the data set. All other initial calibration criteria and continuing calibration criteria were met for all compounds. A few method blanks contained low concentrations of 2,4,6-trinitrotoluene or 2,4-dinitrotoluene. This resulted in some low concentrations of these compounds to be qualified as undetected “U.” All other method blanks were clear of contamination. Surrogate compound recoveries were acceptable for all analyses. LCS and MS/MSD evaluations included the project-targeted analytes, with the exception of nitroglycerine. LCS and MS/MSD recoveries were within criteria. Although some analyses were qualified as estimated, the deviations observed should not have a primary influence on the results, and the values are considered technically sound and defensible.
4.5.2 Groundwater, Surface Water, and Field QC Samples
Analytical holding times were met for all samples. All initial calibration criteria and continuing calibration criteria were met for all compounds. Method blanks were clear of contamination. Surrogate compound recoveries were acceptable for all analyses. LCS and MS/MSD evaluations included the project-targeted analytes, with the exception of nitroglycerine. Water LCS and MS recoveries were within criteria. Although some analyses were qualified as estimated, the deviations observed should not have a primary influence on the results, and the values are considered technically sound and defensible
4.6 NITROGUANIDINE AND NITROCELLULOSE ANALYSES
4.6.1 Soils and Sediments
Analytical holding times were met for most samples. There were a few instances when holding times were slightly exceeded; however, these were not considered exceptional, and associated nitrocellulose/nitroguanidine data were simply estimated “J or UJ.” Initial calibration criteria and continuing calibration criteria were met for all analyses. Several method blanks contained low concentrations of nitrate, which resulted in similar low concentrations of nitrocellulose being qualified as undetected “U.” All other method blanks were clear of contamination for both compounds. There were a few instances of elevated LCS or MS recoveries for nitroguanidine that caused estimation “J” of associated data. Two nitrocellulose values were rejected “R” due to very low MS recoveries. These were in samples LL11132 and LL11247. All other LCS and MS/MSD recoveries were within criteria. While some of this data was qualified as estimated, only a few data points exhibited enough significant deviations to be rejected. Although some analyses were qualified as estimated, the deviations observed should not have a primary influence on the results, and the values are considered technically sound and defensible.
4.6.2 Groundwater, Surface Water, and Field QC Samples
Analytical holding times were met for most samples. There were a few instances when holding times were slightly exceeded; however, these were not considered exceptional, and associated nitrocellulose/nitroguanidine data were simply estimated “J or UJ.” Initial calibration criteria and continuing calibration criteria were met for all analyses. All method blanks were clear of contamination for both compounds. All LCS and MS/MSD recoveries were within criteria. Although some analyses were qualified as estimated, the deviations observed should not have a primary influence on the results, and the values are considered technically sound and defensible.

01/069(doc)/121102 G-19
4.7 MISCELLANEOUS ANALYSES
4.7.1 Soils, Sediments, Groundwaters, Surface Waters, and Field QC Samples
Analytical holding times were met for all TOC determinations and for most cyanide analyses. Hexavalent chromium analyses were predominantly run outside holding time. Analyses performed outside holding times were qualified as estimated “J or UJ.” Initial calibration criteria and continuing calibration criteria were met for all analyses. All method blanks were clear of contamination for these analytes. There were a few instances of elevated MS recoveries or RDP values for cyanide and TOC that caused estimation “J” of the associated data. Two hexavalent chromium values were rejected “R” due to very low MS recoveries, while other hexavalent chromium MS recoveries caused associated data to be consistently estimated “J or UJ.” Hexavalent chromium for samples LL10753 and LL11124 were rejected. LCS recoveries were consistently within criteria. While some of this data were qualified as estimated, only a few data points exhibited enough significant deviations to be rejected. Although some analyses were qualified as estimated, the deviations observed should not have a primary influence on the results, and the values are considered technically sound and defensible.
4.8 PRECISION
Field duplicate samples were collected to ascertain the contribution to variability (i.e., precision) due to the combination of environmental media, sampling consistency, and analytical precision. Field duplicate samples were collected from the same spatial and temporal conditions as the primary environmental sample. Soil samples were collected from the same sampling device, after homogenization for all analytes except VOCs.
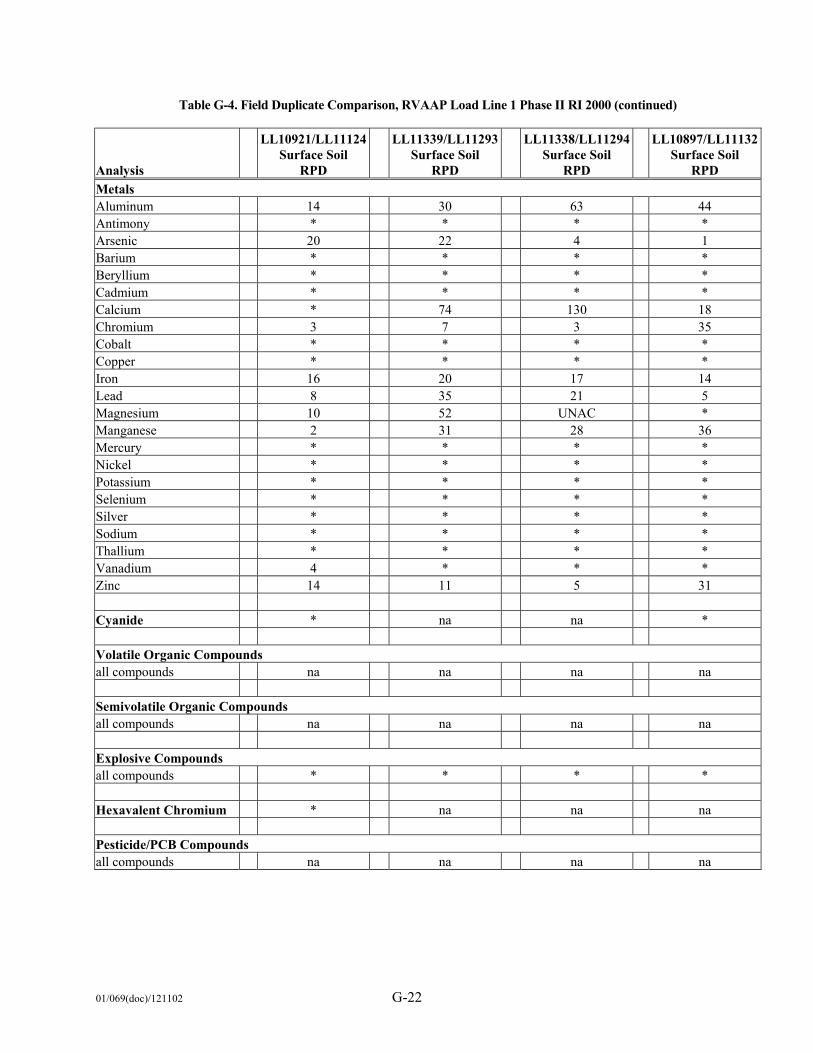
Field duplicate comparison information in Table G-4 presents the absolute difference or RPD for field duplicate measurements, by analyte. RPD was calculated only when both samples were >5 times the reporting level. When one or both sample values were between the quantitation level and 5 times the reporting level, the absolute difference was evaluated. If both samples were not detected for a given analyte, precision was considered acceptable. In order to review information, this data quality assessment has implemented general criteria for comparison of absolute difference measurements and RPDs. RPD criteria were set at 50, and absolute difference criteria were set at 3 times the reporting level.
Field duplicate metal comparisons are considered good. Of 690 RPD observations in surface soil duplicates, 647 (95 percent) were <50 or had acceptable absolute differences, while all of the 69 RPD observations for subsurface soil duplicates were <50 or had acceptable absolute differences. Only 2 percent of the surface soil RPD comparisons were >100, and only 3 percent were >50. Nine of the >100 RPD comparisons were within the one duplicate set of samples LL11199 and LL11109. Sediment duplicate metal comparisons were also good, with 89 percent of the RPDs <50 or with acceptable absolute differences. Only 1 percent of the sediment RPD comparisons were >100, and 10 percent were >50. Nine of the >50 RPD comparisons were within the one duplicate set of samples LL11103 and LL11137.

01/069(doc)/121102 G-20
Table G-4. Field Duplicate Comparison, RVAAP Load Line 1 Phase II RI 2000
Analysis
LL11004/LL11107Surface Soil
RPD
LL10799/LL11111Surface Soil
RPD
LL10893/LL11110 Surface Soil
RPD
LL10907/LL11119Surface Soil
RPD Metals Aluminum 6 19 1 6 Antimony * * * * Arsenic 4 4 10 18 Barium * * * * Beryllium * * * * Cadmium * * UNAC * Calcium * * 42 * Chromium 7 13 5 11 Cobalt * * * * Copper * 31 1 * Iron 1 8 16 23 Lead 0 83 15 2 Magnesium 6 14 74 10 Manganese 1 19 1 8 Mercury * * * * Nickel * 9 * * Potassium * 24 * * Selenium * * * * Silver * * * * Sodium * * * * Thallium * * * * Vanadium * * * * Zinc 4 36 16 5 Cyanide na * na * Volatile Organic Compounds all compounds na na na na Semivolatile Organic Compounds all compounds na na na na Explosive Compounds all compounds * * * na Hexavalent Chromium na na na * Pesticide/PCB Compounds all compounds na na na na

01/069(doc)/121102 G-21
Table G-4. Field Duplicate Comparison, RVAAP Load Line 1 Phase II RI 2000 (continued)
Analysis
LL10872/LL11114Surface Soil
RPD
LL10838/LL11115Surface Soil
RPD
LL11242/LL11130 Surface Soil
RPD
LL10926/LL11123Surface Soil
RPD Metals Aluminum 11 23 2 1 Antimony * * * * Arsenic 12 13 6 3 Barium * * * * Beryllium * * * * Cadmium * * * * Calcium UNAC UNAC * * Chromium 67 7 3 2 Cobalt * * * * Copper 12 13 18 * Iron 19 16 14 0 Lead 74 30 9 7 Magnesium * * * 4 Manganese 16 24 7 2 Mercury * * * * Nickel * * * 0 Potassium * * * * Selenium * * * * Silver * * * * Sodium * * * * Thallium * * * * Vanadium * * * * Zinc 31 20 10 3 Cyanide na * na * Volatile Organic Compounds all compounds na na na na Semivolatile Organic Compounds all compounds na na na na Explosive Compounds all compounds * * * * except 2,4,6-TNT 34 0 * * Hexavalent Chromium * na na na Pesticide/PCB Compounds all compounds na na na na
01/069(doc)/121102 G-22
Table G-4. Field Duplicate Comparison, RVAAP Load Line 1 Phase II RI 2000 (continued)
Analysis
LL10921/LL11124Surface Soil
RPD
LL11339/LL11293Surface Soil
RPD
LL11338/LL11294 Surface Soil
RPD
LL10897/LL11132Surface Soil
RPD Metals Aluminum 14 30 63 44 Antimony * * * * Arsenic 20 22 4 1 Barium * * * * Beryllium * * * * Cadmium * * * * Calcium * 74 130 18 Chromium 3 7 3 35 Cobalt * * * * Copper * * * * Iron 16 20 17 14 Lead 8 35 21 5 Magnesium 10 52 UNAC * Manganese 2 31 28 36 Mercury * * * * Nickel * * * * Potassium * * * * Selenium * * * * Silver * * * * Sodium * * * * Thallium * * * * Vanadium 4 * * * Zinc 14 11 5 31 Cyanide * na na * Volatile Organic Compounds all compounds na na na na Semivolatile Organic Compounds all compounds na na na na Explosive Compounds all compounds * * * * Hexavalent Chromium * na na na Pesticide/PCB Compounds all compounds na na na na

01/069(doc)/121102 G-23
Table G-4. Field Duplicate Comparison, RVAAP Load Line 1 Phase II RI 2000 (continued)
Analysis
LL11223/LL11131Surface Soil
RPD
LL10753/LL11120Surface Soil
RPD
LL10981/LL11112 Surface Soil
RPD
LL10783/LL11121Surface Soil
RPD Metals Aluminum 7 27 43 9 Antimony * * * * Arsenic 0 16 16 9 Barium * * * * Beryllium * * * * Cadmium * * * 7 Calcium * 72 5 5 Chromium 1 15 7 11 Cobalt * * * * Copper 3 36 0 9 Iron 0 21 44 4 Lead 2 31 0 11 Magnesium * 55 * 17 Manganese 4 52 8 29 Mercury * * * * Nickel * * * * Potassium * * * * Selenium * * * * Silver * * * * Sodium * * * * Thallium * * * * Vanadium * * * * Zinc 12 21 18 7 Cyanide * * * * Volatile Organic Compounds all compounds na * * * Semivolatile Organic Compounds all compounds na * * * Explosive Compounds all compounds * * * * except Nitrocellulose * 35 * * Hexavalent Chromium na na na na Pesticide/PCB Compounds all compounds na * * *

01/069(doc)/121102 G-24
Table G-4. Field Duplicate Comparison, RVAAP Load Line 1 Phase II RI 2000 (continued)
Analysis
LL11333/LL11281Surface Soil
RPD
LL10903/LL11126Surface Soil
RPD
LL10905/LL11127 Surface Soil
RPD
LL11337/LL11292Surface Soil
RPD Metals Aluminum 23 3 2 1 Antimony * * * * Arsenic 20 20 7 25 Barium * * * * Beryllium * * * * Cadmium * * * * Calcium UNAC * * 10 Chromium 33 1 0 15 Cobalt * * * * Copper 1 21 * * Iron 18 15 13 1 Lead 1 28 7 53 Magnesium * * * * Manganese 11 58 10 6 Mercury * * * * Nickel * * * * Potassium * * * * Selenium * * * * Silver * * * * Sodium * * * * Thallium * * * * Vanadium * * 5 * Zinc 15 1 4 14 Cyanide na * * na Volatile Organic Compounds all compounds na na na na Semivolatile Organic Compounds all compounds na na na na Explosive Compounds all compounds * * na * Hexavalent Chromium na na na na Pesticide/PCB Compounds all compounds na na na na

01/069(doc)/121102 G-25
Table G-4. Field Duplicate Comparison, RVAAP Load Line 1 Phase II RI 2000 (continued)
Analysis
LL11199/LL11109Surface Soil
RPD
LL10782/LL11116Surface Soil
RPD
LL10777/LL11122 Surface Soil
RPD
LL11314/LL11129Surface Soil
RPD Metals Aluminum 127 21 4 10 Antimony * * * * Arsenic 122 11 7 6 Barium * * * * Beryllium * * * * Cadmium * * * * Calcium 96 * * 10 Chromium 131 23 7 6 Cobalt * * * * Copper 131 10 * 3 Iron 123 49 4 2 Lead 112 4 3 36 Magnesium 128 17 * * Manganese 114 9 7 11 Mercury * * * * Nickel * 16 * * Potassium * * * * Selenium * * * * Silver * * * * Sodium * * * * Thallium * * * * Vanadium * * * * Zinc 142 24 18 10 Cyanide * na * na Volatile Organic Compounds all compounds na na na na Semivolatile Organic Compounds all compounds na na na na Explosive Compounds all compounds * * * * Hexavalent Chromium na * * na Pesticide/PCB Compounds all compounds na na na na

01/069(doc)/121102 G-26
Table G-4. Field Duplicate Comparison, RVAAP Load Line 1 Phase II RI 2000 (continued)
Analysis
LL10740/LL11118Surface Soil
RPD
LL10724/LL11117Surface Soil
RPD
LL10908/LL11125 Surface Soil
RPD
LL11249/LL11280Surface Soil
RPD Metals Aluminum 30 0 4 9 Antimony * * * * Arsenic 10 7 2 10 Barium 47 16 * * Beryllium * * * * Cadmium * * * * Calcium * UNAC 33 UNAC Chromium 20 4 6 1 Cobalt UNAC UNAC * * Copper 0 2 4 * Iron 10 2 3 18 Lead 44 2 9 32 Magnesium 9 9 2 * Manganese 153 1 14 18 Mercury * * * * Nickel 10 3 7 * Potassium * * * 38 Selenium * * * * Silver * * * * Sodium * * * * Thallium * * * * Vanadium 38 * * 9 Zinc 14 1 2 28 Cyanide na na * na Volatile Organic Compounds all compounds na na na na Semivolatile Organic Compounds all compounds na na na na Explosive Compounds all compounds * * * * except 2,4,6-TNT UNAC * * * RDX 46 * * * Nitrocellulose 140 * * * Hexavalent Chromium * * * na Pesticide/PCB Compounds all compounds na na na na

01/069(doc)/121102 G-27
Table G-4. Field Duplicate Comparison, RVAAP Load Line 1 Phase II RI 2000 (continued)
Analysis
LL11258/LL11128Surface Soil
RPD
LL11237/LL11278Surface Soil
RPD
LL10818/LL11113 Subsurface Soil
RPD
LL11245/LL11133Subsurface Soil
RPD Metals Aluminum 11 0 13 2 Antimony * * * * Arsenic 1 15 31 15 Barium * * 14 * Beryllium * * * * Cadmium * * * * Calcium * * * * Chromium 3 4 8 4 Cobalt 51 * * * Copper * 2 * 13 Iron 4 5 9 12 Lead 12 19 19 12 Magnesium * * 9 9 Manganese 33 21 32 5 Mercury * * * * Nickel * * * * Potassium * * * * Selenium * * * * Silver * * * * Sodium * * * * Thallium * * * * Vanadium 4 * * * Zinc 5 3 5 21 Cyanide na na na * Volatile Organic Compounds all compounds na na na na Semivolatile Organic Compounds all compounds na na na na Explosive Compounds all compounds * * * * except 2,4,6-TNT * * * 20 Nitrocellulose * * * 89 Hexavalent Chromium na na * na Pesticide/PCB Compounds all compounds na na na na

01/069(doc)/121102 G-28
Table G-4. Field Duplicate Comparison, RVAAP Load Line 1 Phase II RI 2000 (continued)
Analysis
LL11233/LL11279Subsurface Soil
RPD
LL11052/LL11134Sediment
RPD
LL11040/LL11139 Sediment
RPD
LL11274/LL11136Sediment
RPD Metals Aluminum 8 32 34 3 Antimony * UNAC 7 * Arsenic 36 27 49 15 Barium * * * * Beryllium * * * * Cadmium * * * * Calcium * * 37 1 Chromium 8 22 37 1 Cobalt * * * * Copper 14 28 89 1 Iron 26 35 84 11 Lead 12 15 12 0 Magnesium 12 24 * 1 Manganese 28 2 24 10 Mercury * * * * Nickel * * 103 7 Potassium * * * * Selenium * * * * Silver * * * * Sodium * * * * Thallium * * * * Vanadium 7 * * * Zinc 15 4 17 2 Cyanide * na na na Volatile Organic Compounds all compounds na na na na Semivolatile Organic Compounds all compounds na na na na Explosive Compounds all compounds * * * * except 2,4,6-TNT 9 * * * Hexavalent Chromium na na * * Pesticide/PCB Compounds all compounds na na na na

01/069(doc)/121102 G-29
Table G-4. Field Duplicate Comparison, RVAAP Load Line 1 Phase II RI 2000 (continued)
Analysis
LL11050/LL11135 Sediment
RPD
LL11103/LL11137 Sediment
RPD Metals Aluminum 12 80 Antimony * * Arsenic 26 94 Barium * * Beryllium * * Cadmium * * Calcium 25 49 Chromium 19 77 Cobalt * * Copper 10 * Iron 28 85 Lead 24 90 Magnesium * 78 Manganese 3 83 Mercury * * Nickel * 83 Potassium * * Selenium * * Silver * * Sodium * * Thallium * * Vanadium * * Zinc 13 91 Cyanide * * Volatile Organic Compounds all compounds * * Semivolatile Organic Compounds all compounds * * Explosive Compounds all compounds * * except Hexavalent Chromium na na Pesticide/PCB Compounds all compounds * *

01/069(doc)/121102 G-30
Table G-4. Field Duplicate Comparison, RVAAP Load Line 1 Phase II RI 2000 (continued)
Analysis
LL11082/LL11145Groundwater
RPD
LL11097/LL11142Surface Water
RPD
LL11071/LL11140Surface Water
RPD Metals Aluminum * * * Antimony * * * Arsenic * * * Barium * * * Beryllium * * * Cadmium * * * Calcium 1 2 * Chromium * * 8 Cobalt * * * Copper * * * Iron * * * Lead * * * Magnesium * * * Manganese * * * Mercury * * * Nickel * * * Potassium * * * Selenium * * * Silver * * * Sodium * * * Thallium * * * Vanadium * * * Zinc * * * Cyanide na na na Volatile Organic Compounds all compounds * * * Semivolatile Organic Compounds all compounds * * * Explosive Compounds all compounds * * * except Hexavalent Chromium na na na Pesticide/PCB Compounds all compounds 8 * * * = At least one value is <5× the reporting level, and duplicate comparison is within 3× the reporting level. PCB = polychlorinated biphenyl. RPD = relative percent difference. UNAC = At least one value is <5× the reporting level, and duplicate comparison is NOT within 3× the reporting level.

01/069(doc)/121102 G-31
Field duplicate explosive comparisons were also considered good. Of 612 RPD observations for surface soils, subsurface soils, and sediments, one nitrocellulose RPD was at 89 and one was at 140. This resulted in more than 99 percent of the observations being <50 or having acceptable absolute differences. All VOC, SVOC, pesticide, and PCB duplicate observations were within 5 times the respective reporting levels and presented acceptable comparisons, with the exception of one PCB comparison, which provided an acceptable RPD of 25. All cyanide and hexavalent chromium comparisons were within 5 times the respective reporting levels and presented acceptable comparisons, with the exception of one hexachromium comparison that was unacceptable. Total organic carbon duplicate RPDs for sediment samples (25, 4, 55 and 14) are considered good.
Results for the few surface water duplicates and one groundwater duplicate collected were predominantly within 5× the respective reporting levels, and all comparisons are considered acceptable.
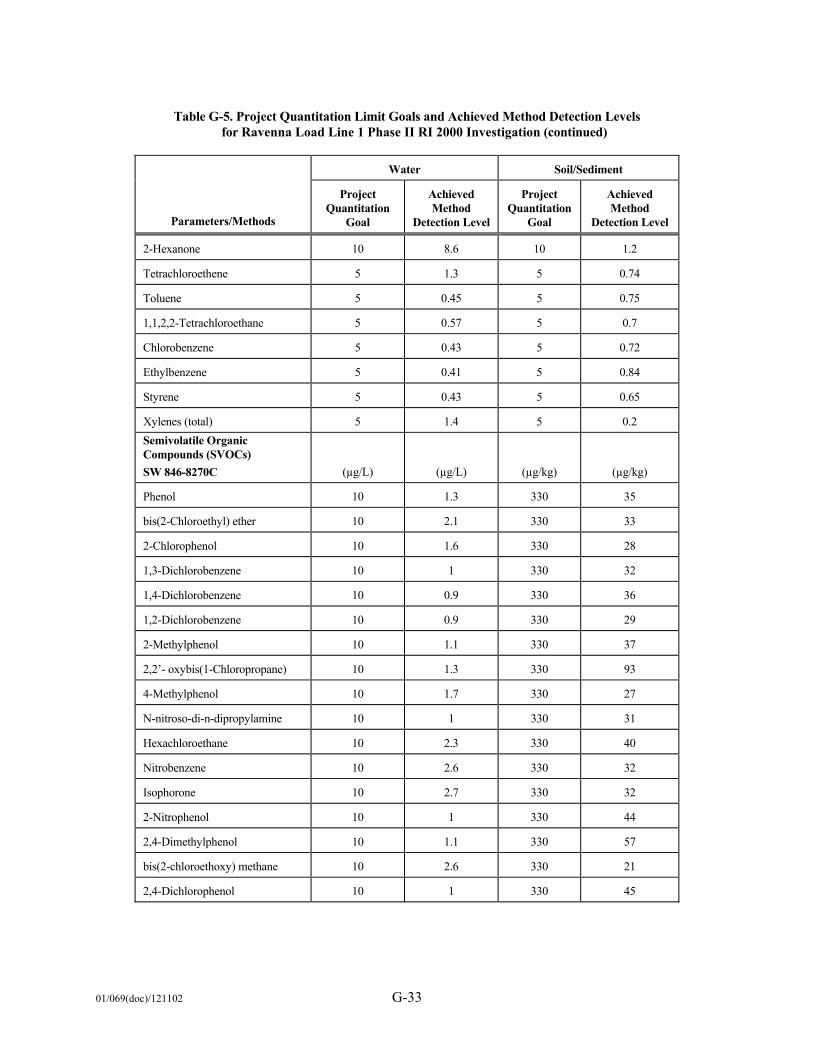
4.9 SENSITIVITY
Determination of minimum detectable values allows the investigation to assess the relative confidence that can be placed in a value relative to the magnitude or level of analyte concentration observed. The closer a measured value comes to the minimum detectable concentration, the less confidence and more variation the measurement will have. Project sensitivity goals were expressed as quantitation level goals in the QAPjP. These levels were achieved or exceeded throughout the analytical process, with the exception of thallium in water. Actual laboratory method detection levels achieved during this investigation are presented in Table G-5 with original practical quantitation level goals. Individual analyte reporting levels varied due to matrix differences and contaminant analyte concentrations. Reporting levels were elevated in soils and sediments due to inherent moisture content variability and results being reported in the standard dry weight format. However, there were larger elevations of reporting levels in several soil and sediment PCB, pesticide, and semivolatile results due to high levels of the PCB, Aroclor 1254. This caused solid sample reporting levels for other analytes to be elevated by factors of 10-50 times, as a result of required dilutions. High levels of 2,4,6-trinitrotoluene also caused explosive and semivolatile analyses to be diluted and reporting levels to be elevated in soils. Water determinations consistently met project reporting level goals. Reporting level variations have been considered during data interpretation and statistical applications.
Method blank determinations were performed with each analytical sample batch for each analyte under investigation. These blanks were evaluated during data validation to determine their potential impact on individual data points, if any. Validation action levels are set at 5× the reporting level for all analytes, except those designated as common laboratory contaminants (methylene chloride, acetone, toluene, 2-butanone, and phthalate compounds), with action levels set at 10× the reporting levels. During data validation, reported sample concentrations are assessed against method blank action levels, and the following qualifications are made when reportable quantities of analytes were observed in the associated method blank.
• When the analyte sample concentration is above the 5× or 10× action level, the data are not qualified, and they are considered a positive value. They will receive a validation reason code of “F01, F08.”
• When the analyte sample concentration is determined to be below the 5× or 10× action level but above the reporting level, the data are considered to be impacted by the method blank, and the value reported is qualified as a non-detect at the analyte value reported. These data are then qualified as “U” with a reason code of “F01, F07.”

01/069(doc)/121102 G-32
Table G-5. Project Quantitation Limit Goals and Achieved Method Detection Levels for Ravenna Load Line 1 Phase II RI 2000 Investigation
Water Soil/Sediment
Parameters/Methods
Project Quantitation
Goal
Achieved Method
Detection Level
Project Quantitation
Goal
Achieved Method
Detection Level
Volatile Organic Compounds (VOCs) SW 846-8260B (µg/L) (µg/L) (µg/kg) (µg/kg)
Chloromethane 10 1.1 10 0.73
Bromomethane 10 0.92 10 1.2
Vinyl chloride 10 0.58 10 0.66
Chloroethane 10 0.67 10 0.92
Methylene chloride 5 0.4 5 1.4
Acetone 10 5.9 10 1.8
Carbon disulfide 5 0.4 5 1.1
1,1-Dichloroethene 5 0.53 5 0.67
1,1-Dichloroethane 5 0.62 5 0.63
1,2-Dichloroethene (total) 5 0.87 5 0.96
Chloroform 5 0.51 5 0.71
1,2-Dichloroethane 5 0.43 5 0.57
2-Butanone 10 9.7 10 4.8
1,1,1-Trichloroethane 5 0.63 5 0.71
Carbon tetrachloride 5 0.41 5 0.62
Bromodichloromethane 5 0.39 5 0.65
1,2-Dichloropropane 5 0.32 5 0.65
cis-1,3-Dichloropropene 5 0.35 5 0.61
Trichloroethene 5 0.54 5 0.7
Dibromochloromethane 5 0.36 5 0.57
1,1,2-Trichloroethane 5 0.41 5 0.54
Benzene 5 0.45 5 0.63
trans-1,3-Dichloropropene 5 0.64 5 0.59
Tribromomethane 5 0.35 5 0.50
4-Methyl-2-pentanone 10 5.5 10 3.3
01/069(doc)/121102 G-33
Table G-5. Project Quantitation Limit Goals and Achieved Method Detection Levels
for Ravenna Load Line 1 Phase II RI 2000 Investigation (continued)
Water Soil/Sediment
Parameters/Methods
Project Quantitation
Goal
Achieved Method
Detection Level
Project Quantitation
Goal
Achieved Method
Detection Level
2-Hexanone 10 8.6 10 1.2
Tetrachloroethene 5 1.3 5 0.74
Toluene 5 0.45 5 0.75
1,1,2,2-Tetrachloroethane 5 0.57 5 0.7
Chlorobenzene 5 0.43 5 0.72
Ethylbenzene 5 0.41 5 0.84
Styrene 5 0.43 5 0.65
Xylenes (total) 5 1.4 5 0.2 Semivolatile Organic Compounds (SVOCs) SW 846-8270C (µg/L) (µg/L) (µg/kg) (µg/kg)
Phenol 10 1.3 330 35
bis(2-Chloroethyl) ether 10 2.1 330 33
2-Chlorophenol 10 1.6 330 28
1,3-Dichlorobenzene 10 1 330 32
1,4-Dichlorobenzene 10 0.9 330 36
1,2-Dichlorobenzene 10 0.9 330 29
2-Methylphenol 10 1.1 330 37
2,2’- oxybis(1-Chloropropane) 10 1.3 330 93
4-Methylphenol 10 1.7 330 27
N-nitroso-di-n-dipropylamine 10 1 330 31
Hexachloroethane 10 2.3 330 40
Nitrobenzene 10 2.6 330 32
Isophorone 10 2.7 330 32
2-Nitrophenol 10 1 330 44
2,4-Dimethylphenol 10 1.1 330 57
bis(2-chloroethoxy) methane 10 2.6 330 21
2,4-Dichlorophenol 10 1 330 45

01/069(doc)/121102 G-34
Table G-5. Project Quantitation Limit Goals and Achieved Method Detection Levels for Ravenna Load Line 1 Phase II RI 2000 Investigation (continued)
Water Soil/Sediment
Parameters/Methods
Project Quantitation
Goal
Achieved Method
Detection Level
Project Quantitation
Goal
Achieved Method
Detection Level
1,2,4-Trichlorobenzene 10 2.5 330 38
Naphthalene 10 0.7 330 35
4-Chloroaniline 10 2.8 330 33
Hexachlorobutadiene 10 1.2 330 31
4-chloro-3-methylphenol 10 1.2 330 31
2-Methylnaphthalene 10 0.9 330 33
Hexachlorocyclopentadiene 10 3.4 330 150
2,4,6-Trichlorophenol 10 1.3 330 57
2,4,5-Trichlorophenol 25 1.1 800 69
2-Chloronaphthalene 10 2.5 330 32
2-Nitroaniline 25 1.4 800 33
Dimethylphthalate 10 3.7 330 36
Acenaphthylene 10 2.7 330 35
2,6-Dinitrotoluene 10 2.8 330 30
3-Nitroaniline 25 2 800 33
Acenaphthene 10 2.7 330 35
2,4-Dinitrophenol 25 13 800 150
4-Nitrophenol 25 4.8 800 350
Dibenzofuran 10 2.8 330 36
2,4-Dinitrotoluene 10 0.8 330 41
Diethylphthalate 10 3.2 330 38
4-Chlorophenyl-phenyl ether 10 1.3 330 36
Fluorene 10 2.9 330 29
4-Nitroaniline 25 1.2 800 47
4,6-Dinitro-2-methylphenol 25 7.5 800 180
N-nitrosodiphenylamine 10 0.9 330 37
4-bromophenyl-phenylether 10 1 300 35
Hexachlorobenzene 10 1.8 330 41

01/069(doc)/121102 G-35
Table G-5. Project Quantitation Limit Goals and Achieved Method Detection Levels for Ravenna LL1 Phase II RI 2000 Investigation (continued)
Water Soil/Sediment
Parameters/Methods
Project Quantitation
Goal
Achieved Method
Detection Level
Project Quantitation
Goal
Achieved Method
Detection Level
Pentachlorophenol 25 0.6 800 34
Phenanthrene 10 2.4 330 43
Anthracene 10 0.9 330 37
Carbazole 10 1.1 330 42
Di-n-butylphthalate 10 1.1 330 59
Fluoranthene 10 0.9 330 38
Pyrene 10 1.4 330 57
Butylbenzylphthalate 10 1.9 330 44
3,3’-Dichlorobenzidine 10 1.1 330 140
Benzo(a)anthracene 10 2.8 330 35
Chrysene 10 0.9 330 50
bis(2-Ethylhexyl)phthalate 10 2.1 330 65
Di-n-octylphthalate 10 2 330 50
Benzo(b)fluoranthene 10 2.6 330 35
Benzo(k)fluoranthene 10 1.2 330 41
Benzo(a)pyrene 10 3 330 33
Indeno(1,2,3-cd)pyrene 10 1.2 330 42
Dibenzo(a,h)anthracene 10 1.2 330 38
Benzo(g,h,i)perylene 10 3.3 330 45
PCBs
SW 846-8082
(µg/L)
(µg/L)
(µg/kg)
(µg/kg)
Arochlor-1016 1.0 0.02 33 5.3
Arochlor-1221 2.0 0.09 67 19
Arochlor-1232 1.0 0.16 33 11
Arochlor-1242 1.0 0.3 33 18
Arochlor-1248 1.0 0.22 33 4.6
Arochlor-1254 1.0 0.10 33 20
Arochlor-1260 1.0 0.07 33 7.4

01/069(doc)/121102 G-36
Table G-5. Project Quantitation Limit Goals and Achieved Method Detection Levels for Ravenna LL1 Phase II RI 2000 Investigation (continued)
Water Soil/Sediment
Parameters/Methods
Project Quantitation
Goal
Achieved Method
Detection Level
Project Quantitation
Goal
Achieved Method
Detection Level
Explosive Compounds
SW 846-8330 (µg/L) (µg/L) (mg/kg) (mg/kg)
HMX Octahydro-1,3,5,7-tetranitro-1,3,5,7-tetrazocine
20 0.09 2 0.18
RDX (cyclonite) Hexahydro-1,3,5-trinitro-1,3,5-triazine
20 0.09 2 0.17
1,3,5-Trinitrobenzene 2 0.09 1 0.09
1,3-Dinitrobenzene 3 0.04 1 0.03
Tetryl 50 0.06 5 0.38
Nitrobenzene 10 0.06 1 0.05
2,4,6-Trinitrotoluene 3 0.05 1 0.05
2,4-Dinitrotoluene 0.1 0.05 1 0.05
2,6-Dinitrotoluene 0.1 0.09 1 0.09
4-Amino-2,6-dinitrotoluene 0.1 0.09 1 0.09
4-Amino-2,6-dinitrotoluene 0.1 0.09 1 0.09
o-Nitrotoluene 10 0.14 1 0.14
m-Nitrotoluene 10 0.14 1 0.14
p-Nitrotoluene 10 0.10 1 0.09
Additional Explosive Compounds:
Nitroglycerin 10 0.3 1 0.12
Nitroquanidine 10 0.96 1 0.023
Nitrocellulose 10 0.36 1 0.28
Metals (Target Analyte List) SW 846-6010B/6020 or 7000 (µg/L) (µg/L)
(mg/kg)
(mg/kg)
Aluminum 200 28 20 1.1
Antimony 5 2.2 0.5 0.49
Arsenic 5 4.1 0.5 0.3
Barium 200 3 20 0.13
Beryllium 4 0.54 0.5 0.046

01/069(doc)/121102 G-37
Table G-5. Project Quantitation Limit Goals and Achieved Method Detection Levels for Ravenna LL1 Phase II RI 2000 Investigation (continued)
Water Soil/Sediment
Parameters/Methods
Project Quantitation
Goal
Achieved Method
Detection Level
Project Quantitation
Goal
Achieved Method
Detection Level
Cadmium 5 0.28 0.5 0.04
Calcium 5000 250 500 37
Chromium 10 1.4 1 0.38
Cobalt 50 1.3 15 0.15
Copper 25 4.2 2.5 0.27
Iron 100 88 10 6.6
Lead 3 2.5 0.3 0.249
Magnesium 5000 30 500 12
Manganese 15 0.9 1.5 0.15
Mercury (CVAA)
SW 846-7470A/7471A
0.2 0.13 0.1 0.008
Nickel 40 2.2 4 0.27
Potassium 5000 41 500 5.1
Selenium 5 4.5 0.5 0.319
Silver 10 1.5 1 0.152
Sodium 5000 630 500 50
Thallium 2 5 0.5 0.5
Vanadium 50 0.82 5 0.13
Zinc 20 12 2 1.2

01/069(doc)/121102 G-38
• When the analyte sample concentration is determined to be below the 5× or 10× action level and
below the reporting level, the data are considered to be impacted by the method blank, and the value reported is qualified as a non-detect at the reporting level. These data are then qualified as “U” with a reason code of “F01, F06.”
No data was rejected as a result of method blank contamination; however, various analytes are qualified as non-detect “U”, according to the above validation reason codes.
Evaluation of overall project sensitivity can be gained through review of field blank information. These actual sample analyses may provide a comprehensive look at the combined sampling and analysis sensitivity attained by the project. Field QC blanks obtained during sampling activities at RVAAP included samples of VOC trip blank waters, one rinsate sample, and a site potable water source.
There was only a minor concentration of the VOC acetone detected in one project trip blank. The concentration observed for acetone was 16 µg/L compared to the reporting level of 10 µg/L. It is therefore determined that VOC analyses have not been affected through the transportation and storage process and that the procedures and precautions employed were effective in preserving the integrity of the sample analysis.
Field source water blank LL11152 (09/20/2000) and equipment rinsate LL11150 (09/20/2000) exhibited few analyte levels above project reporting levels. Those detected included minor levels of acetone and carbon disulfide in the equipment rinsate. The site source water blank exhibited normal levels of calcium, magnesium, potassium, and sodium, with minor concentrations of bromodichloromethane and chloroform. There is no indication that the source water or the equipment rinsate impacted associated sample levels.
4.10 REPRESENTATIVENESS AND COMPARABILITY
Representativeness expresses the degree to which data accurately reflect the analyte or parameter of interest for the environmental site and is the qualitative term most concerned with the proper design of the sampling program. Factors that affect the representativeness of analytical data include proper preservation, holding times, use of standard sampling and analytical methods, and determination of matrix or analyte interferences. Samples were delivered directly to the laboratory by courier, were received in good condition, and at appropriate temperature. A few organic analyses were conducted outside the holding time because samples were re-extracted and reanalyzed due to low surrogate recoveries. These data were qualified accordingly as outside of the holding time per EPA validation protocols. These instances occurred when initial extraction results required the laboratory to repeat semivolatile extractions for a sample beyond the standard holding time but within the direction and guidance of the analytical methodology. Sample preservation, analytical methodologies, and soil sampling methodologies were documented to be adequate and consistently applied. Estimated values that were qualified as being outside of the holding time were utilized with the requisite precautions in some of the report data interpretations. Use of these data might result in some additional uncertainty in specific interpretations where the values were incorporated, but they are not believed to have detracted from achieving the overall project data quality objectives.
Comparability, like representativeness, is a qualitative term relative to an individual project data set. These RVAAP AOC investigations employed appropriate sampling methodologies, site surveillance, use of standard sampling devices, uniform training, documentation of sampling, standard analytical protocols/procedures, QC checks with standard control limits, and universally accepted data reporting units to ensure comparability to other data sets. Through the proper implementation and documentation of these standard practices, the project has established the confidence that the data will be comparable to other project and programmatic information.

01/069(doc)/121102 G-39
Table G-6 presents the standardized parameter groups, analyzed analytical methods, sample containers, preservation techniques, and associated holding times.
4.11 COMPLETENESS
Usable data are defined as those data that pass individual scrutiny during the verification process and are accepted for unrestricted application to the human health risk assessment evaluation or equivalent type applications. It has been determined that estimated data are acceptable for RVAAP project objectives.
Objectives for the RVAAP Load Line 1 Phase II RI Investigation Work Plan have been achieved. The project produced valid results for more 99 percent of the sample analyses performed and successfully collected all the samples planned.

01/069(doc)/121102 G
-40
Table G-6. Container Requirements for Soil and Sediment Samples at Ravenna Army Ammunition Plant, Ravenna, Ohio
Analyte Group Container Minimum
Sample Size Preservative Holding Time Volatile Organic Compounds 5030/8260B
1 - 2 oz glass jar with Teflon®-lined cap (no headspace)
20 g Cool, 4 degrees C 14 d
Semivolatile Organic Compounds 3540/8270C
1 - 8 oz glass jar with Teflon®-lined cap
60 g Cool, 4 degrees C 14 d (extraction) 40 d (analysis)
Pesticide Compounds 3540/8081A
Include in SVOC container 60 g Cool, 4 degrees C 14 d (extraction) 40 d (analysis)
PCBs 3540/8082
Include in SVOC container 60 g Cool, 4 degrees C 14 d (extraction) 40 d (analysis)
Explosive Compounds 8330
1 - 4 oz glass jar with Teflon®-lined cap
60 g Cool, 4 degrees C 14 d (extraction) 40 d (analysis)
Propellant Compounds 8330, 353.2, and UV-HPLC
1 - 4 oz glass jar with Teflon®-lined cap
60 g Cool, 4 degrees C 14 d (extraction) 40 d (analysis)
Metals 6010B and 7471
1 - 4 oz glass jar with Teflon®-lined cap
50 g Cool, 4 degrees C 180 d; Hg @ 28 d
Cyanide 9012A
Include in metals container 25 g Cool, 4 degrees C 14 d
Hexavalent Chromium 7196A
Include in metals container 25 g Cool, 4 degrees C 24 hr

01/069(doc)/121102 G
-41
Table G-6 (cont.). Container Requirements for Water Samples at Ravenna Army Ammunition Plant, Ravenna, Ohio
Analyte Group Container Minimum
Sample Size Preservative Holding Time Volatile Organic Compounds 5030/8260B
3 -40 mL glass vials with Teflon®-lined septum (no headspace)
80 mL HCl to pH <2 Cool, 4 degrees C
14 d
Semivolatile Organic Compounds 3520/8270C
2 - 1L amber glass bottle with Teflon®-lined lid
1000 mL Cool, 4 degrees C 7 d (extraction) 40 d (analysis)
Pesticide Compounds 3520/8081A
1 - 1L amber glass bottle with Teflon®-lined lid
1000 mL Cool, 4 degrees C 7 d (extraction) 40 d (analysis)
PCBs 3520/8082
1 - 1L amber glass bottle with Teflon®-lined lid
1000 mL Cool, 4 degrees C 7 d (extraction) 40 d (analysis)
Explosive Compounds 8330
1 - 1L amber glass bottle with Teflon®-lined lid
1000 mL Cool, 4 degrees C 7 d (extraction) 40 d (analysis)
Propellant Compounds 8330, 353.2, and UV-HPLC
1 - 1L amber glass bottle with Teflon®-lined lid
1000 mL Cool, 4 degrees C 7 d (extraction) 40 d (analysis)
Metals 6010A and 7470
1 - 1L polybottle 500 mL HNO3 to pH <2 Cool, 4 degrees C
180 d; Hg @ 28 d
Cyanide 9012A
500 mL polybottle 500 mL NaOH to pH >12 Cool, 4 degrees C
14 d
Anions (Br, Cl, F, SO4) 300.0
250 mL polybottle 250 mL Cool, 4 degrees C 28 d
Nitrate-Nitrite 353.2
250 mL polybottle 100 mL H2SO4 to pH <2 Cool, 4 degrees C
28 d
TSS/TDS 160.2 and 160.1
500 mL polybottle 100 mL ea. Cool, 4 degrees C 28 d
PCB = polychlorinated biphenyl.. TDS = total dissolved solids. TSS = total suspended solids.

01/069(doc)/121102 G-42
THIS PAGE INTENTIONALLY LEFT BLANK

01/069(doc)/121102 G-43
5.0 DATA QUALITY ASSESSMENT SUMMARY
The overall quality of RVAAP Load Line 1 Phase II RI information meets or exceeds the established project objectives. Through proper implementation of the project data verification, reviews, and assessment process, project information has been determined to be acceptable for use, as qualified.
Data, as presented, have been qualified as usable, estimated “J,” or rejected “R.” Data that have been estimated provide indications of either accuracy, precision, or sensitivity being less than desired but adequate for interpretation. Data that are not acceptable for use have been rejected. Qualifiers have been applied to all data when necessary.
Data produced for this project demonstrate that they can withstand scientific scrutiny, are appropriate for its intended purpose, are technically defensible, and are of known and acceptable sensitivity, precision, and accuracy. Data integrity has been documented through proper implementation of QA and QC measures. The environmental information presented has an established confidence that allows utilization for the project objectives and provides data for future needs.

01/069(doc)/121102 G-44
THIS PAGE INTENTIONALLY LEFT BLANK

01/069(doc)/121102 G-45
ATTACHMENT
SAIC Data Validation Flagging Codes

01/069(doc)/121102 G-46
THIS PAGE INTENTIONALLY LEFT BLANK

01/069(doc)/121102 G-47
DATA VALIDATION REASON CODES
Organic, Inorganic, and Radiological Analytical Data
Holding Times A01 Extraction holding times were exceeded. A02 Extraction holding times were grossly exceeded. A03 Analysis holding times were exceeded. A04 Analysis holding times were grossly exceeded. A05 Samples were not preserved properly. A06 Professional judgment was used to qualify the data. GC/MS Tuning B01 Mass calibration was in error, even after applying expanded criteria. B02 Mass calibration was not performed every 12 hours. B03 Mass calibration did not meet ion abundance criteria. B04 Professional judgment was used to qualify the data. Initial/Continuing Calibration – Organics C01 Initial calibration RRF was < 0.05. C02 Initial calibration RDS was > 30 percent. C03 Initial calibration sequence was not followed as required. C04 Continuing calibration RRF was < 0.05. C05 Continuing calibration %D was > 25 percent. C06 Continuing calibration was not performed at the required frequency. C07 Resolution criteria were not met. C08 RPD criteria were not met. C09 RDS criteria were not met. C10 Retention time of compounds was outside windows. C11 Compounds were not adequately resolved. C12 Breakdown of endrin or DDT was > 30 percent. C13 Combined breakdown of endrin/DDT was > 30 percent. C14 Professional judgment was used to qualify the data. Initial/Continuing Calibration – Inorganics D01 ICV or CCV was not performed for every analyte. D02 ICV recovery was above the upper control limit. D03 ICV recovery was below the lower control limit. D04 CCV recovery was above the upper control limit. D05 CCV recovery was below the lower control limit. D06 Standard curve was not established with the minimum number of standards. D07 Instrument was not calibrated daily or each time the instrument was set up. D08 Correlation coefficient was <0.995.

01/069(doc)/121102 G-48
D09 Mid-range cyanide standard was not distilled. D10 Professional judgment was used to qualify the data. ICP and Furnace Requirements E01 Interference check sample recovery was outside the control limit. E02 Duplicate injections were outside the control limit. E03 Post-digestion spike recovery was outside the control limit. E04 MSA was required but not performed. E05 MSA correlation coefficient was <0.995. E06 MSA spikes were not at the correct concentration. E07 Serial dilution criteria were not met. E08 Professional judgment was used to qualify the data. Blanks F01 Sample data were qualified as a result of the method blank. F02 Sample data were qualified as a result of the field blank. F03 Sample data were qualified as a result of the equipment rinsate. F04 Sample data were qualified as a result of the trip blank. F05 Gross contamination exists. F06 Concentration of the contaminant was detected at a level below the CRQL. F07 Concentration of the contaminant was detected at a level less than the action limit but greater than
the CRQL. F08 Concentration of the contaminant was detected at a level that exceeds the action level. F09 No laboratory blanks were analyzed. F10 Blank had a negative value >2×s the IDL. F11 Blanks were not analyzed at required frequency. F12 Professional judgment was used to qualify the data. Surrogate/Radiological Chemical Recovery G01 Surrogate/radiological chemical recovery was above the upper control limit. G02 Surrogate/radiological chemical recovery was below the lower control limit. G03 Surrogate recovery was <10 percent. G04 Surrogate recovery was zero. G05 Surrogate/radiological chemical recovery data were not present. G06 Professional judgment was used to qualify the data. G07 Radiological chemical recovery was <20 percent. G08 Radiological chemical recovery was >150 percent. Matrix Spike/Matrix Spike Duplicate (MS/MSD) H01 MS/MSD recovery was above the upper control limit. H02 MS/MSD recovery was below the lower control limit. H03 MD/MSD recovery was <10 percent. H04 MS/MSD pairs exceed the RPD limit. H05 No action was taken on MS/MSD limit. H06 Professional judgment was used to qualify the data. H07 Radiological MS/MSD recovery was <20 percent.

01/069(doc)/121102 G-49
H08 Radiological MS/MSD recovery was >160 percent. H09 Radiological MS/MSD samples were not analyzed at the required frequency. Matrix Spike I01 MS recovery was above the upper control limit. I02 MS recovery was below the lower control limit. I03 MS recovery was <30 percent. I04 No action was taken on MS data. I05 Professional judgment was used to qualify the data. Laboratory Duplicate J01 Duplicate RPD/radiological duplicate error ratio (DER) was outside the control limit. J02 Duplicate sample results were >5× the CRDL. J03 Duplicate sample results were <5× the CRDL. J04 Professional judgment was used to qualify the data. J05 Duplicate was not analyzed at the required frequency. Internal Area Summary K01 Area counts were outside the control limits. K02 Extremely low area counts or performance was exhibited by a major drop off. K03 IS retention time varied by more than 30 seconds. K04 Professional judgment was used to qualify the data. Pesticide Cleanup Checks L01 10 percent recovery was obtained during either check. L02 Recoveries during either check were >120 percent. L03 GPC cleanup recoveries were outside the control limits. L04 Florisil cartridge cleanup recoveries were outside the control limits. L05 Professional judgment was used to qualify the data. Target Compound Identification M01 Incorrect identifications were made. M02 Qualitative criteria were not met. M03 Cross contamination occurred. M04 Confirmatory analysis was not performed. M05 No results were provided. M06 Analysis occurred outside 12-hour GC/MS window. M07 Professional judgment was used to qualify the data. M08 The %D between the two pesticide/PCB column checks was >25 percent. Compound Quantitation and Reported CRQLs N01 Quantitation limits were affected by large off-scale peaks. N02 MDLs reported by the laboratory exceeded corresponding CRQLs. N03 Professional judgment was used to qualify the data.

01/069(doc)/121102 G-50
Tentatively Identified Compounds (TICs) O01 Compound was suspected laboratory contaminant and was not detected in the blank. O02 TIC result was not above 10× the level found in the blank. O03 Professional judgment was used to qualify analytical data. Laboratory Control Samples (LCSs) P01 LCS recovery was above upper control limit. P02 LCS recovery was below lower control limit. P03 LCS recovery was <50 percent. P04 No action was taken on the LCS data. P05 LCS was not analyzed at required frequency. P06 Radiological LCS recovery was <50 percent for aqueous samples; <40 percent for solid samples. P07 Radiological LCS recovery was >150 percent for aqueous samples; >160 percent for solid
samples. P08 Professional judgment was used to qualify the data. Field Duplicate Q01 Field duplicate RPDs were >30 percent for waters and/or >50 percent for soils. Q02 Radiological field DER was outside the control limit. Q03 Duplicate sample results were >5× the CRDL. Q04 Duplicate sample results were <5× the CRDL. Radiological Calibration R01 Efficiency calibration criteria were not met. R02 Energy calibration criteria were not met. R03 Resolution calibration criteria were not met. R04 Background determination criteria were not met. R05 Quench curve criteria were not met. R06 Absorption curve criteria were not met. R07 Plateau curve criteria were not met. R08 Professional judgment was used to qualify the data. Radiological Calibration Verification S01 Efficiency verification criteria were not met. S02 Energy verification criteria were not met. S03 Resolution verification criteria were not met. S04 Background verification criteria were not met. S05 Cross-talk verification criteria were not met. S06 Professional judgment was used to qualify the data.

01/069(doc)/121102 G-51
THIS PAGE INTENTIONALLY LEFT BLANK