appendix g updated air quality assessment - alberta · 2016. 11. 16. · table g3.3-10 updated...
TRANSCRIPT
TOTAL Upgrader Supplemental InformationAppendix G: Updated Air Quality Assessment
TOTAL E&P Canada Ltd. November 2008
Appendix G Updated Air Quality Assessment
TOTAL Upgrader Supplemental Information Appendix G: Updated Air Quality Assessment
November 2008 TOTAL E&P Canada Ltd.
TOTAL Upgrader Supplemental InformationAppendix G: Updated Air Quality Assessment Table of Contents
TOTAL E&P Canada Ltd. November 2008 Page G-i
Table of Contents
G1 Introduction ................................................................................................................... G-1 G2 Methods .......................................................................................................................... G-1 G3 Updated Project Emissions .......................................................................................... G-1
G3.1 Project Fenceline ........................................................................................... G-1 G3.2 Plot Plan ........................................................................................................ G-1 G3.3 Stack Emissions ............................................................................................ G-3 G3.4 Tank Emissions ........................................................................................... G-17 G3.5 Process Area Emissions .............................................................................. G-25 G3.6 Comparison of EIA and Updated Project Emissions .................................. G-26 G3.7 Summary ..................................................................................................... G-29
G4 Results .......................................................................................................................... G-30 G4.1 Normal Stack Predictions ........................................................................... G-30 G4.2 Upset Stack Predictions .............................................................................. G-41
G5 Summary and Conclusions......................................................................................... G-53 G5.1 Summary ..................................................................................................... G-53 G5.2 Conclusions ................................................................................................. G-53
List of Tables
Table G3.3-1 Plant Fuel Gas Composition Associated with the EIA and Updated Project Cases ........................................................................................ G-7
Table G3.3-2 TOTAL Upgrader Stack Emission Sources ........................................................ G-7 Table G3.3-3 Updated Stack Parameters and Emissions – Stacks 1, 2, 46, 47 ......................... G-9 Table G3.3-4 Updated Stack Parameters and Emissions – Stacks 3, 4, 5, 6 ........................... G-10 Table G3.3-5 Updated Stack Parameters and Emissions – Stacks 11, 12, 13, 15, 16 ............. G-11 Table G3.3-6 Updated Stack Parameters and Emissions – Stacks 17, 18, 19 ......................... G-12 Table G3.3-7 Updated Stack Parameters and Emissions – Stacks 21, 22, 23, 24, 25 ............. G-13 Table G3.3-8 Updated Thermal Oxidizer Parameters and Emissions – Stack 20 ................... G-14 Table G3.3-9 Updated Flare Stack Parameters and Emissions – Normal: Stacks 45, 49,
50....................................................................................................................... G-15 Table G3.3-10 Updated Flare Stack Parameters and Emissions – Upset: Stacks 45, 49, 50 .... G-16 Table G3.4-1 TOTAL Upgrader Tank Emission Sources....................................................... G-17 Table G3.4-2 Updated Tank Parameters and Emissions – Diluted Bitumen Tanks ............... G-18 Table G3.4-3 Updated Tank Parameters and Emissions – Diluent Return and Treated
Naphtha Tanks .................................................................................................. G-19 Table G3.4-4 Updated Tank Parameters and Emissions – Treated Distillate and Gas Oil
Tanks ................................................................................................................. G-20 Table G3.4-5 Updated Tank Parameters and Emissions (Synthetic Crude Oil and Short
Resid Tanks) ..................................................................................................... G-21 Table G3.4-6 Updated Tank Parameters and Emissions (Untreated Naphtha, Distillate
and Gas Oil Tanks) ........................................................................................... G-22 Table G3.4-7 Updated Tank Parameters and Emissions – Untreated Distillate/Gas Oil
Swing and Slop Tanks ...................................................................................... G-23
TOTAL Upgrader Supplemental Information Table of Contents Appendix G: Updated Air Quality Assessment
November 2008 TOTAL E&P Canada Ltd.Page G-ii
Table G3.4-8 Updated Tank Parameters and Emissions – Mine Solvent Makeup, Diluent Return Tanks and Liquid Sulphur Storage ........................................................ G-24
Table G3.4-9 Updated Tank Parameters and Emissions – Sour Water Tank ......................... G-25 Table G3.6-1 EIA and Updated Project Case Emissions Comparison ................................... G-27 Table G3.7-1 Summary of Project Emission Changes ............................................................ G-29 Table G4.1-1 EIA and Updated Project Maximum Predicted SO2 and NOX
Concentrations Based on SCREEN3 Model ..................................................... G-31 Table G4.1-2 Maximum Predicted Values Inside Project Fenceline ...................................... G-33 Table G4.1-3 Maximum Predicted Values at Project Fenceline ............................................. G-34 Table G4.1-4 Maximum Predicted Values Outside Project Fenceline ................................... G-34 Table G4.1-5 Maximum Predicted Concentrations at Agricultural, Residential and
Industrial Receptors .......................................................................................... G-38 Table G4.1-6 Maximum Predicted Concentrations at Public Use Area, Monitoring
Station and Project Fenceline Receptors ........................................................... G-39 Table G4.2-1 Maximum Predicted SO2 Concentrations – Upset Flaring SCREEN3
Model ................................................................................................................ G-52 Table G4.2-2 Maximum Predicted 1-h SO2 Concentrations – Upset Flaring CALPUFF
Model ................................................................................................................ G-52
List of Figures
Figure G3.1-1 Fencelines Associated with the EIA and Updated Project Cases .................... G-2 Figure G3.2-1 Stack Locations Associated with the EIA and Updated Project Cases ............ G-4 Figure G3.2-2 Tank Locations Associated with the EIA and Updated Project Cases ............ G-5 Figure G3.2-3 Process Area Locations Associated with the EIA and Updated
Project Cases .................................................................................................... G-6 Figure G4.1-1 Comparison of EIA and Updated Project Case 1-h SO2 Concentrations ....... G-42 Figure G4.1-2 Comparison of EIA and Updated Project Case 24-h SO2 Concentrations ..... G-43 Figure G4.1-3 Comparison of EIA and Updated Project Case Annual SO2
Concentrations ............................................................................................... G-44 Figure G4.1-4 Comparison of EIA and Updated Project Case 1-h NO2 Concentrations ...... G-45 Figure G4.1-5 Comparison of EIA and Updated Project Case 24-h NO2 Concentrations .... G-46 Figure G4.1-6 Comparison of EIA and Updated Project Case Annual NO2
Concentrations ............................................................................................... G-47 Figure G4.1-7 Comparison of EIA and Updated Project Case 24-h PM2.5
Concentrations ............................................................................................... G-48 Figure G4.1-8 Comparison of EIA and Updated Project Case 1-h CO Concentrations ....... G-49 Figure G4.1-9 Comparison of EIA and Updated Project Case 8-h CO Concentrations ....... G-50 Figure G4.1-10 Comparison of EIA and Updated Project Case Annual Potential Acid
Input Concentrations ...................................................................................... G-51
TOTAL Upgrader Supplemental InformationAppendix G: Updated Air Quality Assessment
TOTAL E&P Canada Ltd. November 2008 Page G-iii
Abbreviations
AAAQO ............................................................... Alberta Ambient Air Quality Objectives ASL .............................................................................................................. above sea level C2- ............................................................................................................. ethane and lighter C3 .............................................................................................................................. propane CO ............................................................................................................. carbon monoxide CO2 ................................................................................................................ carbon dioxide COS .......................................................................................................... carbonyl sulphide CRT ................................................................................................................ cone roof tank CS2 ............................................................................................................ carbon disulphide DHT .................................................................................................... distillate hydrotreater DRU .................................................................................................... diluent recovery unit EIA .................................................................................. environmental impact assessment H2 ............................................................................................................................ hydrogen H2O ............................................................................................................................... water H2S .......................................................................................................... hydrogen sulphide HDT Rx ............................................................................................... hydrotreating reactor HHRA .................................................................................... human health risk assessment HHV ........................................................................................................ high heating value IFRT ............................................................................................. internal floating roof tank LHV .......................................................................................................... low heating value MHC ........................................................................................................ mild hydrocracker N2 ............................................................................................................................. nitrogen N2O ................................................................................................................... nitrous oxide NO2 ............................................................................................................. nitrogen dioxide NH3 .......................................................................................................................... methane NOX .......................................................................................................... oxides of nitrogen PAH .................................................................................. polycyclic aromatic hydrocarbon PAI ......................................................................................................... potential acid input PDA .............................................................................................. project development area PM ............................................................................................................. particulate matter PM2.5 ..................................................................... particulate matter 2.5 microns (µ) in size RSH ...................................................................................................................... mercaptan S ................................................................................................................................. sulphur Shell .................................................................................................... Shell Canada Limited SIR ................................................................................... supplemental information request SO2 ............................................................................................................... sulphur dioxide t/a .................................................................................................... tonnes per annum (year) t/d ................................................................................................................... tonnes per day TRS ...................................................................................................... total reduced sulphur VDU ................................................................................................ vacuum distillation unit VOC ........................................................................................... volatile organic compound VRU .................................................................................................... vapour recovery unit VTB .................................................................................................. vacuum tower bottoms UTM NAD ................................... Universal Transverse Mercator North American Datum
TOTAL Upgrader Supplemental Information Appendix G: Updated Air Quality Assessment
November 2008 TOTAL E&P Canada Ltd.Page G-iv
TOTAL Upgrader Supplemental InformationAppendix G: Updated Air Quality Assessment
TOTAL E&P Canada Ltd. November 2008 Page G-1
G1 Introduction This appendix provides supporting information for the response to SIR 20.
In this appendix, the Updated Project Case air quality predictions are compared with the environmental impact assessment (EIA) Project Case predictions in the Integrated Application, Volume 2, Section 3, Appendix 3D. More specifically, the goals of this updated air quality assessment are:
• to summarize the design changes (see Section G3)
• to compare air quality changes associated with those presented in the Project Case in the EIA with the Updated Project Case (see Section G4)
The requirement for a full reassessment of the Base Case, Application Case and Planned Development Case is determined based on comparison of the EIA Project Case with the Updated Project Case, i.e., incremental change.
G2 Methods Methods used to estimate air quality changes due to updated design were identical to those described in the Integrated Application, Volume 2, Section 3.4.
G3 Updated Project Emissions Updated design information that can influence the ambient air predictions in the EIA includes changes to the following:
• project fenceline (i.e., project development area [PDA] boundary) • plot plan • stack emissions • tank emissions • process area emissions
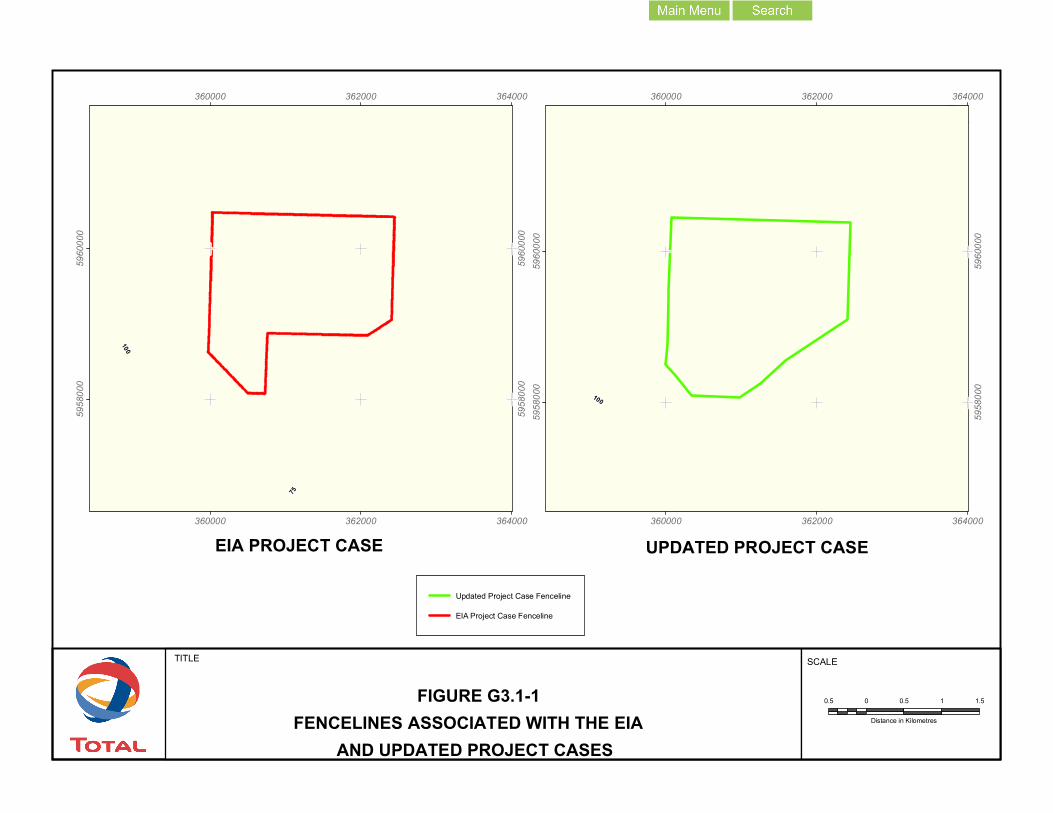
G3.1 Project Fenceline The EIA provided maximum concentration predictions within and outside the project fenceline (PDA boundary), for which the Alberta Ambient Air Quality Objectives (AAAQO) are applicable. A change in the location of the fenceline can change the corresponding concentration predictions. For a comparison of the EIA fenceline with the updated fenceline, see Figure G3.1-1. The main change is along the southern boundary.
G3.2 Plot Plan Ambient concentration predictions depend on the distance between the emission source and the receptor, and for multiple emission sources, on the orientation of emission sources relative to wind direction. These factors influence ambient concentrations more strongly in the near field (i.e., within 5 km).
The CALMET model was applied using 1-km grid cell spacing, and meteorological parameters for adjacent cells can change slightly. On this basis, moving a stack from one CALMET grid cell to another can change the trajectory of a plume and this can influence ambient concentrations at more distant locations.
TITLE
FIGURE G3.1-1
75
100
360000
360000
362000
362000
364000
364000
5958
000
5958
000
5960
000
5960
000
0.5 0 0.5 1 1.5
Distance in KilometresFENCELINES ASSOCIATED WITH THE EIA AND UPDATED PROJECT CASES
SCALE
Updated Project Case Fenceline
EIA Project Case Fenceline
100
360000
360000
362000
362000
364000
36400059
5800
0
5958
000
5960
000
5960
000
EIA PROJECT CASE UPDATED PROJECT CASE
TOTAL Upgrader Supplemental InformationAppendix G: Updated Air Quality Assessment
TOTAL E&P Canada Ltd. November 2008 Page G-3
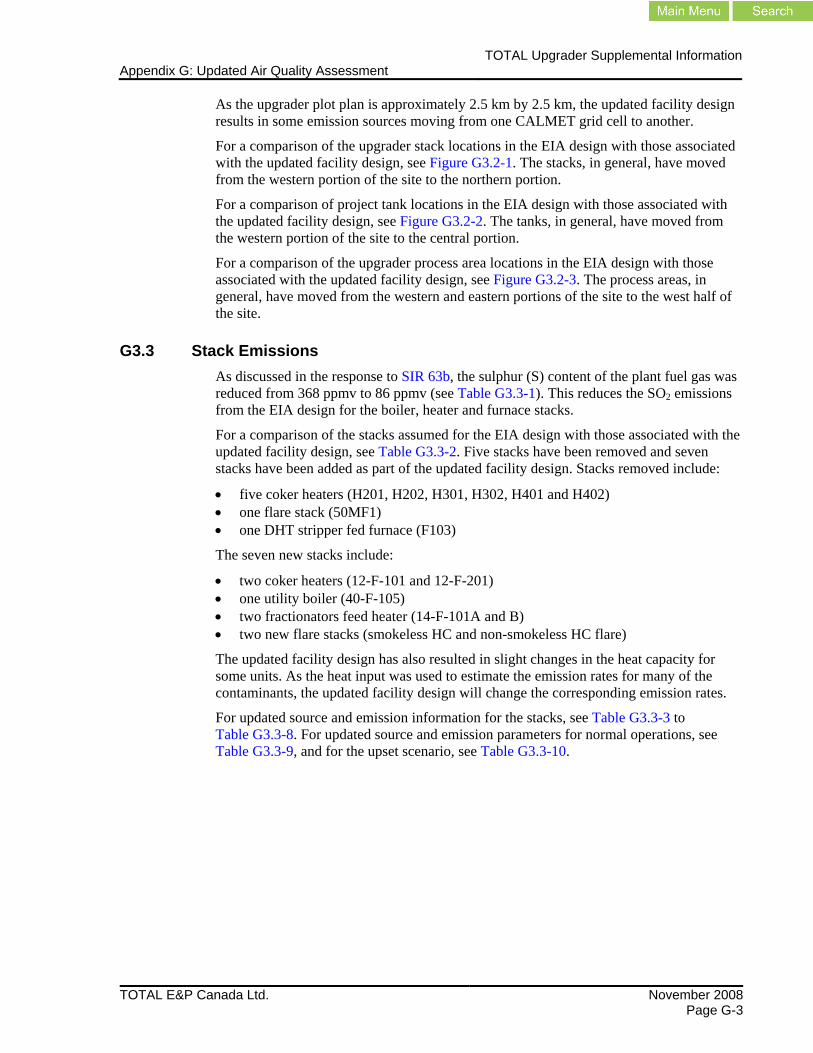
As the upgrader plot plan is approximately 2.5 km by 2.5 km, the updated facility design results in some emission sources moving from one CALMET grid cell to another.
For a comparison of the upgrader stack locations in the EIA design with those associated with the updated facility design, see Figure G3.2-1. The stacks, in general, have moved from the western portion of the site to the northern portion.
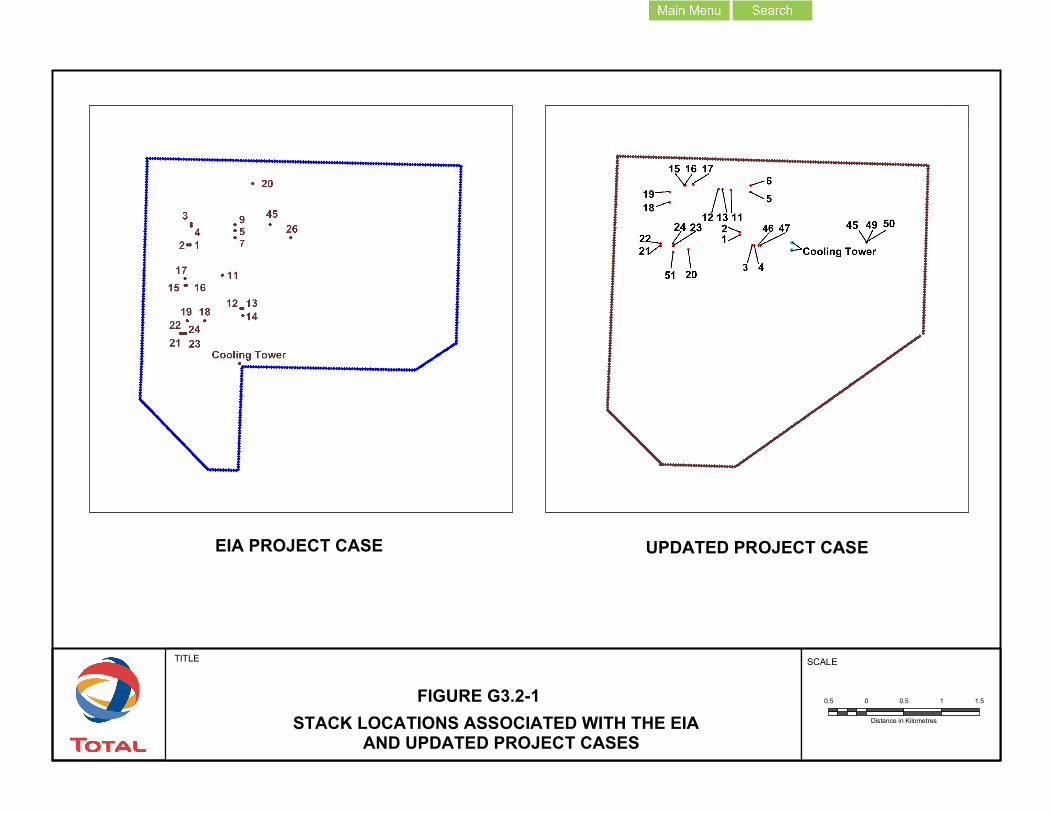
For a comparison of project tank locations in the EIA design with those associated with the updated facility design, see Figure G3.2-2. The tanks, in general, have moved from the western portion of the site to the central portion.
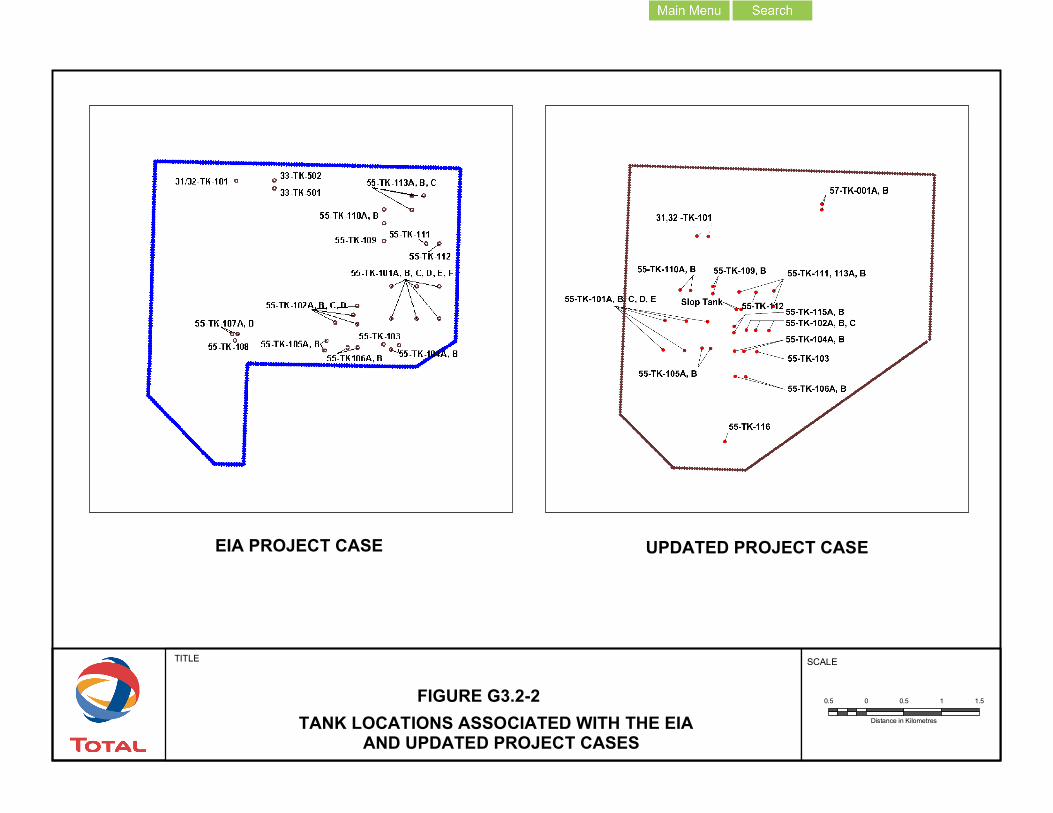
For a comparison of the upgrader process area locations in the EIA design with those associated with the updated facility design, see Figure G3.2-3. The process areas, in general, have moved from the western and eastern portions of the site to the west half of the site.
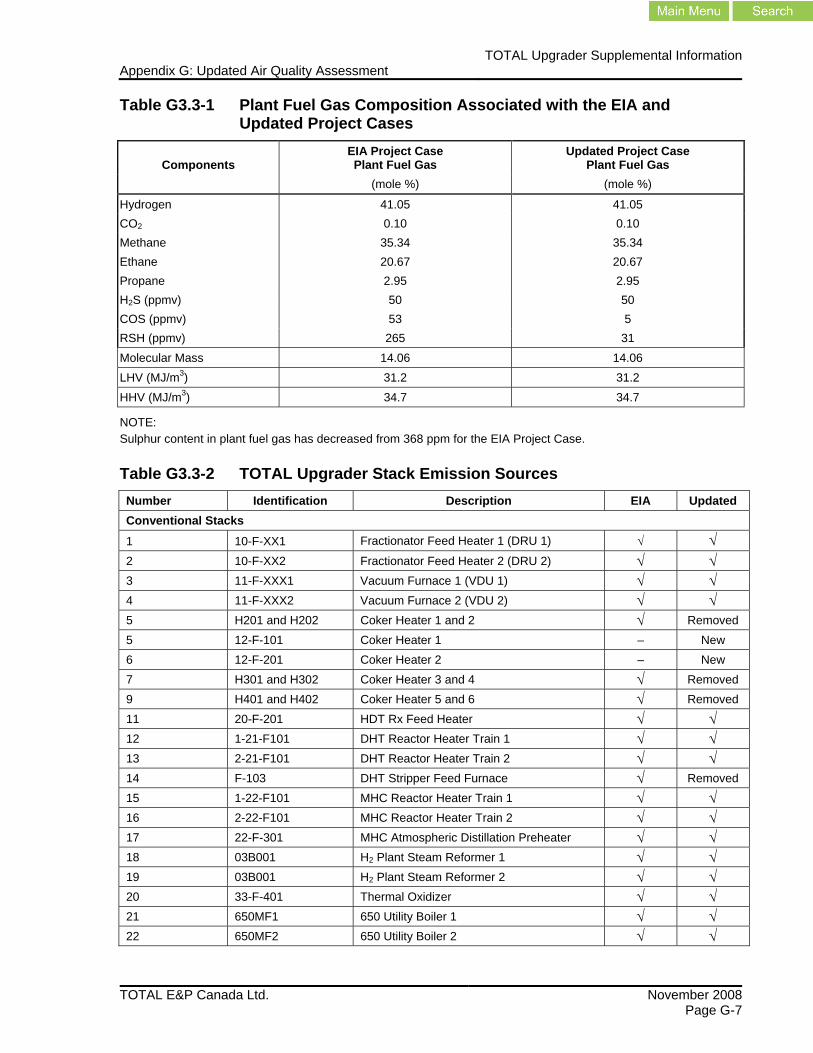
G3.3 Stack Emissions As discussed in the response to SIR 63b, the sulphur (S) content of the plant fuel gas was reduced from 368 ppmv to 86 ppmv (see Table G3.3-1). This reduces the SO2 emissions from the EIA design for the boiler, heater and furnace stacks.
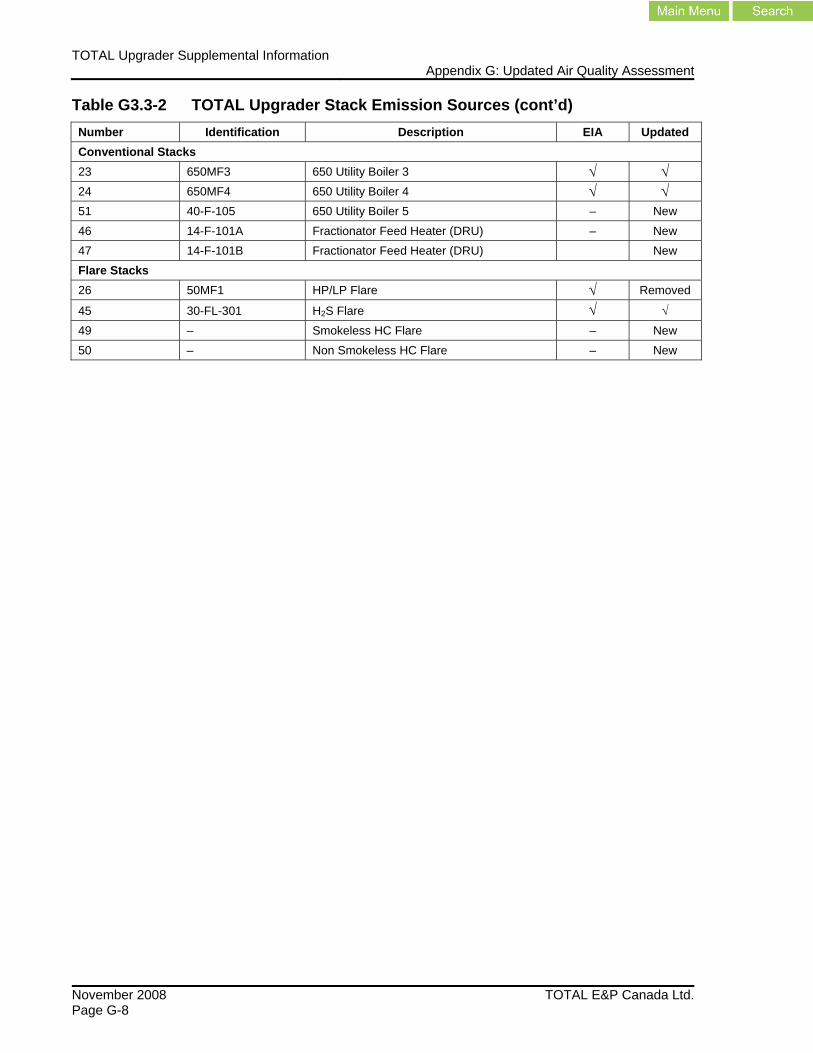
For a comparison of the stacks assumed for the EIA design with those associated with the updated facility design, see Table G3.3-2. Five stacks have been removed and seven stacks have been added as part of the updated facility design. Stacks removed include:
• five coker heaters (H201, H202, H301, H302, H401 and H402) • one flare stack (50MF1) • one DHT stripper fed furnace (F103)
The seven new stacks include:
• two coker heaters (12-F-101 and 12-F-201) • one utility boiler (40-F-105) • two fractionators feed heater (14-F-101A and B) • two new flare stacks (smokeless HC and non-smokeless HC flare)
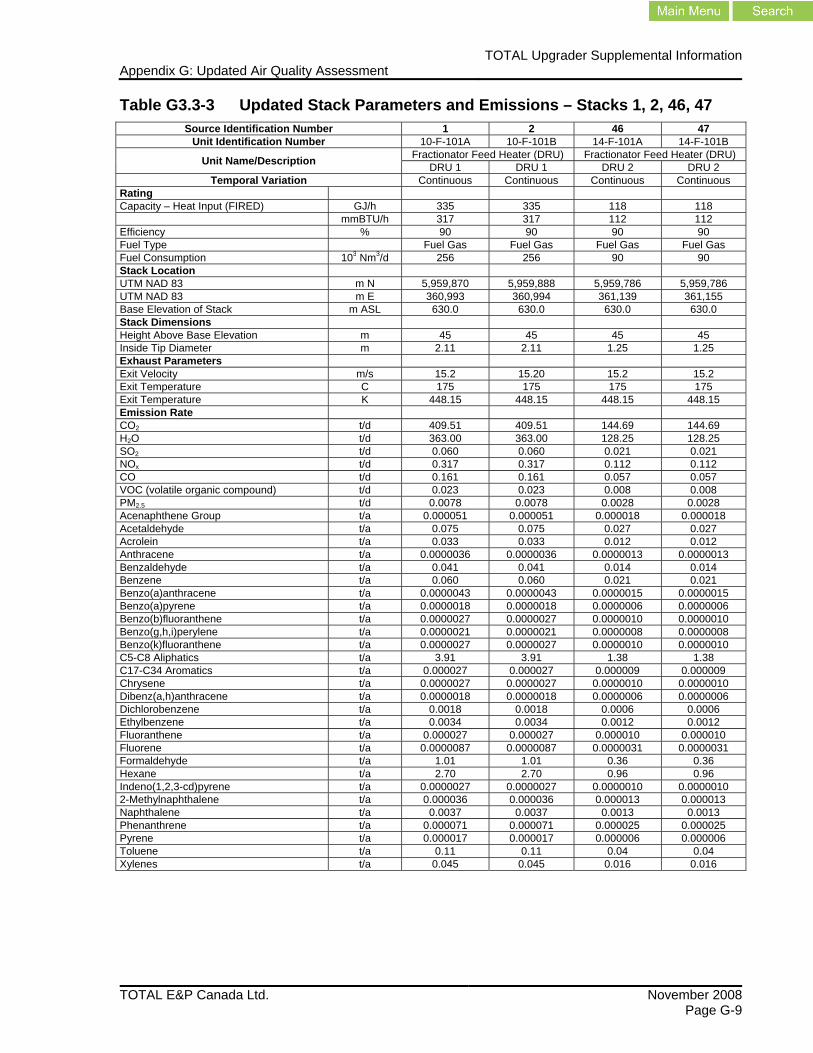
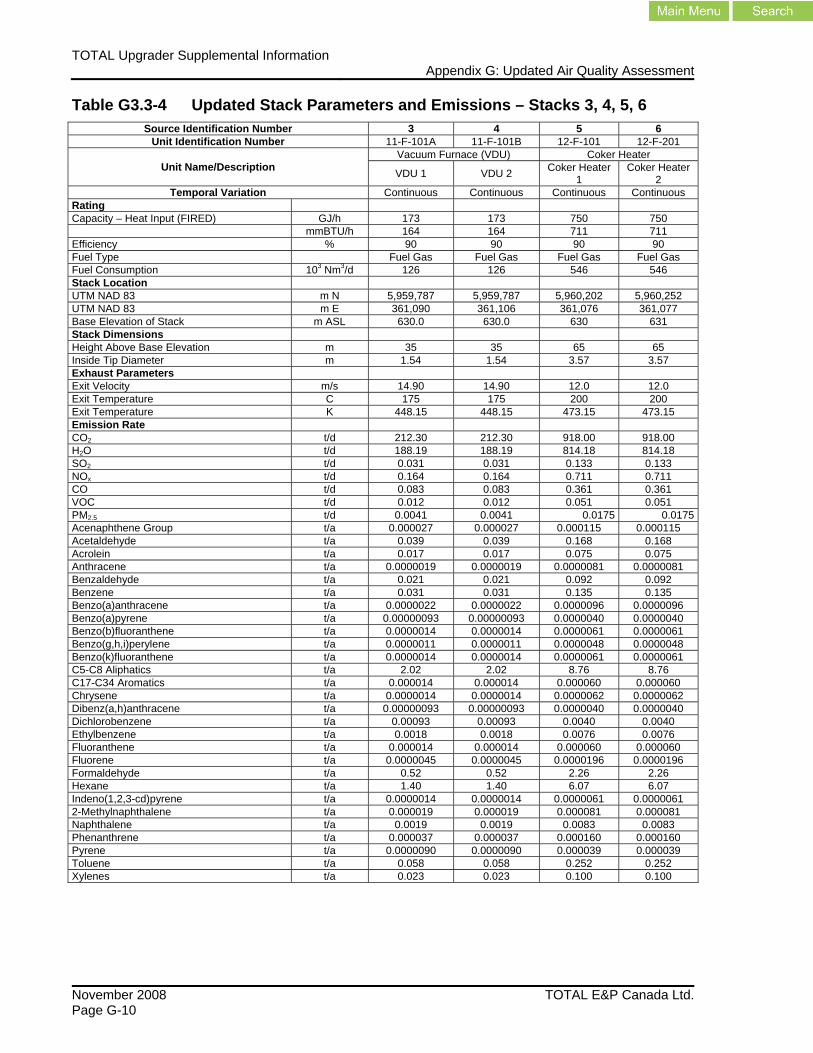
The updated facility design has also resulted in slight changes in the heat capacity for some units. As the heat input was used to estimate the emission rates for many of the contaminants, the updated facility design will change the corresponding emission rates.
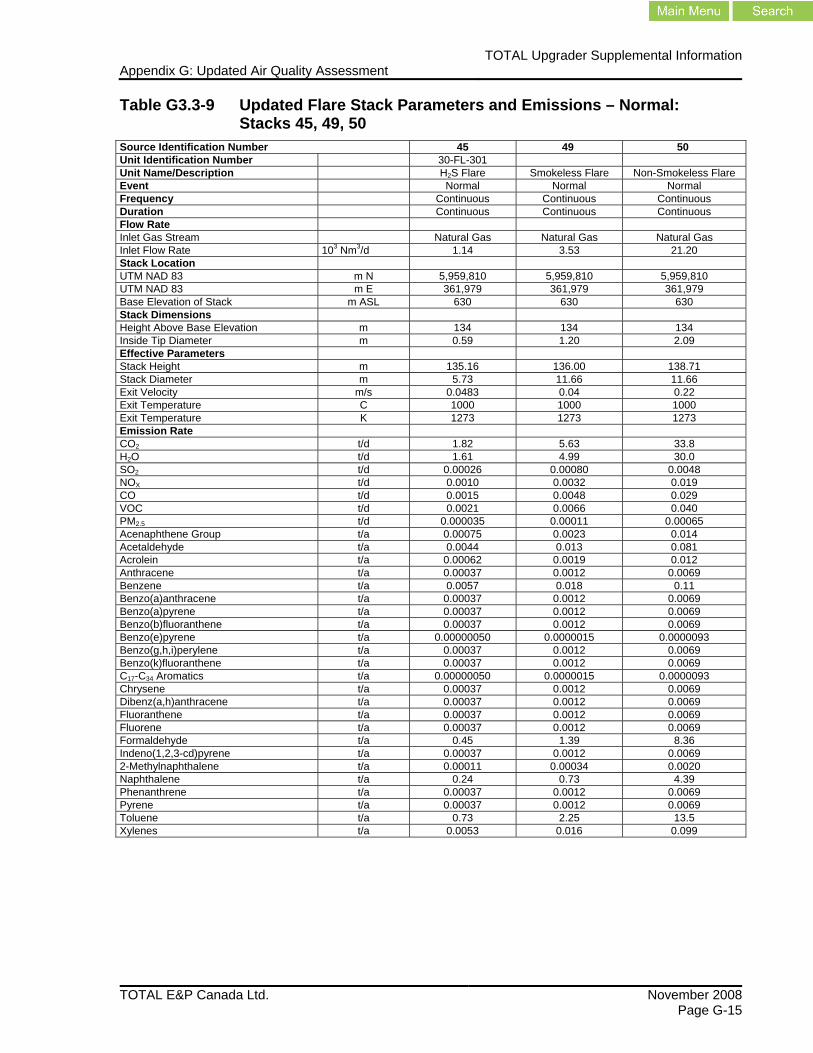
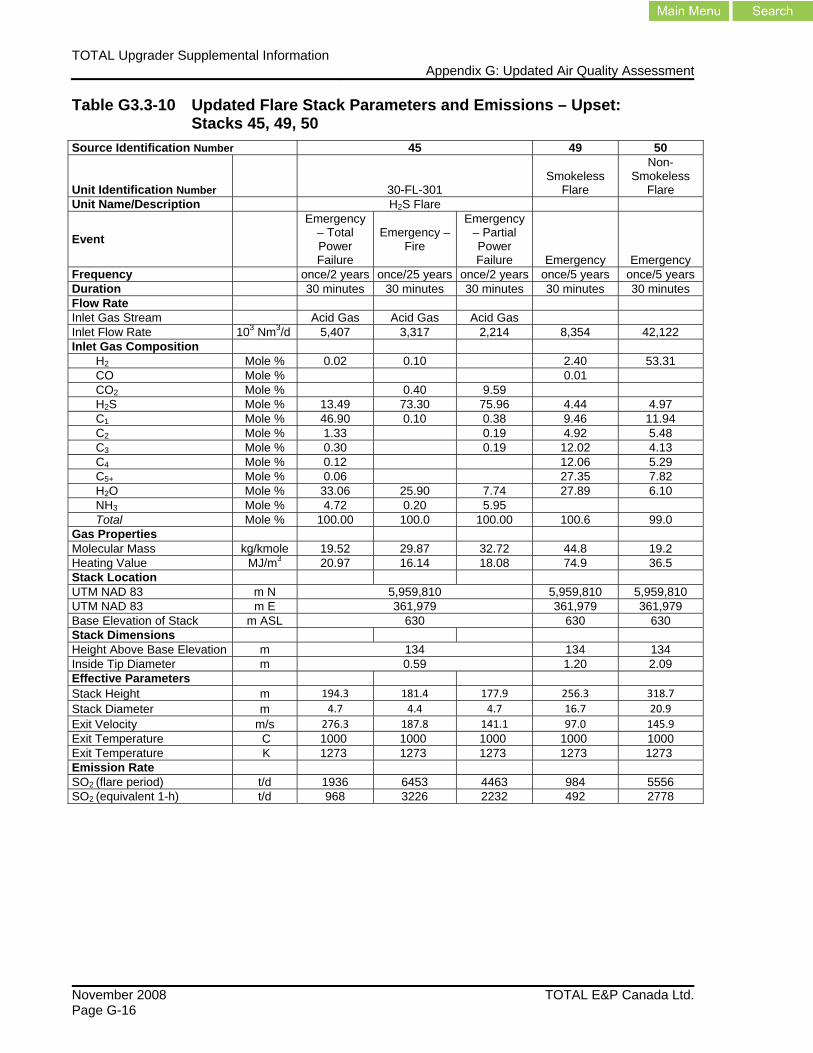
For updated source and emission information for the stacks, see Table G3.3-3 to Table G3.3-8. For updated source and emission parameters for normal operations, see Table G3.3-9, and for the upset scenario, see Table G3.3-10.
TITLE
FIGURE G3.2-1 0.5 0 0.5 1 1.5
Distance in KilometresSTACK LOCATIONS ASSOCIATED WITH THE EIAAND UPDATED PROJECT CASES
SCALE
100
EIA PROJECT CASE UPDATED PROJECT CASE
TITLE
FIGURE G3.2-2 0.5 0 0.5 1 1.5
Distance in KilometresTANK LOCATIONS ASSOCIATED WITH THE EIAAND UPDATED PROJECT CASES
SCALE
100
EIA PROJECT CASE UPDATED PROJECT CASE
TITLE
FIGURE G3.2-3 0.5 0 0.5 1 1.5
Distance in KilometresPROCESS AREA LOCATIONS ASSOCIATED WITH THE EIAAND UPDATED PROJECT CASES
SCALE
100
EIA PROJECT CASE UPDATED PROJECT CASE
TOTAL Upgrader Supplemental InformationAppendix G: Updated Air Quality Assessment
TOTAL E&P Canada Ltd. November 2008 Page G-7
Table G3.3-1 Plant Fuel Gas Composition Associated with the EIA and Updated Project Cases
Components EIA Project Case Plant Fuel Gas
Updated Project Case Plant Fuel Gas
(mole %) (mole %)
Hydrogen 41.05 41.05 CO2 0.10 0.10 Methane 35.34 35.34 Ethane 20.67 20.67 Propane 2.95 2.95 H2S (ppmv) 50 50 COS (ppmv) 53 5 RSH (ppmv) 265 31 Molecular Mass 14.06 14.06 LHV (MJ/m3) 31.2 31.2 HHV (MJ/m3) 34.7 34.7
NOTE: Sulphur content in plant fuel gas has decreased from 368 ppm for the EIA Project Case.
Table G3.3-2 TOTAL Upgrader Stack Emission Sources Number Identification Description EIA Updated Conventional Stacks 1 10-F-XX1 Fractionator Feed Heater 1 (DRU 1) √ √ 2 10-F-XX2 Fractionator Feed Heater 2 (DRU 2) √ √ 3 11-F-XXX1 Vacuum Furnace 1 (VDU 1) √ √ 4 11-F-XXX2 Vacuum Furnace 2 (VDU 2) √ √ 5 H201 and H202 Coker Heater 1 and 2 √ Removed 5 12-F-101 Coker Heater 1 – New 6 12-F-201 Coker Heater 2 – New 7 H301 and H302 Coker Heater 3 and 4 √ Removed 9 H401 and H402 Coker Heater 5 and 6 √ Removed 11 20-F-201 HDT Rx Feed Heater √ √ 12 1-21-F101 DHT Reactor Heater Train 1 √ √ 13 2-21-F101 DHT Reactor Heater Train 2 √ √ 14 F-103 DHT Stripper Feed Furnace √ Removed 15 1-22-F101 MHC Reactor Heater Train 1 √ √ 16 2-22-F101 MHC Reactor Heater Train 2 √ √ 17 22-F-301 MHC Atmospheric Distillation Preheater √ √ 18 03B001 H2 Plant Steam Reformer 1 √ √ 19 03B001 H2 Plant Steam Reformer 2 √ √ 20 33-F-401 Thermal Oxidizer √ √ 21 650MF1 650 Utility Boiler 1 √ √ 22 650MF2 650 Utility Boiler 2 √ √
TOTAL Upgrader Supplemental Information Appendix G: Updated Air Quality Assessment
November 2008 TOTAL E&P Canada Ltd.Page G-8
Table G3.3-2 TOTAL Upgrader Stack Emission Sources (cont’d) Number Identification Description EIA Updated Conventional Stacks 23 650MF3 650 Utility Boiler 3 √ √ 24 650MF4 650 Utility Boiler 4 √ √ 51 40-F-105 650 Utility Boiler 5 – New 46 14-F-101A Fractionator Feed Heater (DRU) – New 47 14-F-101B Fractionator Feed Heater (DRU) New Flare Stacks 26 50MF1 HP/LP Flare √ Removed
45 30-FL-301 H2S Flare √ √ 49 – Smokeless HC Flare – New 50 – Non Smokeless HC Flare – New
TOTAL Upgrader Supplemental InformationAppendix G: Updated Air Quality Assessment
TOTAL E&P Canada Ltd. November 2008 Page G-9
Table G3.3-3 Updated Stack Parameters and Emissions – Stacks 1, 2, 46, 47 Source Identification Number 1 2 46 47
Unit Identification Number 10-F-101A 10-F-101B 14-F-101A 14-F-101B
Unit Name/Description Fractionator Feed Heater (DRU) Fractionator Feed Heater (DRU) DRU 1 DRU 1 DRU 2 DRU 2
Temporal Variation Continuous Continuous Continuous Continuous Rating Capacity – Heat Input (FIRED) GJ/h 335 335 118 118 mmBTU/h 317 317 112 112 Efficiency % 90 90 90 90 Fuel Type Fuel Gas Fuel Gas Fuel Gas Fuel Gas Fuel Consumption 103 Nm3/d 256 256 90 90 Stack Location UTM NAD 83 m N 5,959,870 5,959,888 5,959,786 5,959,786 UTM NAD 83 m E 360,993 360,994 361,139 361,155 Base Elevation of Stack m ASL 630.0 630.0 630.0 630.0 Stack Dimensions Height Above Base Elevation m 45 45 45 45 Inside Tip Diameter m 2.11 2.11 1.25 1.25 Exhaust Parameters Exit Velocity m/s 15.2 15.20 15.2 15.2 Exit Temperature C 175 175 175 175 Exit Temperature K 448.15 448.15 448.15 448.15 Emission Rate CO2 t/d 409.51 409.51 144.69 144.69 H2O t/d 363.00 363.00 128.25 128.25 SO2 t/d 0.060 0.060 0.021 0.021 NOx t/d 0.317 0.317 0.112 0.112 CO t/d 0.161 0.161 0.057 0.057 VOC (volatile organic compound) t/d 0.023 0.023 0.008 0.008 PM2.5 t/d 0.0078 0.0078 0.0028 0.0028 Acenaphthene Group t/a 0.000051 0.000051 0.000018 0.000018 Acetaldehyde t/a 0.075 0.075 0.027 0.027 Acrolein t/a 0.033 0.033 0.012 0.012 Anthracene t/a 0.0000036 0.0000036 0.0000013 0.0000013 Benzaldehyde t/a 0.041 0.041 0.014 0.014 Benzene t/a 0.060 0.060 0.021 0.021 Benzo(a)anthracene t/a 0.0000043 0.0000043 0.0000015 0.0000015 Benzo(a)pyrene t/a 0.0000018 0.0000018 0.0000006 0.0000006 Benzo(b)fluoranthene t/a 0.0000027 0.0000027 0.0000010 0.0000010 Benzo(g,h,i)perylene t/a 0.0000021 0.0000021 0.0000008 0.0000008 Benzo(k)fluoranthene t/a 0.0000027 0.0000027 0.0000010 0.0000010 C5-C8 Aliphatics t/a 3.91 3.91 1.38 1.38 C17-C34 Aromatics t/a 0.000027 0.000027 0.000009 0.000009 Chrysene t/a 0.0000027 0.0000027 0.0000010 0.0000010 Dibenz(a,h)anthracene t/a 0.0000018 0.0000018 0.0000006 0.0000006 Dichlorobenzene t/a 0.0018 0.0018 0.0006 0.0006 Ethylbenzene t/a 0.0034 0.0034 0.0012 0.0012 Fluoranthene t/a 0.000027 0.000027 0.000010 0.000010 Fluorene t/a 0.0000087 0.0000087 0.0000031 0.0000031 Formaldehyde t/a 1.01 1.01 0.36 0.36 Hexane t/a 2.70 2.70 0.96 0.96 Indeno(1,2,3-cd)pyrene t/a 0.0000027 0.0000027 0.0000010 0.0000010 2-Methylnaphthalene t/a 0.000036 0.000036 0.000013 0.000013 Naphthalene t/a 0.0037 0.0037 0.0013 0.0013 Phenanthrene t/a 0.000071 0.000071 0.000025 0.000025 Pyrene t/a 0.000017 0.000017 0.000006 0.000006 Toluene t/a 0.11 0.11 0.04 0.04 Xylenes t/a 0.045 0.045 0.016 0.016
TOTAL Upgrader Supplemental Information Appendix G: Updated Air Quality Assessment
November 2008 TOTAL E&P Canada Ltd.Page G-10
Table G3.3-4 Updated Stack Parameters and Emissions – Stacks 3, 4, 5, 6 Source Identification Number 3 4 5 6
Unit Identification Number 11-F-101A 11-F-101B 12-F-101 12-F-201
Unit Name/Description Vacuum Furnace (VDU) Coker Heater
VDU 1 VDU 2 Coker Heater 1
Coker Heater 2
Temporal Variation Continuous Continuous Continuous Continuous Rating Capacity – Heat Input (FIRED) GJ/h 173 173 750 750 mmBTU/h 164 164 711 711 Efficiency % 90 90 90 90 Fuel Type Fuel Gas Fuel Gas Fuel Gas Fuel Gas Fuel Consumption 103 Nm3/d 126 126 546 546 Stack Location UTM NAD 83 m N 5,959,787 5,959,787 5,960,202 5,960,252 UTM NAD 83 m E 361,090 361,106 361,076 361,077 Base Elevation of Stack m ASL 630.0 630.0 630 631 Stack Dimensions Height Above Base Elevation m 35 35 65 65 Inside Tip Diameter m 1.54 1.54 3.57 3.57 Exhaust Parameters Exit Velocity m/s 14.90 14.90 12.0 12.0 Exit Temperature C 175 175 200 200 Exit Temperature K 448.15 448.15 473.15 473.15 Emission Rate CO2 t/d 212.30 212.30 918.00 918.00 H2O t/d 188.19 188.19 814.18 814.18 SO2 t/d 0.031 0.031 0.133 0.133 NOx t/d 0.164 0.164 0.711 0.711 CO t/d 0.083 0.083 0.361 0.361 VOC t/d 0.012 0.012 0.051 0.051 PM2.5 t/d 0.0041 0.0041 0.0175 0.0175Acenaphthene Group t/a 0.000027 0.000027 0.000115 0.000115 Acetaldehyde t/a 0.039 0.039 0.168 0.168 Acrolein t/a 0.017 0.017 0.075 0.075 Anthracene t/a 0.0000019 0.0000019 0.0000081 0.0000081 Benzaldehyde t/a 0.021 0.021 0.092 0.092 Benzene t/a 0.031 0.031 0.135 0.135 Benzo(a)anthracene t/a 0.0000022 0.0000022 0.0000096 0.0000096 Benzo(a)pyrene t/a 0.00000093 0.00000093 0.0000040 0.0000040 Benzo(b)fluoranthene t/a 0.0000014 0.0000014 0.0000061 0.0000061 Benzo(g,h,i)perylene t/a 0.0000011 0.0000011 0.0000048 0.0000048 Benzo(k)fluoranthene t/a 0.0000014 0.0000014 0.0000061 0.0000061 C5-C8 Aliphatics t/a 2.02 2.02 8.76 8.76 C17-C34 Aromatics t/a 0.000014 0.000014 0.000060 0.000060 Chrysene t/a 0.0000014 0.0000014 0.0000062 0.0000062 Dibenz(a,h)anthracene t/a 0.00000093 0.00000093 0.0000040 0.0000040 Dichlorobenzene t/a 0.00093 0.00093 0.0040 0.0040 Ethylbenzene t/a 0.0018 0.0018 0.0076 0.0076 Fluoranthene t/a 0.000014 0.000014 0.000060 0.000060 Fluorene t/a 0.0000045 0.0000045 0.0000196 0.0000196 Formaldehyde t/a 0.52 0.52 2.26 2.26 Hexane t/a 1.40 1.40 6.07 6.07 Indeno(1,2,3-cd)pyrene t/a 0.0000014 0.0000014 0.0000061 0.0000061 2-Methylnaphthalene t/a 0.000019 0.000019 0.000081 0.000081 Naphthalene t/a 0.0019 0.0019 0.0083 0.0083 Phenanthrene t/a 0.000037 0.000037 0.000160 0.000160 Pyrene t/a 0.0000090 0.0000090 0.000039 0.000039 Toluene t/a 0.058 0.058 0.252 0.252 Xylenes t/a 0.023 0.023 0.100 0.100
TOTAL Upgrader Supplemental InformationAppendix G: Updated Air Quality Assessment
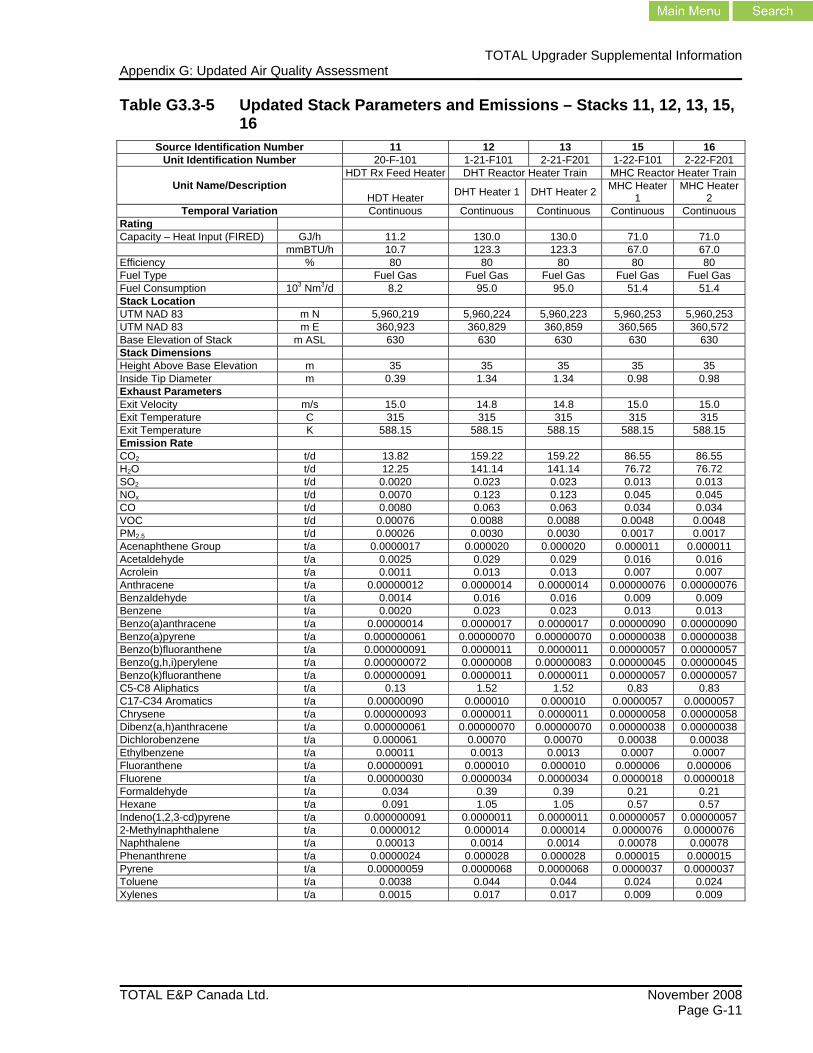
TOTAL E&P Canada Ltd. November 2008 Page G-11
Table G3.3-5 Updated Stack Parameters and Emissions – Stacks 11, 12, 13, 15, 16
Source Identification Number 11 12 13 15 16 Unit Identification Number 20-F-101 1-21-F101 2-21-F201 1-22-F101 2-22-F201
Unit Name/Description HDT Rx Feed Heater DHT Reactor Heater Train MHC Reactor Heater Train
HDT Heater DHT Heater 1 DHT Heater 2 MHC Heater 1
MHC Heater 2
Temporal Variation Continuous Continuous Continuous Continuous Continuous Rating Capacity – Heat Input (FIRED) GJ/h 11.2 130.0 130.0 71.0 71.0 mmBTU/h 10.7 123.3 123.3 67.0 67.0 Efficiency % 80 80 80 80 80 Fuel Type Fuel Gas Fuel Gas Fuel Gas Fuel Gas Fuel Gas Fuel Consumption 103 Nm3/d 8.2 95.0 95.0 51.4 51.4 Stack Location UTM NAD 83 m N 5,960,219 5,960,224 5,960,223 5,960,253 5,960,253 UTM NAD 83 m E 360,923 360,829 360,859 360,565 360,572 Base Elevation of Stack m ASL 630 630 630 630 630 Stack Dimensions Height Above Base Elevation m 35 35 35 35 35 Inside Tip Diameter m 0.39 1.34 1.34 0.98 0.98 Exhaust Parameters Exit Velocity m/s 15.0 14.8 14.8 15.0 15.0 Exit Temperature C 315 315 315 315 315 Exit Temperature K 588.15 588.15 588.15 588.15 588.15 Emission Rate CO2 t/d 13.82 159.22 159.22 86.55 86.55 H2O t/d 12.25 141.14 141.14 76.72 76.72 SO2 t/d 0.0020 0.023 0.023 0.013 0.013 NOx t/d 0.0070 0.123 0.123 0.045 0.045 CO t/d 0.0080 0.063 0.063 0.034 0.034 VOC t/d 0.00076 0.0088 0.0088 0.0048 0.0048 PM2.5 t/d 0.00026 0.0030 0.0030 0.0017 0.0017 Acenaphthene Group t/a 0.0000017 0.000020 0.000020 0.000011 0.000011 Acetaldehyde t/a 0.0025 0.029 0.029 0.016 0.016 Acrolein t/a 0.0011 0.013 0.013 0.007 0.007 Anthracene t/a 0.00000012 0.0000014 0.0000014 0.00000076 0.00000076 Benzaldehyde t/a 0.0014 0.016 0.016 0.009 0.009 Benzene t/a 0.0020 0.023 0.023 0.013 0.013 Benzo(a)anthracene t/a 0.00000014 0.0000017 0.0000017 0.00000090 0.00000090 Benzo(a)pyrene t/a 0.000000061 0.00000070 0.00000070 0.00000038 0.00000038 Benzo(b)fluoranthene t/a 0.000000091 0.0000011 0.0000011 0.00000057 0.00000057 Benzo(g,h,i)perylene t/a 0.000000072 0.0000008 0.00000083 0.00000045 0.00000045 Benzo(k)fluoranthene t/a 0.000000091 0.0000011 0.0000011 0.00000057 0.00000057 C5-C8 Aliphatics t/a 0.13 1.52 1.52 0.83 0.83 C17-C34 Aromatics t/a 0.00000090 0.000010 0.000010 0.0000057 0.0000057 Chrysene t/a 0.000000093 0.0000011 0.0000011 0.00000058 0.00000058 Dibenz(a,h)anthracene t/a 0.000000061 0.00000070 0.00000070 0.00000038 0.00000038 Dichlorobenzene t/a 0.000061 0.00070 0.00070 0.00038 0.00038 Ethylbenzene t/a 0.00011 0.0013 0.0013 0.0007 0.0007 Fluoranthene t/a 0.00000091 0.000010 0.000010 0.000006 0.000006 Fluorene t/a 0.00000030 0.0000034 0.0000034 0.0000018 0.0000018 Formaldehyde t/a 0.034 0.39 0.39 0.21 0.21 Hexane t/a 0.091 1.05 1.05 0.57 0.57 Indeno(1,2,3-cd)pyrene t/a 0.000000091 0.0000011 0.0000011 0.00000057 0.00000057 2-Methylnaphthalene t/a 0.0000012 0.000014 0.000014 0.0000076 0.0000076 Naphthalene t/a 0.00013 0.0014 0.0014 0.00078 0.00078 Phenanthrene t/a 0.0000024 0.000028 0.000028 0.000015 0.000015 Pyrene t/a 0.00000059 0.0000068 0.0000068 0.0000037 0.0000037 Toluene t/a 0.0038 0.044 0.044 0.024 0.024 Xylenes t/a 0.0015 0.017 0.017 0.009 0.009
TOTAL Upgrader Supplemental Information Appendix G: Updated Air Quality Assessment
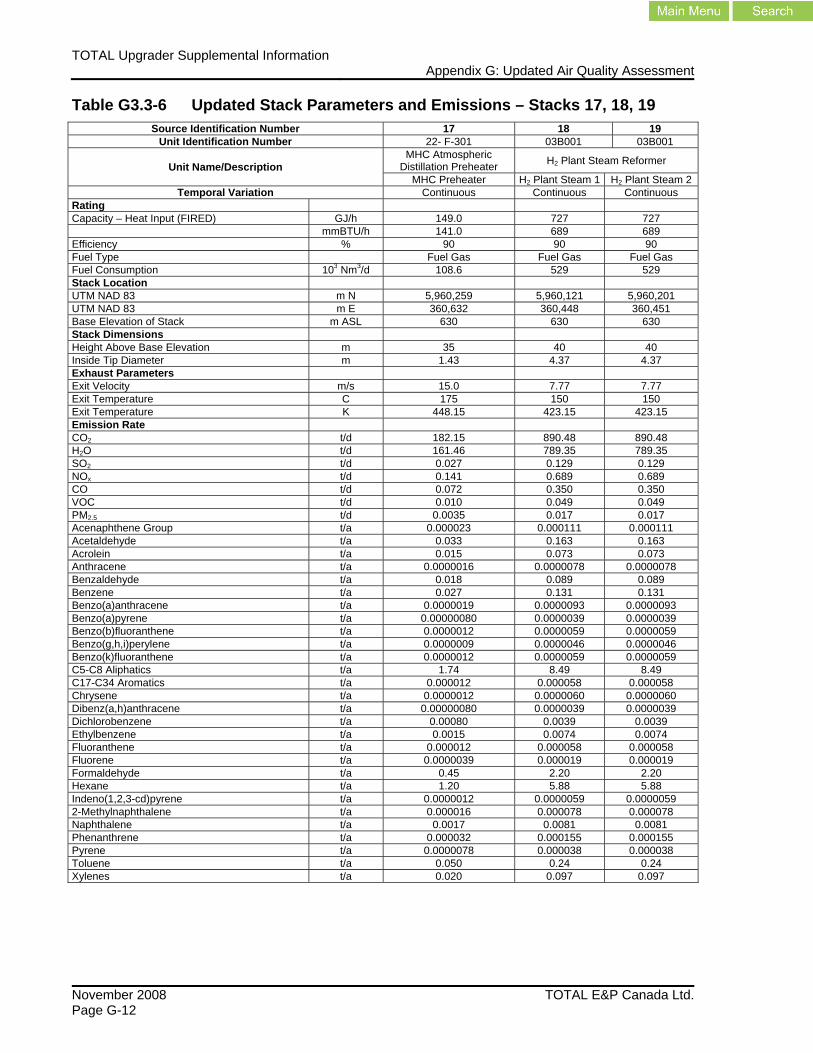
November 2008 TOTAL E&P Canada Ltd.Page G-12
Table G3.3-6 Updated Stack Parameters and Emissions – Stacks 17, 18, 19 Source Identification Number 17 18 19
Unit Identification Number 22- F-301 03B001 03B001
Unit Name/Description MHC Atmospheric
Distillation Preheater H2 Plant Steam Reformer
MHC Preheater H2 Plant Steam 1 H2 Plant Steam 2 Temporal Variation Continuous Continuous Continuous
Rating Capacity – Heat Input (FIRED) GJ/h 149.0 727 727 mmBTU/h 141.0 689 689 Efficiency % 90 90 90 Fuel Type Fuel Gas Fuel Gas Fuel Gas Fuel Consumption 103 Nm3/d 108.6 529 529 Stack Location UTM NAD 83 m N 5,960,259 5,960,121 5,960,201 UTM NAD 83 m E 360,632 360,448 360,451 Base Elevation of Stack m ASL 630 630 630 Stack Dimensions Height Above Base Elevation m 35 40 40 Inside Tip Diameter m 1.43 4.37 4.37 Exhaust Parameters Exit Velocity m/s 15.0 7.77 7.77 Exit Temperature C 175 150 150 Exit Temperature K 448.15 423.15 423.15 Emission Rate CO2 t/d 182.15 890.48 890.48 H2O t/d 161.46 789.35 789.35 SO2 t/d 0.027 0.129 0.129 NOx t/d 0.141 0.689 0.689 CO t/d 0.072 0.350 0.350 VOC t/d 0.010 0.049 0.049 PM2.5 t/d 0.0035 0.017 0.017 Acenaphthene Group t/a 0.000023 0.000111 0.000111 Acetaldehyde t/a 0.033 0.163 0.163 Acrolein t/a 0.015 0.073 0.073 Anthracene t/a 0.0000016 0.0000078 0.0000078 Benzaldehyde t/a 0.018 0.089 0.089 Benzene t/a 0.027 0.131 0.131 Benzo(a)anthracene t/a 0.0000019 0.0000093 0.0000093 Benzo(a)pyrene t/a 0.00000080 0.0000039 0.0000039 Benzo(b)fluoranthene t/a 0.0000012 0.0000059 0.0000059 Benzo(g,h,i)perylene t/a 0.0000009 0.0000046 0.0000046 Benzo(k)fluoranthene t/a 0.0000012 0.0000059 0.0000059 C5-C8 Aliphatics t/a 1.74 8.49 8.49 C17-C34 Aromatics t/a 0.000012 0.000058 0.000058 Chrysene t/a 0.0000012 0.0000060 0.0000060 Dibenz(a,h)anthracene t/a 0.00000080 0.0000039 0.0000039 Dichlorobenzene t/a 0.00080 0.0039 0.0039 Ethylbenzene t/a 0.0015 0.0074 0.0074 Fluoranthene t/a 0.000012 0.000058 0.000058 Fluorene t/a 0.0000039 0.000019 0.000019 Formaldehyde t/a 0.45 2.20 2.20 Hexane t/a 1.20 5.88 5.88 Indeno(1,2,3-cd)pyrene t/a 0.0000012 0.0000059 0.0000059 2-Methylnaphthalene t/a 0.000016 0.000078 0.000078 Naphthalene t/a 0.0017 0.0081 0.0081 Phenanthrene t/a 0.000032 0.000155 0.000155 Pyrene t/a 0.0000078 0.000038 0.000038 Toluene t/a 0.050 0.24 0.24 Xylenes t/a 0.020 0.097 0.097
TOTAL Upgrader Supplemental InformationAppendix G: Updated Air Quality Assessment
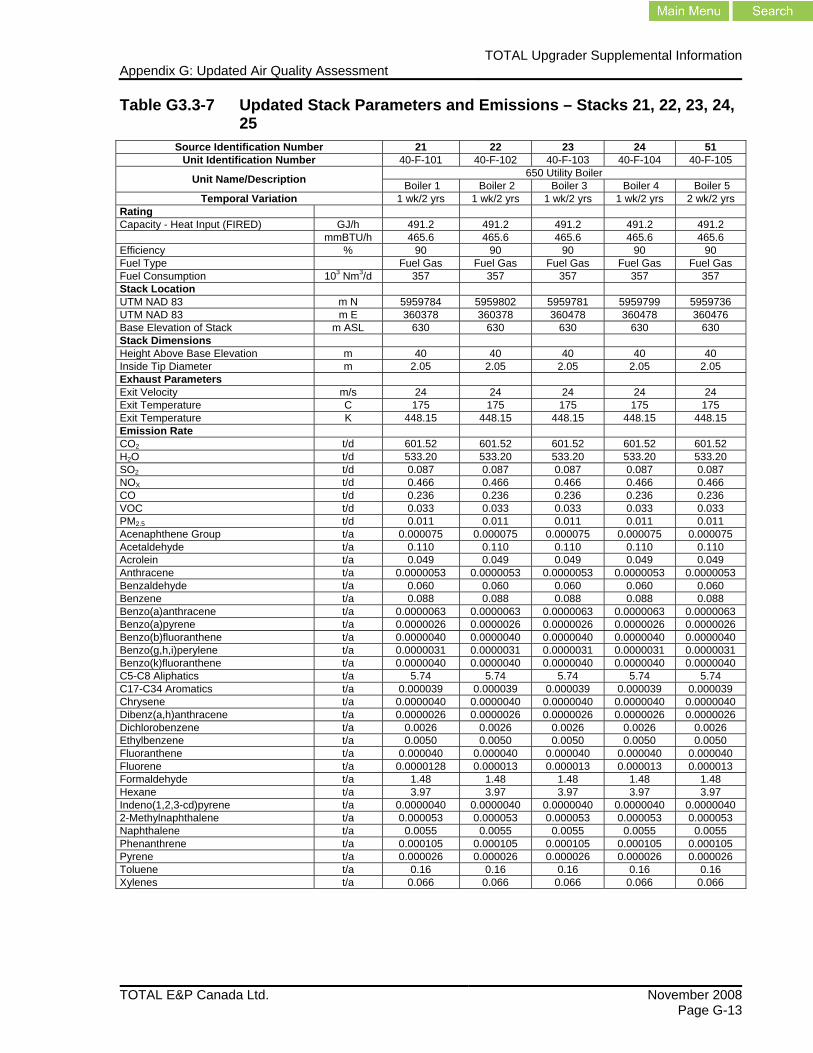
TOTAL E&P Canada Ltd. November 2008 Page G-13
Table G3.3-7 Updated Stack Parameters and Emissions – Stacks 21, 22, 23, 24, 25
Source Identification Number 21 22 23 24 51 Unit Identification Number 40-F-101 40-F-102 40-F-103 40-F-104 40-F-105
Unit Name/Description 650 Utility Boiler Boiler 1 Boiler 2 Boiler 3 Boiler 4 Boiler 5
Temporal Variation 1 wk/2 yrs 1 wk/2 yrs 1 wk/2 yrs 1 wk/2 yrs 2 wk/2 yrs Rating Capacity - Heat Input (FIRED) GJ/h 491.2 491.2 491.2 491.2 491.2 mmBTU/h 465.6 465.6 465.6 465.6 465.6 Efficiency % 90 90 90 90 90 Fuel Type Fuel Gas Fuel Gas Fuel Gas Fuel Gas Fuel Gas Fuel Consumption 103 Nm3/d 357 357 357 357 357 Stack Location UTM NAD 83 m N 5959784 5959802 5959781 5959799 5959736 UTM NAD 83 m E 360378 360378 360478 360478 360476 Base Elevation of Stack m ASL 630 630 630 630 630 Stack Dimensions Height Above Base Elevation m 40 40 40 40 40 Inside Tip Diameter m 2.05 2.05 2.05 2.05 2.05 Exhaust Parameters Exit Velocity m/s 24 24 24 24 24 Exit Temperature C 175 175 175 175 175 Exit Temperature K 448.15 448.15 448.15 448.15 448.15 Emission Rate CO2 t/d 601.52 601.52 601.52 601.52 601.52 H2O t/d 533.20 533.20 533.20 533.20 533.20 SO2 t/d 0.087 0.087 0.087 0.087 0.087 NOX t/d 0.466 0.466 0.466 0.466 0.466 CO t/d 0.236 0.236 0.236 0.236 0.236 VOC t/d 0.033 0.033 0.033 0.033 0.033 PM2.5 t/d 0.011 0.011 0.011 0.011 0.011 Acenaphthene Group t/a 0.000075 0.000075 0.000075 0.000075 0.000075 Acetaldehyde t/a 0.110 0.110 0.110 0.110 0.110 Acrolein t/a 0.049 0.049 0.049 0.049 0.049 Anthracene t/a 0.0000053 0.0000053 0.0000053 0.0000053 0.0000053 Benzaldehyde t/a 0.060 0.060 0.060 0.060 0.060 Benzene t/a 0.088 0.088 0.088 0.088 0.088 Benzo(a)anthracene t/a 0.0000063 0.0000063 0.0000063 0.0000063 0.0000063 Benzo(a)pyrene t/a 0.0000026 0.0000026 0.0000026 0.0000026 0.0000026 Benzo(b)fluoranthene t/a 0.0000040 0.0000040 0.0000040 0.0000040 0.0000040 Benzo(g,h,i)perylene t/a 0.0000031 0.0000031 0.0000031 0.0000031 0.0000031 Benzo(k)fluoranthene t/a 0.0000040 0.0000040 0.0000040 0.0000040 0.0000040 C5-C8 Aliphatics t/a 5.74 5.74 5.74 5.74 5.74 C17-C34 Aromatics t/a 0.000039 0.000039 0.000039 0.000039 0.000039 Chrysene t/a 0.0000040 0.0000040 0.0000040 0.0000040 0.0000040 Dibenz(a,h)anthracene t/a 0.0000026 0.0000026 0.0000026 0.0000026 0.0000026 Dichlorobenzene t/a 0.0026 0.0026 0.0026 0.0026 0.0026 Ethylbenzene t/a 0.0050 0.0050 0.0050 0.0050 0.0050 Fluoranthene t/a 0.000040 0.000040 0.000040 0.000040 0.000040 Fluorene t/a 0.0000128 0.000013 0.000013 0.000013 0.000013 Formaldehyde t/a 1.48 1.48 1.48 1.48 1.48 Hexane t/a 3.97 3.97 3.97 3.97 3.97 Indeno(1,2,3-cd)pyrene t/a 0.0000040 0.0000040 0.0000040 0.0000040 0.0000040 2-Methylnaphthalene t/a 0.000053 0.000053 0.000053 0.000053 0.000053 Naphthalene t/a 0.0055 0.0055 0.0055 0.0055 0.0055 Phenanthrene t/a 0.000105 0.000105 0.000105 0.000105 0.000105 Pyrene t/a 0.000026 0.000026 0.000026 0.000026 0.000026 Toluene t/a 0.16 0.16 0.16 0.16 0.16 Xylenes t/a 0.066 0.066 0.066 0.066 0.066
TOTAL Upgrader Supplemental Information Appendix G: Updated Air Quality Assessment
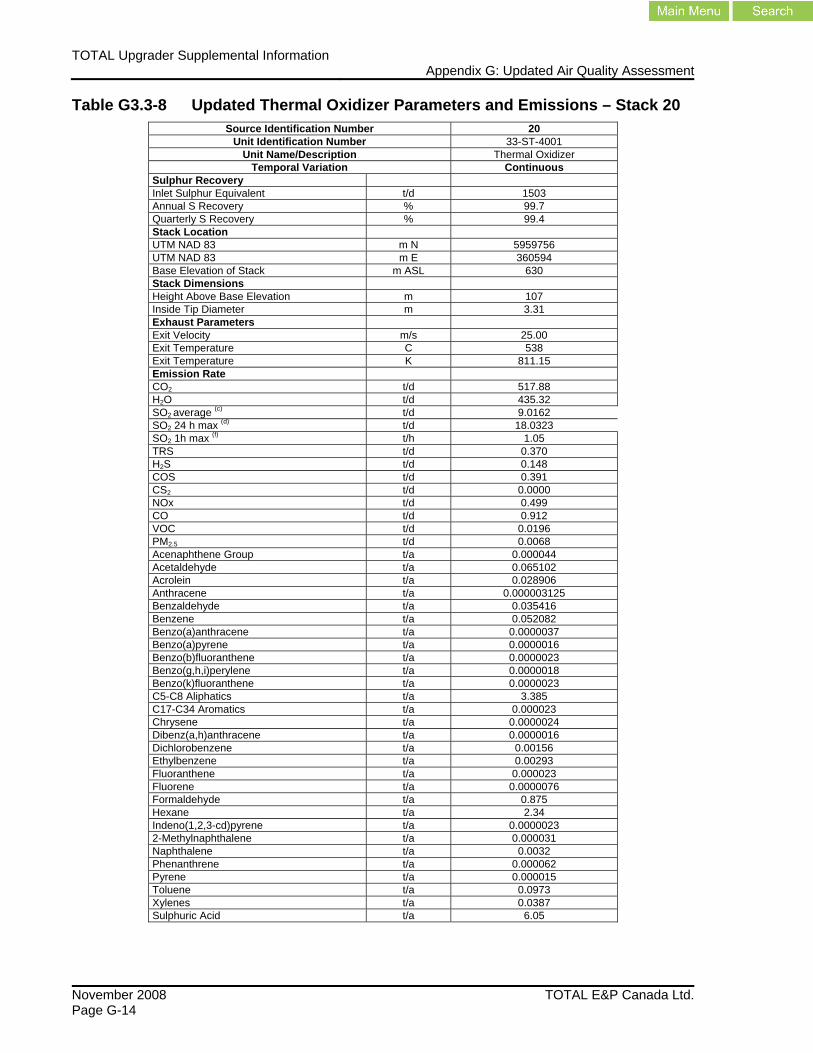
November 2008 TOTAL E&P Canada Ltd.Page G-14
Table G3.3-8 Updated Thermal Oxidizer Parameters and Emissions – Stack 20 Source Identification Number 20
Unit Identification Number 33-ST-4001 Unit Name/Description Thermal Oxidizer
Temporal Variation Continuous Sulphur Recovery Inlet Sulphur Equivalent t/d 1503 Annual S Recovery % 99.7 Quarterly S Recovery % 99.4 Stack Location UTM NAD 83 m N 5959756 UTM NAD 83 m E 360594 Base Elevation of Stack m ASL 630 Stack Dimensions Height Above Base Elevation m 107 Inside Tip Diameter m 3.31 Exhaust Parameters Exit Velocity m/s 25.00 Exit Temperature C 538 Exit Temperature K 811.15 Emission Rate CO2 t/d 517.88 H2O t/d 435.32 SO2 average (c) t/d 9.0162 SO2 24 h max (d) t/d 18.0323 SO2 1h max (f) t/h 1.05 TRS t/d 0.370 H2S t/d 0.148 COS t/d 0.391 CS2 t/d 0.0000 NOx t/d 0.499 CO t/d 0.912 VOC t/d 0.0196 PM2.5 t/d 0.0068 Acenaphthene Group t/a 0.000044 Acetaldehyde t/a 0.065102 Acrolein t/a 0.028906 Anthracene t/a 0.000003125 Benzaldehyde t/a 0.035416 Benzene t/a 0.052082 Benzo(a)anthracene t/a 0.0000037 Benzo(a)pyrene t/a 0.0000016 Benzo(b)fluoranthene t/a 0.0000023 Benzo(g,h,i)perylene t/a 0.0000018 Benzo(k)fluoranthene t/a 0.0000023 C5-C8 Aliphatics t/a 3.385 C17-C34 Aromatics t/a 0.000023 Chrysene t/a 0.0000024 Dibenz(a,h)anthracene t/a 0.0000016 Dichlorobenzene t/a 0.00156 Ethylbenzene t/a 0.00293 Fluoranthene t/a 0.000023 Fluorene t/a 0.0000076 Formaldehyde t/a 0.875 Hexane t/a 2.34 Indeno(1,2,3-cd)pyrene t/a 0.0000023 2-Methylnaphthalene t/a 0.000031 Naphthalene t/a 0.0032 Phenanthrene t/a 0.000062 Pyrene t/a 0.000015 Toluene t/a 0.0973 Xylenes t/a 0.0387 Sulphuric Acid t/a 6.05
TOTAL Upgrader Supplemental InformationAppendix G: Updated Air Quality Assessment
TOTAL E&P Canada Ltd. November 2008 Page G-15
Table G3.3-9 Updated Flare Stack Parameters and Emissions – Normal: Stacks 45, 49, 50
Source Identification Number 45 49 50 Unit Identification Number 30-FL-301 Unit Name/Description H2S Flare Smokeless Flare Non-Smokeless Flare Event Normal Normal Normal Frequency Continuous Continuous Continuous Duration Continuous Continuous Continuous Flow Rate Inlet Gas Stream Natural Gas Natural Gas Natural Gas Inlet Flow Rate 103 Nm3/d 1.14 3.53 21.20 Stack Location UTM NAD 83 m N 5,959,810 5,959,810 5,959,810 UTM NAD 83 m E 361,979 361,979 361,979 Base Elevation of Stack m ASL 630 630 630 Stack Dimensions Height Above Base Elevation m 134 134 134 Inside Tip Diameter m 0.59 1.20 2.09 Effective Parameters Stack Height m 135.16 136.00 138.71 Stack Diameter m 5.73 11.66 11.66 Exit Velocity m/s 0.0483 0.04 0.22 Exit Temperature C 1000 1000 1000 Exit Temperature K 1273 1273 1273 Emission Rate CO2 t/d 1.82 5.63 33.8 H2O t/d 1.61 4.99 30.0 SO2 t/d 0.00026 0.00080 0.0048 NOX t/d 0.0010 0.0032 0.019 CO t/d 0.0015 0.0048 0.029 VOC t/d 0.0021 0.0066 0.040 PM2.5 t/d 0.000035 0.00011 0.00065 Acenaphthene Group t/a 0.00075 0.0023 0.014 Acetaldehyde t/a 0.0044 0.013 0.081 Acrolein t/a 0.00062 0.0019 0.012 Anthracene t/a 0.00037 0.0012 0.0069 Benzene t/a 0.0057 0.018 0.11 Benzo(a)anthracene t/a 0.00037 0.0012 0.0069 Benzo(a)pyrene t/a 0.00037 0.0012 0.0069 Benzo(b)fluoranthene t/a 0.00037 0.0012 0.0069 Benzo(e)pyrene t/a 0.00000050 0.0000015 0.0000093 Benzo(g,h,i)perylene t/a 0.00037 0.0012 0.0069 Benzo(k)fluoranthene t/a 0.00037 0.0012 0.0069 C17-C34 Aromatics t/a 0.00000050 0.0000015 0.0000093 Chrysene t/a 0.00037 0.0012 0.0069 Dibenz(a,h)anthracene t/a 0.00037 0.0012 0.0069 Fluoranthene t/a 0.00037 0.0012 0.0069 Fluorene t/a 0.00037 0.0012 0.0069 Formaldehyde t/a 0.45 1.39 8.36 Indeno(1,2,3-cd)pyrene t/a 0.00037 0.0012 0.0069 2-Methylnaphthalene t/a 0.00011 0.00034 0.0020 Naphthalene t/a 0.24 0.73 4.39 Phenanthrene t/a 0.00037 0.0012 0.0069 Pyrene t/a 0.00037 0.0012 0.0069 Toluene t/a 0.73 2.25 13.5 Xylenes t/a 0.0053 0.016 0.099
TOTAL Upgrader Supplemental Information Appendix G: Updated Air Quality Assessment
November 2008 TOTAL E&P Canada Ltd.Page G-16
Table G3.3-10 Updated Flare Stack Parameters and Emissions – Upset: Stacks 45, 49, 50
Source Identification Number 45 49 50
Unit Identification Number 30-FL-301 Smokeless
Flare
Non-Smokeless
Flare Unit Name/Description H2S Flare
Event
Emergency – Total Power Failure
Emergency – Fire
Emergency – Partial Power Failure Emergency Emergency
Frequency once/2 years once/25 years once/2 years once/5 years once/5 years Duration 30 minutes 30 minutes 30 minutes 30 minutes 30 minutes Flow Rate Inlet Gas Stream Acid Gas Acid Gas Acid Gas Inlet Flow Rate 103 Nm3/d 5,407 3,317 2,214 8,354 42,122 Inlet Gas Composition
H2 Mole % 0.02 0.10 2.40 53.31 CO Mole % 0.01 CO2 Mole % 0.40 9.59 H2S Mole % 13.49 73.30 75.96 4.44 4.97 C1 Mole % 46.90 0.10 0.38 9.46 11.94 C2 Mole % 1.33 0.19 4.92 5.48 C3 Mole % 0.30 0.19 12.02 4.13 C4 Mole % 0.12 12.06 5.29 C5+ Mole % 0.06 27.35 7.82 H2O Mole % 33.06 25.90 7.74 27.89 6.10 NH3 Mole % 4.72 0.20 5.95 Total Mole % 100.00 100.0 100.00 100.6 99.0
Gas Properties Molecular Mass kg/kmole 19.52 29.87 32.72 44.8 19.2 Heating Value MJ/m3 20.97 16.14 18.08 74.9 36.5 Stack Location UTM NAD 83 m N 5,959,810 5,959,810 5,959,810 UTM NAD 83 m E 361,979 361,979 361,979 Base Elevation of Stack m ASL 630 630 630 Stack Dimensions Height Above Base Elevation m 134 134 134 Inside Tip Diameter m 0.59 1.20 2.09 Effective Parameters Stack Height m 194.3 181.4 177.9 256.3 318.7 Stack Diameter m 4.7 4.4 4.7 16.7 20.9 Exit Velocity m/s 276.3 187.8 141.1 97.0 145.9 Exit Temperature C 1000 1000 1000 1000 1000 Exit Temperature K 1273 1273 1273 1273 1273 Emission Rate SO2 (flare period) t/d 1936 6453 4463 984 5556 SO2 (equivalent 1-h) t/d 968 3226 2232 492 2778
TOTAL Upgrader Supplemental InformationAppendix G: Updated Air Quality Assessment
TOTAL E&P Canada Ltd. November 2008 Page G-17
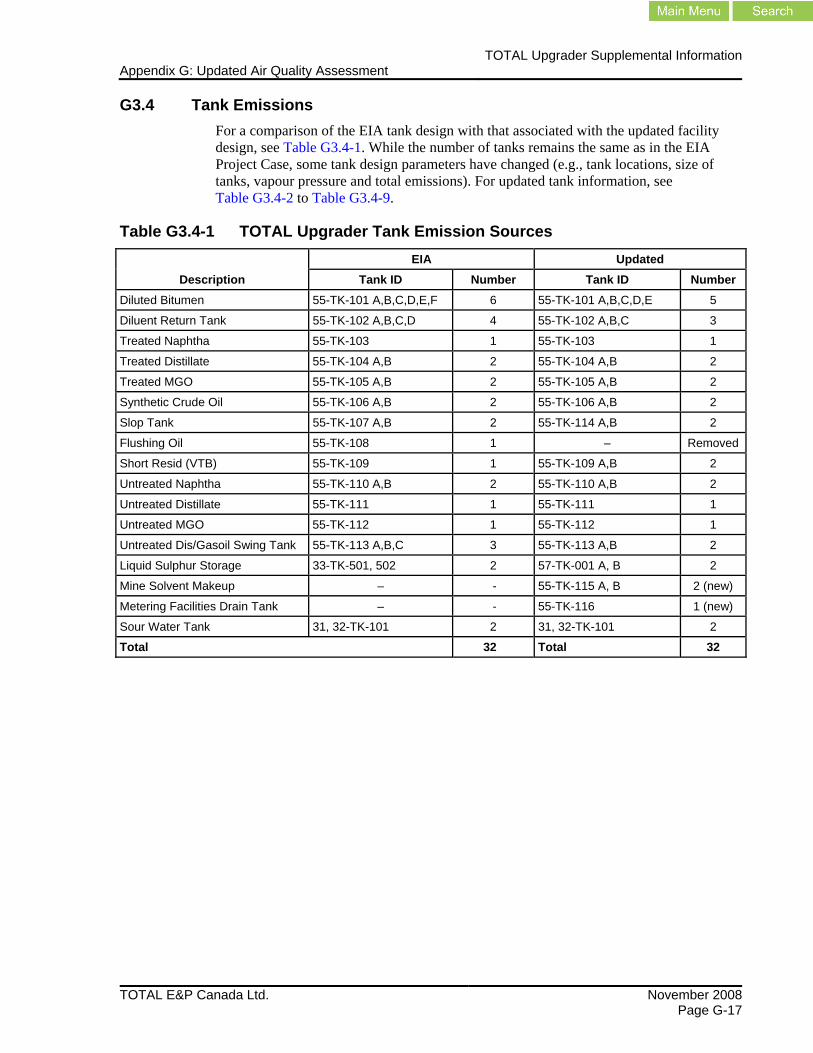
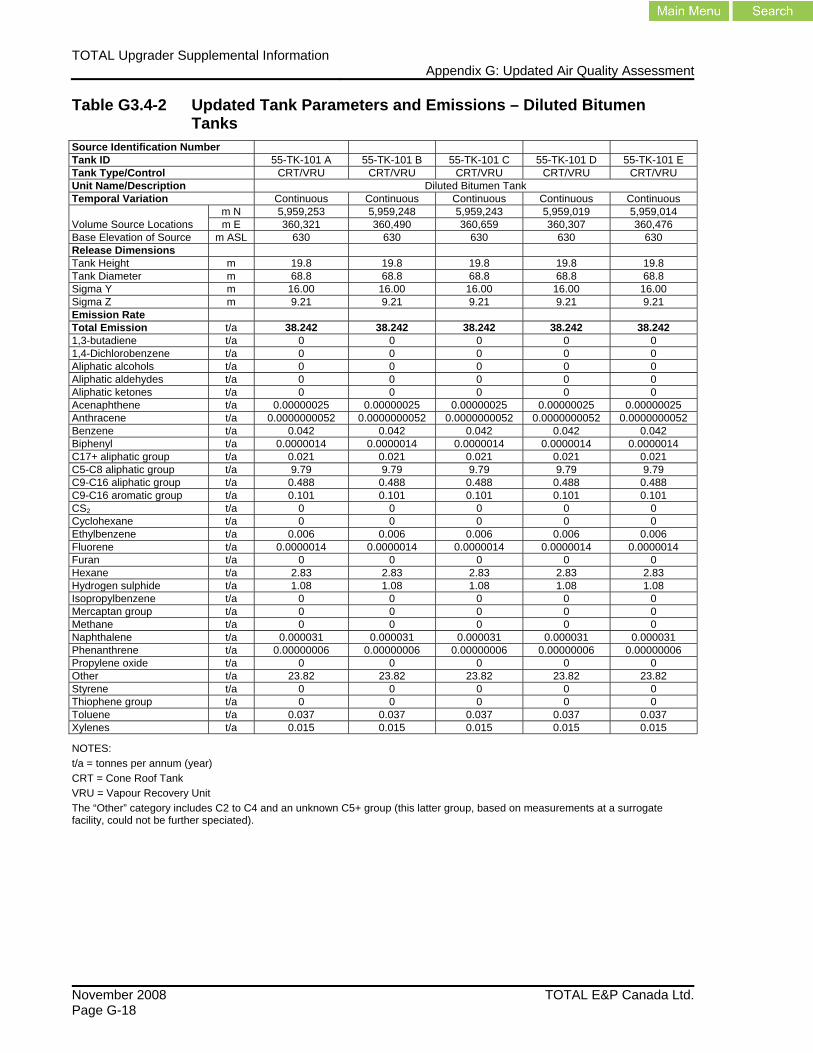
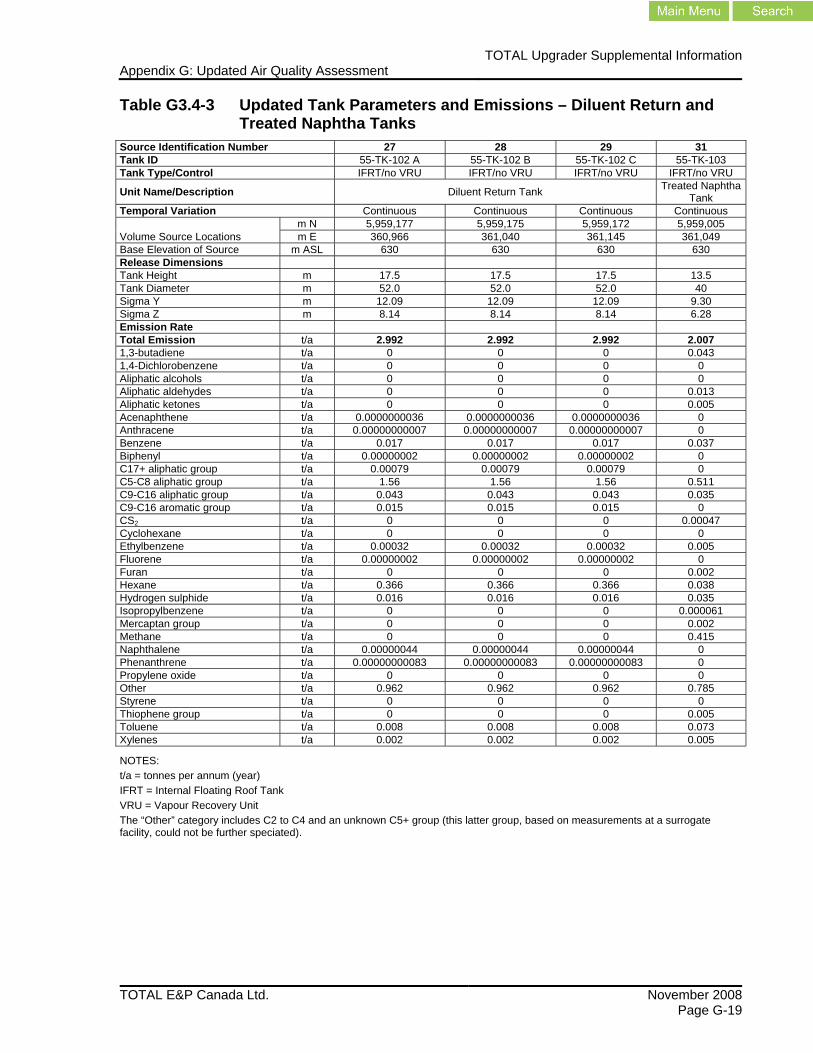
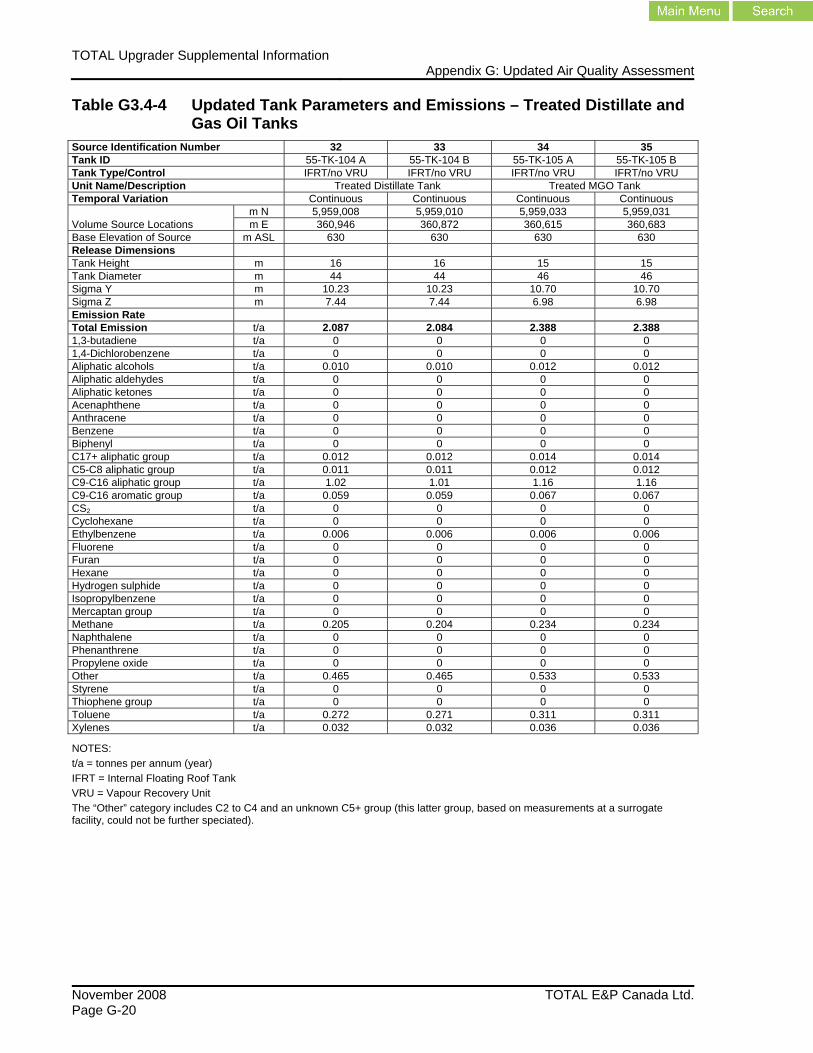
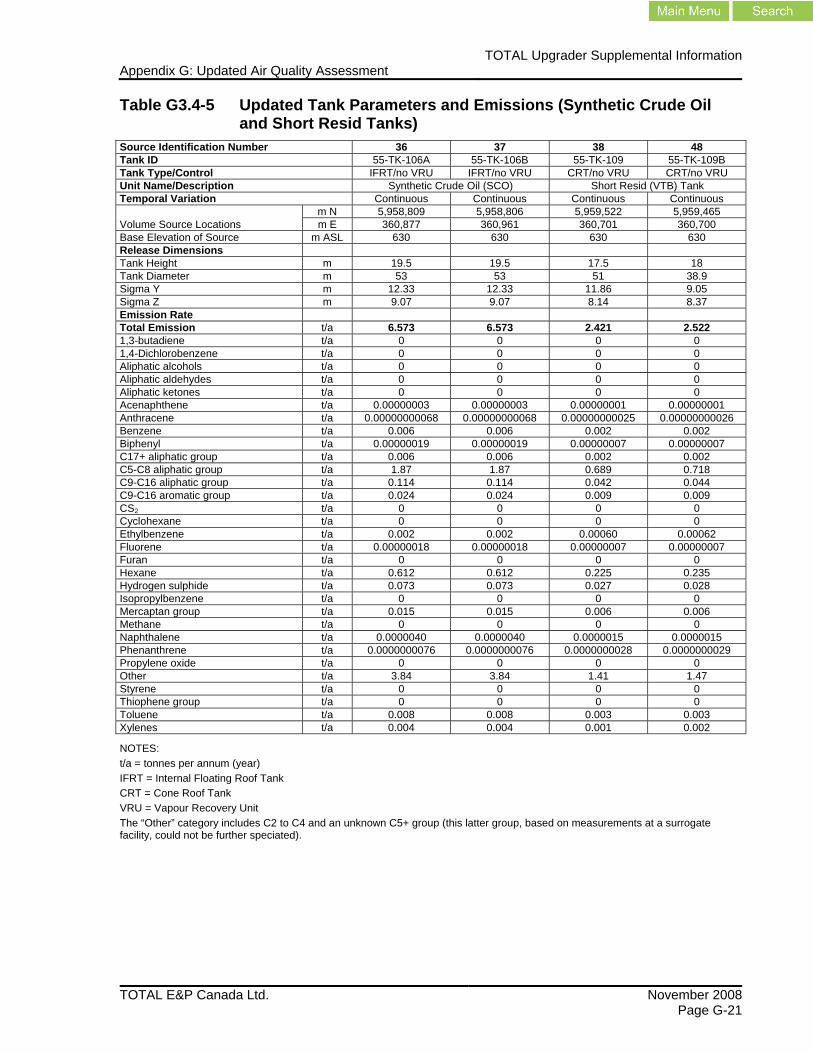
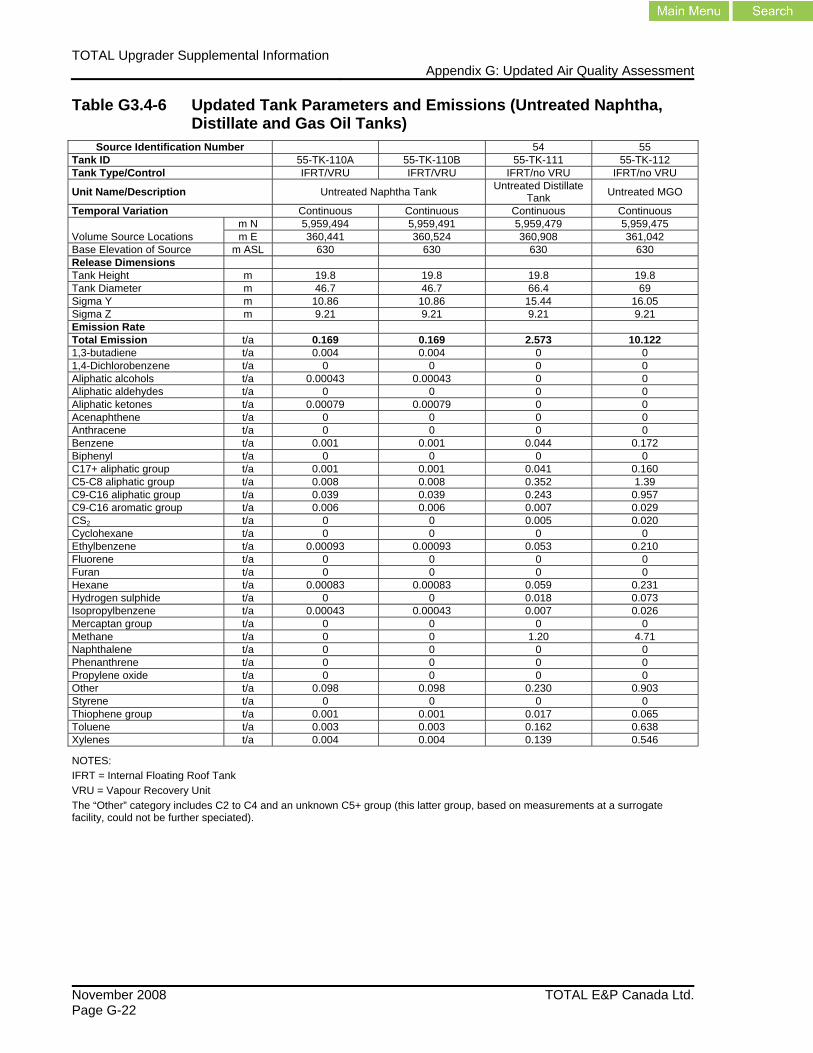
G3.4 Tank Emissions For a comparison of the EIA tank design with that associated with the updated facility design, see Table G3.4-1. While the number of tanks remains the same as in the EIA Project Case, some tank design parameters have changed (e.g., tank locations, size of tanks, vapour pressure and total emissions). For updated tank information, see Table G3.4-2 to Table G3.4-9.
Table G3.4-1 TOTAL Upgrader Tank Emission Sources
Description EIA Updated
Tank ID Number Tank ID Number Diluted Bitumen 55-TK-101 A,B,C,D,E,F 6 55-TK-101 A,B,C,D,E 5
Diluent Return Tank 55-TK-102 A,B,C,D 4 55-TK-102 A,B,C 3
Treated Naphtha 55-TK-103 1 55-TK-103 1
Treated Distillate 55-TK-104 A,B 2 55-TK-104 A,B 2
Treated MGO 55-TK-105 A,B 2 55-TK-105 A,B 2
Synthetic Crude Oil 55-TK-106 A,B 2 55-TK-106 A,B 2
Slop Tank 55-TK-107 A,B 2 55-TK-114 A,B 2
Flushing Oil 55-TK-108 1 – Removed
Short Resid (VTB) 55-TK-109 1 55-TK-109 A,B 2
Untreated Naphtha 55-TK-110 A,B 2 55-TK-110 A,B 2
Untreated Distillate 55-TK-111 1 55-TK-111 1
Untreated MGO 55-TK-112 1 55-TK-112 1
Untreated Dis/Gasoil Swing Tank 55-TK-113 A,B,C 3 55-TK-113 A,B 2
Liquid Sulphur Storage 33-TK-501, 502 2 57-TK-001 A, B 2
Mine Solvent Makeup – - 55-TK-115 A, B 2 (new)
Metering Facilities Drain Tank – - 55-TK-116 1 (new)
Sour Water Tank 31, 32-TK-101 2 31, 32-TK-101 2
Total 32 Total 32
TOTAL Upgrader Supplemental Information Appendix G: Updated Air Quality Assessment
November 2008 TOTAL E&P Canada Ltd.Page G-18
Table G3.4-2 Updated Tank Parameters and Emissions – Diluted Bitumen Tanks
Source Identification Number Tank ID 55-TK-101 A 55-TK-101 B 55-TK-101 C 55-TK-101 D 55-TK-101 E Tank Type/Control CRT/VRU CRT/VRU CRT/VRU CRT/VRU CRT/VRU Unit Name/Description Diluted Bitumen Tank Temporal Variation Continuous Continuous Continuous Continuous Continuous
Volume Source Locations m N 5,959,253 5,959,248 5,959,243 5,959,019 5,959,014 m E 360,321 360,490 360,659 360,307 360,476
Base Elevation of Source m ASL 630 630 630 630 630 Release Dimensions Tank Height m 19.8 19.8 19.8 19.8 19.8 Tank Diameter m 68.8 68.8 68.8 68.8 68.8 Sigma Y m 16.00 16.00 16.00 16.00 16.00 Sigma Z m 9.21 9.21 9.21 9.21 9.21 Emission Rate Total Emission t/a 38.242 38.242 38.242 38.242 38.242 1,3-butadiene t/a 0 0 0 0 0 1,4-Dichlorobenzene t/a 0 0 0 0 0 Aliphatic alcohols t/a 0 0 0 0 0 Aliphatic aldehydes t/a 0 0 0 0 0 Aliphatic ketones t/a 0 0 0 0 0 Acenaphthene t/a 0.00000025 0.00000025 0.00000025 0.00000025 0.00000025 Anthracene t/a 0.0000000052 0.0000000052 0.0000000052 0.0000000052 0.0000000052 Benzene t/a 0.042 0.042 0.042 0.042 0.042 Biphenyl t/a 0.0000014 0.0000014 0.0000014 0.0000014 0.0000014 C17+ aliphatic group t/a 0.021 0.021 0.021 0.021 0.021 C5-C8 aliphatic group t/a 9.79 9.79 9.79 9.79 9.79 C9-C16 aliphatic group t/a 0.488 0.488 0.488 0.488 0.488 C9-C16 aromatic group t/a 0.101 0.101 0.101 0.101 0.101 CS2 t/a 0 0 0 0 0 Cyclohexane t/a 0 0 0 0 0 Ethylbenzene t/a 0.006 0.006 0.006 0.006 0.006 Fluorene t/a 0.0000014 0.0000014 0.0000014 0.0000014 0.0000014 Furan t/a 0 0 0 0 0 Hexane t/a 2.83 2.83 2.83 2.83 2.83 Hydrogen sulphide t/a 1.08 1.08 1.08 1.08 1.08 Isopropylbenzene t/a 0 0 0 0 0 Mercaptan group t/a 0 0 0 0 0 Methane t/a 0 0 0 0 0 Naphthalene t/a 0.000031 0.000031 0.000031 0.000031 0.000031 Phenanthrene t/a 0.00000006 0.00000006 0.00000006 0.00000006 0.00000006 Propylene oxide t/a 0 0 0 0 0 Other t/a 23.82 23.82 23.82 23.82 23.82 Styrene t/a 0 0 0 0 0 Thiophene group t/a 0 0 0 0 0 Toluene t/a 0.037 0.037 0.037 0.037 0.037 Xylenes t/a 0.015 0.015 0.015 0.015 0.015
NOTES: t/a = tonnes per annum (year) CRT = Cone Roof Tank VRU = Vapour Recovery Unit The “Other” category includes C2 to C4 and an unknown C5+ group (this latter group, based on measurements at a surrogate facility, could not be further speciated).
TOTAL Upgrader Supplemental InformationAppendix G: Updated Air Quality Assessment
TOTAL E&P Canada Ltd. November 2008 Page G-19
Table G3.4-3 Updated Tank Parameters and Emissions – Diluent Return and Treated Naphtha Tanks
Source Identification Number 27 28 29 31 Tank ID 55-TK-102 A 55-TK-102 B 55-TK-102 C 55-TK-103 Tank Type/Control IFRT/no VRU IFRT/no VRU IFRT/no VRU IFRT/no VRU
Unit Name/Description Diluent Return Tank Treated Naphtha Tank
Temporal Variation Continuous Continuous Continuous Continuous
Volume Source Locations m N 5,959,177 5,959,175 5,959,172 5,959,005 m E 360,966 361,040 361,145 361,049
Base Elevation of Source m ASL 630 630 630 630 Release Dimensions Tank Height m 17.5 17.5 17.5 13.5 Tank Diameter m 52.0 52.0 52.0 40 Sigma Y m 12.09 12.09 12.09 9.30 Sigma Z m 8.14 8.14 8.14 6.28 Emission Rate Total Emission t/a 2.992 2.992 2.992 2.007 1,3-butadiene t/a 0 0 0 0.043 1,4-Dichlorobenzene t/a 0 0 0 0 Aliphatic alcohols t/a 0 0 0 0 Aliphatic aldehydes t/a 0 0 0 0.013 Aliphatic ketones t/a 0 0 0 0.005 Acenaphthene t/a 0.0000000036 0.0000000036 0.0000000036 0 Anthracene t/a 0.00000000007 0.00000000007 0.00000000007 0 Benzene t/a 0.017 0.017 0.017 0.037 Biphenyl t/a 0.00000002 0.00000002 0.00000002 0 C17+ aliphatic group t/a 0.00079 0.00079 0.00079 0 C5-C8 aliphatic group t/a 1.56 1.56 1.56 0.511 C9-C16 aliphatic group t/a 0.043 0.043 0.043 0.035 C9-C16 aromatic group t/a 0.015 0.015 0.015 0 CS2 t/a 0 0 0 0.00047 Cyclohexane t/a 0 0 0 0 Ethylbenzene t/a 0.00032 0.00032 0.00032 0.005 Fluorene t/a 0.00000002 0.00000002 0.00000002 0 Furan t/a 0 0 0 0.002 Hexane t/a 0.366 0.366 0.366 0.038 Hydrogen sulphide t/a 0.016 0.016 0.016 0.035 Isopropylbenzene t/a 0 0 0 0.000061 Mercaptan group t/a 0 0 0 0.002 Methane t/a 0 0 0 0.415 Naphthalene t/a 0.00000044 0.00000044 0.00000044 0 Phenanthrene t/a 0.00000000083 0.00000000083 0.00000000083 0 Propylene oxide t/a 0 0 0 0 Other t/a 0.962 0.962 0.962 0.785 Styrene t/a 0 0 0 0 Thiophene group t/a 0 0 0 0.005 Toluene t/a 0.008 0.008 0.008 0.073 Xylenes t/a 0.002 0.002 0.002 0.005
NOTES: t/a = tonnes per annum (year) IFRT = Internal Floating Roof Tank VRU = Vapour Recovery Unit The “Other” category includes C2 to C4 and an unknown C5+ group (this latter group, based on measurements at a surrogate facility, could not be further speciated).
TOTAL Upgrader Supplemental Information Appendix G: Updated Air Quality Assessment
November 2008 TOTAL E&P Canada Ltd.Page G-20
Table G3.4-4 Updated Tank Parameters and Emissions – Treated Distillate and Gas Oil Tanks
Source Identification Number 32 33 34 35 Tank ID 55-TK-104 A 55-TK-104 B 55-TK-105 A 55-TK-105 B Tank Type/Control IFRT/no VRU IFRT/no VRU IFRT/no VRU IFRT/no VRU Unit Name/Description Treated Distillate Tank Treated MGO Tank Temporal Variation Continuous Continuous Continuous Continuous
Volume Source Locations m N 5,959,008 5,959,010 5,959,033 5,959,031 m E 360,946 360,872 360,615 360,683
Base Elevation of Source m ASL 630 630 630 630 Release Dimensions Tank Height m 16 16 15 15 Tank Diameter m 44 44 46 46 Sigma Y m 10.23 10.23 10.70 10.70 Sigma Z m 7.44 7.44 6.98 6.98 Emission Rate Total Emission t/a 2.087 2.084 2.388 2.388 1,3-butadiene t/a 0 0 0 0 1,4-Dichlorobenzene t/a 0 0 0 0 Aliphatic alcohols t/a 0.010 0.010 0.012 0.012 Aliphatic aldehydes t/a 0 0 0 0 Aliphatic ketones t/a 0 0 0 0 Acenaphthene t/a 0 0 0 0 Anthracene t/a 0 0 0 0 Benzene t/a 0 0 0 0 Biphenyl t/a 0 0 0 0 C17+ aliphatic group t/a 0.012 0.012 0.014 0.014 C5-C8 aliphatic group t/a 0.011 0.011 0.012 0.012 C9-C16 aliphatic group t/a 1.02 1.01 1.16 1.16 C9-C16 aromatic group t/a 0.059 0.059 0.067 0.067 CS2 t/a 0 0 0 0 Cyclohexane t/a 0 0 0 0 Ethylbenzene t/a 0.006 0.006 0.006 0.006 Fluorene t/a 0 0 0 0 Furan t/a 0 0 0 0 Hexane t/a 0 0 0 0 Hydrogen sulphide t/a 0 0 0 0 Isopropylbenzene t/a 0 0 0 0 Mercaptan group t/a 0 0 0 0 Methane t/a 0.205 0.204 0.234 0.234 Naphthalene t/a 0 0 0 0 Phenanthrene t/a 0 0 0 0 Propylene oxide t/a 0 0 0 0 Other t/a 0.465 0.465 0.533 0.533 Styrene t/a 0 0 0 0 Thiophene group t/a 0 0 0 0 Toluene t/a 0.272 0.271 0.311 0.311 Xylenes t/a 0.032 0.032 0.036 0.036
NOTES: t/a = tonnes per annum (year) IFRT = Internal Floating Roof Tank VRU = Vapour Recovery Unit The “Other” category includes C2 to C4 and an unknown C5+ group (this latter group, based on measurements at a surrogate facility, could not be further speciated).
TOTAL Upgrader Supplemental InformationAppendix G: Updated Air Quality Assessment
TOTAL E&P Canada Ltd. November 2008 Page G-21
Table G3.4-5 Updated Tank Parameters and Emissions (Synthetic Crude Oil and Short Resid Tanks)
Source Identification Number 36 37 38 48 Tank ID 55-TK-106A 55-TK-106B 55-TK-109 55-TK-109B Tank Type/Control IFRT/no VRU IFRT/no VRU CRT/no VRU CRT/no VRU Unit Name/Description Synthetic Crude Oil (SCO) Short Resid (VTB) Tank Temporal Variation Continuous Continuous Continuous Continuous
Volume Source Locations m N 5,958,809 5,958,806 5,959,522 5,959,465 m E 360,877 360,961 360,701 360,700
Base Elevation of Source m ASL 630 630 630 630 Release Dimensions Tank Height m 19.5 19.5 17.5 18 Tank Diameter m 53 53 51 38.9 Sigma Y m 12.33 12.33 11.86 9.05 Sigma Z m 9.07 9.07 8.14 8.37 Emission Rate Total Emission t/a 6.573 6.573 2.421 2.522 1,3-butadiene t/a 0 0 0 0 1,4-Dichlorobenzene t/a 0 0 0 0 Aliphatic alcohols t/a 0 0 0 0 Aliphatic aldehydes t/a 0 0 0 0 Aliphatic ketones t/a 0 0 0 0 Acenaphthene t/a 0.00000003 0.00000003 0.00000001 0.00000001 Anthracene t/a 0.00000000068 0.00000000068 0.00000000025 0.00000000026 Benzene t/a 0.006 0.006 0.002 0.002 Biphenyl t/a 0.00000019 0.00000019 0.00000007 0.00000007 C17+ aliphatic group t/a 0.006 0.006 0.002 0.002 C5-C8 aliphatic group t/a 1.87 1.87 0.689 0.718 C9-C16 aliphatic group t/a 0.114 0.114 0.042 0.044 C9-C16 aromatic group t/a 0.024 0.024 0.009 0.009 CS2 t/a 0 0 0 0 Cyclohexane t/a 0 0 0 0 Ethylbenzene t/a 0.002 0.002 0.00060 0.00062 Fluorene t/a 0.00000018 0.00000018 0.00000007 0.00000007 Furan t/a 0 0 0 0 Hexane t/a 0.612 0.612 0.225 0.235 Hydrogen sulphide t/a 0.073 0.073 0.027 0.028 Isopropylbenzene t/a 0 0 0 0 Mercaptan group t/a 0.015 0.015 0.006 0.006 Methane t/a 0 0 0 0 Naphthalene t/a 0.0000040 0.0000040 0.0000015 0.0000015 Phenanthrene t/a 0.0000000076 0.0000000076 0.0000000028 0.0000000029 Propylene oxide t/a 0 0 0 0 Other t/a 3.84 3.84 1.41 1.47 Styrene t/a 0 0 0 0 Thiophene group t/a 0 0 0 0 Toluene t/a 0.008 0.008 0.003 0.003 Xylenes t/a 0.004 0.004 0.001 0.002
NOTES: t/a = tonnes per annum (year) IFRT = Internal Floating Roof Tank CRT = Cone Roof Tank VRU = Vapour Recovery Unit The “Other” category includes C2 to C4 and an unknown C5+ group (this latter group, based on measurements at a surrogate facility, could not be further speciated).
TOTAL Upgrader Supplemental Information Appendix G: Updated Air Quality Assessment
November 2008 TOTAL E&P Canada Ltd.Page G-22
Table G3.4-6 Updated Tank Parameters and Emissions (Untreated Naphtha, Distillate and Gas Oil Tanks)
Source Identification Number 54 55 Tank ID 55-TK-110A 55-TK-110B 55-TK-111 55-TK-112 Tank Type/Control IFRT/VRU IFRT/VRU IFRT/no VRU IFRT/no VRU
Unit Name/Description Untreated Naphtha Tank Untreated Distillate Tank Untreated MGO
Temporal Variation Continuous Continuous Continuous Continuous
Volume Source Locations m N 5,959,494 5,959,491 5,959,479 5,959,475 m E 360,441 360,524 360,908 361,042
Base Elevation of Source m ASL 630 630 630 630 Release Dimensions Tank Height m 19.8 19.8 19.8 19.8 Tank Diameter m 46.7 46.7 66.4 69 Sigma Y m 10.86 10.86 15.44 16.05 Sigma Z m 9.21 9.21 9.21 9.21 Emission Rate Total Emission t/a 0.169 0.169 2.573 10.122 1,3-butadiene t/a 0.004 0.004 0 0 1,4-Dichlorobenzene t/a 0 0 0 0 Aliphatic alcohols t/a 0.00043 0.00043 0 0 Aliphatic aldehydes t/a 0 0 0 0 Aliphatic ketones t/a 0.00079 0.00079 0 0 Acenaphthene t/a 0 0 0 0 Anthracene t/a 0 0 0 0 Benzene t/a 0.001 0.001 0.044 0.172 Biphenyl t/a 0 0 0 0 C17+ aliphatic group t/a 0.001 0.001 0.041 0.160 C5-C8 aliphatic group t/a 0.008 0.008 0.352 1.39 C9-C16 aliphatic group t/a 0.039 0.039 0.243 0.957 C9-C16 aromatic group t/a 0.006 0.006 0.007 0.029 CS2 t/a 0 0 0.005 0.020 Cyclohexane t/a 0 0 0 0 Ethylbenzene t/a 0.00093 0.00093 0.053 0.210 Fluorene t/a 0 0 0 0 Furan t/a 0 0 0 0 Hexane t/a 0.00083 0.00083 0.059 0.231 Hydrogen sulphide t/a 0 0 0.018 0.073 Isopropylbenzene t/a 0.00043 0.00043 0.007 0.026 Mercaptan group t/a 0 0 0 0 Methane t/a 0 0 1.20 4.71 Naphthalene t/a 0 0 0 0 Phenanthrene t/a 0 0 0 0 Propylene oxide t/a 0 0 0 0 Other t/a 0.098 0.098 0.230 0.903 Styrene t/a 0 0 0 0 Thiophene group t/a 0.001 0.001 0.017 0.065 Toluene t/a 0.003 0.003 0.162 0.638 Xylenes t/a 0.004 0.004 0.139 0.546
NOTES: IFRT = Internal Floating Roof Tank VRU = Vapour Recovery Unit The “Other” category includes C2 to C4 and an unknown C5+ group (this latter group, based on measurements at a surrogate facility, could not be further speciated).
TOTAL Upgrader Supplemental InformationAppendix G: Updated Air Quality Assessment
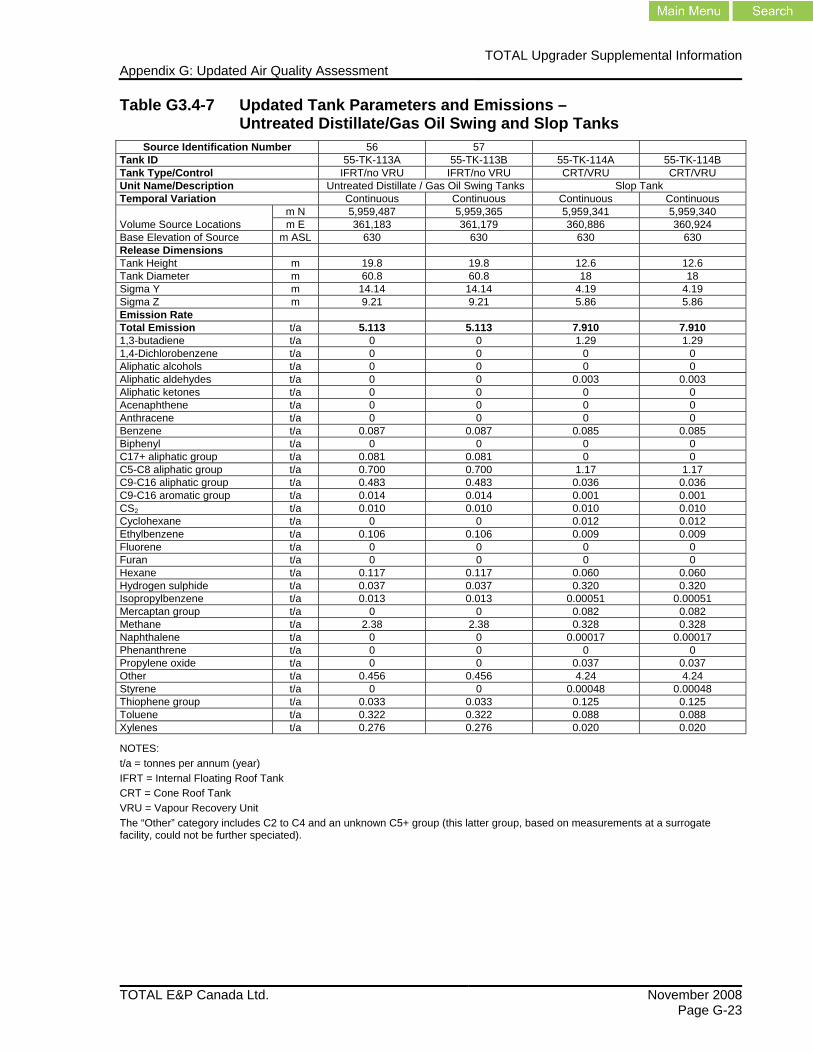
TOTAL E&P Canada Ltd. November 2008 Page G-23
Table G3.4-7 Updated Tank Parameters and Emissions – Untreated Distillate/Gas Oil Swing and Slop Tanks
Source Identification Number 56 57 Tank ID 55-TK-113A 55-TK-113B 55-TK-114A 55-TK-114B Tank Type/Control IFRT/no VRU IFRT/no VRU CRT/VRU CRT/VRU Unit Name/Description Untreated Distillate / Gas Oil Swing Tanks Slop Tank Temporal Variation Continuous Continuous Continuous Continuous
Volume Source Locations m N 5,959,487 5,959,365 5,959,341 5,959,340 m E 361,183 361,179 360,886 360,924
Base Elevation of Source m ASL 630 630 630 630 Release Dimensions Tank Height m 19.8 19.8 12.6 12.6 Tank Diameter m 60.8 60.8 18 18 Sigma Y m 14.14 14.14 4.19 4.19 Sigma Z m 9.21 9.21 5.86 5.86 Emission Rate Total Emission t/a 5.113 5.113 7.910 7.910 1,3-butadiene t/a 0 0 1.29 1.29 1,4-Dichlorobenzene t/a 0 0 0 0 Aliphatic alcohols t/a 0 0 0 0 Aliphatic aldehydes t/a 0 0 0.003 0.003 Aliphatic ketones t/a 0 0 0 0 Acenaphthene t/a 0 0 0 0 Anthracene t/a 0 0 0 0 Benzene t/a 0.087 0.087 0.085 0.085 Biphenyl t/a 0 0 0 0 C17+ aliphatic group t/a 0.081 0.081 0 0 C5-C8 aliphatic group t/a 0.700 0.700 1.17 1.17 C9-C16 aliphatic group t/a 0.483 0.483 0.036 0.036 C9-C16 aromatic group t/a 0.014 0.014 0.001 0.001 CS2 t/a 0.010 0.010 0.010 0.010 Cyclohexane t/a 0 0 0.012 0.012 Ethylbenzene t/a 0.106 0.106 0.009 0.009 Fluorene t/a 0 0 0 0 Furan t/a 0 0 0 0 Hexane t/a 0.117 0.117 0.060 0.060 Hydrogen sulphide t/a 0.037 0.037 0.320 0.320 Isopropylbenzene t/a 0.013 0.013 0.00051 0.00051 Mercaptan group t/a 0 0 0.082 0.082 Methane t/a 2.38 2.38 0.328 0.328 Naphthalene t/a 0 0 0.00017 0.00017 Phenanthrene t/a 0 0 0 0 Propylene oxide t/a 0 0 0.037 0.037 Other t/a 0.456 0.456 4.24 4.24 Styrene t/a 0 0 0.00048 0.00048 Thiophene group t/a 0.033 0.033 0.125 0.125 Toluene t/a 0.322 0.322 0.088 0.088 Xylenes t/a 0.276 0.276 0.020 0.020
NOTES: t/a = tonnes per annum (year) IFRT = Internal Floating Roof Tank CRT = Cone Roof Tank VRU = Vapour Recovery Unit The “Other” category includes C2 to C4 and an unknown C5+ group (this latter group, based on measurements at a surrogate facility, could not be further speciated).
TOTAL Upgrader Supplemental Information Appendix G: Updated Air Quality Assessment
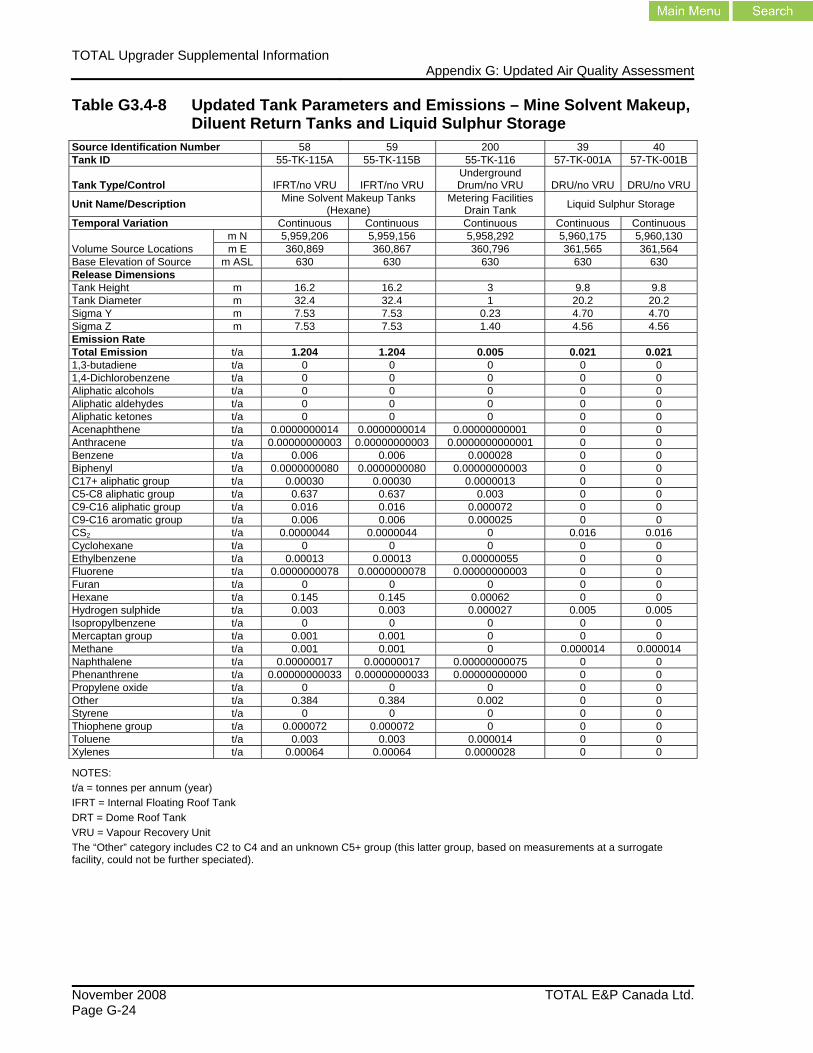
November 2008 TOTAL E&P Canada Ltd.Page G-24
Table G3.4-8 Updated Tank Parameters and Emissions – Mine Solvent Makeup, Diluent Return Tanks and Liquid Sulphur Storage
Source Identification Number 58 59 200 39 40 Tank ID 55-TK-115A 55-TK-115B 55-TK-116 57-TK-001A 57-TK-001B
Tank Type/Control IFRT/no VRU IFRT/no VRU Underground Drum/no VRU DRU/no VRU DRU/no VRU
Unit Name/Description Mine Solvent Makeup Tanks (Hexane)
Metering Facilities Drain Tank Liquid Sulphur Storage
Temporal Variation Continuous Continuous Continuous Continuous Continuous
Volume Source Locations m N 5,959,206 5,959,156 5,958,292 5,960,175 5,960,130 m E 360,869 360,867 360,796 361,565 361,564
Base Elevation of Source m ASL 630 630 630 630 630 Release Dimensions Tank Height m 16.2 16.2 3 9.8 9.8 Tank Diameter m 32.4 32.4 1 20.2 20.2 Sigma Y m 7.53 7.53 0.23 4.70 4.70 Sigma Z m 7.53 7.53 1.40 4.56 4.56 Emission Rate Total Emission t/a 1.204 1.204 0.005 0.021 0.021 1,3-butadiene t/a 0 0 0 0 0 1,4-Dichlorobenzene t/a 0 0 0 0 0 Aliphatic alcohols t/a 0 0 0 0 0 Aliphatic aldehydes t/a 0 0 0 0 0 Aliphatic ketones t/a 0 0 0 0 0 Acenaphthene t/a 0.0000000014 0.0000000014 0.00000000001 0 0 Anthracene t/a 0.00000000003 0.00000000003 0.0000000000001 0 0 Benzene t/a 0.006 0.006 0.000028 0 0 Biphenyl t/a 0.0000000080 0.0000000080 0.00000000003 0 0 C17+ aliphatic group t/a 0.00030 0.00030 0.0000013 0 0 C5-C8 aliphatic group t/a 0.637 0.637 0.003 0 0 C9-C16 aliphatic group t/a 0.016 0.016 0.000072 0 0 C9-C16 aromatic group t/a 0.006 0.006 0.000025 0 0 CS2 t/a 0.0000044 0.0000044 0 0.016 0.016 Cyclohexane t/a 0 0 0 0 0 Ethylbenzene t/a 0.00013 0.00013 0.00000055 0 0 Fluorene t/a 0.0000000078 0.0000000078 0.00000000003 0 0 Furan t/a 0 0 0 0 0 Hexane t/a 0.145 0.145 0.00062 0 0 Hydrogen sulphide t/a 0.003 0.003 0.000027 0.005 0.005 Isopropylbenzene t/a 0 0 0 0 0 Mercaptan group t/a 0.001 0.001 0 0 0 Methane t/a 0.001 0.001 0 0.000014 0.000014 Naphthalene t/a 0.00000017 0.00000017 0.00000000075 0 0 Phenanthrene t/a 0.00000000033 0.00000000033 0.00000000000 0 0 Propylene oxide t/a 0 0 0 0 0 Other t/a 0.384 0.384 0.002 0 0 Styrene t/a 0 0 0 0 0 Thiophene group t/a 0.000072 0.000072 0 0 0 Toluene t/a 0.003 0.003 0.000014 0 0 Xylenes t/a 0.00064 0.00064 0.0000028 0 0
NOTES: t/a = tonnes per annum (year) IFRT = Internal Floating Roof Tank DRT = Dome Roof Tank VRU = Vapour Recovery Unit The “Other” category includes C2 to C4 and an unknown C5+ group (this latter group, based on measurements at a surrogate facility, could not be further speciated).
TOTAL Upgrader Supplemental InformationAppendix G: Updated Air Quality Assessment
TOTAL E&P Canada Ltd. November 2008 Page G-25
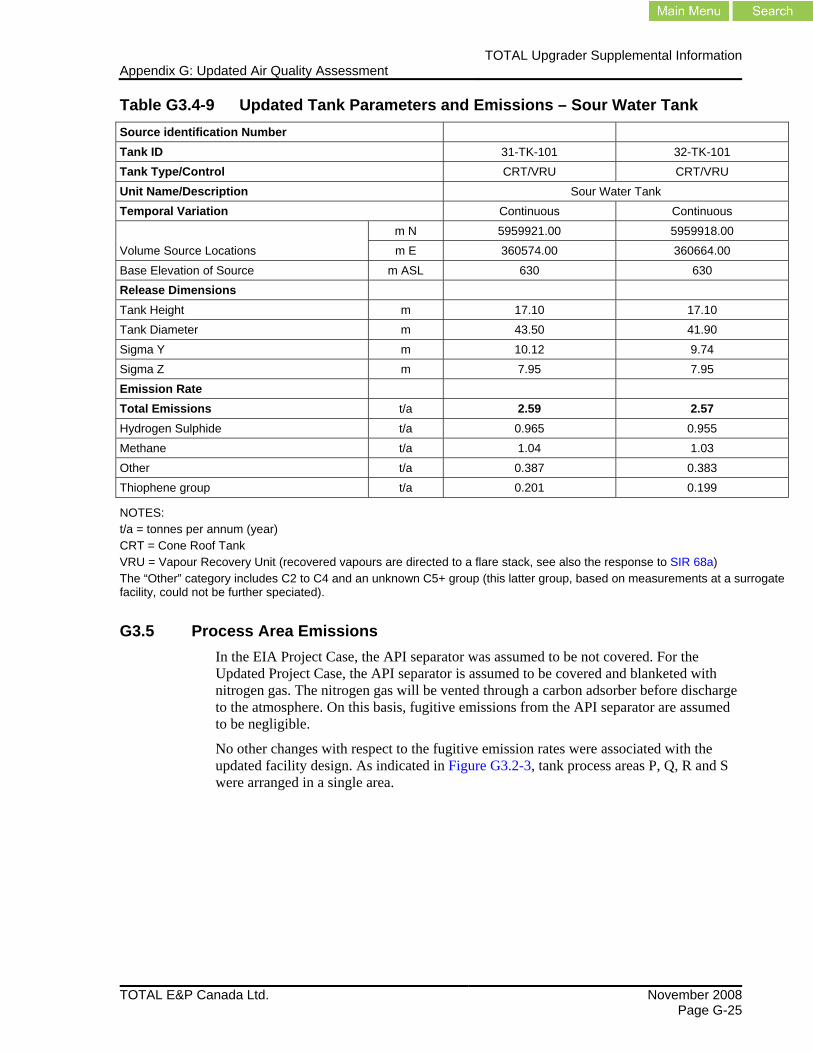
Table G3.4-9 Updated Tank Parameters and Emissions – Sour Water Tank Source identification Number Tank ID 31-TK-101 32-TK-101 Tank Type/Control CRT/VRU CRT/VRU Unit Name/Description Sour Water Tank Temporal Variation Continuous Continuous
Volume Source Locations m N 5959921.00 5959918.00 m E 360574.00 360664.00
Base Elevation of Source m ASL 630 630 Release Dimensions Tank Height m 17.10 17.10 Tank Diameter m 43.50 41.90 Sigma Y m 10.12 9.74 Sigma Z m 7.95 7.95 Emission Rate Total Emissions t/a 2.59 2.57 Hydrogen Sulphide t/a 0.965 0.955 Methane t/a 1.04 1.03 Other t/a 0.387 0.383 Thiophene group t/a 0.201 0.199
NOTES: t/a = tonnes per annum (year) CRT = Cone Roof Tank VRU = Vapour Recovery Unit (recovered vapours are directed to a flare stack, see also the response to SIR 68a) The “Other” category includes C2 to C4 and an unknown C5+ group (this latter group, based on measurements at a surrogate facility, could not be further speciated).
G3.5 Process Area Emissions In the EIA Project Case, the API separator was assumed to be not covered. For the Updated Project Case, the API separator is assumed to be covered and blanketed with nitrogen gas. The nitrogen gas will be vented through a carbon adsorber before discharge to the atmosphere. On this basis, fugitive emissions from the API separator are assumed to be negligible.
No other changes with respect to the fugitive emission rates were associated with the updated facility design. As indicated in Figure G3.2-3, tank process areas P, Q, R and S were arranged in a single area.
TOTAL Upgrader Supplemental Information Appendix G: Updated Air Quality Assessment
November 2008 TOTAL E&P Canada Ltd.Page G-26
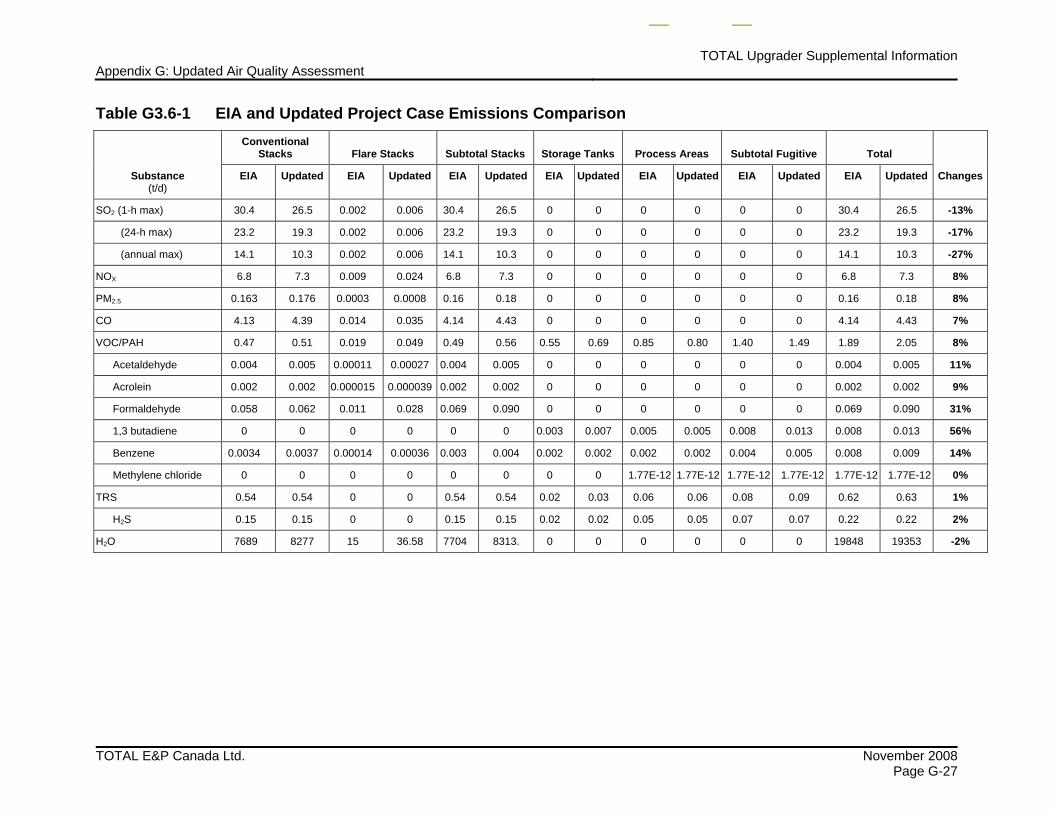
G3.6 Comparison of EIA and Updated Project Emissions For a comparison of EIA project emissions with those associated with the updated facility design, see Table G3.6-1. The comparison indicates that:
• SO2 emissions associated with the upgrader have decreased by 13 to 27%, depending on the averaging period and the corresponding sulphur recovery assumption. The reduced sulphur content in the fuel gas has reduced combustion SO2 emissions from 5.1 to 1.3 t/d (a decrease of 3.8 t/d).
• NOX, CO and PM2.5 emissions have increased by about 7 to 8%, due to increased fuel consumption. The increases are slightly different for each substance since the emission factors applied to conventional burners are different from those applied to flare stacks.
• VOC emissions have increased by 8% due to increased fuel consumption and due to changes in assumptions about the requirement for vapour recovery on some tanks described in the Integrated Application (see also the response to SIR 66a and SIR 66f).
• greenhouse gas emissions from combustion and fugitive sources have increased by 8%, primarily due to increased fuel consumption
• water vapour emissions from the cooling tower facilities have decreased by about 2%
Table G3.6-1 also compares the EIA and updated project emissions for selected VOC and total reduced sulphur (TRS) compounds. These compounds were selected to represent the VOC and TRS groups since they were identified in the Human Health Risk Assessment (HHRA) in the Integrated Application, Volume 2, Section 14, as having relatively high exposure ratios. The following section evaluates the air quality implications of these emission source changes relative to those provided in the EIA Project Case.
TOTAL Upgrader Supplemental InformationAppendix G: Updated Air Quality Assessment
TOTAL E&P Canada Ltd. November 2008 Page G-27
Table G3.6-1 EIA and Updated Project Case Emissions Comparison
Substance (t/d)
Conventional Stacks Flare Stacks Subtotal Stacks Storage Tanks Process Areas Subtotal Fugitive Total
Changes
EIA
Updated
EIA
Updated
EIA
Updated
EIA
Updated
EIA
Updated
EIA
Updated
EIA
Updated
SO2 (1-h max) 30.4 26.5 0.002 0.006 30.4 26.5 0 0 0 0 0 0 30.4 26.5 -13%
(24-h max) 23.2 19.3 0.002 0.006 23.2 19.3 0 0 0 0 0 0 23.2 19.3 -17%
(annual max) 14.1 10.3 0.002 0.006 14.1 10.3 0 0 0 0 0 0 14.1 10.3 -27%
NOX 6.8 7.3 0.009 0.024 6.8 7.3 0 0 0 0 0 0 6.8 7.3 8%
PM2.5 0.163 0.176 0.0003 0.0008 0.16 0.18 0 0 0 0 0 0 0.16 0.18 8%
CO 4.13 4.39 0.014 0.035 4.14 4.43 0 0 0 0 0 0 4.14 4.43 7%
VOC/PAH 0.47 0.51 0.019 0.049 0.49 0.56 0.55 0.69 0.85 0.80 1.40 1.49 1.89 2.05 8%
Acetaldehyde 0.004 0.005 0.00011 0.00027 0.004 0.005 0 0 0 0 0 0 0.004 0.005 11%
Acrolein 0.002 0.002 0.000015 0.000039 0.002 0.002 0 0 0 0 0 0 0.002 0.002 9%
Formaldehyde 0.058 0.062 0.011 0.028 0.069 0.090 0 0 0 0 0 0 0.069 0.090 31%
1,3 butadiene 0 0 0 0 0 0 0.003 0.007 0.005 0.005 0.008 0.013 0.008 0.013 56%
Benzene 0.0034 0.0037 0.00014 0.00036 0.003 0.004 0.002 0.002 0.002 0.002 0.004 0.005 0.008 0.009 14%
Methylene chloride 0 0 0 0 0 0 0 0 1.77E-12 1.77E-12 1.77E-12 1.77E-12 1.77E-12 1.77E-12 0%
TRS 0.54 0.54 0 0 0.54 0.54 0.02 0.03 0.06 0.06 0.08 0.09 0.62 0.63 1%
H2S 0.15 0.15 0 0 0.15 0.15 0.02 0.02 0.05 0.05 0.07 0.07 0.22 0.22 2%
H2O 7689 8277 15 36.58 7704 8313. 0 0 0 0 0 0 19848 19353 -2%
TOTAL Upgrader Supplemental Information Appendix G: Updated Air Quality Assessment
November 2008 TOTAL E&P Canada Ltd.Page G-28
Table G3.6-1 EIA and Updated Project Case Emissions Comparison (cont’d)
Substance (t/d)
Conventional Stacks Flare Stacks Subtotal Stacks Storage Tanks Process Areas Subtotal Fugitive Total
Changes
EIA
Updated
EIA
Updated
EIA
Updated
EIA
Updated
EIA
Updated
EIA
Updated
EIA
Updated
Greenhouse Gas Emissions
CO2 8701 9363 16 41.3 8718 9404 0 0 0 0 0 0 8718 9404 8%
Methane 0.18 0.20 0.0004 0.001 0.18 0.197 0.036 0.040 0.667 0.658 0.703 0.698 0.884 0.899 2%
N2O 0.16 0.18 0.0003 0.001 0.16 0.175 0 0 0 0 0 0.16 0.175 10%
CO2e 8755 9421 17 41.6 8771 9463 0.764 0.845 14.0 13.8 14.8 14.7 8786 9479 8%
NOTES:
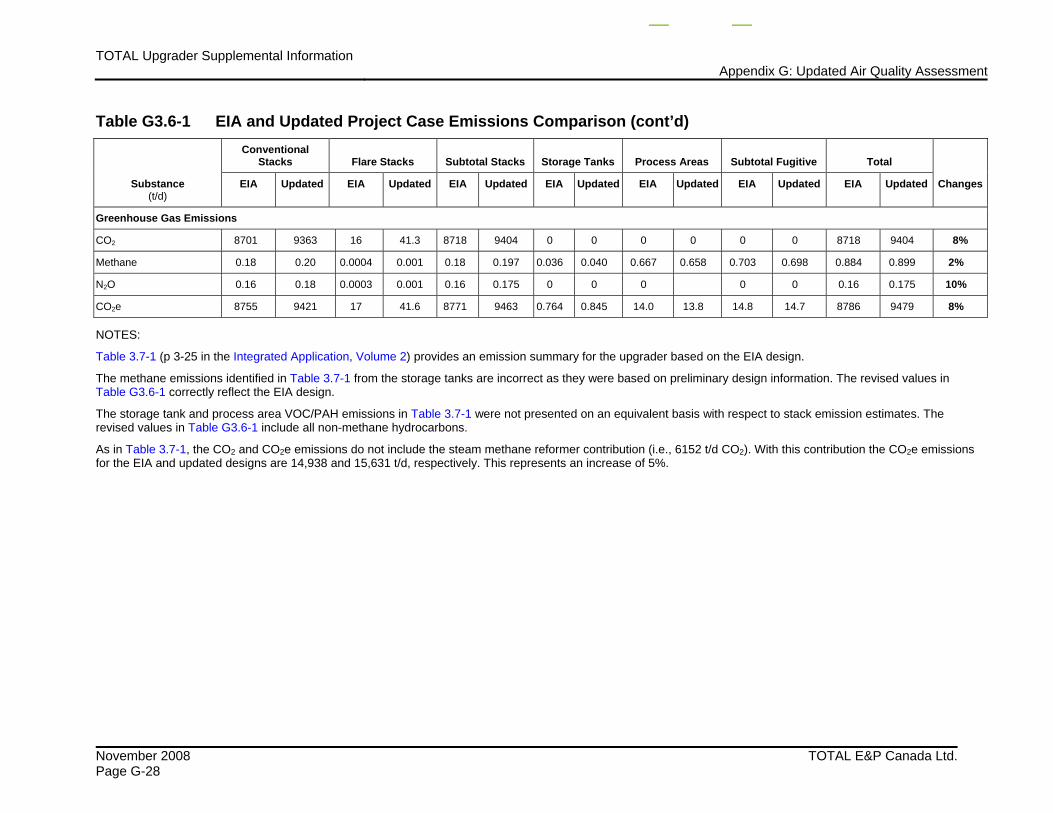
Table 3.7-1 (p 3-25 in the Integrated Application, Volume 2) provides an emission summary for the upgrader based on the EIA design.
The methane emissions identified in Table 3.7-1 from the storage tanks are incorrect as they were based on preliminary design information. The revised values in Table G3.6-1 correctly reflect the EIA design.
The storage tank and process area VOC/PAH emissions in Table 3.7-1 were not presented on an equivalent basis with respect to stack emission estimates. The revised values in Table G3.6-1 include all non-methane hydrocarbons.
As in Table 3.7-1, the CO2 and CO2e emissions do not include the steam methane reformer contribution (i.e., 6152 t/d CO2). With this contribution the CO2e emissions for the EIA and updated designs are 14,938 and 15,631 t/d, respectively. This represents an increase of 5%.
TOTAL Upgrader Supplemental InformationAppendix G: Updated Air Quality Assessment
TOTAL E&P Canada Ltd. November 2008 Page G-29
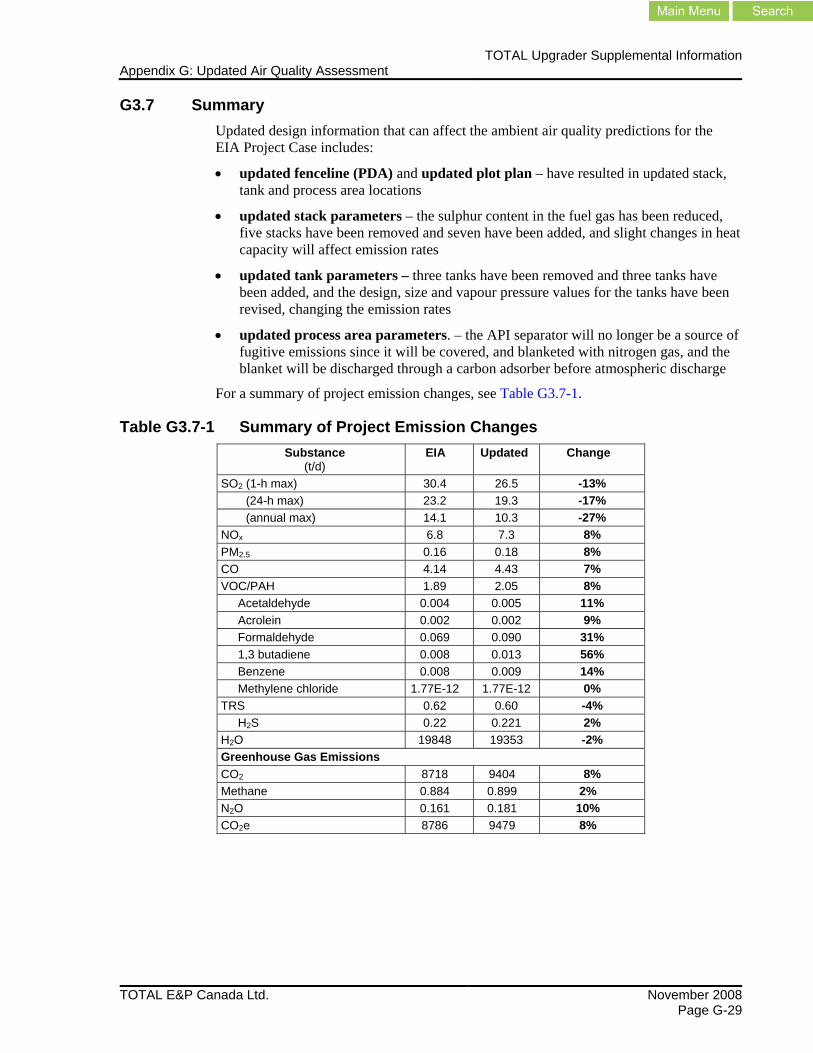
G3.7 Summary Updated design information that can affect the ambient air quality predictions for the EIA Project Case includes:
• updated fenceline (PDA) and updated plot plan – have resulted in updated stack, tank and process area locations
• updated stack parameters – the sulphur content in the fuel gas has been reduced, five stacks have been removed and seven have been added, and slight changes in heat capacity will affect emission rates
• updated tank parameters – three tanks have been removed and three tanks have been added, and the design, size and vapour pressure values for the tanks have been revised, changing the emission rates
• updated process area parameters. – the API separator will no longer be a source of fugitive emissions since it will be covered, and blanketed with nitrogen gas, and the blanket will be discharged through a carbon adsorber before atmospheric discharge
For a summary of project emission changes, see Table G3.7-1.
Table G3.7-1 Summary of Project Emission Changes Substance
(t/d) EIA
Updated
Change
SO2 (1-h max) 30.4 26.5 -13% (24-h max) 23.2 19.3 -17% (annual max) 14.1 10.3 -27% NOx 6.8 7.3 8% PM2.5 0.16 0.18 8% CO 4.14 4.43 7% VOC/PAH 1.89 2.05 8% Acetaldehyde 0.004 0.005 11% Acrolein 0.002 0.002 9% Formaldehyde 0.069 0.090 31% 1,3 butadiene 0.008 0.013 56% Benzene 0.008 0.009 14% Methylene chloride 1.77E-12 1.77E-12 0% TRS 0.62 0.60 -4% H2S 0.22 0.221 2% H2O 19848 19353 -2% Greenhouse Gas Emissions CO2 8718 9404 8% Methane 0.884 0.899 2% N2O 0.161 0.181 10% CO2e 8786 9479 8%
TOTAL Upgrader Supplemental Information Appendix G: Updated Air Quality Assessment
November 2008 TOTAL E&P Canada Ltd.Page G-30
Key emission changes are as follows:
• SO2 emissions have decreased due to the reduced sulphur compound content in the fuel gas.
• NOX, PM2.5, CO and greenhouse gas emissions have increased due to the change in firing capacities.
• VOC emissions have increased by 8%, primarily due to increased fuel consumption and due to changes in assumptions about the requirement for vapour recovery on some tanks described in the Integrated Application.
G4 Results
G4.1 Normal Stack Predictions
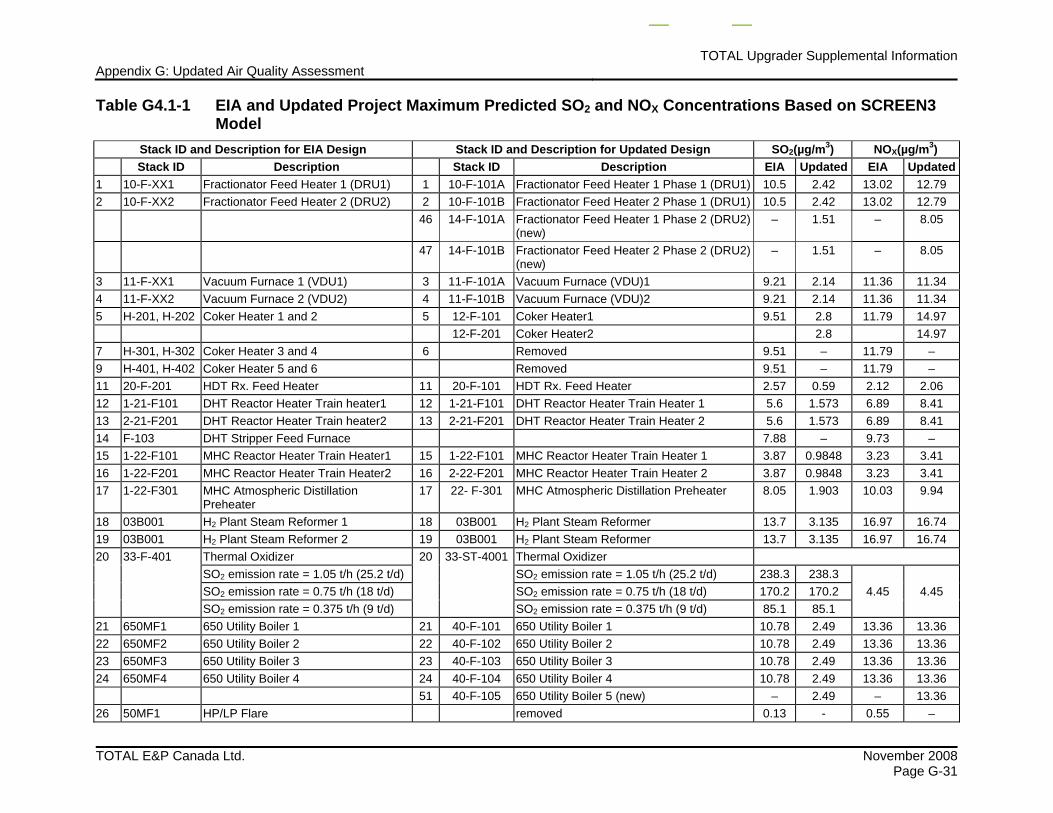
G4.1.1 SCREEN3 Predictions The SCREEN3 model was used in the EIA to evaluate maximum ground-level SO2 and NOX concentrations from each of the project stacks. For a comparison of the maximum predicted concentrations associated with the EIA stack assumptions with the updated stack assumptions, see Table G4.1-1. As in the EIA, the maxima for the individual stacks were added to provide an indicator of the combined facility maximum even though the individual maxima occur in different locations and may occur at different times. The results demonstrate that:
• the maximum SO2 concentration for each boiler/heater type of stack decreases due to the reduced sulphur content of the fuel gas
• the maximum SO2 concentrations due to the thermal oxidizer stack remains the same as the parameters for this stack did not change
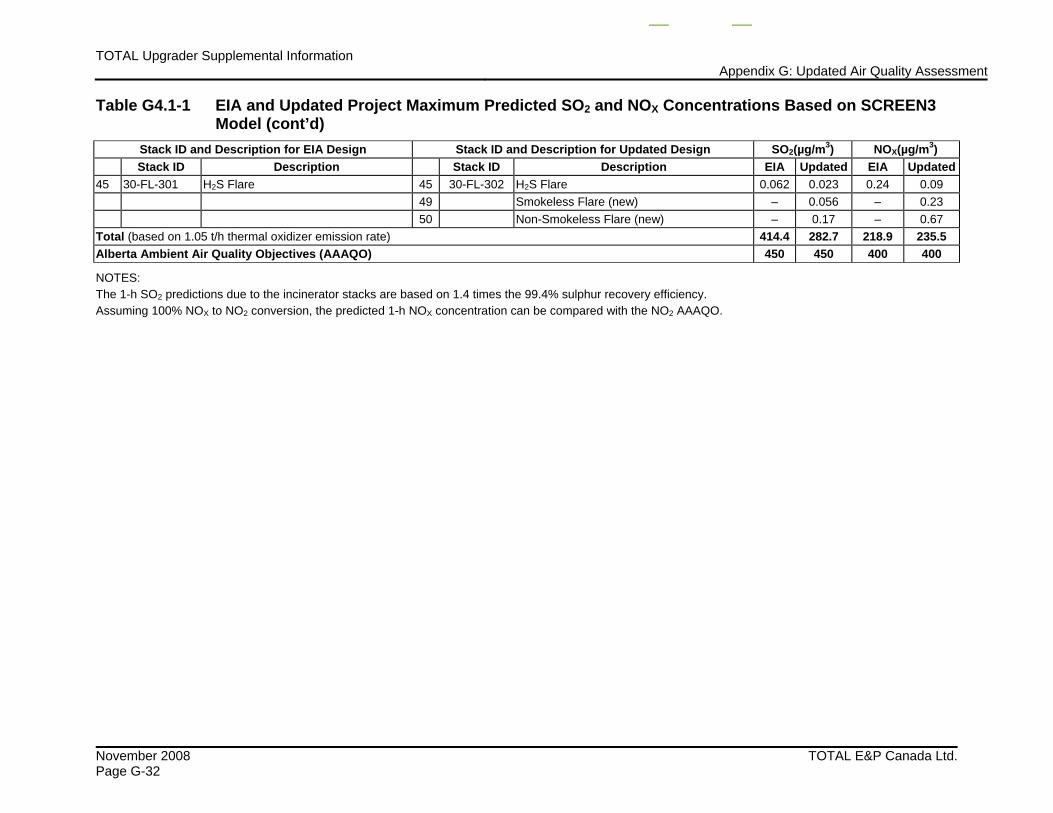
• the total maximum SO2 concentration decreases from 414 µg/m3 to 269 µg/m3; this is a decrease of 35%
• the maximum NOx concentration for each boiler/heater type of stack show some increases and some decreases, depending on the direction of the fuel gas consumption change
• total maximum NOX concentrations increase from 219 µg/m3 to 236 µg/m3, an increase of 8%, primarily due to an additional utility boiler
The maximum predicted SO2 concentration due to the upgrader (for both the EIA Project Case and Updated Project Case) is less than the 1-h average AAAQO of 450 µg/m3. If all NO is conservatively assumed to be in the form of NO2, then the maximum predicted NO2 concentration due to the upgrader (for both the EIA Project Case and updated Project Case) is less than the 1-h average AAAQO of 400 µg/m3.
TOTAL Upgrader Supplemental InformationAppendix G: Updated Air Quality Assessment
TOTAL E&P Canada Ltd. November 2008 Page G-31
Table G4.1-1 EIA and Updated Project Maximum Predicted SO2 and NOX Concentrations Based on SCREEN3 Model
Stack ID and Description for EIA Design Stack ID and Description for Updated Design SO2(µg/m3) NOX(µg/m3) Stack ID Description Stack ID Description EIA Updated EIA Updated
1 10-F-XX1 Fractionator Feed Heater 1 (DRU1) 1 10-F-101A Fractionator Feed Heater 1 Phase 1 (DRU1) 10.5 2.42 13.02 12.79 2 10-F-XX2 Fractionator Feed Heater 2 (DRU2) 2 10-F-101B Fractionator Feed Heater 2 Phase 1 (DRU1) 10.5 2.42 13.02 12.79 46 14-F-101A Fractionator Feed Heater 1 Phase 2 (DRU2)
(new) – 1.51 – 8.05
47 14-F-101B Fractionator Feed Heater 2 Phase 2 (DRU2) (new)
– 1.51 – 8.05
3 11-F-XX1 Vacuum Furnace 1 (VDU1) 3 11-F-101A Vacuum Furnace (VDU)1 9.21 2.14 11.36 11.34 4 11-F-XX2 Vacuum Furnace 2 (VDU2) 4 11-F-101B Vacuum Furnace (VDU)2 9.21 2.14 11.36 11.34 5 H-201, H-202 Coker Heater 1 and 2 5 12-F-101 Coker Heater1 9.51 2.8 11.79 14.97 12-F-201 Coker Heater2 2.8 14.97 7 H-301, H-302 Coker Heater 3 and 4 6 Removed 9.51 – 11.79 – 9 H-401, H-402 Coker Heater 5 and 6 Removed 9.51 – 11.79 – 11 20-F-201 HDT Rx. Feed Heater 11 20-F-101 HDT Rx. Feed Heater 2.57 0.59 2.12 2.06 12 1-21-F101 DHT Reactor Heater Train heater1 12 1-21-F101 DHT Reactor Heater Train Heater 1 5.6 1.573 6.89 8.41 13 2-21-F201 DHT Reactor Heater Train heater2 13 2-21-F201 DHT Reactor Heater Train Heater 2 5.6 1.573 6.89 8.41 14 F-103 DHT Stripper Feed Furnace 7.88 – 9.73 – 15 1-22-F101 MHC Reactor Heater Train Heater1 15 1-22-F101 MHC Reactor Heater Train Heater 1 3.87 0.9848 3.23 3.41 16 1-22-F201 MHC Reactor Heater Train Heater2 16 2-22-F201 MHC Reactor Heater Train Heater 2 3.87 0.9848 3.23 3.41 17 1-22-F301 MHC Atmospheric Distillation
Preheater 17 22- F-301 MHC Atmospheric Distillation Preheater 8.05 1.903 10.03 9.94
18 03B001 H2 Plant Steam Reformer 1 18 03B001 H2 Plant Steam Reformer 13.7 3.135 16.97 16.74 19 03B001 H2 Plant Steam Reformer 2 19 03B001 H2 Plant Steam Reformer 13.7 3.135 16.97 16.74 20 33-F-401 Thermal Oxidizer 20 33-ST-4001 Thermal Oxidizer SO2 emission rate = 1.05 t/h (25.2 t/d) SO2 emission rate = 1.05 t/h (25.2 t/d) 238.3 238.3
4.45 4.45 SO2 emission rate = 0.75 t/h (18 t/d) SO2 emission rate = 0.75 t/h (18 t/d) 170.2 170.2 SO2 emission rate = 0.375 t/h (9 t/d) SO2 emission rate = 0.375 t/h (9 t/d) 85.1 85.1 21 650MF1 650 Utility Boiler 1 21 40-F-101 650 Utility Boiler 1 10.78 2.49 13.36 13.36 22 650MF2 650 Utility Boiler 2 22 40-F-102 650 Utility Boiler 2 10.78 2.49 13.36 13.36 23 650MF3 650 Utility Boiler 3 23 40-F-103 650 Utility Boiler 3 10.78 2.49 13.36 13.36 24 650MF4 650 Utility Boiler 4 24 40-F-104 650 Utility Boiler 4 10.78 2.49 13.36 13.36 51 40-F-105 650 Utility Boiler 5 (new) – 2.49 – 13.36 26 50MF1 HP/LP Flare removed 0.13 - 0.55 –
TOTAL Upgrader Supplemental Information Appendix G: Updated Air Quality Assessment
November 2008 TOTAL E&P Canada Ltd.Page G-32
Table G4.1-1 EIA and Updated Project Maximum Predicted SO2 and NOX Concentrations Based on SCREEN3 Model (cont’d)
Stack ID and Description for EIA Design Stack ID and Description for Updated Design SO2(µg/m3) NOX(µg/m3) Stack ID Description Stack ID Description EIA Updated EIA Updated
45 30-FL-301 H2S Flare 45 30-FL-302 H2S Flare 0.062 0.023 0.24 0.09 49 Smokeless Flare (new) – 0.056 – 0.23
50 Non-Smokeless Flare (new) – 0.17 – 0.67 Total (based on 1.05 t/h thermal oxidizer emission rate) 414.4 282.7 218.9 235.5 Alberta Ambient Air Quality Objectives (AAAQO) 450 450 400 400
NOTES: The 1-h SO2 predictions due to the incinerator stacks are based on 1.4 times the 99.4% sulphur recovery efficiency. Assuming 100% NOX to NO2 conversion, the predicted 1-h NOX concentration can be compared with the NO2 AAAQO.
TOTAL Upgrader Supplemental InformationAppendix G: Updated Air Quality Assessment
TOTAL E&P Canada Ltd. November 2008 Page G-33
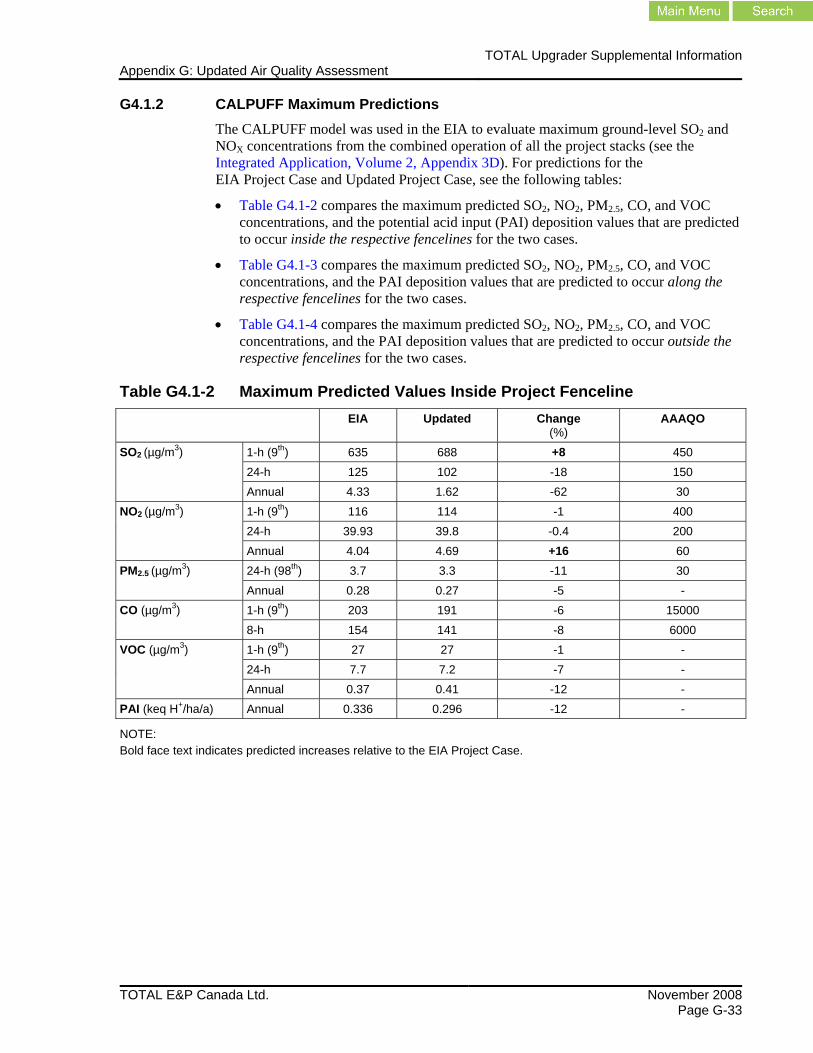
G4.1.2 CALPUFF Maximum Predictions The CALPUFF model was used in the EIA to evaluate maximum ground-level SO2 and NOX concentrations from the combined operation of all the project stacks (see the Integrated Application, Volume 2, Appendix 3D). For predictions for the EIA Project Case and Updated Project Case, see the following tables:
• Table G4.1-2 compares the maximum predicted SO2, NO2, PM2.5, CO, and VOC concentrations, and the potential acid input (PAI) deposition values that are predicted to occur inside the respective fencelines for the two cases.
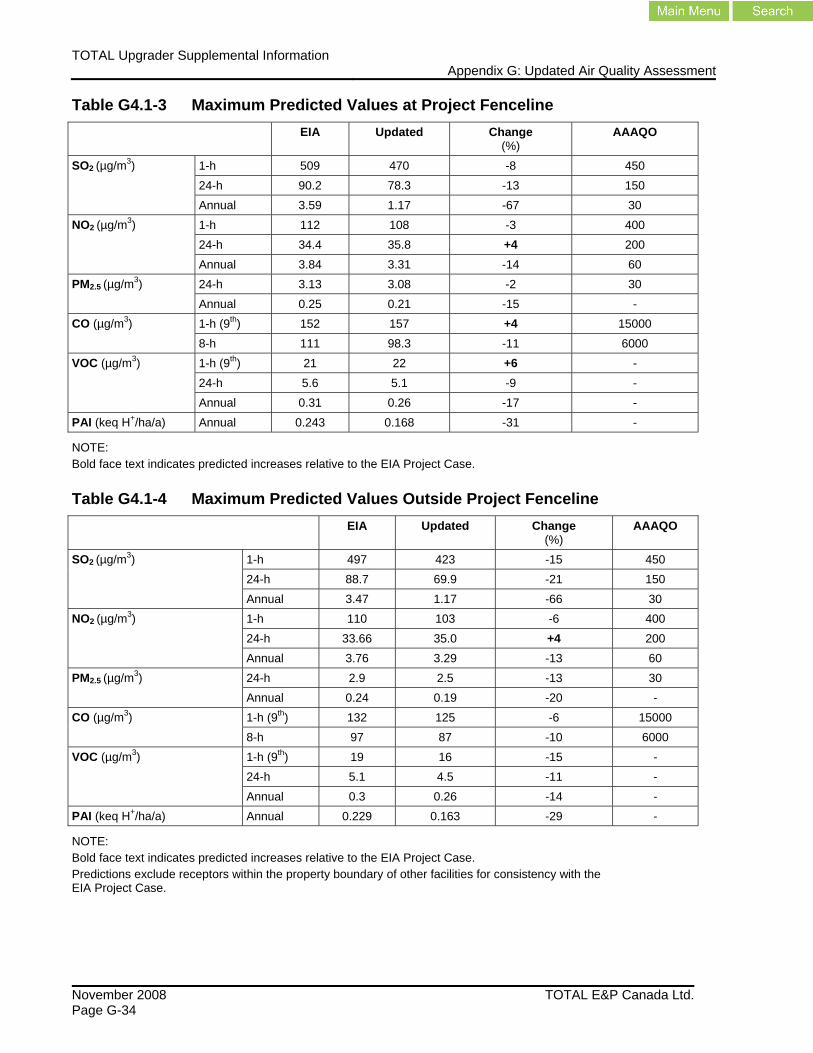
• Table G4.1-3 compares the maximum predicted SO2, NO2, PM2.5, CO, and VOC concentrations, and the PAI deposition values that are predicted to occur along the respective fencelines for the two cases.
• Table G4.1-4 compares the maximum predicted SO2, NO2, PM2.5, CO, and VOC concentrations, and the PAI deposition values that are predicted to occur outside the respective fencelines for the two cases.
Table G4.1-2 Maximum Predicted Values Inside Project Fenceline
EIA
Updated
Change
(%) AAAQO
SO2 (µg/m3) 1-h (9th) 635 688 +8 450
24-h 125 102 -18 150 Annual 4.33 1.62 -62 30
NO2 (µg/m3) 1-h (9th) 116 114 -1 400 24-h 39.93 39.8 -0.4 200 Annual 4.04 4.69 +16 60
PM2.5 (µg/m3) 24-h (98th) 3.7 3.3 -11 30 Annual 0.28 0.27 -5 -
CO (µg/m3) 1-h (9th) 203 191 -6 15000 8-h 154 141 -8 6000
VOC (µg/m3) 1-h (9th) 27 27 -1 - 24-h 7.7 7.2 -7 - Annual 0.37 0.41 -12 -
PAI (keq H+/ha/a) Annual 0.336 0.296 -12 -
NOTE: Bold face text indicates predicted increases relative to the EIA Project Case.
TOTAL Upgrader Supplemental Information Appendix G: Updated Air Quality Assessment
November 2008 TOTAL E&P Canada Ltd.Page G-34
Table G4.1-3 Maximum Predicted Values at Project Fenceline EIA
Updated
Change
(%) AAAQO
SO2 (µg/m3) 1-h 509 470 -8 450
24-h 90.2 78.3 -13 150 Annual 3.59 1.17 -67 30
NO2 (µg/m3) 1-h 112 108 -3 400 24-h 34.4 35.8 +4 200 Annual 3.84 3.31 -14 60
PM2.5 (µg/m3) 24-h 3.13 3.08 -2 30 Annual 0.25 0.21 -15 -
CO (µg/m3) 1-h (9th) 152 157 +4 15000 8-h 111 98.3 -11 6000
VOC (µg/m3) 1-h (9th) 21 22 +6 - 24-h 5.6 5.1 -9 - Annual 0.31 0.26 -17 -
PAI (keq H+/ha/a) Annual 0.243 0.168 -31 -
NOTE: Bold face text indicates predicted increases relative to the EIA Project Case.
Table G4.1-4 Maximum Predicted Values Outside Project Fenceline
EIA
Updated
Change
(%) AAAQO
SO2 (µg/m3) 1-h 497 423 -15 450
24-h 88.7 69.9 -21 150 Annual 3.47 1.17 -66 30
NO2 (µg/m3) 1-h 110 103 -6 400 24-h 33.66 35.0 +4 200 Annual 3.76 3.29 -13 60
PM2.5 (µg/m3) 24-h 2.9 2.5 -13 30 Annual 0.24 0.19 -20 -
CO (µg/m3) 1-h (9th) 132 125 -6 15000 8-h 97 87 -10 6000
VOC (µg/m3) 1-h (9th) 19 16 -15 - 24-h 5.1 4.5 -11 - Annual 0.3 0.26 -14 -
PAI (keq H+/ha/a) Annual 0.229 0.163 -29 -
NOTE: Bold face text indicates predicted increases relative to the EIA Project Case. Predictions exclude receptors within the property boundary of other facilities for consistency with the EIA Project Case.
TOTAL Upgrader Supplemental InformationAppendix G: Updated Air Quality Assessment
TOTAL E&P Canada Ltd. November 2008 Page G-35
The predicted differences for the two cases depend on the changes in the emission parameters, the locations of the emission sources and the location of the receptors. As the AAAQO are applicable at and outside the fencelines, the following general comments apply in this context:
• Maximum predicted SO2 concentrations for the Updated Project Case are predicted to decrease (by -8 to -67%) for all averaging periods. The maximum predicted PAI deposition for the Updated Project Case also decreases (by -29 to -31%). The predicted concentration and PAI deposition decreases are consistent with the SO2 emissions that decrease by 13 to 27%.
• Maximum predicted NO2 concentrations for the Updated Project Case decrease (by -3 to -14%) for the 1-h and annual averaging periods and increase (by 4%) for the 24-h averaging period. The NO2 emissions associated with the Updated Project Case increase by 8%.
• Maximum predicted PM2.5 concentrations for the Updated Project Case are predicted to decrease (by -6 to -20%) for all averaging periods. While the primary PM2.5 emissions associated with the Updated Project Case increase by 8%, precursor SO2 emissions decrease by 13 to 27%.
• Maximum predicted CO concentrations for the Updated Project Case generally decrease (by -6 to -17%); however, there is an increase (by 4%) for the 1-h averaging period along the fenceline. The CO emissions associated with the Updated Project Case increase by 7%.
• Maximum predicted VOC concentrations for the Updated Project Case generally decrease (by -9 to -17%); however, there is an increase (by 6%) for the 1-h averaging period along the fenceline. The VOC emissions associated with the Updated Project Case increase by 8%.
G4.1.3 CALPUFF Maximum Predictions for the Human Health Risk Assessment For the Human Health Risk Assessment (HHRA) receptor locations, maximum predicted concentrations associated with each receptor class for the EIA Project Case were compared with the Updated Project Case. For a comparison of maximum predicted SO2, NO2, PM2.5, CO, acetaldehyde, acrolein, formaldehyde, H2S, 1,3-butadiene and benzene concentrations for the two cases, see Table G4.1-5 and Table G4.1-6.
The following describes the use of receptors in the air and HHRA:
• The HHRA provided an assessment for six receptor groups (i.e., Agricultural, Residential, Industrial, Public Use Areas, Monitoring and Fenceline). While the air quality assessment evaluated these six receptor types, the air quality assessment section of the EIA presented results for only four of these receptor groups:
• Agricultural/Residential (i.e., Agricultural) • Residential/Community (i.e., Residential) • Commercial/Industrial (i.e., Industrial) • Public Access (i.e., Public Use Areas)
• The HHRA conservatively included Agricultural receptors located within the property lines of planned development projects. The air quality assessment section of the EIA excluded these receptors from the analysis.
TOTAL Upgrader Supplemental Information Appendix G: Updated Air Quality Assessment
November 2008 TOTAL E&P Canada Ltd.Page G-36
For this updated project assessment, the receptor groups and Agricultural receptors are consistent for both the updated air quality assessment and updated HHRA.
Results of the EIA Project Case and Updated Project Case comparison for each receptor group are as follows:
Agricultural/Residential Group There are increases and decreases for these receptors, depending on the substance and the averaging period. Maximum values that increase by 10% or more include NO2 (24-h, 16%), 1,3-butadiene (all averaging periods, 30 to 68%) and methylene chloride (1-h and annual, 47% and 53%).
While the maximum H2S concentrations are predicted to decrease, the maximum 1-h and 24-h H2S concentrations are still predicted to exceed the respective AAAQO of 14 and 4 µg/m3. These maximum concentrations are predicted to occur at an agricultural receptor located within a planned development north of the upgrader.
Maximum 1-h H2S concentrations of 13 to 14 µg/m3 are predicted to occur at two agricultural receptors south of the upgrader. One exceedance per year is predicted to occur at one of the receptors. The 24-h AAQO is predicted to be exceeded 2 and 4 days per year at this receptor. Similar values were predicted for the EIA Project Case.
Residential/Community Group There are increases and decreases for these receptors, depending on the substance and the averaging period. Maximum values that increase by 10% or more include 1,3-butadiene (all averaging periods, 28 to 43%) and formaldehyde (1-h, 12%).
Commercial/Industrial Group There are increases and decreases for these receptors, depending on the substance and the averaging period. Maximum values that increase by 10% or more include NO2 (annual, 27%), PM2.5 (24-h, 13%), 1,3-butadiene (1-h and annual, 24 and 68%), acetaldehyde (annual, by 29%), acrolein (annual, 27%), formaldehyde (1-h and annual, 16 and 68%) and methylene chloride (1-h and annual, 22 and 37%). The highest increases are predicted to occur at a nearby industrial receptor adjacent to the southern boundary of the upgrader site.
While the maximum H2S concentrations are predicted to decrease, the maximum 1-h and 24-h H2S concentrations are still predicted to exceed the respective AAAQO of 14 and 4 µg/m3. The maximum 1-h concentration is predicted to occur at an industrial facility north of the upgrader. The maximum 24-h concentration is predicted to occur at an industrial receptor adjacent to the southern boundary of the upgrader site.
Public Access Group There are increases and decreases for these receptors, depending on the substance and the averaging period. Maximum values that increase by 10% or more include NO2 (24-h, 12%), 1,3-butadiene (all averaging periods, 51 to 60%) and methylene chloride (1-h and 24-h, 14 and 17%). The highest increases are predicted in the Astotin Natural Area.
TOTAL Upgrader Supplemental InformationAppendix G: Updated Air Quality Assessment
TOTAL E&P Canada Ltd. November 2008 Page G-37
Monitoring Station Group There are increases and decreases for these receptors, depending on the substance and the averaging period. Maximum values that increase by 10% or more include NO2 (annual, 11%), 1,3-butadiene (1-h, 12%), acetaldehyde (annual, 13%), acrolein (annual, 12%) and formaldehyde (annual, 22%). The highest increases are located at the Range Road 220 and Scotford monitoring stations, which are the closest monitoring stations to the PDA.
Fenceline Group There are increases and decreases for these receptors, depending on the substance and the averaging period. Maximum values that increase by 10% or more include 1,3-butadiene (1-7, 10%, annual, 16%), formaldehyde (1-h, 37%) and methylene chloride (1-h and annual, 25 and 82%).
While the maximum H2S concentrations are predicted to decrease, the maximum 1-h and 24-h H2S concentrations are still predicted to exceed the respective AAAQO of 14 and 4 µg/m3. The maximum concentrations are predicted to occur along the northern boundary of the upgrader site.
Summary This comparison focused on comparing maximum values associated with the EIA Project Case and Updated Project Case. These maximum values are only one indicator of the predicted concentration changes associated with the two project cases. An indicated decrease in the tables might not mean a decrease at every receptor, and an indicated increase in the tables might not indicate that reductions do not happen at some receptors. Only increases of 10% or more have been flagged in the text; as indicated in the tables, there are also substantial decreases.
For a discussion of the implications of these changes on human health, see Appendix H.
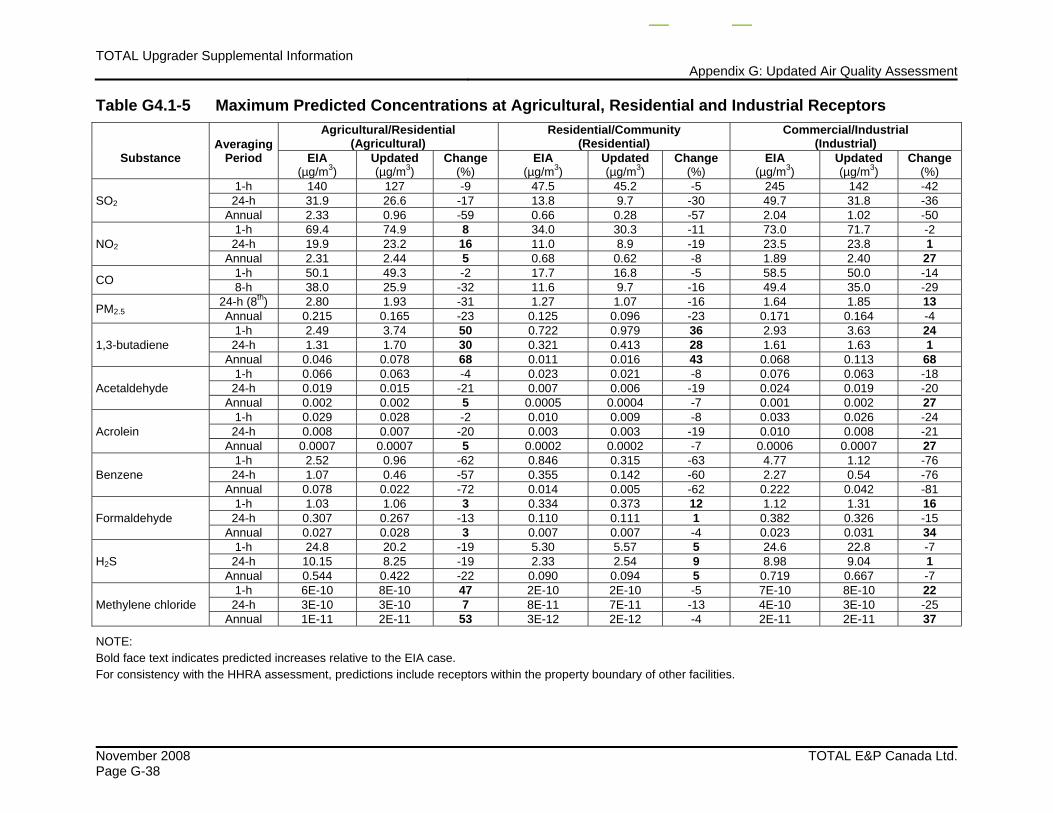
TOTAL Upgrader Supplemental Information Appendix G: Updated Air Quality Assessment
November 2008 TOTAL E&P Canada Ltd.Page G-38
Table G4.1-5 Maximum Predicted Concentrations at Agricultural, Residential and Industrial Receptors
Substance
Averaging Period
Agricultural/Residential (Agricultural)
Residential/Community (Residential)
Commercial/Industrial (Industrial)
EIA(µg/m3)
Updated(µg/m3)
Change (%)
EIA(µg/m3)
Updated (µg/m3)
Change(%)
EIA(µg/m3)
Updated(µg/m3)
Change(%)
SO2 1-h 140 127 -9 47.5 45.2 -5 245 142 -42 24-h 31.9 26.6 -17 13.8 9.7 -30 49.7 31.8 -36
Annual 2.33 0.96 -59 0.66 0.28 -57 2.04 1.02 -50
NO2 1-h 69.4 74.9 8 34.0 30.3 -11 73.0 71.7 -2 24-h 19.9 23.2 16 11.0 8.9 -19 23.5 23.8 1
Annual 2.31 2.44 5 0.68 0.62 -8 1.89 2.40 27
CO 1-h 50.1 49.3 -2 17.7 16.8 -5 58.5 50.0 -14 8-h 38.0 25.9 -32 11.6 9.7 -16 49.4 35.0 -29
PM2.5 24-h (8th) 2.80 1.93 -31 1.27 1.07 -16 1.64 1.85 13Annual 0.215 0.165 -23 0.125 0.096 -23 0.171 0.164 -4
1,3-butadiene 1-h 2.49 3.74 50 0.722 0.979 36 2.93 3.63 2424-h 1.31 1.70 30 0.321 0.413 28 1.61 1.63 1
Annual 0.046 0.078 68 0.011 0.016 43 0.068 0.113 68
Acetaldehyde 1-h 0.066 0.063 -4 0.023 0.021 -8 0.076 0.063 -18 24-h 0.019 0.015 -21 0.007 0.006 -19 0.024 0.019 -20
Annual 0.002 0.002 5 0.0005 0.0004 -7 0.001 0.002 27
Acrolein 1-h 0.029 0.028 -2 0.010 0.009 -8 0.033 0.026 -24 24-h 0.008 0.007 -20 0.003 0.003 -19 0.010 0.008 -21
Annual 0.0007 0.0007 5 0.0002 0.0002 -7 0.0006 0.0007 27
Benzene 1-h 2.52 0.96 -62 0.846 0.315 -63 4.77 1.12 -76 24-h 1.07 0.46 -57 0.355 0.142 -60 2.27 0.54 -76
Annual 0.078 0.022 -72 0.014 0.005 -62 0.222 0.042 -81
Formaldehyde 1-h 1.03 1.06 3 0.334 0.373 12 1.12 1.31 1624-h 0.307 0.267 -13 0.110 0.111 1 0.382 0.326 -15
Annual 0.027 0.028 3 0.007 0.007 -4 0.023 0.031 34
H2S 1-h 24.8 20.2 -19 5.30 5.57 5 24.6 22.8 -7 24-h 10.15 8.25 -19 2.33 2.54 9 8.98 9.04 1
Annual 0.544 0.422 -22 0.090 0.094 5 0.719 0.667 -7
Methylene chloride 1-h 6E-10 8E-10 47 2E-10 2E-10 -5 7E-10 8E-10 2224-h 3E-10 3E-10 7 8E-11 7E-11 -13 4E-10 3E-10 -25
Annual 1E-11 2E-11 53 3E-12 2E-12 -4 2E-11 2E-11 37
NOTE: Bold face text indicates predicted increases relative to the EIA case. For consistency with the HHRA assessment, predictions include receptors within the property boundary of other facilities.
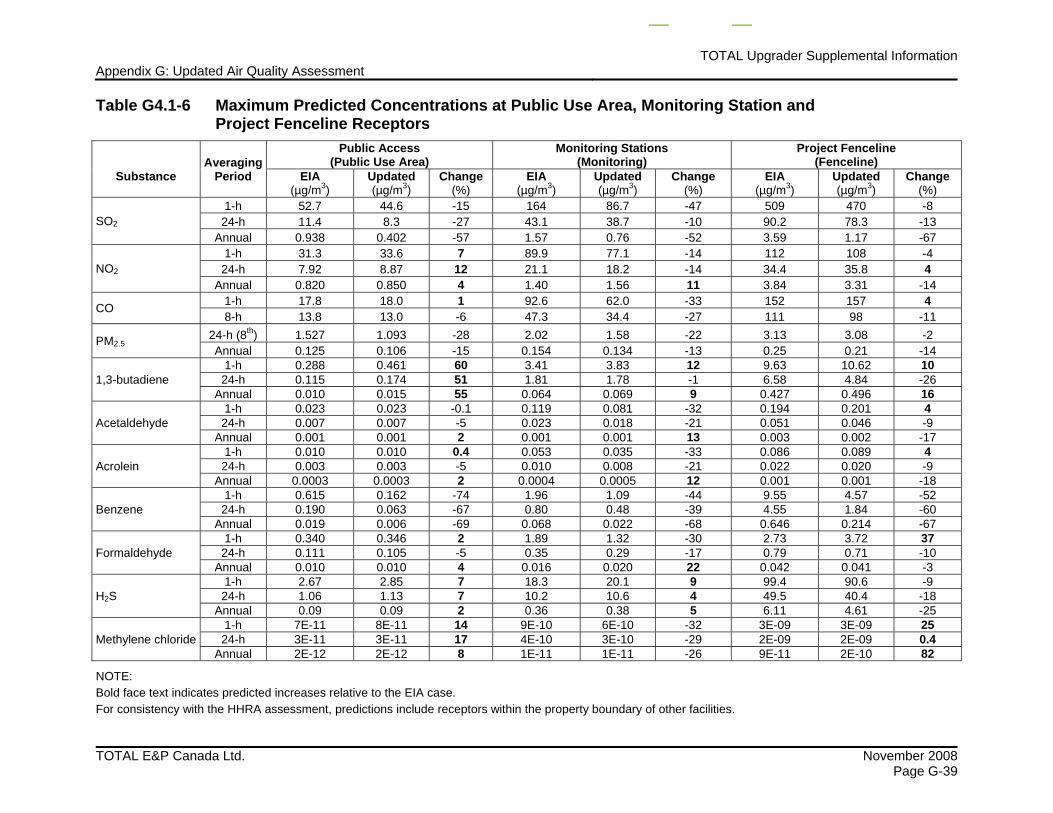
TOTAL Upgrader Supplemental InformationAppendix G: Updated Air Quality Assessment
TOTAL E&P Canada Ltd. November 2008 Page G-39
Table G4.1-6 Maximum Predicted Concentrations at Public Use Area, Monitoring Station and Project Fenceline Receptors
Substance
Averaging Period
Public Access (Public Use Area)
Monitoring Stations(Monitoring)
Project Fenceline(Fenceline)
EIA (µg/m3)
Updated(µg/m3)
Change(%)
EIA(µg/m3)
Updated (µg/m3)
Change(%)
EIA(µg/m3)
Updated(µg/m3)
Change(%)
SO2 1-h 52.7 44.6 -15 164 86.7 -47 509 470 -8 24-h 11.4 8.3 -27 43.1 38.7 -10 90.2 78.3 -13
Annual 0.938 0.402 -57 1.57 0.76 -52 3.59 1.17 -67
NO2 1-h 31.3 33.6 7 89.9 77.1 -14 112 108 -4 24-h 7.92 8.87 12 21.1 18.2 -14 34.4 35.8 4
Annual 0.820 0.850 4 1.40 1.56 11 3.84 3.31 -14
CO 1-h 17.8 18.0 1 92.6 62.0 -33 152 157 4 8-h 13.8 13.0 -6 47.3 34.4 -27 111 98 -11
PM2.5 24-h (8th) 1.527 1.093 -28 2.02 1.58 -22 3.13 3.08 -2 Annual 0.125 0.106 -15 0.154 0.134 -13 0.25 0.21 -14
1,3-butadiene 1-h 0.288 0.461 60 3.41 3.83 12 9.63 10.62 10 24-h 0.115 0.174 51 1.81 1.78 -1 6.58 4.84 -26
Annual 0.010 0.015 55 0.064 0.069 9 0.427 0.496 16
Acetaldehyde 1-h 0.023 0.023 -0.1 0.119 0.081 -32 0.194 0.201 4 24-h 0.007 0.007 -5 0.023 0.018 -21 0.051 0.046 -9
Annual 0.001 0.001 2 0.001 0.001 13 0.003 0.002 -17
Acrolein 1-h 0.010 0.010 0.4 0.053 0.035 -33 0.086 0.089 4 24-h 0.003 0.003 -5 0.010 0.008 -21 0.022 0.020 -9
Annual 0.0003 0.0003 2 0.0004 0.0005 12 0.001 0.001 -18
Benzene 1-h 0.615 0.162 -74 1.96 1.09 -44 9.55 4.57 -52 24-h 0.190 0.063 -67 0.80 0.48 -39 4.55 1.84 -60
Annual 0.019 0.006 -69 0.068 0.022 -68 0.646 0.214 -67
Formaldehyde 1-h 0.340 0.346 2 1.89 1.32 -30 2.73 3.72 37 24-h 0.111 0.105 -5 0.35 0.29 -17 0.79 0.71 -10
Annual 0.010 0.010 4 0.016 0.020 22 0.042 0.041 -3
H2S 1-h 2.67 2.85 7 18.3 20.1 9 99.4 90.6 -9 24-h 1.06 1.13 7 10.2 10.6 4 49.5 40.4 -18
Annual 0.09 0.09 2 0.36 0.38 5 6.11 4.61 -25
Methylene chloride 1-h 7E-11 8E-11 14 9E-10 6E-10 -32 3E-09 3E-09 25 24-h 3E-11 3E-11 17 4E-10 3E-10 -29 2E-09 2E-09 0.4
Annual 2E-12 2E-12 8 1E-11 1E-11 -26 9E-11 2E-10 82
NOTE: Bold face text indicates predicted increases relative to the EIA case. For consistency with the HHRA assessment, predictions include receptors within the property boundary of other facilities.

TOTAL Upgrader Supplemental Information Appendix G: Updated Air Quality Assessment
November 2008 TOTAL E&P Canada Ltd.Page G-40
G4.1.4 CALPUFF Predictions for Spatial Plots The CALPUFF model was used to predict the spatial concentration variation for the EIA Project Case and Updated Project Case. The predicted concentrations have been superimposed over a 50 by 50 km base map and are compared in the Figure G4.1-1 to Figure G4.1-10.
SO2 Predictions For the predicted maximum 1-h average SO2 concentrations for the EIA Project Case and Updated Project Case, see Figure G4.1-1. For most of the model domain, the Updated Project Case predictions are generally 80% to 90% of those associated with the EIA Project Case. There are isolated locations where the changes are in the 60% to 70% range, and isolated locations where the changes are in the 100% to 110% range.
For the predicted maximum 24-h average SO2 concentrations for the EIA Project Case and Updated Project Case, see Figure G4.1-2. The Updated Project Case predictions are generally 60% to 90% of those associated with the EIA Project Case. There are isolated locations where the changes are in the 50% to 60% range, and one location where the changes are about 130%.
For the predicted annual average SO2 concentrations for the EIA Project Case and Updated Project Case, see Figure G4.1-3. The Updated Project Case predictions are generally 40% to 60% of those associated with the EIA Project Case. In the southeast corner of the RSA, the changes are in the 60% to 70% range.
NO2 Predictions For the predicted maximum 1-h average NO2 concentrations for the EIA Project Case and Updated Project Case, see Figure G4.1-4. The Updated Project Case predictions are generally 100% to 120% of those associated with the EIA Project Case. South of the PDA, the changes are generally in the 90% to 100% range
For the predicted maximum 24-h average NO2 concentrations for the EIA Project Case and Updated Project Case, see Figure G4.1-5. The Updated Project Case predictions are generally 100% to 120% of those associated with the EIA Project Case. There are isolated locations where the changes are in the 70% to 100% range, and several locations to the southwest where the changes are in the 130% to 150% range.
For the predicted annual average NO2 concentrations for the EIA Project Case and Updated Project Case, see Figure G4.1-6. The Updated Project Case predictions are generally 100% to 120% of those associated with the EIA Project Case. Southwest of the PDA, the changes are in the 70% to 100% range.
PM2.5 Predictions For the predicted 98th percentile 24-h average PM2.5 concentrations for the EIA Project Case and Updated Project Case, see Figure G4.1-7. The Updated Project Case predictions are generally 80% to 100% of those associated with the EIA Project Case. In isolated areas south of the PDA, the changes are generally in the 100% to 110% range.
TOTAL Upgrader Supplemental InformationAppendix G: Updated Air Quality Assessment
TOTAL E&P Canada Ltd. November 2008 Page G-41
CO Predictions For the predicted maximum 1-h average concentrations for the EIA Project Case and Updated Project Case, see Figure G4.1-8. The Updated Project Case predictions are generally 100% to 120% of those associated with the EIA Project Case. South of the PDA, the changes are generally in the 90% to 100% range.
For the predicted maximum 8-h average concentrations for the EIA Project Case and Updated Project Case, see Figure G4.1-9. The Updated Project Case predictions are generally 100% to 120% of those associated with the EIA Project Case. There are isolated locations where the changes are in the 70% to 100% range, and several locations to the southwest where the changes are in the 130% to 150% range.
PAI Deposition Predictions For the predicted annual PAI deposition for the EIA Project Case and Updated Project Case, see Figure G4.1-10. The Updated Project Case predictions are generally 70% to 80% of those associated with the EIA Project Case.
G4.2 Upset Stack Predictions Four upset flaring scenarios were identified in the EIA Project Case (see the Integrated Application, Volume 2, Appendix 3E.2.3). For the Updated Project Case, one of these scenarios has been removed (Scenario 1) and two new scenarios have been added (Scenario 5 and Scenario 6). These changes are due to updated stack design. Specifically, the 50MF1 HP/LP flare stack has been replaced with two new flare stacks (i.e., smokeless HC and non-smokeless HC flare stacks). The parameters for the three acid-gas scenarios (Scenario 2 to Scenario 4) have been updated.
G4.2.1 SCREEN3 Predictions For a comparison of the EIA and updated flaring scenario predictions, see Table G4.2-1. The comparison demonstrates that:
• maximum predicted SO2 concentrations for the three acid-gas flaring scenarios decrease
• maximum predicted SO2 concentrations associated with the two new scenarios are less than the AAAQO
G4.2.2 CALPUFF Predictions For a comparison of the EIA and updated scenario predictions, see Table G4.2-2. The comparison demonstrates that:
• maximum predicted SO2 concentrations for the three acid-gas flaring scenarios decrease
• maximum predicted SO2 concentrations associated with the two new scenarios are less than the AAAQO
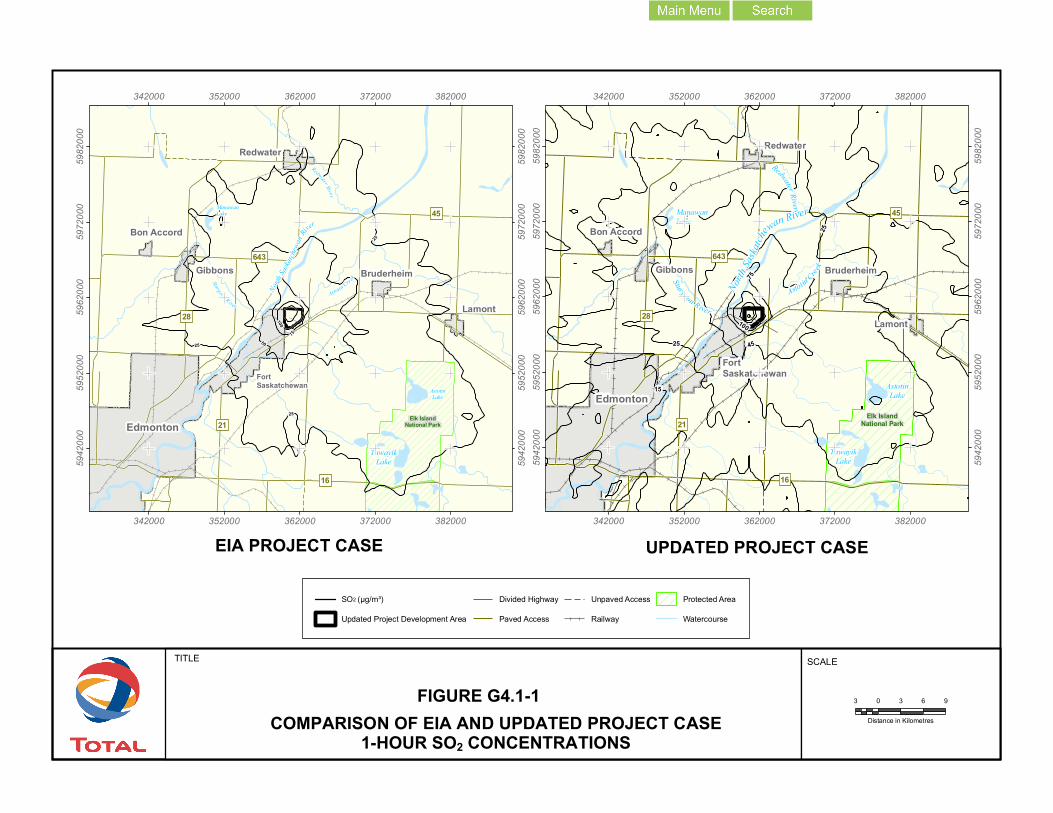
TITLE
FIGURE G4.1-1
North
Saska
tchew
an Ri
ver
FortSaskatchewan
Elk IslandNational Park
AstotinLake
Sturgeon R iver
Redwater Riv er
Astotin Creek
ManawanLake
75
5025
25
100
25
Redwater
BruderheimGibbons
Lamont
Edmonton
Bon Accord
28
21
16
45
643
TawayikLake
342000
342000
352000
352000
362000
362000
372000
372000
382000
382000
5942
000
5942
000
5952
000
5952
000
5962
000
5962
000
5972
000
5972
000
5982
000
5982
000
3 0 3 6 9
Distance in KilometresCOMPARISON OF EIA AND UPDATED PROJECT CASE1-HOUR SO2 CONCENTRATIONS
SCALE
SO2 (µg/m³)
Updated Project Development Area
Divided Highway
Paved Access
Unpaved Access
Railway
Protected Area
Watercourse
North
Saska
tchewan River
FortSaskatchewan
Elk IslandNational Park
AstotinLake
Sturgeon River
Redwater River
Astotin Creek
ManawanLake
45
75
100
25
25
15
Redwater
BruderheimGibbons
Lamont
Edmonton
Bon Accord
28
21
16
45
643
TawayikLake
342000
342000
352000
352000
362000
362000
372000
372000
382000
38200059
4200
0
5942
000
5952
000
5952
000
5962
000
5962
000
5972
000
5972
000
5982
000
5982
000
EIA PROJECT CASE UPDATED PROJECT CASE
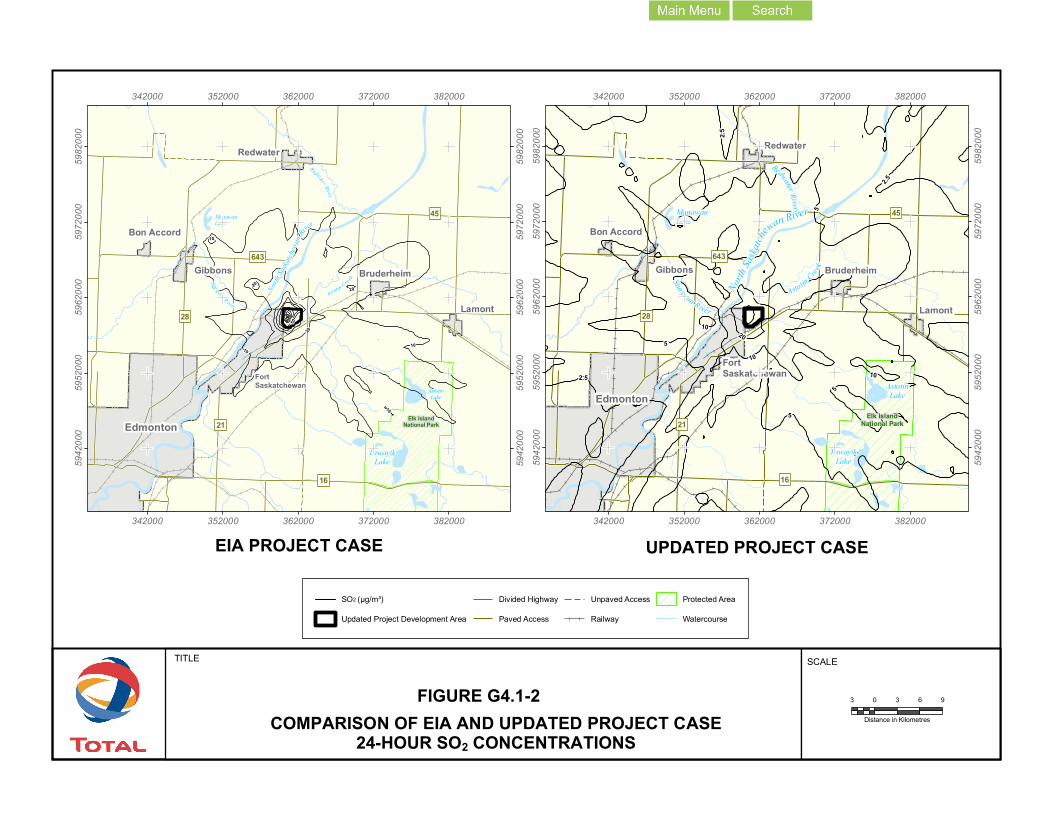
TITLE
FIGURE G4.1-2
North
Saska
tchew
an Ri
ver
FortSaskatchewan
Elk IslandNational Park
AstotinLake
Sturgeon R iver
Redwater Riv er
Astotin Creek
ManawanLake
20
10
10
20
50
10
20
10
Redwater
BruderheimGibbons
Lamont
Edmonton
Bon Accord
28
21
16
45
643
TawayikLake
342000
342000
352000
352000
362000
362000
372000
372000
382000
382000
5942
000
5942
000
5952
000
5952
000
5962
000
5962
000
5972
000
5972
000
5982
000
5982
000
3 0 3 6 9
Distance in KilometresCOMPARISON OF EIA AND UPDATED PROJECT CASE24-HOUR SO2 CONCENTRATIONS
SCALE
SO2 (µg/m³)
Updated Project Development Area
Divided Highway
Paved Access
Unpaved Access
Railway
Protected Area
Watercourse
North
Saska
tchewan River
FortSaskatchewan
Elk IslandNational Park
AstotinLake
Sturgeon River
Redwater River
Astotin Creek
ManawanLake
10
5
20
5
5
2.5 10
10
2.5
5
2.5
Redwater
BruderheimGibbons
Lamont
Edmonton
Bon Accord
28
21
16
45
643
TawayikLake
342000
342000
352000
352000
362000
362000
372000
372000
382000
38200059
4200
0
5942
000
5952
000
5952
000
5962
000
5962
000
5972
000
5972
000
5982
000
5982
000
EIA PROJECT CASE UPDATED PROJECT CASE
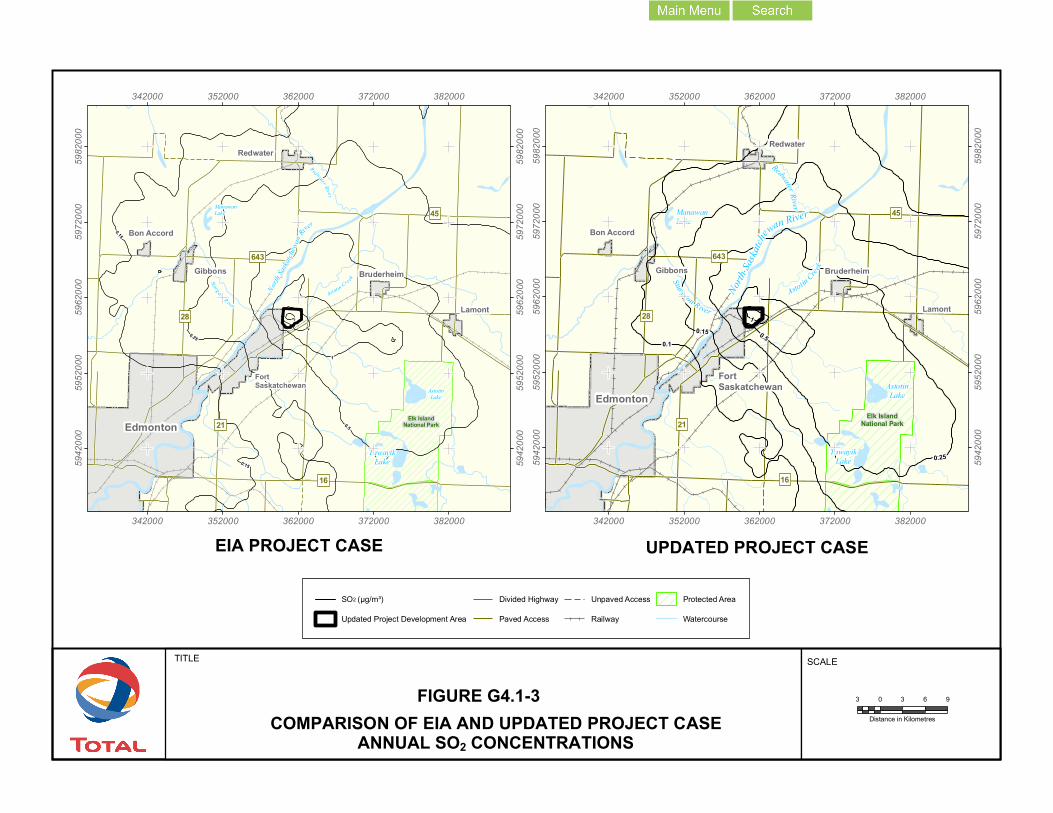
TITLE
FIGURE G4.1-3
North
Saska
tchew
an Ri
ver
FortSaskatchewan
Elk IslandNational Park
AstotinLake
Sturgeon R iver
Redwater Riv er
Astotin Creek
ManawanLake
2
0.25
0.15
0.15
3
1
1
0.5
Redwater
BruderheimGibbons
Lamont
Edmonton
Bon Accord
28
21
16
45
643
TawayikLake
342000
342000
352000
352000
362000
362000
372000
372000
382000
382000
5942
000
5942
000
5952
000
5952
000
5962
000
5962
000
5972
000
5972
000
5982
000
5982
000
3 0 3 6 9
Distance in KilometresCOMPARISON OF EIA AND UPDATED PROJECT CASEANNUAL SO2 CONCENTRATIONS
SCALE
SO2 (µg/m³)
Updated Project Development Area
Divided Highway
Paved Access
Unpaved Access
Railway
Protected Area
Watercourse
North
Saska
tchewan River
FortSaskatchewan
Elk IslandNational Park
AstotinLake
Sturgeon River
Redwater River
Astotin Creek
ManawanLake
0.50.1
0.25
0.151
Redwater
BruderheimGibbons
Lamont
Edmonton
Bon Accord
28
21
16
45
643
TawayikLake
342000
342000
352000
352000
362000
362000
372000
372000
382000
38200059
4200
0
5942
000
5952
000
5952
000
5962
000
5962
000
5972
000
5972
000
5982
000
5982
000
EIA PROJECT CASE UPDATED PROJECT CASE
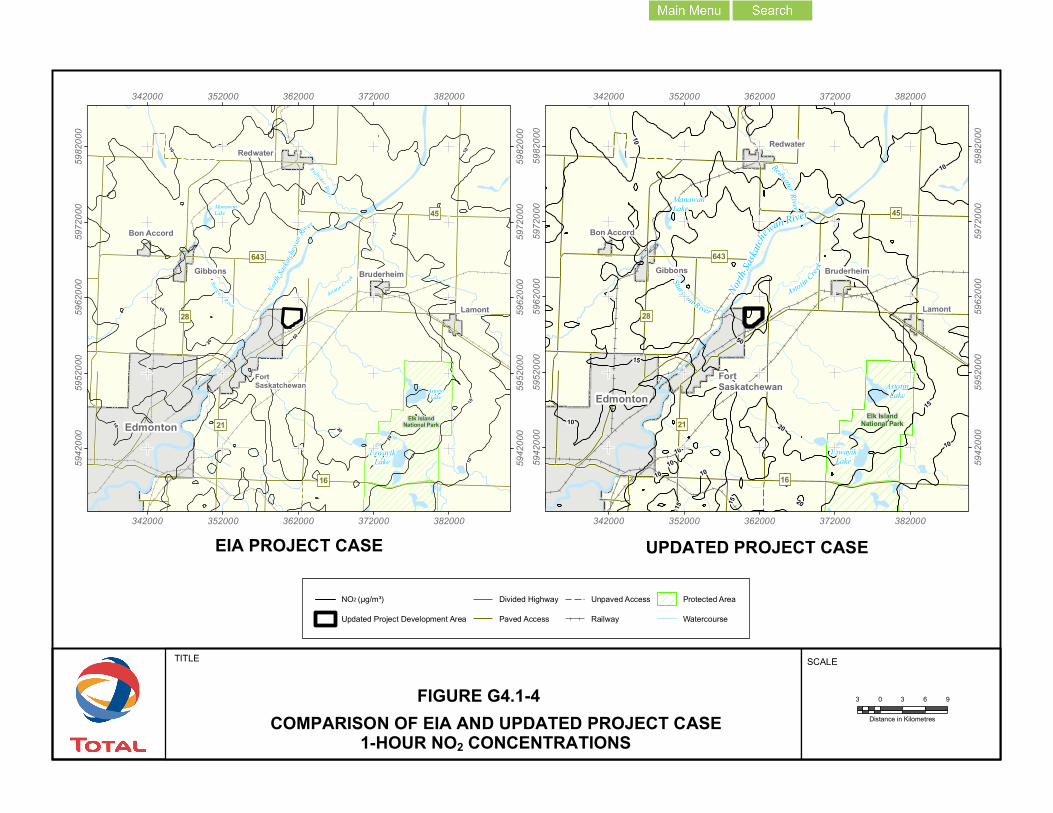
TITLE
FIGURE G4.1-4
North
Saska
tchew
an Ri
ver
FortSaskatchewan
Elk IslandNational Park
AstotinLake
Sturgeon R iver
Redwater Riv er
Astotin Creek
ManawanLake
50
10
10
15
20
20
15
10
20
1510
Redwater
BruderheimGibbons
Lamont
Edmonton
Bon Accord
28
21
16
45
643
TawayikLake
342000
342000
352000
352000
362000
362000
372000
372000
382000
382000
5942
000
5942
000
5952
000
5952
000
5962
000
5962
000
5972
000
5972
000
5982
000
5982
000
3 0 3 6 9
Distance in KilometresCOMPARISON OF EIA AND UPDATED PROJECT CASE1-HOUR NO2 CONCENTRATIONS
SCALE
NO2 (µg/m³)
Updated Project Development Area
Divided Highway
Paved Access
Unpaved Access
Railway
Protected Area
Watercourse
North
Saska
tchewan River
FortSaskatchewan
Elk IslandNational Park
AstotinLake
Sturgeon River
Redwater River
Astotin Creek
ManawanLake
2010
15
15
50
10
10
10
15
101010
10
15 20
Redwater
BruderheimGibbons
Lamont
Edmonton
Bon Accord
28
21
16
45
643
TawayikLake
342000
342000
352000
352000
362000
362000
372000
372000
382000
38200059
4200
0
5942
000
5952
000
5952
000
5962
000
5962
000
5972
000
5972
000
5982
000
5982
000
EIA PROJECT CASE UPDATED PROJECT CASE
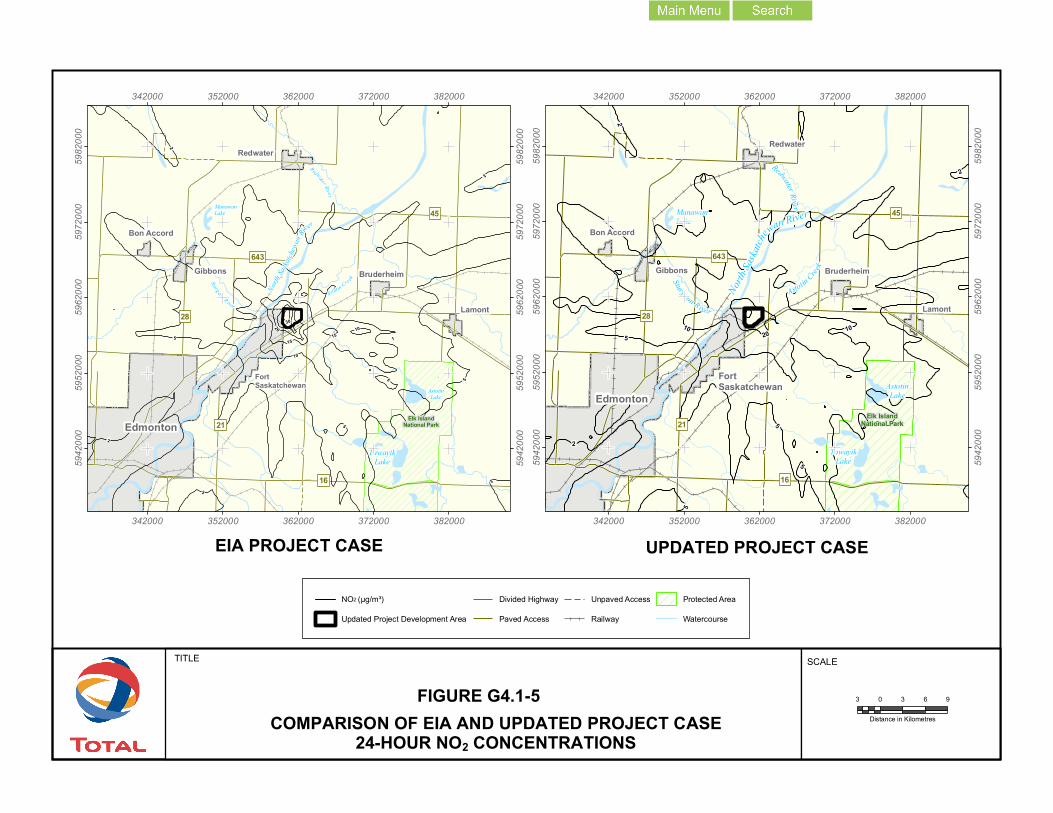
TITLE
FIGURE G4.1-5
North
Saska
tchew
an Ri
ver
FortSaskatchewan
Elk IslandNational Park
AstotinLake
Sturgeon R iver
Redwater Riv er
Astotin Creek
ManawanLake
15
2
2
5
20
1
5
2
5
2
30
2
5
1510
10
Redwater
BruderheimGibbons
Lamont
Edmonton
Bon Accord
28
21
16
45
643
TawayikLake
342000
342000
352000
352000
362000
362000
372000
372000
382000
382000
5942
000
5942
000
5952
000
5952
000
5962
000
5962
000
5972
000
5972
000
5982
000
5982
000
3 0 3 6 9
Distance in KilometresCOMPARISON OF EIA AND UPDATED PROJECT CASE24-HOUR NO2 CONCENTRATIONS
SCALE
NO2 (µg/m³)
Updated Project Development Area
Divided Highway
Paved Access
Unpaved Access
Railway
Protected Area
Watercourse
North
Saska
tchewan River
FortSaskatchewan
Elk IslandNational Park
AstotinLake
Sturgeon River
Redwater River
Astotin Creek
ManawanLake
5
2
105
10
2
2
5
5
20
Redwater
BruderheimGibbons
Lamont
Edmonton
Bon Accord
28
21
16
45
643
TawayikLake
342000
342000
352000
352000
362000
362000
372000
372000
382000
38200059
4200
0
5942
000
5952
000
5952
000
5962
000
5962
000
5972
000
5972
000
5982
000
5982
000
EIA PROJECT CASE UPDATED PROJECT CASE
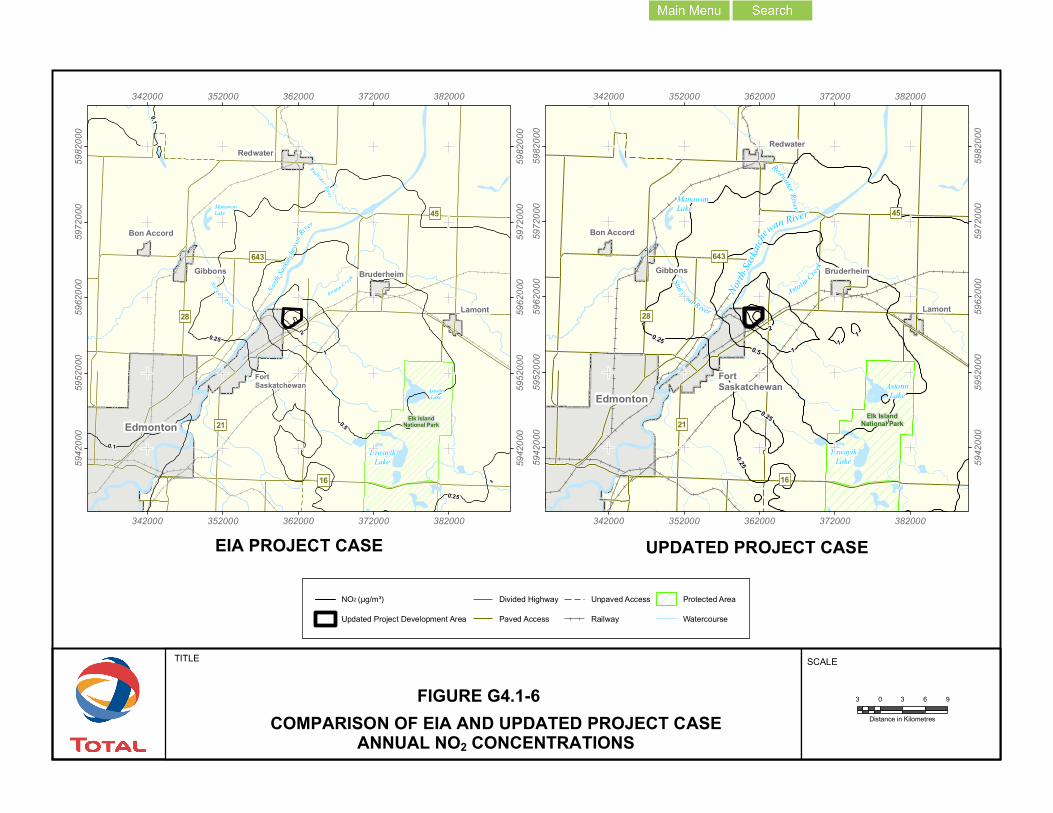
TITLE
FIGURE G4.1-6
North
Saska
tchew
an Ri
ver
FortSaskatchewan
Elk IslandNational Park
AstotinLake
Sturgeon R iver
Redwater Riv er
Astotin Creek
ManawanLake
0.1
0.1
20.25
0.5
1
20.25
Redwater
BruderheimGibbons
Lamont
Edmonton
Bon Accord
28
21
16
45
643
TawayikLake
342000
342000
352000
352000
362000
362000
372000
372000
382000
382000
5942
000
5942
000
5952
000
5952
000
5962
000
5962
000
5972
000
5972
000
5982
000
5982
000
3 0 3 6 9
Distance in KilometresCOMPARISON OF EIA AND UPDATED PROJECT CASEANNUAL NO2 CONCENTRATIONS
SCALE
NO2 (µg/m³)
Updated Project Development Area
Divided Highway
Paved Access
Unpaved Access
Railway
Protected Area
Watercourse
North
Saska
tchewan River
FortSaskatchewan
Elk IslandNational Park
AstotinLake
Sturgeon River
Redwater River
Astotin Creek
ManawanLake
0.25
10.25
0.25
0.5
1
1
2
Redwater
BruderheimGibbons
Lamont
Edmonton
Bon Accord
28
21
16
45
643
TawayikLake
342000
342000
352000
352000
362000
362000
372000
372000
382000
38200059
4200
0
5942
000
5952
000
5952
000
5962
000
5962
000
5972
000
5972
000
5982
000
5982
000
EIA PROJECT CASE UPDATED PROJECT CASE
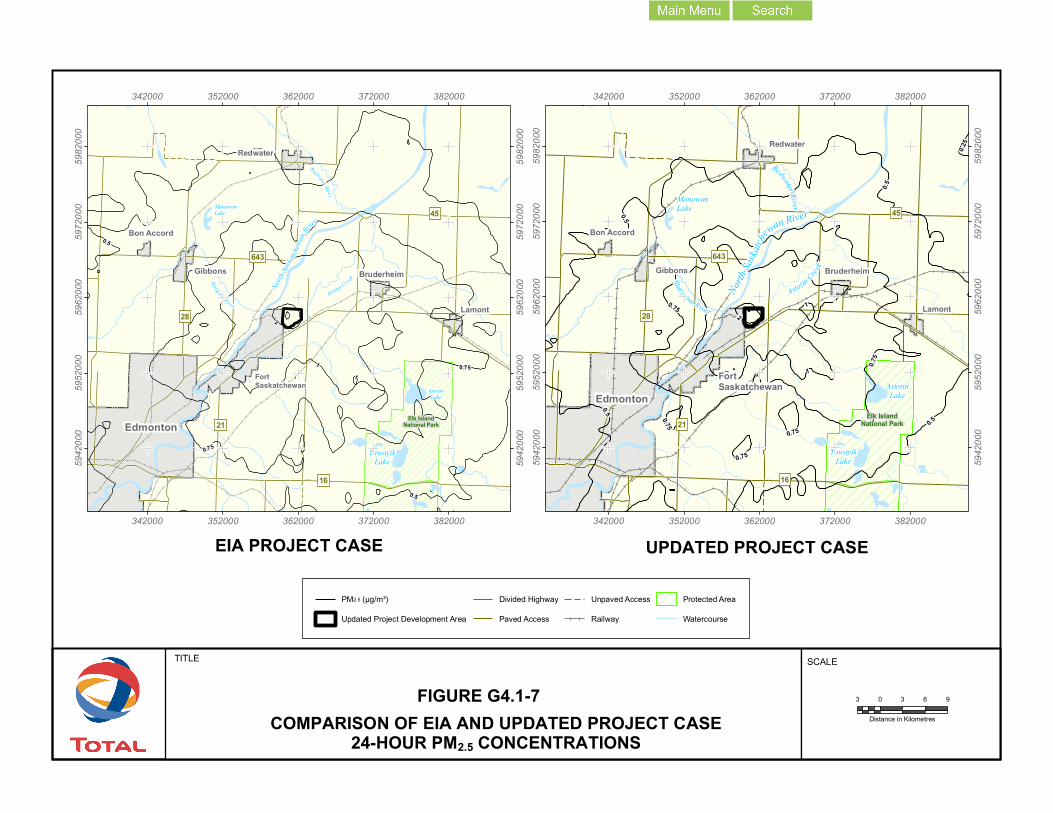
TITLE
FIGURE G4.1-7
North
Saska
tchew
an Riv
er
FortSaskatchewan
Elk IslandNational Park
AstotinLake
Sturgeon R iver
Redwater Riv er
Astotin Creek
ManawanLake
1
0.5
0.75
0.75
0.5
1
2
Redwater
BruderheimGibbons
Lamont
Edmonton
Bon Accord
28
21
16
45
643
TawayikLake
342000
342000
352000
352000
362000
362000
372000
372000
382000
382000
5942
000
5942
000
5952
000
5952
000
5962
000
5962
000
5972
000
5972
000
5982
000
5982
000
3 0 3 6 9
Distance in KilometresCOMPARISON OF EIA AND UPDATED PROJECT CASE24-HOUR PM2.5 CONCENTRATIONS
SCALE
PM2.5 (µg/m³)
Updated Project Development Area
Divided Highway
Paved Access
Unpaved Access
Railway
Protected Area
Watercourse
North
Saska
tchewan River
FortSaskatchewan
Elk IslandNational Park
AstotinLake
Sturgeon River
Redwater River
Astotin Creek
ManawanLake
0.75
0.5
0.5
0.5
0.75
1
0.5
0.75
0.75
0.25
21
0.75
Redwater
BruderheimGibbons
Lamont
Edmonton
Bon Accord
28
21
16
45
643
TawayikLake
342000
342000
352000
352000
362000
362000
372000
372000
382000
38200059
4200
0
5942
000
5952
000
5952
000
5962
000
5962
000
5972
000
5972
000
5982
000
5982
000
EIA PROJECT CASE UPDATED PROJECT CASE

TITLE
FIGURE G4.1-8
North
Saska
tchew
an Riv
er
FortSaskatchewan
Elk IslandNational Park
AstotinLake
Sturgeon R iver
Redwater Riv er
Astotin Creek
ManawanLake
2
5
10
20
5
5
5
5
5
15
5
5
10
5
50
Redwater
BruderheimGibbons
Lamont
Edmonton
Bon Accord
28
21
16
45
643
TawayikLake
342000
342000
352000
352000
362000
362000
372000
372000
382000
382000
5942
000
5942
000
5952
000
5952
000
5962
000
5962
000
5972
000
5972
000
5982
000
5982
000
3 0 3 6 9
Distance in KilometresCOMPARISON OF EIA AND UPDATED PROJECT CASE1-HOUR CO CONCENTRATIONS
SCALE
CO (µg/m³)
Updated Project Development Area
Divided Highway
Paved Access
Unpaved Access
Railway
Protected Area
Watercourse
North
Saska
tchewan River
FortSaskatchewan
Elk IslandNational Park
AstotinLake
Sturgeon River
Redwater River
Astotin Creek
ManawanLake
10
20
55
10
20
10
5
55
5
5
100
50
Redwater
BruderheimGibbons
Lamont
Edmonton
Bon Accord
28
21
16
45
643
TawayikLake
342000
342000
352000
352000
362000
362000
372000
372000
382000
38200059
4200
0
5942
000
5952
000
5952
000
5962
000
5962
000
5972
000
5972
000
5982
000
5982
000
EIA PROJECT CASE UPDATED PROJECT CASE
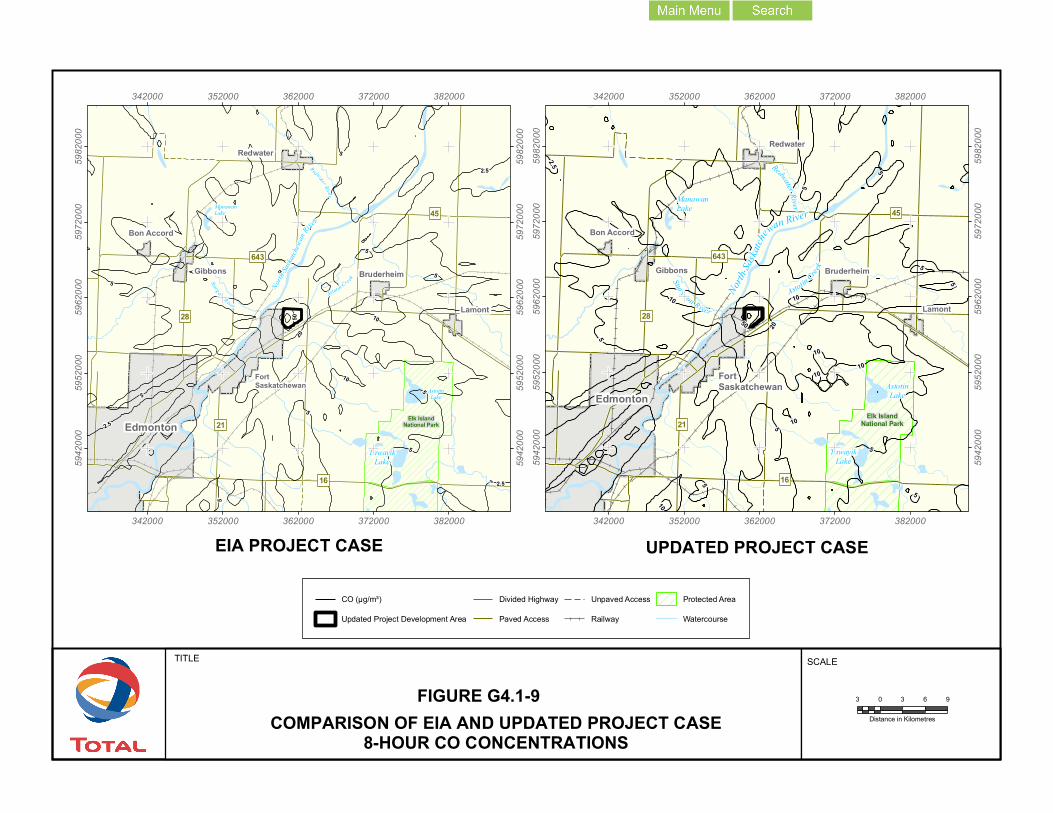
TITLE
FIGURE G4.1-9
North
Saska
tchew
an Riv
er
FortSaskatchewan
Elk IslandNational Park
AstotinLake
Sturgeon R iver
Redwater Riv er
Astotin Creek
ManawanLake
2
5
10
20
5
5
5
5
5
5
5
10
5
50
2.5
2.5
2.5
Redwater
BruderheimGibbons
Lamont
Edmonton
Bon Accord
28
21
16
45
643
TawayikLake
342000
342000
352000
352000
362000
362000
372000
372000
382000
382000
5942
000
5942
000
5952
000
5952
000
5962
000
5962
000
5972
000
5972
000
5982
000
5982
000
3 0 3 6 9
Distance in KilometresCOMPARISON OF EIA AND UPDATED PROJECT CASE8-HOUR CO CONCENTRATIONS
SCALE
CO (µg/m³)
Updated Project Development Area
Divided Highway
Paved Access
Unpaved Access
Railway
Protected Area
Watercourse
North
Saska
tchewan River
FortSaskatchewan
Elk IslandNational Park
AstotinLake
Sturgeon River
Redwater River
Astotin Creek
ManawanLake
10
5
5
10
20
10
5
5
5
5
50
10
10
10
2.5
5
5
10
5
Redwater
BruderheimGibbons
Lamont
Edmonton
Bon Accord
28
21
16
45
643
TawayikLake
342000
342000
352000
352000
362000
362000
372000
372000
382000
38200059
4200
0
5942
000
5952
000
5952
000
5962
000
5962
000
5972
000
5972
000
5982
000
5982
000
EIA PROJECT CASE UPDATED PROJECT CASE
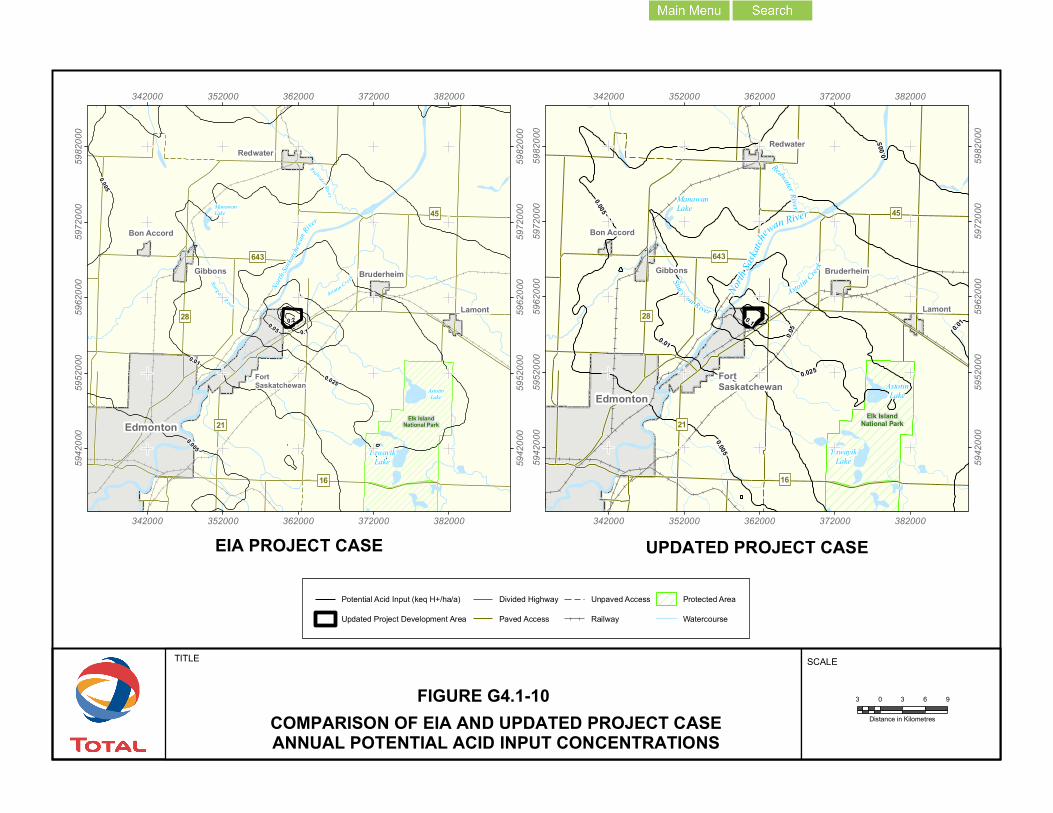
TITLE
FIGURE G4.1-10
North
Saska
tchew
an Riv
er
FortSaskatchewan
Elk IslandNational Park
AstotinLake
Sturgeon R iver
Redwater Riv er
Astotin Creek
ManawanLake
0.025
0.005
0.005
0.01
0.05 0.10.2
Redwater
BruderheimGibbons
Lamont
Edmonton
Bon Accord
28
21
16
45
643
TawayikLake
342000
342000
352000
352000
362000
362000
372000
372000
382000
382000
5942
000
5942
000
5952
000
5952
000
5962
000
5962
000
5972
000
5972
000
5982
000
5982
000
3 0 3 6 9
Distance in KilometresCOMPARISON OF EIA AND UPDATED PROJECT CASEANNUAL POTENTIAL ACID INPUT CONCENTRATIONS
SCALE
Potential Acid Input (keq H+/ha/a)
Updated Project Development Area
Divided Highway
Paved Access
Unpaved Access
Railway
Protected Area
Watercourse
North
Saska
tchewan River
FortSaskatchewan
Elk IslandNational Park
AstotinLake
Sturgeon River
Redwater River
Astotin Creek
ManawanLake
0.010.0
1
0.025
0.005
0.05
0.005
0.10.005
Redwater
BruderheimGibbons
Lamont
Edmonton
Bon Accord
28
21
16
45
643
TawayikLake
342000
342000
352000
352000
362000
362000
372000
372000
382000
38200059
4200
0
5942
000
5952
000
5952
000
5962
000
5962
000
5972
000
5972
000
5982
000
5982
000
EIA PROJECT CASE UPDATED PROJECT CASE
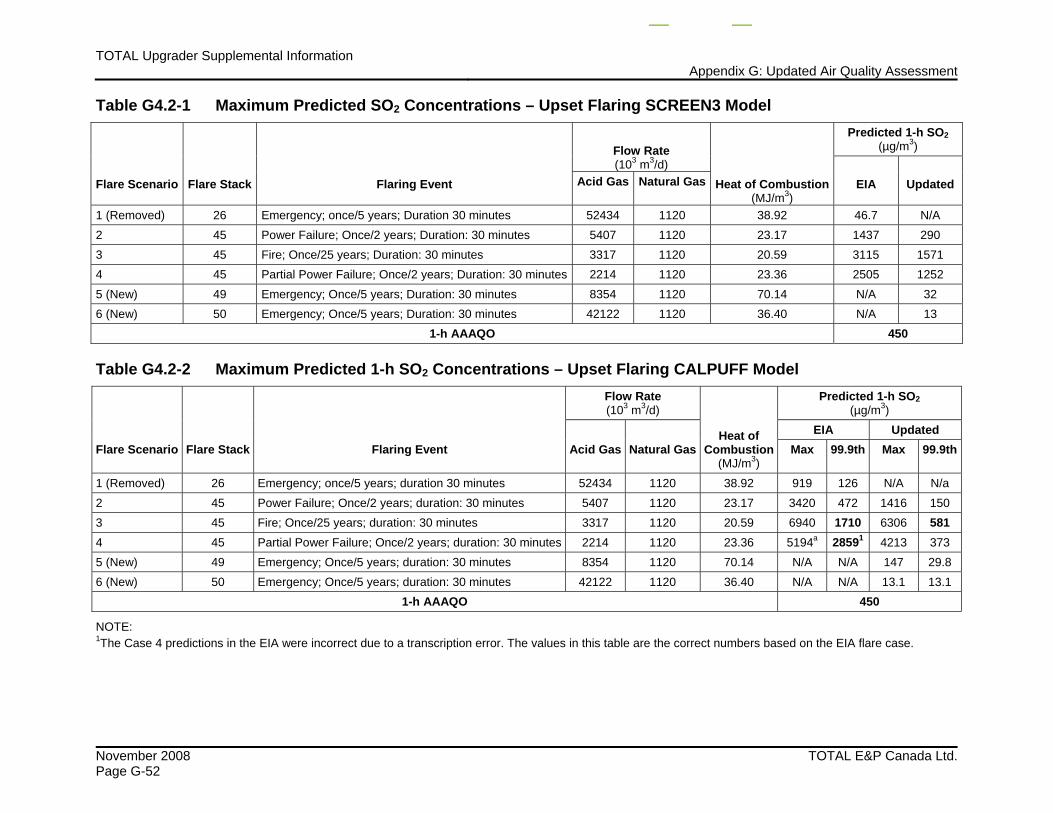
TOTAL Upgrader Supplemental Information Appendix G: Updated Air Quality Assessment
November 2008 TOTAL E&P Canada Ltd.Page G-52
Table G4.2-1 Maximum Predicted SO2 Concentrations – Upset Flaring SCREEN3 Model
Flare Scenario
Flare Stack
Flaring Event
Flow Rate (103 m3/d)
Heat of Combustion(MJ/m3)
Predicted 1-h SO2 (µg/m3)
EIA
Updated
Acid Gas
Natural Gas
1 (Removed) 26 Emergency; once/5 years; Duration 30 minutes 52434 1120 38.92 46.7 N/A 2 45 Power Failure; Once/2 years; Duration: 30 minutes 5407 1120 23.17 1437 290 3 45 Fire; Once/25 years; Duration: 30 minutes 3317 1120 20.59 3115 1571 4 45 Partial Power Failure; Once/2 years; Duration: 30 minutes 2214 1120 23.36 2505 1252 5 (New) 49 Emergency; Once/5 years; Duration: 30 minutes 8354 1120 70.14 N/A 32 6 (New) 50 Emergency; Once/5 years; Duration: 30 minutes 42122 1120 36.40 N/A 13
1-h AAAQO 450
Table G4.2-2 Maximum Predicted 1-h SO2 Concentrations – Upset Flaring CALPUFF Model
Flare Scenario
Flare Stack
Flaring Event
Flow Rate (103 m3/d)
Heat of Combustion
(MJ/m3)
Predicted 1-h SO2 (µg/m3)
Acid Gas
Natural Gas
EIA Updated Max
99.9th
Max
99.9th
1 (Removed) 26 Emergency; once/5 years; duration 30 minutes 52434 1120 38.92 919 126 N/A N/a 2 45 Power Failure; Once/2 years; duration: 30 minutes 5407 1120 23.17 3420 472 1416 150 3 45 Fire; Once/25 years; duration: 30 minutes 3317 1120 20.59 6940 1710 6306 581 4 45 Partial Power Failure; Once/2 years; duration: 30 minutes 2214 1120 23.36 5194a 28591 4213 373 5 (New) 49 Emergency; Once/5 years; duration: 30 minutes 8354 1120 70.14 N/A N/A 147 29.8 6 (New) 50 Emergency; Once/5 years; duration: 30 minutes 42122 1120 36.40 N/A N/A 13.1 13.1
1-h AAAQO 450
NOTE: 1The Case 4 predictions in the EIA were incorrect due to a transcription error. The values in this table are the correct numbers based on the EIA flare case.
TOTAL Upgrader Supplemental InformationAppendix G: Updated Air Quality Assessment
TOTAL E&P Canada Ltd. November 2008 Page G-53
G5 Summary and Conclusions
G5.1 Summary The CALPUFF model approach described in the EIA was used as the primary assessment tool to evaluate the air quality changes in the EIA Project Case and Updated Project Case. The results can be summarized as: • Maximum predicted SO2 concentrations for the Updated Project Case are predicted
to decrease (by -8 to -67%) for all averaging periods. • Maximum predicted NO2 concentrations for the Updated Project Case decrease (by -3
to -14%) for the 1-h and annual averaging periods and increase (by 4%) for the 24-h averaging period.
• Maximum predicted PM2.5 concentrations for the Updated Project Case are predicted to decrease (by -6 to -20%) for all averaging periods. While the primary PM2.5 emissions associated with the Updated Project Case increase by 8%, precursor SO2 emissions decrease by 13 to 27%.
• Maximum predicted CO concentrations for the Updated Project Case generally decrease (by -6 to -17%); however, there is an increase (by 4%) for the 1-h averaging period along the fenceline. The CO emissions associated with the Updated Project Case increase by 7%.
• Maximum predicted VOC concentrations for the Updated Project Case generally decrease (by -9 to -11%); however, there is an increase (by 6%) for the 1-h averaging period along the fenceline. The VOC emissions associated with the Updated Project Case increase by 8%.
• Maximum predicted PAI deposition for the Updated Project Case also decreases (by -29 to -31%). The predicted PAI deposition decrease is consistent with the annual SO2 emissions that decrease by 27%.
For the maximum concentrations predicted in the HHRA locations, there are increases and decreases, depending on the receptor type, the substance and the averaging period. Generally, maximum NO2, 1,3-butadiene and formaldehyde concentrations were predicted to increase by 10% or more at some residential and agricultural locations. While the H2S emissions were remain unchanged, there are still predicted exceedances of the H2S AAAQO near the Project fenceline.
For upset flaring, maximum predicted SO2 concentrations for the three updated acid-gas flaring scenarios decrease and maximum predicted SO2 concentrations associated with the two new scenarios are less than the AAAQO.
G5.2 Conclusions The Updated Project Case predictions for SO2, PM2.5 and PAI decrease compared with the EIA Project Case. Though there are some predicted NO2 and CO concentration increases due to the Updated Project Case predictions, the levels associated with the EIA Project Case and Updated Project Case are much less than the respective AAAQO. Concentrations for some VOC and TRS substances due to the Updated Project Case are predicted to increase in some locations. The key conclusions in the Integrated Application, Volume 2, Section 3.11 remain unchanged despite the changes in upgrader air emissions. Therefore, Application Case and Planned Development Case assessments are not considered necessary to understand the implications of the updated project.
TOTAL Upgrader Supplemental Information Appendix G: Updated Air Quality Assessment
November 2008 TOTAL E&P Canada Ltd.Page G-54