appendix g updated geotechnical investigation-results of
TRANSCRIPT
10336 Alder Avenue Industrial Project
Appendix G
Updated Geotechnical Investigation-Results of Percolation Testing

22885 Savi Ranch Parkway Suite E Yorba Linda California 92887voice: (714) 685-1115 fax: (714) 685-1118 www.socalgeo.com
November 15, 2018
Lake Creek Industrial17551 Norwood StreetTustin, California 92780
Attention: Mr. Michael JohnsonPrincipal
Project No.: 18G218-3
Subject: Results of Percolation TestingProposed Alder Logistics Center10336 Alder AvenueSan Bernardino County, California
Reference: Updated Geotechnical Investigation, Proposed Alder Logistics Center, 10336 AlderAvenue, San Bernardino County, California, prepared by Southern CaliforniaGeotechnical, Inc. (SCG), for Lake Creek Industrial, SCG Project No. 18G218-1,dated November 15, 2018.
Dear Mr. Johnson:
In accordance with your request, we have conducted percolation testing at the subject site. Weare pleased to present this report summarizing the results of the percolation testing and ourdesign recommendations.
Scope of Services
The scope of services performed for this project was in general accordance with our Proposal No.18P444 dated November 2, 2018. The scope of services included a visual site reconnaissance andthe review of the previously prepared percolation report to determine the infiltration rates of theon-site soils. The percolation testing was performed in accordance with the San BernardinoCounty Department of Environmental Health Services standards, Soil Percolation (PERC) TestReport Standards: Suitability of Lots and Soils for Use of Leachlines or Seepage Pits, publishedby the San Bernardino County Department of Environmental Health Services, revised June 2017.
Site and Project Description
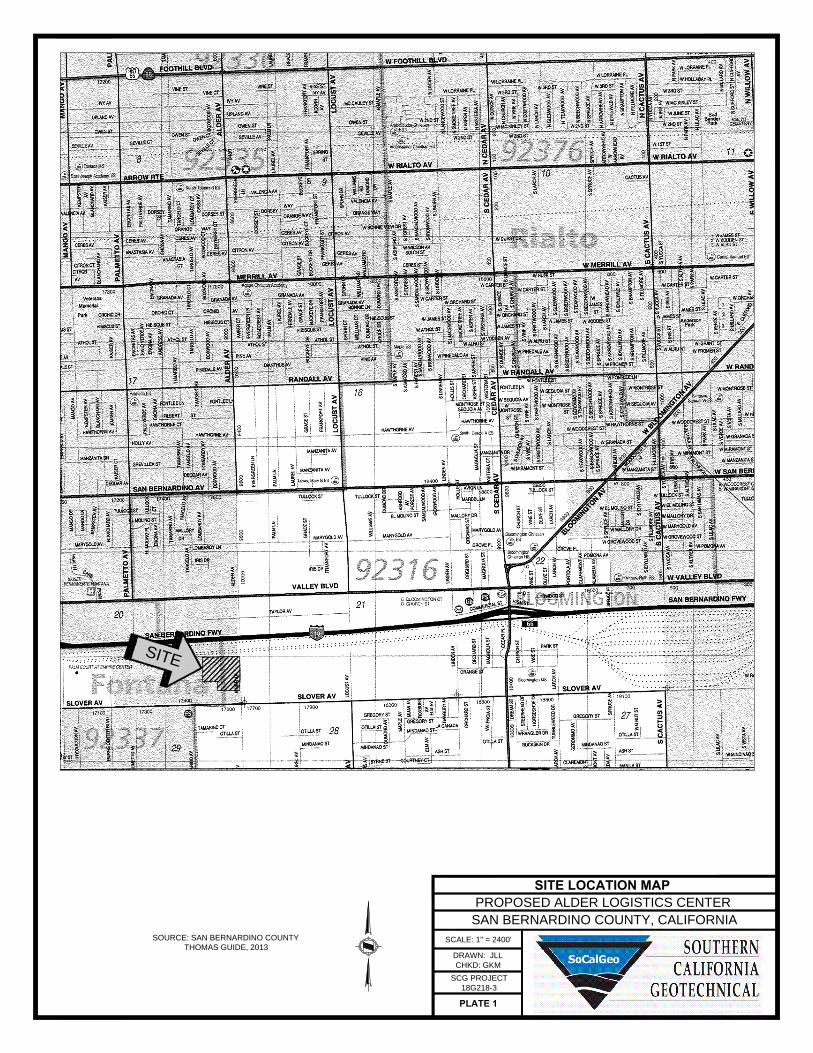
The site is located on the west side of Alder Avenue, 600± feet north of Slover Avenue, at theaddress of 10336 Alder Avenue in an unincorporated area within San Bernardino County,California. The site is bounded to the north by a Southern Pacific Railroad easement, to the westby a railroad yard, to the south by a steel facility and to the east by Alder Avenue. The generallocation of the site is illustrated on the Site Location Map, included as Plate 1 of this report.
The subject site consists of an assemblage of five parcels which total 8.50± acres. The site iscurrently developed as the Gene Belk Fruit Packers and Briners facility. This facility includes ametal-frame building located in the northeastern corner of the site. This building is approximately10,000 square feet and is of metal-frame construction with sheet-metal siding, presumably

Proposed Alder Logistics Center – San Bernardino County, CAProject No. 18G218-3
Page 2
supported on a shallow foundation system with a concrete slab-on-grade floor. This building iscurrently being utilized for produce processing. The existing facility also includes numeroussmaller structures and brine tanks throughout the site as well as a single-story single-familyresidence of wood-frame construction presumably supported on a shallow foundation system witha concrete slab-on-grade floor. Groundcover generally consists of heavily weathered asphalticconcrete pavements with isolated areas of exposed soil and aggregate base, and Portland cementconcrete pavements surrounding the brine tanks.
It should be noted that the current owner of the property has provided the approximate locationsof existing underground improvements. The existing underground improvements include, but arenot limited to, a 10,000-gallon rain storage tank located in the southern region of the site, andtwo (2) septic systems in the western and eastern regions. The underground improvementspresumably extend to a depth of 12± feet below the existing site grades. In addition, each septicsystem includes a 40±-foot deep 4±-foot diameter seepage pit. The existing undergroundimprovements are depicted on Plate 2 in Appendix A of this report.
Topographic information was obtained from a conceptual grading plan prepared by SB&O, Inc.,the project civil engineer. Based on our review of this plan, the existing site topography generallyslopes downward to the south to southeast at a gradient of 1 to 2 percent. The elevation at thesubject site ranges from 1100± feet mean sea level (msl) at the northwest corner of the site to1088± feet msl in the southeast corner of the site. There is approximately 12 feet of elevationdifferential across on subject site.
Proposed Development
The site plan provided to our office by the client indicates that the new development will consistof a 172,780± ft2 commercial/industrial building located in the northcentral region of the site. Thenew building will include a 2,000± ft2 mezzanine. The new building will be constructed with dock-high doors along the southern building wall. The building is expected to be surrounded byasphaltic concrete pavements in the parking and drive lane areas, Portland cement concretepavements in the loading dock areas, and concrete flatwork and landscaped planters locatedthroughout the site.
We understand that the proposed development will utilize on-site disposal for septic waste water.Based on conversations with SB&O, Inc., and the conceptual precise grading plan provided, anew septic system will be constructed in the southeastern area of the subject site. The new septicsystem will consist of one (1) sewer septic tank and six (6) sewer seepage pits. The depth of theproposed septic system was not known at the time of this report. The seepage pits are expectedto extend to depths of 20 to 25± feet below the existing site grades and the bottom of the sewerseptic tank would be approximately 5 feet below the existing site grades.
Previous Study
SCG previously performed a geotechnical investigation at the subject site, which is referencedabove. As part of this investigation, six (6) borings were advanced to depths of 5 to 20± feetbelow the existing site grades. Asphaltic concrete pavements were encountered at the groundsurface at most of the boring locations. The pavements consist of 2± inches of asphaltic concrete
Proposed Alder Logistics Center – San Bernardino County, CAProject No. 18G218-3
Page 3
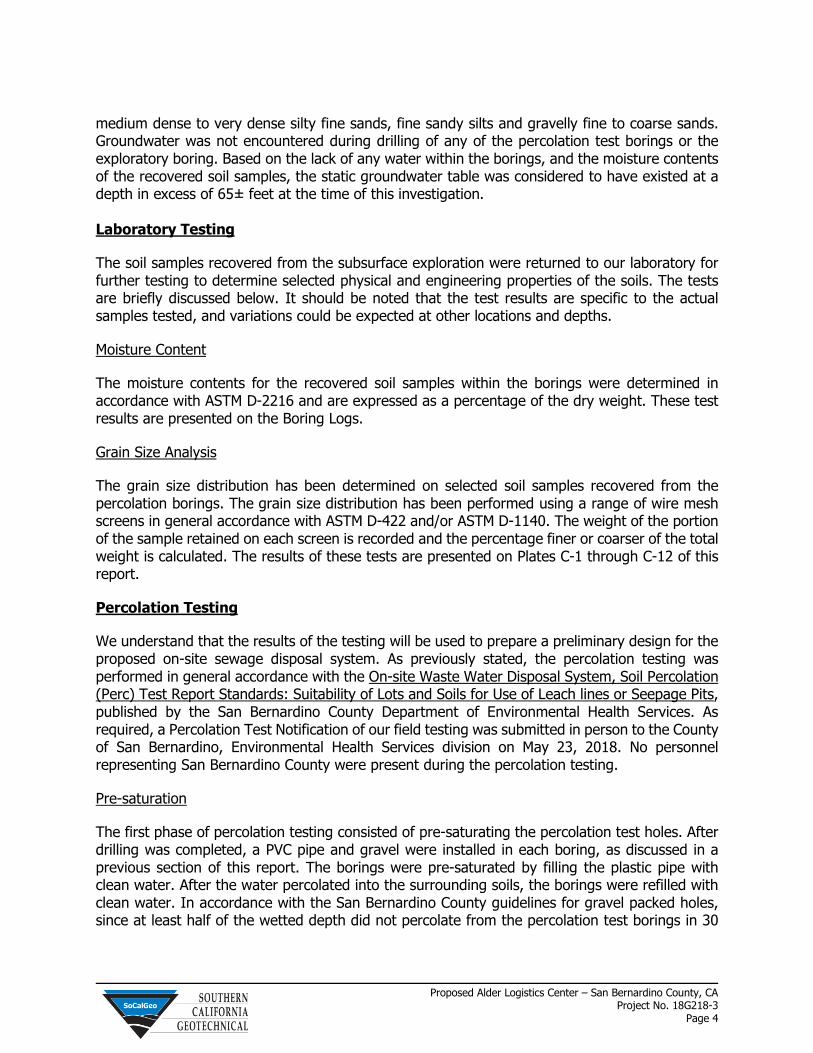
with no underlying layer of aggregate base. However, one of the borings was drilled in an areacovered with 6± inches of aggregate base at the ground surface. Artificial fill soils wereencountered below the pavements and/or aggregate base at all of the boring locations. The fillsoils extend to depths of 1½ to 4½± feet below the existing site grades. The fill soils generallyconsisted of loose to medium dense silty fine sands and medium to coarse sands, with varyingfine to coarse gravel content and occasional cobbles. Native alluvial soils were encountered belowthe fill soils at all of the boring locations, extending to at least the maximum depth explored of20± feet below the existing site grades. The alluvial soils generally consisted of medium denseto very dense silty fine to medium sands, gravelly fine to coarse sands, fine to coarse sandygravel, and fine sandy silts, with occasional cobbles. Free water was not encountered during thedrilling of any of the borings.
Subsurface Exploration
Scope of Exploration
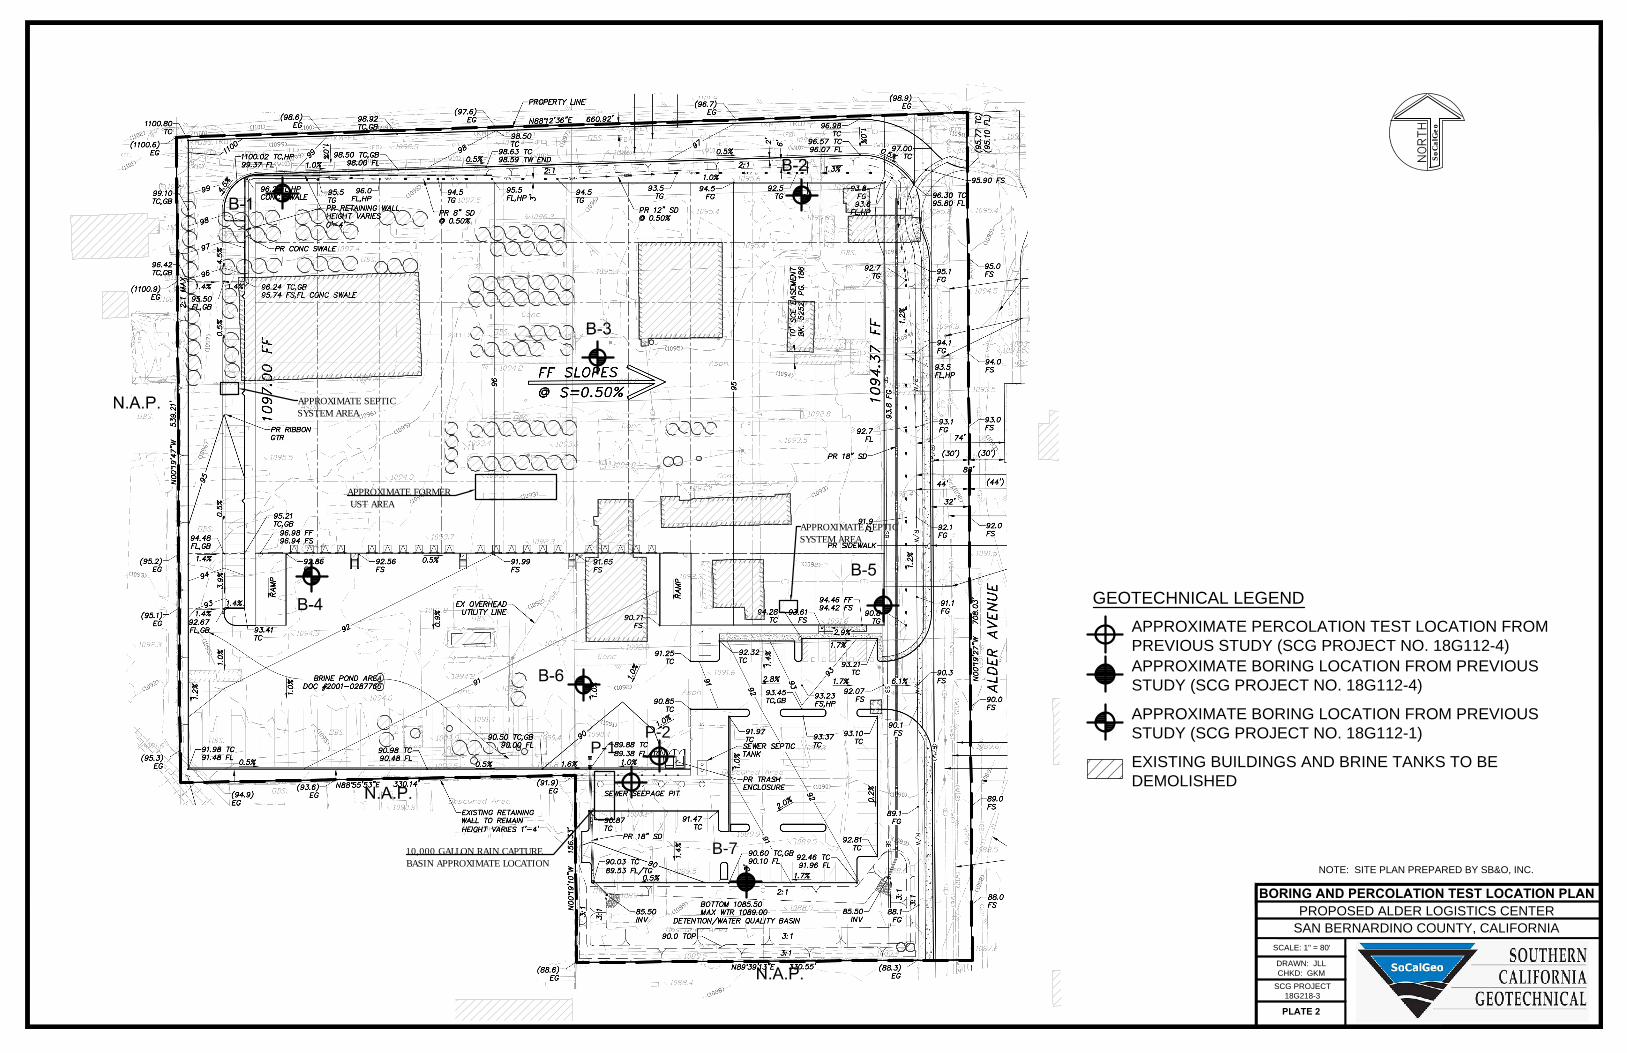
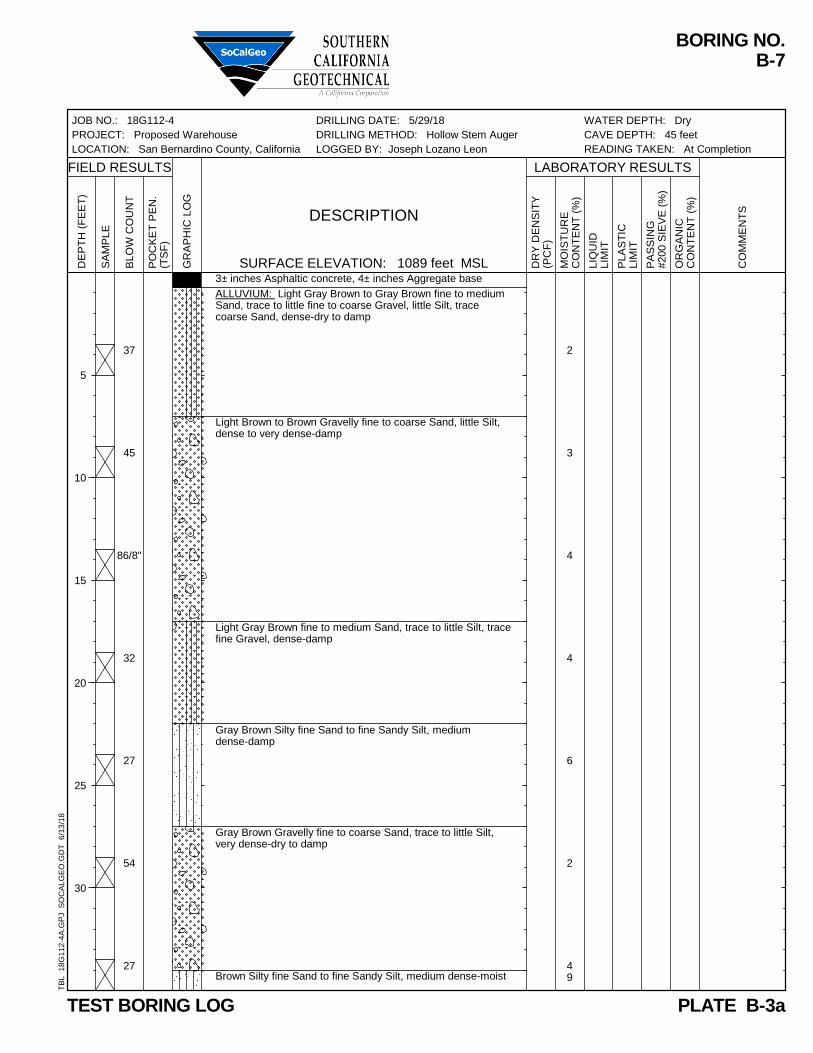
The subsurface exploration conducted for the percolation testing phase of this project consistedof two (2) percolation test borings and one (1) exploratory boring. The borings for this projectwere drilled on May 29, 2018. The percolation test borings were advanced to depths of 20 and25± feet below the existing site grades, while the exploratory boring was advanced to a depth of65± feet (at least 40± feet below the bottom of the percolation test borings) below the existingsite grades in the proposed sewage disposal system areas. These borings were logged duringdrilling by a member of our staff. All of the borings were advanced using a truck-mounted drillingrig, equipped with 8-inch diameter hollow stem augers. The approximate locations of thepercolation test borings (identified as P-1 and P-2) and exploratory boring (identified as B-7) areindicated on the Boring and Percolation Test Location Plan, enclosed as Plate 2 of this report.
Upon completion of the drilling of the percolation test borings, the bottoms of the percolation testholes were covered with 2± inches of clean ¾-inch gravel. A sufficient length of 3-inch-diameterperforated PVC casing was then placed into the test holes so that the perforated PVC casingextended from the bottom of the test hole to the ground surface. Clean ¾-inch gravel was theninstalled in the annulus surrounding the perforated PVC casing.
Geotechnical Conditions
Asphaltic concrete pavements were encountered at the ground surface at all three (3) of theboring locations. The pavements consist of 3± inches of asphaltic concrete with 2 to 4± inchesof underlying aggregate base. Artificial fill soils were encountered below the pavements atPercolation Borings P-1 and P-2, extending to a depth of 17± feet below the existing site grades.The fill soils generally consist of medium dense to very dense fine to coarse sands with varyingsilt and gravel content. The fill soils possess a disturbed, mottled, appearance, resulting in theirclassification as artificial fill. In addition, the fill soils possess a strong organic odor. Based onhistorical aerial photographs obtained from the internet and communications with the currentproperty owner, it is expected that the existing fill soils encountered at the two (2) percolationboring locations are backfill materials utilized to fill a previous detention basin or the existing10,000-gallon rain storage tank. Native alluvial soils were encountered below the fill soils or belowthe existing pavements at all three of the boring locations, extending to at least the maximumdepth explored of 65± feet below the existing site grades. The alluvial soils generally consist of
Proposed Alder Logistics Center – San Bernardino County, CAProject No. 18G218-3
Page 4
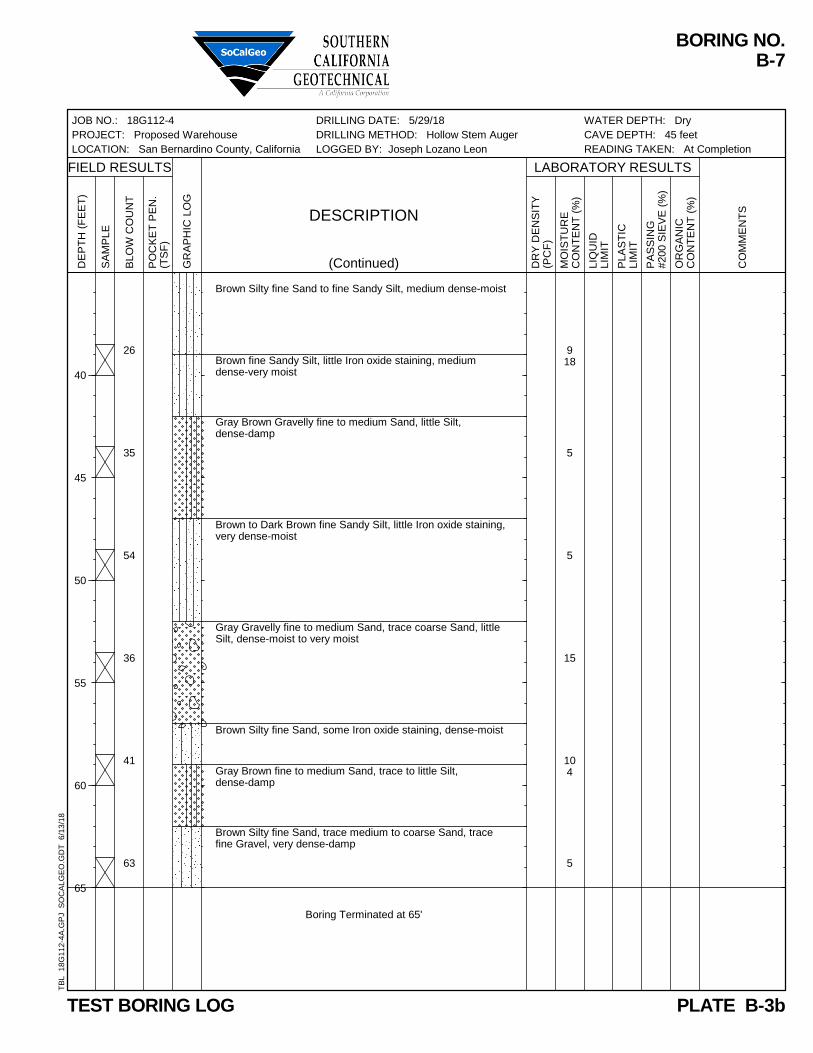
medium dense to very dense silty fine sands, fine sandy silts and gravelly fine to coarse sands.Groundwater was not encountered during drilling of any of the percolation test borings or theexploratory boring. Based on the lack of any water within the borings, and the moisture contentsof the recovered soil samples, the static groundwater table was considered to have existed at adepth in excess of 65± feet at the time of this investigation.
Laboratory Testing
The soil samples recovered from the subsurface exploration were returned to our laboratory forfurther testing to determine selected physical and engineering properties of the soils. The testsare briefly discussed below. It should be noted that the test results are specific to the actualsamples tested, and variations could be expected at other locations and depths.
Moisture Content
The moisture contents for the recovered soil samples within the borings were determined inaccordance with ASTM D-2216 and are expressed as a percentage of the dry weight. These testresults are presented on the Boring Logs.
Grain Size Analysis
The grain size distribution has been determined on selected soil samples recovered from thepercolation borings. The grain size distribution has been performed using a range of wire meshscreens in general accordance with ASTM D-422 and/or ASTM D-1140. The weight of the portionof the sample retained on each screen is recorded and the percentage finer or coarser of the totalweight is calculated. The results of these tests are presented on Plates C-1 through C-12 of thisreport.
Percolation Testing
We understand that the results of the testing will be used to prepare a preliminary design for theproposed on-site sewage disposal system. As previously stated, the percolation testing wasperformed in general accordance with the On-site Waste Water Disposal System, Soil Percolation(Perc) Test Report Standards: Suitability of Lots and Soils for Use of Leach lines or Seepage Pits,published by the San Bernardino County Department of Environmental Health Services. Asrequired, a Percolation Test Notification of our field testing was submitted in person to the Countyof San Bernardino, Environmental Health Services division on May 23, 2018. No personnelrepresenting San Bernardino County were present during the percolation testing.
Pre-saturation
The first phase of percolation testing consisted of pre-saturating the percolation test holes. Afterdrilling was completed, a PVC pipe and gravel were installed in each boring, as discussed in aprevious section of this report. The borings were pre-saturated by filling the plastic pipe withclean water. After the water percolated into the surrounding soils, the borings were refilled withclean water. In accordance with the San Bernardino County guidelines for gravel packed holes,since at least half of the wetted depth did not percolate from the percolation test borings in 30

Proposed Alder Logistics Center – San Bernardino County, CAProject No. 18G218-3
Page 5
minutes or less for at least four (4) consecutive fillings, the percolation testing was conducted theday following the pre-saturation procedure.
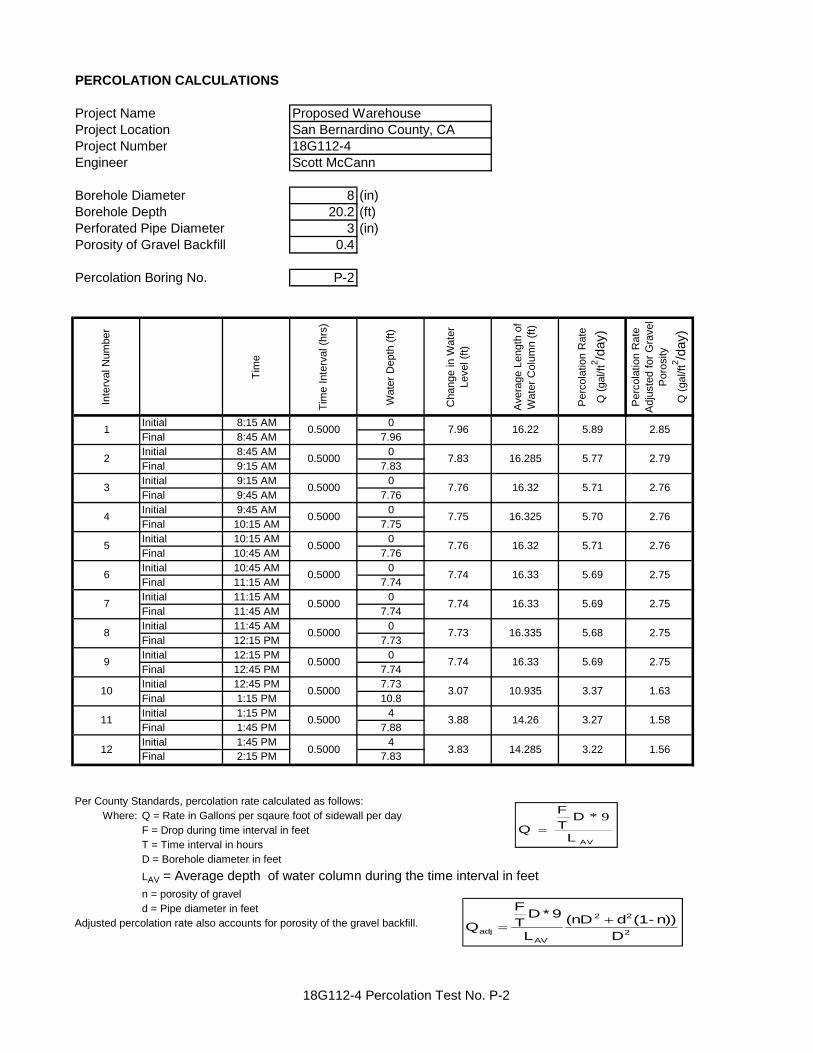
Percolation Testing
SCG subsequently performed the percolation testing the following day on May 30, 2018. Accordingto the San Bernardino County guidelines for soils with fines, it was determined that the percolationtesting should consist of at least twelve (12) consecutive 30-minute intervals. During thepercolation testing phase, from a fixed reference point, the drop-in water level was measuredover a 30-minute period for five (5) hours for both of the percolation test borings (P-1 and P-2).After each time interval was recorded, the test holes were refilled to their initial water height evenwith the ground surface. During the final (sixth) hour of testing, readings were taken again atevery 30 minutes, without refilling. The depths of the percolation test borings were measuredafter each reading to ensure that caving did not occur. These water level readings are presentedon the spreadsheets enclosed with this report. The percolation rate for each of the time intervalsis also tabulated on the spreadsheets.
Percolation Results
The procedure used to calculate the percolation rates accounts for the porosity of the gravelwhich was used to backfill the borings. This material was tested in our laboratory and determinedto possess a porosity of approximately 0.4.
Percolation rates are tabulated in gallons per square feet per day. In accordance with SanBernardino County guidelines, it is recommended that the most conservative reading from thelatter part of the percolation test be used for design. These rates are summarized below:
Percolation TestLocation
Boring Depth(Feet)
Percolation Rate (Q)Gal/ft²/d
San Bernardino CountyMinimum/Maximum
Percolation Rates(Q)
P-1 25 2.4 Minimum = 1.1Maximum = 4.0P-2 20 1.6
Historic Groundwater Research
We have researched historic groundwater levels near the subject site. One of the sources whichpossessed information deemed relevant to the subject site was the State of California Departmentof Water Resources website. Historic high-water levels from nearby wells included in the reporthave been presented in the table below.
State Well IDApproximate Distance
from Subject Site
Historic High Water
Level bgs (feet)
Available Data
Range (years)
340661N1174301W001 0.6 miles (W) 268 1989 to 2017
340672N1173979W001 1.2 miles (E) 240 1956 to 2000
340556N1174454W001 1.7 miles (SW) 225 1912 to 2008

Proposed Alder Logistics Center – San Bernardino County, CAProject No. 18G218-3
Page 6
Based on the well data provided above, and our exploratory borings, the ground water at thesubject site is estimated to be at least 225± feet below the existing ground surface.
Design Considerations
Based on the soil percolation testing, the percolation rates at the test locations are 1.6 and 2.4gallons per square foot per day (gal/ft²/d). The San Bernardino County guidelines state that thedesign flow rate (Q) for seepage pits must be at least 1.1 gal/ft²/d and no greater than 4.0gal/ft²/d. Therefore, we recommend that a design percolation rate of 1.6 gal/ft²/d beused for the seepage pits per San Bernardino County guidelines.
The design of the on-site sewage disposal system should be performed by the project civilengineer. It should be noted that the recommended percolation rate is based on percolationtesting at two (2) discrete locations, and the overall percolation rates of the septic system couldvary. However, based on the uniformity of the soil at the percolation test boring locations, thepercolation rate is not expected to vary significantly. We also recommend that a copy of the DEHSseptic system handout “Taking Care of Your Septic System” be obtained by the owner/developerand that the recommendations contained in that handout be applied throughout the life of theproposed system.
Abandonment of Percolation Test Borings
We recommend that the percolation test borings be abandoned during construction in thefollowing manner: The upper 5 feet of the boring should be over-drilled to remove the gravelfrom the boring and the PVC drain pipe should be removed from the upper 5 feet of the boring.The excavation should then be filled with lean concrete slurry. We further recommend that anylocal well abandonment standards or procedures be observed.
General Comments
This report has been prepared as an instrument of service for use by the client in order to aid inthe evaluation of this property and to assist the architects and engineers in the design andpreparation of the project plans and specifications. This report may be provided to thecontractor(s) and other design consultants to disclose information relative to the project.However, this report is not intended to be utilized as a specification in and of itself, withoutappropriate interpretation by the project architect, structural engineer, and/or civil engineer. Thereproduction and distribution of this report must be authorized by the client and SouthernCalifornia Geotechnical, Inc. Furthermore, any reliance on this report by an unauthorized thirdparty is at such party’s sole risk, and we accept no responsibility for damage or loss which mayoccur.
The analysis of this site was based on a subsurface profile interpolated from limited discrete soilsamples. While the materials encountered in the project area are considered to be representativeof the total area, some variations should be expected between boring locations and testingdepths. If the conditions encountered during construction vary significantly from those detailedherein, we should be contacted immediately to determine if the conditions alter therecommendations contained herein.
Proposed Alder Logistics Center – San Bernardino County, CAProject No. 18G218-3
Page 7
This report has been based on assumed or provided characteristics of the proposed development.It is recommended that the owner, client, architect, structural engineer, and civil engineercarefully review these assumptions to ensure that they are consistent with the characteristics ofthe proposed development. If discrepancies exist, they should be brought to our attention toverify that they do not affect the conclusions and recommendations contained herein. We alsorecommend that the project plans and specifications be submitted to our office for review toverify that our recommendations have been correctly interpreted.
The analysis, conclusions, and recommendations contained within this report have beenpromulgated in accordance with generally accepted professional geotechnical engineeringpractice. No other warranty is implied or expressed.
Closure
We sincerely appreciate the opportunity to be of service on this project. We look forward toproviding additional consulting services during the course of the project. If we may be of furtherassistance in any manner, please contact our office.
Respectfully Submitted,
SOUTHERN CALIFORNIA GEOTECHNICAL, INC.
Joseph Lozano LeonStaff Engineer
Gregory K. Mitchell, GE 2364Principal Engineer
Distribution: (1) Addressee
Enclosures: Plate 1 - Site Location MapPlate 2 – Boring and Percolation Test Location PlanBoring Log Legend and Boring Logs (6 pages)Percolation Test Results Spreadsheets (4 pages)Grain Size Distribution Graphs (12 pages)
S
IT
E
PROPOSED ALDER LOGISTICS CENTER
SCALE: 1" = 2400'
DRAWN: JLL
CHKD: GKM
SCG PROJECT
18G218-3
PLATE 1
SITE LOCATION MAP
SAN BERNARDINO COUNTY, CALIFORNIA
SOURCE: SAN BERNARDINO COUNTY
THOMAS GUIDE, 2013
10,000 GALLON RAIN CAPTURE
BASIN APPROXIMATE LOCATION
APPROXIMATE FORMER
UST AREA
APPROXIMATE SEPTIC
SYSTEM AREA
APPROXIMATE SEPTIC
SYSTEM AREA
P-1
P-2
B-7
SCALE: 1" = 80'
DRAWN: JLL
CHKD: GKM
PLATE 2
SCG PROJECT
18G218-3
SAN BERNARDINO COUNTY, CALIFORNIA
PROPOSED ALDER LOGISTICS CENTER
BORING AND PERCOLATION TEST LOCATION PLAN
GEOTECHNICAL LEGEND
So
Ca
lG
eo
NOTE: SITE PLAN PREPARED BY SB&O, INC.
APPROXIMATE BORING LOCATION FROM PREVIOUS
STUDY (SCG PROJECT NO. 18G112-1)
EXISTING BUILDINGS AND BRINE TANKS TO BE
DEMOLISHED
APPROXIMATE PERCOLATION TEST LOCATION FROM
PREVIOUS STUDY (SCG PROJECT NO. 18G112-4)
APPROXIMATE BORING LOCATION FROM PREVIOUS
STUDY (SCG PROJECT NO. 18G112-4)
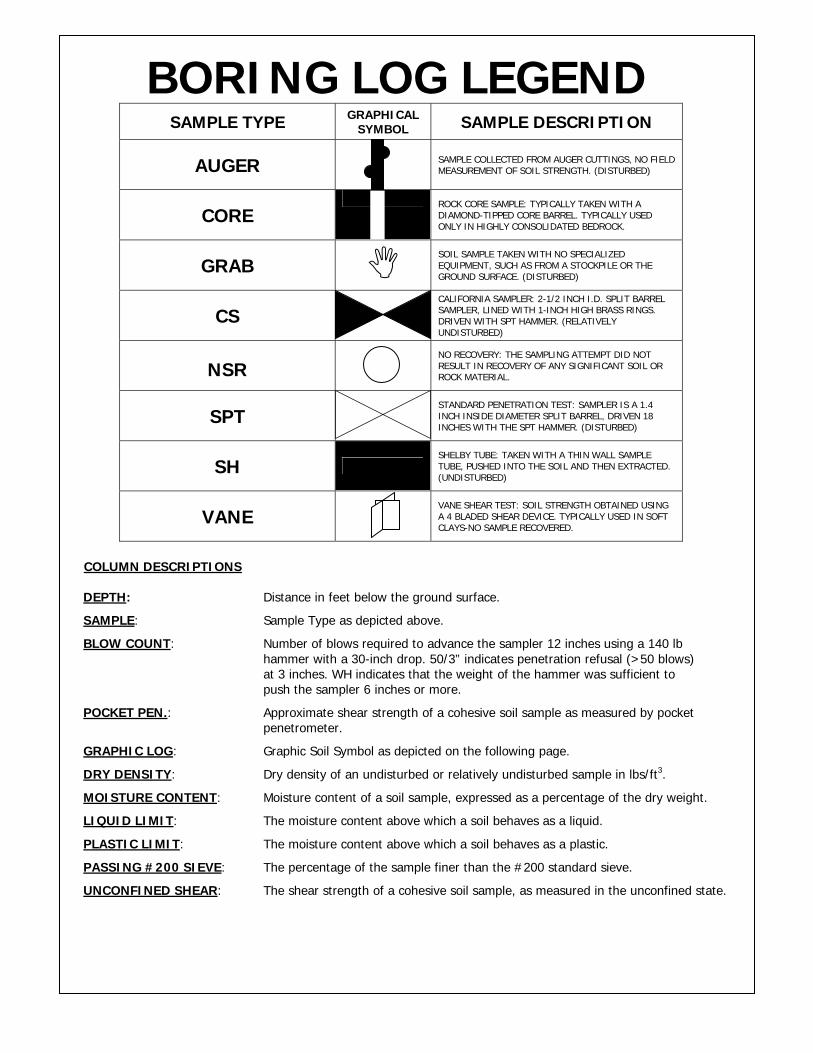
BORING LOG LEGEND SAMPLE TYPE GRAPHICAL
SYMBOL SAMPLE DESCRIPTION
AUGER
SAMPLE COLLECTED FROM AUGER CUTTINGS, NO FIELD MEASUREMENT OF SOIL STRENGTH. (DISTURBED)
CORE ROCK CORE SAMPLE: TYPICALLY TAKEN WITH A
DIAMOND-TIPPED CORE BARREL. TYPICALLY USED ONLY IN HIGHLY CONSOLIDATED BEDROCK.
GRAB SOIL SAMPLE TAKEN WITH NO SPECIALIZED EQUIPMENT, SUCH AS FROM A STOCKPILE OR THE GROUND SURFACE. (DISTURBED)
CS CALIFORNIA SAMPLER: 2-1/2 INCH I.D. SPLIT BARREL
SAMPLER, LINED WITH 1-INCH HIGH BRASS RINGS. DRIVEN WITH SPT HAMMER. (RELATIVELY UNDISTURBED)
NSR
NO RECOVERY: THE SAMPLING ATTEMPT DID NOT RESULT IN RECOVERY OF ANY SIGNIFICANT SOIL OR ROCK MATERIAL.
SPT STANDARD PENETRATION TEST: SAMPLER IS A 1.4 INCH INSIDE DIAMETER SPLIT BARREL, DRIVEN 18 INCHES WITH THE SPT HAMMER. (DISTURBED)
SH SHELBY TUBE: TAKEN WITH A THIN WALL SAMPLE TUBE, PUSHED INTO THE SOIL AND THEN EXTRACTED. (UNDISTURBED)
VANE VANE SHEAR TEST: SOIL STRENGTH OBTAINED USING
A 4 BLADED SHEAR DEVICE. TYPICALLY USED IN SOFT CLAYS-NO SAMPLE RECOVERED.
COLUMN DESCRIPTIONS DEPTH: Distance in feet below the ground surface.
SAMPLE: Sample Type as depicted above.
BLOW COUNT: Number of blows required to advance the sampler 12 inches using a 140 lb hammer with a 30-inch drop. 50/3” indicates penetration refusal (>50 blows) at 3 inches. WH indicates that the weight of the hammer was sufficient to push the sampler 6 inches or more.
POCKET PEN.: Approximate shear strength of a cohesive soil sample as measured by pocket penetrometer.
GRAPHIC LOG: Graphic Soil Symbol as depicted on the following page.
DRY DENSITY: Dry density of an undisturbed or relatively undisturbed sample in lbs/ft3.
MOISTURE CONTENT: Moisture content of a soil sample, expressed as a percentage of the dry weight.
LIQUID LIMIT: The moisture content above which a soil behaves as a liquid.
PLASTIC LIMIT: The moisture content above which a soil behaves as a plastic.
PASSING #200 SIEVE: The percentage of the sample finer than the #200 standard sieve.
UNCONFINED SHEAR: The shear strength of a cohesive soil sample, as measured in the unconfined state.

SM
SP
COARSEGRAINED
SOILS
SW
TYPICALDESCRIPTIONS
WELL-GRADED GRAVELS, GRAVEL -SAND MIXTURES, LITTLE OR NOFINES
SILTY GRAVELS, GRAVEL - SAND -SILT MIXTURES
LETTERGRAPH
POORLY-GRADED GRAVELS,GRAVEL - SAND MIXTURES, LITTLEOR NO FINES
GC
GM
GP
GW
POORLY-GRADED SANDS,GRAVELLY SAND, LITTLE OR NOFINES
SILTSAND
CLAYS
MORE THAN 50%OF MATERIAL ISLARGER THANNO. 200 SIEVE
SIZE
MORE THAN 50%OF MATERIAL ISSMALLER THANNO. 200 SIEVE
SIZE
MORE THAN 50%OF COARSEFRACTION
PASSING ON NO.4 SIEVE
MORE THAN 50%OF COARSEFRACTION
RETAINED ON NO.4 SIEVE CLAYEY GRAVELS, GRAVEL - SAND -
CLAY MIXTURES
FINEGRAINED
SOILS
SYMBOLSMAJOR DIVISIONS
SOIL CLASSIFICATION CHART
PT
OH
CH
MH
OL
CL
ML
CLEAN SANDS
SC
SILTY SANDS, SAND - SILTMIXTURES
CLAYEY SANDS, SAND - CLAYMIXTURES
INORGANIC SILTS AND VERY FINESANDS, ROCK FLOUR, SILTY ORCLAYEY FINE SANDS OR CLAYEYSILTS WITH SLIGHT PLASTICITY
INORGANIC CLAYS OF LOW TOMEDIUM PLASTICITY, GRAVELLYCLAYS, SANDY CLAYS, SILTY CLAYS,LEAN CLAYS
ORGANIC SILTS AND ORGANICSILTY CLAYS OF LOW PLASTICITY
INORGANIC SILTS, MICACEOUS ORDIATOMACEOUS FINE SAND ORSILTY SOILS
INORGANIC CLAYS OF HIGHPLASTICITY
ORGANIC CLAYS OF MEDIUM TOHIGH PLASTICITY, ORGANIC SILTS
PEAT, HUMUS, SWAMP SOILS WITHHIGH ORGANIC CONTENTS
SILTSAND
CLAYS
GRAVELS WITHFINES
SANDAND
SANDYSOILS (LITTLE OR NO FINES)
SANDS WITHFINES
LIQUID LIMITLESS THAN 50
LIQUID LIMITGREATER THAN 50
HIGHLY ORGANIC SOILS
NOTE: DUAL SYMBOLS ARE USED TO INDICATE BORDERLINE SOIL CLASSIFICATIONS
GRAVELAND
GRAVELLYSOILS
(APPRECIABLEAMOUNT OF FINES)
(APPRECIABLEAMOUNT OF FINES)
(LITTLE OR NO FINES)
WELL-GRADED SANDS, GRAVELLYSANDS, LITTLE OR NO FINES
CLEANGRAVELS

7
9
29
9
12
10
72
45
44
57
57
45
31
23
3± inches Asphaltic concrete, 4± inches Aggregate base
FILL: Gray Brown fine to coarse Sand, trace to little Silt, tracefine Gravel, mottled, dense-dry to damp
FILL: Red Brown fine to coarse Sand, little fine Gravel, littleSilt, very dense-dry to damp
FILL: Gray Brown Silty fine to medium Sand, little coarseSand, trace fine Gravel, some Iron oxide staining, verydense-moist
FILL: Gray Brown Gravelly fine to coarse Sand, little Silt, traceIron oxide staining, very dense-damp
FILL: Dark Gray to Black fine to coarse Sand, little Silt, littlefine Gravel, dense-damp to moist
ALLUVIUM: Gray fine to medium Sand, strong Organic odor,dense-damp
Dark Green to Gray fine Sandy Silt, trace medium Sand,strong Organic odor, medium dense-moist
Boring Terminated at 25'
3
2
2
9
3
7
4
13
JOB NO.: 18G112-4
PROJECT: Proposed Warehouse
LOCATION: San Bernardino County, California
BORING NO.P-1
PLATE P-1
DRILLING DATE: 5/29/18
DRILLING METHOD: Hollow Stem Auger
LOGGED BY: Joseph Lozano Leon
FIELD RESULTS LABORATORY RESULTS
CO
MM
EN
TS
SURFACE ELEVATION: --- MSL
WATER DEPTH: Dry
CAVE DEPTH: 1090 feet
READING TAKEN: At Completion
5
10
15
20
25
GR
AP
HIC
LO
G
PA
SS
ING
#200
SIE
VE
(%)
TEST BORING LOG
DESCRIPTION
PO
CK
ET
PE
N.
(TS
F)
DR
YD
EN
SIT
Y(P
CF
)
DE
PT
H(F
EE
T)
MO
IST
UR
EC
ON
TE
NT
(%)
LIQ
UID
LIM
IT
PLA
ST
ICLIM
IT
SA
MP
LE
BLO
WC
OU
NT
OR
GA
NIC
CO
NT
EN
T(%
)
TB
L1
8G
11
2-4
.GP
JS
OC
AL
GE
O.G
DT
6/1
3/1
8
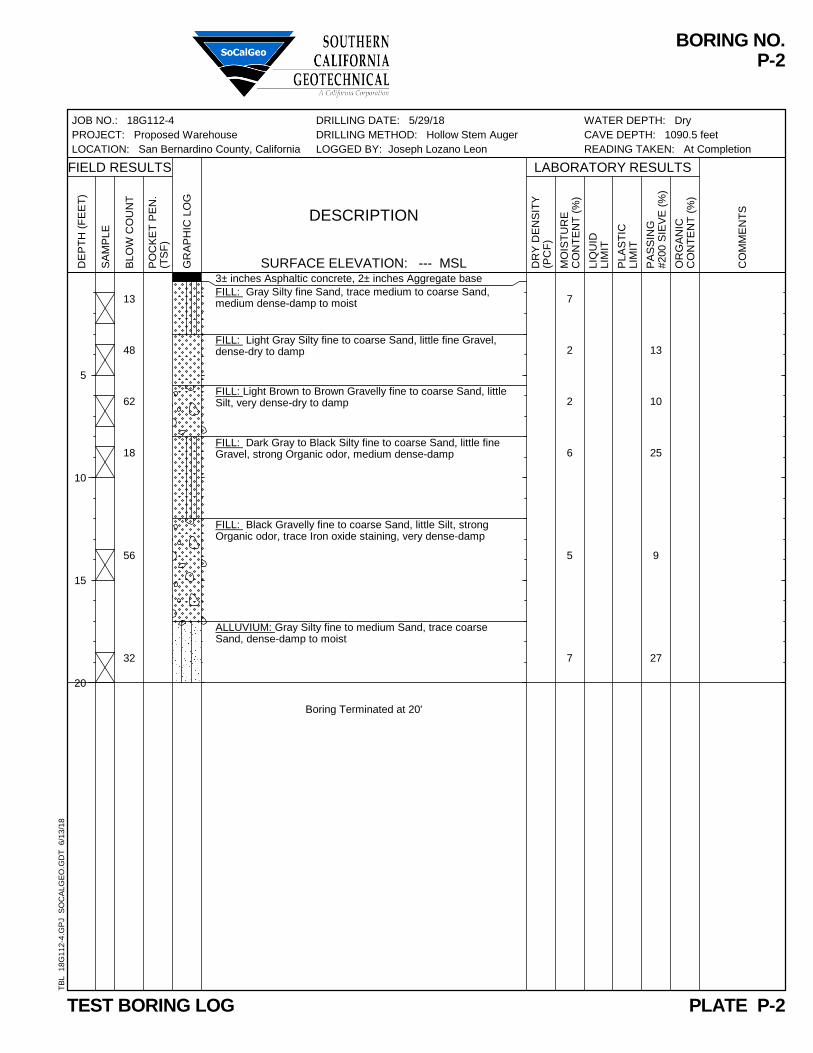
13
10
25
9
27
13
48
62
18
56
32
3± inches Asphaltic concrete, 2± inches Aggregate base
FILL: Gray Silty fine Sand, trace medium to coarse Sand,medium dense-damp to moist
FILL: Light Gray Silty fine to coarse Sand, little fine Gravel,dense-dry to damp
FILL: Light Brown to Brown Gravelly fine to coarse Sand, littleSilt, very dense-dry to damp
FILL: Dark Gray to Black Silty fine to coarse Sand, little fineGravel, strong Organic odor, medium dense-damp
FILL: Black Gravelly fine to coarse Sand, little Silt, strongOrganic odor, trace Iron oxide staining, very dense-damp
ALLUVIUM: Gray Silty fine to medium Sand, trace coarseSand, dense-damp to moist
Boring Terminated at 20'
7
2
2
6
5
7
JOB NO.: 18G112-4
PROJECT: Proposed Warehouse
LOCATION: San Bernardino County, California
BORING NO.P-2
PLATE P-2
DRILLING DATE: 5/29/18
DRILLING METHOD: Hollow Stem Auger
LOGGED BY: Joseph Lozano Leon
FIELD RESULTS LABORATORY RESULTS
CO
MM
EN
TS
SURFACE ELEVATION: --- MSL
WATER DEPTH: Dry
CAVE DEPTH: 1090.5 feet
READING TAKEN: At Completion
5
10
15
20
GR
AP
HIC
LO
G
PA
SS
ING
#200
SIE
VE
(%)
TEST BORING LOG
DESCRIPTION
PO
CK
ET
PE
N.
(TS
F)
DR
YD
EN
SIT
Y(P
CF
)
DE
PT
H(F
EE
T)
MO
IST
UR
EC
ON
TE
NT
(%)
LIQ
UID
LIM
IT
PLA
ST
ICLIM
IT
SA
MP
LE
BLO
WC
OU
NT
OR
GA
NIC
CO
NT
EN
T(%
)
TB
L1
8G
11
2-4
.GP
JS
OC
AL
GE
O.G
DT
6/1
3/1
8
37
45
86/8"
32
27
54
27
3± inches Asphaltic concrete, 4± inches Aggregate base
ALLUVIUM: Light Gray Brown to Gray Brown fine to mediumSand, trace to little fine to coarse Gravel, little Silt, tracecoarse Sand, dense-dry to damp
Light Brown to Brown Gravelly fine to coarse Sand, little Silt,dense to very dense-damp
Light Gray Brown fine to medium Sand, trace to little Silt, tracefine Gravel, dense-damp
Gray Brown Silty fine Sand to fine Sandy Silt, mediumdense-damp
Gray Brown Gravelly fine to coarse Sand, trace to little Silt,very dense-dry to damp
Brown Silty fine Sand to fine Sandy Silt, medium dense-moist
2
3
4
4
6
2
49
JOB NO.: 18G112-4
PROJECT: Proposed Warehouse
LOCATION: San Bernardino County, California
BORING NO.B-7
PLATE B-3a
DRILLING DATE: 5/29/18
DRILLING METHOD: Hollow Stem Auger
LOGGED BY: Joseph Lozano Leon
FIELD RESULTS LABORATORY RESULTS
CO
MM
EN
TS
SURFACE ELEVATION: 1089 feet MSL
WATER DEPTH: Dry
CAVE DEPTH: 45 feet
READING TAKEN: At Completion
5
10
15
20
25
30
GR
AP
HIC
LO
G
PA
SS
ING
#200
SIE
VE
(%)
TEST BORING LOG
DESCRIPTION
PO
CK
ET
PE
N.
(TS
F)
DR
YD
EN
SIT
Y(P
CF
)
DE
PT
H(F
EE
T)
MO
IST
UR
EC
ON
TE
NT
(%)
LIQ
UID
LIM
IT
PLA
ST
ICLIM
IT
SA
MP
LE
BLO
WC
OU
NT
OR
GA
NIC
CO
NT
EN
T(%
)
TB
L1
8G
11
2-4
A.G
PJ
SO
CA
LG
EO
.GD
T6
/13
/18
26
35
54
36
41
63
Brown Silty fine Sand to fine Sandy Silt, medium dense-moist
Brown fine Sandy Silt, little Iron oxide staining, mediumdense-very moist
Gray Brown Gravelly fine to medium Sand, little Silt,dense-damp
Brown to Dark Brown fine Sandy Silt, little Iron oxide staining,very dense-moist
Gray Gravelly fine to medium Sand, trace coarse Sand, littleSilt, dense-moist to very moist
Brown Silty fine Sand, some Iron oxide staining, dense-moist
Gray Brown fine to medium Sand, trace to little Silt,dense-damp
Brown Silty fine Sand, trace medium to coarse Sand, tracefine Gravel, very dense-damp
Boring Terminated at 65'
918
5
5
15
104
5
JOB NO.: 18G112-4
PROJECT: Proposed Warehouse
LOCATION: San Bernardino County, California
BORING NO.B-7
PLATE B-3b
DRILLING DATE: 5/29/18
DRILLING METHOD: Hollow Stem Auger
LOGGED BY: Joseph Lozano Leon
FIELD RESULTS LABORATORY RESULTS
CO
MM
EN
TS
(Continued)
WATER DEPTH: Dry
CAVE DEPTH: 45 feet
READING TAKEN: At Completion
40
45
50
55
60
65
GR
AP
HIC
LO
G
PA
SS
ING
#200
SIE
VE
(%)
TEST BORING LOG
DESCRIPTION
PO
CK
ET
PE
N.
(TS
F)
DR
YD
EN
SIT
Y(P
CF
)
DE
PT
H(F
EE
T)
MO
IST
UR
EC
ON
TE
NT
(%)
LIQ
UID
LIM
IT
PLA
ST
ICLIM
IT
SA
MP
LE
BLO
WC
OU
NT
OR
GA
NIC
CO
NT
EN
T(%
)
TB
L1
8G
11
2-4
A.G
PJ
SO
CA
LG
EO
.GD
T6
/13
/18

PERCOLATION CALCULATIONS - PRESATURATION
Project NameProject LocationProject NumberEngineer
Borehole Diameter 8 (in)Borehole Depth 25.2 (ft)Perforated Pipe Diameter 3 (in)Porosity of Gravel Backfill 0.4
Percolation Boring No. P-1
Inte
rvalN
um
ber
Tim
e
Tim
eIn
terv
al(h
rs)
Wate
rD
epth
(ft)
Change
inW
ate
r
Level(f
t)
Did
Seepage
Exceed
1/2
Wett
ed
Depth
?
Overn
ight
Pre
-
Satu
ration
Required?
Initial 1:00 PM 0
Final 1:30 PM 12.8
Initial 1:30 PM 0
Final 2:00 PM 12.63
Initial 2:00 PM 0
Final 2:30 PM 12.52
Initial - 0
Final - 0
Proposed WarehouseSan Bernardino County, CA18G112-4Scott McCann
1 0.5000 12.8 YES NO
2 0.5000 12.63 YES NO
3 0.5000 12.52 NO YES
4 0.0000 0 0 YES
18G112-4 Percolation Test No. P-1
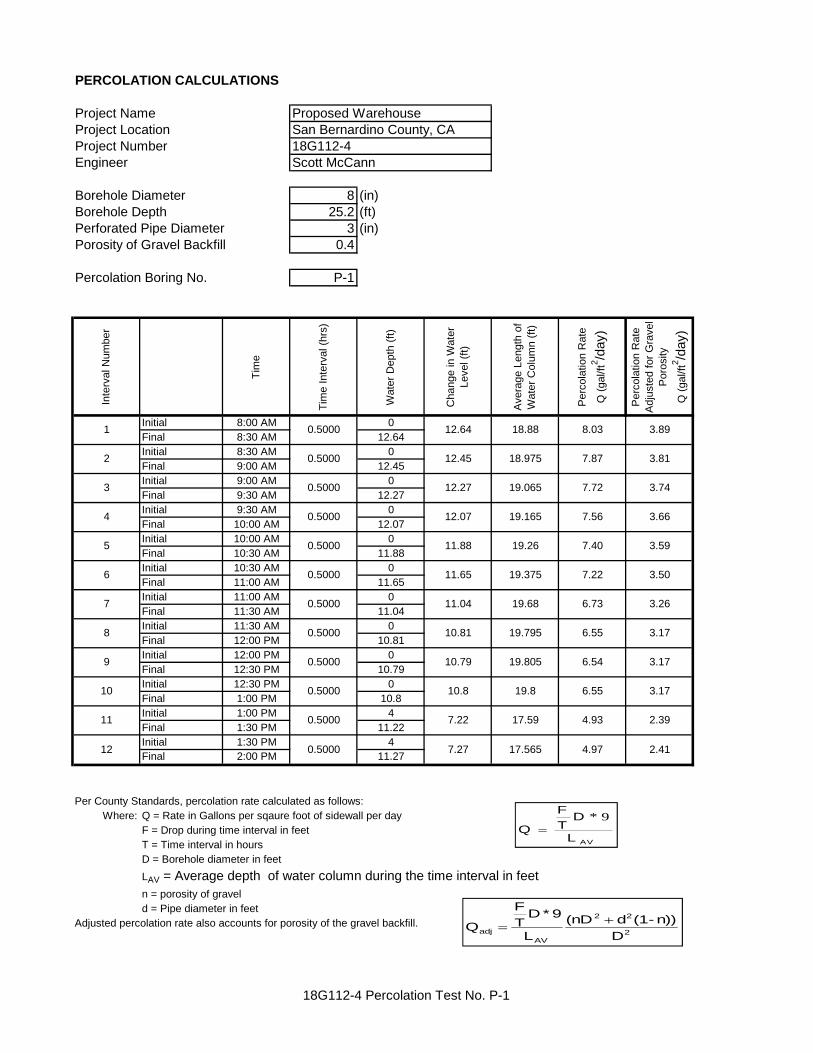
PERCOLATION CALCULATIONS
Project NameProject LocationProject NumberEngineer
Borehole Diameter 8 (in)Borehole Depth 25.2 (ft)Perforated Pipe Diameter 3 (in)Porosity of Gravel Backfill 0.4
Percolation Boring No. P-1
Inte
rvalN
um
ber
Tim
e
Tim
eIn
terv
al(h
rs)
Wate
rD
epth
(ft)
Change
inW
ate
r
Level(f
t)
Avera
ge
Length
of
Wate
rC
olu
mn
(ft)
Perc
ola
tion
Rate
Q(g
al/ft
2/d
ay)
Perc
ola
tion
Rate
Adju
ste
dfo
rG
ravel
Poro
sity
Q(g
al/ft
2/d
ay)
Initial 8:00 AM 0
Final 8:30 AM 12.64
Initial 8:30 AM 0
Final 9:00 AM 12.45
Initial 9:00 AM 0
Final 9:30 AM 12.27
Initial 9:30 AM 0
Final 10:00 AM 12.07
Initial 10:00 AM 0
Final 10:30 AM 11.88
Initial 10:30 AM 0
Final 11:00 AM 11.65
Initial 11:00 AM 0
Final 11:30 AM 11.04
Initial 11:30 AM 0
Final 12:00 PM 10.81
Initial 12:00 PM 0
Final 12:30 PM 10.79
Initial 12:30 PM 0
Final 1:00 PM 10.8
Initial 1:00 PM 4
Final 1:30 PM 11.22
Initial 1:30 PM 4
Final 2:00 PM 11.27
Per County Standards, percolation rate calculated as follows:
Where: Q = Rate in Gallons per sqaure foot of sidewall per day
F = Drop during time interval in feet
T = Time interval in hours
D = Borehole diameter in feet
LAV = Average depth of water column during the time interval in feet
n = porosity of gravel
d = Pipe diameter in feet
Adjusted percolation rate also accounts for porosity of the gravel backfill.
12 0.5000 7.27 17.565 4.97 2.41
11 0.5000 7.22 17.59 4.93 2.39
10 0.5000 10.8 19.8 6.55 3.17
9 0.5000 10.79 19.805 6.54 3.17
19.68 6.73 3.26
8 0.5000 10.81 19.795 6.55 3.17
Proposed WarehouseSan Bernardino County, CA18G112-4Scott McCann
7 0.5000 11.04
1 0.5000 12.64 18.88 8.03 3.89
2 0.5000 12.45 18.975 7.87 3.81
3 0.5000 12.27 19.065 7.72 3.74
4 0.5000 12.07 19.165 7.56 3.66
5 0.5000 11.88 19.26 7.40 3.59
6 0.5000 11.65 19.375 7.22 3.50
AVL
DT
F
Q9*
2
22
AV
adjD
n))(1-d(nD
L
9*DT
F
Q
18G112-4 Percolation Test No. P-1
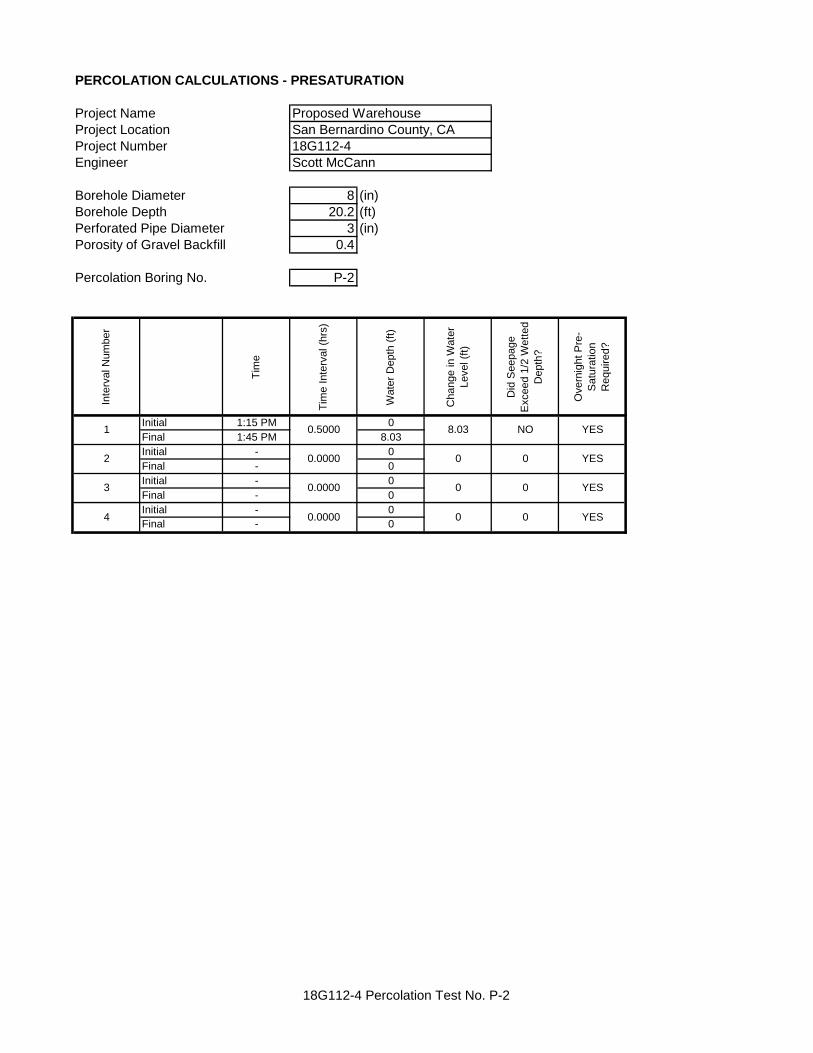
PERCOLATION CALCULATIONS - PRESATURATION
Project NameProject LocationProject NumberEngineer
Borehole Diameter 8 (in)Borehole Depth 20.2 (ft)Perforated Pipe Diameter 3 (in)Porosity of Gravel Backfill 0.4
Percolation Boring No. P-2
Inte
rvalN
um
ber
Tim
e
Tim
eIn
terv
al(h
rs)
Wate
rD
epth
(ft)
Change
inW
ate
r
Level(f
t)
Did
Seepage
Exceed
1/2
Wett
ed
Depth
?
Overn
ight
Pre
-
Satu
ration
Required?
Initial 1:15 PM 0
Final 1:45 PM 8.03
Initial - 0
Final - 0
Initial - 0
Final - 0
Initial - 0
Final - 0
3 0.0000 0 0 YES
4 0.0000 0 0 YES
NO YES
2 0.0000 0 0 YES
Proposed WarehouseSan Bernardino County, CA18G112-4Scott McCann
1 0.5000 8.03
18G112-4 Percolation Test No. P-2
PERCOLATION CALCULATIONS
Project NameProject LocationProject NumberEngineer
Borehole Diameter 8 (in)Borehole Depth 20.2 (ft)Perforated Pipe Diameter 3 (in)Porosity of Gravel Backfill 0.4
Percolation Boring No. P-2
Inte
rvalN
um
ber
Tim
e
Tim
eIn
terv
al(h
rs)
Wate
rD
epth
(ft)
Change
inW
ate
r
Level(f
t)
Avera
ge
Length
of
Wate
rC
olu
mn
(ft)
Perc
ola
tion
Rate
Q(g
al/ft
2/d
ay)
Perc
ola
tion
Rate
Adju
ste
dfo
rG
ravel
Poro
sity
Q(g
al/ft
2/d
ay)
Initial 8:15 AM 0
Final 8:45 AM 7.96
Initial 8:45 AM 0
Final 9:15 AM 7.83
Initial 9:15 AM 0
Final 9:45 AM 7.76
Initial 9:45 AM 0
Final 10:15 AM 7.75
Initial 10:15 AM 0
Final 10:45 AM 7.76
Initial 10:45 AM 0
Final 11:15 AM 7.74
Initial 11:15 AM 0
Final 11:45 AM 7.74
Initial 11:45 AM 0
Final 12:15 PM 7.73
Initial 12:15 PM 0
Final 12:45 PM 7.74
Initial 12:45 PM 7.73
Final 1:15 PM 10.8
Initial 1:15 PM 4
Final 1:45 PM 7.88
Initial 1:45 PM 4
Final 2:15 PM 7.83
Per County Standards, percolation rate calculated as follows:
Where: Q = Rate in Gallons per sqaure foot of sidewall per day
F = Drop during time interval in feet
T = Time interval in hours
D = Borehole diameter in feet
LAV = Average depth of water column during the time interval in feet
n = porosity of gravel
d = Pipe diameter in feet
Adjusted percolation rate also accounts for porosity of the gravel backfill.
12 0.5000 3.83 14.285 3.22 1.56
11 0.5000 3.88 14.26 3.27 1.58
10 0.5000 3.07 10.935 3.37 1.63
9 0.5000 7.74 16.33 5.69 2.75
8 0.5000 7.73 16.335 5.68 2.75
7 0.5000 7.74 16.33 5.69 2.75
6 0.5000 7.74 16.33 5.69 2.75
5 0.5000 7.76 16.32 5.71 2.76
4 0.5000 7.75 16.325 5.70 2.76
3 0.5000 7.76 16.32 5.71 2.76
16.22 5.89 2.85
2 0.5000 7.83 16.285 5.77 2.79
Proposed WarehouseSan Bernardino County, CA18G112-4Scott McCann
1 0.5000 7.96
AVL
DT
F
Q9*
2
22
AV
adjD
n))(1-d(nD
L
9*DT
F
Q
18G112-4 Percolation Test No. P-2

Sample Description P-1 @ 3.5 feetSoil Classification Gray Brown fine to coarse Sand, trace to little Silt, trace fine Gravel
Proposed Warehouse
San Bernardino County, CA
Project No. 18G112-4PLATE C-1
0
10
20
30
40
50
60
70
80
90
100
0.0010.010.1110100
Perc
en
tP
assin
gb
yW
eig
ht
Grain Size in Millimeters
Grain Size Distribution
Sieve Analysis Hydrometer Analysis
US Standard Sieve Sizes
Coarse Gravel Fine Gravel Crs. Sand Med. Sand Fine Sand Fines (Silt and Clay)
2 1 3/4 1/2 3/8 1/4 #4 #8 #10 #16 #20 #30 #40 #50 #100 #200
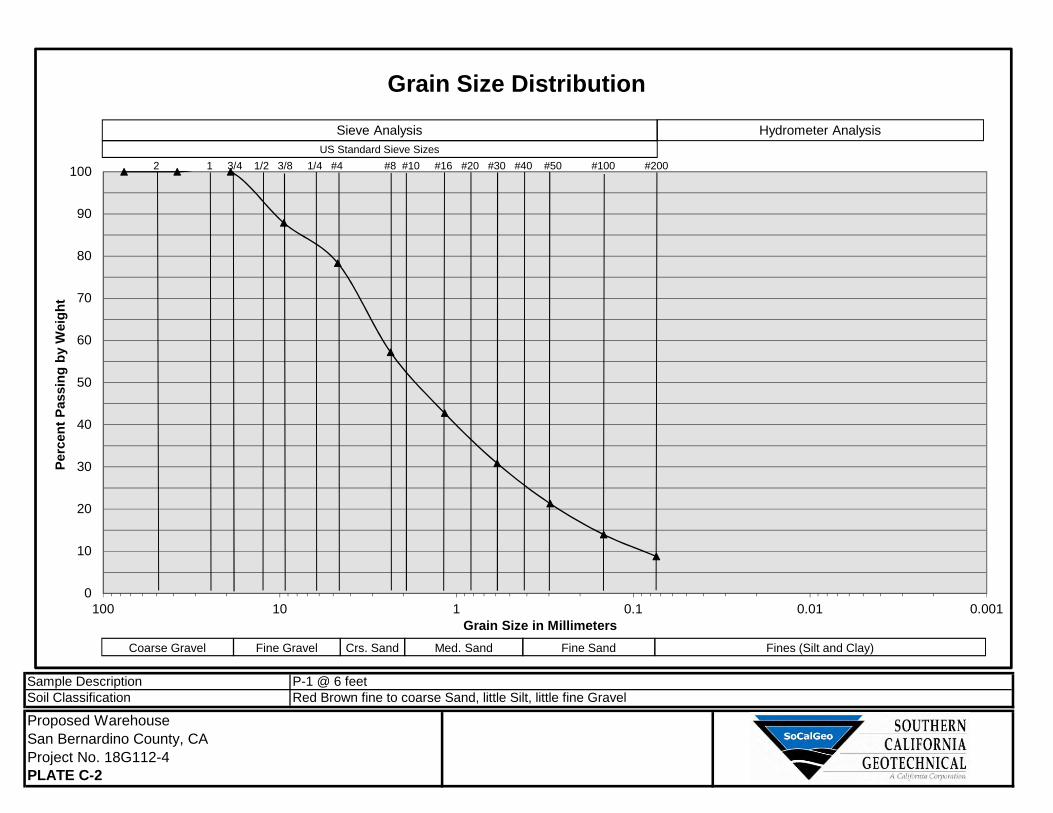
Sample Description P-1 @ 6 feetSoil Classification Red Brown fine to coarse Sand, little Silt, little fine Gravel
Proposed Warehouse
San Bernardino County, CA
Project No. 18G112-4PLATE C-2
0
10
20
30
40
50
60
70
80
90
100
0.0010.010.1110100
Perc
en
tP
assin
gb
yW
eig
ht
Grain Size in Millimeters
Grain Size Distribution
Sieve Analysis Hydrometer Analysis
US Standard Sieve Sizes
Coarse Gravel Fine Gravel Crs. Sand Med. Sand Fine Sand Fines (Silt and Clay)
2 1 3/4 1/2 3/8 1/4 #4 #8 #10 #16 #20 #30 #40 #50 #100 #200
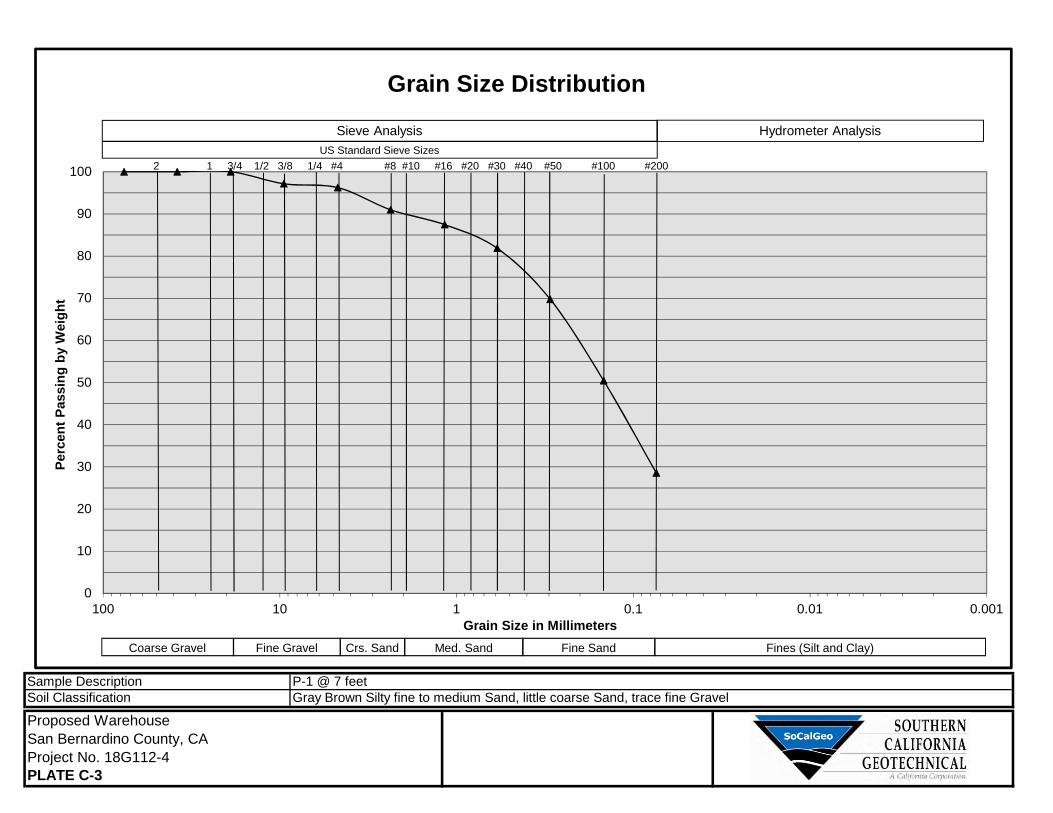
Sample Description P-1 @ 7 feetSoil Classification Gray Brown Silty fine to medium Sand, little coarse Sand, trace fine Gravel
Proposed Warehouse
San Bernardino County, CA
Project No. 18G112-4PLATE C-3
0
10
20
30
40
50
60
70
80
90
100
0.0010.010.1110100
Perc
en
tP
assin
gb
yW
eig
ht
Grain Size in Millimeters
Grain Size Distribution
Sieve Analysis Hydrometer Analysis
US Standard Sieve Sizes
Coarse Gravel Fine Gravel Crs. Sand Med. Sand Fine Sand Fines (Silt and Clay)
2 1 3/4 1/2 3/8 1/4 #4 #8 #10 #16 #20 #30 #40 #50 #100 #200

Sample Description P-1 @ 8.5 feetSoil Classification Gray Gravelly fine to coarse Sand, little Silt
Proposed Warehouse
San Bernardino County, CA
Project No. 18G112-4PLATE C-4
0
10
20
30
40
50
60
70
80
90
100
0.0010.010.1110100
Perc
en
tP
assin
gb
yW
eig
ht
Grain Size in Millimeters
Grain Size Distribution
Sieve Analysis Hydrometer Analysis
US Standard Sieve Sizes
Coarse Gravel Fine Gravel Crs. Sand Med. Sand Fine Sand Fines (Silt and Clay)
2 1 3/4 1/2 3/8 1/4 #4 #8 #10 #16 #20 #30 #40 #50 #100 #200

Sample Description P-1 @ 13.5 feetSoil Classification Dark Gray to Black fine to coarse Sand, little Silt, little fine Gravel
Proposed Warehouse
San Bernardino County, CA
Project No. 18G112-4PLATE C-5
0
10
20
30
40
50
60
70
80
90
100
0.0010.010.1110100
Perc
en
tP
assin
gb
yW
eig
ht
Grain Size in Millimeters
Grain Size Distribution
Sieve Analysis Hydrometer Analysis
US Standard Sieve Sizes
Coarse Gravel Fine Gravel Crs. Sand Med. Sand Fine Sand Fines (Silt and Clay)
2 1 3/4 1/2 3/8 1/4 #4 #8 #10 #16 #20 #30 #40 #50 #100 #200

Sample Description P-1 @ 18.5 feetSoil Classification Gray fine to medium Sand, little Silt
Proposed Warehouse
San Bernardino County, CA
Project No. 18G112-4PLATE C-6
0
10
20
30
40
50
60
70
80
90
100
0.0010.010.1110100
Perc
en
tP
assin
gb
yW
eig
ht
Grain Size in Millimeters
Grain Size Distribution
Sieve Analysis Hydrometer Analysis
US Standard Sieve Sizes
Coarse Gravel Fine Gravel Crs. Sand Med. Sand Fine Sand Fines (Silt and Clay)
2 1 3/4 1/2 3/8 1/4 #4 #8 #10 #16 #20 #30 #40 #50 #100 #200

Sample Description P-1 @ 23.5 feetSoil Classification Dark Green to Gray fine Sandy Silt, trace medium Sand
Proposed Warehouse
San Bernardino County, CA
Project No. 18G112-4PLATE C-7
0
10
20
30
40
50
60
70
80
90
100
0.0010.010.1110100
Perc
en
tP
assin
gb
yW
eig
ht
Grain Size in Millimeters
Grain Size Distribution
Sieve Analysis Hydrometer Analysis
US Standard Sieve Sizes
Coarse Gravel Fine Gravel Crs. Sand Med. Sand Fine Sand Fines (Silt and Clay)
2 1 3/4 1/2 3/8 1/4 #4 #8 #10 #16 #20 #30 #40 #50 #100 #200
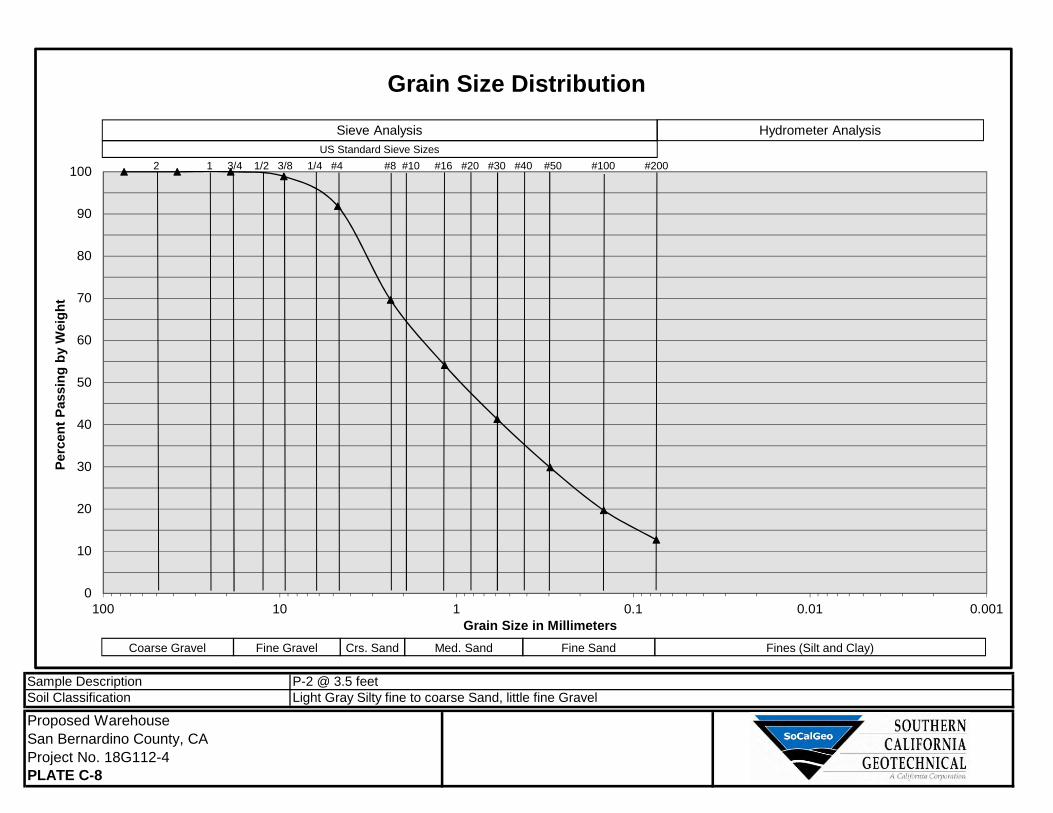
Sample Description P-2 @ 3.5 feetSoil Classification Light Gray Silty fine to coarse Sand, little fine Gravel
Proposed Warehouse
San Bernardino County, CA
Project No. 18G112-4PLATE C-8
0
10
20
30
40
50
60
70
80
90
100
0.0010.010.1110100
Perc
en
tP
assin
gb
yW
eig
ht
Grain Size in Millimeters
Grain Size Distribution
Sieve Analysis Hydrometer Analysis
US Standard Sieve Sizes
Coarse Gravel Fine Gravel Crs. Sand Med. Sand Fine Sand Fines (Silt and Clay)
2 1 3/4 1/2 3/8 1/4 #4 #8 #10 #16 #20 #30 #40 #50 #100 #200
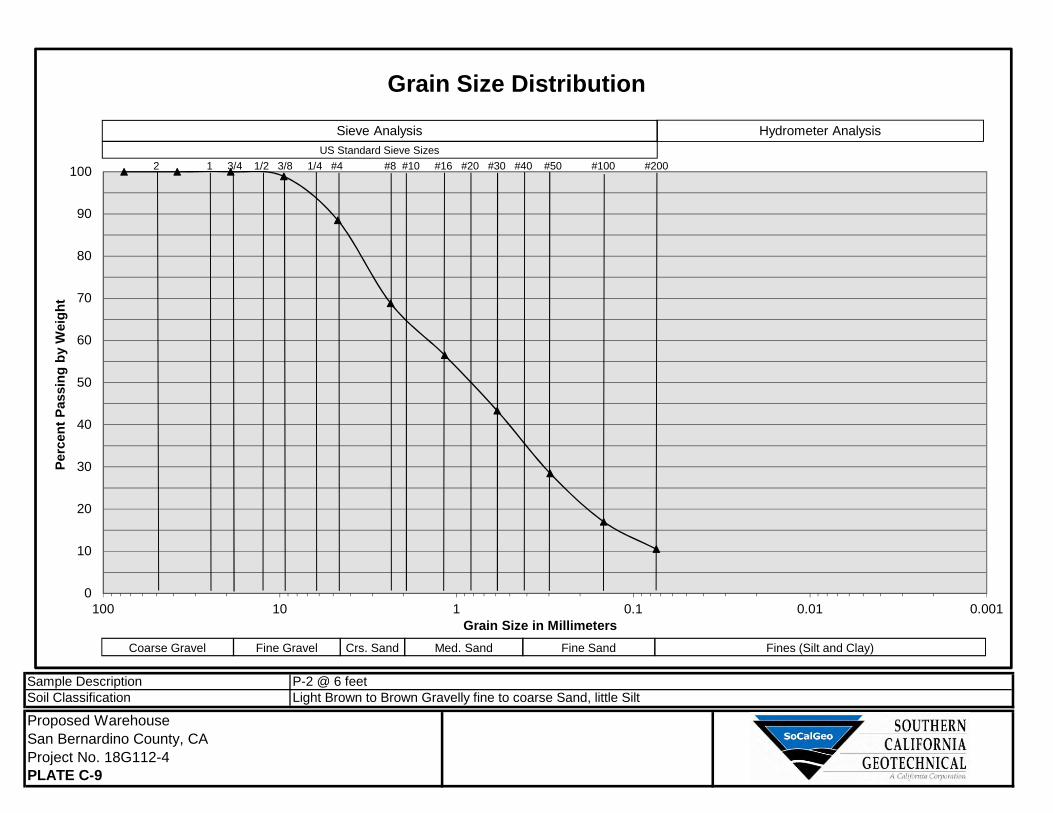
Sample Description P-2 @ 6 feetSoil Classification Light Brown to Brown Gravelly fine to coarse Sand, little Silt
Proposed Warehouse
San Bernardino County, CA
Project No. 18G112-4PLATE C-9
0
10
20
30
40
50
60
70
80
90
100
0.0010.010.1110100
Perc
en
tP
assin
gb
yW
eig
ht
Grain Size in Millimeters
Grain Size Distribution
Sieve Analysis Hydrometer Analysis
US Standard Sieve Sizes
Coarse Gravel Fine Gravel Crs. Sand Med. Sand Fine Sand Fines (Silt and Clay)
2 1 3/4 1/2 3/8 1/4 #4 #8 #10 #16 #20 #30 #40 #50 #100 #200

Sample Description P-2 @ 8.5 feetSoil Classification Dark Gray to Black Silty fine to coarse Sand, little fine Gravel
Proposed Warehouse
San Bernardino County, CA
Project No. 18G112-4PLATE C-10
0
10
20
30
40
50
60
70
80
90
100
0.0010.010.1110100
Perc
en
tP
assin
gb
yW
eig
ht
Grain Size in Millimeters
Grain Size Distribution
Sieve Analysis Hydrometer Analysis
US Standard Sieve Sizes
Coarse Gravel Fine Gravel Crs. Sand Med. Sand Fine Sand Fines (Silt and Clay)
2 1 3/4 1/2 3/8 1/4 #4 #8 #10 #16 #20 #30 #40 #50 #100 #200
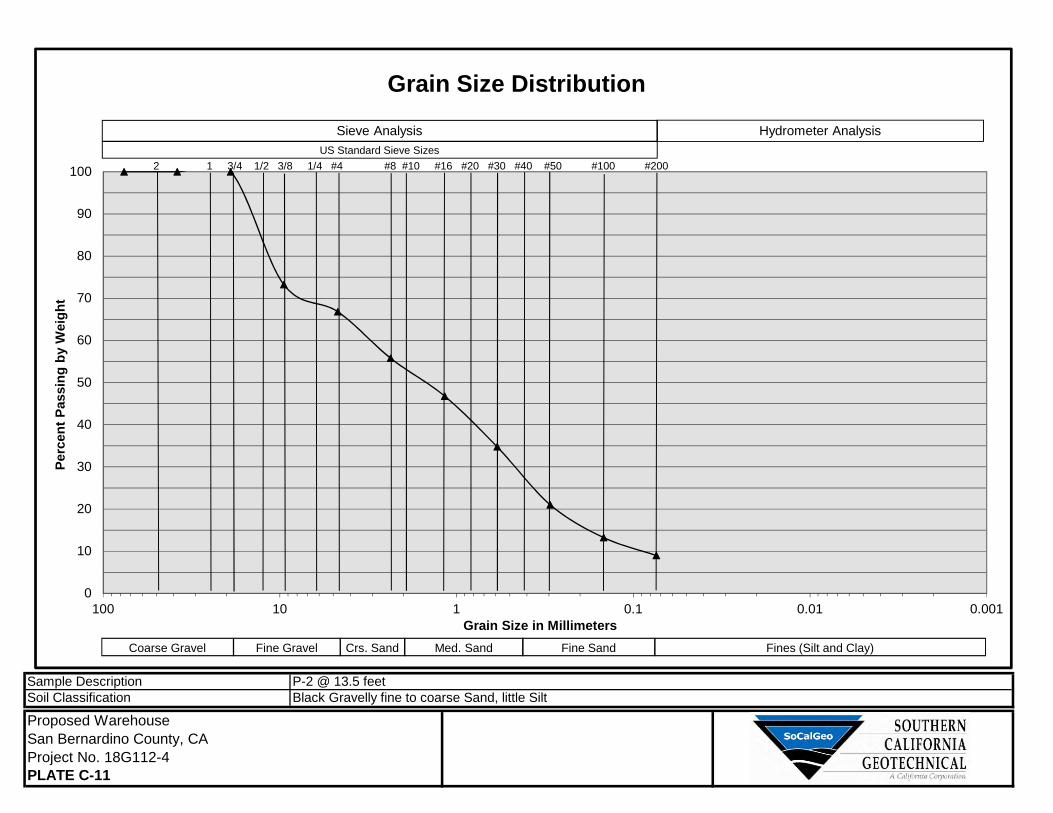
Sample Description P-2 @ 13.5 feetSoil Classification Black Gravelly fine to coarse Sand, little Silt
Proposed Warehouse
San Bernardino County, CA
Project No. 18G112-4PLATE C-11
0
10
20
30
40
50
60
70
80
90
100
0.0010.010.1110100
Perc
en
tP
assin
gb
yW
eig
ht
Grain Size in Millimeters
Grain Size Distribution
Sieve Analysis Hydrometer Analysis
US Standard Sieve Sizes
Coarse Gravel Fine Gravel Crs. Sand Med. Sand Fine Sand Fines (Silt and Clay)
2 1 3/4 1/2 3/8 1/4 #4 #8 #10 #16 #20 #30 #40 #50 #100 #200

Sample Description P-2 @ 18.5 feetSoil Classification Gray Silty fine to medium Sand, trace coarse Sand
Proposed Warehouse
San Bernardino County, CA
Project No. 18G112-4PLATE C-12
0
10
20
30
40
50
60
70
80
90
100
0.0010.010.1110100
Perc
en
tP
assin
gb
yW
eig
ht
Grain Size in Millimeters
Grain Size Distribution
Sieve Analysis Hydrometer Analysis
US Standard Sieve Sizes
Coarse Gravel Fine Gravel Crs. Sand Med. Sand Fine Sand Fines (Silt and Clay)
2 1 3/4 1/2 3/8 1/4 #4 #8 #10 #16 #20 #30 #40 #50 #100 #200