appendix h sinkhole report - florida disaster · table 1 calculation of weights for the...
TRANSCRIPT

Appendix H: Sinkhole Report 2018 State Hazard Mitigation Plan _______________________________________________________________________________________
_______________________________________________________________________________________Florida Division of Emergency Management
APPENDIX H:
Sinkhole Report

THE FAVORABILITY OF FLORIDA’S GEOLOGY TO SINKHOLE FORMATION
Florida Department of Environmental Protection, Florida Geological Survey
3000 Commonwealth Boulevard, Suite 1, Tallahassee, Florida 32303
June 2017
Prepared For:
The Florida Division of Emergency Management,
Mitigation Section

1 | P a g e
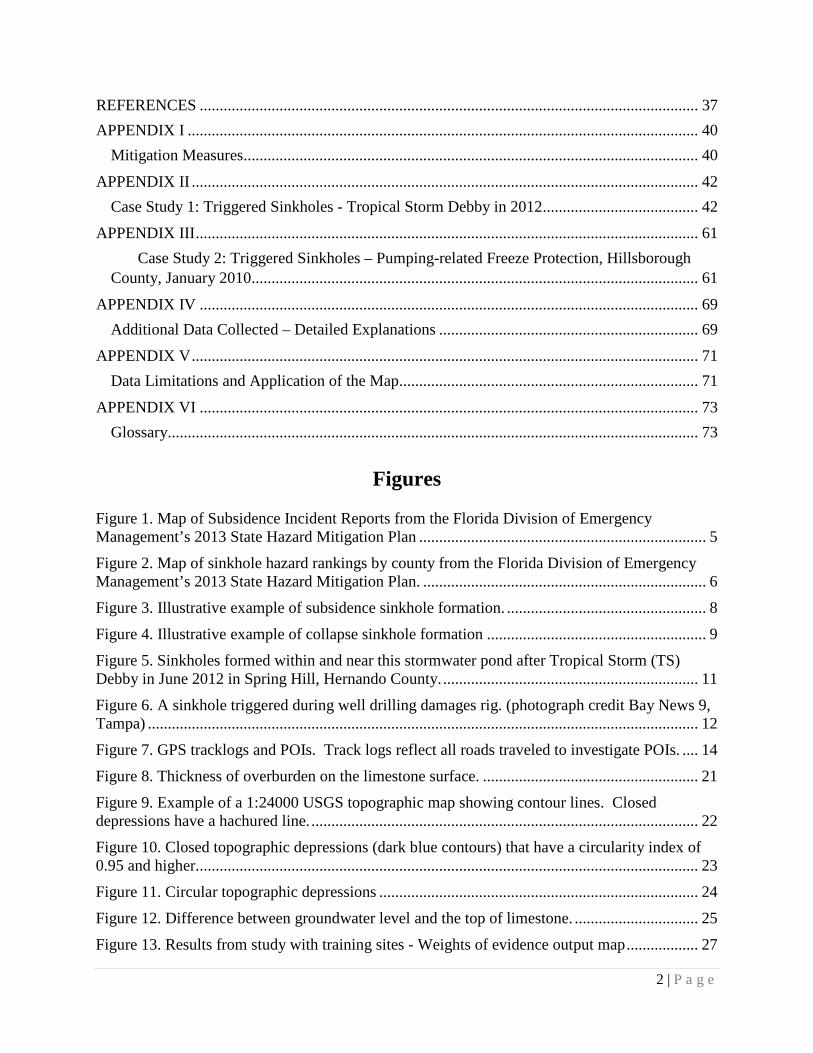
Table of Contents EXECUTIVE SUMMARY ............................................................................................................ 4
INTRODUCTION .......................................................................................................................... 4
Background ................................................................................................................................. 5
Subsidence Incident Report Database ..................................................................................... 6
Purpose and Scope ...................................................................................................................... 7
Sinkhole Development ................................................................................................................ 7
Subsidence Sinkhole Formation .............................................................................................. 8
Collapse Sinkhole Formation .................................................................................................. 9
Sinkhole Reactivation .............................................................................................................. 9
Sinkhole Formation Triggers ...................................................................................................... 9
Natural Triggers ....................................................................................................................... 9
Anthropogenic Triggers ......................................................................................................... 10
METHODS ................................................................................................................................... 12
Field Methods............................................................................................................................ 12
Pre-fieldwork Site Reconnaissance ....................................................................................... 12
Field Data Collection ............................................................................................................. 13
Data Collected ....................................................................................................................... 15
Modeling ................................................................................................................................... 17
Study Area ............................................................................................................................. 17
Training Sites Theme and Prior Probability .......................................................................... 17
Data Layer Development ....................................................................................................... 18
Evidential Themes ................................................................................................................. 18
Response Theme .................................................................................................................... 20
MODELING RESULTS ............................................................................................................... 20
Validation of Response Theme.............................................................................................. 29
Random 75% Subset of Training Sites .................................................................................. 30
Data Limitations .................................................................................................................... 33
Application of the Map .......................................................................................................... 33
Disclaimer .............................................................................................................................. 34
CONCLUSIONS .......................................................................................................................... 35
FUTURE IMPROVEMENTS ...................................................................................................... 35
2 | P a g e
REFERENCES ............................................................................................................................. 37
APPENDIX I ................................................................................................................................ 40
Mitigation Measures .................................................................................................................. 40
APPENDIX II ............................................................................................................................... 42
Case Study 1: Triggered Sinkholes - Tropical Storm Debby in 2012 ....................................... 42
APPENDIX III .............................................................................................................................. 61
Case Study 2: Triggered Sinkholes – Pumping-related Freeze Protection, Hillsborough County, January 2010................................................................................................................ 61
APPENDIX IV ............................................................................................................................. 69
Additional Data Collected – Detailed Explanations ................................................................. 69
APPENDIX V ............................................................................................................................... 71
Data Limitations and Application of the Map........................................................................... 71
APPENDIX VI ............................................................................................................................. 73
Glossary..................................................................................................................................... 73
Figures
Figure 1. Map of Subsidence Incident Reports from the Florida Division of Emergency Management’s 2013 State Hazard Mitigation Plan ........................................................................ 5
Figure 2. Map of sinkhole hazard rankings by county from the Florida Division of Emergency Management’s 2013 State Hazard Mitigation Plan. ....................................................................... 6
Figure 3. Illustrative example of subsidence sinkhole formation. .................................................. 8
Figure 4. Illustrative example of collapse sinkhole formation ....................................................... 9
Figure 5. Sinkholes formed within and near this stormwater pond after Tropical Storm (TS) Debby in June 2012 in Spring Hill, Hernando County. ................................................................ 11
Figure 6. A sinkhole triggered during well drilling damages rig. (photograph credit Bay News 9, Tampa) .......................................................................................................................................... 12
Figure 7. GPS tracklogs and POIs. Track logs reflect all roads traveled to investigate POIs. .... 14
Figure 8. Thickness of overburden on the limestone surface. ...................................................... 21
Figure 9. Example of a 1:24000 USGS topographic map showing contour lines. Closed depressions have a hachured line. ................................................................................................. 22
Figure 10. Closed topographic depressions (dark blue contours) that have a circularity index of 0.95 and higher.............................................................................................................................. 23
Figure 11. Circular topographic depressions ................................................................................ 24
Figure 12. Difference between groundwater level and the top of limestone. ............................... 25
Figure 13. Results from study with training sites - Weights of evidence output map .................. 27

3 | P a g e
Figure 14. Sinkhole favorability classes ....................................................................................... 28
Figure 15. Map depicting calculated confidence values for the sinkhole favorability map. ........ 29
Figure 16. Results from study with 25% of the training sites held back. ..................................... 30
Figure 17. Results from favorability analysis compared with the subjective dataset of Subsidence Incident Report (points). ............................................................................................................... 32
Tables Table 1 Calculation of weights for the reclassified overburden evidential layer. ........................ 20
Table 2 Calculated weights for layer depicting the presence or absence of karst features based on the circularity index and depth from the USGS 1:24,000 topographic contour lines. .................. 26
Table 3 Calculated weights for the epiphreatic thickness layer. ................................................... 26
Table 4 Calculated weights for overburden thickness vs observed sinkhole features across Florida. .......................................................................................................................................... 26
Table 5. Example cross-tabulation matrix of the area in square kilometers per class of the favorability response theme and the 75% subset response theme. ............................................... 31
Table 6. Kappa coefficient values and their associated interpretation (Landis and Koch, 1977). 31
Table 7. Results from statewide study with Subsidence Incident Reports. .................................. 33
4 | P a g e
THE FAVORABILITY OF FLORIDA’S GEOLOGY TO SINKHOLE FORMATION
By Clint Kromhout (P.G. #2522), Alan E. Baker (P.G. 2324), Casey K. Albritton, Thomas M. Scott (P.G. #99), James R. Cichon (P.G. #2830), and Scott R. Miller
EXECUTIVE SUMMARY
The Florida Division of Emergency Management (DEM) contracted the Florida Geological Survey (FGS) to map the favorability of the State’s geology to sinkhole formation in response a large outbreak of sinkholes across the State following Tropical Storm Debby in late June 2012. The project’s results are intended to bolster the State Hazard Mitigation Plan’s section on sinkhole hazards allowing for improved mitigation strategies. The three-and-a-half-year project was funded by the Federal Emergency Management Administration’ s Hazard Mitigation Grant Program (75%) and the State of Florida (25%).
The FGS used a modeling technique called Weights of Evidence (WofE) that involves the combination of diverse spatial data to describe and analyze interactions and generate predictive models from which a map of favorability can be produced. The project began with a one year pilot study in Columbia, Hamilton, and Suwannee Counties, during which methodologies were developed in preparation to model the entire state. To train and validate the model, locations of sinkholes were required. Over two-and-a-half-years, field teams traversed the state investigating over 3,600 points of interest (potential sinkholes) and mapped 705 sinkholes. After evaluating fourteen different spatial data types, the three statistically strong spatial data layers were used to model the favorability of the State’s geology for sinkhole formation. The resulting map depicts four classes representing areas where the geology is least favorable to most favorable to sinkhole formation, see Figure 13 herein. It is suggested the map be used at a scale of 1:100,000 or smaller. The digital version of the data will be delivered in one kilometer grid cells corresponding with the United States National Grid system and will be symbolized/attributed with the highest favorability class that the one kilometer cell intersects.
INTRODUCTION
Sinkholes are a geological hazard that places property and lives at risk. Kuniansky et al (2015) estimate the direct cost of damage associated with sinkhole collapses in the United States averages more than $300 million per year. In Florida, five people are known to have lost their lives due to sinkhole collapse. As Florida’s population increases, the potential for individuals to be negatively impacted by a sinkhole increases.
Florida is underlain by several thousand feet of carbonate rock, limestone and dolostone, with a variably thick mixture of sands, clays, shells, and other near surface carbonate rock units, called overburden. Those several thousand feet of carbonate rocks are host to one of the world’s most productive aquifers, the Floridan aquifer system. Erosional processes, physical and chemical, have acted upon these carbonate rocks as water flows through them creating fissures and cavities within the rock. Those erosional processes have created Florida’s karst topography, which is characterized by the presence of sinkholes, swallets, caves (wet and dry), submerged conduits, springs, and disappearing / reappearing streams.
Sinkholes are landforms created when the overburden subsides or collapses into fissures and cavities in underlying carbonate rocks. Four types of sinkholes are found in Florida: cover-collapse, rock-collapse, cover-subsidence, and solution subsidence. For simplicity and based on their rate of formation, we have reduced the number discussed to two types of sinkholes: cover collapse sinkholes (rapid) and cover
5 | P a g e
subsidence sinkholes (slow), hereafter referred to as “collapse” and “subsidence” sinkholes. Collapse sinkholes form when the ceiling of an underground cavity can no longer support the overlying weight, resulting in an abrupt collapse of the overburden into the cavity, thereby forming a hole at land surface. Subsidence sinkholes form as the overburden slowly migrates down into the fissures and cavities in the underlying rock. The result of a subsidence sinkhole is a depression in the land surface. Geologic and hydrogeologic conditions exist below land surface that result in formation of sinkholes.
Background
In June 2012, Florida experienced a mass sinkhole event triggered by record rainfall from Tropical Storm Debby following an extended period of drought. This event led to the formation of hundreds of collapse sinkholes across the state, which resulted in highway and residential road closures, evacuations of homes, and closure of buildings. Following that event, the Florida Division of Emergency Management (DEM) evaluated the State Hazard Mitigation Plan’s (SHMP) section on sinkholes and found it to be insufficient as an effective sinkhole mitigation resource and guide to prepare for and respond to this type of hazard.
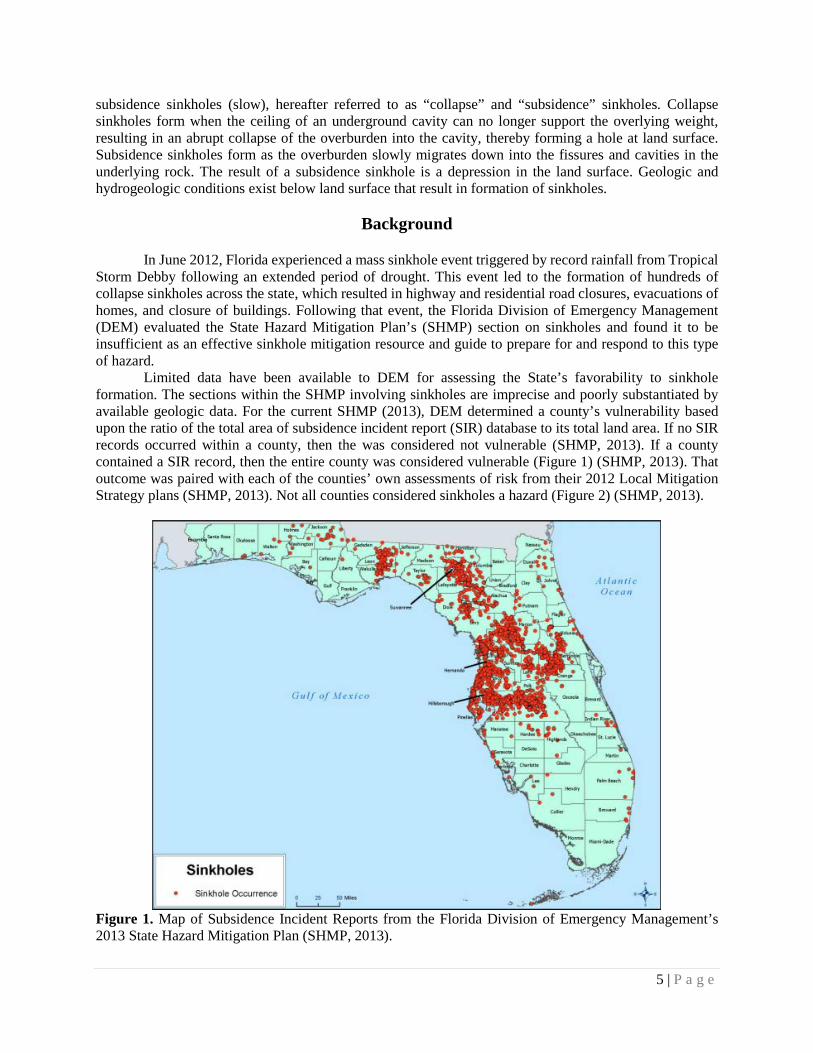
Limited data have been available to DEM for assessing the State’s favorability to sinkhole formation. The sections within the SHMP involving sinkholes are imprecise and poorly substantiated by available geologic data. For the current SHMP (2013), DEM determined a county’s vulnerability based upon the ratio of the total area of subsidence incident report (SIR) database to its total land area. If no SIR records occurred within a county, then the was considered not vulnerable (SHMP, 2013). If a county contained a SIR record, then the entire county was considered vulnerable (Figure 1) (SHMP, 2013). That outcome was paired with each of the counties’ own assessments of risk from their 2012 Local Mitigation Strategy plans (SHMP, 2013). Not all counties considered sinkholes a hazard (Figure 2) (SHMP, 2013).
Figure 1. Map of Subsidence Incident Reports from the Florida Division of Emergency Management’s 2013 State Hazard Mitigation Plan (SHMP, 2013).

6 | P a g e
Figure 2. Map of sinkhole hazard rankings by county from the Florida Division of Emergency Management’s 2013 State Hazard Mitigation Plan. Subsidence Incident Report Database
The “Florida sinkhole index” was initiated by the Florida Geological Survey (FGS) in the 1950’s
for scientific research purposes. The data collected was voluntarily reported by citizens, city and county agencies, and the Florida Department of Transportation. Few of the reports were field verified by geologists. In early 1983, the database was moved to the newly legislatively authorized Florida Sinkhole Research Institute (FSRI), where an effort was made to increase the number of records entered into the database. Although the number of sinkholes reported more than doubled during the FSRI tenure (Tihansky, 1999), some were not field validated and most were voluntarily reported. In 1992, the FSRI was eliminated, and the database reverted to the FGS, where again the reports were voluntary and few were validated in the field by geologists.
In recent years, a majority of the sinkhole reports come from DEM’s State Watch Office, which has an optional reporting form available to county, city, and state dispatchers in the event a call comes in regarding a possible sinkhole occurrence. The second source is from citizens who either fill out and submit our Subsidence Incident Report form (via mail, email, fax) or by calling the FGS. The third source is via emergency situations where a swarm of sinkholes occurs, and the FGS is called in by emergency officials to help survey the sinkhole hazard, such as after TS Debby or the January 2010 freeze event in the Plant City area. During those responses, FGS geologists recorded data about the sinkholes. This is an important data collection effort as the sinkholes affecting structures are often rapidly remediated and unrecognizable in as quickly as hours to days to weeks to months.
In 2008, the database was renamed to subsidence incident reports to clarify that the database records may or may not reflect true sinkholes. For example, a reported subsidence may be caused solely by subsurface erosion from broken water supply main and is therefore not a sinkhole. Other causes for land subsidence that may be confused with sinkholes include: 1) subsurface expansive clay or organic layers

7 | P a g e
which compress as water is removed, 2) collapsed or broken sewer and drain pipes or broken septic tanks, 3) improperly compacted soil after excavation work, 4) buried trash, logs, and other debris, and 5) animal burrows. Very few of the reports within the database have been verified by a professional geologist as true sinkholes. Additionally, the reports do not differentiate between subsidence and collapse sinkholes which is important to understanding the geological and hydrogeological conditions in which they form.
In addition to inaccuracies in the SIR database, there also exists a geographic bias. Since the data is voluntarily reported, the data is spatially biased towards population centers. For example, a sinkhole formed in rangeland or a national forest is much less likely to be reported than one in a neighborhood. The frequency of subsidence incident reporting also varies by county; some actively report where sinkholes are of constant concern, some only occasionally report, and some only rarely report. Additionally, the methods and quality of reporting location have varied greatly over time. As such, the SIR locations cannot be wholly trusted, akin to the subsidence incident itself. While not suitable for use as a scientifically defensible map of sinkhole occurrence, the SIR database has some use as a validation tool (see Modeling Results).
Purpose and Scope
The FGS was contracted by the DEM to produce a map depicting the State’s favorability to sinkhole formation. To achieve that goal, the FGS utilized a spatial statistical modeling technique, called Weights-of-Evidence (WofE), in a geographic information system (GIS) computing environment (Bonham and Carter, 1994). The three-year project began with a one-year pilot study in three northern Florida counties: Columbia, Hamilton, and Suwannee (Kromhout and Baker, 2015). The three pilot counties were picked for their geologic and topographic diversity and experienced the 2012 Tropical Storm Debby sinkhole event. Selecting a pilot area with diversity was important to subsequently modeling the State’s geology at the statewide scale. In years two and three, the statewide study was conducted building off what was learned from the pilot study. The scope of work included field data collection documenting new and existing sinkholes, researching and developing geologic GIS data sets, modeling, and reporting.
Sinkhole Development
Dissolution of carbonate rock forms karst’s characteristic topography which is dominated by sinkholes (Waltham et al, 2005). Dissolution slowly occurs when naturally acidic rain water, surface water, or groundwater encounters Florida’s carbonate rocks, limestone (CaCO3) and dolostone (CaMg(CO3)2). A weak carbonic acid (H2CO3) naturally forms as water (H2O) mixes with carbon dioxide (CO2) in the atmosphere and soils and is the primary dissolution mechanism leading to cavity development.
A sinkhole is classified based upon formation rate and process, as well as geological and hydrogeological characteristics. There are four types of sinkholes present in Florida; however, for the purposes of this study which focuses on sinkholes as a hazard to human life and property, sinkholes will be simply classified based upon their rate of formation. Simply, sinkholes form either rapid (minutes to hours) or slow (months to years). Sinkholes can form by natural and anthropogenic influences.
8 | P a g e
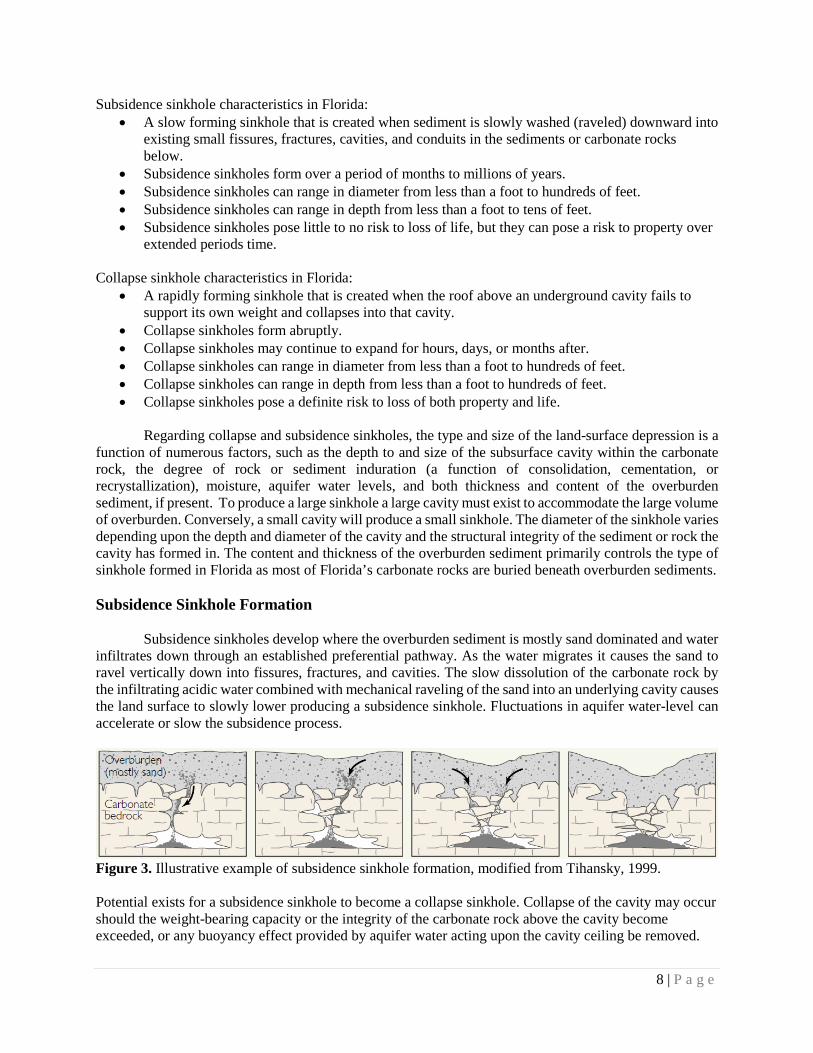
Subsidence sinkhole characteristics in Florida: • A slow forming sinkhole that is created when sediment is slowly washed (raveled) downward into
existing small fissures, fractures, cavities, and conduits in the sediments or carbonate rocks below.
• Subsidence sinkholes form over a period of months to millions of years. • Subsidence sinkholes can range in diameter from less than a foot to hundreds of feet. • Subsidence sinkholes can range in depth from less than a foot to tens of feet. • Subsidence sinkholes pose little to no risk to loss of life, but they can pose a risk to property over
extended periods time. Collapse sinkhole characteristics in Florida:
• A rapidly forming sinkhole that is created when the roof above an underground cavity fails to support its own weight and collapses into that cavity.
• Collapse sinkholes form abruptly. • Collapse sinkholes may continue to expand for hours, days, or months after. • Collapse sinkholes can range in diameter from less than a foot to hundreds of feet. • Collapse sinkholes can range in depth from less than a foot to hundreds of feet. • Collapse sinkholes pose a definite risk to loss of both property and life.
Regarding collapse and subsidence sinkholes, the type and size of the land-surface depression is a
function of numerous factors, such as the depth to and size of the subsurface cavity within the carbonate rock, the degree of rock or sediment induration (a function of consolidation, cementation, or recrystallization), moisture, aquifer water levels, and both thickness and content of the overburden sediment, if present. To produce a large sinkhole a large cavity must exist to accommodate the large volume of overburden. Conversely, a small cavity will produce a small sinkhole. The diameter of the sinkhole varies depending upon the depth and diameter of the cavity and the structural integrity of the sediment or rock the cavity has formed in. The content and thickness of the overburden sediment primarily controls the type of sinkhole formed in Florida as most of Florida’s carbonate rocks are buried beneath overburden sediments. Subsidence Sinkhole Formation
Subsidence sinkholes develop where the overburden sediment is mostly sand dominated and water infiltrates down through an established preferential pathway. As the water migrates it causes the sand to ravel vertically down into fissures, fractures, and cavities. The slow dissolution of the carbonate rock by the infiltrating acidic water combined with mechanical raveling of the sand into an underlying cavity causes the land surface to slowly lower producing a subsidence sinkhole. Fluctuations in aquifer water-level can accelerate or slow the subsidence process.
Figure 3. Illustrative example of subsidence sinkhole formation, modified from Tihansky, 1999. Potential exists for a subsidence sinkhole to become a collapse sinkhole. Collapse of the cavity may occur should the weight-bearing capacity or the integrity of the carbonate rock above the cavity become exceeded, or any buoyancy effect provided by aquifer water acting upon the cavity ceiling be removed.
9 | P a g e
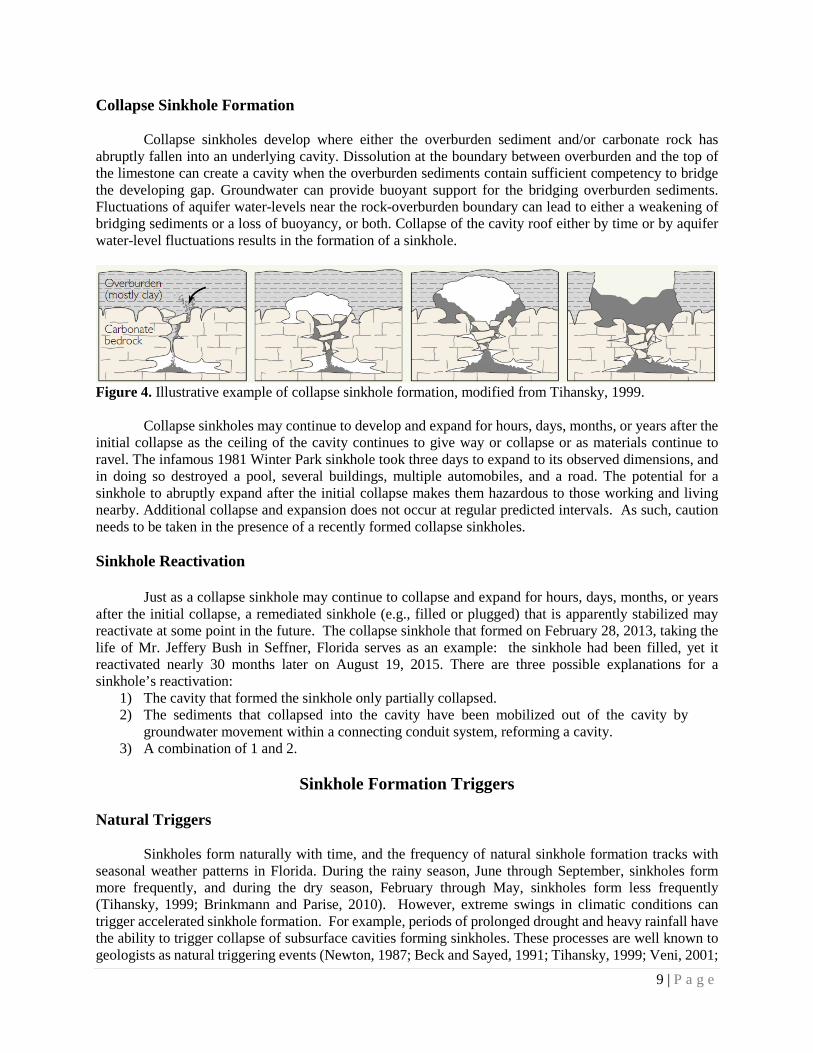
Collapse Sinkhole Formation
Collapse sinkholes develop where either the overburden sediment and/or carbonate rock has abruptly fallen into an underlying cavity. Dissolution at the boundary between overburden and the top of the limestone can create a cavity when the overburden sediments contain sufficient competency to bridge the developing gap. Groundwater can provide buoyant support for the bridging overburden sediments. Fluctuations of aquifer water-levels near the rock-overburden boundary can lead to either a weakening of bridging sediments or a loss of buoyancy, or both. Collapse of the cavity roof either by time or by aquifer water-level fluctuations results in the formation of a sinkhole.
Figure 4. Illustrative example of collapse sinkhole formation, modified from Tihansky, 1999.
Collapse sinkholes may continue to develop and expand for hours, days, months, or years after the initial collapse as the ceiling of the cavity continues to give way or collapse or as materials continue to ravel. The infamous 1981 Winter Park sinkhole took three days to expand to its observed dimensions, and in doing so destroyed a pool, several buildings, multiple automobiles, and a road. The potential for a sinkhole to abruptly expand after the initial collapse makes them hazardous to those working and living nearby. Additional collapse and expansion does not occur at regular predicted intervals. As such, caution needs to be taken in the presence of a recently formed collapse sinkholes. Sinkhole Reactivation
Just as a collapse sinkhole may continue to collapse and expand for hours, days, months, or years after the initial collapse, a remediated sinkhole (e.g., filled or plugged) that is apparently stabilized may reactivate at some point in the future. The collapse sinkhole that formed on February 28, 2013, taking the life of Mr. Jeffery Bush in Seffner, Florida serves as an example: the sinkhole had been filled, yet it reactivated nearly 30 months later on August 19, 2015. There are three possible explanations for a sinkhole’s reactivation:
1) The cavity that formed the sinkhole only partially collapsed. 2) The sediments that collapsed into the cavity have been mobilized out of the cavity by
groundwater movement within a connecting conduit system, reforming a cavity. 3) A combination of 1 and 2.
Sinkhole Formation Triggers
Natural Triggers
Sinkholes form naturally with time, and the frequency of natural sinkhole formation tracks with seasonal weather patterns in Florida. During the rainy season, June through September, sinkholes form more frequently, and during the dry season, February through May, sinkholes form less frequently (Tihansky, 1999; Brinkmann and Parise, 2010). However, extreme swings in climatic conditions can trigger accelerated sinkhole formation. For example, periods of prolonged drought and heavy rainfall have the ability to trigger collapse of subsurface cavities forming sinkholes. These processes are well known to geologists as natural triggering events (Newton, 1987; Beck and Sayed, 1991; Tihansky, 1999; Veni, 2001;

10 | P a g e
Salvati and Sasowsky, 2002; Scheidt et al, 2005; Gordon et al 2012). Appendix II provides an in-depth case study of the natural sinkhole event related to the passage of Tropical Storm Debby in 2012.
Drought
The prevailing hypothesis for drought being a trigger for sinkhole formation is long term, months-to-years, of below normal to little rainfall leading to abnormally lowered groundwater levels within an aquifer. The lowered water level within the aquifer removes the hydrostatic buoyancy effect of the water on the ceilings of water-filled cavities. Without the support of the water, the cavity ceilings cannot support their own weight and collapse forming a sinkhole at land surface. A second hypothesis suggests that shrink-swell clays, clays which expand and contract quickly when water is added or taken away, within near-surface sediments contract significantly when under drought conditions creating either subsidence or collapse of the sediments above them into a cavity not formed by the dissolution of carbonate rock. Beck and Sayed (1991) studied the clay hypothesis in Florida and determined shrink-swell clays were less significant than the influence of the reduction of aquifer water levels on sinkhole development.
Heavy Rainfall
Heavy rainfall within a short period has the ability to trigger formation of sinkholes in three ways. First, heavy rainfall adds additional weight to the overburden sediments above a cavity potentially causing failure of the cavity ceiling. Second, flood water from heavy rainfall naturally collects in low lying areas and infiltrates into the ground. Should a cavity be present below ground at that location, the weight of the flood water and accelerated infiltration may cause failure of the cavity ceiling. The third mechanism relates to an area that has sustained extended rainfall such that the overburden sediments become saturated and soft. Heavy rainfall can cause accelerated additive weakening of the overburden sediments causing failure of the cavity ceiling forming a sinkhole. Anthropogenic Triggers
The activities of humans can exacerbate natural sinkhole formation. We constantly interact with and impact the landscape, frequently altering the natural environment (Fluery, 2007). The effects of anthropogenic activities, are also well known to geologists to trigger the formation of sinkholes (Sinclair, 1982; Newton, 1987; Wilson and Beck, 1992; Tihansky, 1999; Veni, 2001; Salvati and Sasowsky, 2002; Scheidt, 2005; Waltham et al, 2005; Ford and Williams, 2007; Gordon et al, 2012). Appendix III contains an in-depth case study of a human-induced triggered sinkhole formation event following substantial groundwater withdrawal in 2010.
Groundwater Withdrawal
Groundwater resources are necessary to sustain life. In Florida, more than 4 billion gallons per day are extracted from the freshwater aquifers (Marella, 2012). Much like drought, groundwater withdrawal through a single well or numerous wells can trigger sinkhole formation, even in areas where sinkhole do not routinely occur. Sinclair (1982) studied the formation of numerous sinkholes near a Tampa well field and concluded that aggressive pumping triggered the event. High rates of pumping in support of agricultural frost-freeze protection in the Plant City and Dover area has been associated with sinkhole occurrences over the years (Metcalfe and Hall, 1984; Tihansky, 1999; Aurit et al., 2012; Peterson and Rumbaugh, 2012).
Terraforming
Human alteration of the earth’s surface can thin or remove critical overburden sediments that buffer
dissolution of underlying carbonate rocks or weaken support of subsurface cavity ceilings. An example is
11 | P a g e
terraforming associated with mining, whereby the land disturbance and removal of overburden can trigger formation of sinkholes.
Terraforming related to changes in surface-water storage may also trigger sinkholes. As earth-moving equipment modify the earth’s natural topography, natural surface water flow paths and drainage areas are also modified. As a result, areas previously unexposed to high rates of surface water infiltration may become infiltration focal points. If pre-existing subsurface cavities exist in the area, a sinkhole is more likely to occur with the addition of the increased infiltration. As such, rapid infiltration basins (RIBs), spray fields and absorption field systems can trigger the development of sinkholes through artificially enhanced recharge (Tihansky, 1999). Veni et al (2015) attribute increased sinkhole development in urbanized areas of Pasco County to focused recharge from roof and road run-off.
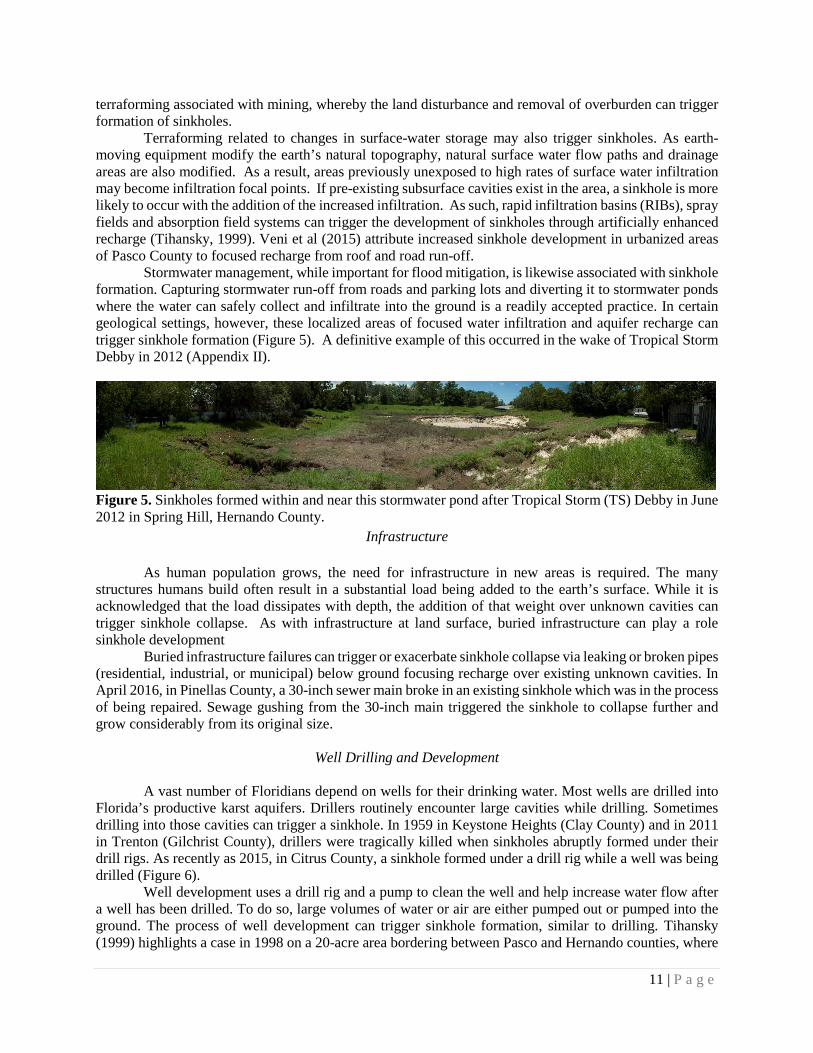
Stormwater management, while important for flood mitigation, is likewise associated with sinkhole formation. Capturing stormwater run-off from roads and parking lots and diverting it to stormwater ponds where the water can safely collect and infiltrate into the ground is a readily accepted practice. In certain geological settings, however, these localized areas of focused water infiltration and aquifer recharge can trigger sinkhole formation (Figure 5). A definitive example of this occurred in the wake of Tropical Storm Debby in 2012 (Appendix II).
Figure 5. Sinkholes formed within and near this stormwater pond after Tropical Storm (TS) Debby in June 2012 in Spring Hill, Hernando County.
Infrastructure As human population grows, the need for infrastructure in new areas is required. The many structures humans build often result in a substantial load being added to the earth’s surface. While it is acknowledged that the load dissipates with depth, the addition of that weight over unknown cavities can trigger sinkhole collapse. As with infrastructure at land surface, buried infrastructure can play a role sinkhole development
Buried infrastructure failures can trigger or exacerbate sinkhole collapse via leaking or broken pipes (residential, industrial, or municipal) below ground focusing recharge over existing unknown cavities. In April 2016, in Pinellas County, a 30-inch sewer main broke in an existing sinkhole which was in the process of being repaired. Sewage gushing from the 30-inch main triggered the sinkhole to collapse further and grow considerably from its original size.
Well Drilling and Development
A vast number of Floridians depend on wells for their drinking water. Most wells are drilled into Florida’s productive karst aquifers. Drillers routinely encounter large cavities while drilling. Sometimes drilling into those cavities can trigger a sinkhole. In 1959 in Keystone Heights (Clay County) and in 2011 in Trenton (Gilchrist County), drillers were tragically killed when sinkholes abruptly formed under their drill rigs. As recently as 2015, in Citrus County, a sinkhole formed under a drill rig while a well was being drilled (Figure 6).
Well development uses a drill rig and a pump to clean the well and help increase water flow after a well has been drilled. To do so, large volumes of water or air are either pumped out or pumped into the ground. The process of well development can trigger sinkhole formation, similar to drilling. Tihansky (1999) highlights a case in 1998 on a 20-acre area bordering between Pasco and Hernando counties, where

12 | P a g e
an irrigation well was being developed and triggered the formation of hundreds of collapse sinkholes in a six-hour period.
Figure 6. A sinkhole triggered during well drilling damages rig. (photograph credit Bay News 9, Tampa)
METHODS
Field Methods Pre-fieldwork Site Reconnaissance
Sinkholes in map view form closed topographic depressions (CTDs). Therefore, elevation profiles indicating depressed topographic closure may be an indication of a sinkhole. Prior to fieldwork, time was invested researching potential sinkholes reflected by these CTDs. The identified sites were termed “points of interest” (POI). POI’s were researched using Geographic Information Systems (GIS) from which a POI GIS layer was created. GIS layers typically used during that process were: digital elevation models (DEM), LiDAR (light detection and ranging) high resolution elevation data, CTDs, (DEM and LiDAR derived), streams, swallets, springs, surficial geology, aerial imagery, the Florida National Hydrologic Dataset (NHD), and the SIR database.
To ensure adequate spatial coverage of the state of Florida, the study area was split into two primary grids: a 10-kilometer grid and a one kilometer grid. Within each 10-kilometer grid cell, a minimum of four POIs were identified for onsite visitation by field staff. When possible, more POI were identified within a 10-kilometer cell. The one kilometer grid cells were used as a minimum spacing between each POI to avoid clustering. In the field, there was no limit to the number of sites documented in an area, although effort was made to traverse at least a kilometer before documenting another site.
The POI serve two purposes. First, POI may be used as model training sites, provided that field investigations confirm the POI is a sinkhole. Second, the complete set of POIs serves as a planning tool

13 | P a g e
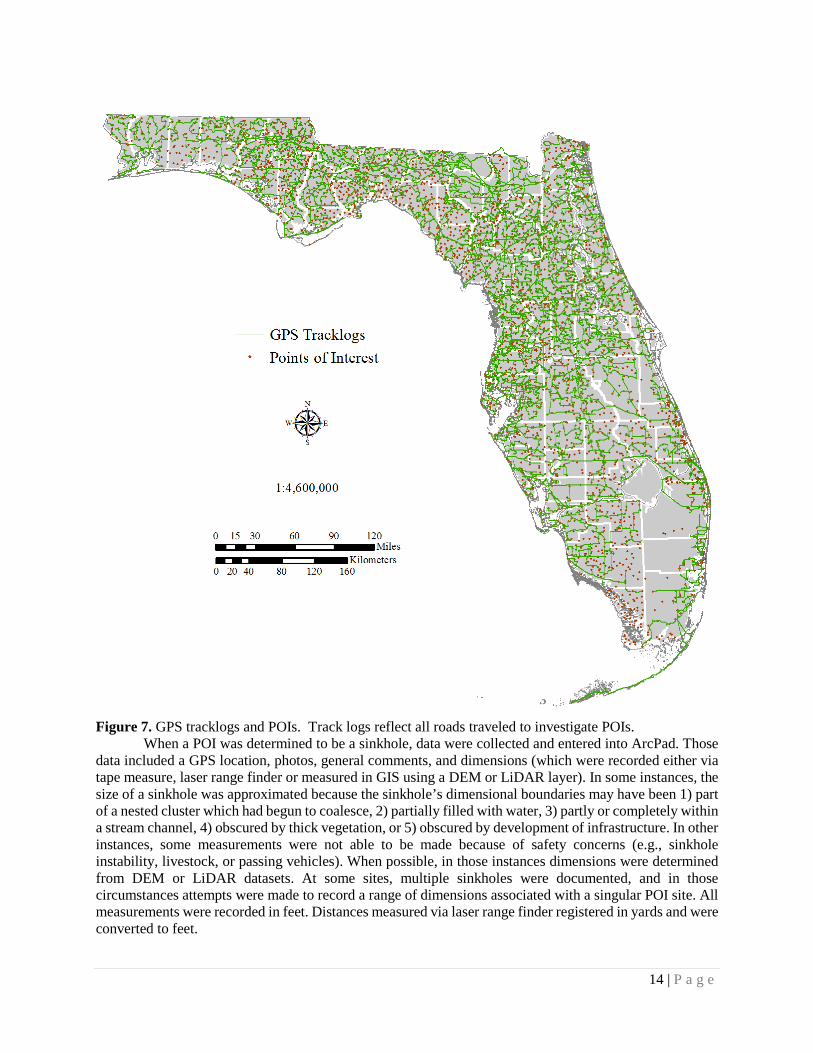
that helps guide systematic and efficient navigation of the field area. In ideal situations, POI sites were easily accessible by vehicle and foot. Over 3,600 POI were identified and flagged for field investigation (Figure 7).
Most often, POI were proximal and data could be taken from the roadside. For POI on private property and not proximal to a road, permission to access was attained from the property owner. Entry was gained into many large public properties, such as those governed by local, state and federal governments, many of which required permits or formal land access agreements; however, private large property owners generally did not allow entry. In context of this project, these areas comprise approximately 18% of the state. For some areas of the state, access was impossible for environmental, conservation, or safety reasons, such as military bombing ranges. In many of those cases, public roads passed through the properties allowing for limited data collection. Everglades National Park, Big Cypress National Preserve, and state owned lands bordering them in south Florida were largely inaccessible areas due to the lands being submerged.
Field Data Collection
Field data collection was conducted over a two-and-a-half-year period from early November 2013 through the end of May 2016. Over the course of fieldwork, field staff covered over twenty-two thousand miles of roadway to survey POI’s throughout the State of Florida (Figure 7). Standard equipment utilized included: laptop computer loaded with Environmental Systems Research Institute ESRI® ArcGIS® ArcMap™ and ArcPad™ GIS software with GIS data layers, Google Earth™, a GPS (global positioning system), 12-volt power inverter, mobile internet data air card, digital SLR cameras, 100-foot measuring tape, laser range finder, rock hammers, binoculars, four-wheel drive SUV (sport utility vehicle), and a four-wheel drive off-road utility vehicle. In most cases, field staff consisted of a driver, a navigator, and two spotters. The navigator directed field staff to pre-selected POI’s using laptop ArcMap and ArcPad software with a GPS connection. It was also their responsibility to input all data into the custom ArcPad data collection form. The spotters’ sole purpose was firsthand visual observation of potential sinkholes; each spotter being responsible for a 180-degree field of view as the vehicle moved. At least one or more of the field staff was a licensed professional geologist. When on site, best professional judgment of field staff was used to determine whether the POI being observed was a true sinkhole.
Field data collection was conducted utilizing ESRI’s ArcPad and ArcMap GIS software. ArcPad is specifically designed for data collection in a mobile environment. Custom toolbars and forms were created by FGS staff to meet project specific data collection needs. Various data layers applicable to data collection assistance were loaded into both ArcPad and ArcMap such as POIs, elevation, known karst features, surficial and subsurface geologic data, roads, property boundaries, aerial and satellite photography, and previously collected field data.
In ArcPad, positive sinkhole identifications were designated as ‘Sinkhole’ points, while features determined not to be sinkholes were designated either as ‘Anthropogenic’, ‘Generic Karst’, or ‘Other’ points. When POIs were determined not to be a sinkhole, or when a POI was judged to be a karstic depression but was too far away or heavily overgrown with vegetation to confirm it is a sinkhole, then the feature’s location was recorded and field observations were noted. Identification of non-sinkhole features which mimic the topographic profile of a sinkhole were equally important to document. These non-sinkhole features identified during fieldwork included: abandoned rock quarries, abandoned hard-rock phosphate mine pits, borrow pits, test pits, dug drainage ponds, decomposing tree roots and root mats, animal wallows and burrows, dune blowouts, and cypress domes.
14 | P a g e
Figure 7. GPS tracklogs and POIs. Track logs reflect all roads traveled to investigate POIs.
When a POI was determined to be a sinkhole, data were collected and entered into ArcPad. Those data included a GPS location, photos, general comments, and dimensions (which were recorded either via tape measure, laser range finder or measured in GIS using a DEM or LiDAR layer). In some instances, the size of a sinkhole was approximated because the sinkhole’s dimensional boundaries may have been 1) part of a nested cluster which had begun to coalesce, 2) partially filled with water, 3) partly or completely within a stream channel, 4) obscured by thick vegetation, or 5) obscured by development of infrastructure. In other instances, some measurements were not able to be made because of safety concerns (e.g., sinkhole instability, livestock, or passing vehicles). When possible, in those instances dimensions were determined from DEM or LiDAR datasets. At some sites, multiple sinkholes were documented, and in those circumstances attempts were made to record a range of dimensions associated with a singular POI site. All measurements were recorded in feet. Distances measured via laser range finder registered in yards and were converted to feet.
15 | P a g e
ArcPad also allowed for data collection on accessibility of features, designated ‘Access’ points, and on surface exposure of rocks and sediment, designated ‘Float’, ‘M-Series’, or ‘Outcrop’ points. Once a data point was recorded, the ArcPad program required filling out a form with criteria specific to feature type. Generally, all data entry forms had ‘Comments’ fields, and most included an option to record photos. Sometimes photos were not warranted, such as in thickly vegetated areas or at ‘Access’ points. Just over 6,500 GIS data points were recorded in the field: 705 sinkholes, 985 generic karst, 676 anthropogenic, 68 M-series (collected geologic samples), 75 outcrop, 9 float, 3,077 access, and 1,041 other. Refer to the Data Collected section of this text and Appendix IV for explanation of these data types. In addition to the GIS data, over 7,300 photographs were taken and archived. Data Collected
Sinkholes Due to the wide range of ages of sinkholes encountered, determination of the sinkhole type
(collapse versus subsidence sinkholes) was at times difficult to assess. In general, the steeper the sides and greater the topographic relief of a sinkhole provided enough evidence to classify it as a collapse sinkhole. Broad shallow features, on the other hand, were classified as cover subsidence unless evidence was observed to classify as a collapse sinkhole. Ford and Williams (2007) note difficulty visually differentiating collapse sinkholes from subsidence sinkholes as the characteristically steep side walls of an old collapse sinkhole may be obscured through mechanisms such as side-wall erosion, detrital deposition, and anthropogenic modification. The majority of sinkholes documented in the field were collapse sinkholes. The sinkhole dataset used as model training point sites were all collapse sinkholes.
Elongate CTD’s often indicated coalescing sinkholes, while circular CTD’s indicated either recently formed or very old end members. Slope was used as a tool to determine cover subsidence or cover collapse. Presence and type of water within a sinkhole provide information about whether the sinkhole drains effectively and whether it may be connected to the Floridan aquifer system (e.g., clear, not dark tannic water). Overburden depth was important to document in recently formed sinkholes in which we could see clear contact between overburden and carbonate rock.
Older sinkholes, which often presented themselves with heavy vegetative soil cover and therefore indeterminable thickness of overburden, were left without sinkhole type designation, because it could not be observed whether this cover was due to subsidence or infill.
For a POI or depressional feature to be designated a sinkhole, the observing field team had to be able to closely inspect the sinkhole, generally stand on its rim or venture safely into it, to make key 1st order observations. ‘Sinkhole’ points maintained the most intricate of all data collection forms, including forms for ‘Site Info’, ‘Sink Info’, ‘1st Order Observations’, ‘2nd Order Observations’, and ‘Triggers’. While ‘Site Info’ forms were important for verifying locations of ‘Sinkhole’ points, ‘Sink Info’ and ‘1st and 2nd Order Observations’ forms accommodated the bulk of data.
‘Sink Info’ included ‘Sinkhole Dimensions’ (length, width, and depth), ‘Sinkhole Type’, ‘Sinkhole Shape’, and ‘Slope’, as well as ‘Presence of Water’, ‘Overburden Type’, and ‘Overburden Depth’ fields. ‘Sinkhole Types’ were designated as: cover-subsidence, cover-collapse, rock collapse, or swallet. For newly formed sinkholes this was feasible to determine, while older sinkholes were troublesome. Sinkhole shapes were designated either circular or elongate in plan view, and slopes estimated to 30°, 60°, or 90°. Presence of water, water type and depth to water were recorded, as were overburden type and overburden depth, when available.
‘Sinkhole’ 1st order observation criteria include soluble (carbonate) rock near the surface, surficial deformation, CTDs, and overburden sediment cohesion and thickness. Soluble rock near the surface and overburden sediment cohesion and thickness could not always be observed in field investigations due to soil and vegetation cover. Experience and knowledge of the lead licensed professional geologist and geology staff was critical in those circumstances.

16 | P a g e
2nd order criteria were all subcategories of the 1st order criteria surficial deformation. These included soil cracks, soil creep or slump, leaning or sagging of vegetation, water flow marks, sagging ground, arching vegetation, exposed rock or sediment, watermarks, stressed or dying vegetation, and depth of rock observed. In both newly formed and older sinkholes, evidence of surficial deformation was important in determining sinkhole type, and whether a sinkhole was newly formed, inactive, or had recently been re-activated. Attention was paid as to whether deformation was erosional or due to subsidence. Sometimes no surficial deformation was present, as in the case of broad, gently sloping cover-subsidence sinkholes. Other times, vegetation was too thick to determine any surficial deformation at all.
Man-made (Anthropogenic) Features
‘Anthropogenic’ features were often documented and classified by field staff as a non-sinkhole. The angular sides, distinct slopes, and evidence of excavation associated with the features were often cited as reasons for not being picked as POI’s during the pre-fieldwork site reconnaissance. Anthropogenic POI’s that resembled sinkholes include abandoned rock quarries, old hard-rock phosphate mine pits, borrow pits, test pits, dug drainage ponds, and erosional washouts associated with infrastructure. It was often easy to determine an anthropogenic POI upon site inspection. Berms or rubble piles frequently accompanied the feature as well as irregular or non-circular dimensions, sheered or blocky rock faces, or culverts draining in or out. Some cases were not as easy to discern, such as possible sinkholes or swallets that were converted to drainages. In these cases, field staff considered evidence such as feature shape, presence of exposed rock, presence of water level gauges, and historical imagery to determine feature type. Other anthropogenic features that mimic sinkhole activity, such as a broken water main, were also encountered and documented in the field. It’s noteworthy that many of the historical hard-rock phosphate pits found in west-central and north-central Florida were likely sinkholes (e.g., Sellards, 1913; Upchurch and Lawrence, 1984; and Scott, 1988). Despite this association, the sharp angular and irregular topographic profiles of the hard rock phosphate pits and the uncertainty of the origins of the deposits led FGS field teams to document those pits as non-sinkholes and to classify them as ‘Anthropogenic.’
Generic Karst
‘Generic Karst’ was used primarily as a designation for depression features that field staff could not closely inspect to confirm as sinkhole features. These features also exhibited a circular, CTD in elevation data and on imagery, and upon field inspection, were prescribed ‘subtype’ (Depression, Karstic Depression, Cover Collapse, Subsidence, Lake (possible paleo-sink), Swallet, or Spring). These data points included natural depressions, such as cypress domes, or natural ground subsidence related to expansive clays or buried decomposing organic material. Cypress domes are thought of as expressions of karst (Sinclair, 1982), so they were designated the subtype ‘Karstic Depression’. Features were also designated ‘Karstic Depression’ when field staff were confident a feature of interest was a sinkhole from visual observation in conjunction with LiDAR/imagery, but could not access the feature to be sure. Features were designated ‘Depression’ when they were related to non-karstic subsidence or when field staff were unsure of the features character.
Secondarily, ‘Generic Karst’ points were dropped when field staff had already documented a ‘Sinkhole’ in close proximity (<1 km away), because the immediate area was already represented for modeling purposes. In this case, the feature was either designated Cover Collapse or Subsidence. Lake (possible paleo-sink) points were dropped less often. When field staff encountered springs or swallets, they were given the appropriate designation.

17 | P a g e
Additional Collected Data (For more detailed explanations of the additional data collected briefly described below, please turn to Appendix IV.)
• Other - The ‘Other’ designation was generally used to document points which did not fit the above designations.
• Access - As with any field study, a hindrance to data collection was a lack of access. Field staff characterized many restricted roadways and features of interest.
• Float – A term given to isolated or out-of-place rock. Field observations of float was a possible indication that carbonate rock was at or near land surface.
• M-Series – The name given to the FGS’s rock hand sample collection. Sixty-eight M-Series rock hand samples were collected and used to confirm or better understand the extent and character of carbonate rock exposed at the surface.
• Outcrop – Geologic exposures at land surface. Forty-five outcrops were documented which aided in either confirming or increased understanding of the surficial geology.
Modeling
Use of the Weights of Evidence (WofE) modeling technique involves the combination of diverse
spatial data that are used to describe and analyze interactions and generate predictive models (Bonham-Carter, 1994 and Raines et al., 2000). WofE is a data-driven process that relies on mathematical relationships between known occurrences (e.g. sinkholes), model training sites and evidential data layers to create maps from weighted continuous input data layers. These input data layers, known as evidential themes, are then combined to yield an output data layer (or result of the model), known as a response theme (Raines, 1999). WofE was adapted to mineral potential mapping in a GIS platform and is based on the application of Bayes’ Rule of Probability, with an assumption of conditional independence, which occurs when an evidential theme does not affect the probability of another evidential theme (Raines et al., 2000). Although Bayesian theory has been applied to ground-water related issues in recent years (e.g., Arthur et al, 2007, Soulsby et al., 2003; Meyer and Nicholson., 2003; and Feyen et al., 2004), the specific application of WofE to the potential for sinkhole formation has not been attempted until this study.
When applied in this project, WofE was used to generate sinkhole favorability response themes. These response themes were generated in the Environmental Systems Research Institute ESRI® ArcGIS® ArcMap™ version 10.3 environment. WofE was executed using the Spatial Data Modeler Tools (ArcSDM toolbox) which is public domain and available through the ESRI arcscripts pages (Sawatzky, D.L., Raines, G.L., Bonham-Carter, G.F., and Looney, C.G., 2009,). The fundamental approach and basic nomenclature of WofE is further described in the following sections. Study Area
The initial step in implementing a WofE model is the identification and delineation of a study area extent (i.e., Florida is the model domain). This is a critical step in any application of WofE since the area identified is used in the calculation of weights and probabilities throughout the modeling process. Training Sites Theme and Prior Probability
Training sites (synonymously referred to as points) are locations of known features, also known as “occurrences” in the literature. In mining applications for example, existing mines are known occurrences. In this study, existing or known, true karst features are considered occurrences. Training sites are used in
18 | P a g e
WofE to calculate the following parameters: prior probability, weights for each evidential theme, and posterior probability of the response theme.
Training sites are converted to represent a unit area of the study area, such as a grid cell within a GIS application. The prior probability is calculated by dividing the training point unit area by the total study area and represents the probability that a training point will occupy any given unit within that study area, independent of any evidential theme data. Prior probability is based on previous knowledge of the problem without the benefit of supporting evidence (i.e., evidential themes). For the sinkhole favorability map, prior probability would be described as the proportion of known sinkholes that FGS staff documented within the state. Data Layer Development
The initial phase of this vulnerability assessment involves the acquisition, development and attribution of various data layers representing the natural environment and geology for use as model input. These chosen data layers will determine the level of detail, accuracy, and confidence of the final model results. Below is the list of data layers that were either newly developed, improved from an existing data layer, or used as is. All layers were statistically analyzed using the WofE data exploration process to determine their strength as evidential components important to modeling the favorability of Florida’s geology to sinkhole formation. Consideration should be given to the apparent accuracy of the spatial data layers. In the case of overburden thickness and top of rock layers that were developed, a total of 4,269 boreholes were located and reviewed and 2,290 were used to create the layer. A significant number of staff hours over the course of the project were expended to accurately locate, describe, and properly attribute this data and get it into a workable source of information. This equates to a rough density of approximately one described borehole for every 64 sq km. Additionally, those boreholes are not evenly distributed across the state. Evidential Themes
An evidential theme is defined as a set of continuous spatial data that is associated with the location and distribution of known occurrences. This is analogous to a data layer or coverage. In determining sinkhole vulnerability, examples of evidential themes include proximity to closed topographic depressions and overburden thickness. A comprehensive list of possible evidence types was compiled at the outset of the study. Each of these layers was at one point considered as a viable layer to be used in the identification of areas that could be categorized as favorable for sinkhole formation.
• top of rock – a mapped surface of the first occurrence of limestone • overburden thickness • geomorphology district • organic content of soils • hydraulic conductivity of soils • pedality of soils • proximity to surface streams • proximity to surface water bodies • the difference in pressure (as elevation) between the surficial aquifer system in Floridan aquifer
system • seasonal fluctuation in Floridan aquifer system; within a single year and across a multiyear period • epiphreatic zone • closed topographic depressions, iterating through different values of a circularity index • Floridan aquifer system transmissivity • lineaments

19 | P a g e
Weights are calculated in WofE procedures to establish spatial associations between training sites
and evidential themes. The calculation is completed by grouping large sets of data into fewer, more manageable categories that have statistical association with the training sites. For example, if an evidential theme consisted of a data layer of overburden thickness divided into one-foot thickness intervals, it might be necessary to classify the data into categories such as 10 or 20 foot intervals to make the data layer more manageable and statistically significant groups.
Weights are calculated for each evidential theme based on the presence or absence of known occurrences with respect to the model extent. A positive weight is calculated for areas that have more training sites than would be expected by chance. In other words, the weight is associated with occurrence of evidence. Conversely, a negative weight would be calculated for areas that have fewer points than expected; the weight is not associated with occurrence of evidence (or non-evidence). A weight of zero indicates that there is no association between training sites and the evidential theme, or that the evidential theme is not a discriminating layer. For an evidential theme to be a valid WofE input, it must be a discriminating data layer and have statistical significance.
During the preliminary phase of the project, while performing the initial sinkhole pilot study, several data sets were evaluated but not used because they were not discriminating and therefore did not add anything to the model. This supports the concept of this sinkhole favorability analysis by using a data-driven model versus an expert knowledge model in that two of the layers that were deemed logical as predictors of favorable areas for sinkhole formation did not have any statistical significance. These themes were layers depicting the distance to surface streams or surface water bodies. In this example, the logic is areas associated with sinkholes do not have streams or surface water features. It turns out that some of the stream classifications may be an issue, but it also indicates many solution sinks can be water filled and classified as lakes. It may be more accurate to classify water-filled sinks differently or look at density of water bodies based on area instead of the presence or absence of either feature. It is also worth noting that the layer may not add anything to the favorability maps as it appears the models do a good job of showing vulnerable areas to sinkhole formation without inserting the data layer. This does not rule them out from future consideration but the data layers, in their current state, are insufficient as predictor maps, and therefore, were excluded from this analysis.
Weights can be calculated using three distinct methods: categorical, cumulative ascending, or cumulative descending. The categorical method is used to calculate weights for evidential themes where the theme’s values are not ordered (e.g., units in a geologic map). The cumulative ascending method is used to calculate cumulative weights in a proximity analysis. In this method, areas represented by smaller values of an evidential theme have a stronger association with training sites, and those represented by larger values of an evidential theme have a weaker association with training sites. Area and number of points are determined cumulatively from the first class to the last class. This method is applicable for themes where the points are mainly associated with the lower values of the evidential theme (e.g., overburden thickness; presence of existing sinkholes are more associated with thinner packages of overburden). The cumulative descending method is used to calculate the cumulative weights from the last class to the first class in the opposite way of cumulative ascending. This method is applicable for themes where the points are mainly associated with the higher values of the evidential theme (e.g., soil hydraulic conductivity).
Generalization of evidential themes follows calculation of weights in the WofE modeling process. Themes are generalized to establish areas of the evidence that share a greater association with locations of type occurrences. During the calculation of weights for each evidential theme, a contrast value is calculated, which is a combination of the positive and negative weights (positive weight – negative weight) described above (Table 1). Contrast is a measure of a theme’s significance in predicting the location of training sites and helps to determine the threshold or thresholds that maximize the spatial association between the evidential theme map pattern and the training point theme pattern (Bonham-Carter, 1994).
Confidence of the evidential theme is also calculated for each class, and equals the contrast divided by its standard deviation (a student T test) for a given evidential theme (Table 1). Confidence provides a useful measure of significance of the contrast due to the uncertainties of the weights and areas of possible

20 | P a g e
missing data (Raines, 1999). Also, a contrast value that is significant, based on its confidence, suggests an evidential theme is a useful predictor of training sites. Evidential themes that do not meet the minimum confidence level of significance are not included in the models.
Following the calculation of weights, contrast is used as a threshold to generalize or subdivide evidential themes into categories (Table 1). These breaks delineate which areas of the model each evidential layer within the study area have more association with the training sites. The simplest and most common method of categorizing an ordered evidential theme is to select the maximum contrast as a threshold to determine where to place a break in the evidential data theme thereby creating two categories: one with strong(er) association with the training point theme and one with weak(er) association with the training point theme. In a few cases, more complex statistical contrast patterns are inherent in the data and may justify the creation of multiple classes in the evidential theme data. To create multiple classes, contrast thresholds must correspond to a minimum level of significance.
Clas
s
Area in Sq km
Training Sites
Positive Weight
Std Dev Pos
Weight Negative Weight
Std Dev Neg
Weight Contr
ast
Std Dev Contrast
Studentized Contrast
Recla
ss
Weight
Std Dev
Weight 1 44775.8 520 0.9904 0.0441 -1.3209 0.0917 2.3113 0.1018 22.7091 in 0.9904 0.0441
2 102283 119 -1.3209 0.0917 0.9904 0.0441 -
2.3113 0.1018 -22.7091 out -
1.3209 0.0917 Table 1 example table (not used in report) showing calculation of weights for the reclassified overburden evidential layer (Sq km – square kilometer, Std Dev – Standard deviation, Pos – positive).
In general, a positive weight (W1) for an evidential theme indicates areas where training sites are likely to occur, while a negative weight (W2) for an evidential theme indicates areas where training sites are not likely to occur. Contrast is the difference between the highest and lowest weights and is a measure of how well an evidential theme predicts training sites. Contrast is also used to rank the evidential themes. Higher contrast values indicate those evidential themes that best predict training point locations and which are more important in the model. Conversely, a negative weight that is stronger than a positive weight indicates that an evidential theme is a better predictor of where training sites are not likely to occur (i.e., low favorability) as opposed to where they were likely to occur.
Response Theme
Following the generalization of evidential themes, WofE output results are generated and are known as response themes. A response theme is an output data layer showing the probability (posterior probability) that a unit area contains a training point based on the evidence (evidential theme) provided. Areas of higher posterior probability indicate that an area is more apt to contain a training point, whereas areas of lower posterior probability indicate that an area is less likely to contain a training point. As it relates to the sinkhole mapping project, a response theme can be understood as a favorability map that is displayed in classes of relative favorability based on documented sinkhole features used as training sites.
MODELING RESULTS
A favorability map of the Weights of Evidence model was generated using the three evidential themes that showed the strongest association with the training point theme and therefore were considered the strongest for identifying areas with geology favorable for sinkhole formation. Those layers were overburden, a categorical representation of closed topographic depressions and a layer depicting the difference between the water-table surface and the top of limestone. Each of these evidential layers were evaluated relative to the study area training sites. A calculated weights table was used to identify the break between areas that are associated with training sites and areas less associated with sites.
21 | P a g e
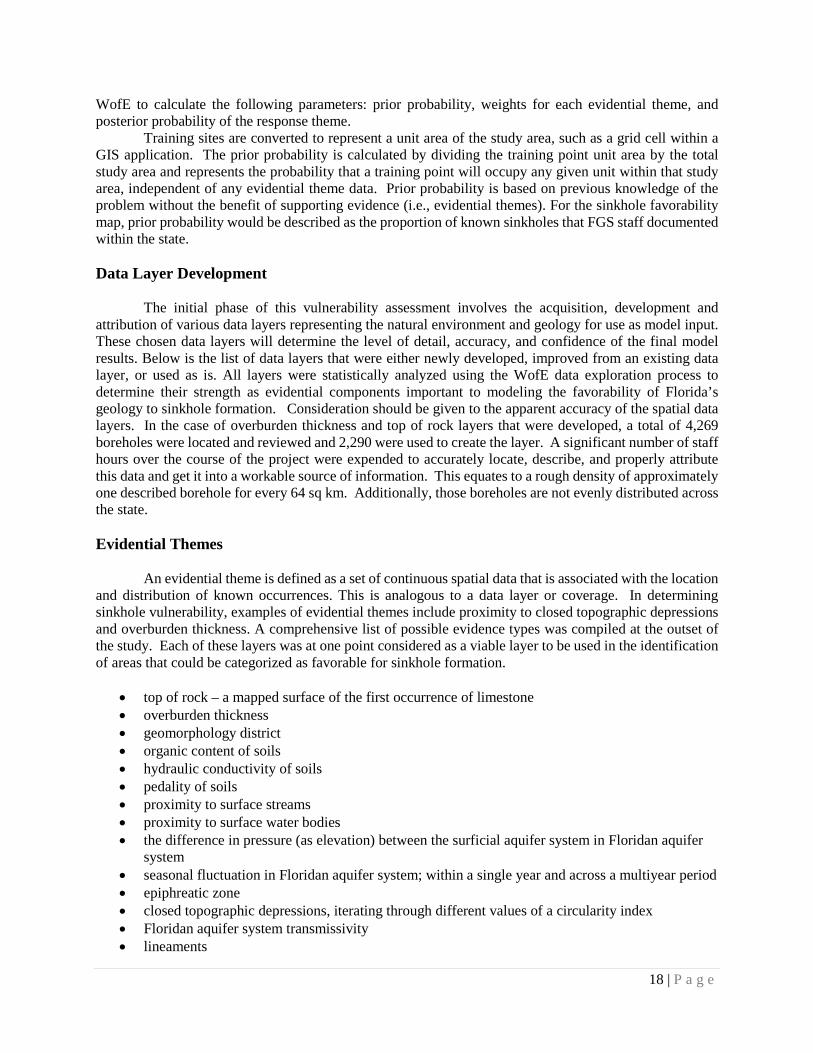
Overburden thickness was calculated by taking the top of limestone surface and subtracting it from land surface. Values across the state ranged from approximately 550 meters (~1,800 ft) thick in extreme coastal northwestern Florida to 0 meters (0 ft) thick, which occurs mostly in the lower lying areas along the major area rivers in the Big Bend area of Florida. In the southern peninsula of Florida, the thickness of overburden begins to increase as well, reaching values more than 300 meters (~1,000 ft). Intersecting the training sites with this evidential layer revealed that training sites occurred in areas with 34 meters (113 ft.) or less of overburden. A second observed category is from 34 meters (113 ft) to 133 meters (436 ft ) of overburden. This second classification is weekly associated with the formation of sinkholes. Areas where the calculated overburden values exceed 133 meters displayed no association with observed cover collapse sinkholes in the field and therefore had no association. (figure 8).
Figure 8. Thickness of overburden on the limestone surface.

22 | P a g e
This layer showed the strongest association with the training sites. Regarding breaks for this layer, areas where the overburden was 34 meters (113 ft) or less in thickness (in red) are more closely associated with sinkhole formation. Areas with overburden thicknesses between 34 meters (113 ft) and 88 meters (436 ft) have a weak association with sinkhole formation and areas greater than 133 meters (436 ft) displayed no association with observed cover collapse sinkholes and therefore had no association (Figure 8).
Closed topographic depressions are obtained from United States Geological Survey (USGS) 1:24,000 topographic maps and are reflected by the hachured, closed isolines on the map (Figure 9). Since sinkholes tend to be highly circular, filtering by a circularity index allows for the removal of closed topographic depressions that are highly linear (e.g., a drainage ditch or linear dune feature) and least likely to represent a sinkhole. The circularity index of a feature is the ratio of the area of a perfect circle with the same perimeter as the closed depression. Figure 10 identifies depressions in Figure 9 that have a high circularity index.
Figure 9. Example of a 1:24000 USGS topographic map showing contour lines. Closed depressions have a hachured line.
The depression features were intersected with the United States National Grid to summarize feature
statistics on a one kilometer basis. The resulting one kilometer grid of closed depressions was then queried
23 | P a g e
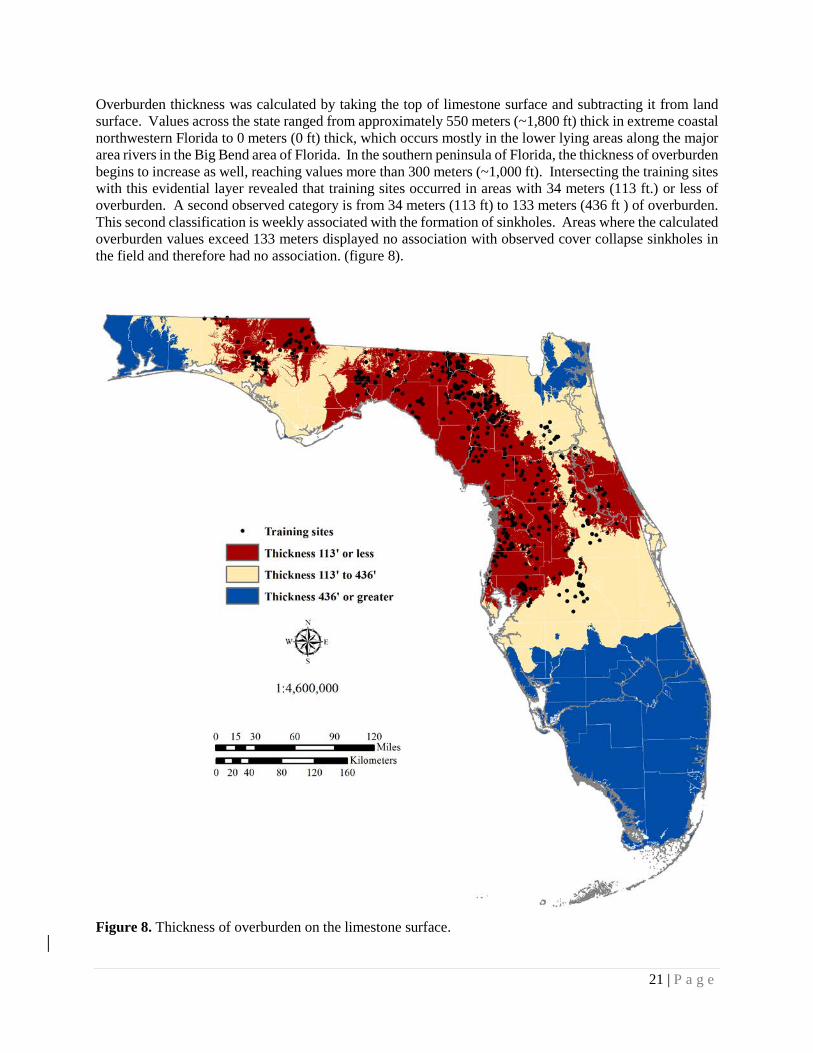
to find the best fit with known sinkhole occurrences (training sites). These were then filtered based on the circularity index (Denizman, 2003). Ultimately, closed topographic features with a circularity index of 0.75 or greater and depth ranges greater than five feet coupled with the existence of multiple closed depressions within a grid cell meeting that criteria had the strongest association with the training point sites (Figure 11). This evidential layer is separated into two classes based on the selection criteria discussed and is displayed as being associated with known sinkholes.
Figure 10. Closed topographic depressions (dark blue contours) that have a circularity index of 0.95 and higher.
In some instances, multiple layers can be combined into a single layer to account for complex
interactions between layers. For example, the difference between the top of limestone layer and the top of the potentiometric surface are two layers that have been combined into a single evidential theme. The combined layer references the difference between water-table surface and top of limestone. The composite layer helps reveal the areas in the state where the top of soluble rock is near the potentiometric surface. Presumably, this is the epiphreatic zone where water-table fluctuations or possible hydraulic pumping of the aquifer proximal to zones containing cavities is most pronounced, thereby actively flushing sediments from cavities within the underlying soluble limestone rock layers (Figure 12).
Top of limestone data points are used to create a layer depicting the surface of limestone that is susceptible to dissolution. The layer was subtracted from a groundwater level surface and then intersected
24 | P a g e
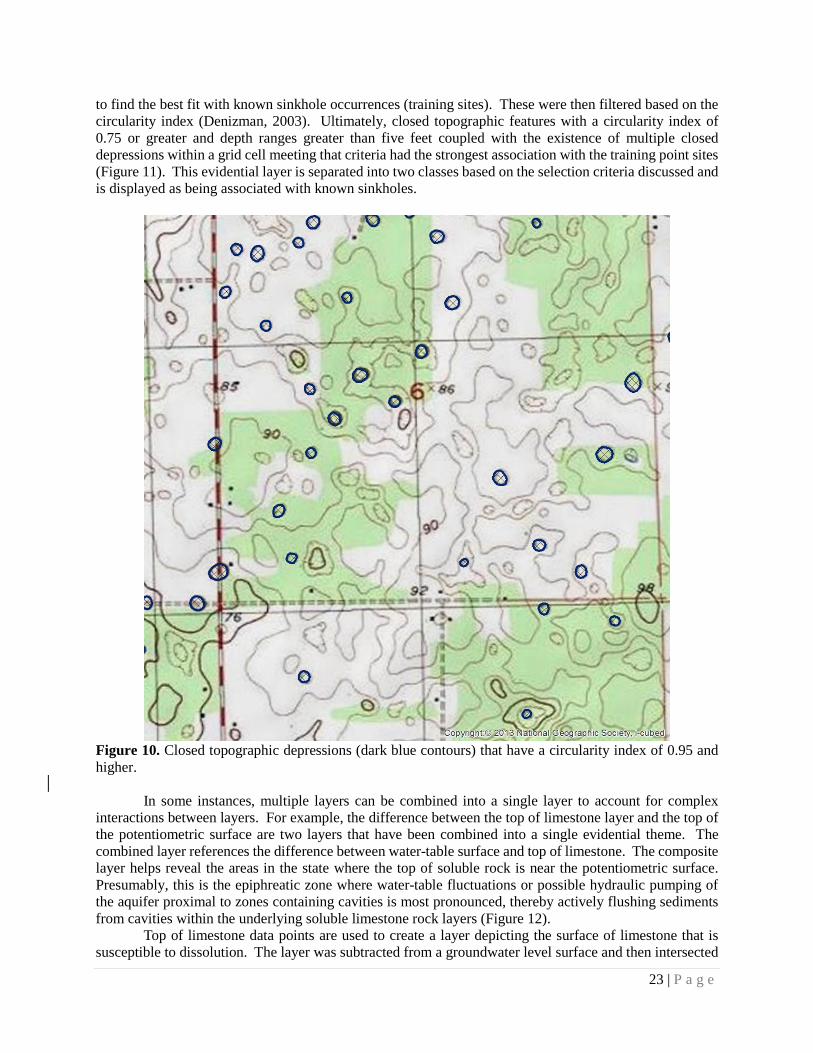
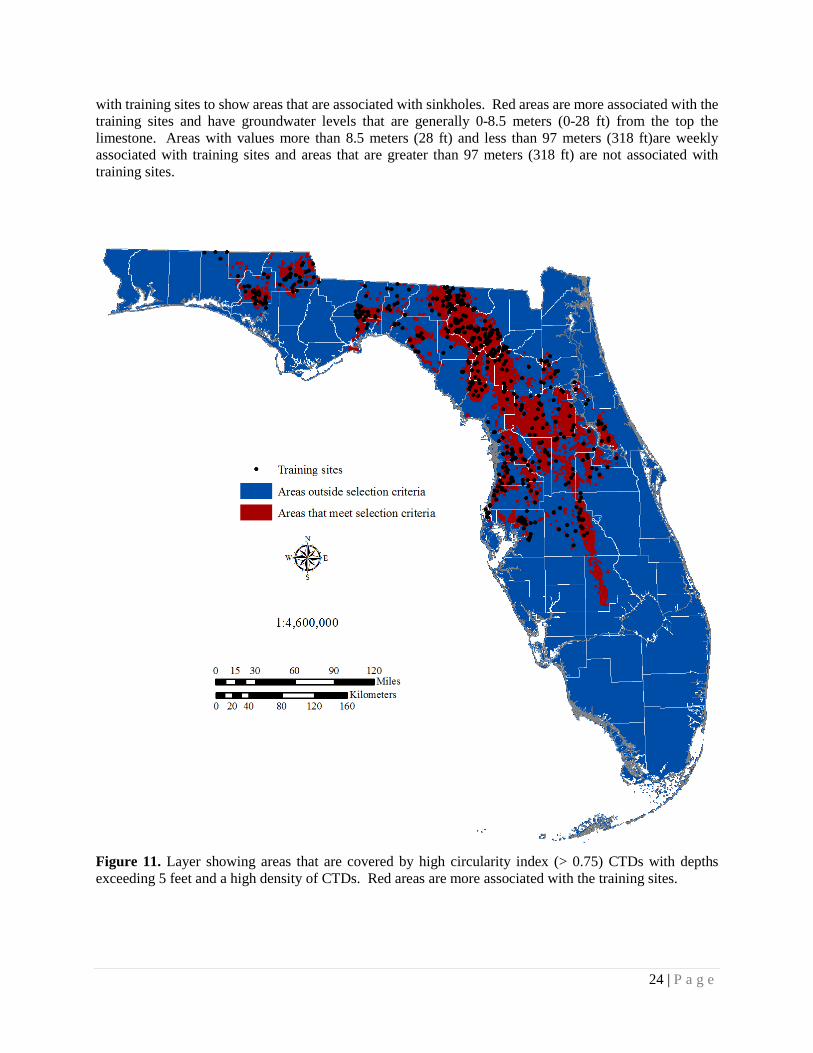
with training sites to show areas that are associated with sinkholes. Red areas are more associated with the training sites and have groundwater levels that are generally 0-8.5 meters (0-28 ft) from the top the limestone. Areas with values more than 8.5 meters (28 ft) and less than 97 meters (318 ft)are weekly associated with training sites and areas that are greater than 97 meters (318 ft) are not associated with training sites.
Figure 11. Layer showing areas that are covered by high circularity index (> 0.75) CTDs with depths exceeding 5 feet and a high density of CTDs. Red areas are more associated with the training sites.

25 | P a g e
Figure 12. Difference between groundwater level and the top of limestone.
Tables showing the reclassifications of the three evidential themes and their associated weights are
located below. Table 2 is for selected areas associated with CTDs within a one kilometer square area. The layer was developed by taking the United States National Grid system for Florida and intersecting it with the closed topographic depressions. The maximum CI value for each 1km grid was used to calculate weights. The cutoff for CI values in real world terms was 0.75 and higher. Other selection criteria were; at least five feet deep and that there were five or more present in each one kilometer grid.

26 | P a g e
Clas
s
Area
in S
q km
Trai
ning
Si
tes
Posit
ive
Wei
ght
Std
Dev
Pos
Wei
ght
Neg
ativ
e W
eigh
t
Std
Dev
Neg
W
eigh
t
Cont
rast
Std
Dev
Cont
rast
Stud
entiz
ed
Cont
rast
Recl
ass
Wei
ght
Std
Dev
Wei
ght
1 25347 549 1.6021 0.0431 -
1.6516 0.0981 3.2537 0.1072 30.3605 in 1.6021 0.0431
2 121711 104 -
1.6516 0.0981 1.6021 0.0431 -3.2537 0.1072 -30.3605 out -1.6516 0.0981 Table 2 showing calculated weights for layer depicting the presence or absence of karst features based on the circularity index and depth from the USGS 1:24,000 topographic contour lines.
Table 3 shows values associated with the epiphreatic zone thickness as an absolute value. The logic behind this layer is that it is useful at indicating areas of the state where water levels fluctuating over time can create a pumping action, especially during prolonged droughts followed by large amounts of rainfall in a short time period. The layer has a strong association with observed sinkholes throughout the state. From the calculation, it shows that areas having values of 28 feet or less (class 1) are more likely to have sinkholes than areas that are
Clas
s
Area
in S
q km
Trai
ning
Si
tes
Posit
ive
Wei
ght
Std
Dev
Pos
Wei
ght
Neg
ativ
e W
eigh
t
Std
Dev
Neg
W
eigh
t
Cont
rast
Std
Dev
Cont
rast
Stud
entiz
ed
Cont
rast
Recl
ass
Wei
ght
Std
Dev
Wei
ght
1 29970 477 1.2865 0.0462 -1.0857 0.0754 2.3722 0.0884 26.8238 in 1.2865 0.0462
2 58696 176 -0.3958 0.0755 0.1974 0.0459 -0.5932 0.0884 -6.7141 in -0.3958 0.0755
3 58141 0 0 0 0 0 0 0 0 out -10.164 10.001 Table 3 showing calculated weights for the epiphreatic thickness layer. Table 4 computes the weights for overburden thickness across Florida. From the calculation, it shows that areas having greater than 113 feet of overburden (class 1) are less likely to have sinkholes than areas that are thinner. Additionally, areas with overburden values of 436 feet (class 3) or more have no association with sinkholes. This is apparent from the strong negative weight. This interaction between observed sinkholes and overburden is shown in Table 4. Conversely, this layer is better at predicting areas that have a weaker association for sinkhole formation.
Clas
s
Area
in S
q km
Trai
ning
Si
tes
Posit
ive
Wei
ght
Std
Dev
Pos
Wei
ght
Neg
ativ
e W
eigh
t
Std
Dev
Neg
W
eigh
t
Cont
rast
Std
Dev
Cont
rast
Stud
entiz
ed
Cont
rast
Recl
ass
Wei
ght
Std
Dev
Wei
ght
1 49384.28 561 0.9446 0.0425 -1.5532 0.1043 2.4979 0.1126 22.1798 in 0.9446 0.0425
2 48852.45 92 -0.862 0.1044 0.254 0.0423 -1.1161 0.1126 -9.9103 in -0.862 0.1044
3 48571.42 0 0 0 0 0 0 0 0 out -9.985 10.001 Table 4 shows the calculated weights for overburden thickness vs observed sinkhole features across Florida.
The three evidential themes were combined in the WofE model to build the response theme, shown in Figure 13. The model revealed a strong contrast depicting areas with favorable sinkhole formation. The model calculates areas with thin to absent overburden, high degree of closed topographic depressions, and the epiphreatic thickness of 28 feet or less have a strong association with sinkhole formation (Figure 13). Highest favorability in red.

27 | P a g e
Figure 13. Results from study with training sites - Weights of evidence output map from combining the three evidential themes; overburden, closed depressions, difference between water-table aquifer and top of rock and soil physical properties. This map reflects the relative favorability for sinkhole formation across the state for use in hazard mitigation.
Plotting posterior probability against cumulative area as a percentage (Figure 14) allowed the delineation of class breaks for display of favorability zones in the final response theme. The breaks for these favorability zones were selected where a notable stepwise increase in posterior probability relative to cumulative area occurred. The first break, which delineated the least favorable zone from the favorable zone, occurred at a posterior probability value of 0.00026. The least favorable zone represents approximately 62% of the study area. The second break delineating the moderately favorable zone from the more favorable zone occurred at the next significant stepwise increase in posterior probability at a value

28 | P a g e
of 0.006734, which also corresponded with the prior probability. The favorable zone represents approximately 14% of the study area. The third break delineating the more favorable zone from the most favorable zone occurred at the next significant increase in posterior probability at a value of 0.033643. The more favorable zone represents approximately 10% of the study area. The remainder of the study area fell into the most favorable zone and represents approximately 14% of the study area. This more favorable zone is considered to have the greatest likelihood of containing a training point.
Figure 14. Sinkhole favorability classes depicted in Figure 13 were determined using this chart of posterior probability (vertical axis) versus cumulative area within the study area (horizontal axis). Class breaks were placed where both a notable increase in probability and cumulative area were observed.
As part of the WofE analysis a confidence map is generated for the model. For the sinkhole map showing favorable areas, the confidence values range from less than 60 percent to greater than 99.5 percent. The high confidence areas are associated with favorable areas for sinkhole formation. The epiphriatic zone layer with values of 318 feet or more contain zero training sites and therefore those sites have low confidence values. In this case the low confidence is acceptable because these areas are unlikely to have sinkholes form and more specifically it is improbable that they will form in swarms. Figure 15 shows the confidence map for the sinkhole favorability model results in Figure 13.
0.00000100
0.00024300
0.00130600
0.00147800
0.00625400 0.00789900
0.032737000.03691000
0.17088700
0.00000
0.00001
0.00010
0.00100
0.01000
0.10000
1.0000030 40 50 60 70 80 90 100
most favorable zone
more favorable zone
favorable zone
least favorable zone
prior probability
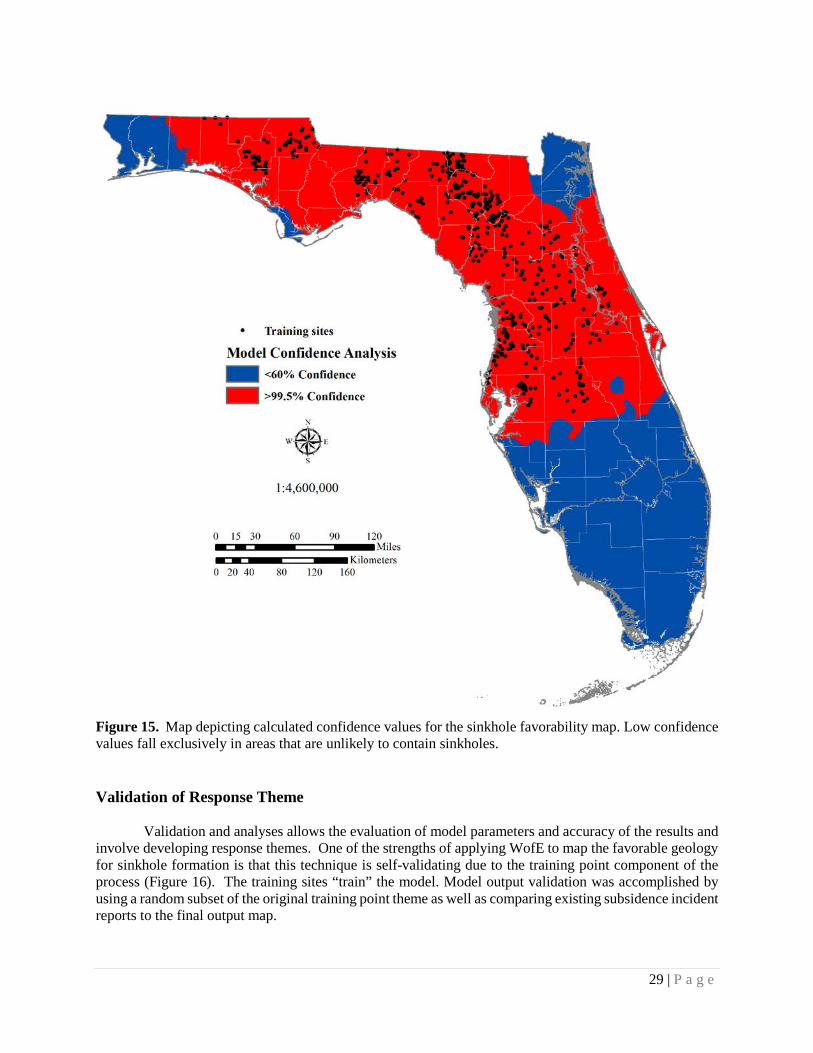
29 | P a g e
Figure 15. Map depicting calculated confidence values for the sinkhole favorability map. Low confidence values fall exclusively in areas that are unlikely to contain sinkholes. Validation of Response Theme
Validation and analyses allows the evaluation of model parameters and accuracy of the results and
involve developing response themes. One of the strengths of applying WofE to map the favorable geology for sinkhole formation is that this technique is self-validating due to the training point component of the process (Figure 16). The training sites “train” the model. Model output validation was accomplished by using a random subset of the original training point theme as well as comparing existing subsidence incident reports to the final output map.

30 | P a g e
Random 75% Subset of Training Sites
A training point theme of observed sinkholes consisting of a random subset of 75% of the original occurrences was generated, and the model was re-executed generating a response theme based on the random subset of points. The results were divided into four favorability classes.
Figure 16. Results from study with 25% of the training sites held back. The resulting model has the exact same pattern and shows excellent agreement.
The subset response themes were then compared to the original response themes. A statistical test, called a kappa coefficient, was used to evaluate the degree of correlation between the model response theme (Figure 13) and the subset response theme (Figure 16). The kappa coefficient measures the amount of spatial agreement between response themes while taking into account agreement that could have occurred by chance. Additionally, conditional kappa values were calculated to determine the amount of agreement between each favorability class of the two response themes. A cross-tabulation matrix is used to classify

31 | P a g e
the response themes by area (in square kilometers) and aided in the calculation of observed and expected proportions. Values along the diagonal in this table (upper left to lower right) reflect the amount of agreement between response themes cells. The other values in the table reflect where the response themes were mismatched. Table 5 is an example of the cross-tabulation matrix.
Kappa coefficient results can range between -1 (perfect disagreement) and 1 (perfect agreement). A value of zero indicated that the agreement was no better than that expected due to chance (Bonham-Carter 1994). Kappa coefficients calculated in the project were all positive values. Positive kappa coefficients can be interpreted using Table 6.
Class 75% subset response theme Most More Favorable Least Total
Mod
el R
esul
ts Most 9121035 9121035
More 1686455 1686455 Favorable 2018501 2018501
Least 1854753 1854753 Total 9121035 1686455 2018501 1854753 14680744
Table 5. Example cross-tabulation matrix of the area in square kilometers per class of the favorability response theme and the 75% subset response theme. Values along the diagonal reflect the amount of agreement and in this case show perfect agreement, kappa equal to one.
Interpretation of kappa values
Kappa Interpretation
< 0 No agreement
0.0 – 0.19 Poor agreement
0.20 – 0.39 Fair agreement
0.40 – 0.59 Moderate agreement
0.60 – 0.79 Substantial agreement
0.80 – 1.00 Almost perfect agreement
Table 6. Kappa coefficient values and their associated interpretation (Landis and Koch, 1977). An independent set of data points, called the Subsidence Incident Report (SIR) database was
brought in as a way of analyzing the results of the model (Figure 17). To date, there have been 3,756 subsidence events reported (Figure 17). Of those, 3,368 or 87 percent fall in the “favorable”, “more favorable” or “most favorable” categories (Table 7). As indicated earlier, there is some bias in the Subsidence Incident Report database towards populated areas, and there are a number of misclassified points that are not associated with the naturally occurring geology of the state. These would be the reported

32 | P a g e
events along the Atlantic coast of Florida, in the southern peninsula of the state and in the extreme western panhandle.
Figure 17. Results from favorability analysis compared with the subjective dataset of Subsidence Incident Report (points).

33 | P a g e
Class SIRs Pct/Class Least Favorable 488 13% Favorable 463 12% More Favorable 869 23% Most Favorable 1979 52% Total 3368 87%
Table 7. Results from statewide study with Subsidence Incident Reports. Of the 3,799 reports on file with the FGS, 488 or 13% fell in the category of least favorable and the remaining 3,311 or 87% fell in the favorable to most favorable categories (see bold text in table).
Data Limitations
Although several qualitative and quantitative validation methods support the results of the maps, important factors exist regarding appropriate end-user application of maps. These factors involve understanding input-data resolution, missing data, model precision, and what the maps and associated statistics indicate regarding sinkhole favorability for a given location.
The maps reflect projections based on scientific models. These models were structured to represent interrelationships between relevant components of Florida’s geologic and hydrogeologic framework as they pertain to the formation of sinkholes. Of critical importance to the accuracy of these favorability maps is the quality and type of data input into the model. If data of poor quality (i.e., inaccurate or imprecise) is used in a model, output from the model will be of equally poor quality and thus of limited value Anthropogenic Features Affecting Topography
Although the model response theme is based on evidential themes characterizing the natural system, some anthropogenic features can affect natural geologic characteristics. The features can “override” the calculated results of favorability for the model. For example, over pumping associated with large agricultural areas or municipal well fields can change local hydrogeologic conditions to the extent that sinkhole events can be induced. In these localized areas, results of the modeling may under-predict favorability, see discussion in Appendix III and Appendix III’s Figure 6 concerning the Plant City sinkhole event from 2010.
There are some areas where the favorability model reflects sinkhole “activity” less than that indicated by the SIRs data (Figure 17). These include areas of western Polk and Eastern Hillsborough Counties, where significant mining has occurred in the last century. In these areas, impacts from mining activity can include the removal of up to 60 feet of overburden. These disturbed areas are back filled with material extracted from adjoining areas and process waste material is stored in stacks on land surface that can exceed 200 feet in relief (see Anthropogenic and Terraforming sections above). Additionally, due to terraforming in the area, naturally occurring topographic depressions were not mapped on the USGS topographic sheets on which the DEM model is based, and therefore the area is under-represented with respect to CTDs. Terraforming and related activities, especially on a regional scale can affect evidential themes that are intended to reflect the natural system, terraforming can be associated with sinkhole triggering activities depending on the geologic setting.
Application of the Map
The purpose of this section is to address the question of how to use the map. The detailed patterns of the response themes are directly related to the detail of the evidential themes and the intersection of those

34 | P a g e
layers on the maps. Close inspection of the maps in their digital form reveals that some of the expected vulnerabilities are as small as a single grid cell (i.e., 100 m2) in the response theme. Technically, this cell size dictates the resolution of the maps is 100 m. The value is based on the resolution of the most highly resolved evidential theme, which is the overburden layer since it is derived, in part, from the digital elevation model. All evidential themes, despite having originated from less detailed resolutions, were required to be re-sampled to a consistent 100 m grid cell size for input into the WofE models.
Users of the map may be tempted to make decisions based on the cell size (100 m2) of the response theme. Although the resolution of some evidential themes is 100 m2, decisions cannot be made on cell size. If a unit cell of the response theme differs in favorability as compared to nearby cells, the difference is real and based on mapped geologic evidence. Examples of those differences include a nearby closed topographic depression or a change in overburden thickness.
It is also important to keep in mind the data’s limitations (see discussion in Data Limitations). For example, interpolation of the top of the Floridan aquifer system’s potentiometric surfaces is made statewide based on a relatively low number of water level measurements. This layer is utilized in the calculation of the epiphreatic zone evidential theme. Another degree of uncertainty pertains to the closed topographic depression features. Not all closed topographic depressions are karst related, a number were filtered out because of their shape (circularity index). Some number of those filtered may have been karst features and were not utilized as evidence for the output map.
Consideration must be given when evaluating the results of the WofE sinkhole model as it relates to the training point data set. As described earlier in the report, large portions of the state were inaccessible by field geologists so potential features in those areas were never acquired. Likewise, lack of road access limited field teams in some areas, and if features were not visible from roads, then they could not be confirmed as sinkholes.
Sinkhole favorability maps were developed from a wide range of data resolutions, vertically and horizontally. Input data strengths and weaknesses and knowledge of data not represented in the model have been described in this report. Considering those factors, it is suggested the maps be used at scales of sufficient size to preclude the comparison of individual parcels to the response themes. For example, use of a scale of 1:100,000 or smaller. The digital version of the data will be delivered in one kilometer grid cells corresponding with the United States National Grid system and will be symbolized/attributed with the highest favorability class that one kilometer cell intersects.
With a need to apply these statewide model results at the county scale, it is suggested that the application be greater than or equal to 10 square kilometers. When assessing a 10-kilometer area, consider favorability of sinkhole formation as possible if a zone exists in that area with a favorable or higher designation. Again, this does not imply results less than favorable are meaningless. Every 100-m grid cell has significance; however, this is a favorability model and the authors make no assumption that all input data layers are accurate, precise, or complete at that scale. Application of the favorability map outside the scope of this study, for which it was intended, does not replace the need for larger scale studies.
The maps are as accurate as the most detailed input layer, and as inaccurate as the least detailed layer. For example, the wells used to define the overburden layer represent, on average, about 13 square miles. Accuracy of the maps is not sufficient for evaluating sinkhole favorability at a specific location. It is the responsibility of the end-users of these maps to determine specific and appropriate applications of results. For improved resolution of the maps for applications at both the statewide and larger scales, see the Future Improvements section below.
Disclaimer
These maps were developed by the DEP/FGS as a contractor to DEM to carry out each agency’s
responsibilities. Although efforts have been made to make the information in these maps accurate and useful, DEP/FGS and DEM assume no responsibility for errors in the information and does not guarantee that the data are free from errors or inaccuracies. Similarly, DEP/FGS and DEM assume no responsibility for the consequences of inappropriate uses or interpretations of the data on these maps. As such, these maps

35 | P a g e
are distributed on an "as is" basis and the user assumes all risk as to their quality, the results obtained from their use, and the performance of the data. DEP/FGS and DEM further make no warranties, either expressed or implied as to any other matter whatsoever, including, without limitation, the condition of the product, or its suitability for any purpose. The burden for determining suitability for use lies entirely with the user. In no event, shall the DEP/FGS and DEM or its employees have any liability whatsoever for payment of any consequential, incidental, indirect, special, or tort damages of any kind, including, but not limited to, any loss of profits arising out of use of or reliance on the maps or support by DEP/FGS and DEM. DEP/FGS and DEM bear no responsibility to inform users of any changes made to this data. Anyone using this data is advised that resolution implied by the data may far exceed actual accuracy and precision.
Comments on this data are invited and DEP/FGS would appreciate that documented errors be brought to the attention of our staff. Because part of this data was developed and collected with U.S. Government and/or State of Florida funding, no proprietary rights may be attached to it in whole or in part, nor may it be sold to the U.S. Government or the Florida State Government as part of any procurement of products or services.
CONCLUSIONS
A WofE model was successfully used to map the favorability of Florida’s geology to sinkhole formation for use as a tool for developing hazard mitigation strategies. The results of this model do not suggest that any given area may or may not have a sinkhole. Instead, this model identifies areas of the state that have the favorable geology for sinkhole formation in large numbers during significant triggering events such as a large rainfall preceded by a prolonged drought, or an event where the water level in the aquifer is abruptly changed due to pumping activities.
Bayesian statistics, specifically utilizing WofE (Raines et al., 2000) in a GIS platform was applied to the input data. When applying this technique, much of the subjectivity and potential bias inherent in many expert driven models was removed. Moreover, by applying the WofE model, the results are self-validated. This, however, does not take the place of further model validation, which was performed for the model output.
Large amounts of data were processed and utilized in order to generate the favorability map. These data sets not only have limitations with respect to resolution, accuracy and completeness, but many also reflect a mere snapshot in time. Consequently, the resulting map is time-sensitive; as new data become available, the maps should be periodically revised. The frequency of this revision may serve well to correspond with program needs within Florida.
Within this report, the resultant maps represent the favorability for sinkhole formation. This map has been separated into four categories of relative favorability: least favorable, favorable, more favorable, and most favorable. The four-class favorability map is provided as a resource for Division of Emergency Management in creating mitigation plans for future sinkhole events.
Appropriate application of the maps is important and is discussed in this Applications section of the report. In general, it is recommended that the maps should be applied at scales smaller than 1:100,000 thereby eliminating the urge to compare relative favorability classes to individual land parcels. Use of the maps at a scale larger than 1:100,000 is not recommended. Most importantly, the favorability map is not of sufficient detail to provide site specific information regarding sinkhole formation.
FUTURE IMPROVEMENTS
There are multiple improvements to increase resolution which could be undertaken in future efforts. Those improvements can include:
• Refinement of the statewide spatial data layers utilized • Additional statewide data such as: geotechnical and geophysical data

36 | P a g e
• Seamless statewide LiDAR would tremendously improve the ability to spatially model and interpret closed topographic depressions.
• Consecutive years of seamless LiDAR would allow for change detection analysis that would potentially identify area which are being actively being affected by geologic processes, such karst activity.
• Modeling counties individually will allow for individually tailored analyses utilizing spatial data that may be more important at the county scale versus the statewide scale.
37 | P a g e
REFERENCES Arthur, J.D., Wood, H.A.R., Baker, A.E., Cichon, J.R., and Raines, G.L., 2007, Development and
implementation of a Bayesian-based aquifer vulnerability assessment in Florida: Natural Resources Research, v. 16, p. 93-107.
Aurit, M.D., Paterson, R.O., Blanford, J.I., 2013, A GIS Analysis of the Relationship between Sinkholes,
Dry-Well Complaints and Groundwater Pumping for Frost-Freeze Protection of Winter Strawberry Production in Florida: PLoS ONE, v. 8, e5382, doi:10.1371/journal.pone.0053832.
Baker, A.E., Wood, H.A.R., and Cichon, J.R., 2007, The Marion County Aquifer Vulnerability Assessment:
unpublished report submitted to Marion County Board of County Commissioners in fulfillment of Marion County Project No. SS06-01, March 2007, 42 p.
Bonham-Carter, G. F., 1994, Geographic Information Systems for Geoscientists, Modeling with GIS:
Oxford, Pergamon, 398 p. Brinkmann, R., and Parise, M., 2010, The timing of sinkhole formation in Tampa and Orlando, Florida: in
The Florida Geographer, V. 41, p. 22-38. Denizman, C., 2003, Morphometric and spatial distribution parameters of karstic depressions, Lower
Suwannee River Basin, Florida: Journal of Cave and Karst Studies, v. 65, no. 1, p. 29-35. Feyen, L., Dessalegn, A.M., DeSmedt, F., Gebremeskel, S., and Batelaan, O., 2004, Application of a
Bayesian Approach to Stochastic Delineation of Capture Zones: Ground Water, v. 42, no. 4, p. 542-551.
Ford, D.C., and Williams, P., 2007, Karst Hydrogeology and geomorphology: Wiley, Chichester, 562 p. Gordon, D.W., Painter, J.A., and McCranie, J.M., 2012, Hydrologic Conditions, Groundwater Quality, and
Analysis of Sinkhole Formation in the Albany Area of Dougherty County, Georgia, 2009: U.S. Geological Survey Scientific Investigations Report 2012-5018, 72 p.
Gutierrez, F., Cooper, A.H., Johnson, K.S., 2008, Identification, prediction, and mitigation of sinkhole
hazards in evaporite karst areas: in Environmental Geology, Springer-Verlag, p. 1-16. Kromhout, C., and Baker, A.E., 2015, Sinkhole Vulnerability Mapping: Results from a Pilot Study in North
Central Florida: in Proceedings of the 14th Multidisciplinary Conference on Sinkholes and the Engineering and Environmental Impacts of Karst, NCKRI Symposium 5, Carlsbad, NM, p 241-254.
Marella, R.L., 2012, Water Withdrawals in Florida, 2012: U.S. Geological Survey Open-File Report 2015-
1158, 10 p. Metcalfe, S.J., and Hall, L.E., 1984, Sinkhole collapse induced by groundwater pumpage for freeze
protection irrigation near Dover, Florida, January 1977: in Proceeding of the Conference on Sinkholes: Their Geology, Engineering, and Environmental Impact: Rotterdam, A.A. Balkema, p. 29-33.
Nuendorf, K.K., Mehl Jr., J.P., and Jackson, J.A., 2005, Glossary of Geology, 5th edition: Alexandria,
Virginia, American Geological Institute, 799 p.

38 | P a g e
Peterson, R.O., and Rumbaugh, J.O., III, 2012, Hydrogeologic impacts observed during the January 2010 Freeze event in Dover/Plant City, Hillsborough County, Florida: Southwest Florida Water Management District Resource Evaluation, June 2012.
Polk, J.S., and Brinkmann, R., 2015, Climatic Influences on Coastal Cave and Karst Development in
Florida, in Lace, M.J. and Mylroie, J.E., eds., Coastal Karst Landforms: Coastal Research Library 5, p. 317-345, DOI 10.1007/978-94-007-5016-6_15.
Poucher, S., and Copeland, R., 2006, Speleological and Karst Glossary of Florida and the Caribbean:
University Press of Florida, 192 p. Raines, Gary L., 1999, Evaluation of Weights of Evidence to Predict Epithermal-Gold Deposits in the Great
Basin of the Western United States: Natural Resources Research, vol. 8, no. 4, p. 257-276. Raines, G. L., Bonham-Carter, G. F., and Kemp, L., 2000, Predictive Probabilistic Modeling Using
ArcView GIS: ArcUser, v. 3, no.2, p. 45-48. Salvati, R., and Sasowsky, I.D., 2002, Development of collapse sinkholes in areas of groundwater
discharge: in Journal of Hydrology, v. 264, 11 p. Sawatzky, D.L., Raines, G.L., Bonham-Carter, G.F., and Looney, C.G., 2009, Spatial Data Modeller
(SDM): ArcMAP 9.3 geoprocessing tools for spatial data modelling using weights of evidence, logistic regression, fuzzy logic and neural networks. http://arcscripts.esri.com/details.asp?dbid=15341.
Scheidt, J., Lerche, I., and Paleologos, E., 2005, Environmental and economic risks from sinkholes in west-
central Florida: in Environmental Geosciences, v. 12, Iss. 5358, p. 207-217. Scott, T., 1988, The lithostratigraphy of the Hawthorn Group (Miocene) of Florida: Bulletin No. 59, Florida
Geological Survey. Sellards, E.H., 1913, Origin of the hard-rock phosphates of Florida: Florida Geological Survey Fifth Annual
Report, p. 115-159. Shrock, R.R., 1948a, Sequence in layered rocks: McGraw-Hill Book Co., New York, Toronto, London, p.
126. Sinclair, W.C., 1982, Sinkhole development resulting from ground-water development in the Tampa area,
Florida: U.S. Geological Survey Water-Resources Investigations Report 81-50, 19 p Tihansky, A.B., 1999, Sinkholes, west-central Florida: in Land subsidence in the United States: U.S.
Geological Survey, Circular 1182, pp. 121-140. Upchurch, S.B., and Lawrence, F.W., 1984, Impact of groundwater chemistry on sinkhole development
along a retreating scarp: in Proceedings of the Conference on Sinkholes: Engineering and Environmental Impact, Rotterdam, A. A. Balkema, p. 23-28.
Upchurch, S.B., Scott, T.M., Alfieri, M.C., and Dobecki, T.L., 2015, Shallow Depression in the Florida
Coastal Plain: Karst and Pseudokarst, NCKRI Symposium 5, 14th Sinkhole Conference, DOI 10.5038/978099100095101041.

39 | P a g e
Veni, G., DuChene, H.R., Crawford, N.C., Groves, C.G., Huppert, G.N., Kastning, E.H., Olson, R., and Wheeler, B.J., 2001, Living with Karst: a fragile foundation: AGI environmental awareness series, no. 4. American Geological Institute, Alexandria, Virginia.
Veni, G., Brashear, C.C., and Glasbrenner, D., 2015, Building codes to minimize cover collapses in
sinkhole-prone areas: in Proceedings of the 14th Multidisciplinary Conference on Sinkholes and the Engineering and Environmental Impacts of Karst, NCKRI Symposium 5, Carlsbad, NM, p 471-476.
Wade, D.D., and Langdon, O.G., 1982, Cabbage Palmetto:
https://www.na.fs.fed.us/spfo/pubs/silvics_manual/Volume_2/sabal/palmetto.htm (accessed June 2016).
Waltham, T., Bell, F., and Culshaw, M., 2005, Sinkholes and Subsidence: Karst and Cavernous Rocks in
Engineering and Construction: Praxis Publishing, Chichester, UK, 379 p. Williams, et. al., in preparation, Florida Geomorphology: Florida Geological Survey, Tallahassee, FL Wilson, W.L., and Beck, B.F., 19992, Hydrogeologic Factors Affecting New Sinkhole Development in the
Orlando Area, Florida: in Groundwater, Volume 30, No. 6, p 918-930.

40 | P a g e
APPENDIX I
Mitigation Measures
Sinkhole-prone areas exist throughout the world. Due to the interaction of people with these geohazards, a variety of ways to lessen the chance of sinkhole formation or mitigate sinkhole formation have been developed. In most cases, sinkhole mitigation measures are directly linked to how people use, or impact, their local water resources. Some of these interactions are known as triggering mechanisms.
In the United States, there are many state specific policies involving sinkholes. Common regulatory practices include zoning ordinances with construction requirements, subdivision ordinances, stormwater management rules, setbacks, and comprehensive plans (Fluery, 2007). In general, hazards associated with sinkholes can be mitigated by proper planning, geotechnical site investigation, appropriate design and proper maintenance of infrastructure. Below briefly outlines two recent publications which propose mitigation measures within sinkhole-prone areas.
Focusing on sinkhole collapse and the management of water recharge in urban and suburban areas
of Pasco County, Veni et al (2015) suggest the following sources of focused recharge be addressed by building code changes:
• roof runoff • street drainage • lawn irrigation systems • effluent from septic tanks • leaking plumbing below or beside buildings • obsolete or unrepaired shallow irrigation wells • unlined stormwater ponds • leaking swimming pools • wastewater spray fields.
Gutierrez et al (2008), focusing on sinkhole development in Spain, proposed the following
measures to mitigate karst activity in sensitive areas: • manage water withdrawals and declines in the aquifer • line canals and ditches • manage irrigation • utilize geomembranes and geotextiles • create efficient drainage systems and divert surface runoff • remediate existing sinkholes • grout cavities • improve ground compaction by injection grouting to increase strength and weight bearing
capacity of soils • construct cutoff screens and grout curtains to arrest groundwater circulation • construct engineered slabs • reinforce foundations using beams • incorporate tensile geogrids in subbase and embankments of roads and railways • utilize oversized piers and pads and sacrificial piers for bridges • instrument critical infrastructure with monitoring devices • implement educational programs for policy and decision makers • install signage in existing hazard areas
Gutierrez et al (2008) state that the safest mitigation strategy is to avoid the areas of highest sinkhole susceptibility through land use planning and regulation.

41 | P a g e
Additional Mitigation Measures
Mitigation is common practice for critical infrastructure such as power plants, landfills, water
treatment facilities, highways, bridges, large reservoirs, pipelines, and transmission lines. A pre-construction geologic or geotechnical site investigation can be an effective mitigation tool to identify potential karst hazards. In addition to the mitigation measures listed above, those tools include:
• visual site inspection by a licensed professional geologist (to identify potential surface anomalies)
• geophysical surveys (to investigate for anomalous zones below ground and test surface anomalies)
• exploratory boreholes (to test geologic strength or investigate anomalies identified by geophysics)
• dynamic ground improvement (to compact and strengthen subsurface geology and to collapse unforeseen cavities), methods include:
o rolling surcharge o dynamic compaction o vibratory compaction
Mitigation Measures for Forming or Newly Formed Sinkholes
The British Geological Survey (BGS) (2016) notes that hazards associated with sinkholes can be
mitigated by appropriate planning, good site investigation (with geophysics and boreholes), appropriate design and proper maintenance of infrastructure. The BGS recommends in the event of a newly formed or forming sinkhole, measures can be taken to ensure the safety of those threatened by the geohazard and to reduce the impact of the feature on nearby infrastructure:
• a perimeter should be cordoned off around the feature with substantial buffer between the actual feature and the perimeter
• landowners and emergency services should be notified as appropriate • infrastructure managers should be contacted • ensure that any triggering mechanisms are minimized in the area • check engineering and geological history of the area and request a list of consulting
engineers that can give advice on the correct way to stabilize the features
In 2005 the Florida Geological Survey published Special Publication 57, “Geological and Geotechnical Investigation Procedures For Evaluation of the Causes of Subsidence Damage In Florida.” The publication is intended to be a guide to promote currently accepted investigative practices used within the professional geoscience community in Florida to investigate the presence of karst processes (Schmidt, 2005).
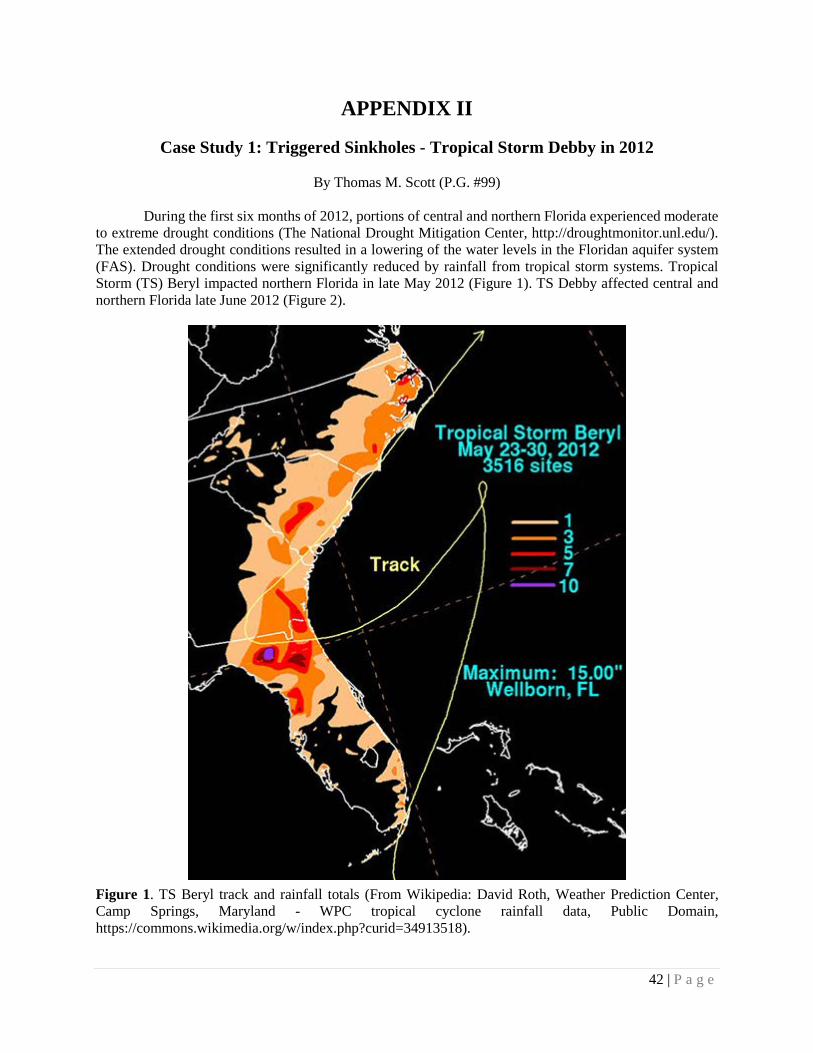
42 | P a g e
APPENDIX II
Case Study 1: Triggered Sinkholes - Tropical Storm Debby in 2012
By Thomas M. Scott (P.G. #99)
During the first six months of 2012, portions of central and northern Florida experienced moderate to extreme drought conditions (The National Drought Mitigation Center, http://droughtmonitor.unl.edu/). The extended drought conditions resulted in a lowering of the water levels in the Floridan aquifer system (FAS). Drought conditions were significantly reduced by rainfall from tropical storm systems. Tropical Storm (TS) Beryl impacted northern Florida in late May 2012 (Figure 1). TS Debby affected central and northern Florida late June 2012 (Figure 2).
Figure 1. TS Beryl track and rainfall totals (From Wikipedia: David Roth, Weather Prediction Center, Camp Springs, Maryland - WPC tropical cyclone rainfall data, Public Domain, https://commons.wikimedia.org/w/index.php?curid=34913518).

43 | P a g e
Figure 2. TS Debby track and rainfall (from Wikipedia: David Roth, Weather Prediction Center, Camp Springs, Maryland - WPC tropical cyclone rainfall data, Public Domain, (https://commons.wikimedia.org/w/index.php?curid=37227815). The impact of the heavy rains following the extended drought conditions caused numerous sinkholes to form in Hernando County, Suwannee County and other counties. Hernando County June 2012 Sinkhole Event
Heavy rainfall associated with TS Debby caused localized flooding and the development of numerous sinkholes in Hernando County. Rainfall records for Brooksville recorded 2.4 inches on June 22, 10.6 inches on June 24th, 1.0 inches on June 25th and 0.1 inches on June 26th (http://www.ncdc.noaa.gov/cdo-web/search). Rainfall at Brooksville exceeded 14 inches (http://www.ncdc.noaa.gov/cdo-web/search). Figure 2 shows 15 to 20 inches of rainfall in the vicinity of Spring Hill.
The FGS Subsidence Incident Report (SIR) database records 37 subsidence events occurring between June 27th and July 6th, 2012; however, anecdotal accounts indicate sinkhole formation occurring
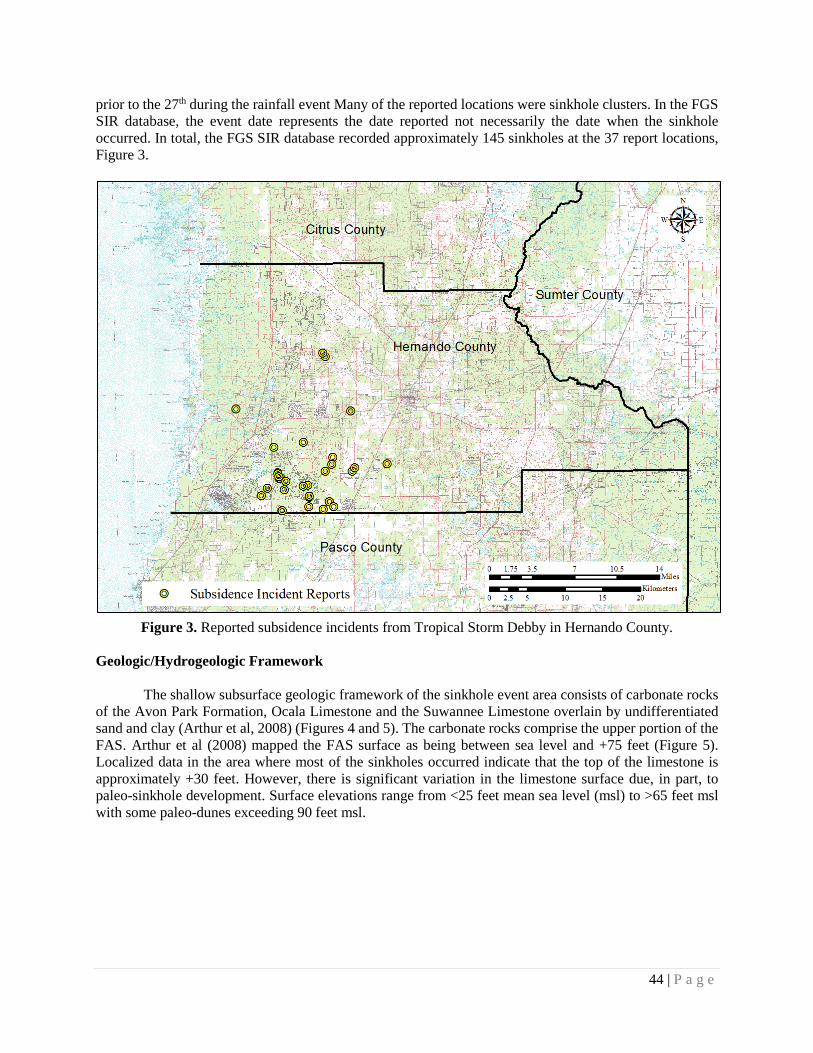
44 | P a g e
prior to the 27th during the rainfall event Many of the reported locations were sinkhole clusters. In the FGS SIR database, the event date represents the date reported not necessarily the date when the sinkhole occurred. In total, the FGS SIR database recorded approximately 145 sinkholes at the 37 report locations, Figure 3.
Figure 3. Reported subsidence incidents from Tropical Storm Debby in Hernando County.
Geologic/Hydrogeologic Framework
The shallow subsurface geologic framework of the sinkhole event area consists of carbonate rocks of the Avon Park Formation, Ocala Limestone and the Suwannee Limestone overlain by undifferentiated sand and clay (Arthur et al, 2008) (Figures 4 and 5). The carbonate rocks comprise the upper portion of the FAS. Arthur et al (2008) mapped the FAS surface as being between sea level and +75 feet (Figure 5). Localized data in the area where most of the sinkholes occurred indicate that the top of the limestone is approximately +30 feet. However, there is significant variation in the limestone surface due, in part, to paleo-sinkhole development. Surface elevations range from <25 feet mean sea level (msl) to >65 feet msl with some paleo-dunes exceeding 90 feet msl.

45 | P a g e
Figure 4. Cross section location. The western three wells of F-F’ are shown in Figure 3 (Modified from Arthur et al, 2008).
Figure 5. Stratigraphic sequence in southern Hernando County (Modified from Arthur et al, 2008).
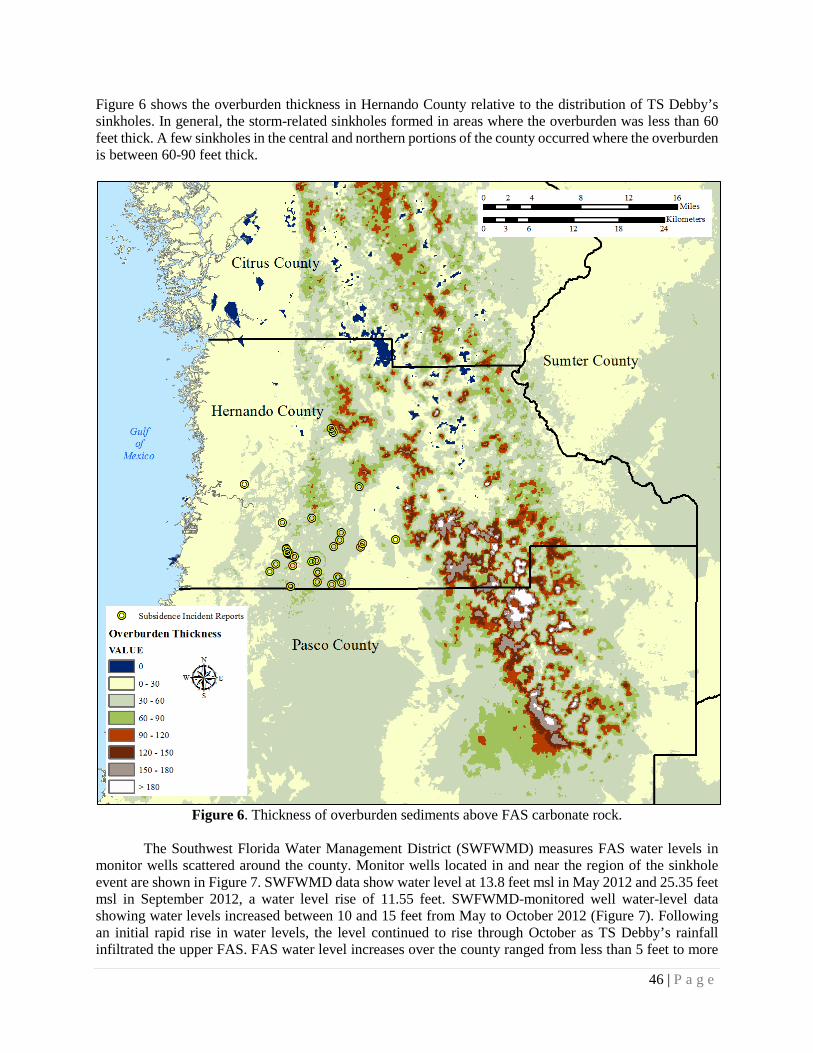
46 | P a g e
Figure 6 shows the overburden thickness in Hernando County relative to the distribution of TS Debby’s sinkholes. In general, the storm-related sinkholes formed in areas where the overburden was less than 60 feet thick. A few sinkholes in the central and northern portions of the county occurred where the overburden is between 60-90 feet thick.
Figure 6. Thickness of overburden sediments above FAS carbonate rock.
The Southwest Florida Water Management District (SWFWMD) measures FAS water levels in monitor wells scattered around the county. Monitor wells located in and near the region of the sinkhole event are shown in Figure 7. SWFWMD data show water level at 13.8 feet msl in May 2012 and 25.35 feet msl in September 2012, a water level rise of 11.55 feet. SWFWMD-monitored well water-level data showing water levels increased between 10 and 15 feet from May to October 2012 (Figure 7). Following an initial rapid rise in water levels, the level continued to rise through October as TS Debby’s rainfall infiltrated the upper FAS. FAS water level increases over the county ranged from less than 5 feet to more
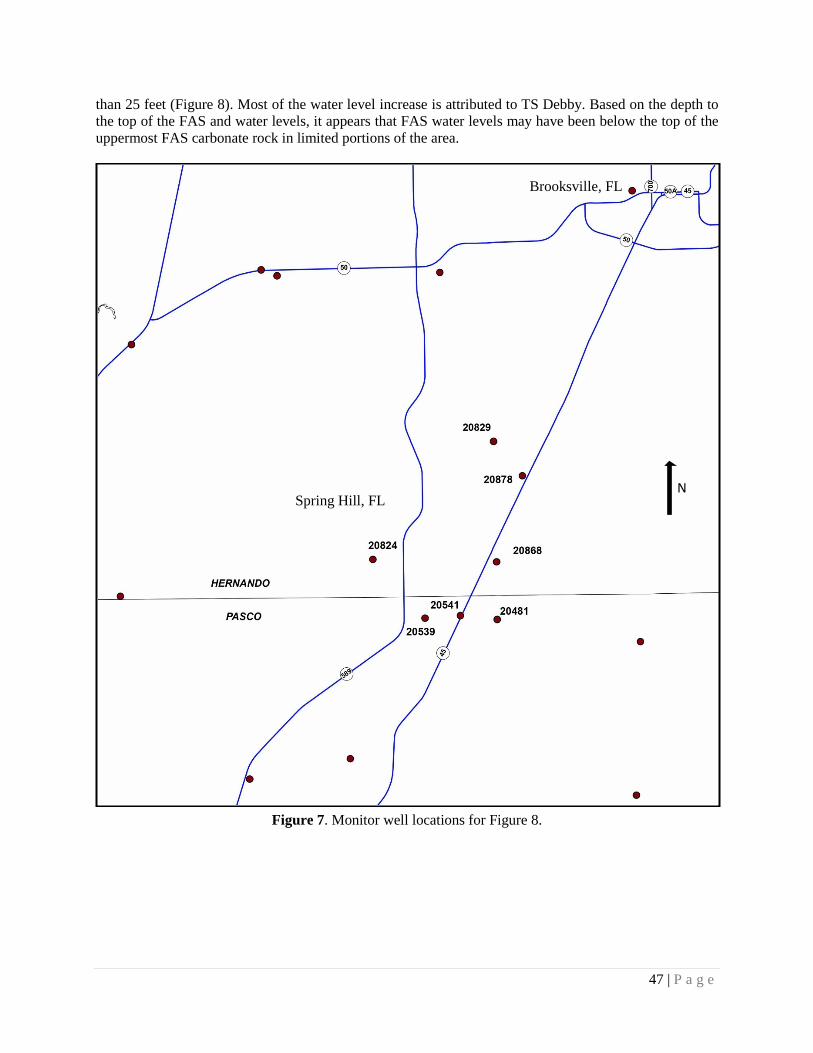
47 | P a g e
than 25 feet (Figure 8). Most of the water level increase is attributed to TS Debby. Based on the depth to the top of the FAS and water levels, it appears that FAS water levels may have been below the top of the uppermost FAS carbonate rock in limited portions of the area.
Figure 7. Monitor well locations for Figure 8.
N
Brooksville, FL
Spring Hill, FL

48 | P a g e
Figure 8. FAS water level changes in response to TS Debby’s rainfall (SWFWMD).
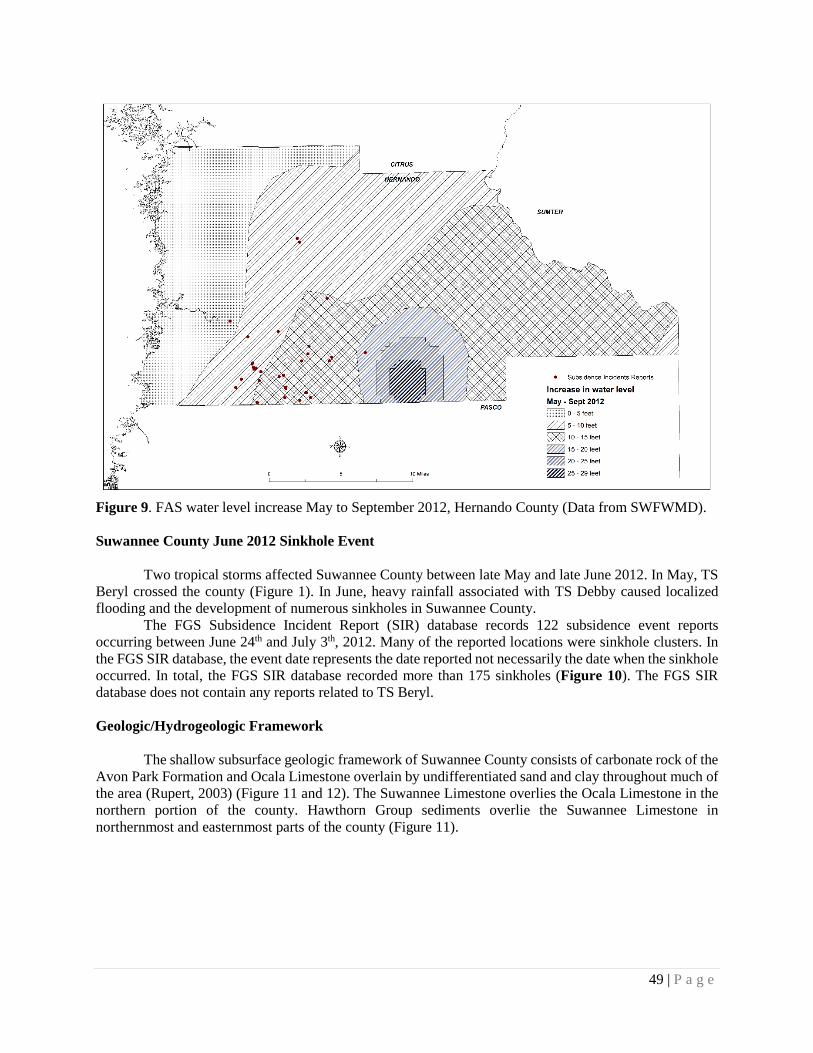
49 | P a g e
Figure 9. FAS water level increase May to September 2012, Hernando County (Data from SWFWMD). Suwannee County June 2012 Sinkhole Event
Two tropical storms affected Suwannee County between late May and late June 2012. In May, TS Beryl crossed the county (Figure 1). In June, heavy rainfall associated with TS Debby caused localized flooding and the development of numerous sinkholes in Suwannee County.
The FGS Subsidence Incident Report (SIR) database records 122 subsidence event reports occurring between June 24th and July 3th, 2012. Many of the reported locations were sinkhole clusters. In the FGS SIR database, the event date represents the date reported not necessarily the date when the sinkhole occurred. In total, the FGS SIR database recorded more than 175 sinkholes (Figure 10). The FGS SIR database does not contain any reports related to TS Beryl.
Geologic/Hydrogeologic Framework
The shallow subsurface geologic framework of Suwannee County consists of carbonate rock of the Avon Park Formation and Ocala Limestone overlain by undifferentiated sand and clay throughout much of the area (Rupert, 2003) (Figure 11 and 12). The Suwannee Limestone overlies the Ocala Limestone in the northern portion of the county. Hawthorn Group sediments overlie the Suwannee Limestone in northernmost and easternmost parts of the county (Figure 11).

50 | P a g e
Figure 10. Reported subsidence incidents from Tropical Storm Debby in Suwannee County.
(Rupert, 2003). Carbonate rock comprises the upper portion of the FAS. Allison, et al (1995) mapped the FAS surface as being between sea level in the southernmost part of the county and 90 feet msl in the northern part (Figure 13). Surface elevations range from <70 feet msl to >100 feet msl in the more karstified areas while elevations in the uplands north and east of Live Oak often exceed 150 feet msl. Figure 14 shows the overburden thickness in Suwannee County relative to the distribution of TS Debby’s sinkholes. In general, the storm-related sinkholes formed in areas where overburden was less than 60 feet thick. A few sinkholes in the central and eastern portions of the county occurred where the overburden is greater than 60 feet thick. Much greater thicknesses of these sediments occur in paleo-sinkholes.

51 | P a g e
Figure 11. Cross section locations (Rupert, 2003).

52 | P a g e
Figure 12. Cross sections for Suwannee County (Rupert, 2003).

53 | P a g e
Figure 13. Top of FAS carbonate rock (modified from Allison et al, 1995)

54 | P a g e
Figure 14. Thickness of overburden sediments above FAS carbonate rock.
The SRWMD was impacted by two tropical storms in May and June 2012, Beryl and Debby. TS
Beryl passed through this area in late May providing a significant amount of rain. Figure 1 shows Beryl’s path and rainfall amounts. SRWMD radar-based estimates indicate that Suwannee County received between 4 and 16 inches of rain from Beryl (Figure 15). TS Debby traversed the area in late June 2012. Figure 2 shows Debby’s path and rainfall amounts. Rainfall data for Branford recorded 0.3 inches on June 22, 4.1 inches on June 24th, 3.0 inches on June 25th and 9.4 inches on June 26th (http://www.ncdc.noaa.gov/cdo-web/search). Rainfall data for Dowling Park recorded 0.2 inches on June 23, 2.7inches on June 24th, 5.5 inches on June 25th and 1.0 inches on June 26th (http://www.ncdc.noaa.gov/cdo-web/search). Rainfall totaled 16.8 inches in Branford and 11.4 inches in Dowling Park. Figure 2 shows 15 to 20 inches of rainfall in the portions of Suwannee County from TS Debby. SRWMD radar-based estimates indicate that Suwannee County received between 9 and 33 inches of rain from Debby (Figure 16). Figure 17 shows the

55 | P a g e
radar-based rainfall estimate from Beryl and Debby. The estimates show that much of Suwannee County received 36 to 48 inches of rainfall from May 26 to June 30, 2012
Figure 15. Radar-based rainfall estimates for May 2012 including TS Beryl (SRWMD, 2012).
The Suwannee River Water Management District (SRWMD) measures FAS water levels in
Suwannee County. Figure 18 shows the monitor well locations for the well records displayed in Figure 19. SRWMD data show significant increases in water level in late June and early July 2012 (Figure 19). Water level data show that water levels increased between 10 and 15 feet from May to September 2012 (Figure 19). Many of the monitor wells show significant water level rises as a result of TS Debby. Three wells located in the southwestern portion of the county – coincident with TS Beryl’s highest rainfall totals – show water levels rising after TS Beryl followed by significant water level rises due to TS Debby. Figure 20 shows the increases in water level in the FAS from May to September 2012. Most of the water level increase is attributed to Tropical Storms Beryl and Debby. Based on the depth to the top of the FAS and water levels, it appears that water levels were below the top of the uppermost FAS in many portions of the county.

56 | P a g e
Figure 16. Radar-based rainfall estimates for June 2012 including TS Debby (SRWMD, 2012).
Figure 17. Radar-based rainfall estimates for May 26th to June 30th, 2012 including Tropical Storms Beryl and Debby (SRWMD, 2012)
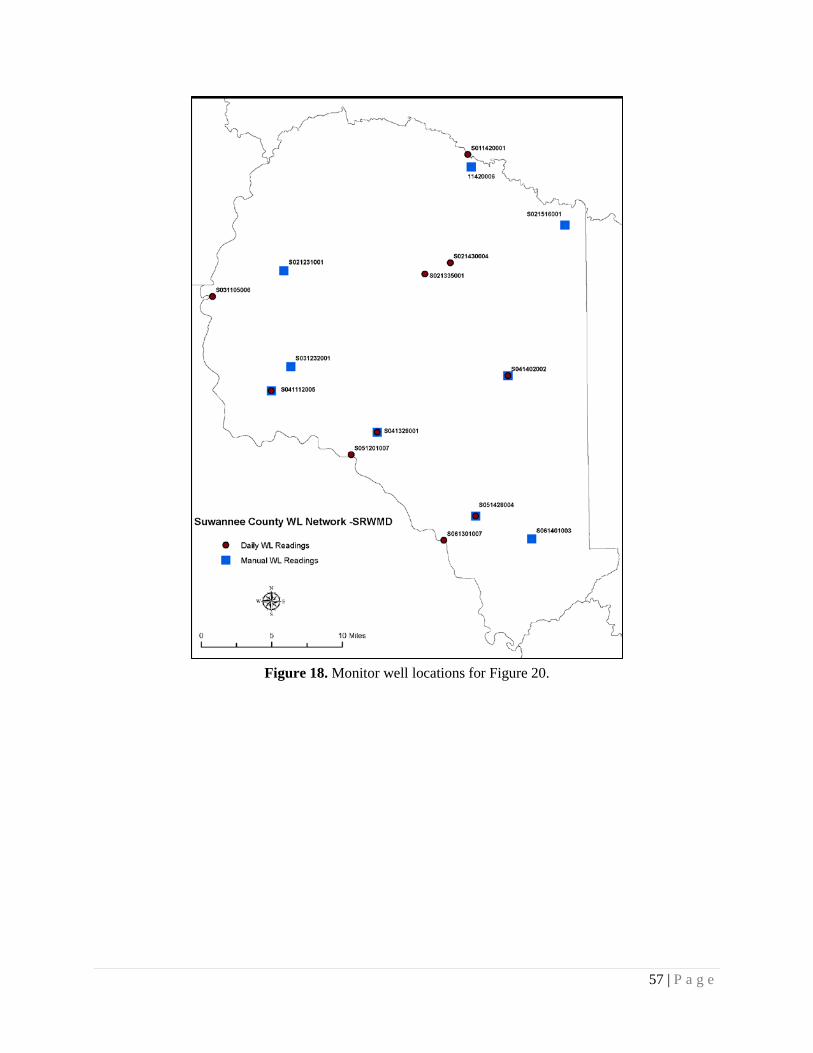
57 | P a g e
Figure 18. Monitor well locations for Figure 20.
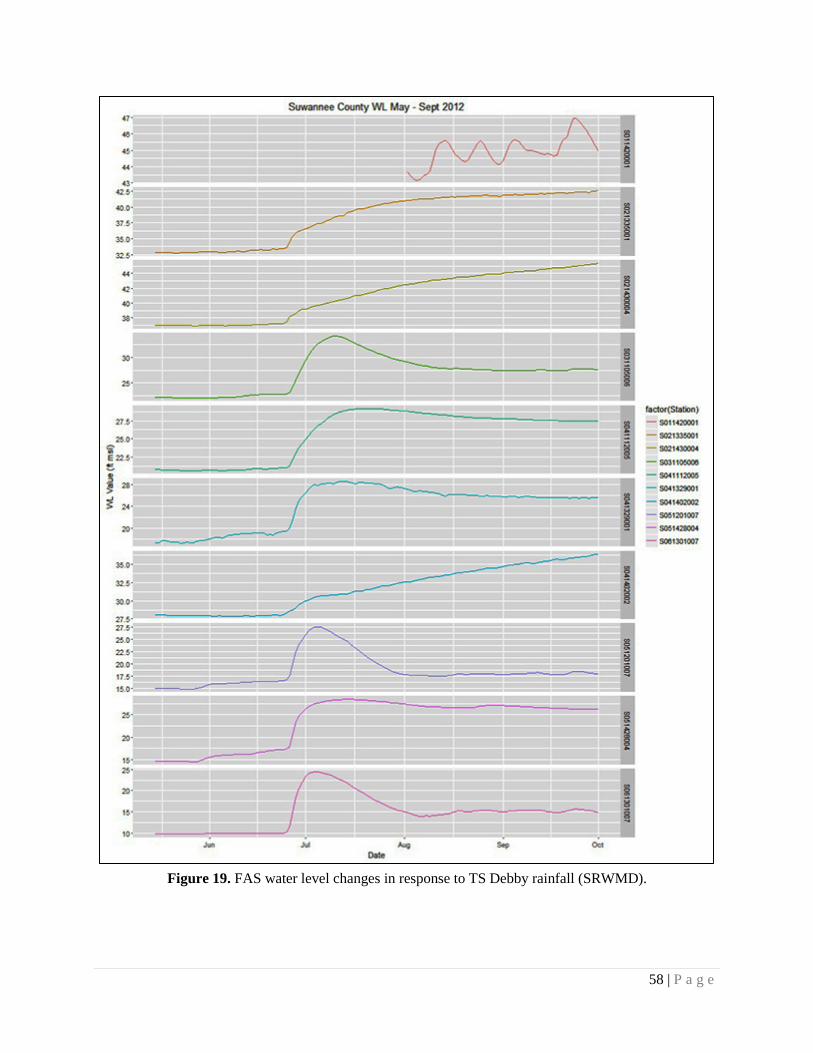
58 | P a g e
Figure 19. FAS water level changes in response to TS Debby rainfall (SRWMD).

59 | P a g e
Figure 20. Increases in the FAS water levels in response to TS Debby (Data from SRWMD).
Discussion
Geologists have long held the opinion that reductions in water levels in carbonate aquifers increases the likelihood of sinkhole collapse. Additionally, observations show an increased frequency of sinkhole collapse occurring when heavy precipitation follows droughts. In the case of Hernando and Suwannee Counties, significant drought conditions in early 2012 reduced the FAS water levels near or below the top of the upper FAS carbonate rock in some areas. This reduced the buoyancy effect of the water on the limestone, increasing the likelihood of sinkhole collapses. TS Debby rainfall in Hernando and Suwannee Counties and TS Beryl in Suwannee County added a significant amount of water as rainfall soaked into the
60 | P a g e
sand overlying the FAS and providing much needed recharge. The additional weight of the water, in conjunction with the already lower water levels in the FAS, set the stage for sinkhole collapse.
There are no scientific methods to determine where or exactly when sinkholes will collapse. However, warnings for increased sinkhole-collapse favorability can potentially be issued if the geohydrologic template discussed above is identified and is accompanied by weather forecasts of heavy rainfall. References Allison, D., Groszos, M., and Rupert, F., 1995, Top of rock of the Floridan Aquifer System in the
Suwannee River Water Management District: Florida Geological Survey, Open-file Map Series 84. Arthur, J.D., Fischler, C., Kromhout, C., Clayton, J.M., Kelley, G.M., Lee, R.A., Li, L., O'Sullivan, M.,
Green, R.C, and Werner, C.L., 2008, Hydrogeologic framework of the Southwest Florida Water Management District: Florida Geological Survey Bulletin 68.
Rupert, F.R., 2003, Geology of Suwannee County, Florida: Florida Geological Survey, Open-file Report
86, 9 p Wikipedia: David Roth, Weather Prediction Center, Camp Springs, Maryland - WPC tropical cyclone
rainfall data, Public Domain, https://commons.wikimedia.org/w/index.php?curid=34913518 Wikipedia: David Roth, Weather Prediction Center, Camp Springs, Maryland - WPC tropical cyclone
rainfall data, Public Domain, https://commons.wikimedia.org/w/index.php?curid=37227815

61 | P a g e
APPENDIX III
Case Study 2: Triggered Sinkholes – Pumping-related Freeze Protection, Hillsborough County, January 2010
By Thomas M. Scott (P.G. #99)
Geologists have long noted the correlation between sinkhole formation and heavy rainfall. In
particular, geologists recognized the frequency of sinkhole formation increased dramatically when drought conditions were followed by very heavy rainfall, often from tropical storms. Geologists have also correlated severe, man-induced reductions in the potentiometric surface in the Floridan aquifer system (FAS) with sinkhole formation. The Florida Geological Survey (FGS) examined two sinkhole events caused by these factors: 1) The January 2010 sinkhole event in eastern Hillsborough County (this Appendix), and 2) The June 2012 sinkhole events in Hernando and Suwannee Counties (Appendix II). Data were gathered from previous publications, rainfall data, potentiometric maps, well water-level records, FGS Subsidence Incident Report database (FGS SIR), and lithologic descriptions. The results of this investigation lay the groundwork for additional investigations into these and other sinkhole events to better determine if there are more specific conditions that may be used to alert scientists, public officials, and the public that sinkhole frequency may increase when these conditions occur. Hillsborough County January 2010 Sinkhole Event
Freezing temperatures in agricultural areas often necessitate heavy pumpage of groundwater to protect cold sensitive plants. In portions of Hillsborough County near Dover and Plant City, agriculture is very important to the local economy. Peterson and Rumbaugh (2012) provide an excellent review of the freeze event and the subsequent effects. In January 2010, freezing temperatures for nine nights of 11 consecutive days resulted in the need to pump large quantities of groundwater from the FAS for strawberry crop protection. The January 2010 freeze is considered an extreme example of freezes that have affected this area since the 1970s. For discussions of previous investigations related to freeze-protection groundwater pumpage, refer to Peterson and Rumbaugh (2012).
The two major effects of the freeze-protection groundwater withdrawals in Hillsborough County were sinkholes and wells going dry. At least 140 sinkholes (Figure 1) and 760 dry well complaints were reported. Higher than normal groundwater withdrawals began on January 4, 2010 and continued through January 14, 2010 (Peterson and Rumbaugh, 2012; Figure 2). The maximum drawdown of the upper FAS occurred January 11-12, 2010 and had a maximum reduction of at least 55 feet. The FAS water level began to recover following the freeze and the termination of the freeze-protection groundwater withdrawals on January 14th.
Peterson and Rumbaugh (2012) state that approximately 140 sinkholes formed in the Dover/Plant City area during this freeze event (Figure 1). FGS SIR entries for the Dover/Plant City area show 124 reports of subsidence likely related to groundwater withdrawals beginning with one report on January 9th. On January 11, FGS SIR data show 25 reports followed by 14 on January 12th, 22 on January 13th, 29 on January 14th, 13 on January 15th, one each day on January 16th and

62 | P a g e
Figure 1. 140 sinkholes triggered by groundwater withdrawal during the January 2010 freeze.
17th, five on January 20th, four on January 21st, five on January 22nd, three on January 25th, one on January 27th, and one on January 28th. As can be seen on Figure 2, the majority of sinkholes were reported between January 11th and 15th. From the FGS SIR data, approximately 83% of the reported sinkholes occurred during this timeframe.
Impressive drawdowns began with groundwater withdrawals on January 6-7 and 7-8. Increased drawdown occurred on January 10-11 and reached the maximum water-level reduction on January 11-12 (Figure 3). Water levels began a punctuated recovery between January 11-12 to 13-14 when freeze-protection groundwater withdrawals ended. Beginning on January 14th, water levels progressively rose. Water levels in the FAS recovered to approximately 45 feet NGVD (approximately 10 feet below pre-freeze levels) by January 22nd (Peterson and Rumbaugh, 2012).

63 | P a g e
Figure 2. Reported sinkholes during the January 2010 freeze (modified after Peterson and Rumbaugh, 2012).
Geology of the Dover/Plant City Area
The study area lies within the northwestern portion of the Hardee Plain within the Peace River District (Williams, et. al., in preparation). Elevations vary from less than 70 feet NGVD to greater than 140 feet NGVD. Tertiary carbonates that form the upper portion of the FAS underlying the area include the Avon Park Formation, Ocala Limestone, Suwannee Limestone, and the Tampa Member of the Arcadia Formation of the Hawthorn Group (Figure 4, ROMP DV-1). The upper carbonates of the FAS are involved in sinkhole development in the Dover/Plant City area. The Suwannee Limestone (Oligocene Epoch) is more permeable and porous than the Tampa Member and is well known for containing dissolutionally enhanced secondary porosity – cavities, enlarged fractures, conduits and caves. The Tampa Member is finer grained than the Suwannee Limestone and appears to have less well developed dissolutional features. Although it is not specifically known at this time, the Suwannee Limestone is the likely location of void space large enough and sufficiently common to accommodate the necessary volumes of overburden sediment to create sinkholes.

64 | P a g e
Figure 3. FAS Drawdown in monitor well ROMP DV-1 (Figure 6) and temperatures during the January 2010 freeze (Peterson and Rumbaugh, 2012).
The Suwannee Limestone was encountered in ROMP DV-1 at approximately -41 feet NGVD and
was overlain by the Tampa Member between -41 feet NGVD and 32 feet NGVD (Figure 4, ROMP DV-1). Peace River Formation of the Hawthorn Group occurred between 32 feet NGVD and 92 feet NGVD. Undifferentiated sand and clay was encountered between 92 feet NGVD and the land surface. West to east across the study area, the Tampa Member thickness shows some variation and the Tampa Member grades eastward into the undifferentiated Arcadia Formation (Scott, 1988; Arthur et al., 2008). Variable thicknesses of Peace River Formation and undifferentiated sand and clay occur across the area (Arthur et al., 2008). North to south, the Suwannee Limestone and the Tampa Member are near land surface north of ROMP DV-1 (Arthur et al., 2008). The tops of these units dip toward the south. The Tampa Member thickens southward through the area.

65 | P a g e
Figure 4. Stratigraphic sequence in the Dover/Plant City area. ROMP DV-1 (Arthur et al., 2008).
Discussion
Tihansky (1999) provides an excellent discussion of sinkholes occurring as a result of pumpage. Groundwater withdrawals for well development, agricultural, commercial and residential use may result in a reduction of the water levels within the FAS. If the reductions are severe, sinkhole activity may be triggered resulting in land-surface collapse.

66 | P a g e
Agricultural freeze-protection events include between 1977 to 2010 (Peterson and Rumbaugh, 2012). The most dramatic water-level reduction was recorded during the 2010 drawdown. Although there are limited records of the timing of reported sinkholes for the prior events, there are records of reported sinkholes. The number of reported sinkholes during previous freeze events ranged from 0 during a December 2010 freeze to 27 reported in 1985 (Peterson and Rumbaugh, 2012). The number of sinkholes reported for the January 2010 freeze eclipsed the numbers reported in prior events dating back to 1977.
Figure 5. Comparison of sinkhole reports and freeze events (Peterson and Rumbaugh, 2012).
Groundwater withdrawals during the January 2010 freeze greatly exceeded the withdrawals for
other freezes. It seems obvious that the significantly greater lowering of the water level in the FAS was the triggering mechanism for the sinkholes.
Many monitoring wells in the Hillsborough-Polk area exhibited significant drawdowns during the January 2010 freeze event. Monitoring wells in the Frostproof area recorded significant drawdowns but very few sinkholes were reported (Figure 6). The very limited occurrence of sinkholes in this area, regardless of the significant, localized water-level drawdowns, is attributed to the geologic framework of the Frostproof area. In this area, there is a thicker sequence of cohesive, clayey sediments of the Hawthorn Group as compared to the Dover/Plant City area.
Conclusions
Geologists have, for a long time, recognized that significant groundwater withdrawals may have a causative effect on the development of sinkholes. However, there are little data indicating the extent of drawdown versus sinkhole development and the regional geologic framework. The 2010 Dover/Plant City event provided an opportunity to compare periodic, intense groundwater drawdowns with sinkhole occurrence and the geologic framework.

67 | P a g e
Figure 6. Monitoring wells with significant water-level drawdown during the January 2010 freeze.
Periodic freezes triggering agricultural-freeze protection protocols show that the magnitude of the
groundwater withdrawals is related to the frequency of sinkhole occurrence. The January 2010 freeze triggered the freeze protection protocols during an 11 day period (Figure 3). Groundwater withdrawals were particularly pronounced from January 10 – 14, 2010. Coincidentally, the greatest reported frequency of sinkhole formation occurred between January 11 – 15. Few sinkholes were reported prior to January 11th. Also, a limited number of sinkholes were reported after January 15th as the FAS water levels were recovering.
Significant drawdowns of the FAS water levels also occurred in the Frostproof area. However, few sinkholes were reported. It appears that the significantly thicker section of Hawthorn Group clayey sediments likely inhibited the formation of sinkholes during the drawdown event.
The sinkhole formation triggering mechanism for the Dover/Plant City sinkhole event of January 2010 appears related to two significant factors: 1) a relatively thin sequence of Hawthorn Group clayey sediments and younger sand overlie the FAS; and 2) the significant drawdown and duration of the FAS water levels (the largest drawdown for freeze protection on record). For future freeze events where freeze-protection protocols trigger extensive groundwater withdrawals, SWFWMD groundwater modeling may be able to predict the extent of drawdowns. If drawdowns are projected to be the same or greater than the January 2010 levels, a potential sinkhole risk warning may be warranted. References Arthur, J.D., Fischler, C., Kromhout, C., Clayton, J.M., Kelley, G.M., Lee, R.A., Li, L., O'Sullivan, M.,
Green, R.C, and Werner, C.L., 2008, Hydrogeologic framework of the Southwest Florida Water Management District: Florida Geological Survey Bulletin 68.

68 | P a g e
Peterson, R.O., and Rumbaugh, J.O., III, 2012, Hydrogeologic impacts observed during the January 2010 freeze event in Dover/Plant City, Hillsborough County, Florida: Southwest Florida Water Management District Resource Evaluation, June 2012.
Tihansky, A.B., 1999, Sinkholes, west-central Florida: in Land subsidence in the United States: U.S.
Geological Survey, Circular 1182, pp. 121-140.
69 | P a g e
APPENDIX IV
Additional Data Collected – Detailed Explanations Other The ‘Other’ designation was generally used to document points which did not fit the above designations, with the ‘subtype’ ‘Access Comment’, ‘Cabbage Palm’, ‘Cabbage Palm Abundant’, ‘Data Quality Comment’, ‘Feature of Interest – High Priority’, ‘Feature of Interest – Low Priority’, ‘Geologic Comment’, or ‘Uncategorized Comment’. ‘Cabbage Palm’ and ‘Cabbage Palm Abundant’ points were dropped because the presence of cabbage palm trees can be a possible indicator of a carbonate-rich rock or sediment at or near the surface (Wade and Langdon, 2016). ‘Geologic Comment’ points were usually dropped in wetlands, although in a few cases distinct geomorphological features such as Carolina bays were seen in LiDAR and recorded. For an informative discussion on Carolina bays, see Upchurch et al 2015. ‘Uncategorized Comment’ generally consisted of an amalgamation of anthropogenic, or inaccessible features, or nondescript topographic lows. Access
As with any field study, a hindrance to data collection was a lack of access. Field staff characterized many restricted roadways and features of interest as ‘Posted No Trespassing’. In some cases, public roads were impassable due to flooding, ongoing maintenance, or lack of maintenance, previously mapped public roads no longer existed, or gates were locked. Most often, however, ’Access’ points were dropped upon encountering private property and the owner was not accessible. In certain areas, field staff could not ever gain access, including but not limited to military bases, timberlands, phosphate tracts, large ranchlands, and wetland areas. Many features of interest were inaccessible due to inundation.
Float ‘Float’ was rarely documented because it was rarely encountered. Because of general vegetation or development cover, float was only encountered in razed fields where carbonate rock was generally at or near to land surface, brought up through tilling soil. In these areas, for example, field staff often noticed farmers had removed boulders from open fields and piled them up around oak trees. M Series
Sixty-eight surficial rock hand samples collected and archived by FGS are given the name M-Series. M-Series data point collection focused on samples from carbonate units, because carbonate presence at land surface is a potential indicator of karst activity and therefore potential sinkhole occurrence. M-Series were also used to confirm the top of carbonate rock layer, and were taken only from public lands and private property when granted permission by the property owner. No samples were taken on federally protected land. M-Series were collected in large Ziploc bags marked with a latitude and longitude and given a cursory description in ArcPad. M-Series were then described in greater detail back in the lab and assigned an official M-Series number. Field staff observed carbonate rock in many sinkholes, but sometimes could not retrieve samples for safety reasons.
With a few exceptions, surficial non-carbonate units in Florida consist of unconsolidated sands and clays of Miocene and younger origin. In this project for modeling purposes, these clastic sediments are lumped into one layer: overburden. Due to the relative abundance and fragile nature of overburden outcrop exposures, the field team often refrained from collecting such samples, and instead opted to drop ‘Outcrop’

70 | P a g e
points. However, in a few cases there was a discrepancy between field observations and previously mapped surficial lithology, and so overburden samples were taken.
Outcrop
The combination of gentle topography and prevalence of heavily vegetated and heavily developed areas throughout the State of Florida limited documentation of outcrops. Outcrops were either anthropogenic, resulting from quarrying, dug drainages and canals, or road cuts, or natural, which included river cuts, caves, or caprock exposed at the surface. Forty-five outcrop locations were documented, and like the M-Series, outcrop information helps to refine the FGS’s surficial geologic mapping within the state, including this project. References Upchurch, S.B., Scott, T.M., Alfieri, M.C., and Dobecki, T.L., 2015, Shallow Depression in the Florida
Coastal Plain: Karst and Pseudokarst, NCKRI Symposium 5, 14th Sinkhole Conference, DOI 10.5038/978099100095101041.
Wade, D.D., and Langdon, O.G., 1982, Cabbage Palmetto:
https://www.na.fs.fed.us/spfo/pubs/silvics_manual/Volume_2/sabal/palmetto.htm (accessed June 2016).

71 | P a g e
APPENDIX V
Data Limitations and Application of the Map Data Limitations
A number of techniques are employed to resolve data gaps and inconsistencies within statewide data layers. The elevation data utilized to develop some of the significant data layers for the project were based on USGS 7.5-minute quadrangle maps and the digitized contour lines. The accuracy of the elevation model for which overburden and closed topographic depressions is therefore as good as the maps on which it was based. Data quality and consistency issues related to the elevation model come from the method by which they were digitized. The original DEM was completed in 2004. Errors were identified shortly after and a newer version of the elevation model was compiled in 2009. As this project progressed and methodologies for testing significant layers were developed additional inconsistences were detected and addressed with the aid of recently acquired LiDAR data. This data, however, is not available statewide.
Many of the borehole well samples the FGS uses were collected and described before the prolific use of geographic positioning systems. For the most part, samples were referenced to the public land survey system, and many have accuracy statements that indicate they are confidently located to a “center of section” designation which is equivalent to one square mile. Although Florida is state with relatively low topographic relief, elevations in some areas, along ridges and in upland areas, can vary by as much as 50 feet within a square mile. Further, aquifer and formation picks, especially if based on well cuttings samples alone, can have an error of up to ±20 feet depending on the interval of the well cuttings descriptions. Finally, the surfaces created based on well data are much less reliable in areas lacking in well data, such as the Everglades where few wells have been drilled. Development of the overburden layer was based on borehole data from on 2,290 wells. The extent of the model as defined in this report, covers an area of is almost 57,000 square miles or 147,000 square kilometers. As a result, each well is taken to represent on average an area of 25 square miles or 64 square kilometers. However, this assumes there is an even distribution of well descriptions from which to base this layer on. Figure 1 shows the distribution of picked wells across the state and it should be noted; however, that this value is an average statewide well density; some areas are much better represented with wells, while others are very poorly represented and have a much smaller well density (e.g., the Everglades area).
Additionally, elevation values for determining vertical heights of surfaces such as the top of rock layers, or potentiometric surfaces have a ±5 feet or ±10 feet contour interval and therefore vertical accuracy is at least that. With that said, when a statement exists in this report that 103 feet of overburden is the threshold for being associated with sinkhole formation, it by no means indicates that we can predict the surface to be accurate to the foot. Factors that could contribute to miscalculations in the data are related to sample interval, topography, and location inaccuracies.
The layer depicting the significant closed topographic depressions is also dependent on the digital terrain models. The method of identifying depressions related to karst may have overestimated the number of features that meet the definition of karst. For example, parts of dune fields appeared on topographic maps as depressions. In addition, storm-water ponds and berms around agricultural fields appeared as topographic depressions. Some of these types of features were included in the closed topographic depressions coverage; as a result, non-karst depressions were included in the development of a karst coverage. Although efforts were utilized to filter out these “false positive” features, not all were captured and true karst features were likely eliminated through spatial filtering prior to input into the model.

72 | P a g e
Distribution of boreholes utilized in the development of the overburden layer for the model. There were 4,269 borehole descriptions reviewed in the process of creating this layer, and 2,290 boreholes were used to create it.

73 | P a g e
APPENDIX VI
Glossary Aerial photography - Photographs taken from the air, such as a photograph of a part of the Earth’s surface
taken by a camera mounted in an aircraft. Usually taken in strips of overlapping prints for mapping purposes (Nuendorf et al, 2005).
Anthropogenic – of, relating to, or resulting from the influence of human beings on nature. Carbonate rock - A rock consisting chiefly of carbonate minerals or rocks, such as calcite and dolomite or
limestone and dolostone; specifically, a sedimentary rock composed of more than fifty percent by weight of carbonate minerals or rocks (Nuendorf et al, 2005).
Cave - A natural underground open space; it generally has a connection to the surface, is large enough for
a person to enter, and extents into darkness. The most common type of cave is formed in limestone by dissolution (Nuendorf et al, 2005).
Closed topographic depression (CTD) – Where topographic lines form a closed loop and elevations
decrease toward the center. These are areas of very limited or no surface water drainage. Karst landscapes often produce a variety of these topographic lows.
Clay – 1) sediment with particles smaller than silt, typically less than 0.00016 inch (0.004 mm). 2) A stiff,
sticky fine-grained earth, typically yellow, red, or bluish-gray in color and often forming an impermeable layer in the soil. It can be molded when wet, and is dried and baked to make bricks, pottery, and ceramics (Nuendorf et al, 2005).
Collapse sinkhole - A fast forming sinkhole that is created when the roof above an underground cavity
within the underlying carbonate rock fails to support its own weight and collapses into that cavity (Poucher and Copeland, 2006).
Conditional Independence – Occurs when an evidential theme does not affect the probability of another
evidential theme. It is a reflection of overlapping evidence (Bonham-Carter, 1994). Confidence of Evidential Theme – Equals contrast divided by its estimated standard deviation; provides a
useful measure of significance of the contrast (Bonham-Carter, 1994). Contrast – W+ minus W- (see weights), which is an overall measure of the spatial association (correlation)
of an evidential theme with the training sites (Bonham-Carter, 1994). DEM – Digital Elevation Model or Division of Emergency Management. DEP – Department of Environmental Protection Dissolution - A chemical reaction in which a solid material is dispersed as ions in a liquid. In karst, refers
to the process of dissolving rock to produce landforms, in contrast to solution, the chemical product of dissolution (Nuendorf et al, 2005).
Dolomite – An anhydrous carbonate mineral composed of calcium magnesium carbonate, ideally
CaMg(CO3)2 (Nuendorf et al, 2005).
74 | P a g e
Dolostone – A rock consisting of dolomite. A term proposed by Shrock (1948a, p.126) for the sedimentary
rock dolomite, used to avoid confusion with the mineral of the same name (Nuendorf et al, 2005). Data Driven – Refers to a modeling process in which decisions made about modeling input are driven by
empirical data (Bonham-Carter, 1994). Examples include the weights of evidence approach or logistic regression approach as in the DEP’s Florida Aquifer Vulnerability Assessment project (Arthur et al, 2005).
Evidential Theme – A set of continuous spatial data that is associated with the location and distribution of
known occurrences (i.e., training sites); a map data layer used as a predictor of vulnerability (Bonham-Carter, 1994).
Expert Driven – A scientific approach which relies on the expertise and knowledge of one or more
specialists to drive decisions in a modeling project (Bonham-Carter, 1994). Epiphreatic – Zone of fluctuation of water table (Ford and Williams, 2007). EPA – Environmental Protection Agency FEMA – Federal Emergency Management Administration FGS – Florida Geological Survey Geomorphology - The science that treats the general configuration of the Earth’s surface, specifically the
study of the classification, description, nature, origin, processes, and development of present landforms and their relationships to underlying structures and of the history of geologic changes s recorded by these surface features (Nuendorf et al, 2005).
Karst – Landscape underlain by limestone that has been eroded by dissolution, producing ridges, towers,
fissures, sinkholes, swallets, and other characteristic landforms (Poucher and Copeland, 2006). LiDAR – “Light detection and ranging”. A remote sensing method that uses light in the form of a pulsed
laser to measure ranges (variable distances) to the Earth. LiDAR data provides high resolution topography maps used in field reconnaissance (Nuendorf et al, 2005).
Limestone - A sedimentary rock consisting chiefly (more than fifty percent by weight or by areal
percentages under the microscope) of calcium carbonate, primarily in the form of the mineral calcite, and with or without magnesium carbonate; specifically, a carbonate sedimentary rock containing more than ninety five percent calcite and less than five percent dolomite (Nuendorf et al, 2005).
Lineament - is a mappable, simple or composite linear feature of a surface, whose parts are aligned and
which differs distinctly from the patterns of adjacent features and presumably reflects regional subsurface fractures (Nuendorf et al, 2005)
Overburden - The upper part of a sedimentary deposit, compressing and consolidating the material below.
The loose soil, silt, sand, gravel, or other unconsolidated material overlaying bedrock, either transported or formed in place (Nuendorf et al, 2005).

75 | P a g e
NHD – National Hydrography Dataset, a collection of geographic information systems spatial data layers containing hydrologic features hosted by the United States Geological Survey.
Pedality – The physical nature of soil a expressed by the features of its peds (grains) (Nuendorf et al, 2005). Permeability – a property of rocks that is an indication of the ability of fluids (gas or liquid) to flow through
rocks. High permeability will allow fluids to move rapidly through rocks (Nuendorf et al, 2005). Phreatic - relating to or denoting underground water in the zone of saturation (beneath the water table)
(Nuendorf et al, 2005) Porosity – A measure of how much of a rock is open space. This space can be between grains or within
cracks or cavities of the rock (Nuendorf et al, 2005). Posterior Probability – The probability that a unit cell contains a training point after consideration of the
evidential themes. This measurement changes from location to location depending on the values of the evidence (Bonham-Carter, 1994).
Prior Probability – The probability that a unit cell contains a training point before considering the evidential
themes. It is a constant value over the study area equal to the training point density (total number of training sites divided by total study area in unit cells) (Bonham-Carter, 1994).
Raveling - The process by which water transports soil particles down into cavities in underlying strata
(Poucher and Copeland, 2006). Response Theme – An output map that displays the probability that a unit area would contain a training
point, estimated by the combined weights of the evidential themes. The output is displayed in classes of relative vulnerability, favorability, or probability (Bonham-Carter, 1994).
Sand - Rock or mineral grains with diameters between .074 mm and 4.76 mm (Nuendorf et al, 2005). Sinkhole – A surface depression formed by dissolution of bedrock or by collapse of an underlying cave
(and often a combination of both). Soluble – Able to be dissolved, especially in water (Nuendorf et al, 2005). Spatial Data – Information about the location and shape of, and relationships among, geographic features,
usually stored as coordinates and topology (Bonham-Carter, 1994). Spring - A place where groundwater flows naturally from a rock or the soil onto the land surface or into a
body of surface water. Its occurrence depends on the nature and relationship of rocks, especially permeable and impermeable strata, on the position of the water table, and on the topography (Nuendorf et al, 2005).
Subsidence incident report - A report of subsidence, which is believed to be a sinkhole by the reporting
entity. Very few of the reports are verified by a Florida licensed professional geologist or engineer as true sinkholes. Other subterranean events can cause holes, depressions or subsidence of the land surface that may mimic sinkholes or sinkhole activity. These include 1) subsurface expansive clay or organic layers which compress as water is removed, 2) collapsed or broken sewer and drain pipes or broken septic tanks, 3) improperly compacted soil after excavation work, and 4) buried trash, logs, and other debris.

76 | P a g e
Subsidence incident report database – A database of reported subsidence incidents. Subsidence sinkhole - A slow forming sinkhole which is created when sediment is slowly washed (raveled)
down into existing small fissures, fractures, cavities, and conduits in the carbonate rock below. Subterranean - Formed or occurring beneath the Earth’s surface, or situated within the Earth (Nuendorf et
al, 2005). Subterranean drainage – In a karst landscape groundwater flow may be enhanced by underground karst
conduits and/or increased porosity due to dissolution of the limestone (Nuendorf et al, 2005). Swallet - The opening through which a sinking stream loses its water to the subsurface; or a place where
such a stream may sink into alluvium in a streambed without the presence of a depression (Nuendorf et al, 2005).
Training Sites – A set of locations (points) reflecting a parameter used to calculate weights for each
evidential theme, one weight per class, using the overlap relationships between points and the various classes. In this study, a training point is a sinkhole (Bonham-Carter, 1994).
Transmissivity – The rate at which groundwater passes through a unit width of an aquifer under a hydraulic
gradient. (Lexicon of Cave and Karst Terminology, 2002) Weights – A measure of an evidential-theme class. A weight is calculated for each theme class. For binary
themes, these are often labeled as W+ and W-. For multiclass themes, each class can also be described by a W+ and W- pair, assuming presence/absence of this class versus all other classes. Positive weights indicate that more points occur on the class than due to chance, and the inverse for negative weights. The weight for missing data is zero. Weights are approximately equal to the proportion of training sites on a theme class divided by the proportion of the study area occupied by theme class, approaching this value for an infinitely small unit cell (Bonham-Carter, 1994).
References
Arthur, J.D., Baker, A.E., Cichon, J.R., Wood, A.R., and Rudin, A., 2005, Florida Aquifer Vulnerability Assessment (FAVA): Contamination potential of Florida’s principal aquifer systems: Florida Geological Survey Bulletin 67, 148 p.
Bonham-Carter, G. F., 1994, Geographic Information Systems for Geoscientists, Modeling with GIS:
Oxford, Pergamon, 398 p. Ford, D.C., and Williams, P., 2007, Karst Hydrogeology and geomorphology: Wiley, Chichester, 562 p. Lexicon of Cave and Karst Terminology, 2002: U.S. Environmental Protection Agency Nuendorf, K.K., Mehl Jr., J.P., and Jackson, J.A., 2005, Glossary of Geology, 5th edition: Alexandria,
Virginia, American Geological Institute, 799 p. Poucher, S., and Copeland, R., 2006, Speleological and Karst Glossary of Florida and the Caribbean:
University Press of Florida, 192 p. Shrock, R.R., 1948, A classification of sedimentary rocks: Journal of Geology, v. 56, p. 118-129.