appendix h - traffic and transport report
TRANSCRIPT

Prepared for:
P&C Consulting 28 June 2019
The Transport Planning Partnership E: [email protected]
245 Marion Street, Leichhardt Traffic and Parking Impact Assessment

245 Marion Street, Leichhardt Traffic and Parking Impact Assessment
Client: P&C Consulting
Version: V03
Date: 28 June 2019
TTPP Reference: 18256
Quality Record
Version Date Prepared by Reviewed by Approved by Signature
V01 16/6/19 T. Jones J. Rudd J. Rudd
V02 26/6/19 T. Jones J. Rudd J. Rudd
V03 28/6/19 T. Jones J. Rudd J. Rudd

18256_r01v03_190628 i
Table of Contents 1 Introduction ...................................................................................................................................... 1
2 Existing Condition Assessment ....................................................................................................... 2
2.1 Site Description ...................................................................................................................... 2
2.2 Abutting Road Network ....................................................................................................... 5
2.2.1 Marion Street ................................................................................................................. 5
2.2.2 Walter Street .................................................................................................................. 5
2.2.3 Foster Street.................................................................................................................... 6
2.2.4 Hawthorne Parade ....................................................................................................... 6
2.3 Existing Vehicle Access ........................................................................................................ 6
2.4 Pedestrian Infrastructure ...................................................................................................... 6
2.5 Cycle Infrastructure .............................................................................................................. 7
2.6 Public Transport Facilities ..................................................................................................... 8
2.6.1 Bus Services .................................................................................................................... 9
2.6.2 Light Rail Services .......................................................................................................... 9
2.6.3 Rail Services .................................................................................................................. 11
2.7 Car Sharing Pods ................................................................................................................. 12
2.8 Travel Behaviour Data ....................................................................................................... 13
2.8.1 Method of Travel to Work Data ............................................................................... 13
2.9 Traffic Volumes .................................................................................................................... 14
3 Public Transport Capacity ........................................................................................................... 17
4 Overview of Planning Proposal ................................................................................................... 21
5 Assessment of Planning Proposal ............................................................................................... 22
5.1 Car Parking Provisions ........................................................................................................ 22
5.1.1 Leichhardt DCP 2013 ................................................................................................. 22
5.1.2 Roads and Maritime Guidelines .............................................................................. 23
5.1.3 Summary of Car Parking Assessment ...................................................................... 24
5.2 Public Transport and Sustainable Travel Modes ........................................................... 24
5.3 Traffic Generation Assessment ......................................................................................... 26
5.3.1 Estimated Additional Traffic Generation Potential .............................................. 26
5.3.2 Intersection Operation Analysis ............................................................................... 27
5.4 Site Access Arrangements ................................................................................................ 29
6 Conclusions ..................................................................................................................................... 30

18256_r01v03_190628 ii
Tables Table 2.1: Existing Bus Services.......................................................................................................... 10
Table 2.2: Summary of Existing Train Services and Frequencies ................................................ 11
Table 3.1: Summary of Bus Frequencies near the Site ................................................................. 18
Table 5.1: Leichhardt DCP 2013 Car Parking Requirements ..................................................... 22
Table 5.2: Estimate Net Additional Site Traffic Generation ......................................................... 26
Table 5.3: Level of Service Criteria for Intersection Operation .................................................. 28
Table 5.4: Intersection Operation with Additional Traffic Generated by Site Development 28
Figures Figure 2.1: Site Locality .......................................................................................................................... 2
Figure 2.2: Existing Marion Street Site Frontage with Access Driveway ....................................... 3
Figure 2.3: Existing Walter Street Site Frontage with Access Driveway ........................................ 4
Figure 2.4: Abutting Road Network .................................................................................................... 5
Figure 2.5: Pedestrian Catchment Surrounding Site (15-minute walking distance) ................. 7
Figure 2.6: Bicycle Network Map ........................................................................................................ 8
Figure 2.7: Public Transport Access Nodes in the Catchment Area ............................................ 9
Figure 2.8: Regional Bus Network ...................................................................................................... 10
Figure 2.9: L1 Dulwich Hill Light Rail Route ....................................................................................... 11
Figure 2.10: GoGet Car Sharing Vehicles .......................................................................................... 12
Figure 2.11: Selected SA1 Areas Surrounding the Subject Area ................................................... 13
Figure 2.12: Travel to Work Mode Share for Residents near the Subject Site ............................. 14
Figure 2.13: Key Nominated Intersections ......................................................................................... 15
Figure 2.14: Existing (2018) Traffic Flows ............................................................................................. 16
Figure 3.1: Marion Light Rail Monthly Patronage (July 2016 to February 2018) ....................... 17
Figure 3.2: Existing Peak Bus Capacities (Bus Stop 204080) – To City ......................................... 19
Figure 3.3: Existing Peak Bus Capacities (Bus Stop 204082) – From City .................................... 19

18256_r01v03_190628 iii
APPENDICES
A. PLANNING PROPOSAL ARCHITECTURAL PLANS
B. GREEN TRAVEL PLAN
C. TRAFFIC SURVEY RESULTS
D. INTERSECTION OPERATION MODELLING RESULTS

18256_r01v03_190628 1
1 Introduction
The Transport Planning Partnership (TTPP) Pty Ltd has prepared this traffic and parking impact assessment report on behalf of P&C Consulting Pty Ltd to accompany a Planning Proposal to be lodged with Inner West Council.
The Planning Proposal seeks approval to allow additional permitted uses on the site at 245 Marion Street Leichardt to allow mixed-use development to occur on the site. The proposal would allow both employment and residential uses to occur on the site.
The site is currently occupied by light industrial automotive repair uses. The existing site use would be compatible with the proposed complimentary employment and residential uses.
The indicative architectural scheme (see Appendix A) prepared for the purpose of the planning proposal comprises the following uses:
Automotive services (light industrial)
Urban services (light industrial)
Office premises
Ancillary retail (restaurants / café)
Residential
The indicative architectural scheme has been utilised in the traffic and parking assessment presented herein. The report assesses the traffic implications associated with the proposed development.
The remainder of the report is set out as follows:
Chapter 2 discusses the existing conditions including a description of the subject site
Chapter 3 provides a brief description of the proposed development
Chapter 4 assesses the traffic and transport implications of the planning proposal
Chapter 5 provides the assessments conclusions and recommendations.

18256_r01v03_190628 2
2 Existing Condition Assessment
2.1 Site Description
The subject site is located at 245 Marion Street. The site has two road frontages, one to Marion Street and a rear site frontage to Walter Street.
The site falls within the local government area of Inner West Council.
A locality map of the subject site is shown in Figure 2.1.
Figure 2.1: Site Locality
Source: Google Maps
The site is currently in use as an automotive repair and service centre.
Vehicle access to / from the site is provided by:
Marion Street - 25 metre wide driveway with entry and exit lanes to the building and 90 degree parking spaces as shown in Figure 2.2; and
Walter Street - combined entry / exit driveway as shown in Figure 2.3.
Subject Site

18256_r01v03_190628 3
Figure 2.2: Existing Marion Street Site Frontage with Access Driveway
Marion Street
Existing Site Access

18256_r01v03_190628 4
Figure 2.3: Existing Walter Street Site Frontage with Access Driveway
Land uses surrounding the site are predominantly low density residential housing. In addition there is:
an aged care facility immediately east of the site;
a light railway station immediately to the west; and
a recreational sports facility opposite the site’s frontage.
Other nearby facilities include:
Kegworth Primary School; and
Leichhardt Market Place shopping centre;
`
Walter Street
Existing Site Access

18256_r01v03_190628 5
2.2 Abutting Road Network
The subject site fronts Marion Street which if a designated Regional Road. Other streets within the vicinity of the site include Foster Street to the east and Hawthorne Parade to the west.
Figure 2.4 displays the road classifications for streets near the site, and a brief description of these roads is provided below.
Figure 2.4: Abutting Road Network
Source: Roads and Maritime Services Roads Classification Review – Sydney Overview
2.2.1 Marion Street
Marion Street is a two-way, two-lane regional road aligned in an east-west direction between Leichhardt and Haberfield and is the principal point of access to the subject site. Marion Street is generally 12.5 metres in width and accommodates on-street parking on both sides of the road (outside of peak periods). The road has a posted speed limit of 50 km/hr and intersects Foster Street to the east via a four-way traffic signal-controlled intersection.
2.2.2 Walter Street
Walter Street is a two-way local road, which provides the secondary point of access to the subject site. The street is aligned in an east-west direction and is generally 10 metres in width. Walter Street has a 50 km/hr posted speed limit and unrestricted kerbside parking is generally accommodated on both sides of the carriageway.
Subject Site
LegendExisting State Roads
Existing Regional Roads

18256_r01v03_190628 6
2.2.3 Foster Street
Foster Street functions as a two-way, two-lane state road aligned in a north-south direction between Darley Street and Tebbutt Street. The street offers good accessibility to the wider arterial road network, including the City West Link via Darley Road to the north and Paramatta Road via Tebbutt Street to the south.
Foster Street is generally 12.5 metres in width and generally accommodates kerbside parallel parking on both sides of the road. The road has a posted speed limit of 50 km/hr, with 40 km/hr school zone restrictions applicable during school hours within the immediate vicinity of Kegworth Public School.
2.2.4 Hawthorne Parade
Hawthorne Parade is a two-way, two-lane local road aligned a north-south direction, intersecting Marion Street via a priority junction. North of the Marion Street intersection, Hawthorne Parade has a posted speed limit of 15 km/hr, assisted by a speed bump 10 metres north of the junction. To the south, Hawthorne Parade is a 50 km/hr area with a 3 tonne gross load limit restriction.
2.3 Existing Vehicle Access
As indicated previously, vehicle access to the existing site is provided by two separate driveways to two separate car parking areas. The principle site access is taken to the south of the site via Marion Street and is approximately 25 metres wide, leading to the principal on-site car park.
A second site access is located to the north of the site via Walter Street, providing access to the second on-site car park and is approximately 4 metres wide.
2.4 Pedestrian Infrastructure
Pedestrian access to / from the site is provided via the footpath on the north side of Marion Street that leads through the principal vehicle access. Pedestrian access is also possible via the secondary vehicle access on Walter Street.
There are several well-established pedestrian facilities within the vicinity of the site that provide good access to the surrounding residential areas and public transport. All the surrounding streets are provided with paved pedestrian footpaths on both sides of the road, and a signalised pedestrian crossing is located at the Marion Street / Foster Street

18256_r01v03_190628 7
intersection. Approximately 160 metres west of the site, there is also a pedestrian crossing area featuring a refuge island enabling pedestrians to cross Marion Street safely.
The pedestrian catchment within a 15-minute walking distance from the site is shown in Figure 2.5. It is noted that several bus, light rail and railway stations are located within or on the periphery of a 15-minute walking distance catchment. These will be discussed in greater depth later in the report.
Figure 2.5: Pedestrian Catchment Surrounding Site (15-minute walking distance)
Source: www.app.targomo.com/demo
2.5 Cycle Infrastructure
The site benefits from several established on and off-road bicycle routes. On-street markings are provided on Marion Street to indicate that the street is a shared facility for motor vehicles and cyclists.

18256_r01v03_190628 8
There are similar indicators provided on Hawthorne Parade to the south of the Marion Street junction, as well of the provision of signages that indicate the distance to various destinations. There is also an off-road dedicated cycle path aligned in a north-south direction that runs parallel to Hawthorne Parade between Sydney Harbour and Lewisham.
The bicycle network map for the vicinity of the site is provided in Figure 2.6.
Figure 2.6: Bicycle Network Map
Source: Inner West Council, Ashfield Cycling Map
2.6 Public Transport Facilities
The site benefits from very good accessibility by public transport. The location of bus stops falling within a 400 metre catchment area radius of the subject site are indicated in Figure 2.7, as well as the location of rail and light rail stations in the area.
Subject Site
Legend
On-Road(low/med traffic)
On-Road(high traffic)
Off-Road
Non Designated Route
Walking Path

18256_r01v03_190628 9
Figure 2.7: Public Transport Access Nodes in the Catchment Area
Source: Google Maps
2.6.1 Bus Services
A summary of the existing bus services provided close to or within a 400 metre walking distance catchment radius of the site is provided in Table 2.1.
A map displaying the regional bus network is shown in Figure 2.8.
2.6.2 Light Rail Services
The site is adjacent to Marion Light Railway Station, which is located on the L1 Dulwich Hill line. The L1 route provides connection between Dulwich Hill and Central via several Inner West stations including Lilyfield, Rozelle Bay and Leichardt North. These services typically operate every 10-15 minutes throughout the day.
A map of the L1 Dulwich Hill light rail route is shown in Figure 2.9.

18256_r01v03_190628 10
Table 2.1: Existing Bus Services
Service No. Route Description Bus Stop Location ID Approximate Site
Proximity
Approximate Frequency
Peak Off-peak
436 Central Station Belmore Park – Rodd Point and Chiswick
204549 / 204550 130 metres
Every 16-20
minutes
Every 30 minutes
438 City Martin Place Every 7-15 minutes
Every 15 minutes
439 City Martin Place – Mortlake N/A Every 30 minutes
L38 City Martin Place – Abbotsford 4 every hour N/A
L39 City Martin Place – Mortlake 4 every hour N/A
445 Balmain to Campsie 204041 / 204033 410 metres
4 every hour
4 every hour
447 Lilyfield to Leichhardt Marketplace (Loop Service) Every hour Every
hour
370 Coogee to Leichhardt Marketplace 204037 440 metres Every 10
minutes Every 15 minutes
Figure 2.8: Regional Bus Network
Source: Sydney Buses
Subject Site

18256_r01v03_190628 11
Figure 2.9: L1 Dulwich Hill Light Rail Route
Source: Transport for NSW
2.6.3 Rail Services
Summer Hill Railway Station is approximately 910 metres south-west of the site. Summer Hill is served by the T2 Inner West & Leppington line as well as the T3 Bankstown line, which provide services between Sydney City and the Inner West suburbs of Parramatta, Leppington and Liverpool.
A summary of the existing train services and their associated peak hour frequencies are provided in Table 2.2.
Table 2.2: Summary of Existing Train Services and Frequencies
Rail Line Route AM Peak 7am-9am (no. of services)
PM Peak 4pm-6pm (no. of services)
T2 Inner West & Leppington
City Circle via Town Centre 18 8
Paramatta 7 8
Ashfield Only 1 -
Leppington via Granville - 9
T3 Bankstown Liverpool via Regents Park 1 -

18256_r01v03_190628 12
2.7 Car Sharing Pods
Car sharing is a flexible, cost-effective alternative to car ownership and is a convenient and reliable way for residents to use a car when they need one.
GoGet and Flexicar are car share companies operating in Australia, with a number of vehicles positioned within the area. Car share is a concept by which members join a car ownership club, choose a rate plan and pay an annual fee. The fees cover fuel, insurance, maintenance and cleaning.
The vehicles are mostly sedans, but also include SUVs, station wagons and vans. Each vehicle has a home location, referred to as a “pod”, either in a parking lot or on a street, typically in a densely-populated urban neighbourhood. Members reserve a car by web, telephone and use a key card to access the vehicle.
The locations of GoGet car sharing pods in the vicinity of the site are shown in Figure 2.10.
Figure 2.10: GoGet Car Sharing Vehicles
Source: www.goget.com.au
Subject Site

18256_r01v03_190628 13
2.8 Travel Behaviour Data
2.8.1 Method of Travel to Work Data
Method of Travel to Work (MTW) using 2016 census data from the Australian Bureau of Statistics has been obtained in order to understand the existing travel behaviour of residents living in the area surrounding the subject site. Eight level one statistical areas have been selected surrounding the site, as shown in Figure 2.11.
Figure 2.11: Selected SA1 Areas Surrounding the Subject Area
Source: QGIS
An analysis of the data indicates that the predominant mode of travel among residents living in the selected level one statistical areas is car (44 per cent) followed by both bus (12 per cent) and train (12 per cent), although a further 14 per cent either worked at home or did not go to work.
A full breakdown is provided in Figure 2.12.
Given the introduction of the new Marion Light Rail stop in 2014 and current journey to work trip patterns in the area, the site is considered to be well serviced by public transport facilities
Subject Site

18256_r01v03_190628 14
and shows the potential to generate a modal shift away from car modes to more sustainable transport.
As such, it is proposed to provide a green travel plan as part of the proposed development, with green travel plan initiatives intended to be provided prior to the occupation of the site. As part of the planning proposal submission a Green Travel Plan has been prepared for the site. This Green Travel Plan is provided in Appendix B.
Figure 2.12: Travel to Work Mode Share for Residents near the Subject Site
2.9 Traffic Volumes
Traffic surveys have been conducted at the following key nominated intersections:
Foster Street-Walter Street (priority intersection)
Foster Street-Marion Street (signalised intersection)
The nominated key intersections are outlined in red in Figure 2.13. A summary of the surveyed flows is presented in Figure 2.14. The detailed survey results are provided in Appendix C.
Tra in, 12%
Bus , 12%
Ferry/Tram, 7%
Car, 44%
Other, 3%
Bicycle, 3%
Walked Only, 4%
Worked at Home/Did not go to Work, 14%

18256_r01v03_190628 15
Figure 2.13: Key Nominated Intersections
Source: Google Maps
The surveyed traffic flows include traffic generated by the existing automotive repair and service facility on the site. TTPP’s observations of the existing site conditions have indicated that the existing facilities can accommodate between 50 – 80 vehicle services per day with additional vehicle movements parts deliveries etc.
Customer arrival and departure of vehicles to the existing automotive service facility are undertaken via the Marion Street driveways. This represents the bulk of the vehicle movements to and from the site.
Service and staff related vehicle movements are typically undertaken via the rear driveway at Walter Street.

18256_r01v03_190628 16
Figure 2.14: Existing (2018) Traffic Flows

18256_r01v03_190628 17
3 Public Transport Capacity
This section contains a review of historical data of existing occupancy figures on public transport facilities, including light rail, bus and ferry services, and household travel survey information obtained from Transport for NSW’s Open Data website.
3.1 Light Rail Patronage
The Marion Light Rail station was opened in 2014 and provides good public transport connectivity between Dulwich Hill and Central. The Marion Light Rail station currently services some 10,000 patrons per month and is set to increase in the future based on future development in the area and the future connection to the CBD and South East Light Rail link.
A summary of the existing monthly patronage at the Marion Light Rail station is shown in Figure 3.1.
It is noted that Transport for NSW regularly reviews patronage, demand and anticipated growth for light rail services. Since opening it is understood that some 220 additional services have been added to the peak, inter peak and weekend periods thus reflecting the provision of services to adequately meet travel demands for light rail from the proposed development at 245 Marion Street and other development proposals.
Figure 3.1: Marion Light Rail Monthly Patronage (July 2016 to February 2018)
Note. A significant portion of the Light Rail line was closed during the month of January to allow for construction work as part of the CBD and South East Light Rail project, resulting in lower number of trips in January.
9,319
9,643 9,390
10,82110,057
10,941
4,713
9,372
2,500
3,500
4,500
5,500
6,500
7,500
8,500
9,500
10,500
11,500
12,500
Opa
l Trip
s (T
ap-O
n)
Month
Marion Light Rail Station Monthly Patronage

18256_r01v03_190628 18
3.2 Bus Patronage
Bus patronage surveys on Thursday, 24 November 2017 have been obtained to understand existing bus services, frequencies and capacity within the immediate vicinity of the site along the Marion Street corridor.
The bus patronage surveys have been derived from the following three main sources:
PTIPS – Public Transport Information and Prioritisation System
Opal
Bus Fleet Capacity
A summary of the existing bus frequencies at the nearest bus stops located on Marion Street, near Lambert Park is summarised in Table 3.1.
Table 3.1: Summary of Bus Frequencies near the Site
Cordon AM Period PM Period
7am-8am 8am-9am 4pm-5pm 5pm-6pm
To City 7 12 8 7
From City 6 8 9 10
The above data excludes any other bus stops located on Parramatta Road, which service bus routes 461, 480 and 484 to the City The Domain and Central station suburbs.
Existing bus services along the Marion Road corridor can currently accommodate a total capacity of some 62-112 bus patrons (people) per bus. Based on the bus patronage surveys, existing bus loads within the immediate vicinity of the site currently operate below their capacity, generally with many seats available during peak times.
The bus patronage surveys provide the following bus capacity classifications:
MANY_SEATS_AVAILABLE
If occupancy on the bus is less than 50% of the seating capacity (e.g. less than or equal 22 bus patrons)
FEW_SEATS_AVAILABLE
If occupancy on the bus is more than 50% of the seating capacity (e.g. more than 22 bus patrons)
STANDING_ROOM_ONLY
If occupancy on the bus is more than the seating capacity of the bus (e.g. more than 45 bus patrons)

18256_r01v03_190628 19
With the above in mind, the existing bus loadings/capacities at the selected bus stops on Marion Street, near Lambert Park during the AM and PM peak periods are summarised in Figure 3.2 and Figure 3.3.
The following graphs show how many buses currently operate during the peak periods and their associated bus capacity classification.
Figure 3.2: Existing Peak Bus Capacities (Bus Stop 204080) – To City
Figure 3.3: Existing Peak Bus Capacities (Bus Stop 204082) – From City
7
11
67
01
200 0 0 0
02468
1012
07:00 to 08:00 08:00 to 09:00 16:00 to 17:00 17:00 to 18:00
AM Period PM Period
No.
of b
uses
Time
Existing Bus Capacity(Cordon To City)
MANY_SEATS_AVAILABLE FEW_SEATS_AVAILABLE STANDING_ROOM_ONLY
67
8 8
01 1
2
0 00123456789
07:00 to 08:00 08:00 to 09:00 16:00 to 17:00 17:00 to 18:00
AM Period PM Period
No.
of b
uses
Time
Exisitng Bus Capacity(Cordon From City)
MANY_SEATS_AVAILABLE FEW_SEATS_AVAILABLE STANDING_ROOM_ONLY

18256_r01v03_190628 20
As such, the existing bus facilities within the immediate vicinity of the site currently operate well below its capacity, with spare capacity for any additional bus trips generated by the proposed development site (e.g. residents, visitors, staff etc.).

18256_r01v03_190628 21
4 Overview of Planning Proposal
The proposed development involves the construction of a mixed-use development at 245 Marion Street, Leichhardt.
As noted previously, this planning proposal seeks approval to allow additional site-specific uses on the site.
An indicative masterplan (see Appendix A) has been prepared by Figgis & Jefferson Tepa Architects for traffic analysis purposes, with the following indicative mix:
97 residential units
o 2 x studio units
o 22 x 1-bedroom units
o 56 x 2-bedroom units
o 17 x 3-bedroom+ units
3,200m2 (minimum) of urban services and light industry
2,000m2 (maximum) commercial (business and office premises, health service facilities or child care)
250m2 ancillary retail.
Basement car parking facilities (indicatively 146 spaces over 3 levels of basement)
The master plan proposal seeks to retain the primary vehicle access via Marion Street with a single two way vehicle driveway. A single vehicle driveway (exit only) is proposed to be retained at Walter Street.
In addition to this, as part of the proposed development, there will be opportunities to create a through site pedestrian / cycle link between Marion Street and Walter Street. Such a link will improve access to the Marion Street light rail station for existing residential properties to the north of the site.

18256_r01v03_190628 22
5 Assessment of Planning Proposal
5.1 Car Parking Provisions
The car parking requirements for the proposed development has been assessed with reference to the following three documents:
Leichhardt Development Control Plan (DCP) 2013; and
Roads and Maritime Services guidelines
The car parking assessment for the proposed development is detailed below.
5.1.1 Leichhardt DCP 2013
The car parking requirement for various development land uses within the old Leichardt Council area of the new Inner West Local Government Area are is set out in the Leichhardt DCP 2013.
The car parking requirements are set out within Part C1.11 – Parking in the DCP. A summary of the indicative car parking requirements arising from the proposal is summarised in Table 5.1.
Table 5.1: Leichhardt DCP 2013 Car Parking Requirements (Indicative)
Land use Size DCP Parking Rates (Min – Max)
DCP Parking Requirement (Min – Max)
Residential
Studio 2 0 to 0.5 spaces per dwelling 0 - 1 spaces
1-bed 22 0.333 to 0.5 spaces per dwelling 7 - 11 spaces
2-bed 56 0.5 to 1 space per dwelling 28 - 56 spaces
3-bed+ 17 1 to 1.2 spaces per dwelling 17 - 20 spaces
Visitors 0.09 to 0.125 spaces per dwelling 9 - 12 spaces
Sub-Total 97 - 61 - 100 spaces
Light Industrial 3,160m2 1/250m2 – 1/150m2 13 - 21
Office 1,800m2 1/100m2 - 1/80m2 18 – 23
Retail 250m2 1/50m2 – 1/50m2 5
Total 97 - 149 spaces

18256_r01v03_190628 23
Based on the proposed development yields set out in the planning proposal, Table 5.1 indicates that the proposed development would be required to provide between 97-149 on site car spaces to service the proposed uses.
5.1.2 Roads and Maritime Guidelines
For the purpose of estimating the parking requirements arising from the proposed development under RMS guidelines, the following parking rates have been adopted using the Roads and Maritime Traffic Generation guidelines:
residential (sub-metropolitan)
0.6 spaces per 1-bedroom unit
0.9 spaces per 2-bedroom unit
1.4 spaces per 3-bedroom unit
1 space per 5-units (visitor parking)
commercial/community use:
2.41 spaces per 100m2
Using the above metrics, the proposed development would require some 226 car parking spaces, with the following car parking breakdown:
107 residential spaces; and
119 non-residential spaces.
Notably, this car parking requirement of the RMS is higher than that assessed using the DCP rates.
TTPP notes that the future vision for the area will lead to higher levels of local employment, as well as better access to public transport infrastructure and facilities. As such, there may be an opportunity to reduce the car parking rates as set out using the Roads and Maritime rates.
In this regard, it is the intention to satisfy Council’s DCP car parking rates for the proposal, which represents a less onerous car parking provision compared to the Roads and Maritime rates. Council’s DCP car parking rates are also considered more appropriate to cater for anticipated market and demand of the proposed development uses (i.e. residential and commercial/employment uses).
1 This car parking rate is the average maximum parking demand derived from the Roads and Maritime’s Trip Generation and Parking Generation Surveys (Office Blocks) Analysis report 2010.

18256_r01v03_190628 24
5.1.3 Summary of Car Parking Assessment
Based on the above car parking assessment and parking codes (DCP) a car parking provision of 97 – 149 car spaces would be appropriate to serve the proposed development.
At this stage, it is envisaged that some 146 car parking spaces can be accommodated within the basement car parking levels. This car parking provision is considered satisfactory to serve the proposed development based on the above car parking assessment.
Further to this, car share spaces, accessible parking, motorcycle and bicycle parking spaces would also need to be considered and provided in accordance with Council’s DCP requirements as part of a future development application (DA) for the site.
The car park and associated elements are proposed to be designed in accordance with the design requirements set out in the relevant Australian Standards for car parking facilities.
5.2 Public Transport and Sustainable Travel Modes
As noted in Section 2 and Section 3 of this report, the proposed redevelopment site is well placed within close proximity to a range of public transport services and community facilities.
This proximity to public transport and community facilities provides a realistic opportunity to better manage travel demand generated by the site and in particular promote more sustainable modes of transport and better management of car use.
Notwithstanding the above, the implementation of site specific as part of a “Green Travel Plan” (GTP) will further encourage and maintain use of sustainable travel modes to and from the site.
A GTP is a package of coordinated strategies and measures to promote and encourage sustainable travel, such as walking, cycling and public transport etc. Such plans aim to influence the way people move to/from a business, residential complex or any other organisation to deliver better environmental outcomes and a range of travel choices, whilst also reducing the reliance on private car usage, particularly single occupancy car trips.
A GTP is proposed to be implemented as part of any development approval for the site, with green travel plan initiatives intended to be provided prior to the occupation of the site.
These green travel plan initiatives would promote the use of more sustainable modes of travel (i.e. walking, cycling, car share and public transport) and subsequently, reduce vehicle trips to/from the area.

18256_r01v03_190628 25
An initial GTP has been prepared for the site and is provided in Appendix B. This initial GTP would guide a future GTP to be prepared as part of a future DA and implemented for site operation.
GTP measures may include (but not limited to):
Appointment of a Travel Plan Co-ordinator to ensure the ongoing monitoring and evaluation of the plan
provision of reduced car parking within the site for commercial (destination based land use) to limit attractiveness of the site for private vehicle trips for the journey to work travel
creation of high quality pedestrian/shared environments and cycling facilities to encourage cycling and walking
provide car sharing facilities and promote the availability of such car sharing pods to reduce private car ownership
provide free opal cards to all residents upon occupation with pre-loaded credit so that travel patterns can be influenced from Day 1
provision of public transport noticeboards to notify all residents/occupants of the alternate transport options available and a transport access guide for all new occupants
provision of high quality telecommunication points to reduce the need for travel off-site
a half yearly newsletter for every resident after occupation to outline the latest news on sustainable travel initiatives in the area.
These and other measures are set out in the GTP for the site contained in Appendix B.
In fact, such GTP initiatives (e.g. provided residents/occupants pre-loaded Opal cards from Day 1 and a welcome pack with public transport information) have been put in place in other similar developments, including Mirvac’s Harold Park development, which has resulted in car traffic generation rates being some 50% lower than predicted in the original traffic impact assessment.
This site is considered comparable with the Harold Park site due to its proximity to high frequency public transport facilities. The site is located approximately 100m south from the Marion light rail stop, whilst the Harold Park site is located about 400m south from the Jubilee Park light rail stop. Both light rail stops (Marion and Jubilee) services the L1 Dulwich Hill line.
Following the occupation of the Harold Park site with the green travel initiatives in place, the peak hour traffic generation per unit was recorded as being 0.1-0.12 trips per unit based on surveys conducted 3-month post occupation in 2015 and recent surveys conducted this year (2018).

18256_r01v03_190628 26
Thus, it is envisaged that the implementation of a GTP could reduce trips generated by the development, particularly to target residents and staff within the proposed development site.
5.3 Traffic Generation Assessment
5.3.1 Estimated Additional Traffic Generation Potential
As indicated previously, the existing site is currently occupied by an automotive repair and service facility with a floor area of over 3,000m2.
The existing traffic generation of the site has been included in the existing surveyed traffic flows as presented in Section 2 of this report.
It is proposed that the future use of the site will retain approximately 3,200m2 of ‘light industrial’ floor area for the use of automotive services. Essentially the existing automotive uses will be retained on the site under the proposed development.
Thus, with regard to potential traffic implications of the proposal, it is the nett additional traffic generation associated with the ‘office’ and ‘residential’ uses that need to be considered.
For the purpose of assessing the traffic generation potential of the proposed additional site uses, the Roads and Maritime suggested traffic generation rates for commercial and residential uses have been adopted as follows:
residential: 0.19 trips per unit (AM Peak); 0.15 trips per unit (PM Peak)
commercia/community use: 1.69 trips per 100m2 (AM Peak); 1.2 trips per 100m2 (PM Peak)
The application of these rates has been applied to the additional uses on the site in Table 5.2.
Table 5.2: Estimate Net Additional Site Traffic Generation
Scenario AM Peak Hour PM Peak Hour
Automotive Services No additional traffic No additional traffic
Office (commercial) GFA
RMS Traffic Generation Rate Traffic Generation
1800m2
1.69 vph / 100m2 + 30 vph
1800m2
1.2 vph / 100m2 +22 vph
Residential No. of Apartments
RMS Traffic Generation Rate Traffic Generation
97
0.19 vph / apartment + 18 vph
97
0.15 vph / apartment + 15 vph
Total Additional Peak Hour Traffic + 48 vph +37 vph

18256_r01v03_190628 27
As shown above, the planning proposal could be expected to generate an additional 37- 48 vehicle trips during the AM and PM Peak respectively.
For the additional traffic potential the following proportions of inbound and outbound trips have been assumed in the surrounding road network assessment:
residential: 20% inbound / 80% outbound (AM Peak); 80% inbound / 20% outbound (PM Peak)
commercial/community use: 80% inbound / 20% outbound (AM Peak); 20% inbound / 80% outbound (PM Peak)
5.3.2 Intersection Operation Analysis
Based on the above, the potential additional traffic flows associated with the planning proposal development have been assigned to the surrounding road network and the operation of adjacent key intersections assessed using SIDRA modelling software to ascertain the intersection performance at the key nominated intersections surrounding the site.
Roads and Maritime uses the performance measure level of service to define how efficient an intersection is operating under given prevailing traffic conditions. Level of service is directly related to the delays experienced by traffic travelling the intersection. Level of service ranges from LoS A to LoS F. LoS A indicates the intersection is operating with spare capacity, while LoS F indicates the intersection is operating above capacity. LoS D is the long term desirable level of service.
Table 5.3 shows the criteria that SIDRA Intersection adopts in assessing the level of service.

18256_r01v03_190628 28
Table 5.3: Level of Service Criteria for Intersection Operation
Level of Service
Average Delay (seconds per vehicle) Traffic Signals, Roundabout Give Way and Stop Signs
A Less than 14 good operation good operation
B 15 to 28 good with acceptable delays and spare capacity
acceptable delays and spare capacity
C 29 to 42 satisfactory satisfactory, but accident study required
D 43 to 56 operating near capacity near capacity and accident study required
E 57 to 70 at capacity At signals, incidents will cause
excessive delays.
at capacity, requires other control mode
F Greater than 71 unsatisfactory with excessive queuing
unsatisfactory with excessive queuing; requires other control mode
Source: Roads and Maritime Guide to Traffic Generating Developments, 2002
The SIDRA modelling results for the existing (2018) and with development scenarios are presented in Table 5.4.
The full movement summaries of the SIDRA modelling results are provided in Appendix D.
Table 5.4: Intersection Operation with Additional Traffic Generated by Site Development
Intersection Existing (2018) With Development
Ave. Delay (s) LOS Ave. Delay (s) LOS
Marion St-Foster St
AM Peak 62 E 65 E
PM Peak 60 E 57 E
Foster St-Walter St
AM Peak 12 A 12 A
PM Peak 15 B 15 B
Under the above traffic assessment, the proposed development is expected to result in a slight increase in the delays experienced at the Marion Street / Foster Street intersection during both the AM and PM peak periods.
It is pertinent to note that the Marion Street / Foster Street intersection currently experiences poor levels of service intersection and that the proposed development would not significantly exacerbate this existing condition.

18256_r01v03_190628 29
Notwithstanding the above, the site’s close proximity to high quality public transport services will offer residents and workers at the site realistic alternatives to private vehicle use. Traffic congestion during peak periods will be another factor influencing mode choice in favour of public transport. The implementation of a green travel plan (as appended to this report) is considered to be a critical factor in encouraging the mode shifts away from private motor vehicle use for future residents and workers of the site.
5.4 Site Access Arrangements
As described in Section 2, the site currently benefits from wide driveways at Marion Street and a rear site driveway at Walter Street.
As shown in the ground floor plan of the architectural drawings for the planning proposal, it is intended to consolidate the existing driveways at Marion Street to a single entry / exit driveway and retain a single driveway at Walter Street.
To limit the volume of traffic utilising Walter Street while maintaining flexibility for vehicle movements within the site, it is intended that the Walter Street driveway be provided as a one way access. TTPP’s recommendations during the concept design is that the Walter Street access should be provided as a one way exit driveway.
The provision of a ground level through site link will facility efficient service vehicle movements through the site. It will also allow cars accessing the site to avoid the need to travel through the congested Marion Street / Foster Street intersection.
The through site link will also facilitate pedestrian and cycle movement through the site and improve the walking / cycling connections to the Marion Street Light Rail station and Marion Street bus stops.
It is noted that the proposed site access arrangements are consistent with the adjacent Uniting aged care facility which provides its primary access at Marion Street while also facilitating vehicle exit movements via the rear of the site at Hawthorne Street.

18256_r01v03_190628 30
6 Conclusions
This report examines the traffic and parking implications of the planning proposal development at 245 Marion Street, Leichhardt. The key findings of this report are presented below.
The planning proposal seeks approval to allow additional permitted uses on the site at 245 Marion Street Leichardt to allow mixed-use development to occur on the site. The proposal would allow both employment and residential uses to occur on the site.
The site is currently occupied by automotive service uses. It is intended that this use will remain on site as part of the proposed development.
The additional uses of the site would indicatively include:
o Residential apartments (97 apartments)
o Office / commercial (1,800m2)
o Ancillary retail (eg. café)
The proposed architectural plans indicate that on site car parking provision can be provided in accordance with the relevant parking controls/guidelines, with appropriate allocation provided for bicycle and motorcycle spaces.
The proposal is expected to generate an additional 37-48 vehicles per hour in the peak periods.
The proposed development is not expected to change the overall level of service at key nominated intersections within the vicinity.
However, traffic modelling indicates that the Marion Street-Foster Street intersection is forecasted to continue to function at its operational capacity at LoS E in the future, irrespective of the development traffic arising from the proposed site.
Notwithstanding the above, the site’s close proximity to high quality public transport services will provide a realistic and attractive travel mode alternative to private vehicle travel.
The proposed vehicle access arrangements and provision of a through site link will facilitate improved access to the Marion Street Light Rail Station and Marion Street bus stops for the site and its neighbours.
A green travel plan should be implemented as part of the proposed development to facilitate a modal shift towards public transport usage as opposed to car usage, particularly for single-occupancy car trips. This is likely to further reduce traffic generated by the proposal.
Overall, it is concluded that the traffic and parking aspects of the proposed development would be satisfactory.

18256_r01v03_190628
Appendix A
Planning Proposal Architectural Plans

TRUE NORTH
SCALE0m 5m 10m 15m 20m 25m
SCALE0m
RED
EVEL
OPM
ENT
OF
245
MA
RIO
N S
TREE
T, L
EIC
HH
AR
DT
- PLA
NN
ING
PR
OPO
SAL
5m 10m 15m 20m 25m
DRIVEWAY
40.2m
35.0m
106.6m
106.7m
30.5m
LEVEL 1- GROUND FLOOR

TRUE NORTH
SCALE0m 5m 10m 15m 20m 25m
SCALE0m
RED
EVEL
OPM
ENT
OF
245
MA
RIO
N S
TREE
T, L
EIC
HH
AR
DT
- PLA
NN
ING
PR
OPO
SAL
5m 10m 15m 20m 25m
56.0m 25.0m 50.1m 6.0m
6.0m
7.5mCAR PARK (RETAIL/EMPLOYMENT USES)URBAN SERVICES
DRIVEWAY
DEE
P SO
IL
DEEP SOIL
MA
RIO
N S
TREE
T
WA
LTER
STR
EET
40.2
m
35.0
m
106.6m 30.5m
106.7m21.3m 9.3m
BASEMENT 1

TRUE NORTH
SCALE0m 5m 10m 15m 20m 25m
SCALE0m
RED
EVEL
OPM
ENT
OF
245
MA
RIO
N S
TREE
T, L
EIC
HH
AR
DT
- PLA
NN
ING
PR
OPO
SAL
5m 10m 15m 20m 25m
6.0m
56m 25.0m 50.1m 6.0m
CAR PARK (RESIDENTIAL)
DRIVEWAY
DEE
P SO
IL
DEEP SOIL
STORE
MA
RIO
N S
TREE
T
WA
LTER
STR
EET
VOID
40.2
m
35.0
m
106.6m 30.5m
106.7m21.3m 9.3m
BASEMENT 2

TRUE NORTH
SCALE0m 5m 10m 15m 20m 25m
SCALE0m
RED
EVEL
OPM
ENT
OF
245
MA
RIO
N S
TREE
T, L
EIC
HH
AR
DT
- PLA
NN
ING
PR
OPO
SAL
5m 10m 15m 20m 25m
56.0m 50.1m
6.0m
25.0m 6.0m
DRIVEWAY
DEE
P SO
IL
DEEP SOIL
MA
RIO
N S
TREE
T
WA
LTER
STR
EET
CAR PARK (RESIDENTIAL)40.2
m
35.0
m
106.6m 30.5m
106.7m21.3m 9.3m
URBAN SERVICES
BASEMENT 3

18256_r01v03_190628
Appendix B
Indicative Green Travel Plan

Prepared for:
P&C Consulting Pty Ltd 12 June 2019
The Transport Planning Partnership
245 Marion Street, Leichhardt Green Travel Plan

245 Marion Street, Leichhardt Green Travel Plan
Client: P&C Consulting Pty Ltd
Version: V01
Date: 12 June 2019
TTPP Reference: 18256
Quality Record
Version Date Prepared by Reviewed by Approved by Signature
V01 12/06/19 Jessica Ng Jason Rudd Jason Rudd

18256_r02v01_GTP_180612 i
Table of Contents 1 Introduction ...................................................................................................................................... 1
1.1 Preamble ................................................................................................................................ 1
1.2 The Role of Travel Plans ........................................................................................................ 1
1.3 Travel Plan Pyramid .............................................................................................................. 2
1.4 Drivers of the Travel Plan ..................................................................................................... 3
1.5 Case Study – Harold Park Green Travel Plan ................................................................... 5
2 Existing Transport Policy Context .................................................................................................. 7
2.1 Summary of Key Policy Directions...................................................................................... 7
2.1.1 Greater Sydney Region Plans: 30-minute City ........................................................ 8
3 Existing Transport Conditions ....................................................................................................... 11
3.1 Rail Services .......................................................................................................................... 11
3.1.1 Train ............................................................................................................................... 11
3.1.2 Light Rail ........................................................................................................................ 12
3.2 Existing Bus Services ............................................................................................................ 13
3.3 Existing Pedestrian Infrastructure...................................................................................... 14
3.4 Existing Cycling Infrastructure ........................................................................................... 16
3.5 Car Share .............................................................................................................................. 18
3.6 Traffic Surveys and Modal Split ......................................................................................... 19
3.6.1 Light Rail Patronage ................................................................................................... 20
3.6.2 Bus Patronage ............................................................................................................. 20
3.6.3 Existing Modal Split ..................................................................................................... 23
4 Objectives and Targets ................................................................................................................ 24
4.1 Future Population and Projected Mode Splits .............................................................. 24
4.2 Objectives ............................................................................................................................ 24
4.3 Mode Share Targets ........................................................................................................... 25
5 Methods of Encouraging Modal Shift ........................................................................................ 26
5.1 Site Specific Measures ....................................................................................................... 26
5.1.1 Walking ......................................................................................................................... 26
5.1.2 Cycling .......................................................................................................................... 26
5.1.3 Public Transport ........................................................................................................... 26
5.1.4 Travel Share .................................................................................................................. 26
5.1.5 Off-site Measures ........................................................................................................ 27
5.2 GTP Information ................................................................................................................... 27

18256_r02v01_GTP_180612 ii
5.3 Information and Communication ................................................................................... 28
5.4 Actions .................................................................................................................................. 29
6 Management and Monitoring of the Plan ............................................................................... 30
6.1 Management ...................................................................................................................... 30
6.2 Remedial Actions ................................................................................................................ 31
6.3 Consultation ......................................................................................................................... 31
6.4 Conclusion ........................................................................................................................... 31
Tables Table 1.1: Summary of Harold Park Post-Occupation Surveys ........................................................... 6
Table 2.1: Summary of Policy Framework ............................................................................................... 7
Table 3.1: Summary of Existing Train Services and Frequencies ....................................................... 11
Table 3.2: Population of Walkers to a Bus Stop (Weekday Trips)...................................................... 14
Table 3.3: Summary of Bus Frequencies near the Site ........................................................................ 21
Table 3.4: Journey to Work Modal Splits (2016 Census) ..................................................................... 23
Table 4.1: Projected Journey to Work Modal Splits ............................................................................. 24
Table 5.1: Framework Action Table ....................................................................................................... 29
Figures Figure 1.1: Travel Plan Pyramid ................................................................................................................. 3
Figure 2.1: 30-minute Catchment by Transit ........................................................................................ 10
Figure 3.1: T2 Route ................................................................................................................................... 11
Figure 3.2: T3 Route ................................................................................................................................... 12
Figure 3.3: L1 Dulwich Hill Light Rail Route ............................................................................................ 12
Figure 3.4: Marion Light Rail Station ....................................................................................................... 13
Figure 3.5: Walking Route to the Marion Light Rail Station ................................................................ 13
Figure 3.6: Existing Bus Network Map ..................................................................................................... 15
Figure 3.7: Existing Pedestrian Catchment (30-minute walk) ............................................................ 16
Figure 3.8: Existing Bicycle Route Map .................................................................................................. 17
Figure 3.9: Existing Bicycle Catchment (30-minutes) .......................................................................... 18
Figure 3.10: Location of Existing GoGet Vehicles ................................................................................ 19
Figure 3.11: Marion Light Rail Monthly Patronage (July 2016 to February 2018) ........................... 20

18256_r02v01_GTP_180612 iii
Figure 3.12: Existing Peak Bus Capacities (Bus Stop 204080) – To City ............................................ 22
Figure 3.13: Existing Peak Bus Capacities (Bus Stop 204082) – From City ........................................ 22
APPENDICES A. TRANSPORT ACCESS GUIDE

18256_r02v01_GTP_180612 1
1 Introduction
1.1 Preamble
TTPP has been appointed to provide a Green Travel Plan (GTP) for the subject site to assist in the management of travel demand at the proposed rezoning site at 245 Marion Street Leichhardt.
This GTP has been prepared to outline how travel demand of the future site development can be managed in a manner which encourages greater use of sustainable, public and active travel modes, along with reducing trip lengths and the need for trips.
This GTP is considered to be a live document that will evolve over time to reflect the changing demand of the site’s population and its surrounds.
1.2 The Role of Travel Plans
The purpose of a Green Travel Plan (GTP) is to encapsulate a strategy for managing travel demand that embraces the principles of sustainable transport. In its simplest form, this GTP encourages use of transport modes that have a low environmental impact, such as active transport modes – walking, cycling, public transport, and better management of car use.
Active transport presents a number of interrelated benefits including:
improved health benefits
reduced traffic congestion, noise and air pollution caused by cars
greater social connections within communities
cost savings to the economy and individual.
A GTP is a package of coordinated strategies and measures to promote and encourage active/sustainable travel. This GTP aims to influence the way people move to/from the proposed development site to deliver better environmental outcomes and provide a range of travel choices, whilst also reducing the reliance on private car usage, particularly single occupancy car trips.
The planning of the new development would need to accommodate innovative ideas to better manage the transport demand of the project. It will be necessary to introduce

18256_r02v01_GTP_180612 2
new measures to ensure that trips generated by the proposed development are not solely private car based, particularly single occupancy trips.
Key drivers for the GTP are detailed in Section 1.3.
In order to ensure that the GTP meets its intended objectives, a review of the 2012 GTP against ‘best practice’ guidelines such as the City of Sydney ‘Guide to Travel Plans’ and ‘The Essential Guide to Travel Planning’ prepared by the United Kingdom Department of Transport, has been undertaken.
The key themes applicable to the GTP include:
Site audit and data collection: A desktop audit has been undertaken in order to identify and document the existing issues and opportunities relevant to site and its accessibility particularly by non-car modes. Opportunities to improve amenity, incentivise non-car travel and remove barriers to use of sustainable transport modes are then dealt with under the Site-Specific Measures.
Audit of Policies: An audit of key policy documents has been undertaken to assist define the direction and purpose of the GTP, aligned with the key targets and objectives from a local and regional perspective.
Bicycle parking and car parking management: This GTP provides a strategy for management of both bicycle parking and car parking moving forward, and how they interact with travel choices.
Local alliances: The development of relationships between the Proponent and various stakeholders (such as the Inner West Council, the Roads and Maritime Services and Transport for New South Wales) will assist the Proponent in delivering improved transport options.
1.3 Travel Plan Pyramid
The GTP will need to be tailored to the proposed development site to ensure appropriate measures are in place for the different land uses to promote a modal shift away from car usage.
The key elements of the GTP are shown in the Travel Plan Pyramid in Figure 1.1.

18256_r02v01_GTP_180612 3
Figure 1.1: Travel Plan Pyramid
Figure 1.1 demonstrates that the key foundations to ensure the success of a GTP are:
1. Location – i.e. proximity to existing public transport services and proximity to mixed land uses, e.g. shops and services, such that walking or cycling becomes the natural choice
2. Built Environment – i.e. provision of high quality pedestrian and cycling facilities, end-of-trip facilities and reduced car parking provision to encourage sustainable transport choices.
1.4 Drivers of the Travel Plan
Further to the above, there are a number of social, environmental and economic drivers for developing and implementing a GTP for the proposed development site as detailed below.
1.4.1.1 Car Parking
Car parks utilise valuable land resources and impact amenity. If the area continues to grow and there is no modal shift towards non-car transport modes, the car parking demand could increase significantly. As such, the provision of car parking must reflect the site’s proximity to public transport to influence a modal shift to sustainable transport modes. As the site is located within close proximity to high frequency public transport facilities with direct access to the Sydney CBD, there is strong justification to provide
•e.g. welcome packs, public transport discounts and incentives
Promotional Strategy
•location to public transport facilities and provision of services e.g. high speed internet access to reduce the need for travel off-site
Services and Facilities
•develop further measures and oversee the plan on an ongoing basis to ensure effectivity of the measures
Travel Plan Coordinator
•site design, including pedestrian and cycling facilities and parking provision
Built Environment
•proximity to exisitng facilitites, e.g. provision of complementary land uses
Location

18256_r02v01_GTP_180612 4
reduced car parking compared to the maximum car parking rates as set out in Council’s Development Control Plan.
Further to this, the cost of building underground parking is significant and therefore, there is strong economic imperative to reduce parking demand through supporting modal shift to sustainable transport modes (Poinsatte and Toor 1999).
1.4.1.2 Environmental Impacts
The transport sector amounts to 13.5% of greenhouse gas emissions (GHG) in Australia (Department of Sustainability, Environment, Water, Population and Communities 2011). Mitigating this impact is a key driver of the GTP. Within Australia, GHG emissions in the transport sector have risen by 30% in the last 20 years with the greatest emissions growth coming from the use of private vehicles (Department of Climate Change and Energy Efficiency, 2011). In comparison, travel modes such as walking and cycling have the lowest emissions while public transportation has far less impact than the private car (Dave 2011).
1.4.1.3 Health Benefits
The use of sustainable transport modes can have wide-ranging health benefits across the population (World Health Organisation, 2009). High levels of car-use and long commuting times are also associated with decreased physical activity and sedentary lifestyle diseases such as obesity, heart disease and type-2 diabetes (Wen et al.2006). Medibank Private (2007) estimates the cost of physical inactivity to the health care system to be $1.5 billion per year. Active transport modes (including public transport) also provide more sustained health benefits because physical activity becomes part of everyday routine. Sustainable transport modes also improve air quality by lowering air pollution and reducing exposure to particulates, sulphates and atmospheric ozone. A Bureau of Transport and Regional Economics (2007) report estimates that between 900 and 2,000 early deaths are caused by motor vehicle pollution in Australia each year. Reducing pollution has both environmental and health benefits.
1.4.1.4 Social Inclusion
Transport has a fundamental role in supporting social equity through providing access to essential amenities, employment opportunities and social and recreational goods (Lucas and Currie, 2011). Greater levels of walking and cycling hold significant benefits in terms of equity and community cohesion (Hart 2008). Car dependency accentuates inequalities of access amongst certain groups who are less likely to drive including the unemployed, persons on low incomes, children and young people, the aged, and persons with disabilities (Sustainable Development Commission, 2011). As such, sustainable transport modes can provide a more affordable alternative to car use.

18256_r02v01_GTP_180612 5
1.4.1.5 Resident and Staff Attraction
Ease of access has a significant impact on choices of work and living. Negative experiences and costs associated with travel can reduce the competitiveness of a residential, commercial or retail precinct. High quality and efficient transport systems are key to attracting and retaining staff, visitors and residential tenants. Support for active transport modes is also highly desired by employers and employees, because it improves health and productivity (Colliers International 2011).
1.5 Case Study – Harold Park Green Travel Plan
In 2011, TTPP staff were commissioned by Mirvac to complete the transport assessment for the Harold Park Masterplan comprising 1,250 residential apartments, 7,300m2 of retail floor area and 3,850m2 of commercial floor area.
As part of the proposed Harold Park Masterplan, a Green Travel Plan was prepared to encourage and promote the future use of transport by residents in a sustainable and environmentally friendly manner. In fact, the following Green Travel Plan initiatives were implemented as part of the proposed development:
compliance with the stringent parking controls applicable to the site
creation of street networks and associated cycleways, footpaths and links to encourage cycling and walking
provision of a TAG given to every new occupant of the dwelling
public transport noticeboards within the development to notify all residents and visitors of the alternate transport options available
provision of free yearly GoOccasional, car share membership for the initial occupation of dwellings to allow two drivers registered per membership
provision of free weekly light rail and travel ten bus tickets for the initial occupation (N.B. this was updated to pre-loaded Opal cards for Precincts completed post-2015)
provision of high quality telecommunication points
provision of bicycle parking spaces for both residents and visitors in accordance with City of Sydney requirements.
a half yearly newsletter for every household after occupation to outline the latest news on sustainable travel initiatives in the area.
The above listed measures were in place from ‘Day One’ to establish better transport habits at the start of occupation.

18256_r02v01_GTP_180612 6
Following this, TTPP staff were appointed as the Travel Plan Co-Ordinator for the Harold Park to develop, implement and monitor the effectiveness of the GTP. Surveys have since been conducted to understand the effectiveness of the Green Travel Plan initiatives.
A summary of the survey data is shown in Table 1.1.
Table 1.1: Summary of Harold Park Post-Occupation Surveys
Initial Traffic Assessment Report Estimate (2011)
Roads and Maritime Guide
TDT2013/04a
3-month Post-Occupation
Survey (2015)
Latest Post-Occupation
Survey (2018)
Trip Rate 0.29 trips per unit 0.19 trips per unit 0.10 trips per unit 0.12 trips per unit
Table 1.1 indicates that the Harold Park site generates a peak traffic generation rate of 0.12 trips per unit based recent post-occupation surveys. Comparably, this is more than 50% less than what was initially envisaged for the site and 40% less than current suggested traffic generation rates in the Roads and Maritime latest technical direction for Guide to Traffic Generating Developments.
Taking the above into consideration, TTPP notes that there is strong supporting evidence to suggest the effectiveness of Green Travel Plan initiatives to reduce vehicle trips from a development site. However, that being said, it should be noted that the Harold Park site is supported by high frequency public transport facilities and located near key employment areas. On this basis, a site’s proximity to public transport facilities and key employment areas/attractions is considered a critical component to assess the effectiveness of Green Travel Plan initiatives.

18256_r02v01_GTP_180612 7
2 Existing Transport Policy Context
2.1 Summary of Key Policy Directions
The review of existing relevant policy clearly illustrates a number of themes that should inform the approach to ongoing management of transport demand, and investment in the transport network. These themes include:
Provision of high quality local transport infrastructure and improved bike paths and networks and improving accessibly and connectivity
Address car parking issues in key locations, including residential and business districts and encouraging active transport
Create connected, liveable communities where people can walk, cycle and use public transport to promote healthier, active communities.
A summary of the existing policy framework documents is provided in Table 2.1.
Table 2.1: Summary of Policy Framework
Policy/Strategy Key Aims/Objectives/Goals
Inner West Council
Leichardt 2025+ Community Strategy
Plan
Leichhardt 2025+ is the strategic plan for the Leichhardt Local Government Area that identifies the community’s main priorities and aspirations for the future and guides the delivery of Council services over the next ten years. The key goals are to create:
a community that is equitable, cohesive, connected, caring, diverse, healthy, safe culturally active, creative and innovative and has a strong sense of belong and place
a liveable community – socially, environmentally and economically thriving business and vibrant community accountable civic leadership that delivers services and assets to support the
community and future growth.
Statement of Vision and Priorities
Engagement Report
Delivering the GreenWay Managing traffic congestion Provision and maintenance of local transport infrastructure e.g. roads,
footpaths Improving bike paths and networks Improving accessibility and connectivity Addressing car parking issues in key locations, including residential and
business districts Encouraging active transport

18256_r02v01_GTP_180612 8
Policy/Strategy Key Aims/Objectives/Goals
NSW State Government
Parramatta Road Corridor Urban
Transport Strategy
The purpose of the Strategy is to facilitate the coordinated transformation of Parramatta Road and its adjoining lands by integrated land use and development with transport initiatives and public domain improvements. The key objectives for the Corridor include to:
make it easier to move to, through and within the Corridor support walking and/or cycling for local trips, bus and/or light rail for
intermediate trips, rail and/or car for regional trips realise and support urban transformation and transit-oriented development facilitate additional east-west and north-south movements enhance existing or create new desirable and affordable mixed-use
environments optimise the Corridor’s inherent social, economic and environmental
resources, including freight generating precincts utilise excess road and rail capacity and non-infrastructure initiatives and
optimise public investment in transport contribute to regional resilience and sustainable communities.
New South Wales Long Term Transport
Masterplan (NSW State Government, 2012)
The NSW Long Term Transport Masterplan guide the NSW Government’s transport funding priorities over the next 20 years. As part of this Plan, the Inner West Light Rail extension was completed in 2014, which involved the introduction of nine new stations from Lilyfield to Dulwich Hill, including Marion Light Rail station. This light rail route has provided good connectivity to shopping and entertainment districts and better transport integration by allowing passengers to transfer between rail, bus, bike and heavy rail services.
Future Transport Strategy 2056
The Strategy aims to increase the mode share of public transport services and reduce the use of single occupant vehicles. The Proposal will look to reduce private vehicle travel and aligning with the objectives of the Strategy.
Greater Sydney Region Plan: A Metropolis of
Three Cities – Connecting People
The Site is ideally located to contribute towards creating a 30-minute city. The mix of uses means residents/employees can access easily access shops and the community facilities within the immediate vicinity. The Site’s links with public transport means there are numerous facilities including jobs, schools and hospitals, within a 30-minute travel time for future residents and the Site is within a 30-minute travel time for visitors. The Site thus aligns with the objects of the Plan.
Sydney’s Cycling Future, Cycling for Everyday Transport
(NSW State Government, 2013)
The Three Pillars of Sydney’s Cycling Future: investing in separated cycleways providing connected bicycle networks to major centres and transport
interchanges promoting better use of our existing network; and, engaging with our partners across government, councils, developers and
bicycle users.
2.1.1 Greater Sydney Region Plans: 30-minute City
As indicated above, the Greater Sydney Commission’s Greater Sydney Region Plan, the key purpose of the plan is to deliver a 30-minute city where jobs, services and quality public transport spaces are in easy reach of people’s home. The Eastern City District Plan has been produced so that the Region Plan can be implemented at a district level.
However, a recent study conducted by Deloitte Access Economics found that only 75 of the 313 Sydney neighbourhoods could currently be deemed to have easy access to

18256_r02v01_GTP_180612 9
major job hubs and other key services within half an hour. Based on the findings of the Deloitte study and work undertaken by Arup, a number of key performance criteria have been identified in order to achieve a 30-minute city:
Access to healthcare – hospitals provide an important facility to many people and play a role for employment, education and training facilities. Parking is often limited at hospitals and as such, access via a variety of transport modes are required.
Access to retail services – access to all forms of retail (supermarkets and specialist stores) is essential to achieve a 30-minute city. There has already been an increase in the number of mixed-use developments within Sydney to create micro-communities, which provide mixed retail services, residential, commercial and community facility uses.
Access to schools – access to good schools relies on housing affordability, which also shape where teachers live. In particular, many students have good access to local schools, however some have to travel outside their catchment areas for specialist and selective schools. As such, it is important to create strong transport link are required to provide good access to local schools and connect teachers with their place of residents and work.
Access to further education facilities – public transport links for TAFE and universities are vital as students and teachers often travel out of the local catchment to the educational facility as they are often located in areas with high property prices.
Quality of public transport facilities –Whilst Sydney is a liveable city; it is often constrained by transport issues. As such, the provision of good quality, reliable public transport facilities are essential to achieve a 30-minute city.
Access to jobs – people being able to live close to their jobs is fundamental to delivering a 30-minute city. The current Sydney CBD has the highest concentration of jobs but as found by the Deloitte study, the average one-way commute for those travelling into the CBD from outside the city is 63- minutes. The locations with the best access to jobs currently are located near to railway stations, or close to major employment centres such as the Sydney CBD.
Access to residents – a way of minimising travel needs is to locate jobs and services close to where residents live.
As an indication, the site’s proximity to surrounding suburbs within a 30-minute commute by transit is shown in Figure 2.1.
Figure 2.1 indicates that the site is located within a 30-minute commute to the Sydney CBD by transit (e.g. Ultimo, Haymarket, Pyrmont, Sydney suburbs). Based on this, the site is considered well located to key employment hubs with good public transport connectivity and as such, is considered to align with the key objectives of the Sydney Greater Region Plan by contributing towards the creation of a 30-minute city.

18256_r02v01_GTP_180612 10
Figure 2.1: 30-minute Catchment by Transit
Source: Route360 (accessed on 8/06/18)

18256_r02v01_GTP_180612 11
3 Existing Transport Conditions
3.1 Rail Services
3.1.1 Train
Train services are available at Summer Hill and Lewisham Stations, which are located approximately 900m south of the site. The T2 Inner West & Leppington line and T3 Bankstown line service both these train stations. A summary of the existing train services and their associated frequencies are provided in Table 3.1.
Table 3.1: Summary of Existing Train Services and Frequencies
Rail Line Route AM Peak 7am-9am
(no. of services)
PM Peak 4pm-6pm
(no. of services)
T2 Inner West & Leppington City Circle via Town Centre 18 8
Parramatta 7 8
Ashfield Only 1 -
Leppington via Granville - 6
T3 Bankstown Liverpool via Regents Park 1 -
The T2 and T3 route is shown in Figure 3.1 and Figure 3.2 respectively.
Figure 3.1: T2 Route

18256_r02v01_GTP_180612 12
Figure 3.2: T3 Route
3.1.2 Light Rail
The L1 Dulwich Hill light rail runs from Dulwich Hill to Central via Rozelle Bay, Lilyfield, Leichhardt North, Hawthorne and Marion light rail stops. Services operate every 10-15 minutes between 6am and 11pm, Sunday to Thursday, and until midnight on Friday and Saturday. Bicycles are allowed on light rail spaces for free when space permits.
Further to this, advice provided from TfNSW on 9 July 2018 regarding the potential uplift in light rail demand from the proposal, notes that “TfNSW constantly review the patronage for the inner west light rail services and would increase the services if required”. As such, it is envisaged that adequate public transport connections and services would be provided to cater the proposal, plus other developments within the Taverners Hill Precinct.
Figure 3.3: L1 Dulwich Hill Light Rail Route
Source: Transport for NSW https://transportnsw.info/documents/timetables/93-L1-Dulwich-Hill-Line-20170828.pdf (accessed on 15/06/18)

18256_r02v01_GTP_180612 13
The Marion Light Rail station is located immediately adjacent to the site (1 minute walk – less than 100m) and operates daily, every 7-8 minutes during peak periods in either direction. A picture of this station is shown in Figure 3.4.
The walk travel times and routes to the Marion Light Rail station are shown in Figure 3.5
Figure 3.5: Walking Route to the Marion Light Rail Station
Source: Google Maps Australia (accessed on 08/06/18)
3.2 Existing Bus Services
The Integrated Public Transport Service Planning Guidelines state that bus services influence the travel mode choices of sites within 400 metres (approximately 5 minutes) of a bus stop.
However, more recent data collected by TfNSW Transport Performance and Analytics from 2014/15 household travel surveys suggest that walking trips to a bus stop extend further than the traditional 400m distance to a bus stop, as shown in Table 3.2.
Figure 3.4: Marion Light Rail Station
Source: Google Images (Jensathit, T Feb 2018)
Site Location

18256_r02v01_GTP_180612 14
Table 3.2: Population of Walkers to a Bus Stop (Weekday Trips)
Walking Distance Population Percentage of Population
Up to 400m 155,948 49%
401m to 800m 91,077 28%
801m and greater 73,632 23%
Total 320,657 100% Data Source: TfNSW Transport Performance and Analytics Household Travel Surveys 2014/2015
Notably, there are a number of bus stops located within a 400m catchment radius of the site on Marion Street, which provide good public transport access to a myriad of locations across Sydney. The existing bus network map surrounding the site is shown in Figure 3.6.
3.3 Existing Pedestrian Infrastructure
Well-established pedestrian facilities are provided within the vicinity of the site. Sealed pedestrian paths are provided on either side of Lords Road, which provide good pedestrian access to the properties along Lords Road and retail shops on Flood Street, including MarketPlace Leichhardt.
In addition to this, within the immediate vicinity of the site, signalised pedestrian crossings are provided across Lords Road-Foster Street with zebra pedestrian crossings provided at the Lords Road-Flood Street intersection.
The site is located within a 30-minute walk distance to key destinations and attractions in the area, including MarketPlace Leichhardt, child care centres, local café and restaurants and various recreational facilities and parks.
The pedestrian catchment within a 30-minute walk distance from the site is graphically shown in Figure 3.7.

18256_r02v01_GTP_180612 15
Figure 3.6: Existing Bus Network Map
Basemap Source: State Transit Inner West Network Map (accessed on 15/06/18) <http://www.sydneybuses.info/>

18256_r02v01_GTP_180612 16
Figure 3.7: Existing Pedestrian Catchment (30-minute walk)
Source: Route360 (accessed on 15/06/18)
3.4 Existing Cycling Infrastructure
A number of on-road and off-road bicycle routes are provided within the immediate vicinity of the site. The existing bicycle route map surrounding the site is presented in Figure 3.8.

18256_r02v01_GTP_180612 17
Figure 3.8: Existing Bicycle Route Map
Source: Roads and Maritime Cycleway Finder (accessed on 15/06/18)
Notably, travelling to Marrickville/Newtown suburbs by bike would take about 20 to 30 minutes from the site via existing bicycle routes. As an indication, the cycling catchment area within a 30-minute bike ride from the site is shown in Figure 3.9.

18256_r02v01_GTP_180612 18
Figure 3.9: Existing Bicycle Catchment (30-minutes)
Source: Route360 (accessed on 15/06/18)
3.5 Car Share
Car sharing is a flexible, cost effective alternative to car ownership and is a convenient and reliable way for residents to use a car when they need one. GoGet is a car share company operated in Australia, with a number of vehicles positioned within the area.
Car share is a concept by which members join a car ownership club, choose a rate plan and pay an annual fee. The fees cover fuel, insurance, maintenance, and cleaning. The vehicles are mostly sedans, but also include SUVs and station wagons. Each vehicle has a home location, referred to as a "pod", either in a parking lot or on a street, typically in a highly-populated urban neighbourhood. Members reserve a car by web or telephone and use a key card to access the vehicle.
Notably, the City of Sydney Council has reported that “a single car share vehicle can replace up to 12 private vehicles that would otherwise compete for local parking”.

18256_r02v01_GTP_180612 19
As such, the provision of car sharing facilities should be able to reduce both the parking demand for the site and the traffic generated by it.
Figure 3.10 shows the location of the existing GoGet vehicles within the immediate vicinity of the site.
Figure 3.10: Location of Existing GoGet Vehicles
Source: GoGet Australia (accessed on14/06/18: https://www.goget.com.au/find-cars/)
In addition to those identified above, the development would consider the provision of car share spaces. This would benefit not only the occupants/residents at the site but also other employees and residents in the vicinity.
3.6 Traffic Surveys and Modal Split
This section contains a review of historical data of existing occupancy figures on public transport facilities, including light rail, bus and ferry services, and household travel survey information obtained from Transport for NSW’s Open Data website.
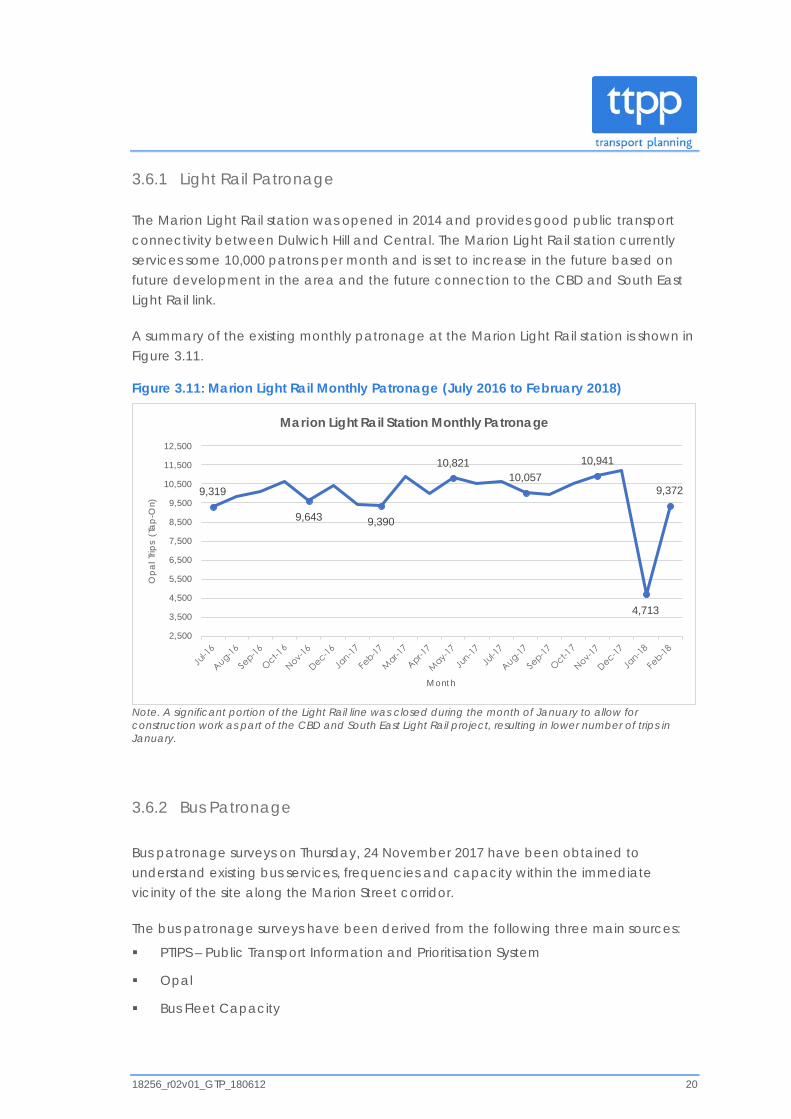
18256_r02v01_GTP_180612 20
3.6.1 Light Rail Patronage
The Marion Light Rail station was opened in 2014 and provides good public transport connectivity between Dulwich Hill and Central. The Marion Light Rail station currently services some 10,000 patrons per month and is set to increase in the future based on future development in the area and the future connection to the CBD and South East Light Rail link.
A summary of the existing monthly patronage at the Marion Light Rail station is shown in Figure 3.11.
Figure 3.11: Marion Light Rail Monthly Patronage (July 2016 to February 2018)
Note. A significant portion of the Light Rail line was closed during the month of January to allow for construction work as part of the CBD and South East Light Rail project, resulting in lower number of trips in January.
3.6.2 Bus Patronage
Bus patronage surveys on Thursday, 24 November 2017 have been obtained to understand existing bus services, frequencies and capacity within the immediate vicinity of the site along the Marion Street corridor.
The bus patronage surveys have been derived from the following three main sources:
PTIPS – Public Transport Information and Prioritisation System
Opal
Bus Fleet Capacity
9,319
9,643 9,390
10,82110,057
10,941
4,713
9,372
2,500
3,500
4,500
5,500
6,500
7,500
8,500
9,500
10,500
11,500
12,500
Opa
l Trip
s (T
ap-O
n)
Month
Marion Light Rail Station Monthly Patronage

18256_r02v01_GTP_180612 21
A summary of the existing bus frequencies at the nearest bus stops located on Marion Street, near Lambert Park is summarised in Table 3.3.
Table 3.3: Summary of Bus Frequencies near the Site
Cordon AM Period PM Period
7am-8am 8am-9am 4pm-5pm 5pm-6pm
To City 7 12 8 7
From City 6 8 9 10
The above data excludes any other bus stops located on Parramatta Road, which service bus routes 461, 480 and 484 to the City The Domain and Central station suburbs.
Existing bus services along the Marion Road corridor can currently accommodate a total capacity of some 62-112 bus patrons (people) per bus. Based on the bus patronage surveys, existing bus loads within the immediate vicinity of the site currently operate below its capacity, generally with many seats available during peak times.
The bus patronage surveys provide the following bus capacity classifications:
MANY_SEATS_AVAILABLE
If occupancy on the bus is less than 50% of the seating capacity (e.g. less than or equal 22 bus patrons)
FEW_SEATS_AVAILABLE
If occupancy on the bus is more than 50% of the seating capacity (e.g. more than 22 bus patrons)
STANDING_ROOM_ONLY
If occupancy on the bus is more than the seating capacity of the bus (e.g. more than 45 bus patrons)
With the above in mind, the existing bus loadings/capacities at the selected bus stops on Marion Street, near Lambert Park during the AM and PM peak periods are summarised in Figure 3.12 and Figure 3.13.
The following graphs show how many buses currently operate during the peak periods and their associated bus capacity classification.

18256_r02v01_GTP_180612 22
Figure 3.12: Existing Peak Bus Capacities (Bus Stop 204080) – To City
Figure 3.13: Existing Peak Bus Capacities (Bus Stop 204082) – From City
As such, the existing bus facilities within the immediate vicinity of the site currently operate well below its capacity, with spare capacity for any additional bus trips generated by the proposed development site (e.g. residents, visitors, staff etc.).
7
11
67
01
200 0 0 0
02468
1012
07:00 to 08:00 08:00 to 09:00 16:00 to 17:00 17:00 to 18:00
AM Period PM Period
No.
of b
uses
Time
Existing Bus Capacity(Cordon To City)
MANY_SEATS_AVAILABLE FEW_SEATS_AVAILABLE STANDING_ROOM_ONLY
67
8 8
01 1
2
0 00123456789
07:00 to 08:00 08:00 to 09:00 16:00 to 17:00 17:00 to 18:00
AM Period PM Period
No.
of b
uses
Time
Exisitng Bus Capacity(Cordon From City)
MANY_SEATS_AVAILABLE FEW_SEATS_AVAILABLE STANDING_ROOM_ONLY

18256_r02v01_GTP_180612 23
3.6.3 Existing Modal Split
2016 Census data has been obtained to understand existing journey to work trips in the Leichhardt area. Based on this data, 77.5% of working residents travel outside of the area to work, with the majority of residents working in the Sydney CBD or within the Inner West local government area (outside of Leichhardt).
A summary of the existing modal splits in the Leichhardt area is shown in Table 3.4. As a benchmark, the modal splits in the Greater Sydney Region have also been presented in Table 3.4.
Table 3.4: Journey to Work Modal Splits (2016 Census)
Main Method of Travel Proportion (%)
Leichhardt Greater Sydney Region Benchmark
Train 12% 19%
Bus 22% 7%
Tram or Ferry 5% 0%
Car Driver 48% 62%
Car Passenger 3% 5%
Motorbike / Scooter 2% 1%
Bicycle 3% 1%
Walk 5% 5%
Total 100% 100%
Table 3.4 indicates that 39% of working residents travel to work via bus, train or tram, with 51% travelling by car (car driver and car passengers). Comparably, within the Greater Sydney region, a total of 67% of working residents travel to work by car.
Given the recent introduction of the new Marion Light Rail stop in 2014 and current journey to work trip patterns in the area, the site is considered to be well serviced by public transport facilities and shows the potential to generate a modal shift away from car modes to more sustainable transport.

18256_r02v01_GTP_180612 24
4 Objectives and Targets
4.1 Future Population and Projected Mode Splits
The proposed development is envisaged to generate a net additional 48 and 37 vehicle trips during the AM and PM peaks respectively. Based on this metric, the projected modal splits for the development are shown in Table 4.1.
Table 4.1: Projected Journey to Work Modal Splits
Main method of Travel Leichhardt (Proportion %)
Net Proposed Development Trips (No. of Trips)
AM Peak PM Peak
Train 12% 11 9
Bus 22% 21 16
Tram or Ferry 5% 5 4
Car Driver 48% 48 37
Car Passenger 3%
Motorbike / Scooter 2% 2 1
Bicycle 3% 3 2
Walk 5% 5 4
Total 100% 95 73
Based on this, the proposed development is expected to generate a net additional 16-21 bus trips, 4-5 ferry trips, 9-11 train trips and 5-9 walking or cycling trips during peak periods.
4.2 Objectives
The following objectives have been identified in order to achieve the vision of the GTP.
Objective 1: Facilitate a shift towards more sustainable transport modes
Improve access, safety, amenity and convenience of sustainable transport modes for travel to and from the site
Provide incentives for sustainable travel and establish a culture of active and public transport use.
Continue to encourage non-car based modes by limiting the convenience of car access to the site.

18256_r02v01_GTP_180612 25
Objectives 2: Make the site a great place to live, work and visit
Improve access and mobility and enhance the sense of place.
Reduce the need to travel by co-locating of complementary land uses.
4.3 Mode Share Targets
As indicated previously, the aim of the GTP is to encourage modal shift away from cars by implementing measures that influence the travel patterns of residents, visitors and staff. To ensure that the GTP is having the desired effect, the implementation of the GTP would be regularly monitored. The success of the GTP is measured by setting modal share targets and identifying the measures and actions that have the greatest impact.
The results of the 2016 Census surveys indicate that car driver mode share is 51% in the area. Noting that a modal shift of between 3-5% would be considered to be a significant achievement (as stated by the experts in the LEC), it is considered that the mode share target for car driver should be 46%, which represents around a 5% modal shift. On this basis, the proposed development would need to influence a modal shift for about 4-7 people per hour to achieve a modal shift of 5%.
Table 4.2: Projected Journey to Work Modal Splits
Main method of Travel Existing Modal Split Proposed Modal Split
Train 12% 12%
Bus 22% 22%
Tram or Ferry 5% 10%
Car Driver 48% 43%
Car Passenger 3% 3%
Motorbike / Scooter 2% 2%
Bicycle 3% 3%
Walk 5% 5%
Total 100% 100%

18256_r02v01_GTP_180612 26
5 Methods of Encouraging Modal Shift
To achieve the objectives of the GTP, measures will be put in place to influence the travel patterns to/from the site, with a view to encouraging modal shift away from cars.
5.1 Site Specific Measures
The Proponent will implement the following measures to encourage more sustainable travel use.
5.1.1 Walking
Staff employed at the site will be encouraged to walk by implementing a’10,000 steps per day initiative’. This involves the provision of high quality pedestrian facilities, including pedestrian paths to/from key public transport hubs and bus stops. Staff members who have achieved the 10,000-step goal over a set period could be rewarded.
5.1.2 Cycling
Provision of high quality cycling infrastructure with end-of-trip facilities will be provided to encourage people to arrive by bicycle. Further to this, all staff, residents and visitors will be encouraged to travel to the site by bike through word of mouth and bicycle maps and routes posted on all noticeboards, newsletters, websites etc, to promote awareness. It is also noted that end of trip facilities are being provided in basement car park.
5.1.3 Public Transport
Public transport noticeboards will be provided in all commercial residential and retail facilities to make staff, residents and visitors more aware of the alternative transport options available. The format of the noticeboards will be based upon the travel access guide.
In addition to this, staff at the site and the initial residents would be provided with pre-loaded Opal cards during either their staff induction or when a resident occupies the site so that travel patterns can be influenced from Day 1.
5.1.4 Travel Share
There will be provision of car sharing facilities at or near the site for use by residents, visitors and staff members. The initiative is aimed at residents and staff members who drive to the site to reduce car ownership and single occupancy car trips.

18256_r02v01_GTP_180612 27
In addition to this, a carpooling forum will be developed to encourage residents and/or staff to travel in groups. The forum would provide a platform for people travelling on the same route to find each other and form groups. The forum will be posted on noticeboards and in newsletters.
5.1.5 Off-site Measures
The Proponent will consult with Council with a view to implementing several off-site measures to improve the transport connections to and from the site including:
Investigations with Council to accommodate cycle facilities within or adjacent to the proposed development site, including opportunities to enhance the through site pedestrian / cycle link created between Marion Street and Walter Street.
Improved signage and way finding from key public transport hubs, to improve the walking and cycling experience. Signage would include wayfinding for cyclists to direct them to the best and safest route to the site and other key destinations.
Investigations will be carried out to introduce parking stickers or other car park management solutions for residents, staff and visitors as a means of ensuring that the car parks are not utilised by external commuters for ‘park and ride’.
Compliance with the stringent parking controls applicable to the site.
Investigations with Council to facilitate additional car sharing facilities.
Introduction of flexible working hours in the commercial facilities to allow staff to commute out of typical peak times to reduce overall congestion and travel time.
Provision of high quality telecommunication services (internet, phone) to enable residents to work from home, rather than travelling off-site to work.
5.2 GTP Information
The information provided within the GTP will be provided to staff, residents and visitors in the form of a package of easy to understand travel information known as a Travel Access Guide (TAG).
This will be included in the information pack provided to residents and staff on day one.
TAGs provide customised travel information for people travelling to and from a particular site using sustainable forms of transport – walking, cycling and public transport. It provides a simple quick visual look at a location making it easy to see the relationship of site to train stations, light rail stations, bus stops and walking and cycling routes.

18256_r02v01_GTP_180612 28
Such TAGs encourage the use of non-vehicle mode transport and can reduce associated greenhouse gas emissions and traffic congestion while improving health through active transport choices.
They can take many forms from a map printed on the back of business cards or brochures. Best practice suggests that the information should be as concise, simple and site centred as possible and where possible provided on a single side/sheet. If instructions are too complex, people are likely to ignore them.
This TAG should be available for pick up at various locations at the site such as, at front entrances and noticeboards.
An indicative TAG for the proposed rezoning site is provided in Appendix A.
5.3 Information and Communication
Several opportunities exist to provide staff, residents and visitors with information about nearby transport options. Connecting staff, residents and visitors with information would help to facilitate journey planning and increase their awareness of convenient and inexpensive transport options which support change in travel behaviour.
Transport NSW info
Bus, train and ferry routes, timetables and journey planning are provided by Transport for New South Wales through their Transport Info website: http://www.transportnsw.info/
Sydney Cycleways
City of Sydney provides a number of services and a range of information to encourage people of all levels of experience to travel by bicycle. http://sydneycycleways.net/
Similarly such phone apps as TripView display Sydney public transport timetable data and shows a summary view showing current and subsequent services, as well as a full timetable viewer. This timetable data is stored on the phone, so it can be used offline.
Connecting staff, residents and visitors via social media may provide a platform to informally pilot new programs or create travel-buddy networks and communication.
The above web links and any social media platforms may be included within the GTP/TAG.

18256_r02v01_GTP_180612 29
5.4 Actions
A summary of the key strategy and framework action table is shown in Table 5.1. It should be noted that this framework action table will be updated as required. However, it is stressed that the availability of the suggested strategies on opening is a key factor in influencing travel patterns.
Table 5.1: Framework Action Table
Strategy Action Targeted Audience Timeline Responsibility
Managing Car Use
Car Sharing Provide car sharing facilities to reduce car
occupancy
Residents, staff and visitors
Prior Occupation
Proponent
Car Pooling Establish a car pooling system to reduce single
car occupancy and promote social
interaction
Residents, staff and visitors
Upon Occupation
Building Manager/Travel Plan Coordinator
Promoting Public Transport
Travel Pass Provide a subsided Opal pass
Residents, staff and visitors
Upon Occupation
Building Manager/Travel Plan Coordinator
Promoting Cycling and Walking
Provision of End-of-Trip Facilities
Provide bicycle parking, showers, lockers and
change rooms
Residents, staff and visitors
Prior to Occupation
Proponent
Other
Green Travel Plan
Provide residents, staff and visitors with the Green Travel Plan to
encourage active travel
Residents, staff and visitors
Upon Occupation
Building Manager/Travel Plan Coordinator
Transport Access Guide
Provide residents, staff and visitors with a TAG on
day one of occupation/induction and post the TAG on noticeboards, front
entrances, Club’s online website, etc.
Residents, staff and visitors
Upon Occupation
Building Manager/Travel Plan Coordinator
Ongoing Review Ongoing review of the GTP to introduce
additional measures as required
- Ongoing Travel Plan Coordinator

18256_r02v01_GTP_180612 30
6 Management and Monitoring of the Plan
6.1 Management
There is no standard methodology for the implementation and management of a GTP. However, the GTP will be monitored to ensure that it is achieving the desired benefits. The mode share targets set out in Section 4.3 are used in this regard to ensure there is an overall goal in the management of the GTP.
The monitoring of the GTP would require travel surveys to be undertaken with a focus to establish travel patterns including mode share of trips to and from the Site.
The implementation of the GTP will need a formal Travel Plan Co-ordinator (TPC), who will have responsibility for developing, implementing and monitoring the GTP. The TPC will be an appointed staff member of the Club or an independent expert.
It will also be necessary to provide feedback to staff, residents and visitors to ensure that they can see the benefits of sustainable transport.
Indeed, there are several keys to the development and implementation of a successful GTP. These include:
Communications – Good communications are an essential part of the GTP. It will be necessary to explain the reason for adopting the plan, promote the benefits available and provide information about the alternatives to driving alone.
Commitment – GTPs involve changing established habits or providing the impetus for people in new developments to choose a travel mode other than private car use. To achieve co-operation, it is essential to promote positively the wider objectives and benefits of the plan. This commitment includes the provision of the necessary resources to implement the plan, beginning with the introduction of the 'carrots' or incentives for changing travel modes upon occupation.
Building Consensus – It will be necessary to obtain broad support for the introduction of the plan from the residents, staff and visitors.
Once the plan has been adopted, it is essential to maintain interest in the scheme. Each new initiative in the plan will need to be publicised and marketing of the project as a whole will be important.

18256_r02v01_GTP_180612 31
6.2 Remedial Actions
A continuous review will take place to identify remedial actions should the modal share targets not be achieved. However, the following measures are proposed both as discrete measures (e.g. car share) and those being proposed as part of the proposed development masterplan:
Increased cycle parking
Increased / improved changing facilities /lockers
Increase in shuttle bus frequency
Increase use of car share (e.g. GoGet for staff).
Alternatively, the TPC could work with council to see how the measures might be aligned with those identified in councils Active Travel study.
6.3 Consultation
The results of the Green Travel Plan will be communicated with Council, staff, resident, visitors and to the wider community via the noticeboard and/or newsletters.
As such, it is recommended that a summary letter is produced presenting the results of the survey within one month of the undertaking of the travel surveys (say 3-months post-occupation). The letter/report may be also appended to the GTP and submitted to Council for comment. Subsequent surveys would be undertaken after 1, 3 and 5 years.
Communication to staff, residents, visitors and the wider community may be carried out in a similar form by public display of the GTP on noticeboards. Alternatively, a news article on the matter could be included on newsletters and/or an online website.
6.4 Conclusion
It is recommended that travel surveys be undertaken 3-months post-occupation of the site, with this draft GTP updated accordingly to suit the site’s existing modal splits and findings of the travel surveys, including opportunities and constraints to influence a modal shift away from car usage. Subsequent surveys should be undertaken after 1, 3 and 5 years.

18256_r02v01_GTP_180612 Appendix A
Appendix A
Transport Access Guide

SITE
10min
480483
461
438439
L38 L39 PrePay
436
L37
Use active transport and
get your daily physical
activity while you travel
Transport Access Guide
245 Marion Street, Leichhardt
Proposed Rezoning
5min
370
445
413
Haberfield
Marion St at Hawthorn Pde
Summer Hill
Parramatta Rd at Hawthorne Pde
Leichhardt
Leichhardt Market Place, Marion Street
Summer Hill Station
Lewisham Station
Hawthorne
Taverners Hill
Lewisham West

Bus
Getting Here
Public Transport InformationFor detailed route maps, departure and
arrival times and service information, please contact Transport Info on 131 500 or visit
transportnsw.info
Frequent bus services are available on Marion Road andParamatta Road located within 10 minute walk from the site.
Start walking today to achieve a goal of 10,000 steps per day!
Route Description
438 Abbotsford - City Martin Place
439 Mortlake - City Martin Place
L38 L39
PrePay OnlyAbbotsford - City Martin Place (Limited Stops)Mortlake - City Martin Place (Limited Stops)
436 Chiswick - Central Pitt St
L37 Haberfield - City Town Hall Limited Stop
445 Campsie - Balmain East Wharf via Leichhardt Marketplace
370 Leichhardt Marketplace - Coogee
480 Strathfield - Central Pitt St via Homebush Rd
483 Strathfield - Central Pitt St via South Strathfield
461 Burwood - City Domain
413 Campsie - City Martin Place
Light Rail
Marion Light Rail Station (100m away)
Train
Summer Hill Station (1.0km away)
Cycle
Service Line T2 Inner West Line
Distance 13 minute walk away
Average Frequency Every 15 minutes
Journey Time 6 minutes to Burwood9 minutes to Strathfield15 minutes to Central
Adult Opal card holders get a $2 discount for every transfer between train, ferry, bus or light rail as part of one journey
Routes
Service Line T2 Inner West Line
Distance 15 minute walk away
Average Frequency Every 15 minutes
Journey Time 8 minutes to Burwood11 minutes to Strathfield13 minutes to Central
Subject Site
There are many cycleways of low (green), moderate (pink)and high (brown) difficulty in the proximity of the site,providing connectivity to the City, Rozelle, Haberfield andMarrickville in the east, north, west and south respectively.
Average Frequency Every 12 minutes
Journey Time 31 minutes to Central
Lewisham Station (1.2km away)

18256_r01v03_190628
Appendix C
Traffic Survey Results


GPS -33.882781, 151.147616Date: North: AM:Weather: East: PM:Suburban: South: 1 AM:Customer: West: 30 PM:
All Vehicles
Period Start Period End U R SB U NB L U R L Hour Peak
7:00 7:15 0 3 64 0 161 4 0 4 3 1062
7:15 7:30 0 1 88 0 166 1 0 3 0 1079
7:30 7:45 0 0 80 0 203 4 0 1 1 1100 Peak
7:45 8:00 0 0 110 0 156 6 0 2 1 1085
8:00 8:15 0 0 78 0 167 3 0 6 2 1076
8:15 8:30 0 1 88 0 183 3 0 4 1 1077
8:30 8:45 0 1 82 0 182 5 0 3 1 1060
8:45 9:00 1 1 117 0 140 3 0 3 1 1067
9:00 9:15 0 1 72 0 176 5 0 2 1 1024
9:15 9:30 0 0 84 0 169 4 0 5 1
9:30 9:45 1 1 95 0 179 2 0 2 1
9:45 10:00 0 0 84 0 135 1 0 1 2
14:30 14:45 0 1 143 0 114 2 0 6 2 1125
14:45 15:00 0 2 142 0 134 2 0 3 3 1164
15:00 15:15 0 3 134 0 97 3 0 6 3 1169
15:15 15:30 0 2 167 0 147 3 0 4 2 1240
15:30 15:45 0 4 174 0 120 2 0 5 2 1224
15:45 16:00 0 2 154 0 127 2 0 2 4 1206
16:00 16:15 0 0 163 0 144 4 0 4 2 1225
16:15 16:30 0 1 186 0 112 3 0 3 4 1233
16:30 16:45 0 1 162 0 121 4 0 0 1 1248
16:45 17:00 0 2 169 0 129 6 0 1 3 1289 Peak
17:00 17:15 1 2 166 0 139 5 0 6 6 1287
17:15 17:30 1 0 169 0 139 8 0 2 5
17:30 17:45 1 3 170 0 141 9 0 1 5
17:45 18:00 1 1 160 1 131 5 0 5 4
Time North Approach Foster St South Approach Foster St West Approach Walter St Hourly Total
Leichart Foster St Traffic Peak
7:30 AM-8:30 AMTTPP Walter St 4:45 PM-5:45 PM
7:00 AM-10:00 AMOvercast N/A 2:30 PM-6:00 PM
TURNING MOVEMENT SURVEYIntersection of Walter St and Foster St, Leichart
Thu 13/09/18 Foster St Survey Period

Period Start Period End U R SB U NB L U R L7:30 8:30 0 1 356 0 709 16 0 13 5 110016:45 17:45 3 7 674 0 548 28 0 10 19 1289
Note: Site sketch is for illustrating traffic flows. Direction is indicative only, drawing is not to scale and not an exact streets configuration.Graphic
TotalLightHeavy
Peak Time North Approach Foster St South Approach Foster St West Approach Walter St Peak total
Foster St
North
Wal
ter
St
Foster St
0 1 334
013
5
015 695
0 1 356
013
5
016 709
AM Peak7:30 AM-8:30 AM
0 0 22
01 14
00
0
Foster St
North
Wal
ter
St
Foster St
3 6 659
010
19
028 540
3 7 674
010
19
028 548
PM Peak4:45 PM-5:45 PM
0 1 15
00 8
00
0

Light Vehicles
Period Start Period End U R SB U NB L U R L7:00 7:15 0 3 61 0 156 4 0 4 2
7:15 7:30 0 0 82 0 158 1 0 3 0
7:30 7:45 0 0 71 0 196 3 0 1 1
7:45 8:00 0 0 105 0 156 6 0 2 1
8:00 8:15 0 0 72 0 162 3 0 6 2
8:15 8:30 0 1 86 0 181 3 0 4 1
8:30 8:45 0 1 79 0 178 5 0 3 1
8:45 9:00 1 1 110 0 139 2 0 3 1
9:00 9:15 0 1 68 0 171 5 0 2 1
9:15 9:30 0 0 84 0 163 4 0 5 1
9:30 9:45 1 1 90 0 173 2 0 2 1
9:45 10:00 0 0 80 0 135 1 0 1 2
14:30 14:45 0 1 138 0 112 2 0 5 2
14:45 15:00 0 2 138 0 129 2 0 3 3
15:00 15:15 0 3 126 0 96 3 0 6 3
15:15 15:30 0 2 158 0 144 3 0 4 2
15:30 15:45 0 4 169 0 119 2 0 3 2
15:45 16:00 0 2 149 0 125 2 0 2 4
16:00 16:15 0 0 161 0 137 4 0 4 2
16:15 16:30 0 1 179 0 107 3 0 3 4
16:30 16:45 0 1 156 0 119 4 0 0 1
16:45 17:00 0 2 163 0 129 6 0 1 3
17:00 17:15 1 1 162 0 135 5 0 6 6
17:15 17:30 1 0 166 0 138 8 0 2 5
17:30 17:45 1 3 168 0 138 9 0 1 5
17:45 18:00 1 1 159 1 126 5 0 5 4
Period Start Period End U R SB U NB L U R L7:30 8:30 0 1 334 0 695 15 0 13 5 106316:45 17:45 3 6 659 0 540 28 0 10 19 1265
Peak total
Peak Time North Approach Foster St South Approach Foster St West Approach Walter St
Time North Approach Foster St South Approach Foster St West Approach Walter St

Heavy Vehicles
Period Start Period End U R SB U NB L U R L7:00 7:15 0 0 3 0 5 0 0 0 1
7:15 7:30 0 1 6 0 8 0 0 0 0
7:30 7:45 0 0 7 0 6 1 0 0 0
7:45 8:00 0 0 3 0 0 0 0 0 0
8:00 8:15 0 0 3 0 4 0 0 0 0
8:15 8:30 0 0 1 0 2 0 0 0 0
8:30 8:45 0 0 2 0 4 0 0 0 0
8:45 9:00 0 0 5 0 1 1 0 0 0
9:00 9:15 0 0 2 0 5 0 0 0 0
9:15 9:30 0 0 0 0 6 0 0 0 0
9:30 9:45 0 0 5 0 6 0 0 0 0
9:45 10:00 0 0 4 0 0 0 0 0 0
14:30 14:45 0 0 4 0 2 0 0 1 0
14:45 15:00 0 0 3 0 2 0 0 0 0
15:00 15:15 0 0 6 0 1 0 0 0 0
15:15 15:30 0 0 3 0 3 0 0 0 0
15:30 15:45 0 0 5 0 1 0 0 2 0
15:45 16:00 0 0 5 0 2 0 0 0 0
16:00 16:15 0 0 2 0 3 0 0 0 0
16:15 16:30 0 0 6 0 0 0 0 0 0
16:30 16:45 0 0 4 0 2 0 0 0 0
16:45 17:00 0 0 3 0 0 0 0 0 0
17:00 17:15 0 1 3 0 1 0 0 0 0
17:15 17:30 0 0 3 0 1 0 0 0 0
17:30 17:45 0 0 2 0 1 0 0 0 0
17:45 18:00 0 0 1 0 3 0 0 0 0
Period Start Period End U R SB U NB L U R L7:30 8:30 0 0 22 0 14 1 0 0 0 3716:45 17:45 0 1 15 0 8 0 0 0 0 24
Peak Time North Approach Foster St South Approach Foster St West Approach Walter St Peak total
Time North Approach Foster St South Approach Foster St West Approach Walter St

Bus
Period Start Period End U R SB U NB L U R L7:00 7:15 0 0 0 0 0 0 0 0 0
7:15 7:30 0 0 0 0 0 0 0 0 0
7:30 7:45 0 0 2 0 1 0 0 0 0
7:45 8:00 0 0 2 0 0 0 0 0 0
8:00 8:15 0 0 3 0 1 0 0 0 0
8:15 8:30 0 0 1 0 0 0 0 0 0
8:30 8:45 0 0 1 0 0 0 0 0 0
8:45 9:00 0 0 2 0 0 0 0 0 0
9:00 9:15 0 0 2 0 0 0 0 0 0
9:15 9:30 0 0 0 0 0 0 0 0 0
9:30 9:45 0 0 0 0 0 0 0 0 0
9:45 10:00 0 0 0 0 0 0 0 0 0
14:30 14:45 0 0 1 0 0 0 0 0 0
14:45 15:00 0 0 1 0 3 0 0 0 0
15:00 15:15 0 0 2 0 0 0 0 0 0
15:15 15:30 0 0 6 0 0 0 0 0 0
15:30 15:45 0 0 0 0 0 0 0 0 0
15:45 16:00 0 0 0 0 0 0 0 0 0
16:00 16:15 0 0 0 0 4 0 0 0 0
16:15 16:30 0 0 1 0 5 0 0 0 0
16:30 16:45 0 0 2 0 0 0 0 0 0
16:45 17:00 0 0 3 0 0 0 0 0 0
17:00 17:15 0 0 1 0 3 0 0 0 0
17:15 17:30 0 0 0 0 0 0 0 0 0
17:30 17:45 0 0 0 0 2 0 0 0 0
17:45 18:00 0 0 0 0 2 0 0 0 0
Period Start Period End U R SB U NB L U R L7:30 8:30 0 0 8 0 2 0 0 0 0 1016:45 17:45 0 0 4 0 5 0 0 0 0 9
Time North Approach Foster St South Approach Foster St West Approach Walter St
Peak Time North Approach Foster St South Approach Foster St West Approach Walter St Peak total

18256_r01v03_190628
Appendix D
Intersection Operation Modelling Results

MOVEMENT SUMMARYSite: 101v [1. Foster St/ Walter St EX AM]
18256 245 Marion Street LeichhardtSite Category: 2018 Existing BaseGiveway / Yield (Two-Way)
Movement Performance - VehiclesDemand Flows 95% Back of QueueMov
ID Turn Deg.
SatnAverage
Delay Level ofService
Prop. Queued
Effective Stop Rate
Aver. No.Cycles
AverageSpeed Total HV Vehicles Distance
veh/h % v/c sec veh m km/hSouth: Foster Street1 L2 17 2.0 0.397 4.6 LOS A 0.0 0.0 0.00 0.01 0.00 48.22 T1 746 2.0 0.397 0.0 LOS A 0.0 0.0 0.00 0.01 0.00 49.8Approach 763 2.0 0.397 0.1 NA 0.0 0.0 0.00 0.01 0.00 49.7
North: Foster Street8 T1 375 6.0 0.201 0.0 LOS A 0.0 0.2 0.01 0.00 0.01 49.99 R2 1 6.0 0.201 9.8 LOS A 0.0 0.2 0.01 0.00 0.01 48.1Approach 376 6.0 0.201 0.1 NA 0.0 0.2 0.01 0.00 0.01 49.9
West: Walter Street10 L2 5 0.0 0.007 7.9 LOS A 0.0 0.2 0.57 0.63 0.57 39.612 R2 14 0.0 0.036 12.2 LOS A 0.1 0.8 0.71 0.87 0.71 31.8Approach 19 0.0 0.036 11.0 LOS A 0.1 0.8 0.67 0.80 0.67 34.1
All Vehicles 1158 3.3 0.397 0.3 NA 0.1 0.8 0.01 0.02 0.01 49.5
Site Level of Service (LOS) Method: Delay (RTA NSW). Site LOS Method is specified in the Parameter Settings dialog (Site tab).Vehicle movement LOS values are based on average delay per movement.Minor Road Approach LOS values are based on average delay for all vehicle movements.NA: Intersection LOS and Major Road Approach LOS values are Not Applicable for two-way sign control since the average delayis not a good LOS measure due to zero delays associated with major road movements.SIDRA Standard Delay Model is used. Control Delay includes Geometric Delay.Gap-Acceptance Capacity: SIDRA Standard (Akçelik M3D).HV (%) values are calculated for All Movement Classes of All Heavy Vehicle Model Designation.
SIDRA INTERSECTION 8.0 | Copyright © 2000-2019 Akcelik and Associates Pty Ltd | sidrasolutions.comOrganisation: TTPP - THE TRANSPORT PLANNING PARTNERSHIP | Processed: Thursday, 27 June 2019 9:22:14 AMProject: X:\18256 245 Marion Street Leichhardt\07 Modelling Files\18256_Existing Base 2018.sip8

MOVEMENT SUMMARYSite: 1 [1. Marion St/Foster St EX AM]
18256 245 Marion Street LeichhardtSite Category: 2018 Existing BaseSignals - Fixed Time Coordinated Cycle Time = 100 seconds (Site User-Given Phase Times)
Movement Performance - VehiclesDemand Flows 95% Back of QueueMov
ID Turn Deg.
SatnAverage
Delay Level ofService
Prop. Queued
Effective Stop Rate
Aver. No.Cycles
AverageSpeed Total HV Vehicles Distance
veh/h % v/c sec veh m km/hSouth: Foster Street1 L2 92 3.4 0.973 71.0 LOS F 45.5 322.3 0.96 1.23 1.45 15.12 T1 631 1.2 0.973 67.5 LOS E 45.5 322.3 0.96 1.23 1.48 13.13 R2 118 0.0 0.973 85.5 LOS F 11.2 78.4 1.00 1.23 1.81 12.6Approach 840 1.3 0.973 70.4 LOS E 45.5 322.3 0.97 1.23 1.52 13.2
East: Marion Street4 L2 77 6.8 0.117 26.8 LOS B 2.5 18.2 0.69 0.71 0.69 25.45 T1 272 3.1 0.376 20.2 LOS B 8.7 62.8 0.71 0.60 0.71 30.1Approach 348 3.9 0.376 21.7 LOS B 8.7 62.8 0.70 0.63 0.70 29.0
North: Foster Street7 L2 9 0.0 0.204 24.2 LOS B 5.0 35.2 0.67 0.57 0.67 27.78 T1 312 1.7 0.712 32.8 LOS C 9.9 70.1 0.84 0.73 0.88 21.09 R2 41 2.6 0.712 49.9 LOS D 9.9 70.1 1.00 0.88 1.09 18.0Approach 362 1.7 0.712 34.5 LOS C 9.9 70.1 0.85 0.74 0.90 20.7
West: Marion Street10 L2 235 0.0 1.003 71.1 LOS F 68.8 489.4 1.00 1.27 1.49 13.911 T1 1007 2.6 1.003 70.1 LOS E 68.8 489.4 1.00 1.28 1.54 14.712 R2 264 1.2 1.003 82.4 LOS F 43.8 311.9 1.00 1.30 1.64 12.7Approach 1506 2.0 1.003 72.4 LOS F 68.8 489.4 1.00 1.28 1.55 14.2
All Vehicles 3057 2.0 1.003 61.6 LOS E 68.8 489.4 0.94 1.13 1.37 15.4
Site Level of Service (LOS) Method: Delay (RTA NSW). Site LOS Method is specified in the Parameter Settings dialog (Site tab).Vehicle movement LOS values are based on average delay per movement.Intersection and Approach LOS values are based on average delay for all vehicle movements.SIDRA Standard Delay Model is used. Control Delay includes Geometric Delay.Gap-Acceptance Capacity: SIDRA Standard (Akçelik M3D).HV (%) values are calculated for All Movement Classes of All Heavy Vehicle Model Designation.
Movement Performance - PedestriansAverage Back of QueueMov
ID DescriptionDemand
Flow Average
Delay Level ofService
Prop. Queued
Effective Stop RatePedestrian Distance
ped/h sec ped mP1 South Full Crossing 53 44.3 LOS E 0.1 0.1 0.94 0.94P2 East Full Crossing 53 44.3 LOS E 0.1 0.1 0.94 0.94P3 North Full Crossing 53 44.3 LOS E 0.1 0.1 0.94 0.94P4 West Full Crossing 53 44.3 LOS E 0.1 0.1 0.94 0.94
All Pedestrians 211 44.3 LOS E 0.94 0.94
Level of Service (LOS) Method: SIDRA Pedestrian LOS Method (Based on Average Delay)Pedestrian movement LOS values are based on average delay per pedestrian movement.Intersection LOS value for Pedestrians is based on average delay for all pedestrian movements.
SIDRA INTERSECTION 8.0 | Copyright © 2000-2019 Akcelik and Associates Pty Ltd | sidrasolutions.comOrganisation: TTPP - THE TRANSPORT PLANNING PARTNERSHIP | Processed: Thursday, 27 June 2019 9:22:14 AM

MOVEMENT SUMMARYSite: 101v [2. Foster St/ Walter St EX PM]
18256 245 Marion Street LeichhardtSite Category: 2018 Existing BaseGiveway / Yield (Two-Way)
Movement Performance - VehiclesDemand Flows 95% Back of QueueMov
ID Turn Deg.
SatnAverage
Delay Level ofService
Prop. Queued
Effective Stop Rate
Aver. No.Cycles
AverageSpeed Total HV Vehicles Distance
veh/h % v/c sec veh m km/hSouth: Foster Street1 L2 29 1.0 0.314 4.6 LOS A 0.0 0.0 0.00 0.03 0.00 48.02 T1 577 1.0 0.314 0.0 LOS A 0.0 0.0 0.00 0.03 0.00 49.6Approach 606 1.0 0.314 0.2 NA 0.0 0.0 0.00 0.03 0.00 49.5
North: Foster Street8 T1 709 2.0 0.380 0.1 LOS A 0.2 1.8 0.03 0.01 0.04 49.59 R2 11 2.0 0.380 9.0 LOS A 0.2 1.8 0.03 0.01 0.04 48.0Approach 720 2.0 0.380 0.3 NA 0.2 1.8 0.03 0.01 0.04 49.5
West: Walter Street10 L2 20 0.0 0.021 6.8 LOS A 0.1 0.6 0.51 0.61 0.51 40.612 R2 11 0.0 0.036 14.9 LOS B 0.1 0.7 0.78 0.90 0.78 29.6Approach 31 0.0 0.036 9.6 LOS A 0.1 0.7 0.60 0.71 0.60 36.9
All Vehicles 1357 1.5 0.380 0.5 NA 0.2 1.8 0.03 0.03 0.04 49.1
Site Level of Service (LOS) Method: Delay (RTA NSW). Site LOS Method is specified in the Parameter Settings dialog (Site tab).Vehicle movement LOS values are based on average delay per movement.Minor Road Approach LOS values are based on average delay for all vehicle movements.NA: Intersection LOS and Major Road Approach LOS values are Not Applicable for two-way sign control since the average delayis not a good LOS measure due to zero delays associated with major road movements.SIDRA Standard Delay Model is used. Control Delay includes Geometric Delay.Gap-Acceptance Capacity: SIDRA Standard (Akçelik M3D).HV (%) values are calculated for All Movement Classes of All Heavy Vehicle Model Designation.
SIDRA INTERSECTION 8.0 | Copyright © 2000-2019 Akcelik and Associates Pty Ltd | sidrasolutions.comOrganisation: TTPP - THE TRANSPORT PLANNING PARTNERSHIP | Processed: Thursday, 27 June 2019 9:22:14 AMProject: X:\18256 245 Marion Street Leichhardt\07 Modelling Files\18256_Existing Base 2018.sip8

MOVEMENT SUMMARYSite: 4 [2. Marion St/Foster St EX PM ]
18256 245 Marion Street LeichhardtSite Category: 2018 Existing BaseSignals - Fixed Time Coordinated Cycle Time = 110 seconds (Site User-Given Phase Times)
Movement Performance - VehiclesDemand Flows 95% Back of QueueMov
ID Turn Deg.
SatnAverage
Delay Level ofService
Prop. Queued
Effective Stop Rate
Aver. No.Cycles
AverageSpeed Total HV Vehicles Distance
veh/h % v/c sec veh m km/hSouth: Foster Street1 L2 242 0.0 0.983 69.9 LOS E 43.0 301.9 0.90 1.12 1.33 15.12 T1 491 0.6 0.983 69.4 LOS E 43.0 301.9 0.92 1.13 1.40 12.73 R2 66 0.0 0.983 91.6 LOS F 11.7 82.0 1.00 1.19 1.73 12.1Approach 799 0.4 0.983 71.4 LOS F 43.0 301.9 0.92 1.13 1.41 13.3
East: Marion Street4 L2 113 2.8 0.545 37.2 LOS C 14.6 105.1 0.87 0.77 0.87 22.55 T1 589 3.0 0.545 31.3 LOS C 15.8 113.7 0.86 0.75 0.86 24.5Approach 702 3.0 0.545 32.3 LOS C 15.8 113.7 0.86 0.76 0.86 24.2
North: Foster Street7 L2 17 0.0 0.920 56.0 LOS D 36.2 253.6 0.95 1.06 1.23 16.58 T1 577 0.2 0.920 51.5 LOS D 36.2 253.6 0.95 1.06 1.23 16.09 R2 84 0.0 0.920 78.7 LOS F 5.7 39.9 1.00 1.07 1.68 12.4Approach 678 0.2 0.920 55.0 LOS D 36.2 253.6 0.95 1.06 1.29 15.4
West: Marion Street10 L2 146 0.0 0.207 23.8 LOS B 5.5 38.8 0.64 0.69 0.64 26.311 T1 407 1.6 1.034 91.9 LOS F 46.3 327.4 0.98 1.37 1.72 10.912 R2 161 0.0 1.034 101.6 LOS F 46.3 327.4 1.00 1.42 1.79 10.0Approach 715 0.9 1.034 80.2 LOS F 46.3 327.4 0.91 1.24 1.51 12.0
All Vehicles 2894 1.1 1.034 60.2 LOS E 46.3 327.4 0.91 1.05 1.27 15.1
Site Level of Service (LOS) Method: Delay (RTA NSW). Site LOS Method is specified in the Parameter Settings dialog (Site tab).Vehicle movement LOS values are based on average delay per movement.Intersection and Approach LOS values are based on average delay for all vehicle movements.SIDRA Standard Delay Model is used. Control Delay includes Geometric Delay.Gap-Acceptance Capacity: SIDRA Standard (Akçelik M3D).HV (%) values are calculated for All Movement Classes of All Heavy Vehicle Model Designation.
Movement Performance - PedestriansAverage Back of QueueMov
ID DescriptionDemand
Flow Average
Delay Level ofService
Prop. Queued
Effective Stop RatePedestrian Distance
ped/h sec ped mP1 South Full Crossing 53 49.3 LOS E 0.2 0.2 0.95 0.95P2 East Full Crossing 53 49.3 LOS E 0.2 0.2 0.95 0.95P3 North Full Crossing 53 49.3 LOS E 0.2 0.2 0.95 0.95P4 West Full Crossing 53 49.3 LOS E 0.2 0.2 0.95 0.95
All Pedestrians 211 49.3 LOS E 0.95 0.95
Level of Service (LOS) Method: SIDRA Pedestrian LOS Method (Based on Average Delay)Pedestrian movement LOS values are based on average delay per pedestrian movement.Intersection LOS value for Pedestrians is based on average delay for all pedestrian movements.
SIDRA INTERSECTION 8.0 | Copyright © 2000-2019 Akcelik and Associates Pty Ltd | sidrasolutions.comOrganisation: TTPP - THE TRANSPORT PLANNING PARTNERSHIP | Processed: Thursday, 27 June 2019 9:22:14 AM

MOVEMENT SUMMARYSite: 101v [1. Foster St/ Walter St Future AM]
18256 245 Marion Street LeichhardtSite Category: Future CaseGiveway / Yield (Two-Way)
Movement Performance - VehiclesDemand Flows 95% Back of QueueMov
ID Turn Deg.
SatnAverage
Delay Level ofService
Prop. Queued
Effective Stop Rate
Aver. No.Cycles
AverageSpeed Total HV Vehicles Distance
veh/h % v/c sec veh m km/hSouth: Foster Street1 L2 17 2.0 0.397 4.6 LOS A 0.0 0.0 0.00 0.01 0.00 48.22 T1 746 2.0 0.397 0.0 LOS A 0.0 0.0 0.00 0.01 0.00 49.8Approach 763 2.0 0.397 0.1 NA 0.0 0.0 0.00 0.01 0.00 49.7
North: Foster Street8 T1 377 6.0 0.202 0.0 LOS A 0.0 0.2 0.01 0.00 0.01 49.99 R2 1 6.0 0.202 9.8 LOS A 0.0 0.2 0.01 0.00 0.01 48.1Approach 378 6.0 0.202 0.1 NA 0.0 0.2 0.01 0.00 0.01 49.9
West: Walter Street10 L2 9 0.0 0.012 8.0 LOS A 0.0 0.3 0.57 0.65 0.57 39.512 R2 14 0.0 0.036 12.3 LOS A 0.1 0.8 0.71 0.87 0.71 31.7Approach 23 0.0 0.036 10.5 LOS A 0.1 0.8 0.66 0.78 0.66 35.1
All Vehicles 1164 3.3 0.397 0.3 NA 0.1 0.8 0.02 0.02 0.02 49.4
Site Level of Service (LOS) Method: Delay (RTA NSW). Site LOS Method is specified in the Parameter Settings dialog (Site tab).Vehicle movement LOS values are based on average delay per movement.Minor Road Approach LOS values are based on average delay for all vehicle movements.NA: Intersection LOS and Major Road Approach LOS values are Not Applicable for two-way sign control since the average delayis not a good LOS measure due to zero delays associated with major road movements.SIDRA Standard Delay Model is used. Control Delay includes Geometric Delay.Gap-Acceptance Capacity: SIDRA Standard (Akçelik M3D).HV (%) values are calculated for All Movement Classes of All Heavy Vehicle Model Designation.
SIDRA INTERSECTION 8.0 | Copyright © 2000-2019 Akcelik and Associates Pty Ltd | sidrasolutions.comOrganisation: TTPP - THE TRANSPORT PLANNING PARTNERSHIP | Processed: Thursday, 27 June 2019 9:22:15 AMProject: X:\18256 245 Marion Street Leichhardt\07 Modelling Files\18256_Existing Base 2018.sip8

MOVEMENT SUMMARYSite: 1 [1. Marion St/Foster St Future AM]
18256 245 Marion Street LeichhardtSite Category: Future CaseSignals - Fixed Time Coordinated Cycle Time = 100 seconds (Site User-Given Phase Times)
Movement Performance - VehiclesDemand Flows 95% Back of QueueMov
ID Turn Deg.
SatnAverage
Delay Level ofService
Prop. Queued
Effective Stop Rate
Aver. No.Cycles
AverageSpeed Total HV Vehicles Distance
veh/h % v/c sec veh m km/hSouth: Foster Street1 L2 95 3.3 0.979 73.5 LOS F 47.1 333.5 0.97 1.26 1.48 14.72 T1 631 1.2 0.979 69.8 LOS E 47.1 333.5 0.97 1.26 1.50 12.83 R2 118 0.0 0.979 87.3 LOS F 10.8 76.1 1.00 1.23 1.84 12.4Approach 843 1.2 0.979 72.7 LOS F 47.1 333.5 0.97 1.25 1.55 12.9
East: Marion Street4 L2 77 6.8 0.117 26.8 LOS B 2.5 18.2 0.69 0.71 0.69 25.45 T1 281 3.0 0.390 20.4 LOS B 9.1 65.3 0.71 0.61 0.71 30.1Approach 358 3.8 0.390 21.7 LOS B 9.1 65.3 0.71 0.63 0.71 29.0
North: Foster Street7 L2 9 0.0 0.206 24.2 LOS B 5.0 35.6 0.67 0.57 0.67 27.78 T1 312 1.7 0.719 32.7 LOS C 9.9 70.3 0.84 0.73 0.89 21.09 R2 43 2.4 0.719 50.1 LOS D 9.9 70.3 1.00 0.89 1.10 17.9Approach 364 1.7 0.719 34.5 LOS C 9.9 70.3 0.85 0.74 0.91 20.7
West: Marion Street10 L2 235 0.0 1.011 76.1 LOS F 71.5 508.6 1.00 1.30 1.54 13.211 T1 1013 2.6 1.011 75.1 LOS F 71.5 508.6 1.00 1.31 1.58 14.012 R2 265 1.2 1.011 87.6 LOS F 45.0 320.1 1.00 1.33 1.68 12.1Approach 1513 1.9 1.011 77.5 LOS F 71.5 508.6 1.00 1.31 1.59 13.5
All Vehicles 3078 1.9 1.011 64.6 LOS E 71.5 508.6 0.94 1.15 1.40 14.9
Site Level of Service (LOS) Method: Delay (RTA NSW). Site LOS Method is specified in the Parameter Settings dialog (Site tab).Vehicle movement LOS values are based on average delay per movement.Intersection and Approach LOS values are based on average delay for all vehicle movements.SIDRA Standard Delay Model is used. Control Delay includes Geometric Delay.Gap-Acceptance Capacity: SIDRA Standard (Akçelik M3D).HV (%) values are calculated for All Movement Classes of All Heavy Vehicle Model Designation.
Movement Performance - PedestriansAverage Back of QueueMov
ID DescriptionDemand
Flow Average
Delay Level ofService
Prop. Queued
Effective Stop RatePedestrian Distance
ped/h sec ped mP1 South Full Crossing 53 44.3 LOS E 0.1 0.1 0.94 0.94P2 East Full Crossing 53 44.3 LOS E 0.1 0.1 0.94 0.94P3 North Full Crossing 53 44.3 LOS E 0.1 0.1 0.94 0.94P4 West Full Crossing 53 44.3 LOS E 0.1 0.1 0.94 0.94
All Pedestrians 211 44.3 LOS E 0.94 0.94
Level of Service (LOS) Method: SIDRA Pedestrian LOS Method (Based on Average Delay)Pedestrian movement LOS values are based on average delay per pedestrian movement.Intersection LOS value for Pedestrians is based on average delay for all pedestrian movements.
SIDRA INTERSECTION 8.0 | Copyright © 2000-2019 Akcelik and Associates Pty Ltd | sidrasolutions.comOrganisation: TTPP - THE TRANSPORT PLANNING PARTNERSHIP | Processed: Thursday, 27 June 2019 9:22:15 AM

MOVEMENT SUMMARYSite: 101v [2. Foster St/ Walter St Future PM]
18256 245 Marion Street LeichhardtSite Category: Future CaseGiveway / Yield (Two-Way)
Movement Performance - VehiclesDemand Flows 95% Back of QueueMov
ID Turn Deg.
SatnAverage
Delay Level ofService
Prop. Queued
Effective Stop Rate
Aver. No.Cycles
AverageSpeed Total HV Vehicles Distance
veh/h % v/c sec veh m km/hSouth: Foster Street1 L2 29 1.0 0.314 4.6 LOS A 0.0 0.0 0.00 0.03 0.00 48.02 T1 577 1.0 0.314 0.0 LOS A 0.0 0.0 0.00 0.03 0.00 49.6Approach 606 1.0 0.314 0.2 NA 0.0 0.0 0.00 0.03 0.00 49.5
North: Foster Street8 T1 712 2.0 0.381 0.1 LOS A 0.2 1.8 0.03 0.01 0.04 49.59 R2 11 2.0 0.381 9.0 LOS A 0.2 1.8 0.03 0.01 0.04 48.0Approach 722 2.0 0.381 0.3 NA 0.2 1.8 0.03 0.01 0.04 49.5
West: Walter Street10 L2 24 0.0 0.025 6.8 LOS A 0.1 0.7 0.51 0.62 0.51 40.612 R2 11 0.0 0.036 15.0 LOS B 0.1 0.7 0.78 0.90 0.78 29.6Approach 35 0.0 0.036 9.3 LOS A 0.1 0.7 0.59 0.71 0.59 37.3
All Vehicles 1363 1.5 0.381 0.5 NA 0.2 1.8 0.03 0.03 0.04 49.1
Site Level of Service (LOS) Method: Delay (RTA NSW). Site LOS Method is specified in the Parameter Settings dialog (Site tab).Vehicle movement LOS values are based on average delay per movement.Minor Road Approach LOS values are based on average delay for all vehicle movements.NA: Intersection LOS and Major Road Approach LOS values are Not Applicable for two-way sign control since the average delayis not a good LOS measure due to zero delays associated with major road movements.SIDRA Standard Delay Model is used. Control Delay includes Geometric Delay.Gap-Acceptance Capacity: SIDRA Standard (Akçelik M3D).HV (%) values are calculated for All Movement Classes of All Heavy Vehicle Model Designation.
SIDRA INTERSECTION 8.0 | Copyright © 2000-2019 Akcelik and Associates Pty Ltd | sidrasolutions.comOrganisation: TTPP - THE TRANSPORT PLANNING PARTNERSHIP | Processed: Thursday, 27 June 2019 9:22:15 AMProject: X:\18256 245 Marion Street Leichhardt\07 Modelling Files\18256_Existing Base 2018.sip8

MOVEMENT SUMMARYSite: 4 [2. Marion St/Foster St Future PM]
18256 245 Marion Street LeichhardtSite Category: Future CaseSignals - Fixed Time Coordinated Cycle Time = 110 seconds (Site User-Given Phase Times)
Movement Performance - VehiclesDemand Flows 95% Back of QueueMov
ID Turn Deg.
SatnAverage
Delay Level ofService
Prop. Queued
Effective Stop Rate
Aver. No.Cycles
AverageSpeed Total HV Vehicles Distance
veh/h % v/c sec veh m km/hSouth: Foster Street1 L2 244 0.0 0.934 51.1 LOS D 32.9 230.8 0.84 0.96 1.11 18.72 T1 491 0.6 0.934 53.2 LOS D 32.9 230.8 0.89 1.01 1.22 15.33 R2 66 0.0 0.934 73.7 LOS F 13.7 96.5 1.00 1.12 1.48 14.3Approach 801 0.4 0.934 54.2 LOS D 32.9 230.8 0.88 1.00 1.21 16.2
East: Marion Street4 L2 113 2.8 0.549 37.3 LOS C 14.8 106.1 0.87 0.78 0.87 22.45 T1 595 3.0 0.549 31.4 LOS C 16.0 114.7 0.86 0.75 0.86 24.5Approach 707 3.0 0.549 32.3 LOS C 16.0 114.7 0.86 0.76 0.86 24.2
North: Foster Street7 L2 17 0.0 0.914 54.2 LOS D 34.2 239.6 0.93 1.04 1.20 16.88 T1 577 0.2 0.914 50.5 LOS D 34.2 239.6 0.93 1.04 1.22 16.29 R2 86 0.0 0.914 77.5 LOS F 7.1 50.0 1.00 1.09 1.63 12.7Approach 680 0.2 0.914 54.0 LOS D 34.2 239.6 0.94 1.05 1.27 15.6
West: Marion Street10 L2 146 0.0 0.209 23.8 LOS B 5.6 39.4 0.64 0.69 0.64 26.311 T1 413 1.5 1.047 99.5 LOS F 48.6 343.6 0.97 1.41 1.77 10.412 R2 163 0.0 1.047 110.2 LOS F 48.6 343.6 1.00 1.46 1.86 9.5Approach 722 0.9 1.047 86.6 LOS F 48.6 343.6 0.91 1.27 1.56 11.4
All Vehicles 2911 1.1 1.047 56.9 LOS E 48.6 343.6 0.90 1.02 1.23 15.7
Site Level of Service (LOS) Method: Delay (RTA NSW). Site LOS Method is specified in the Parameter Settings dialog (Site tab).Vehicle movement LOS values are based on average delay per movement.Intersection and Approach LOS values are based on average delay for all vehicle movements.SIDRA Standard Delay Model is used. Control Delay includes Geometric Delay.Gap-Acceptance Capacity: SIDRA Standard (Akçelik M3D).HV (%) values are calculated for All Movement Classes of All Heavy Vehicle Model Designation.
Movement Performance - PedestriansAverage Back of QueueMov
ID DescriptionDemand
Flow Average
Delay Level ofService
Prop. Queued
Effective Stop RatePedestrian Distance
ped/h sec ped mP1 South Full Crossing 53 49.3 LOS E 0.2 0.2 0.95 0.95P2 East Full Crossing 53 49.3 LOS E 0.2 0.2 0.95 0.95P3 North Full Crossing 53 49.3 LOS E 0.2 0.2 0.95 0.95P4 West Full Crossing 53 49.3 LOS E 0.2 0.2 0.95 0.95
All Pedestrians 211 49.3 LOS E 0.95 0.95
Level of Service (LOS) Method: SIDRA Pedestrian LOS Method (Based on Average Delay)Pedestrian movement LOS values are based on average delay per pedestrian movement.Intersection LOS value for Pedestrians is based on average delay for all pedestrian movements.
SIDRA INTERSECTION 8.0 | Copyright © 2000-2019 Akcelik and Associates Pty Ltd | sidrasolutions.comOrganisation: TTPP - THE TRANSPORT PLANNING PARTNERSHIP | Processed: Thursday, 27 June 2019 9:22:15 AM

The Transport Planning Partnership Suite 402 Level 4, 22 Atchison Street
St Leonards NSW 2065
P.O. Box 237 St Leonards NSW 1590
02 8437 7800
www.ttpp.net.au