appendix i - california state water resources control board · delineation report and all...
TRANSCRIPT

Appendix I
2012 and 2013 Wetland Characterizations

WETLAND DELINEATION
FOR THE FORMER AVILA TANK FARM AVILA BEACH, SAN LUIS OBISPO COUNTY, CALIFORNIA
APN 076-181-047 and 076-181-058
Prepared for:
Chevron Business and Real Estate Services 276 Tank Farm Road
San Luis Obispo, California 93401
Prepared By:
Padre Associates, Inc. 369 Pacific Street
San Luis Obispo, California 93401
March 2012 - Revised October 29, 2012
Project No. 1102-1741

CBRES Avila Tank Farm Wetland Delineation Project No. 1102-1741
- i -
Authenticity and Signature Page
Padre Associates, Inc. 369 Pacific Street
San Luis Obispo, California 93401
Padre Associates, Inc. hereby certifies that all statements furnished in the following Wetland Delineation Report and all supporting information required for this biological evaluation are true and correct to the best of our knowledge and belief. Further, we certify that all field surveys associated with this report were performed by Padre using standards accepted by San Luis Obispo County and accurately represent all information retained from field visits to the Former Avila Tank Farm, San Luis Obispo County, California. __________________________________ __________________________________
Thea Benson Jenifer Langford Project Manager/Project Biologist Senior Botanist
__________________________________
Eric K. Snelling Senior Project Manager

CBRES Avila Tank Farm Wetland Delineation Project No. 1102-1741
- ii -
EXECUTIVE SUMMARY
In December 2011, Padre Associates, Inc. (Padre) was retained by Chevron Business and Real Estate Services (CBRES) to identify and delineate the current geographic extent of State jurisdictional wetlands following the criteria established by the California Department of Fish and Game (DFG) and adopted by the California Coastal Commission (CCC) and federal wetlands administered by the Army Corps of Engineers (ACOE) and the Environmental Protection Agency (EPA) at the former Avila Tank Farm (Avila Tank Farm). Wetlands were mapped using the criteria to identify and delineate the current geographic extent of wetlands.
The Avila Tank Farm is comprised of approximately 95 acres located adjacent to the community of Avila Beach, San Luis Obispo County, California (refer to Figure 1). The objectives of the field surveys and this report are to: (1) introduce and briefly describe the contexts and results of prior delineations at the Avila Tank Farm; (2) explain the approach and methodology used by Padre in this wetland delineation; (3) provide technical results; and (4) discuss the pertinent regulatory contexts and issues at the federal, state, and local levels of jurisdiction.
During the December 2011 field effort, Padre delineated depressional features identified as Wetlands 1 through 7. With the exception of Wetland 7, the wetlands at the Avila Tank Farm are located at former aboveground storage tank sites that were historically excavated to facilitate their construction, which created depressional areas capable of ponding water. Additionally, the wetlands at the Avila Tank Farm (excluding Wetland 7) are fed by a drainage system that was constructed at the Avila Tank Farm as part of historical site operations. It was the ACOE final determination that would consider the wetlands not within federal jurisdiction during a site visit completed by Mr. Bruce Henderson, from the ACOE, on August 21, 2012. This determination was based on the conditions that these wetlands were isolated and man-induced as part of oil field operations in areas excavated in uplands. In summary, the former Avila Tank Farm consists of a total of 0.0 acres of federal-defined wetlands and 1.69 state defined wetlands, pending the state’s final determination.

CBRES Avila Tank Farm Wetland Delineation Project No. 1102-1741
- iii -
TABLE OF CONTENTS
Page
1.0 Introduction ........................................................................................................................ 1
1.1 Site Location ................................................................................................................... 1
1.2 Site Background .............................................................................................................. 1
2.0 Protection and Management of Wetlands ........................................................................... 2
2.1 Federal Agencies ............................................................................................................ 2
2.1.1 Regulations ........................................................................................................... 2 2.1.2 Definitions and Classifications .............................................................................. 2
2.2 State Agencies ................................................................................................................ 4
2.2.1 Regulations ........................................................................................................... 4 2.2.2 Definitions and Classifications .............................................................................. 5
3.0 Methods ............................................................................................................................. 5
3.1 Literature Review ............................................................................................................ 5
3.2 Field Delineation Methods ............................................................................................... 6
4.0 Results ............................................................................................................................... 8
4.1 Summaries of Previous Reports ...................................................................................... 8
4.2 Padre 2011 – Delineation of Wetlands ............................................................................ 9
4.2.1 Site Description ..................................................................................................... 9 4.2.2 Specific Project Area Findings .............................................................................10
5.0 Summary...........................................................................................................................14
6.0 Literature Cited .................................................................................................................16

CBRES Avila Tank Farm Wetland Delineation Project No. 1102-1741
- iv -
TABLES
1 − U.S. Fish & Wildlife Service plant indicator status (Reed, 1988, 1993)
FIGURES
1 – Site Location
2 – Site Plan Showing Wetlands
APPENDICES
Appendix A – Site Photographs
Appendix B – Wetland Data Forms
Appendix C – NRCS Soil Survey Results

CBRES Avila Tank Farm Wetland Delineation Project No. 1102-1741
- 1 -
1.0 INTRODUCTION
In December 2011, Padre Associates, Inc. (Padre) was retained by Chevron Business and Real Estate Services (CBRES) to identify and delineate the current geographic extent of state jurisdictional wetlands, following the criteria established by the California Department of Fish and Game (CDFG) and adopted by the California Coastal Commission (CCC), and federal wetlands administered by the Army Corps of Engineers (ACOE) and Environmental Protection Agency (EPA) at the Former Avila Tank Farm (Avila Tank Farm).
The following report provides results of the delineation surveys conducted by Padre on December 7, 8, and 15, 2011, as well as a site visit by Mr. Bruce Henderson from the ACOE completed on August 21, 2012. This report has been developed using: (a) current Los Angeles District of the ACOE and EPA guidance pertaining to jurisdictional delineations; (b) 2011 field-based observations of site conditions at the Avila Tank Farm; and (c) consideration of several previous wetland identification and delineation studies at the Avila Tank Farm. The results and recommendations offered in this report are subject to final review and approval by the ACOE and the CCC.
The objectives of the field surveys and this report are to: (1) introduce and briefly describe the contexts and results of prior delineations at the Avila Tank Farm; (2) explain the approach and methodology used by Padre in this wetland delineation; (3) provide technical results; and (4) discuss the pertinent regulatory issues at the federal, state, and local levels of jurisdiction.
1.1 SITE LOCATION
The Avila Tank Farm consists of approximately 95 acres located adjacent to the community of Avila Beach, San Luis Obispo County, California. Please refer to Figure 1 – Site Location. The property, owned by Union Oil of California (a subsidiary of Chevron Corporation) is located in an unincorporated portion of San Luis Obispo County. The property is bordered on the north by Avila Beach Drive, on the east by an undeveloped hillside and marine terrace, on the south by the Pacific Ocean, and on the west by the community of Avila Beach. The Avila Tank Farm is designated by the County of San Luis Obispo as Assessor Parcel Numbers (APN) 076-181-047 and -058.
1.2 SITE BACKGROUND
The Avila Tank Farm has served as an accumulation and transfer point for petroleum from oil fields in Santa Barbara County, a refinery, and a petroleum storage facility. It was slowly withdrawn from operation during the later decades of the twentieth century, and the last storage tanks were removed from operation by the late 1990s.

CBRES Avila Tank Farm Wetland Delineation Project No. 1102-1741
- 2 -
2.0 PROTECTION AND MANAGEMENT OF WETLANDS
Wetlands consist of areas that are inundated or saturated by surface or groundwater long enough to support vegetation typically adapted for life in saturated soil conditions. Wetlands, however, have a variety of technical definitions described by resource agencies that protect such wetlands. These agencies and their wetland classifications are further described below.
2.1 FEDERAL AGENCIES
2.1.1 Regulations
Clean Water Act, Section 404. The Clean Water Act (CWA) seeks to protect the nation’s water from pollution by setting water quality standards for surface water and by limiting the discharge of effluents into waters of the United States (WoUS). Section 404 of the CWA is the primary vehicle for federal regulation of activities that occur in wetlands, and is jointly administered by the ACOE and the EPA. The EPA enforces water quality standards and the ACOE is responsible for the issuance of permits for the placement of dredged or fill material into WoUS pursuant to Section 404 of the Clean Water Act (33 USC 1344). The United States Fish and Wildlife Service (USFWS) plays an important advisory role when enforcing the protection of federal wetlands. Wetlands are vital for sustaining fish and wildlife populations including plants and animals listed under the Endangered Species Act, which is administered by the USFWS through the Endangered Species Act, Fish and Wildlife Coordination Act, Fish and Wildlife Act of 1956, Anadromous Fish Conservation Act, and the Migratory Bird Treaty Act.
Clean Water Act, Section 401. The CWA Section 401 water quality certification provides states and authorized tribes an effective tool to help protect water quality. Refer to Section 2.3 State Regulations.
2.1.2 Definitions and Classifications
Army Corps of Engineers (ACOE). The ACOE utilizes the Environmental Laboratory Corps of Engineers Wetland Delineation Manual (1987), herein referred to as 1987 ACOE Manual, to determine which areas qualify as federal wetlands. The ACOE defines a wetland using a “three parameter definition” because three key parameters (hydrology, soil, and vegetation) must all occur to be classified as a federal wetland.
The 1987 ACOE Manual definition reads as follows:
“a. Definition: The ACOE (Federal Register, Section 328.3(b), 1991) and the EPA (Federal Register, Section 230.4(t), 1991) jointly define wetlands as: Those areas that are inundated or saturated by surface or ground water at a frequency and duration sufficient to support, and that under normal circumstances do support, a prevalence of vegetation typically adapted for life in saturated soil conditions. Wetlands generally include swamps, marshes, bogs, and similar areas.
b. Diagnostic environmental characteristics: Wetlands have the following general diagnostic environmental characteristics: 1. Vegetation: The prevalent vegetation consists of macrophytes that are typically
adapted to areas having hydrologic and soil conditions described in (a) above. Hydrophytic species, due to morphological, physiological, and/or reproductive

CBRES Avila Tank Farm Wetland Delineation Project No. 1102-1741
- 3 -
adaptation(s), have the ability to grow, effectively compete, reproduce, and/or persist in anaerobic soil conditions.
2. Soil: Soils are present and have been classified as hydric, or they possess characteristics that are associated with reducing soil conditions.
3. Hydrology: The area is inundated either permanently, or periodically at mean water depths < 6.6 ft. (~ 2 m), or the soil is saturated to the surface at some time during the growing season of the prevalent vegetation. The period of inundation or soil saturation varies according to the hydrologic/soil moisture regime and occurs in both tidal and non-tidal situations
c. Technical approach for the identification and delineation of wetlands: Except in certain situations defined in this manual, evidence of a minimum of one positive wetland indicator from each parameter (hydrology, soil, and vegetation) must be found in order to make a positive wetland determination.”
In addition, recent decisions in the U.S. Supreme Court (i.e., Solid Waste Agency of Northern Cook County [SWANCC] v. US ACOE [531 U.S. 159, 2001] January 9, 2001; Rapanos et ux., et al. v. United States, June 19, 2006) have led to the development of federal guidance that requires careful examination and documentation of the physical location(s) and hydrologic connections among waters/wetlands. To determine federal jurisdiction, particular focus is given to (1) surface hydrologic connections between a wetland and “navigable waters in fact,” (2) “adjacency” of a wetland to traditionally navigable waters, and thus (3) a “significant nexus” to interstate commerce. Wetlands features can also be determined to be under federal jurisdiction by the ACOE or EPA if a “significant nexus” can be shown between the wetland feature in question and its contribution to the maintenance or restoration of the physical, chemical, or biological integrity of downstream waters that are traditionally navigable.
Further, to determine the extent of the wetland boundaries in non-tidal waters, the lateral extent of ACOE jurisdiction is determined by the ordinary high water mark (OHWM), which is defined as:
“…[the] line on the shore established by the fluctuations of water and indicated by physical characteristics such as clear, natural line impressed on the bank, shelving, changes in the character of soil, destruction of terrestrial vegetation, the presence of litter and debris, or other appropriate means that consider the characteristics of the surrounding areas” (33 CFR 328[e]).”
In summary, the ACOE roles and responsibilities, as a federal resource agency, is to administer permits, verify jurisdictional determinations, develop policy and guidance, and enforce Section 404 provisions of the CWA.
United States Fish and Wildlife Service (USFWS). The USFWS definition of a wetland also incorporates the three parameters of hydrophytic vegetation, hydric soils, and hydrology, similar to that of the ACOE; however, the USFWS classifies a wetland if only one of these parameters has been identified. The USFWS uses the Cowardin, et al., 1979 definition that reads as follows:
“Wetlands are lands transitional between terrestrial and aquatic systems where the water table is usually at or near the surface or the land is covered by shallow water. For

CBRES Avila Tank Farm Wetland Delineation Project No. 1102-1741
- 4 -
purposes of this classification wetlands must have one or more of the following three attributes: (1) at least periodically, the land supports predominantly hydrophytes; (2) the substrate is predominantly undrained hydric soil; and (3) the substrate is nonsoil and is saturated with water or covered by shallow water at some time during the growing season of each year.” (Cowardin, et al., 1979).
The USFWS authorities are related to managing fish and wildlife-game species and threatened and endangered species. USFWS regulations are incorporated when such species are dependent on a specific wetland.
2.2 STATE AGENCIES
2.2.1 Regulations
Porter-Cologne Water Quality Control Act of 1969. The Porter-Cologne Water Quality Control Act (CA Water Code §§ 13000-13999.10) mandates that waters of the state shall be protected, such that activities that may affect waters of the state shall be regulated to attain the highest quality. This Act establishes the State Water Resources Control Board (SWRCB) as the principal state agency for controlling water quality in California. The SWRCB provides regulations that mandate a “non-degradation policy” for state waters, especially those of high quality. The SWRCB is divided into nine local Regional Water Quality Control Boards (RWQCB), the Avila Tank Farm property lies within the regional Central Coast Regional Water Quality Control Board (CCRWQCB).
California Fish and Game Code. The CDFG administers a number of laws and programs designed to protect fish and wildlife resources. Section 1602 of the California Fish and Game Code, CDFG requires a Lake or Streambed Alteration Agreement between CDFG and any State or local governmental agency or public utility before the initiation of any construction project that will: 1) divert, obstruct, or change the natural flow or the bed, channel, or bank of any river, stream, or lake; 2) use materials from a streambed; or 3) result in the disposal or deposition of debris, waste, or other material containing crumbled, flaked, or ground pavement where it can pass into any river, stream, or lake. Therefore, the CDFG claims jurisdiction over the bed, bank, and channel of the drainage that may be impacted by project activities.
California Coastal Act of 1976. The California Coastal Act of 1976 created the California Coastal Commission (CCC) and six area offices that are responsible for granting development permits for coastal projects and for determining consistency between federal and state coastal management programs. They also administer tests of oil spill cleanup measures. Wetlands found in the "coastal zone" are regulated under the California Coastal Act and the Federal Coastal Zone Management Act (CZMA), and are within jurisdiction of the CCC. The legislature, also in 1976, created a state agency, the California Coastal Conservancy (Coastal Conservancy), which is authorized to take steps to preserve, enhance, and restore coastal resources and to address issues that regulations alone cannot resolve. The CCC’s authority includes reviewing proposed project actions, as well as reviewing project actions, for the integration of policies that are established by the California Coastal Act.
Clean Water Act, Section 401. Section 401 of the CWA requires that federal agencies issuing licenses or permits for construction or other activities obtain a written certification that the activity will not cause or contribute to a violation of the state’s water quality standards. After

CBRES Avila Tank Farm Wetland Delineation Project No. 1102-1741
- 5 -
receiving the certification, the federal agency issuing the permit must include conditions in the permit to prevent the project from degrading water quality of a downstream state or tribe. The CWA's 401 certification requirement applies to many types of permits and is an important tool for states and tribes to control projects that might degrade state waters. Work involving discharges to waters/wetlands must be reviewed by the CCRWQCB in the context of the Clean Water Act 401 Water Quality Certification Program.
2.2.2 Definitions and Classifications
California Department of Fish and Game (CDFG). The CDFG found that the USFWS definition and classification system to be the most biologically valid and utilizes its definition as a guide to identifying wetlands. Please refer to Section 2.1.2 above.
California Coastal Commission (CCC). The CCC, under the California Coastal Act of 1976, defines a wetland as:
“… land within the coastal zone which may be covered periodically or permanently with shallow water and include saltwater marshes, freshwater marshes, open or closed brackish water marshes, swamps, mudflats, and fens.” (Pub. Res. Code 30121)
However, further precision in wetlands jurisdiction is provided to the Coastal Commission under the California Code of Regulations. Under these provisions wetlands are defined as:
"...land where the water table is at near, or above the land surface long enough to promote the formation of hydric soils or to support the growth of hydrophytes, and shall also include types of wetlands where vegetation is lacking and soil is poorly developed or absent as a result of frequent drastic fluctuations of surface water levels, wave action, water flow, turbidity or high concentration of salts or other substances in the substrate. Such wetlands can be recognized by the presence of surface water or saturated substrate at some time during each year and their location within, or adjacent to vegetated wetland or deepwater habitats." (14 CCR 13577)
The CCC is responsible for implementing the California Coastal Management Program in California’s Coastal Zone, which extends three miles seaward and generally about 1,000 yards inland. The CCC also maintains active involvement in select projects involving wetland restoration, enhancement, and/or mitigation along the coastal zone.
3.0 METHODS
Methods for delineating wetlands within the Avila Tank Farm are described below in further detail.
3.1 LITERATURE REVIEW
Prior to conducting the field survey, previously completed wetland reports were reviewed and include the following:
• Unocal Former Avila Terminal Ecological Evaluation. Prepared by Jordan Environmental Services. 2003.
• Unocal Former Avila Terminal Ecological Evaluation Supplement I. Prepared by David Wolff Environmental. October 11, 2004.

CBRES Avila Tank Farm Wetland Delineation Project No. 1102-1741
- 6 -
• Unocal Former Avila Terminal Ecological Evaluation Supplement II. Prepared by David Wolff Environmental. December 16, 2005.
• 90-Day Vernal Pool Branchiopod Wet Season Survey Report for the Unocal Former Avila Terminal Site, Avila Beach, California. Letter to USFWS Ventura Office. Dated December 16, 2005.
• Aerial Photographs of the Avila Tank Farm on May 3, 1926, July 28, 1954, and September 27, 1940. Prepared by England and Associates.
• Web Soil Survey. Natural Resources Conservation Service (NRCS). United States Department of Agriculture. Available online: http://websoilsurvey.nrc.usda.gov Accessed December 16, 2011.
The above mentioned reports provided wetland acreages and a map depicting the extent of wetland habitats occurring within the Avila Tank Farm; however, formal wetland delineations were not completed.
3.2 FIELD DELINEATION METHODS
The wetland delineation was completed in accordance with the 1987 ACOE Manual and the Interim Regional Supplement: Arid West Region (Environmental Laboratory, 2006).
Field surveys were completed on December 7, 8, and 15, 2011 by Padre Biologists, Ms. Jennifer Langford and Ms. Thea Benson. Wetlands were identified in the field using the three parameter methodology (wetland hydrology, hydric soils, and hydrophytic vegetation). Survey plots, within an approximately 2 foot by 2 foot square, were placed in the potential wetland features to determine the presence/absence of wetland indicators (i.e., sample points). Once the presence of all wetland parameters was established, additional soil pits were excavated where wetland vegetation was absent to determine the outer limits of each wetland feature. The outer limits of each wetland feature were then pin-flagged and a professional surveyor, provided by RRM Design Group of San Luis Obispo, California, subsequently surveyed the pin-flagged areas. The surveyor’s data points were then mapped using ArcGIS and the resulting maps were reviewed by Padre for accuracy. The acreage of these wetlands was calculated from the surveyed data.
The following procedure was implemented at each sample point:
Vegetation. The plant species within the sample plot were recorded and the percent of absolute cover for each species was determined by estimating area cover. The indicator status of each species was determined using the National List of Plant Species That Occur in Wetlands: California (Region 0) (Reed, 1988) (i.e., facultative [FAC], facultative-wetland [FACW] or obligate [OBL] wetland species). The indicator status refers to the relative frequency with which a plant species occurs in jurisdictional wetlands. Refer to Table 1 below for more information in reference to vegetation indicators.
Table 1. U.S. Fish & Wildlife Service plant indicator status (Reed 1988, 1993)
Indicator Status Definition

CBRES Avila Tank Farm Wetland Delineation Project No. 1102-1741
- 7 -
Obligate Wetland (OBL) Occur almost always (estimated probability > 99%) under natural conditions in wetlands.
Facultative Wetland (FACW) Usually occur in wetlands (estimated probability 67%-99%), but occasionally found in non-wetlands.
Facultative (FAC) Equally likely to occur in wetlands or non-wetlands (estimated probability 34%-66%).
Facultative Upland (FACU) Usually occur in non-wetlands, but occasionally found in wetlands (1%-33%).
Obligate Upland (UPL)
Occur in wetlands in another region, but occur almost always (estimated probability > 99%) under natural conditions in non-wetlands in the region specified.
No Indicator Status (NI) Insufficient information exists to assign an indicator status.
Not Listed (NL) Not on the National List in any region.
The percent cover of all species in each four strata (tree, sapling/shrub, herb, and woody vine) was established within each sample plot. Species identifications and taxonomic nomenclature follow The Jepson Manual (Hickman, 1993) with the exception of the Cyperaceae, which follows the Flora of North America (FNA), Volume 23 (FNA Editorial Committee, 2002).
A series of three indicator tests were applied during field surveys to identify the presence of hydrophytic vegetation. Hydrophytic vegetation is present if any of the indicators is satisfied. Indicator 1 is the Dominance Test and was most frequently used during the field surveys. This test is the most basic and used prior to the use of Indicator 2 or 3. If a plant species comprised at least 20 percent of the total areal cover in its stratum, it was considered to be a dominant plant species. If more than 50 percent of the dominant plant species had an indicator status of OBL, FACW, or FAC, the sample point met the wetland vegetation parameter.
Most wetlands will pass the dominance test; however, some wetland plant communities may fail and in those cases where indicators of hydric soil and wetland hydrology were present, the vegetation was then re-evaluated with Indicator 2 – the Prevalence Index. In addition, Indicator 3 – Plant Morphological Adaptations can be used to distinguish certain wetland plant communities.
Soils. The presence of hydric soils was determined based on the criteria outlined in the 1987 ACOE Manual (Environmental Laboratory, 1987) and information provided in the Arid West Regional Supplement (Environmental Laboratory, 2006).
Hydric soils are defined as:
“soil that is saturated, flooded, or ponded long enough during the growing season to develop anaerobic conditions that factor the growth and regeneration of hydrophitic vegetation [USDA-Soil Conservation Service, 1985]. Hydric soils that occur in areas having positive indication of hydrophitic vegetation and wetland hydrology are wetland soils.” (Environmental Laboratory, 1987)

CBRES Avila Tank Farm Wetland Delineation Project No. 1102-1741
- 8 -
Field indicators are soil characteristics designed to identify soils that meet the hydric soil definition without further data. These indicators were referenced during surveys using the Field Indicators of Hydric Soils in the United States (NRCS, 2006).
Soil test pits were dug to a depth of approximately 20 inches to accurately describe the soil profile. Test pits were dug less than 20 inches in areas where the surface horizons consisted of organic material or mucky soils that were easily identifiable as hydric soils or a restrictive layer was identified and difficult to dig into (e.g., rocks, hardpan, shallow aquitard). After the pit was dug, a 20 inch soil profile was sliced off using a soil spade. This profile was used to determine soil color, texture, and moisture at different depths within the soil profile. The Munsell (2000) color chart was used to identify all soil colors and a Websoil Survey (NRCS, 2011) Soil Survey Report was referenced. Soil texture and moisture was determined by feeling the soil samples. If the soil characteristics met the hydric soil criteria provided in the Arid West Supplement and the Field Indicators of Hydric Soils manual (NRCS, 2006), the sample point met the wetland soils parameter.
Within the Avila Tank Farm, the majority of the wetlands occurring on-site do not support a natural soil profile and consist of fill material used for the tank bottoms. The un-natural soil conditions trigger an “Atypical Situation” consisting of Man-Induced Wetlands. In man-induced wetlands, indicators of hydric soils are usually absent, such as many of the wetlands occurring within the Avila Tank Farm. Therefore, a multiparameter approach in making wetland determinations in man-induced wetlands must be based on the presence of hydrophytic vegetation and wetland hydrology. In these cases, hydric soils may be absent, however, a wetland can still be determined as present.
Hydrology. Consistent with the 1987 ACOE Manual protocols, the Arid West Regional Supplement (Environmental Laboratory, 2006), and current regulatory guidance, wetland hydrology can be determined by evaluating a variety of indicators. Recorded data indicators include gage or well data, flood predictions (i.e., FEMA maps), and historic records pertaining to the study area. Field indicators include, but are not limited to, visual observation of inundation and/or saturation, sediment deposition, drainage patterns in wetlands, hydric soil characteristics, watermarks, drift lines, oxidized channels (i.e., rhizospheres) associated with living roots and rhizomes, and water stained leaves (Environmental Laboratory, 1987).
In summary, if a sample point met all three parameters (hydrology, hydrophitic vegetation, and hydric soils) and a significant nexus to navigable waters was identified, it was classified as a federal wetland. If the sample point met only one parameter, it was classified as a state wetland. A defined wetland within the jurisdiction of an agency can be an area that has no surface water present for a significant time during the dry season. Utilizing field indicators can assist in identifying a wetland during a wet or dry season. Further, it is important to note that areas with surface water or with field hydrologic indicators present does not necessary define it as a jurisdictional wetland. The final determination regarding whether or not the wetland is jurisdictional will be made by the CCC and ACOE. Please refer to Appendix A for Site Photographs.
4.0 RESULTS
4.1 SUMMARIES OF PREVIOUS REPORTS
An Ecological Evaluation was prepared within the Avila Tank Farm property in 2003 by Jordan Environmental. The 2003 Ecological Evaluation identified and characterized six wetland

CBRES Avila Tank Farm Wetland Delineation Project No. 1102-1741
- 9 -
areas within manmade retention basins at the Avila Tank Farm. Two areas were classified freshwater marsh because they supported robust emergent wetland plants, such as California bulrush (Schoenoplectus californicus) and narrow-leaved cattail (Typha angustifolia), suggesting a longer duration of ponding or saturation. The four remaining areas were described as seasonal wetlands supporting mostly annual plant species associated with a more temporary ponding or saturation subject to regular drying in the late spring or early summer.
In 2004, David Wolff Environmental (DWE) prepared a supplement to the 2003 Ecological Evaluation prepared by Jordan Environmental. This study provided an evaluation of these six wetland areas in terms of their ecological functions and values. In the 2004 supplement, DWE classified the overall functions and values of the Avila Tank Farm wetland basins as low, because they were surrounded by disturbed and developed areas, and were relatively small and isolated from a more natural wetland context, such as a larger marsh, river floodplain or riparian habitat, or vernal pool grassland.
In 2005, DWE prepared a second supplement to the Ecological Evaluation. Wetland resources were assessed using the review of historical and current background information and field observations during the summer 2004 and 2004-2005 winter, spring, and summer seasons. Observations of hydrology and vegetation were recorded during the 2004/2005 wetland season in the six wetlands identified in the 2003 study. The wetlands were evaluated based on the 1987 ACOE Manual, but a formal delineation with data sheets was not provided.
4.2 PADRE 2011 – DELINEATION OF WETLANDS
4.2.1 Site Description
During the December 2011 field effort, Padre delineated the extent of all wetland features within the Avila Tank Farm. A total of 1.69 acres defined wetlands were identified within the Avila Tank Farm. Most of the wetlands were created artificially by human activity (removal of tanks and the intentional or unintentional creation of detention basins) and have steep topographical boundaries. These wetlands have hydrophytic vegetation and wetland hydrology, but soils could not be reliably used as they are recently formed. Therefore, vegetation and hydrology were the two parameters primarily used for the wetland delineation. The exception is Wetland 7, which is a naturally occurring wetland. At this site, positive indicators for soil and vegetation were present, but wetland hydrology indicators were absent. Refer to Appendix A for images of wetland features occurring within the Avila Tank Farm during the December field visits in 2011.
Hydrology. The presence or absence of wetland hydrology indicators, such as, surface water, saturated soil conditions, hydrogen sulfide odor, and oxidized rhizospheres were used to determine final boundaries of the depressional wetlands. The wetland features present within the Avila Tank Farm are tank depressions/basins that appear to pond water for long (i.e., 7-30 days) or very long (i.e., > 30 days) durations. Surface water was present within these basins during the current and past field surveys. Additionally, a biotic crust was also present at several of the wetlands. A biotic crust is a primary indicator of hydrology and includes ponding-remnant biotic crusts, benthic microflora, and the dried remains of free-floating algae left on or near the soils surface after dewatering. Most of the wetland areas also had a shallow aquitard as a result of the remnant tank foundation.
Soils. Most of the sites investigated during this survey occur at former tank sites with hard rock foundations remaining only several inches below the soil surfaces. The soil that is present

CBRES Avila Tank Farm Wetland Delineation Project No. 1102-1741
- 10 -
along the surface has only formed since the removal of the tanks and is relatively young. This makes the soils problematic, as hydric soils can take as long as 100 years to develop. However, soil pits were advanced when possible and soil examined. Soil ranged in texture from sandy, sandy loam, to clay. Due to the problematic soils, this parameter in determining wetland presence cannot be used and the survey then relies exclusively on hydrology and hydrophytic vegetation.
The NRCS Web Soil Survey of San Luis Obispo County, Coastal Part, identifies and describes the soil mapping unit occurring throughout the majority of the site as Lopez very shaly clay loam (9 to 30 percent slopes). Refer to Appendix C. Lopez soils are somewhat excessively drained and within the first 18 inches, the soils consist of clay loams and unweathered bedrock between 18 to 22 inches below. Along the northern extent of the property, the soil mapping unit shows Cropley clay (0 to 2 percent slopes) and Diablo and Cibo clays (15 to 30 percent slopes). These soils are well drained clay soils for the first 60 inches until bedrock. The Cropley clay soil mapping unit is considered a ‘partially hydric’ soil and the remaining soil mapping units occurring on the site are considered non-hydric by the NRCS Web Soil Survey.
Vegetation. The hydrophytic vegetation within the property tends to be dominated by herbaceous species, such as tall flatsedge (Cyperus eragrostis), and non-native annual grasses including annual rabbitsfoot grass (Polypogon monspeliensis), (Lolium perenne ssp. multiflorum), salt chess (Bromus hordeaceus), and rattail six weeks grass (Festuca myuros), brass buttons (Cotula coronopifolia), curly dock (Rumex crispus), Chilean cudweed (Gnaphalium stramineum), and everlasting cudweed (Gnaphalium luteo-album). On the upland boundaries of the wetlands, coyote brush (Baccharis pilularis) and goldenbush (Isocoma menziesii) become more prevalent. The lowest depressional wetland (Wetland 1) contains a freshwater marsh with 100 percent cover of California bulrush and narrow-leaved cattail.
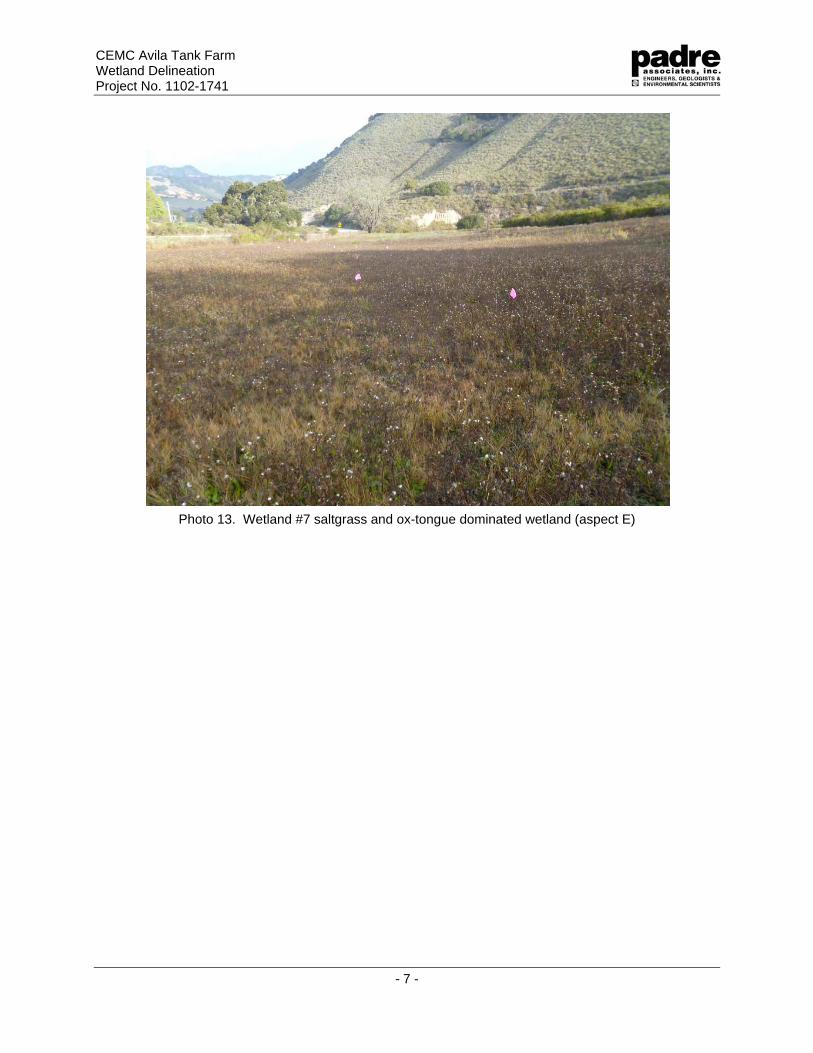
Wetland 7 is likely receiving water from the nearby hillside and, if not impounded by Avila Beach Drive, this area would have drained into San Luis Creek and most likely would be smaller in size. This area is regularly mowed for fire suppression and is dominated by the non-native and invasive bristly ox-tongue (Picris echioides). Salt grass (Distichlis spicata) is also a common species in the wetland area. Sapling/shrub species present in and around this wetland include coast live oak (Quercus agrifolia), coyote brush, and goldenbush. Other herbaceous species include common rush (Juncus patens) and narrow-leaved plantain (Plantago lanceolata).
4.2.2 Specific Project Area Findings
Wetland 1 – This area is the lowest basin within the property and the tank located here was removed in the 1940’s. This area functions as an actively managed detention basin receiving surface runoff during large rain events and water from the upper detention basin (Wetland 3) via drainage pipe. Based on previous reports, this area was observed ponded at depths from 10 to 36 inches from December 17, 2004 through April 12, 2005. The area also had surface water during the December 2011 survey.
The wetland habitat includes one large seasonally flooded marsh and adjacent non-flooded wetlands. As described earlier, the marsh pond is dominated by cattail and bulrush. Surrounding the marsh pond on the north side is a band of non-flooded wetland dominated by tall flatsedge (FACW), rabbitsfoot grass (FACW), and everlasting cudweed (FAC). Wetland features were documented at OBS-W1-1. Refer to Figure 2 – Site Plan Showing Wetlands and Appendix B – Wetland Data Forms. A biotic crust, a primary indicator for hydrology, was also

CBRES Avila Tank Farm Wetland Delineation Project No. 1102-1741
- 11 -
present in this band. Given that this is a former tank site, a natural soil profile would not be expected and soils were not used to determine hydric soil conditions.
The absence of a biotic crust and the transition from wetland to upland plants determined the wetland boundary. This boundary was exemplified at the OBS-W1-2 point (refer to Figure 2 and Appendix B) where goldenbush and coyote brush provide shrub cover, and tall flatsedge decreases in cover. The dominance of upland shrubs and herbs delineated the wetland boundary. During the site visit by Mr. Henderson, it was determined that this wetland does not fall within federal jurisdiction. The extent of state jurisdiction within Wetland 1 is 0.17 acres, pending a final determination from the CCC.
Wetland 2 – This area is located along the bluff in a former catch basin that was likely removed with the adjacent tank in 1950. It receives localized runoff from the surrounding hillsides and from a drainage culvert that drains water collected during rain events. Based on previous reports, water was ponded to a depth of two inches to 12 inches from December 17, 2004 through April 12, 2005. This area was dry on July 2005 and during the December 2011 survey.
The dominant plant is tall flatsedge (FACW). Other common plants observed in this community include rabbitsfoot grass (FACW), salt grass (FACW), mock parsley (Apiastrum angustifolia), curly dock (FACW), iceplant (Carpobrotus edulis), and yellow sweetclover (Melilotus indicus). A soil pit was advanced and soil was saturated at 10 inches and the water table was present at 16 inches. The soil exhibited redox dark surface, a primary hydric soil indicator. Wetland features were documented at OBS-02-1 (refer to Figure 2 and Appendix B).
The transition between the wetland and upland vegetation was abrupt. The presence of upland shrubs and herbs delineated the wetland boundary. California sagebrush (Artemisia californica), and goldenbush are dominant to co-dominant. Herbaceous, weedy species, such as fennel (Foeniculum vulgare), bur clover (Medicago polymorpha), yellow sweetclover, iceplant, pampas grass and annual grasses including rabbitsfoot grass (FACW), foxtail fescue (Vulpia myuros) (FACU) and red brome (Bromus madritensis), were also found adjacent to the site.
During the site visit by Mr. Henderson, it was determined that this wetland does not fall within federal jurisdiction. The extent of state jurisdiction within Wetland 2 is 0.01 acres, pending a final determination from the CCC.
Wetlands 3 and 3A– The wetland habitat included one small depressional wetland (Wetland 3A) located north of a large wetland within the basin bottom (Wetland 3). The small depressional wetland receives road runoff during rain events and does not collect water from the culvert system on-site. This wetland area is dominated by goldenbush, rabbitsfoot grass (FACW) and tall flatsedge (FACW) (refer to OBS-W3-4). The soil had a dark surface but no redox concentrations and wetland hydrology indicators were absent. The absence of hydrophytic plants defined the wetland boundary.
The larger wetland (Wetland 3) is the upper detention basin. It is the site of a former tank location that was removed in 1950. This area functions as an actively managed detention basin receiving surface runoff along the hillsides and water that drains into the culvert system that drains Wetland 4. This basin was observed saturated and ponded at depths of six inches to 24 inches from December 17, 2004 through April 12, 2005. At the time of this survey, the soil

CBRES Avila Tank Farm Wetland Delineation Project No. 1102-1741
- 12 -
was saturated throughout most of the basin and a small pool was located at the drainage inlet leading to the lower basin.
The wetland habitat in the basin bottom is dominated by tall flatsedge (FACW) and narrow-leaved plantain (FAC). Other common plants observed include common plantain (Plantago major) (FACW), Chilian cudweed (Gnaphalium stramineum) (FAC), rabbitsfoot grass (FACW), foxtail fescue (FACU), and Italian rye (FAC). A biotic crust, a primary indicator for hydrology, was also present on the basin bottom. Although the soil did not exhibit any hydric soil indicators, the soils are naturally problematic since the wetland has only formed since the removal of the tank (1950s); however, based on the presence of hydrophitic vegetation, wetland hydrology, and ponding in the area, conditions of a jurisdictional wetland are present. Wetland features were documented at OBS-W3-1 (refer to Figure 2 and Appendix B).
The absence of a biotic crust determined the wetland boundary. Non wetland observations were recorded at OBS-W3-2 (refer to Figure 2 and Appendix B). The transition from wetland to upland habitat occurred with the transition from a dominance of wetland plant species to upland species, and was exemplified at the OBS-W3-3 point where goldenbush provides shrub cover, and tall flatsedge decreases in cover. During the site visit by Mr. Henderson, it was determined that this wetland does not fall within federal jurisdiction. The extent of state jurisdiction within Wetland 3 is 0.28 acres and Wetland 3A is 0.02, pending a final determination from the CCC.
Wetland 4 – This area is a basin from a former tank location that was removed in 1998 and receives localized surface runoff from the hillsides during rain events and water drained via culvert connected to Wetland 5. Based on previous reports, this basin was observed ponded at depths of three to 18 inches from December 17, 2004 through April 12, 2005. During the December 2011 survey, the area was observed ponded with an average depth of one inch.
Within OBS-W4-1 sample point, the dominant plant was tall flatsedge (FACW). Other common plants observed in this community include rabbitsfoot grass FACW) and Italian rye (FAC). A soil pit was not advanced due to ponding. Based on presence of ponding, hydric soils were assumed present, further, the soils were noted as problematic and therefore were not included as a determination parameter. Wetland features were documented at OBS-W4-1 (refer to Figure 2 and Appendix B).
The transition between the wetland and upland habitats was abrupt at the edges of the basin. Ponding and saturated soils ended and dominance of upland shrubs and herbs delineated wetland boundaries. Goldenbush became dominant in the shrub layer and soft-chess brome (Bromus hordeacus) (FACU) co-dominant with Italian rye (FAC) in the herbaceous layer. A soil pit was advanced at the OBS-W4-2 sample point and no indicators of hydric soil were observed. In addition, no positive indicators of wetland hydrology were observed. Non-wetland features were documented at OBS-W4-2 (refer to Figure 2 and Appendix B). During the site visit by Mr. Henderson, it was determined that this wetland does not fall within federal jurisdiction. The extent of state jurisdiction within Wetland 4 is 0.30 acres, pending a final determination from the CCC.
Wetland 5 – This area is a basin from a former tank location that was removed in 1998 and receives localized surface runoff from the hillsides during rain events and water drained via

CBRES Avila Tank Farm Wetland Delineation Project No. 1102-1741
- 13 -
culvert that drains water from the upslope hillsides. The basin bottom is convex with the basin center higher than the surrounding edges. The localized drainage creates braided rivulets along the edges of the basin that were observed flowing at depths up to two inches or dry intermittently from December 17, 2004 through April 12, 2005. During this survey, rivulets through the basin were observed flowing and a small pool was observed at the basin outlet. However, the center of the basin remained dry.
The dominant plant within and adjacent to the rivulets was tall flatsedge. Other common plants observed in this community included rabbitsfoot grass (FACW) and Italian rye (FAC). Wetland hydrology was present with ponding, saturated soils, and water in rivulets. Where water or saturation was not present, the presence of drainage patterns provided positive indication of wetland hydrology. Wetland features were documented at OBS-W5-2 (refer to Figure 2 and Appendix B).
The transition between wetland and upland habitats was abrupt at the edges of the basin. Ponding and saturated soils ended and dominance of upland shrubs and herbs delineated wetland boundaries. Goldenbush became dominant in the shrub layer and foxtail fescue, soft-chess brome, co-dominant with Italian rye (FAC), in the herbaceous layer. A shallow aquitard was present in the basin bottom and a soil pit could only be advanced from six to eight inches. No indicators of hydric soil or wetland hydrology were observed. These observations were documented at OBS-W5-1 (refer to Figure 2 and Appendix B). During the site visit by Mr. Henderson, it was determined that this wetland does not fall within federal jurisdiction. The extent of state jurisdiction within Wetland 5 is 0.04 acres, pending a final determination from the CCC.
Wetland 6 – This area is a basin from a former tank location that was removed in 1995 and receives localized surface runoff during rain events. Based on previous reports, this basin was observed ponded at depths of two to ten inches from January 5, 2005 through March 30, 2005. The basin was dry by April 12, 2005. During the December 2011 survey, the site was dry.
Most of this basin bottom was vegetated with annual grasses and areas previously described as wetland areas in 2005 were vegetated with upland shrubs such as coyote brush and goldenbush. Most of the basin bottom also had a high cover area of annual grass, such as foxtail fescue and soft-chess brome. These observations were documented at OBS-W6-1 (refer to Figure 2 and Appendix B). However, in the center of the basin was an area that had less vegetative cover than the surrounding area. This area was vegetated with brass buttons (FACW) and rabbitsfoot grass (FACW). A presence of a biotic crust also provided a positive indication of wetland hydrology. A small soil pit was advanced and the soil did have a dark surface (7.5YR 5/1), no distinct or prominent redox concentrations were observed, and a shallow aquitard was present only three inches below the soil surface. No positive indicators of hydric soil were observed; however, the soil conditions were noted as problematic and were therefore not included in the wetland determination.
The transition between the wetland and upland habitats was gradual at the edges of the wetland, with the gradual decrease in cover of brass buttons and rabbitsfoot grass and the increase in cover of soft chess brome (FACU) and foxtail fescue (FACU). The biotic crust also was not present in these more heavily vegetated areas. These observations were documented at OBS-W6-3 (refer to Figure 2 and Appendix B). A soil pit was advanced at the wetland

CBRES Avila Tank Farm Wetland Delineation Project No. 1102-1741
- 14 -
boundary and a shallow aquitard was observed at six inches below the surface. No primary indicators of hydric soil or wetland hydrology were observed. During the site visit by Mr. Henderson, it was determined that this wetland does not fall within federal jurisdiction. The extent of state jurisdiction within Wetland 6 is 0.03 acres, pending a final determination from the CCC.
Wetland 7 – This wetland area occurs in an alluvial plain, collecting water ephemerally from the nearby hillsides, and if not impounded by San Luis Bay Drive this area would not likely collect water and/or would be smaller in size. Previous studies did not include this location within their survey area and, therefore, was not previously delineated. There is also no known recorded data on ponding in this area; however, ponding may have occurred in previous years. The area is regularly mowed for fire suppression.
Three different plant species associations occur within this area. At the bottom of the slope, near the drainage under Avila Beach Drive, is a small area dominated by tall flatsedge (FACW) and salt grass (FACW). Soil pits advanced in this area had dark surfaces with redox concentrations, a primary indicator of hydric soils. However, no positive indicators of wetland hydrology were present. These observations were documented at OBS-W7-01 (refer to Figure 2 and Appendix B).
Immediately upland from this area, non-native and invasive bristly ox-tongue (FAC) dominates, and salt grass (FACW) is also a common species in this area. Other herbaceous species include common rush (Juncus effusus) (FAC) and English plantain (FAC). Soils provided positive indicators of wetland soil but no indicators of wetland hydrology were present. These observations were documented at OBS-W7-02 (refer to Figure 2 and Appendix B).
The transition between the wetland and upland habitats was gradual. Bristly ox-tongue remains dominant but upland annual grasses become co-dominant and hydrophytic vegetation was not present. At this boundary, coast live oak and coyote brush become more prevalent. The soil changes to a lighter color and no redox concentrations are present. These observations were documented at OBS-W7-03 (refer to Figure 2 and Appendix B).
During the site visit by Mr. Henderson, it was determined that this wetland does not fall within federal jurisdiction. The extent of state jurisdiction within Wetland 7 is 0.84 acres, pending a final determination from the CCC.
5.0 SUMMARY
In December 2011, Padre conducted field surveys at the Avila Tank Farm and identified seven distinct wetland features based on wetland indicators. The 1987 ACOE Manual was primarily used to identify wetland characteristics, as well as other resource manuals identified in the literature cited section below. Wetland limits were pin-flagged and surveyed by a CBRES retained professional survey group. In total, Padre delineated a total of 1.69 acres of defined wetlands which includes 0.00 acres of federal-defined wetlands determined by the ACOE’s site visit on August 21, 2012, and a total of 1.69 acres of state-defined wetlands, pending final determination by the CCC.
The majority of the wetlands identified within the Avila Tank Farm are located at former aboveground storage tank sites that were historically excavated to facilitate their construction. Several of these former tank locations create depressional areas capable of ponding water.

CBRES Avila Tank Farm Wetland Delineation Project No. 1102-1741
- 15 -
Several of the former tank sites are directly underlain by shallow bedrock and/or fill material used for tank bottoms, and therefore wetland soil characteristics were not present. The absence of a natural soil profile and man-induced conditions indicated that problematic soils were present and soils were therefore not used in the wetland determination for much of the Avila Tank Farm. However, shallow soils are present at several former aboveground storage tank sites that support hydrophytic vegetation (Wetlands 3 through 6). Other identified wetland features (Wetlands 1 and 2) were located at current storm water detention basins and they may or may not contain hydric soils; however, hydrophytic vegetation and hydrology were present (surface water was present at the time of the survey). The wetland feature on the northern section of the Avila Tank Farm (Wetland 7) is located within an alluvial plain. This wetland pools water from surface water drainage off of the surrounding steep hillsides and is largely retained due to the road crossing and culvert associated with Avila Beach Drive. Water pools here ephemerally and for short durations during rain events before it drains out into the road crossing culvert. Wetland indicators were present; however, hydrology indicators were not observed.
Additionally, the 2011 surveys conducted by Padre were completed during December when most vegetation was in a vegetative state, not at full growth, and not in bloom. Therefore, all flora that typically occur in these wetland features were not likely observed. However, decayed plant matter from last years’ spring bloom was identified to the greatest extent possible and wetland vegetation was still identified within the features.
The wetlands at the Avila Tank Farm (excluding Wetland 7) are fed by a drainage system (culverts) that was constructed at the Avila Tank Farm as part of historical site operations. Each depression is connected by culverts and/or berms that ultimately drain to the ocean, providing a potentially significant nexus to a navigable water body; however, the ACOE has determined that all the wetland features identified in the Avila Tank Farm do not lie within federal jurisdiction. It is the CCC’s final determination that will consider these wetland features within state jurisdiction.

CBRES Avila Tank Farm Wetland Delineation Project No. 1102-1741
- 16 -
6.0 LITERATURE CITED
Adamus, P.R., E.J. Clarain Jr., R.D. Smith and R.E. Young. 1987. Wetland Evaluation Technique (WET). U.S. Army Engineers Waterway Experiment Station.
Baldwin, B.G., D.H. Goldman, D.T. Keil, R. Patterson, T.T. Rosati, and D.H. Wilken, editors. 2012. The Jepson Manual: Vascular Plants of California, Second Edition. University of California Press, Berkely.
Brinson, M. 1993. A hydrogeomorphic classification for wetlands. Technical Report WRP-DE-4, U.S. Army Engineer Waterways Experiment Station, Vicksburg, MS.
David Wolff Environmental. 2004. Unocal Former Avila Terminal, Ecological Evaluation Supplement I.
David Wolff Environmental. 2005. Unocal Former Avila Terminal, Ecological Evaluation Supplement II.
Environmental Laboratory. 1987. U.S. Army Corps of Engineers Wetlands Delineation Manual. Technical Report Y-87-1. U.S. Army Corps of Engineers Waterways Experiment Station, Vicksburg, MS.
Environmental Laboratory. 2006. Interim Regional Supplement to the Corps of Engineers Wetland Delineation Manual: Arid West Region. U.S. Army Corps of Engineers Wetlands Regulatory Assistance Program, Washington, DC.
Ernstrom, Daniel J. 1984. Soil Survey of San Luis Obispo County, California, Coastal Part. Prepared for the U.S. Department of Agriculture, Soil Conservation Service.
Federal Register. 1986. Regulatory Programs of the Corps of Engineers; Final Rule. Volume 51, No. 219; 33 CFR Parts 320 through 330.
Federal Register. July 13, 1994. Changes in Hydric Soils of the United States. Washington, D.C. (Hydric soil definition).
Federal Register. September 18, 2002. Hydric Soils of the United States. Washington, D.C. (Hydric Soil Criteria).
Flora of North America (FNA) Editorial Committee. 2002. Flora of North America North of Mexico. Volume 23. Oxford Press.
Hickman, James C. 1993. The Jepson Manual, Higher Plants of California. University of California Press. Berkeley, CA.
Jordan Environmental. 2003. Final, Unocal Former Avila Terminal, San Luis Obispo, California, Ecological Evaluation.
Lichvar, Robert W. and Shawn M. McColley. 2008. A field Guide to the Identification of the Ordinary High Water Mark (OHWM) in the Arid West Region of the Western United States. A delineation Manual. Cold Regions Research and Engineering Laboratory. U.S. Army Corps of Engineers.
Munsell Color. 2000. Munsell Soil Color Charts. Munsell Color, Macbeth Division of Kollmorgen Instruments Corp., New Windsor, NY.

CBRES Avila Tank Farm Wetland Delineation Project No. 1102-1741
- 17 -
Natural Resources Conservation Service (NRCS). 2002. Climate Information – Wetlands Retrieval for California. Natural Resource Conservation Service. Web: http://www.wcc.nrcs.usda.gov/cgibin/getwetco.pl?state=ca accessed April 2008.
Natural Resources Conservation Service (NRCS). 2006. Field Indicators of Hydric Soils in the United States, Version 6.0. G.W. Hurt, L.M. Vasilas, editors. United States Department of Agriculture (USDA), NRCS, in cooperation with the National Technical Committee for Hydric Soils, Fort Worth, TX.
Natural Resources Conservation Service (NRCS). 2011. Web Soil Survey – San Luis Obispo County, Coastal Part. Available online at http://websoilsurvey.nrcs.usda.gov/. Accessed December 16, 2011.
Reed, P.B. Jr. 1988. National List of Plant Species that occur in Wetlands: California (Region 0). (U.S. Fish and Wildl. Serv. Biol. Rep. 88(26.10)). St. Petersburg, FL.
U.S. Army Corps of Engineers (ACOE). 1992. “Clarification and Interpretation of the 1987 Manual.” 3-92 Memorandum.
U.S. Environmental Protection Agency and U.S. Army Corps of Engineers. June 5, 2007. Clean Water Act Jurisdiction Following the U.S. Supreme Court’s Decision in Rapanos v. United States & Carabell v. United States. Joint memorandum issued June 5, 2007. Washington, D.C.
United States Department of Agriculture Soil Conservation Service. 1979. Soil Survey of San Luis Obispo County.

FIGURES

S:\
GIS
\125
2_C
hevr
on
_E
MC
-Avi
la\1
25
2.0
08
_20
11_R
em
ed
iatio
n_S
up
po
rt\A
rcM
ap
Do
cu
me
nts
\019
_12
52
.00
8_S
ite
_Lo
ca
tion
_M
ap
.mxd
\1/2
6/2
012
TR UC KLO AD IN G R AC K
PU M PHO U SE
RE FI NE R Y
AR EA
ST O C K P IL E 1
AV ILA B EA
C H DR IV
E
SA N LUIS ST RE E T
FR ONT ST RE
E T
SAN
RAFA
EL
STRE
ET
SAN
ANT
ONIO
STR
EET
1s t ST RE E
T
CAVE
LA ND
ING
ROAD
P a c i f i c O c e a n
SA N LU IS B AY G O LF C LU B
OB-SP-F H-0 .5OB-WBP-F H- 0.5
Pir ate s Co ve #2
0 2,000 4,0001,000
FEET
SCALE
SITE
FORMER AVILA TANK FARMAVILA BEACH, CALIFORNIA
PREPARED FOR
CHEVRON EMCSAN LUIS OBISPO, CALIFORNIA
SITE LOCATION MAP
FIGURE 1
REFERENCE:
7.5 MINUTE U.S.G.S. TOPOGRAPHIC MAP
OF PISMO BEACH, CALIFORNIA
DATED: 1965
PHOTOREVISED: 1975

@A?@A?
@A?
@A?@A?@A?
@A?@A?
@A?@A?@A?@A?@A?@A?
@A?
@A?
@A?@A?
@A?OBS 5-4
OBS 5-1
OBS 6-3
OBS W1-1
OBS W2-1
OBS W3-4
OBS W3-3
OBS W4-1
OBS W7-1
OBS W7-2
OBS 5-2
OBS 5-3
OBS 6-2
OBS W1-2
OBS W3-2
OBS W4-2
OBS 6-01
OBS W7-3
OBS W3-1
State Wetland 70.84 Acres
State Wetland 3A0.01 Acres
State Wetland 10.17 Acres
State Wetland 60.03 Acres
State Wetland 20.01 Acres
State Wetland 40.30 Acres
State Wetland 30.28 Acres
State Wetland 50.04 Acres
S:\
GIS
\125
2_C
hevr
on_E
MC
-Avi
la\1
252.
009_
2012
_Sup
port\
Arc
Map
Doc
umen
ts\0
54_1
253.
009_
Rev
ised
_Site
_Pla
n_W
etla
nds.
mxd
\9/2
6/20
12
Feet
0 300 600
Scale
FORMER AVILA TANK FARMAVILA BEACH, CALIFORNIA
PREPARED FOR
CHEVRON EMCSAN LUIS OBISPO, CALIFORNIA
REVISED SITE PLAN SHOWING WETLANDS
FIGURE 2
Legend
@A? Wetlands Soil Sample
Approximate Site Boundary
Wetlands - Total Area: 1.68 Acres

APPENDIX A
SITE PHOTOGRAPHS

CEMC Avila Tank Farm Wetland Delineation Project No. 1102-1741
‐ 1 -
Photo 1. Wetland #1, marsh pond dominated by bulrush and cattail (aspect E)
Photo 2. Wetland #1 biotic crust, primary indicator for wetland hydrology

CEMC Avila Tank Farm Wetland Delineation Project No. 1102-1741
‐ 2 -
Photo 3. Wetland #2, tall flatsedge
Photo 4. Wetland #2 soil profile with water saturation at 10 inches

CEMC Avila Tank Farm Wetland Delineation Project No. 1102-1741
‐ 3 -
Photo 5. Wetland #3 dominated by tall flatsedge, narrow-leaved plantain and rabbitsfoot grass (aspect S)
Photo 6. Wetland #3 rabbitsfoot grass. Roping existing from previous delineations (aspect S)

CEMC Avila Tank Farm Wetland Delineation Project No. 1102-1741
‐ 4 -
Photo 7. Wetland #4 former tank bottom (aspect SW)
Photo 8. Wetland #4, within the former tank bottom dominated by flatsedge, rabbitsfoot grass, and Italian
rye(aspect NW)

CEMC Avila Tank Farm Wetland Delineation Project No. 1102-1741
‐ 5 -
Photo 9. Wetland #5, small rivulet draining to the west (aspect E)
Photo 10. Wetland #5 representative soil profile of non-hydric sandy soils

CEMC Avila Tank Farm Wetland Delineation Project No. 1102-1741
‐ 6 -
Photo 11. Wetland #6 biotic crust and brass button wetland indicators (aspect NE)
Photo 12. Wetland #7 overview, wetland occurring close to road, flagged with pin-flags (aspect W)
CEMC Avila Tank Farm Wetland Delineation Project No. 1102-1741
‐ 7 -
Photo 13. Wetland #7 saltgrass and ox-tongue dominated wetland (aspect E)

APPENDIX B
WETLAND DATA FORMS

US Army Corps of Engineers Arid West – Version 2.0
WETLAND DETERMINATION DATA FORM – Arid West Region
Project/Site: Avila Tank Farm City/County: Avila Beach/San Luis Obispo County Sampling Date: 12/08/11
Applicant/Owner: Chevron Business and Real Estate Services State: CA Sampling Point: W1-01 Investigator(s): Thea Benson, Jennifer Langford, Padre Associates Section, Township, Range: San Miguelito Spanish Land Grant
Landform (hillslope, terrace, etc.): bottom of a detention basin Local relief (concave, convex, none): level Slope (%): 0-5
Subregion (LRR): Lat: 35.176 Long: -120.723 Datum: UGS 84
Soil Map Unit Name: Lopez very shaly clay loam NWI classification: Paulistrine emergent wetland
Are climatic / hydrologic conditions on the site typical for this time of year? Yes X No (If no, explain in Remarks.)
Are Vegetation No , Soil No , or Hydrology No significantly disturbed? Are “Normal Circumstances” present? Yes X No
Are Vegetation No , Soil Yes , or Hydrology No naturally problematic? (If needed, explain any answers in Remarks.)
SUMMARY OF FINDINGS – Attach site map showing sampling point locations, transects, important features, etc.
Hydrophytic Vegetation Present? Yes X No
Hydric Soil Present? Yes X No
Wetland Hydrology Present? Yes X No
Is the Sampled Area within a Federal Wetland? Yes X No Is the Sampled Area within a State Wetland? Yes X No
Remarks: This area is the lowest detention basin on the Avila site and a former tank location that was removed in the 1940’s. This area functions as an actively managed detention basin receiving surface runoff and from drainage from the upper detention basin (wetland 3).
VEGETATION – Use scientific names of plants.
Absolute Dominant Indicator Tree Stratum (Plot size: ) % Cover Species? Status
1.
2.
3.
4.
= Total Cover Sapling/Shrub Stratum (Plot size: )
1.
2.
3.
4.
5.
= Total Cover Herb Stratum (Plot size: 3 meter radius )
1. Cyperus eragrostis 30 Yes FACW
2. Polypogon monspeliensis 30 Yes FACW
3. Gnaphalium stramineum 20 Yes
4. Rumex crispus 2 No FACW
5.
6.
7.
8.
82 = Total Cover Woody Vine Stratum (Plot size: )
1.
2.
= Total Cover % Bare Ground in Herb Stratum 30 % Cover of Biotic Crust 0
Dominance Test worksheet:
Number of Dominant Species That Are OBL, FACW, or FAC: 2 (A) Total Number of Dominant Species Across All Strata: 3 (B) Percent of Dominant Species That Are OBL, FACW, or FAC: 66% (A/B)
Prevalence Index worksheet:
Total % Cover of: Multiply by:
OBL species x 1 =
FACW species x 2 =
FAC species x 3 =
FACU species x 4 =
UPL species x 5 =
Column Totals: (A) (B)
Prevalence Index = B/A =
Hydrophytic Vegetation Indicators:
X Dominance Test is >50%
Prevalence Index is ≤3.01
Morphological Adaptations1 (Provide supporting data in Remarks or on a separate sheet)
Problematic Hydrophytic Vegetation1 (Explain)
1Indicators of hydric soil and wetland hydrology must be present, unless disturbed or problematic.
Hydrophytic Vegetation Present? Yes X No
Remarks:
Sampling point is at the edge of marsh dominated by cattail (Typha spp.) and California bulrush (Schoeneoplectus californicus) both obligate species.

US Army Corps of Engineers Arid West – Version 2.0
SOIL Sampling Point: W1-01
Profile Description: (Describe to the depth needed to document the indicator or confirm the absence of indicators.)
Depth Matrix Redox Features (inches) Color (moist) % Color (moist) % Type1 Loc2 Texture Remarks
0-16 7. 5YR 2.5/1 100 2 C M Sandy
1Type: C=Concentration, D=Depletion, RM=Reduced Matrix, CS=Covered or Coated Sand Grains. 2Location: PL=Pore Lining, M=Matrix. Hydric Soil Indicators: (Applicable to all LRRs, unless otherwise noted.) Indicators for Problematic Hydric Soils3:
Histosol (A1) Sandy Redox (S5) 1 cm Muck (A9) (LRR C)
Histic Epipedon (A2) Stripped Matrix (S6) 2 cm Muck (A10) (LRR B)
Black Histic (A3) Loamy Mucky Mineral (F1) Reduced Vertic (F18)
Hydrogen Sulfide (A4) Loamy Gleyed Matrix (F2) Red Parent Material (TF2)
Stratified Layers (A5) (LRR C) Depleted Matrix (F3) Other (Explain in Remarks)
1 cm Muck (A9) (LRR D) Redox Dark Surface (F6)
Depleted Below Dark Surface (A11) Depleted Dark Surface (F7)
Thick Dark Surface (A12) Redox Depressions (F8) 3Indicators of hydrophytic vegetation and
Sandy Mucky Mineral (S1) Vernal Pools (F9) wetland hydrology must be present,
Sandy Gleyed Matrix (S4) unless disturbed or problematic.
Restrictive Layer (if present):
Type:
Depth (inches):
Hydric Soil Present? Yes X No
Remarks:
Hard, dry sand soil – no indications of redox or organic matter Although the soil does not exhibit any of the indicators from the Arid West Supplement, the soil is naturally problematic because the wetland has only formed since the removal of a tank in the 1940s. Hydric soils can take as long as 100 years to develop.
HYDROLOGY
Wetland Hydrology Indicators:
Primary Indicators (minimum of one required; check all that apply) Secondary Indicators (2 or more required)
Surface Water (A1) Salt Crust (B11) Water Marks (B1) (Riverine)
High Water Table (A2) X Biotic Crust (B12) Sediment Deposits (B2) (Riverine)
Saturation (A3) Aquatic Invertebrates (B13) Drift Deposits (B3) (Riverine)
Water Marks (B1) (Nonriverine) Hydrogen Sulfide Odor (C1) Drainage Patterns (B10)
Sediment Deposits (B2) (Nonriverine) Oxidized Rhizospheres along Living Roots (C3) Dry-Season Water Table (C2)
Drift Deposits (B3) (Nonriverine) Presence of Reduced Iron (C4) Crayfish Burrows (C8)
Surface Soil Cracks (B6) Recent Iron Reduction in Tilled Soils (C6) Saturation Visible on Aerial Imagery (C9)
Inundation Visible on Aerial Imagery (B7) Thin Muck Surface (C7) Shallow Aquitard (D3)
Water-Stained Leaves (B9) Other (Explain in Remarks) FAC-Neutral Test (D5)
Field Observations:
Surface Water Present? Yes No X Depth (inches):
Water Table Present? Yes No X Depth (inches):
Saturation Present? Yes No X Depth (inches): (includes capillary fringe)
Wetland Hydrology Present? Yes X No
Describe Recorded Data (stream gauge, monitoring well, aerial photos, previous inspections), if available: The basin was observed ponded at depths from 10 inches to 36 inches from December 17, 2004 through at least April 12, 2005. During this survey water was observed in the basin.
Remarks: Sampling point is on upland edge of drainage basin.

US Army Corps of Engineers Arid West – Version 2.0
WETLAND DETERMINATION DATA FORM – Arid West Region
Project/Site: Avila Tank Farm City/County: Avila Beach/San Luis Obispo County Sampling Date: 12/08/11
Applicant/Owner: Chevron Business and Real Estate Services State: CA Sampling Point: W1-02 Investigator(s): Thea Benson, Jennifer Langford, Padre Associates Section, Township, Range: San Miguelito Spanish Land Grant
Landform (hillslope, terrace, etc.): bottom of a detention basin Local relief (concave, convex, none): level Slope (%): 0-5
Subregion (LRR): Lat: 35.176 Long: -120.723 Datum: UGS 84
Soil Map Unit Name: Lopez very shaly clay loam NWI classification: Paulistrine emergent wetland
Are climatic / hydrologic conditions on the site typical for this time of year? Yes X No (If no, explain in Remarks.)
Are Vegetation No , Soil No , or Hydrology No significantly disturbed? Are “Normal Circumstances” present? Yes X No
Are Vegetation Yes , Soil Yes , or Hydrology No naturally problematic? (If needed, explain any answers in Remarks.)
SUMMARY OF FINDINGS – Attach site map showing sampling point locations, transects, important features, etc.
Hydrophytic Vegetation Present? Yes No X
Hydric Soil Present? Yes No X
Wetland Hydrology Present? Yes No X
Is the Sampled Area within a Federal Wetland? Yes No X Is the Sampled Area within a State Wetland? Yes No X
Remarks: This area is the lowest detention basin on the Avila site and a former tank location that was removed in the 1940’s. This area functions as an actively managed detention basin receiving surface runoff and from drainage from the upper detention basin (wetland 3).
VEGETATION – Use scientific names of plants.
Absolute Dominant Indicator Tree Stratum (Plot size: ) % Cover Species? Status
1.
2.
3.
4.
= Total Cover Sapling/Shrub Stratum (Plot size: 3 meter radius )
1. Isocoma menziesii 25 Yes
2. Baccharis pilularis 5
3.
4.
5.
30 = Total Cover Herb Stratum (Plot size: 3 meter radius)
1. Bromus hordeaceus 30 Yes FACU
2. Gnaphalium stramineum 10 Yes FAC
3. Vulpia myuros 5 No
4 Cyperus eragrostis 5 No FACW
5.
6.
7.
8.
50 = Total Cover Woody Vine Stratum (Plot size: )
1.
2.
= Total Cover % Bare Ground in Herb Stratum 30 % Cover of Biotic Crust 0
Dominance Test worksheet:
Number of Dominant Species That Are OBL, FACW, or FAC: 1 (A) Total Number of Dominant Species Across All Strata: 3 (B) Percent of Dominant Species That Are OBL, FACW, or FAC: 33% (A/B)
Prevalence Index worksheet:
Total % Cover of: Multiply by:
OBL species x 1 =
FACW species x 2 =
FAC species x 3 =
FACU species x 4 =
UPL species x 5 =
Column Totals: (A) (B)
Prevalence Index = B/A =
Hydrophytic Vegetation Indicators:
Dominance Test is >50%
Prevalence Index is ≤3.01
Morphological Adaptations1 (Provide supporting data in Remarks or on a separate sheet)
Problematic Hydrophytic Vegetation1 (Explain)
1Indicators of hydric soil and wetland hydrology must be present, unless disturbed or problematic.
Hydrophytic Vegetation Present? Yes No X
Remarks:
Sampling point is at upland edge of wetland vegetation bordering freshwater marsh. Sampling occurred when grasses were just beginning to germinate. Cover estimated based on remnants of grasses from last season.

US Army Corps of Engineers Arid West – Version 2.0
SOIL Sampling Point: W1-02
Profile Description: (Describe to the depth needed to document the indicator or confirm the absence of indicators.)
Depth Matrix Redox Features (inches) Color (moist) % Color (moist) % Type1 Loc2 Texture Remarks
0-16 5Y 2.5/1 100 Sandy clay loam
1Type: C=Concentration, D=Depletion, RM=Reduced Matrix, CS=Covered or Coated Sand Grains. 2Location: PL=Pore Lining, M=Matrix. Hydric Soil Indicators: (Applicable to all LRRs, unless otherwise noted.) Indicators for Problematic Hydric Soils3:
Histosol (A1) Sandy Redox (S5) 1 cm Muck (A9) (LRR C)
Histic Epipedon (A2) Stripped Matrix (S6) 2 cm Muck (A10) (LRR B)
Black Histic (A3) Loamy Mucky Mineral (F1) Reduced Vertic (F18)
Hydrogen Sulfide (A4) Loamy Gleyed Matrix (F2) Red Parent Material (TF2)
Stratified Layers (A5) (LRR C) Depleted Matrix (F3) Other (Explain in Remarks)
1 cm Muck (A9) (LRR D) Redox Dark Surface (F6)
Depleted Below Dark Surface (A11) Depleted Dark Surface (F7)
Thick Dark Surface (A12) Redox Depressions (F8) 3Indicators of hydrophytic vegetation and
Sandy Mucky Mineral (S1) Vernal Pools (F9) wetland hydrology must be present,
Sandy Gleyed Matrix (S4) unless disturbed or problematic.
Restrictive Layer (if present):
Type:
Depth (inches):
Hydric Soil Present? Yes No X
Remarks:
Although the soil does not exhibit any of the indicators from the Arid West Supplement, the soil is naturally problematic because the wetland has only formed since the removal of a tank in the 1940s. Hydric soils can take as long as 100 years to develop. Because hydrophytic vegetation is not present and the site does not have positive indicators of hydrology, hydric soil is presumed not present.
HYDROLOGY
Wetland Hydrology Indicators:
Primary Indicators (minimum of one required; check all that apply) Secondary Indicators (2 or more required)
Surface Water (A1) Salt Crust (B11) Water Marks (B1) (Riverine)
High Water Table (A2) Biotic Crust (B12) Sediment Deposits (B2) (Riverine)
Saturation (A3) Aquatic Invertebrates (B13) Drift Deposits (B3) (Riverine)
Water Marks (B1) (Nonriverine) Hydrogen Sulfide Odor (C1) Drainage Patterns (B10)
Sediment Deposits (B2) (Nonriverine) Oxidized Rhizospheres along Living Roots (C3) Dry-Season Water Table (C2)
Drift Deposits (B3) (Nonriverine) Presence of Reduced Iron (C4) Crayfish Burrows (C8)
Surface Soil Cracks (B6) Recent Iron Reduction in Tilled Soils (C6) Saturation Visible on Aerial Imagery (C9)
Inundation Visible on Aerial Imagery (B7) Thin Muck Surface (C7) Shallow Aquitard (D3)
Water-Stained Leaves (B9) Other (Explain in Remarks) FAC-Neutral Test (D5)
Field Observations:
Surface Water Present? Yes No Depth (inches):
Water Table Present? Yes No Depth (inches):
Saturation Present? Yes No Depth (inches): (includes capillary fringe)
Wetland Hydrology Present? Yes No X
Describe Recorded Data (stream gauge, monitoring well, aerial photos, previous inspections), if available:
Remarks:

US Army Corps of Engineers Arid West – Version 2.0
WETLAND DETERMINATION DATA FORM – Arid West Region
Project/Site: Avila Tank Farm City/County: Avila Beach/San Luis Obispo County Sampling Date: 12/08/11
Applicant/Owner: Chevron Business and Real Estate Services State: CA Sampling Point: W2-01 Investigator(s): Thea Benson, Jennifer Langford, Padre Associates Section, Township, Range: San Miguelito Spanish Land Grant
Landform (hillslope, terrace, etc.): depression Local relief (concave, convex, none): concave Slope (%): 0-5
Subregion (LRR): Lat: 35.176 Long: -120.723 Datum: UGS 84
Soil Map Unit Name: Lopez very shaly clay loam NWI classification: Paulistrine emergent wetland
Are climatic / hydrologic conditions on the site typical for this time of year? Yes X No (If no, explain in Remarks.)
Are Vegetation No , Soil No , or Hydrology No significantly disturbed? Are “Normal Circumstances” present? Yes X No
Are Vegetation No , Soil No , or Hydrology No naturally problematic? (If needed, explain any answers in Remarks.)
SUMMARY OF FINDINGS – Attach site map showing sampling point locations, transects, important features, etc.
Hydrophytic Vegetation Present? Yes X No
Hydric Soil Present? Yes X No
Wetland Hydrology Present? Yes X No
Is the Sampled Area within a Federal Wetland? Yes X No Is the Sampled Area within a State Wetland? Yes X No
Remarks: Small depressional area at site of former catch basin. Road and pad recently built east and south of area. Adjacent habitat is coastal scrub dominated by Baccharis pilularis, Artememisia californica, Toxicodendron diversilobum and Carpobrotus edulis.
VEGETATION – Use scientific names of plants.
Absolute Dominant Indicator Tree Stratum (Plot size: ) % Cover Species? Status
1.
2.
3.
4.
= Total Cover Sapling/Shrub Stratum (Plot size: )
1.
2.
3.
4.
5.
= Total Cover Herb Stratum (Plot size: 3 meter radius )
1. Cyperus eragrostis 40 Yes FACW
2. Polypogon monspeliensis 10 Yes FACW
3
4
5.
6.
7.
8.
50 = Total Cover Woody Vine Stratum (Plot size: )
1.
2.
= Total Cover % Bare Ground in Herb Stratum 50 % Cover of Biotic Crust 0
Dominance Test worksheet:
Number of Dominant Species That Are OBL, FACW, or FAC: 2 (A) Total Number of Dominant Species Across All Strata: 2 (B) Percent of Dominant Species That Are OBL, FACW, or FAC: 100% (A/B)
Prevalence Index worksheet:
Total % Cover of: Multiply by:
OBL species x 1 =
FACW species x 2 =
FAC species x 3 =
FACU species x 4 =
UPL species x 5 =
Column Totals: (A) (B)
Prevalence Index = B/A =
Hydrophytic Vegetation Indicators:
X Dominance Test is >50%
Prevalence Index is ≤3.01
Morphological Adaptations1 (Provide supporting data in Remarks or on a separate sheet)
Problematic Hydrophytic Vegetation1 (Explain)
1Indicators of hydric soil and wetland hydrology must be present, unless disturbed or problematic.
Hydrophytic Vegetation Present? Yes X No
Remarks:
.

US Army Corps of Engineers Arid West – Version 2.0
SOIL Sampling Point: W2-01
Profile Description: (Describe to the depth needed to document the indicator or confirm the absence of indicators.)
Depth Matrix Redox Features (inches) Color (moist) % Color (moist) % Type1 Loc2 Texture Remarks
0-2 2. 5Y 5/3 100 Sandy loam
2-16 2. 5Y 2.5/1 100 2% Loamy clay
1Type: C=Concentration, D=Depletion, RM=Reduced Matrix, CS=Covered or Coated Sand Grains. 2Location: PL=Pore Lining, M=Matrix. Hydric Soil Indicators: (Applicable to all LRRs, unless otherwise noted.) Indicators for Problematic Hydric Soils3:
Histosol (A1) Sandy Redox (S5) 1 cm Muck (A9) (LRR C)
Histic Epipedon (A2) Stripped Matrix (S6) 2 cm Muck (A10) (LRR B)
Black Histic (A3) Loamy Mucky Mineral (F1) Reduced Vertic (F18)
Hydrogen Sulfide (A4) Loamy Gleyed Matrix (F2) Red Parent Material (TF2)
Stratified Layers (A5) (LRR C) Depleted Matrix (F3) Other (Explain in Remarks)
1 cm Muck (A9) (LRR D) X Redox Dark Surface (F6)
Depleted Below Dark Surface (A11) Depleted Dark Surface (F7)
Thick Dark Surface (A12) Redox Depressions (F8) 3Indicators of hydrophytic vegetation and
Sandy Mucky Mineral (S1) Vernal Pools (F9) wetland hydrology must be present,
Sandy Gleyed Matrix (S4) unless disturbed or problematic.
Restrictive Layer (if present):
Type:
Depth (inches):
Hydric Soil Present? Yes X No Remarks:
The loamy clay showed redox. At 10 inches the soil was saturated and at 16 inches there was water in the pit.
HYDROLOGY
Wetland Hydrology Indicators:
Primary Indicators (minimum of one required; check all that apply) Secondary Indicators (2 or more required)
Surface Water (A1) Salt Crust (B11) Water Marks (B1) (Riverine)
X High Water Table (A2) Biotic Crust (B12) Sediment Deposits (B2) (Riverine)
Saturation (A3) Aquatic Invertebrates (B13) Drift Deposits (B3) (Riverine)
Water Marks (B1) (Nonriverine) Hydrogen Sulfide Odor (C1) Drainage Patterns (B10)
Sediment Deposits (B2) (Nonriverine) Oxidized Rhizospheres along Living Roots (C3) Dry-Season Water Table (C2)
Drift Deposits (B3) (Nonriverine) Presence of Reduced Iron (C4) Crayfish Burrows (C8)
X Surface Soil Cracks (B6) Recent Iron Reduction in Tilled Soils (C6) Saturation Visible on Aerial Imagery (C9)
Inundation Visible on Aerial Imagery (B7) Thin Muck Surface (C7) Shallow Aquitard (D3)
Water-Stained Leaves (B9) Other (Explain in Remarks) FAC-Neutral Test (D5)
Field Observations:
Surface Water Present? Yes No X Depth (inches):
Water Table Present? Yes X No Depth (inches): 16 INCHES
Saturation Present? Yes X No Depth (inches): 10 INCHES (includes capillary fringe)
Wetland Hydrology Present? Yes X No
Describe Recorded Data (stream gauge, monitoring well, aerial photos, previous inspections), if available:
Remarks:

US Army Corps of Engineers Arid West – Version 2.0
WETLAND DETERMINATION DATA FORM – Arid West Region
Project/Site: Avila Tank Farm City/County: Avila Beach/San Luis Obispo County Sampling Date: 12/08/11
Applicant/Owner: Chevron Business and Real Estate Services State: CA Sampling Point: W3-01 Investigator(s): Thea Benson, Jennifer Langford, Padre Associates Section, Township, Range: San Miguelito Spanish Land Grant
Landform (hillslope, terrace, etc.): bottom of a detention basin Local relief (concave, convex, none): convex Slope (%): 0-5
Subregion (LRR): Lat: 35.176 Long: -120.723 Datum: UGS 84
Soil Map Unit Name: Lopez very shaly clay loam NWI classification: Paulistrine emergent wetland
Are climatic / hydrologic conditions on the site typical for this time of year? Yes X No (If no, explain in Remarks.)
Are Vegetation No , Soil No , or Hydrology No significantly disturbed? Are “Normal Circumstances” present? Yes X No
Are Vegetation No , Soil Yes , or Hydrology No naturally problematic? (If needed, explain any answers in Remarks.)
SUMMARY OF FINDINGS – Attach site map showing sampling point locations, transects, important features, etc.
Hydrophytic Vegetation Present? Yes X No
Hydric Soil Present? Yes X No
Wetland Hydrology Present? Yes X No
Is the Sampled Area within a Federal Wetland? Yes X No Is the Sampled Area within a State Wetland? Yes X No
Remarks: This area is considered the upper detention basin on the Avila site and a former tank location that was removed in 1950. This area functions as an actively managed detention basin receiving surface runoff and draining to lower detention basin (wetland 1).
VEGETATION – Use scientific names of plants.
Absolute Dominant Indicator Tree Stratum (Plot size: ) % Cover Species? Status
1.
2.
3.
4.
= Total Cover Sapling/Shrub Stratum (Plot size: )
1.
2.
3.
4.
5.
= Total Cover Herb Stratum (Plot size: 3 meter radius )
1. Cyperus eragrostis 50 Yes FACW
2. Plantago lanceolata 15 Yes FAC
3. Plantago major 2 No FACW
4 Gnaphalium stramineum 2 No FAC
5.
6.
7.
8.
69 = Total Cover Woody Vine Stratum (Plot size: )
1.
2.
= Total Cover % Bare Ground in Herb Stratum 30 % Cover of Biotic Crust 0
Dominance Test worksheet:
Number of Dominant Species That Are OBL, FACW, or FAC: 2 (A) Total Number of Dominant Species Across All Strata: 2 (B) Percent of Dominant Species That Are OBL, FACW, or FAC: 100% (A/B)
Prevalence Index worksheet:
Total % Cover of: Multiply by:
OBL species x 1 =
FACW species x 2 =
FAC species x 3 =
FACU species x 4 =
UPL species x 5 =
Column Totals: (A) (B)
Prevalence Index = B/A =
Hydrophytic Vegetation Indicators:
X Dominance Test is >50%
Prevalence Index is ≤3.01
Morphological Adaptations1 (Provide supporting data in Remarks or on a separate sheet)
Problematic Hydrophytic Vegetation1 (Explain)
1Indicators of hydric soil and wetland hydrology must be present, unless disturbed or problematic.
Hydrophytic Vegetation Present? Yes X No
Remarks:
Site is located in an actively managed detention basin. The berms to the basin are vegetated with Baccharis pilularis and Carpobrotus edulis. At inlets to the basins, Isocoma menziesii and Cyperus eragrostis are common

US Army Corps of Engineers Arid West – Version 2.0
SOIL Sampling Point: W3-01
Profile Description: (Describe to the depth needed to document the indicator or confirm the absence of indicators.)
Depth Matrix Redox Features (inches) Color (moist) % Color (moist) % Type1 Loc2 Texture Remarks
0-16 7. 5YR 2.5/1 100 Loamy sand
1Type: C=Concentration, D=Depletion, RM=Reduced Matrix, CS=Covered or Coated Sand Grains. 2Location: PL=Pore Lining, M=Matrix. Hydric Soil Indicators: (Applicable to all LRRs, unless otherwise noted.) Indicators for Problematic Hydric Soils3:
Histosol (A1) Sandy Redox (S5) 1 cm Muck (A9) (LRR C)
Histic Epipedon (A2) Stripped Matrix (S6) 2 cm Muck (A10) (LRR B)
Black Histic (A3) Loamy Mucky Mineral (F1) Reduced Vertic (F18)
Hydrogen Sulfide (A4) Loamy Gleyed Matrix (F2) Red Parent Material (TF2)
Stratified Layers (A5) (LRR C) Depleted Matrix (F3) Other (Explain in Remarks)
1 cm Muck (A9) (LRR D) Redox Dark Surface (F6)
Depleted Below Dark Surface (A11) Depleted Dark Surface (F7)
Thick Dark Surface (A12) Redox Depressions (F8) 3Indicators of hydrophytic vegetation and
Sandy Mucky Mineral (S1) Vernal Pools (F9) wetland hydrology must be present,
Sandy Gleyed Matrix (S4) unless disturbed or problematic.
Restrictive Layer (if present):
Type:
Depth (inches):
Hydric Soil Present? Yes X No
Remarks:
Although the soil does not exhibit any of the indicators from the Arid West Supplement, the soil is naturally problematic because the wetland has only formed since the removal of a tank in the 1940s. Hydric soils can take as long as 100 years to develop. Because hydrology and hydrophytic vegetation are present, hydric soil was deemed present.
HYDROLOGY
Wetland Hydrology Indicators:
Primary Indicators (minimum of one required; check all that apply) Secondary Indicators (2 or more required)
X Surface Water (A1) Salt Crust (B11) Water Marks (B1) (Riverine)
High Water Table (A2) X Biotic Crust (B12) Sediment Deposits (B2) (Riverine)
Saturation (A3) Aquatic Invertebrates (B13) Drift Deposits (B3) (Riverine)
Water Marks (B1) (Nonriverine) Hydrogen Sulfide Odor (C1) Drainage Patterns (B10)
Sediment Deposits (B2) (Nonriverine) Oxidized Rhizospheres along Living Roots (C3) Dry-Season Water Table (C2)
Drift Deposits (B3) (Nonriverine) Presence of Reduced Iron (C4) Crayfish Burrows (C8)
Surface Soil Cracks (B6) Recent Iron Reduction in Tilled Soils (C6) Saturation Visible on Aerial Imagery (C9)
Inundation Visible on Aerial Imagery (B7) Thin Muck Surface (C7) Shallow Aquitard (D3)
Water-Stained Leaves (B9) Other (Explain in Remarks) FAC-Neutral Test (D5)
Field Observations:
Surface Water Present? Yes X No Depth (inches): 0-2 inches
Water Table Present? Yes No Depth (inches):
Saturation Present? Yes No Depth (inches): (includes capillary fringe)
Wetland Hydrology Present? Yes X No
Describe Recorded Data (stream gauge, monitoring well, aerial photos, previous inspections), if available: This basin was observed saturated and ponded at depths from 6 inches to 24 inches from December 17, 2004 through at least April 12, 2005.
Remarks: T

US Army Corps of Engineers Arid West – Version 2.0
WETLAND DETERMINATION DATA FORM – Arid West Region
Project/Site: Avila Tank Farm City/County: Avila Beach/San Luis Obispo County Sampling Date: 12/08/11
Applicant/Owner: Chevron Business and Real Estate Services State: CA Sampling Point: W3-02 Investigator(s): Thea Benson, Jennifer Langford, Padre Associates Section, Township, Range: San Miguelito Spanish Land Grant
Landform (hillslope, terrace, etc.): detention basin hillside Local relief (concave, convex, none): none Slope (%): 35
Subregion (LRR): Lat: 35.176 Long: -120.723 Datum: UGS 84
Soil Map Unit Name: Lopez very shaly clay loam NWI classification: Paulistrine emergent wetland
Are climatic / hydrologic conditions on the site typical for this time of year? Yes X No (If no, explain in Remarks.)
Are Vegetation No , Soil No , or Hydrology No significantly disturbed? Are “Normal Circumstances” present? Yes X No
Are Vegetation Yes , Soil No , or Hydrology No naturally problematic? (If needed, explain any answers in Remarks.)
SUMMARY OF FINDINGS – Attach site map showing sampling point locations, transects, important features, etc.
Hydrophytic Vegetation Present? Yes X No
Hydric Soil Present? Yes No X
Wetland Hydrology Present? Yes No X
Is the Sampled Area within a Federal Wetland? Yes No X Is the Sampled Area within a State Wetland? Yes X No
Remarks: Observation point is on northeast corner of detention basin, on slope at apparent drainage into basin from road runoff.
VEGETATION – Use scientific names of plants.
Absolute Dominant Indicator Tree Stratum (Plot size: ) % Cover Species? Status
1.
2.
3.
4.
= Total Cover Sapling/Shrub Stratum (Plot size: )
1.
2.
3.
4.
5.
= Total Cover Herb Stratum (Plot size: 3 meter radius )
1. Cyperus eragrostis 25 Yes FACW
2. Polypogon monspeliensis 25 Yes FACW
3. Rumex crispus 3 No FACW
4. Gnaphalium stramineum 1 No FAC
5.
6.
7.
8.
54 = Total Cover Woody Vine Stratum (Plot size: )
1.
2.
= Total Cover % Bare Ground in Herb Stratum 50 % Cover of Biotic Crust 0
Dominance Test worksheet:
Number of Dominant Species That Are OBL, FACW, or FAC: 2 (A) Total Number of Dominant Species Across All Strata: 2 (B) Percent of Dominant Species That Are OBL, FACW, or FAC: 100% (A/B)
Prevalence Index worksheet:
Total % Cover of: Multiply by:
OBL species x 1 =
FACW species x 2 =
FAC species x 3 =
FACU species x 4 =
UPL species x 5 =
Column Totals: (A) (B)
Prevalence Index = B/A =
Hydrophytic Vegetation Indicators:
Dominance Test is >50%
Prevalence Index is ≤3.01
Morphological Adaptations1 (Provide supporting data in Remarks or on a separate sheet)
Problematic Hydrophytic Vegetation1 (Explain)
1Indicators of hydric soil and wetland hydrology must be present, unless disturbed or problematic.
Hydrophytic Vegetation Present? Yes X No
Remarks:

US Army Corps of Engineers Arid West – Version 2.0
SOIL Sampling Point: W3-02
Profile Description: (Describe to the depth needed to document the indicator or confirm the absence of indicators.)
Depth Matrix Redox Features (inches) Color (moist) % Color (moist) % Type1 Loc2 Texture Remarks
0-16 7. 5YR 3/1 100 Loam
1Type: C=Concentration, D=Depletion, RM=Reduced Matrix, CS=Covered or Coated Sand Grains. 2Location: PL=Pore Lining, M=Matrix. Hydric Soil Indicators: (Applicable to all LRRs, unless otherwise noted.) Indicators for Problematic Hydric Soils3:
Histosol (A1) Sandy Redox (S5) 1 cm Muck (A9) (LRR C)
Histic Epipedon (A2) Stripped Matrix (S6) 2 cm Muck (A10) (LRR B)
Black Histic (A3) Loamy Mucky Mineral (F1) Reduced Vertic (F18)
Hydrogen Sulfide (A4) Loamy Gleyed Matrix (F2) Red Parent Material (TF2)
Stratified Layers (A5) (LRR C) Depleted Matrix (F3) Other (Explain in Remarks)
1 cm Muck (A9) (LRR D) Redox Dark Surface (F6)
Depleted Below Dark Surface (A11) Depleted Dark Surface (F7)
Thick Dark Surface (A12) Redox Depressions (F8) 3Indicators of hydrophytic vegetation and
Sandy Mucky Mineral (S1) Vernal Pools (F9) wetland hydrology must be present,
Sandy Gleyed Matrix (S4) unless disturbed or problematic.
Restrictive Layer (if present):
Type:
Depth (inches):
Hydric Soil Present? Yes No X
Remarks: Unlike many of the other sampling points, the sampling point does not occur in the bottom of a former tank location. The sampling point is located on the upland edge of the drainage basin and the soils are not problematic.
HYDROLOGY
Wetland Hydrology Indicators:
Primary Indicators (minimum of one required; check all that apply) Secondary Indicators (2 or more required)
Surface Water (A1) Salt Crust (B11) Water Marks (B1) (Riverine)
High Water Table (A2) Biotic Crust (B12) Sediment Deposits (B2) (Riverine)
Saturation (A3) Aquatic Invertebrates (B13) Drift Deposits (B3) (Riverine)
Water Marks (B1) (Nonriverine) Hydrogen Sulfide Odor (C1) x Drainage Patterns (B10)
Sediment Deposits (B2) (Nonriverine) Oxidized Rhizospheres along Living Roots (C3) Dry-Season Water Table (C2)
Drift Deposits (B3) (Nonriverine) Presence of Reduced Iron (C4) Crayfish Burrows (C8)
Surface Soil Cracks (B6) Recent Iron Reduction in Tilled Soils (C6) Saturation Visible on Aerial Imagery (C9)
Inundation Visible on Aerial Imagery (B7) Thin Muck Surface (C7) Shallow Aquitard (D3)
Water-Stained Leaves (B9) Other (Explain in Remarks) FAC-Neutral Test (D5)
Field Observations:
Surface Water Present? Yes No X Depth (inches):
Water Table Present? Yes No X Depth (inches):
Saturation Present? Yes No X Depth (inches): (includes capillary fringe)
Wetland Hydrology Present? Yes No X
Describe Recorded Data (stream gauge, monitoring well, aerial photos, previous inspections), if available:
Remarks: Sampling point is on upland edge of drainage basin where drainage from runoff occurs,

US Army Corps of Engineers Arid West – Version 2.0
WETLAND DETERMINATION DATA FORM – Arid West Region
Project/Site: Avila Tank Farm City/County: Avila Beach/San Luis Obispo County Sampling Date: 12/08/11
Applicant/Owner: Chevron Business and Real Estate Services State: CA Sampling Point: W3-03 Investigator(s): Thea Benson, Jennifer Langford, Padre Associates Section, Township, Range: San Miguelito Spanish Land Grant
Landform (hillslope, terrace, etc.): detention basin hillside Local relief (concave, convex, none): none Slope (%): 35
Subregion (LRR): Lat: 35.176 Long: -120.723 Datum: UGS 84
Soil Map Unit Name: Lopez very shaly clay loam NWI classification: Paulistrine emergent wetland
Are climatic / hydrologic conditions on the site typical for this time of year? Yes X No (If no, explain in Remarks.)
Are Vegetation No , Soil No , or Hydrology No significantly disturbed? Are “Normal Circumstances” present? Yes X No
Are Vegetation No , Soil No , or Hydrology No naturally problematic? (If needed, explain any answers in Remarks.)
SUMMARY OF FINDINGS – Attach site map showing sampling point locations, transects, important features, etc.
Hydrophytic Vegetation Present? Yes No X
Hydric Soil Present? Yes No X
Wetland Hydrology Present? Yes No X
Is the Sampled Area within a Federal Wetland? Yes No X Is the Sampled Area within a State Wetland? Yes No X
Remarks: Observation point is uphill from Sampling Point W3-02
VEGETATION – Use scientific names of plants.
Absolute Dominant Indicator Tree Stratum (Plot size: ) % Cover Species? Status
1.
2.
3.
4.
= Total Cover Sapling/Shrub Stratum (Plot size: : 3 meter radius )
1. Isocoma menziesii 40 Yes
2.
3.
4.
5.
40 = Total Cover Herb Stratum (Plot size: 3 meter radius )
1. Polypogon monspeliensis 50 Yes FACW
2. Cyperus eragrostis 10 No FACW
3. Geraneum dissectum 2 No FACW
4. Gnaphalium stramineum 1 No FAC
5.
6.
7.
8.
63 = Total Cover Woody Vine Stratum (Plot size: )
1.
2.
= Total Cover % Bare Ground in Herb Stratum 40 % Cover of Biotic Crust 0
Dominance Test worksheet:
Number of Dominant Species That Are OBL, FACW, or FAC: 1 (A) Total Number of Dominant Species Across All Strata: 2 (B) Percent of Dominant Species That Are OBL, FACW, or FAC: 50% (A/B)
Prevalence Index worksheet:
Total % Cover of: Multiply by:
OBL species x 1 =
FACW species x 2 =
FAC species x 3 =
FACU species x 4 =
UPL species x 5 =
Column Totals: (A) (B)
Prevalence Index = B/A =
Hydrophytic Vegetation Indicators:
Dominance Test is >50%
Prevalence Index is ≤3.01
Morphological Adaptations1 (Provide supporting data in Remarks or on a separate sheet)
Problematic Hydrophytic Vegetation1 (Explain)
1Indicators of hydric soil and wetland hydrology must be present, unless disturbed or problematic.
Hydrophytic Vegetation Present? Yes No X
Remarks:
Sampling occurred when grasses were just beginning to germinate. Cover estimated based on remnants of grasses from last season.

US Army Corps of Engineers Arid West – Version 2.0
SOIL Sampling Point: W3-03
Profile Description: (Describe to the depth needed to document the indicator or confirm the absence of indicators.)
Depth Matrix Redox Features (inches) Color (moist) % Color (moist) % Type1 Loc2 Texture Remarks
0-16 10YR 3/1 100 Sandy
1Type: C=Concentration, D=Depletion, RM=Reduced Matrix, CS=Covered or Coated Sand Grains. 2Location: PL=Pore Lining, M=Matrix. Hydric Soil Indicators: (Applicable to all LRRs, unless otherwise noted.) Indicators for Problematic Hydric Soils3:
Histosol (A1) Sandy Redox (S5) 1 cm Muck (A9) (LRR C)
Histic Epipedon (A2) Stripped Matrix (S6) 2 cm Muck (A10) (LRR B)
Black Histic (A3) Loamy Mucky Mineral (F1) Reduced Vertic (F18)
Hydrogen Sulfide (A4) Loamy Gleyed Matrix (F2) Red Parent Material (TF2)
Stratified Layers (A5) (LRR C) Depleted Matrix (F3) Other (Explain in Remarks)
1 cm Muck (A9) (LRR D) Redox Dark Surface (F6)
Depleted Below Dark Surface (A11) Depleted Dark Surface (F7)
Thick Dark Surface (A12) Redox Depressions (F8) 3Indicators of hydrophytic vegetation and
Sandy Mucky Mineral (S1) Vernal Pools (F9) wetland hydrology must be present,
Sandy Gleyed Matrix (S4) unless disturbed or problematic.
Restrictive Layer (if present):
Type:
Depth (inches):
Hydric Soil Present? Yes No X
Remarks:
Unlike many of the other sampling points, this sampling point does not occur in the bottom of a former tank location. The sampling point is located on the upland edge of the drainage basin and the soils are not problematic.
HYDROLOGY
Wetland Hydrology Indicators:
Primary Indicators (minimum of one required; check all that apply) Secondary Indicators (2 or more required)
Surface Water (A1) Salt Crust (B11) Water Marks (B1) (Riverine)
High Water Table (A2) Biotic Crust (B12) Sediment Deposits (B2) (Riverine)
Saturation (A3) Aquatic Invertebrates (B13) Drift Deposits (B3) (Riverine)
Water Marks (B1) (Nonriverine) Hydrogen Sulfide Odor (C1) x Drainage Patterns (B10)
Sediment Deposits (B2) (Nonriverine) Oxidized Rhizospheres along Living Roots (C3) Dry-Season Water Table (C2)
Drift Deposits (B3) (Nonriverine) Presence of Reduced Iron (C4) Crayfish Burrows (C8)
Surface Soil Cracks (B6) Recent Iron Reduction in Tilled Soils (C6) Saturation Visible on Aerial Imagery (C9)
Inundation Visible on Aerial Imagery (B7) Thin Muck Surface (C7) Shallow Aquitard (D3)
Water-Stained Leaves (B9) Other (Explain in Remarks) FAC-Neutral Test (D5)
Field Observations:
Surface Water Present? Yes No X Depth (inches):
Water Table Present? Yes No X Depth (inches):
Saturation Present? Yes No X Depth (inches): (includes capillary fringe)
Wetland Hydrology Present? Yes No X
Describe Recorded Data (stream gauge, monitoring well, aerial photos, previous inspections), if available:
Remarks: Sampling point is on upland edge of drainage basin where drainage from runoff occurs;

US Army Corps of Engineers Arid West – Version 2.0
WETLAND DETERMINATION DATA FORM – Arid West Region
Project/Site: Avila Tank Farm City/County: Avila Beach/San Luis Obispo County Sampling Date: 12/08/11
Applicant/Owner: Chevron Business and Real Estate Services State: CA Sampling Point: W3-04 Investigator(s): Thea Benson, Jennifer Langford, Padre Associates Section, Township, Range: San Miguelito Spanish Land Grant
Landform (hillslope, terrace, etc.): depression Local relief (concave, convex, none): level Slope (%): 3-5
Subregion (LRR): Lat: 35.176 Long: -120.723 Datum: UGS 84
Soil Map Unit Name: Lopez very shaly clay loam NWI classification: Paulistrine emergent wetland
Are climatic / hydrologic conditions on the site typical for this time of year? Yes X No (If no, explain in Remarks.)
Are Vegetation No , Soil No , or Hydrology No significantly disturbed? Are “Normal Circumstances” present? Yes X No
Are Vegetation No , Soil Yes , or Hydrology No naturally problematic? (If needed, explain any answers in Remarks.)
SUMMARY OF FINDINGS – Attach site map showing sampling point locations, transects, important features, etc.
Hydrophytic Vegetation Present? Yes X No
Hydric Soil Present? Yes No X
Wetland Hydrology Present? Yes No X
Is the Sampled Area within a Federal Wetland? Yes No X Is the Sampled Area within a State Wetland? Yes X No
Remarks: Sampling point is in depression north of Wetland 3 receiving road runoff
VEGETATION – Use scientific names of plants.
Absolute Dominant Indicator Tree Stratum (Plot size: ) % Cover Species? Status
1.
2.
3.
4.
= Total Cover Sapling/Shrub Stratum (Plot size: : 3 meter radius )
1. Isocoma menziesii 40 Yes
2.
3.
4.
5.
40 = Total Cover Herb Stratum (Plot size: 3 meter radius )
1. Polypogon monspeliensis 25 Yes FACW
2. Cyperus eragrostis 15 Yes FACW
3. Bromus hordeaceus 10 No FACU
4. Lolium perenne 10 No FAC
5. Gnaphalium straminium (Gnaphalium chilense) 5 No FAC
6. Epilobium ciliatum 3 No FACW
7.
8.
68 = Total Cover Woody Vine Stratum (Plot size: )
1.
2.
= Total Cover % Bare Ground in Herb Stratum 40 % Cover of Biotic Crust 0
Dominance Test worksheet:
Number of Dominant Species That Are OBL, FACW, or FAC: 2 (A) Total Number of Dominant Species Across All Strata: 3 (B) Percent of Dominant Species That Are OBL, FACW, or FAC: 67% (A/B)
Prevalence Index worksheet:
Total % Cover of: Multiply by:
OBL species x 1 =
FACW species x 2 =
FAC species x 3 =
FACU species x 4 =
UPL species x 5 =
Column Totals: (A) (B)
Prevalence Index = B/A =
Hydrophytic Vegetation Indicators:
X Dominance Test is >50%
Prevalence Index is ≤3.01
Morphological Adaptations1 (Provide supporting data in Remarks or on a separate sheet)
Problematic Hydrophytic Vegetation1 (Explain)
1Indicators of hydric soil and wetland hydrology must be present, unless disturbed or problematic.
Hydrophytic Vegetation Present? Yes X No
Remarks:
Sampling occurred when grasses were just beginning to germinate. Cover estimated based on remnants of grasses from last season.

US Army Corps of Engineers Arid West – Version 2.0
SOIL Sampling Point: W3-04
Profile Description: (Describe to the depth needed to document the indicator or confirm the absence of indicators.)
Depth Matrix Redox Features (inches) Color (moist) % Color (moist) % Type1 Loc2 Texture Remarks
0-3 7.5YR 2.5/1 100 Sandy
3+ 2.5YR 6/4 100 Sand/rock
1Type: C=Concentration, D=Depletion, RM=Reduced Matrix, CS=Covered or Coated Sand Grains. 2Location: PL=Pore Lining, M=Matrix. Hydric Soil Indicators: (Applicable to all LRRs, unless otherwise noted.) Indicators for Problematic Hydric Soils3:
Histosol (A1) Sandy Redox (S5) 1 cm Muck (A9) (LRR C)
Histic Epipedon (A2) Stripped Matrix (S6) 2 cm Muck (A10) (LRR B)
Black Histic (A3) Loamy Mucky Mineral (F1) Reduced Vertic (F18)
Hydrogen Sulfide (A4) Loamy Gleyed Matrix (F2) Red Parent Material (TF2)
Stratified Layers (A5) (LRR C) Depleted Matrix (F3) Other (Explain in Remarks)
1 cm Muck (A9) (LRR D) Redox Dark Surface (F6)
Depleted Below Dark Surface (A11) Depleted Dark Surface (F7)
Thick Dark Surface (A12) Redox Depressions (F8) 3Indicators of hydrophytic vegetation and
Sandy Mucky Mineral (S1) Vernal Pools (F9) wetland hydrology must be present,
Sandy Gleyed Matrix (S4) unless disturbed or problematic.
Restrictive Layer (if present):
Type: sand rock
Depth (inches): 3 inches
Hydric Soil Present? Yes No X
Remarks:
Unlike many of the other sampling points, this sampling point does not occur in the bottom of a former tank location. The sampling point is located on the upland edge of the drainage basin and the soils are not problematic.
HYDROLOGY
Wetland Hydrology Indicators:
Primary Indicators (minimum of one required; check all that apply) Secondary Indicators (2 or more required)
Surface Water (A1) Salt Crust (B11) Water Marks (B1) (Riverine)
High Water Table (A2) Biotic Crust (B12) Sediment Deposits (B2) (Riverine)
Saturation (A3) Aquatic Invertebrates (B13) Drift Deposits (B3) (Riverine)
Water Marks (B1) (Nonriverine) Hydrogen Sulfide Odor (C1) Drainage Patterns (B10)
Sediment Deposits (B2) (Nonriverine) Oxidized Rhizospheres along Living Roots (C3) Dry-Season Water Table (C2)
Drift Deposits (B3) (Nonriverine) Presence of Reduced Iron (C4) Crayfish Burrows (C8)
Surface Soil Cracks (B6) Recent Iron Reduction in Tilled Soils (C6) Saturation Visible on Aerial Imagery (C9)
Inundation Visible on Aerial Imagery (B7) Thin Muck Surface (C7) X Shallow Aquitard (D3)
Water-Stained Leaves (B9) Other (Explain in Remarks) FAC-Neutral Test (D5)
Field Observations:
Surface Water Present? Yes No X Depth (inches):
Water Table Present? Yes No X Depth (inches):
Saturation Present? Yes No X Depth (inches): (includes capillary fringe)
Wetland Hydrology Present? Yes No X
Describe Recorded Data (stream gauge, monitoring well, aerial photos, previous inspections), if available:
Remarks:

US Army Corps of Engineers Arid West – Version 2.0
WETLAND DETERMINATION DATA FORM – Arid West Region
Project/Site: Avila Tank Farm City/County: Avila Beach/San Luis Obispo County Sampling Date: 12/08/11
Applicant/Owner: Chevron Business and Real Estate Services State: CA Sampling Point: W4-01 Investigator(s): Thea Benson, Jennifer Langford, Padre Associates Section, Township, Range: San Miguelito Spanish Land Grant
Landform (hillslope, terrace, etc.): detention basin bottom Local relief (concave, convex, none): convex Slope (%): 0-3
Subregion (LRR): Lat: 35.176 Long: -120.723 Datum: UGS 84
Soil Map Unit Name: Lopez very shaly clay loam NWI classification: Paulistrine emergent wetland
Are climatic / hydrologic conditions on the site typical for this time of year? Yes X No (If no, explain in Remarks.)
Are Vegetation No , Soil No , or Hydrology No significantly disturbed? Are “Normal Circumstances” present? Yes X No
Are Vegetation No , Soil Yes , or Hydrology No naturally problematic? (If needed, explain any answers in Remarks.)
SUMMARY OF FINDINGS – Attach site map showing sampling point locations, transects, important features, etc.
Hydrophytic Vegetation Present? Yes X No
Hydric Soil Present? Yes X No
Wetland Hydrology Present? Yes X No
Is the Sampled Area within a Federal Wetland? Yes X No Is the Sampled Area within a State Wetland? Yes X No
Remarks: The area is a basin from a former tank location that was removed in 1998 and receives localized surface runoff.
VEGETATION – Use scientific names of plants.
Absolute Dominant Indicator Tree Stratum (Plot size: ) % Cover Species? Status
1.
2.
3.
4.
= Total Cover Sapling/Shrub Stratum (Plot size: )
1.
2.
3.
4.
5.
= Total Cover Herb Stratum (Plot size: 3 meter radius )
1. Cyperus eragrostis 40 Yes FACW
2.
3.
4.
5.
6.
7.
8.
40 = Total Cover Woody Vine Stratum (Plot size: )
1.
2.
= Total Cover % Bare Ground in Herb Stratum 60 % Cover of Biotic Crust 0
Dominance Test worksheet:
Number of Dominant Species That Are OBL, FACW, or FAC: 1 (A) Total Number of Dominant Species Across All Strata: 1 (B) Percent of Dominant Species That Are OBL, FACW, or FAC: 100% (A/B)
Prevalence Index worksheet:
Total % Cover of: Multiply by:
OBL species x 1 =
FACW species x 2 =
FAC species x 3 =
FACU species x 4 =
UPL species x 5 =
Column Totals: (A) (B)
Prevalence Index = B/A =
Hydrophytic Vegetation Indicators:
X Dominance Test is >50%
Prevalence Index is ≤3.01
Morphological Adaptations1 (Provide supporting data in Remarks or on a separate sheet)
Problematic Hydrophytic Vegetation1 (Explain)
1Indicators of hydric soil and wetland hydrology must be present, unless disturbed or problematic.
Hydrophytic Vegetation Present? Yes X No
Remarks:

US Army Corps of Engineers Arid West – Version 2.0
SOIL Sampling Point: W4-01
Profile Description: (Describe to the depth needed to document the indicator or confirm the absence of indicators.)
Depth Matrix Redox Features (inches) Color (moist) % Color (moist) % Type1 Loc2 Texture Remarks
1Type: C=Concentration, D=Depletion, RM=Reduced Matrix, CS=Covered or Coated Sand Grains. 2Location: PL=Pore Lining, M=Matrix. Hydric Soil Indicators: (Applicable to all LRRs, unless otherwise noted.) Indicators for Problematic Hydric Soils3:
Histosol (A1) Sandy Redox (S5) 1 cm Muck (A9) (LRR C)
Histic Epipedon (A2) Stripped Matrix (S6) 2 cm Muck (A10) (LRR B)
Black Histic (A3) Loamy Mucky Mineral (F1) Reduced Vertic (F18)
Hydrogen Sulfide (A4) Loamy Gleyed Matrix (F2) Red Parent Material (TF2)
Stratified Layers (A5) (LRR C) Depleted Matrix (F3) Other (Explain in Remarks)
1 cm Muck (A9) (LRR D) Redox Dark Surface (F6)
Depleted Below Dark Surface (A11) Depleted Dark Surface (F7)
Thick Dark Surface (A12) Redox Depressions (F8) 3Indicators of hydrophytic vegetation and
Sandy Mucky Mineral (S1) Vernal Pools (F9) wetland hydrology must be present,
Sandy Gleyed Matrix (S4) unless disturbed or problematic.
Restrictive Layer (if present):
Type:
Depth (inches):
Hydric Soil Present? Yes X No
Remarks:
A soil sample was not examined at this point because the sampling point was flooded; Because hydrophytic vegetation and positive indicators of hydrology were present, it is presumed that soil conditions are present.
HYDROLOGY
Wetland Hydrology Indicators:
Primary Indicators (minimum of one required; check all that apply) Secondary Indicators (2 or more required)
X Surface Water (A1) Salt Crust (B11) Water Marks (B1) (Riverine)
High Water Table (A2) Biotic Crust (B12) Sediment Deposits (B2) (Riverine)
X Saturation (A3) Aquatic Invertebrates (B13) Drift Deposits (B3) (Riverine)
Water Marks (B1) (Nonriverine) Hydrogen Sulfide Odor (C1) x Drainage Patterns (B10)
Sediment Deposits (B2) (Nonriverine) Oxidized Rhizospheres along Living Roots (C3) Dry-Season Water Table (C2)
Drift Deposits (B3) (Nonriverine) Presence of Reduced Iron (C4) Crayfish Burrows (C8)
Surface Soil Cracks (B6) Recent Iron Reduction in Tilled Soils (C6) Saturation Visible on Aerial Imagery (C9)
Inundation Visible on Aerial Imagery (B7) Thin Muck Surface (C7) X Shallow Aquitard (D3)
Water-Stained Leaves (B9) Other (Explain in Remarks) FAC-Neutral Test (D5)
Field Observations:
Surface Water Present? Yes X No Depth (inches): 1
Water Table Present? Yes X No Depth (inches):
Saturation Present? Yes X No Depth (inches): (includes capillary fringe)
Wetland Hydrology Present? Yes X No
Describe Recorded Data (stream gauge, monitoring well, aerial photos, previous inspections), if available: This area is a basin from a former tank location that was removed in 1998 and receives localized surface runoff. This basin was observed ponded at depths from 3-18 inches from December 17, 2004 through at least April 12, 2005.
Remarks: Sampling point is on upland edge of drainage basin where drainage from runoff occurs;

US Army Corps of Engineers Arid West – Version 2.0
WETLAND DETERMINATION DATA FORM – Arid West Region
Project/Site: Avila Tank Farm City/County: Avila Beach/San Luis Obispo County Sampling Date: 12/08/11
Applicant/Owner: Chevron Business and Real Estate Services State: CA Sampling Point: W4-02 Investigator(s): Thea Benson, Jennifer Langford, Padre Associates Section, Township, Range: San Miguelito Spanish Land Grant
Landform (hillslope, terrace, etc.): detention basin bottom Local relief (concave, convex, none): Convex Slope (%): 0-3
Subregion (LRR): Lat: 35.176 Long: -120.723 Datum: UGS 84
Soil Map Unit Name: Lopez very shaly clay loam NWI classification: Paulistrine emergent wetland
Are climatic / hydrologic conditions on the site typical for this time of year? Yes X No (If no, explain in Remarks.)
Are Vegetation No , Soil No , or Hydrology No significantly disturbed? Are “Normal Circumstances” present? Yes X No
Are Vegetation Yes , Soil Yes , or Hydrology No naturally problematic? (If needed, explain any answers in Remarks.)
SUMMARY OF FINDINGS – Attach site map showing sampling point locations, transects, important features, etc.
Hydrophytic Vegetation Present? Yes No X
Hydric Soil Present? Yes No X
Wetland Hydrology Present? Yes No X
Is the Sampled Area within a Federal Wetland? Yes No X Is the Sampled Area within a State Wetland? Yes No X
Remarks: Sampling point is within tank bottom but outside wetland boundary.
VEGETATION – Use scientific names of plants.
Absolute Dominant Indicator Tree Stratum (Plot size: ) % Cover Species? Status
1.
2.
3.
4.
= Total Cover Sapling/Shrub Stratum (Plot size: : 3 meter radius )
1. Isocoma menziesii 35 Yes
2.
3.
4.
5.
35 = Total Cover Herb Stratum (Plot size: 3 meter radius )
1. Bromus hordeaceous (Bromus mollis) 40 Yes FACU
2. Lolium multiflorum (Lolium perenne) 40 Yes FACW
3. Trifolium fragiferum 3 No FACW
4. Geranium disectum 1 No
5.
6.
7.
8.
84 = Total Cover Woody Vine Stratum (Plot size: )
1.
2.
= Total Cover % Bare Ground in Herb Stratum 20 % Cover of Biotic Crust 0
Dominance Test worksheet:
Number of Dominant Species That Are OBL, FACW, or FAC: 1 (A) Total Number of Dominant Species Across All Strata: 3 (B) Percent of Dominant Species That Are OBL, FACW, or FAC: 33% (A/B)
Prevalence Index worksheet:
Total % Cover of: Multiply by:
OBL species x 1 =
FACW species x 2 =
FAC species x 3 =
FACU species x 4 =
UPL species x 5 =
Column Totals: (A) (B)
Prevalence Index = B/A =
Hydrophytic Vegetation Indicators:
Dominance Test is >50%
Prevalence Index is ≤3.01
Morphological Adaptations1 (Provide supporting data in Remarks or on a separate sheet)
Problematic Hydrophytic Vegetation1 (Explain)
1Indicators of hydric soil and wetland hydrology must be present, unless disturbed or problematic.
Hydrophytic Vegetation Present? Yes No X
Remarks:
Sampling occurred when grasses were just beginning to germinate. Cover estimated based on remnants of grasses from last season.

US Army Corps of Engineers Arid West – Version 2.0
SOIL Sampling Point: W4-02
Profile Description: (Describe to the depth needed to document the indicator or confirm the absence of indicators.)
Depth Matrix Redox Features (inches) Color (moist) % Color (moist) % Type1 Loc2 Texture Remarks
0-4 10 YR 3/2 100 Sandy
4-9 10YR 2/1 100 Sandy dark
9-16 5YR 3/1 100 Clay
1Type: C=Concentration, D=Depletion, RM=Reduced Matrix, CS=Covered or Coated Sand Grains. 2Location: PL=Pore Lining, M=Matrix. Hydric Soil Indicators: (Applicable to all LRRs, unless otherwise noted.) Indicators for Problematic Hydric Soils3:
Histosol (A1) Sandy Redox (S5) 1 cm Muck (A9) (LRR C)
Histic Epipedon (A2) Stripped Matrix (S6) 2 cm Muck (A10) (LRR B)
Black Histic (A3) Loamy Mucky Mineral (F1) Reduced Vertic (F18)
Hydrogen Sulfide (A4) Loamy Gleyed Matrix (F2) Red Parent Material (TF2)
Stratified Layers (A5) (LRR C) Depleted Matrix (F3) Other (Explain in Remarks)
1 cm Muck (A9) (LRR D) Redox Dark Surface (F6)
Depleted Below Dark Surface (A11) Depleted Dark Surface (F7)
Thick Dark Surface (A12) Redox Depressions (F8) 3Indicators of hydrophytic vegetation and
Sandy Mucky Mineral (S1) Vernal Pools (F9) wetland hydrology must be present,
Sandy Gleyed Matrix (S4) unless disturbed or problematic.
Restrictive Layer (if present):
Type: clay
Depth (inches): 9 inches
Hydric Soil Present? Yes No X
Remarks:
Although the soil does not exhibit any of the indicators from the Arid West Supplement, the soil is naturally problematic because the wetland has only formed since the removal of a tank in 1998. Hydric soils can take as long as 100 years to develop. Because hydrology and hydrophytic vegetation are NOT present, hydric soil was NOT deemed present.
HYDROLOGY
Wetland Hydrology Indicators:
Primary Indicators (minimum of one required; check all that apply) Secondary Indicators (2 or more required)
Surface Water (A1) Salt Crust (B11) Water Marks (B1) (Riverine)
High Water Table (A2) Biotic Crust (B12) Sediment Deposits (B2) (Riverine)
Saturation (A3) Aquatic Invertebrates (B13) Drift Deposits (B3) (Riverine)
Water Marks (B1) (Nonriverine) Hydrogen Sulfide Odor (C1) Drainage Patterns (B10)
Sediment Deposits (B2) (Nonriverine) Oxidized Rhizospheres along Living Roots (C3) Dry-Season Water Table (C2)
Drift Deposits (B3) (Nonriverine) Presence of Reduced Iron (C4) Crayfish Burrows (C8)
Surface Soil Cracks (B6) Recent Iron Reduction in Tilled Soils (C6) Saturation Visible on Aerial Imagery (C9)
Inundation Visible on Aerial Imagery (B7) Thin Muck Surface (C7) X Shallow Aquitard (D3)
Water-Stained Leaves (B9) Other (Explain in Remarks) FAC-Neutral Test (D5)
Field Observations:
Surface Water Present? Yes No X Depth (inches):
Water Table Present? Yes No X Depth (inches):
Saturation Present? Yes No X Depth (inches): (includes capillary fringe)
Wetland Hydrology Present? Yes No X
Describe Recorded Data (stream gauge, monitoring well, aerial photos, previous inspections), if available:
Remarks:

US Army Corps of Engineers Arid West – Version 2.0
WETLAND DETERMINATION DATA FORM – Arid West Region
Project/Site: Avila Tank Farm City/County: Avila Beach/San Luis Obispo County Sampling Date: 12/07/11
Applicant/Owner: Chevron Business and Real Estate Services State: CA Sampling Point: W5-01 Investigator(s): Thea Benson, Jennifer Langford, Padre Associates Section, Township, Range: San Miguelito Spanish Land Grant
Landform (hillslope, terrace, etc.): former tank bottom Local relief (concave, convex, none): Convex Slope (%): 0-3
Subregion (LRR): Lat: 35.176 Long: -120.723 Datum: UGS 84
Soil Map Unit Name: Lopez very shaly clay loam NWI classification: Paulistrine emergent wetland
Are climatic / hydrologic conditions on the site typical for this time of year? Yes X No (If no, explain in Remarks.)
Are Vegetation No , Soil No , or Hydrology No significantly disturbed? Are “Normal Circumstances” present? Yes X No
Are Vegetation Yes , Soil No , or Hydrology No naturally problematic? (If needed, explain any answers in Remarks.)
SUMMARY OF FINDINGS – Attach site map showing sampling point locations, transects, important features, etc.
Hydrophytic Vegetation Present? Yes No X
Hydric Soil Present? Yes No X
Wetland Hydrology Present? Yes No X
Is the Sampled Area within a Federal Wetland? Yes No X Is the Sampled Area within a State Wetland? Yes No X
Remarks: Wetland 5 is located within a basin from a former tank location that was removed in 1998 and receives localized surface runoff with an inlet basin. Sampling point is within tank bottom but outside wetland boundary
VEGETATION – Use scientific names of plants.
Absolute Dominant Indicator Tree Stratum (Plot size: ) % Cover Species? Status
1.
2.
3.
4.
= Total Cover Sapling/Shrub Stratum (Plot size: : 3 meter radius )
1. Isocoma menziesii 25 Yes
2.
3.
4.
5.
25 = Total Cover Herb Stratum (Plot size: 3 meter radius )
1. Vulpia myuros 40 Yes FACU
2. Lolium multiflorum (Lolium perenne) 40 Yes FACW
3. Trifolium fragiferum 3 No FACW
4. Geranium disectum 1 No
5.
6.
7.
8.
84 = Total Cover Woody Vine Stratum (Plot size: )
1.
2.
= Total Cover % Bare Ground in Herb Stratum 20 % Cover of Biotic Crust 0
Dominance Test worksheet:
Number of Dominant Species That Are OBL, FACW, or FAC: 1 (A) Total Number of Dominant Species Across All Strata: 3 (B) Percent of Dominant Species That Are OBL, FACW, or FAC: 33% (A/B)
Prevalence Index worksheet:
Total % Cover of: Multiply by:
OBL species x 1 =
FACW species x 2 =
FAC species x 3 =
FACU species x 4 =
UPL species x 5 =
Column Totals: (A) (B)
Prevalence Index = B/A =
Hydrophytic Vegetation Indicators:
Dominance Test is >50%
Prevalence Index is ≤3.01
Morphological Adaptations1 (Provide supporting data in Remarks or on a separate sheet)
Problematic Hydrophytic Vegetation1 (Explain)
1Indicators of hydric soil and wetland hydrology must be present, unless disturbed or problematic.
Hydrophytic Vegetation Present? Yes No X
Remarks:
Sampling occurred when grasses were just beginning to germinate. Cover estimated based on remnants of grasses from last season.

US Army Corps of Engineers Arid West – Version 2.0
SOIL Sampling Point: W5-01
Profile Description: (Describe to the depth needed to document the indicator or confirm the absence of indicators.)
Depth Matrix Redox Features (inches) Color (moist) % Color (moist) % Type1 Loc2 Texture Remarks
0-6 7.5 YR 2.5/1 100 Sandy
1Type: C=Concentration, D=Depletion, RM=Reduced Matrix, CS=Covered or Coated Sand Grains. 2Location: PL=Pore Lining, M=Matrix. Hydric Soil Indicators: (Applicable to all LRRs, unless otherwise noted.) Indicators for Problematic Hydric Soils3:
Histosol (A1) Sandy Redox (S5) 1 cm Muck (A9) (LRR C)
Histic Epipedon (A2) Stripped Matrix (S6) 2 cm Muck (A10) (LRR B)
Black Histic (A3) Loamy Mucky Mineral (F1) Reduced Vertic (F18)
Hydrogen Sulfide (A4) Loamy Gleyed Matrix (F2) Red Parent Material (TF2)
Stratified Layers (A5) (LRR C) Depleted Matrix (F3) Other (Explain in Remarks)
1 cm Muck (A9) (LRR D) Redox Dark Surface (F6)
Depleted Below Dark Surface (A11) Depleted Dark Surface (F7)
Thick Dark Surface (A12) Redox Depressions (F8) 3Indicators of hydrophytic vegetation and
Sandy Mucky Mineral (S1) Vernal Pools (F9) wetland hydrology must be present,
Sandy Gleyed Matrix (S4) unless disturbed or problematic.
Restrictive Layer (if present):
Type: rocks, gravel
Depth (inches): 6 inches
Hydric Soil Present? Yes No X
Remarks:
Although the soil does not exhibit any of the indicators from the Arid West Supplement, the soil is naturally problematic because the wetland has only formed since the removal of a tank in 1998. Hydric soils can take as long as 100 years to develop. Because hydrology and hydrophytic vegetation are NOT present, hydric soil was NOT deemed present.
HYDROLOGY
Wetland Hydrology Indicators:
Primary Indicators (minimum of one required; check all that apply) Secondary Indicators (2 or more required)
Surface Water (A1) Salt Crust (B11) Water Marks (B1) (Riverine)
High Water Table (A2) Biotic Crust (B12) Sediment Deposits (B2) (Riverine)
Saturation (A3) Aquatic Invertebrates (B13) Drift Deposits (B3) (Riverine)
Water Marks (B1) (Nonriverine) Hydrogen Sulfide Odor (C1) Drainage Patterns (B10)
Sediment Deposits (B2) (Nonriverine) Oxidized Rhizospheres along Living Roots (C3) Dry-Season Water Table (C2)
Drift Deposits (B3) (Nonriverine) Presence of Reduced Iron (C4) Crayfish Burrows (C8)
Surface Soil Cracks (B6) Recent Iron Reduction in Tilled Soils (C6) Saturation Visible on Aerial Imagery (C9)
Inundation Visible on Aerial Imagery (B7) Thin Muck Surface (C7) X Shallow Aquitard (D3)
Water-Stained Leaves (B9) Other (Explain in Remarks) FAC-Neutral Test (D5)
Field Observations:
Surface Water Present? Yes No X Depth (inches):
Water Table Present? Yes No X Depth (inches):
Saturation Present? Yes No X Depth (inches): (includes capillary fringe)
Wetland Hydrology Present? Yes No X
Describe Recorded Data (stream gauge, monitoring well, aerial photos, previous inspections), if available: Localized drainage within the basin bottom creates rivulets observed flowing at depths up to 2 inches or dry intermittently from December 17, 2004 through at least April 12, 2005. Sampling point is upland from drainage patter.
Remarks:

US Army Corps of Engineers Arid West – Version 2.0
WETLAND DETERMINATION DATA FORM – Arid West Region
Project/Site: Avila Tank Farm City/County: Avila Beach/San Luis Obispo County Sampling Date: 12/07/11
Applicant/Owner: Chevron Business and Real Estate Services State: CA Sampling Point: W5-02 Investigator(s): Thea Benson, Jennifer Langford, Padre Associates Section, Township, Range: San Miguelito Spanish Land Grant
Landform (hillslope, terrace, etc.): former tank bottom Local relief (concave, convex, none): Convex Slope (%): 0-3
Subregion (LRR): Lat: 35.176 Long: -120.723 Datum: UGS 84
Soil Map Unit Name: Lopez very shaly clay loam NWI classification: Paulistrine emergent wetland
Are climatic / hydrologic conditions on the site typical for this time of year? Yes X No (If no, explain in Remarks.)
Are Vegetation No , Soil No , or Hydrology No significantly disturbed? Are “Normal Circumstances” present? Yes X No
Are Vegetation Yes , Soil N0 , or Hydrology No naturally problematic? (If needed, explain any answers in Remarks.)
SUMMARY OF FINDINGS – Attach site map showing sampling point locations, transects, important features, etc.
Hydrophytic Vegetation Present? Yes No X
Hydric Soil Present? Yes No X
Wetland Hydrology Present? Yes No X
Is the Sampled Area within a Federal Wetland? Yes No X Is the Sampled Area within a State Wetland? Yes No X
Remarks: Wetland 5 is located within a basin from a former tank location that was removed in 1998 and receives localized surface runoff with an inlet basin. Sampling point is at area previously identified as wetland (Wolff 2005)
VEGETATION – Use scientific names of plants.
Absolute Dominant Indicator Tree Stratum (Plot size: ) % Cover Species? Status
1.
2.
3.
4.
= Total Cover Sapling/Shrub Stratum (Plot size: : )
1.
2.
3.
4.
5.
= Total Cover Herb Stratum (Plot size: 3 meter radius )
1. Bromus hordeaceous (Bromus mollis) 40 Yes FACU
2. Lolium multiflorum (Lolium perenne) 40 Yes FACW
3. Cynodon dactylon 10 No FAC
4. Geranium disectum 1 No
5. Vulpia myuros 5 No FACU
6.
7.
8.
96 = Total Cover Woody Vine Stratum (Plot size: )
1.
2.
= Total Cover % Bare Ground in Herb Stratum 4 % Cover of Biotic Crust 0
Dominance Test worksheet:
Number of Dominant Species That Are OBL, FACW, or FAC: 1 (A) Total Number of Dominant Species Across All Strata: 2 (B) Percent of Dominant Species That Are OBL, FACW, or FAC: 50% (A/B)
Prevalence Index worksheet:
Total % Cover of: Multiply by:
OBL species x 1 =
FACW species x 2 =
FAC species x 3 =
FACU species x 4 =
UPL species x 5 =
Column Totals: (A) (B)
Prevalence Index = B/A =
Hydrophytic Vegetation Indicators:
Dominance Test is >50%
Prevalence Index is ≤3.01
Morphological Adaptations1 (Provide supporting data in Remarks or on a separate sheet)
Problematic Hydrophytic Vegetation1 (Explain)
1Indicators of hydric soil and wetland hydrology must be present, unless disturbed or problematic.
Hydrophytic Vegetation Present? Yes No X
Remarks:
Sampling occurred when grasses were just beginning to germinate. Cover estimated based on remnants of grasses from last season.

US Army Corps of Engineers Arid West – Version 2.0
SOIL Sampling Point: W5-02
Profile Description: (Describe to the depth needed to document the indicator or confirm the absence of indicators.)
Depth Matrix Redox Features (inches) Color (moist) % Color (moist) % Type1 Loc2 Texture Remarks
0-8 5YR 2.5/1 100 Clay
1Type: C=Concentration, D=Depletion, RM=Reduced Matrix, CS=Covered or Coated Sand Grains. 2Location: PL=Pore Lining, M=Matrix. Hydric Soil Indicators: (Applicable to all LRRs, unless otherwise noted.) Indicators for Problematic Hydric Soils3:
Histosol (A1) Sandy Redox (S5) 1 cm Muck (A9) (LRR C)
Histic Epipedon (A2) Stripped Matrix (S6) 2 cm Muck (A10) (LRR B)
Black Histic (A3) Loamy Mucky Mineral (F1) Reduced Vertic (F18)
Hydrogen Sulfide (A4) Loamy Gleyed Matrix (F2) Red Parent Material (TF2)
Stratified Layers (A5) (LRR C) Depleted Matrix (F3) Other (Explain in Remarks)
1 cm Muck (A9) (LRR D) Redox Dark Surface (F6)
Depleted Below Dark Surface (A11) Depleted Dark Surface (F7)
Thick Dark Surface (A12) Redox Depressions (F8) 3Indicators of hydrophytic vegetation and
Sandy Mucky Mineral (S1) Vernal Pools (F9) wetland hydrology must be present,
Sandy Gleyed Matrix (S4) unless disturbed or problematic.
Restrictive Layer (if present):
Type: rock/gravel
Depth (inches): 8 inches
Hydric Soil Present? Yes No X
Remarks:
Although the soil does not exhibit any of the indicators from the Arid West Supplement, the soil is naturally problematic because the wetland has only formed since the removal of a tank in 1998. Hydric soils can take as long as 100 years to develop. Because hydrology and hydrophytic vegetation are NOT present, hydric soil was NOT deemed present.
HYDROLOGY
Wetland Hydrology Indicators:
Primary Indicators (minimum of one required; check all that apply) Secondary Indicators (2 or more required)
Surface Water (A1) Salt Crust (B11) Water Marks (B1) (Riverine)
High Water Table (A2) Biotic Crust (B12) Sediment Deposits (B2) (Riverine)
Saturation (A3) Aquatic Invertebrates (B13) Drift Deposits (B3) (Riverine)
Water Marks (B1) (Nonriverine) Hydrogen Sulfide Odor (C1) Drainage Patterns (B10)
Sediment Deposits (B2) (Nonriverine) Oxidized Rhizospheres along Living Roots (C3) Dry-Season Water Table (C2)
Drift Deposits (B3) (Nonriverine) Presence of Reduced Iron (C4) Crayfish Burrows (C8)
Surface Soil Cracks (B6) Recent Iron Reduction in Tilled Soils (C6) Saturation Visible on Aerial Imagery (C9)
Inundation Visible on Aerial Imagery (B7) Thin Muck Surface (C7) X Shallow Aquitard (D3)
Water-Stained Leaves (B9) Other (Explain in Remarks) FAC-Neutral Test (D5)
Field Observations:
Surface Water Present? Yes No X Depth (inches):
Water Table Present? Yes No X Depth (inches):
Saturation Present? Yes No X Depth (inches): (includes capillary fringe)
Wetland Hydrology Present? Yes No X
Describe Recorded Data (stream gauge, monitoring well, aerial photos, previous inspections), if available:
Remarks:

US Army Corps of Engineers Arid West – Version 2.0
WETLAND DETERMINATION DATA FORM – Arid West Region
Project/Site: Avila Tank Farm City/County: Avila Beach/San Luis Obispo County Sampling Date: 12/07/11
Applicant/Owner: Chevron Business and Real Estate Services State: CA Sampling Point: W5-03 Investigator(s): Thea Benson, Jennifer Langford, Padre Associates Section, Township, Range: San Miguelito Spanish Land Grant
Landform (hillslope, terrace, etc.): former tank bottom Local relief (concave, convex, none): Convex Slope (%): 0-3
Subregion (LRR): Lat: 35.176 Long: -120.723 Datum: UGS 84
Soil Map Unit Name: Lopez very shaly clay loam NWI classification: Paulistrine emergent wetland
Are climatic / hydrologic conditions on the site typical for this time of year? Yes X No (If no, explain in Remarks.)
Are Vegetation No , Soil No , or Hydrology No significantly disturbed? Are “Normal Circumstances” present? Yes X No
Are Vegetation Yes , Soil Yes , or Hydrology No naturally problematic? (If needed, explain any answers in Remarks.)
SUMMARY OF FINDINGS – Attach site map showing sampling point locations, transects, important features, etc.
Hydrophytic Vegetation Present? Yes X No
Hydric Soil Present? Yes X No
Wetland Hydrology Present? Yes X No
Is the Sampled Area within a Federal Wetland? Yes X No Is the Sampled Area within a State Wetland? Yes X No
Remarks: Wetland 5 is located within a basin from a former tank location that was removed in 1998 and receives localized surface runoff with an inlet basin. Sampling point is within tank bottom but outside wetland boundary
VEGETATION – Use scientific names of plants.
Absolute Dominant Indicator Tree Stratum (Plot size: ) % Cover Species? Status
1.
2.
3.
4.
= Total Cover Sapling/Shrub Stratum (Plot size: 3 meter radius )
1. Isocoma menziesii 10 Yes
2.
3.
4.
5.
10 = Total Cover Herb Stratum (Plot size: 3 meter radius )
1. Cyperus eragrostis 40 Yes FACW
2. Lolium multiflorum (Lolium perenne) 20 Yes FACW
3. Vulpia myuros 3 No FACU
4. Trifolium fragiferum 3 No
5.
6.
7.
8.
66 = Total Cover Woody Vine Stratum (Plot size: )
1.
2.
= Total Cover % Bare Ground in Herb Stratum 40 % Cover of Biotic Crust 0
Dominance Test worksheet:
Number of Dominant Species That Are OBL, FACW, or FAC: 2 (A) Total Number of Dominant Species Across All Strata: 3 (B) Percent of Dominant Species That Are OBL, FACW, or FAC: 67% (A/B)
Prevalence Index worksheet:
Total % Cover of: Multiply by:
OBL species x 1 =
FACW species x 2 =
FAC species x 3 =
FACU species x 4 =
UPL species x 5 =
Column Totals: (A) (B)
Prevalence Index = B/A =
Hydrophytic Vegetation Indicators:
X Dominance Test is >50%
Prevalence Index is ≤3.01
Morphological Adaptations1 (Provide supporting data in Remarks or on a separate sheet)
Problematic Hydrophytic Vegetation1 (Explain)
1Indicators of hydric soil and wetland hydrology must be present, unless disturbed or problematic.
Hydrophytic Vegetation Present? Yes X No
Remarks:
Sampling occurred when grasses were just beginning to germinate. Cover estimated based on remnants of grasses from last season.

US Army Corps of Engineers Arid West – Version 2.0
SOIL Sampling Point: W5-03
Profile Description: (Describe to the depth needed to document the indicator or confirm the absence of indicators.)
Depth Matrix Redox Features (inches) Color (moist) % Color (moist) % Type1 Loc2 Texture Remarks
0-7 7.5 YR 2.5/1 100 Sandy
1Type: C=Concentration, D=Depletion, RM=Reduced Matrix, CS=Covered or Coated Sand Grains. 2Location: PL=Pore Lining, M=Matrix. Hydric Soil Indicators: (Applicable to all LRRs, unless otherwise noted.) Indicators for Problematic Hydric Soils3:
Histosol (A1) Sandy Redox (S5) 1 cm Muck (A9) (LRR C)
Histic Epipedon (A2) Stripped Matrix (S6) 2 cm Muck (A10) (LRR B)
Black Histic (A3) Loamy Mucky Mineral (F1) Reduced Vertic (F18)
Hydrogen Sulfide (A4) Loamy Gleyed Matrix (F2) Red Parent Material (TF2)
Stratified Layers (A5) (LRR C) Depleted Matrix (F3) Other (Explain in Remarks)
1 cm Muck (A9) (LRR D) Redox Dark Surface (F6)
Depleted Below Dark Surface (A11) Depleted Dark Surface (F7)
Thick Dark Surface (A12) Redox Depressions (F8) 3Indicators of hydrophytic vegetation and
Sandy Mucky Mineral (S1) Vernal Pools (F9) wetland hydrology must be present,
Sandy Gleyed Matrix (S4) unless disturbed or problematic.
Restrictive Layer (if present):
Type: Gravel/rock tank bottom
Depth (inches): 7 inches
Hydric Soil Present? Yes X No Remarks: Although the soil does not exhibit any of the indicators from the Arid West Supplement, the soil is naturally problematic because the wetland has only formed since the removal of a tank in the 1940s. Hydric soils can take as long as 100 years to develop. Because the sampling point had both hydrophytic vegetation and positive indicators of hydrology, hydric soil is presumed present.
HYDROLOGY
Wetland Hydrology Indicators:
Primary Indicators (minimum of one required; check all that apply) Secondary Indicators (2 or more required)
Surface Water (A1) Salt Crust (B11) Water Marks (B1) (Riverine)
High Water Table (A2) Biotic Crust (B12) Sediment Deposits (B2) (Riverine)
Saturation (A3) Aquatic Invertebrates (B13) Drift Deposits (B3) (Riverine)
Water Marks (B1) (Nonriverine) Hydrogen Sulfide Odor (C1) X Drainage Patterns (B10)
Sediment Deposits (B2) (Nonriverine) Oxidized Rhizospheres along Living Roots (C3) Dry-Season Water Table (C2)
Drift Deposits (B3) (Nonriverine) Presence of Reduced Iron (C4) Crayfish Burrows (C8)
Surface Soil Cracks (B6) Recent Iron Reduction in Tilled Soils (C6) Saturation Visible on Aerial Imagery (C9)
Inundation Visible on Aerial Imagery (B7) Thin Muck Surface (C7) X Shallow Aquitard (D3)
Water-Stained Leaves (B9) Other (Explain in Remarks) FAC-Neutral Test (D5)
Field Observations:
Surface Water Present? Yes No X Depth (inches):
Water Table Present? Yes No X Depth (inches):
Saturation Present? Yes No X Depth (inches): (includes capillary fringe)
Wetland Hydrology Present? Yes X No
Describe Recorded Data (stream gauge, monitoring well, aerial photos, previous inspections), if available:
Remarks:

US Army Corps of Engineers Arid West – Version 2.0
WETLAND DETERMINATION DATA FORM – Arid West Region
Project/Site: Avila Tank Farm City/County: Avila Beach/San Luis Obispo County Sampling Date: 12/07/11
Applicant/Owner: Chevron Business and Real Estate Services State: CA Sampling Point: W5-04 Investigator(s): Thea Benson, Jennifer Langford, Padre Associates Section, Township, Range: San Miguelito Spanish Land Grant
Landform (hillslope, terrace, etc.): former tank bottom Local relief (concave, convex, none): Convex Slope (%): 0-3
Subregion (LRR): Lat: 35.176 Long: -120.723 Datum: UGS 84
Soil Map Unit Name: Lopez very shaly clay loam NWI classification: Paulistrine emergent wetland
Are climatic / hydrologic conditions on the site typical for this time of year? Yes X No (If no, explain in Remarks.)
Are Vegetation No , Soil No , or Hydrology No significantly disturbed? Are “Normal Circumstances” present? Yes X No
Are Vegetation Yes , Soil No , or Hydrology No naturally problematic? (If needed, explain any answers in Remarks.)
SUMMARY OF FINDINGS – Attach site map showing sampling point locations, transects, important features, etc.
Hydrophytic Vegetation Present? Yes X No
Hydric Soil Present? Yes X No
Wetland Hydrology Present? Yes X No
Is the Sampled Area within a Federal Wetland? Yes X No Is the Sampled Area within a State Wetland? Yes X No
Remarks: Wetland 5 is located within a basin from a former tank location that was removed in 1998 and receives localized surface runoff with an inlet basin. Sampling point is at area previously identified as wetland (Wolff 2005)
VEGETATION – Use scientific names of plants.
Absolute Dominant Indicator Tree Stratum (Plot size: ) % Cover Species? Status
1.
2.
3.
4.
= Total Cover Sapling/Shrub Stratum (Plot size: : )
1.
2.
3.
4.
5.
= Total Cover Herb Stratum (Plot size: 3 meter radius )
1. Lolium multiflorum (Lolium perenne) 50 Yes FACW
2. Polypogon monspeliensis 20 Yes FACW
3. Vulpia myuros 20 Yes
4. Plantago coronopus 10 No FAC
5.
6.
7.
8.
100 = Total Cover Woody Vine Stratum (Plot size: )
1.
2.
= Total Cover % Bare Ground in Herb Stratum % Cover of Biotic Crust
Dominance Test worksheet:
Number of Dominant Species That Are OBL, FACW, or FAC: 2 (A) Total Number of Dominant Species Across All Strata: 3 (B) Percent of Dominant Species That Are OBL, FACW, or FAC: 67% (A/B)
Prevalence Index worksheet:
Total % Cover of: Multiply by:
OBL species x 1 =
FACW species x 2 =
FAC species x 3 =
FACU species x 4 =
UPL species x 5 =
Column Totals: (A) (B)
Prevalence Index = B/A =
Hydrophytic Vegetation Indicators:
Dominance Test is >50%
Prevalence Index is ≤3.01
Morphological Adaptations1 (Provide supporting data in Remarks or on a separate sheet)
Problematic Hydrophytic Vegetation1 (Explain)
1Indicators of hydric soil and wetland hydrology must be present, unless disturbed or problematic.
Hydrophytic Vegetation Present? Yes X No
Remarks:
Sampling occurred when grasses were just beginning to germinate. Cover estimated based on remnants of grasses from last season.

US Army Corps of Engineers Arid West – Version 2.0
SOIL Sampling Point: W5-04
Profile Description: (Describe to the depth needed to document the indicator or confirm the absence of indicators.)
Depth Matrix Redox Features (inches) Color (moist) % Color (moist) % Type1 Loc2 Texture Remarks
0-3 5YR 2.5/1 100 Clay
1Type: C=Concentration, D=Depletion, RM=Reduced Matrix, CS=Covered or Coated Sand Grains. 2Location: PL=Pore Lining, M=Matrix. Hydric Soil Indicators: (Applicable to all LRRs, unless otherwise noted.) Indicators for Problematic Hydric Soils3:
Histosol (A1) Sandy Redox (S5) 1 cm Muck (A9) (LRR C)
Histic Epipedon (A2) Stripped Matrix (S6) 2 cm Muck (A10) (LRR B)
Black Histic (A3) Loamy Mucky Mineral (F1) Reduced Vertic (F18)
Hydrogen Sulfide (A4) Loamy Gleyed Matrix (F2) Red Parent Material (TF2)
Stratified Layers (A5) (LRR C) Depleted Matrix (F3) Other (Explain in Remarks)
1 cm Muck (A9) (LRR D) Redox Dark Surface (F6)
Depleted Below Dark Surface (A11) Depleted Dark Surface (F7)
Thick Dark Surface (A12) Redox Depressions (F8) 3Indicators of hydrophytic vegetation and
Sandy Mucky Mineral (S1) Vernal Pools (F9) wetland hydrology must be present,
Sandy Gleyed Matrix (S4) unless disturbed or problematic.
Restrictive Layer (if present):
Type: rock/gravel
Depth (inches): 3 inches
Hydric Soil Present? Yes X No
Remarks: Although the soil does not exhibit any of the indicators from the Arid West Supplement, the soil is naturally problematic because the wetland has only formed since the removal of a tank in the 1998s. Hydric soils can take as long as 100 years to develop. Because the sampling point has hydrophytic vegetation and positive indicators of hydrology, hydric soils is presumed present.
HYDROLOGY
Wetland Hydrology Indicators:
Primary Indicators (minimum of one required; check all that apply) Secondary Indicators (2 or more required)
Surface Water (A1) Salt Crust (B11) Water Marks (B1) (Riverine)
High Water Table (A2) Biotic Crust (B12) Sediment Deposits (B2) (Riverine)
Saturation (A3) Aquatic Invertebrates (B13) Drift Deposits (B3) (Riverine)
Water Marks (B1) (Nonriverine) Hydrogen Sulfide Odor (C1) X Drainage Patterns (B10)
Sediment Deposits (B2) (Nonriverine) Oxidized Rhizospheres along Living Roots (C3) Dry-Season Water Table (C2)
Drift Deposits (B3) (Nonriverine) Presence of Reduced Iron (C4) Crayfish Burrows (C8)
Surface Soil Cracks (B6) Recent Iron Reduction in Tilled Soils (C6) Saturation Visible on Aerial Imagery (C9)
Inundation Visible on Aerial Imagery (B7) Thin Muck Surface (C7) X Shallow Aquitard (D3)
Water-Stained Leaves (B9) Other (Explain in Remarks) FAC-Neutral Test (D5)
Field Observations:
Surface Water Present? Yes No X Depth (inches):
Water Table Present? Yes No X Depth (inches):
Saturation Present? Yes No X Depth (inches): (includes capillary fringe)
Wetland Hydrology Present? Yes X No
Describe Recorded Data (stream gauge, monitoring well, aerial photos, previous inspections), if available:
Remarks:

US Army Corps of Engineers Arid West – Version 2.0
WETLAND DETERMINATION DATA FORM – Arid West Region
Project/Site: Avila Tank Farm City/County: Avila Beach/San Luis Obispo County Sampling Date: 12/07/11
Applicant/Owner: Chevron Business and Real Estate Services State: CA Sampling Point: W6-01 Investigator(s): Thea Benson, Jennifer Langford, Padre Associates Section, Township, Range: San Miguelito Spanish Land Grant
Landform (hillslope, terrace, etc.): former tank bottom Local relief (concave, convex, none): Convex Slope (%): 0-3
Subregion (LRR): Lat: 35.176 Long: -120.723 Datum: UGS 84
Soil Map Unit Name: Lopez very shaly clay loam NWI classification: Paulistrine emergent wetland
Are climatic / hydrologic conditions on the site typical for this time of year? Yes X No (If no, explain in Remarks.)
Are Vegetation No , Soil No , or Hydrology No significantly disturbed? Are “Normal Circumstances” present? Yes X No
Are Vegetation Yes , Soil Yes , or Hydrology No naturally problematic? (If needed, explain any answers in Remarks.)
SUMMARY OF FINDINGS – Attach site map showing sampling point locations, transects, important features, etc.
Hydrophytic Vegetation Present? Yes No X
Hydric Soil Present? Yes No X
Wetland Hydrology Present? Yes No X
Is the Sampled Area within a Federal Wetland? Yes No X Is the Sampled Area within a State Wetland? Yes No X
Remarks: This area is a basin from a former tank location that was removed in 1995 and receives localized surface runoff with no inlet or outlet. Sampling point is withinformer tank bottom but outside wetland boundary
VEGETATION – Use scientific names of plants.
Absolute Dominant Indicator Tree Stratum (Plot size: ) % Cover Species? Status
1.
2.
3.
4.
= Total Cover Sapling/Shrub Stratum (Plot size: 3 meter radius )
1. Isocoma menziesii 15 Yes
2. Baccharis pilularis 15 Yes
3.
4.
5.
30 = Total Cover Herb Stratum (Plot size: 3 meter radius )
1. Bromus hordeaceus (Bromus mollis) 30 Yes FACU
2. Vulpia myuros 10 Yes FACU
3. Trifolium fragiferum 5 No
4. Gnaphalium luteo-album 2 No FACW
5.
6.
7.
8.
47 = Total Cover Woody Vine Stratum (Plot size: )
1.
2.
= Total Cover % Bare Ground in Herb Stratum 50 % Cover of Biotic Crust 0
Dominance Test worksheet:
Number of Dominant Species That Are OBL, FACW, or FAC: 0 (A) Total Number of Dominant Species Across All Strata: 4 (B) Percent of Dominant Species That Are OBL, FACW, or FAC: 0% (A/B)
Prevalence Index worksheet:
Total % Cover of: Multiply by:
OBL species x 1 =
FACW species x 2 =
FAC species x 3 =
FACU species x 4 =
UPL species x 5 =
Column Totals: (A) (B)
Prevalence Index = B/A =
Hydrophytic Vegetation Indicators:
Dominance Test is >50%
Prevalence Index is ≤3.01
Morphological Adaptations1 (Provide supporting data in Remarks or on a separate sheet)
Problematic Hydrophytic Vegetation1 (Explain)
1Indicators of hydric soil and wetland hydrology must be present, unless disturbed or problematic.
Hydrophytic Vegetation Present? Yes No X
Remarks:
Sampling occurred when grasses were just beginning to germinate. Cover estimated based on remnants of grasses from last season.

US Army Corps of Engineers Arid West – Version 2.0
SOIL Sampling Point: W6-01
Profile Description: (Describe to the depth needed to document the indicator or confirm the absence of indicators.)
Depth Matrix Redox Features (inches) Color (moist) % Color (moist) % Type1 Loc2 Texture Remarks
0-6 7.5 YR 2. 5/1 100 Sandy
1Type: C=Concentration, D=Depletion, RM=Reduced Matrix, CS=Covered or Coated Sand Grains. 2Location: PL=Pore Lining, M=Matrix. Hydric Soil Indicators: (Applicable to all LRRs, unless otherwise noted.) Indicators for Problematic Hydric Soils3:
Histosol (A1) Sandy Redox (S5) 1 cm Muck (A9) (LRR C)
Histic Epipedon (A2) Stripped Matrix (S6) 2 cm Muck (A10) (LRR B)
Black Histic (A3) Loamy Mucky Mineral (F1) Reduced Vertic (F18)
Hydrogen Sulfide (A4) Loamy Gleyed Matrix (F2) Red Parent Material (TF2)
Stratified Layers (A5) (LRR C) Depleted Matrix (F3) Other (Explain in Remarks)
1 cm Muck (A9) (LRR D) Redox Dark Surface (F6)
Depleted Below Dark Surface (A11) Depleted Dark Surface (F7)
Thick Dark Surface (A12) Redox Depressions (F8) 3Indicators of hydrophytic vegetation and
Sandy Mucky Mineral (S1) Vernal Pools (F9) wetland hydrology must be present,
Sandy Gleyed Matrix (S4) unless disturbed or problematic.
Restrictive Layer (if present):
Type: Gravel/rock tank bottom
Depth (inches): 6 inches
Hydric Soil Present? Yes No X
Remarks: Although the soil does not exhibit any of the indicators from the Arid West Supplement, the soil is naturally problematic because the wetland has only formed since the removal of a tank in the 1940s. Hydric soils can take as long as 100 years to develop
HYDROLOGY
Wetland Hydrology Indicators:
Primary Indicators (minimum of one required; check all that apply) Secondary Indicators (2 or more required)
Surface Water (A1) Salt Crust (B11) Water Marks (B1) (Riverine)
High Water Table (A2) Biotic Crust (B12) Sediment Deposits (B2) (Riverine)
Saturation (A3) Aquatic Invertebrates (B13) Drift Deposits (B3) (Riverine)
Water Marks (B1) (Nonriverine) Hydrogen Sulfide Odor (C1) Drainage Patterns (B10)
Sediment Deposits (B2) (Nonriverine) Oxidized Rhizospheres along Living Roots (C3) Dry-Season Water Table (C2)
Drift Deposits (B3) (Nonriverine) Presence of Reduced Iron (C4) Crayfish Burrows (C8)
Surface Soil Cracks (B6) Recent Iron Reduction in Tilled Soils (C6) Saturation Visible on Aerial Imagery (C9)
Inundation Visible on Aerial Imagery (B7) Thin Muck Surface (C7) X Shallow Aquitard (D3)
Water-Stained Leaves (B9) Other (Explain in Remarks) FAC-Neutral Test (D5)
Field Observations:
Surface Water Present? Yes No X Depth (inches):
Water Table Present? Yes No X Depth (inches):
Saturation Present? Yes No X Depth (inches): (includes capillary fringe)
Wetland Hydrology Present? Yes No X
Describe Recorded Data (stream gauge, monitoring well, aerial photos, previous inspections), if available:
Remarks:

US Army Corps of Engineers Arid West – Version 2.0
WETLAND DETERMINATION DATA FORM – Arid West Region
Project/Site: Avila Tank Farm City/County: Avila Beach/San Luis Obispo County Sampling Date: 12/07/11
Applicant/Owner: Chevron Business and Real Estate Services State: CA Sampling Point: W6-02 Investigator(s): Thea Benson, Jennifer Langford, Padre Associates Section, Township, Range: San Miguelito Spanish Land Grant
Landform (hillslope, terrace, etc.): former tank bottom Local relief (concave, convex, none): Convex Slope (%): 0-3
Subregion (LRR): Lat: 35.176 Long: -120.723 Datum: UGS 84
Soil Map Unit Name: Lopez very shaly clay loam NWI classification: Paulistrine emergent wetland
Are climatic / hydrologic conditions on the site typical for this time of year? Yes X No (If no, explain in Remarks.)
Are Vegetation No , Soil No , or Hydrology No significantly disturbed? Are “Normal Circumstances” present? Yes X No
Are Vegetation Yes , Soil Yes , or Hydrology No naturally problematic? (If needed, explain any answers in Remarks.)
SUMMARY OF FINDINGS – Attach site map showing sampling point locations, transects, important features, etc.
Hydrophytic Vegetation Present? Yes X No
Hydric Soil Present? Yes X No
Wetland Hydrology Present? Yes No X
Is the Sampled Area within a Federal Wetland? Yes No X Is the Sampled Area within a State Wetland? Yes X No
Remarks: This area is a basin from a former tank location that was removed in 1995 and receives localized surface runoff with no inlet or outlet. Sampling point is within former tank bottom
VEGETATION – Use scientific names of plants.
Absolute Dominant Indicator Tree Stratum (Plot size: ) % Cover Species? Status
1.
2.
3.
4.
= Total Cover Sapling/Shrub Stratum (Plot size: 3 meter radius )
1. Isocoma menziesii 15 Yes
2. Baccharis pilularis 3 No
3.
4.
5.
18 = Total Cover Herb Stratum (Plot size: 3 meter radius )
1. Cotula coronopifolia 35 Yes FACW
2. Polypogon monspeliensis 15 Yes FACW
3. Bromus hordeaceus (Bromus mollis) 10 No FACU
4. Vulpia myuros 2 No
5.
6.
7.
8.
62 = Total Cover Woody Vine Stratum (Plot size: )
1.
2.
= Total Cover % Bare Ground in Herb Stratum 40 % Cover of Biotic Crust 35
Dominance Test worksheet:
Number of Dominant Species That Are OBL, FACW, or FAC: 2 (A) Total Number of Dominant Species Across All Strata: 3 (B) Percent of Dominant Species That Are OBL, FACW, or FAC: 66% (A/B)
Prevalence Index worksheet:
Total % Cover of: Multiply by:
OBL species x 1 =
FACW species x 2 =
FAC species x 3 =
FACU species x 4 =
UPL species x 5 =
Column Totals: (A) (B)
Prevalence Index = B/A =
Hydrophytic Vegetation Indicators:
X Dominance Test is >50%
Prevalence Index is ≤3.01
Morphological Adaptations1 (Provide supporting data in Remarks or on a separate sheet)
Problematic Hydrophytic Vegetation1 (Explain)
1Indicators of hydric soil and wetland hydrology must be present, unless disturbed or problematic.
Hydrophytic Vegetation Present? Yes X No
Remarks:
Sampling occurred when grasses were just beginning to germinate. Cover estimated based on remnants of grasses from last season.

US Army Corps of Engineers Arid West – Version 2.0
SOIL Sampling Point: W6-02
Profile Description: (Describe to the depth needed to document the indicator or confirm the absence of indicators.)
Depth Matrix Redox Features (inches) Color (moist) % Color (moist) % Type1 Loc2 Texture Remarks
0-3 7.5 YR 2.5/1 100 Sandy
1Type: C=Concentration, D=Depletion, RM=Reduced Matrix, CS=Covered or Coated Sand Grains. 2Location: PL=Pore Lining, M=Matrix. Hydric Soil Indicators: (Applicable to all LRRs, unless otherwise noted.) Indicators for Problematic Hydric Soils3:
Histosol (A1) Sandy Redox (S5) 1 cm Muck (A9) (LRR C)
Histic Epipedon (A2) Stripped Matrix (S6) 2 cm Muck (A10) (LRR B)
Black Histic (A3) Loamy Mucky Mineral (F1) Reduced Vertic (F18)
Hydrogen Sulfide (A4) Loamy Gleyed Matrix (F2) Red Parent Material (TF2)
Stratified Layers (A5) (LRR C) Depleted Matrix (F3) Other (Explain in Remarks)
1 cm Muck (A9) (LRR D) Redox Dark Surface (F6)
Depleted Below Dark Surface (A11) Depleted Dark Surface (F7)
Thick Dark Surface (A12) Redox Depressions (F8) 3Indicators of hydrophytic vegetation and
Sandy Mucky Mineral (S1) Vernal Pools (F9) wetland hydrology must be present,
Sandy Gleyed Matrix (S4) unless disturbed or problematic.
Restrictive Layer (if present):
Type: Gravel/rock tank bottom
Depth (inches): 3 inches
Hydric Soil Present? Yes X No
Remarks: Although the soil does not exhibit any of the indicators from the Arid West Supplement, the soil is naturally problematic because the wetland has only formed since the removal of a tank in 1995. Hydric soils can take as long as 100 years to develop. Because hydrophytic vegetation was present, hydric soils were presumed present.
HYDROLOGY
Wetland Hydrology Indicators:
Primary Indicators (minimum of one required; check all that apply) Secondary Indicators (2 or more required)
Surface Water (A1) Salt Crust (B11) Water Marks (B1) (Riverine)
High Water Table (A2) X Biotic Crust (B12) Sediment Deposits (B2) (Riverine)
Saturation (A3) Aquatic Invertebrates (B13) Drift Deposits (B3) (Riverine)
Water Marks (B1) (Nonriverine) Hydrogen Sulfide Odor (C1) Drainage Patterns (B10)
Sediment Deposits (B2) (Nonriverine) Oxidized Rhizospheres along Living Roots (C3) Dry-Season Water Table (C2)
Drift Deposits (B3) (Nonriverine) Presence of Reduced Iron (C4) Crayfish Burrows (C8)
Surface Soil Cracks (B6) Recent Iron Reduction in Tilled Soils (C6) Saturation Visible on Aerial Imagery (C9)
Inundation Visible on Aerial Imagery (B7) Thin Muck Surface (C7) X Shallow Aquitard (D3)
Water-Stained Leaves (B9) Other (Explain in Remarks) FAC-Neutral Test (D5)
Field Observations:
Surface Water Present? Yes No X Depth (inches):
Water Table Present? Yes No X Depth (inches):
Saturation Present? Yes No X Depth (inches): (includes capillary fringe)
Wetland Hydrology Present? Yes No X
Describe Recorded Data (stream gauge, monitoring well, aerial photos, previous inspections), if available: This basin was observed ponded at depths from 2 to 10 inches from January 5, 2005 through at least march 30, 2005.
Remarks:

US Army Corps of Engineers Arid West – Version 2.0
WETLAND DETERMINATION DATA FORM – Arid West Region
Project/Site: Avila Tank Farm City/County: Avila Beach/San Luis Obispo County Sampling Date: 12/07/11
Applicant/Owner: Chevron Business and Real Estate Services State: CA Sampling Point: W6-03 Investigator(s): Thea Benson, Jennifer Langford, Padre Associates Section, Township, Range: San Miguelito Spanish Land Grant
Landform (hillslope, terrace, etc.): former tank bottom Local relief (concave, convex, none): Convex Slope (%): 0-3
Subregion (LRR): Lat: 35.176 Long: -120.723 Datum: UGS 84
Soil Map Unit Name: Lopez very shaly clay loam NWI classification: Paulistrine emergent wetland
Are climatic / hydrologic conditions on the site typical for this time of year? Yes X No (If no, explain in Remarks.)
Are Vegetation No , Soil No , or Hydrology No significantly disturbed? Are “Normal Circumstances” present? Yes X No
Are Vegetation Yes , Soil Yes , or Hydrology No naturally problematic? (If needed, explain any answers in Remarks.)
SUMMARY OF FINDINGS – Attach site map showing sampling point locations, transects, important features, etc.
Hydrophytic Vegetation Present? Yes No X
Hydric Soil Present? Yes No X
Wetland Hydrology Present? Yes No X
Is the Sampled Area within a Federal Wetland? Yes No X Is the Sampled Area within a State Wetland? Yes No X
Remarks: This area is a basin from a former tank location that was removed in 1995 and receives localized surface runoff with no inlet or outlet. Sampling point is within a former tank bottom but outside wetland boundary
VEGETATION – Use scientific names of plants.
Absolute Dominant Indicator Tree Stratum (Plot size: ) % Cover Species? Status
1.
2.
3.
4.
= Total Cover Sapling/Shrub Stratum (Plot size: 3 meter radius )
1. Isocoma menziesii 15 Yes
2.
3.
4.
5.
15 = Total Cover Herb Stratum (Plot size: 3 meter radius )
1. Vulpia myuros 70 Yes FACU
2. Bromus hordeaceus 20 Yes
3.
4.
5.
6.
7.
8.
90 = Total Cover Woody Vine Stratum (Plot size: )
1.
2.
= Total Cover % Bare Ground in Herb Stratum 10 % Cover of Biotic Crust 0
Dominance Test worksheet:
Number of Dominant Species That Are OBL, FACW, or FAC: 0 (A) Total Number of Dominant Species Across All Strata: 3 (B) Percent of Dominant Species That Are OBL, FACW, or FAC: 0% (A/B)
Prevalence Index worksheet:
Total % Cover of: Multiply by:
OBL species x 1 =
FACW species x 2 =
FAC species x 3 =
FACU species x 4 =
UPL species x 5 =
Column Totals: (A) (B)
Prevalence Index = B/A =
Hydrophytic Vegetation Indicators:
Dominance Test is >50%
Prevalence Index is ≤3.01
Morphological Adaptations1 (Provide supporting data in Remarks or on a separate sheet)
Problematic Hydrophytic Vegetation1 (Explain)
1Indicators of hydric soil and wetland hydrology must be present, unless disturbed or problematic.
Hydrophytic Vegetation Present? Yes No X
Remarks:
Sampling occurred when grasses were just beginning to germinate. Cover estimated based on remnants of grasses from last season.

US Army Corps of Engineers Arid West – Version 2.0
SOIL Sampling Point: W6-03
Profile Description: (Describe to the depth needed to document the indicator or confirm the absence of indicators.)
Depth Matrix Redox Features (inches) Color (moist) % Color (moist) % Type1 Loc2 Texture Remarks
0-6 7.5 YR 5/1 100 Sandy
1Type: C=Concentration, D=Depletion, RM=Reduced Matrix, CS=Covered or Coated Sand Grains. 2Location: PL=Pore Lining, M=Matrix. Hydric Soil Indicators: (Applicable to all LRRs, unless otherwise noted.) Indicators for Problematic Hydric Soils3:
Histosol (A1) Sandy Redox (S5) 1 cm Muck (A9) (LRR C)
Histic Epipedon (A2) Stripped Matrix (S6) 2 cm Muck (A10) (LRR B)
Black Histic (A3) Loamy Mucky Mineral (F1) Reduced Vertic (F18)
Hydrogen Sulfide (A4) Loamy Gleyed Matrix (F2) Red Parent Material (TF2)
Stratified Layers (A5) (LRR C) Depleted Matrix (F3) Other (Explain in Remarks)
1 cm Muck (A9) (LRR D) Redox Dark Surface (F6)
Depleted Below Dark Surface (A11) Depleted Dark Surface (F7)
Thick Dark Surface (A12) Redox Depressions (F8) 3Indicators of hydrophytic vegetation and
Sandy Mucky Mineral (S1) Vernal Pools (F9) wetland hydrology must be present,
Sandy Gleyed Matrix (S4) unless disturbed or problematic.
Restrictive Layer (if present):
Type: Gravel/rock tank bottom
Depth (inches): 6 inches
Hydric Soil Present? Yes No X
Remarks: Although the soil does not exhibit any of the indicators from the Arid West Supplement, the soil is naturally problematic because the wetland has only formed since the removal of a tank in 1998. Hydric soils can take as long as 100 years to develop. Because hydrology and hydrophytic vegetation are NOT present, hydric soil was NOT deemed present.
HYDROLOGY
Wetland Hydrology Indicators:
Primary Indicators (minimum of one required; check all that apply) Secondary Indicators (2 or more required)
Surface Water (A1) Salt Crust (B11) Water Marks (B1) (Riverine)
High Water Table (A2) Biotic Crust (B12) Sediment Deposits (B2) (Riverine)
Saturation (A3) Aquatic Invertebrates (B13) Drift Deposits (B3) (Riverine)
Water Marks (B1) (Nonriverine) Hydrogen Sulfide Odor (C1) Drainage Patterns (B10)
Sediment Deposits (B2) (Nonriverine) Oxidized Rhizospheres along Living Roots (C3) Dry-Season Water Table (C2)
Drift Deposits (B3) (Nonriverine) Presence of Reduced Iron (C4) Crayfish Burrows (C8)
Surface Soil Cracks (B6) Recent Iron Reduction in Tilled Soils (C6) Saturation Visible on Aerial Imagery (C9)
Inundation Visible on Aerial Imagery (B7) Thin Muck Surface (C7) X Shallow Aquitard (D3)
Water-Stained Leaves (B9) Other (Explain in Remarks) FAC-Neutral Test (D5)
Field Observations:
Surface Water Present? Yes No X Depth (inches):
Water Table Present? Yes No X Depth (inches):
Saturation Present? Yes No X Depth (inches): (includes capillary fringe)
Wetland Hydrology Present? Yes No X
Describe Recorded Data (stream gauge, monitoring well, aerial photos, previous inspections), if available:
Remarks:

US Army Corps of Engineers Arid West – Version 2.0
WETLAND DETERMINATION DATA FORM – Arid West Region
Project/Site: Avila Tank Farm City/County: Avila Beach/San Luis Obispo County Sampling Date: 12/08/11
Applicant/Owner: Chevron Business and Real Estate Services State: CA Sampling Point: W7-01
Investigator(s): Thea Benson, Jennifer Langford, Padre Associates Section, Township, Range: San Miguelito Spanish Land Grant
Landform (hillslope, terrace, etc.): base of hill Local relief (concave, convex, none): convex Slope (%): 0-3
Subregion (LRR): Lat: 35.176 Long: -120.723 Datum: UGS 84
Soil Map Unit Name: Cropley clay, 0 to 2 percent slopes NWI classification: Paulistrine emergent wetland
Are climatic / hydrologic conditions on the site typical for this time of year? Yes X No (If no, explain in Remarks.)
Are Vegetation No , Soil No , or Hydrology No significantly disturbed? Are “Normal Circumstances” present? Yes X No
Are Vegetation No , Soil No , or Hydrology No naturally problematic? (If needed, explain any answers in Remarks.)
SUMMARY OF FINDINGS – Attach site map showing sampling point locations, transects, important features, etc.
Hydrophytic Vegetation Present? Yes X No
Hydric Soil Present? Yes X No
Wetland Hydrology Present? Yes No X
Is the Sampled Area within a Federal Wetland? Yes No X Is the Sampled Area within a State Wetland? Yes X No
Remarks: Area is at base of hills and would have drained into the San Luis Creek if not impounded by the construction of Avila Road. An under-road drainage is present at this sampling point. The area is regularly mowed for fuel reduction.
VEGETATION – Use scientific names of plants.
Absolute Dominant Indicator Tree Stratum (Plot size: ) % Cover Species? Status
1.
2.
3.
4.
= Total Cover Sapling/Shrub Stratum (Plot size: )
1.
2.
3.
4.
5.
= Total Cover Herb Stratum (Plot size: 3 meter radius )
1. Cyperus eragrostis 60 Yes FACW
2. Distichlis spicata 60 Yes FACW
3. Picris echioides 25 No FAC
4.
5.
6.
7.
8.
145 = Total Cover Woody Vine Stratum (Plot size: )
1.
2.
= Total Cover % Bare Ground in Herb Stratum 60 % Cover of Biotic Crust 0
Dominance Test worksheet:
Number of Dominant Species That Are OBL, FACW, or FAC: 2 (A) Total Number of Dominant Species Across All Strata: 2 (B) Percent of Dominant Species That Are OBL, FACW, or FAC: 100% (A/B)
Prevalence Index worksheet:
Total % Cover of: Multiply by:
OBL species x 1 =
FACW species x 2 =
FAC species x 3 =
FACU species x 4 =
UPL species x 5 =
Column Totals: (A) (B)
Prevalence Index = B/A =
Hydrophytic Vegetation Indicators:
X Dominance Test is >50%
Prevalence Index is ≤3.01
Morphological Adaptations1 (Provide supporting data in Remarks or on a separate sheet)
Problematic Hydrophytic Vegetation1 (Explain)
1Indicators of hydric soil and wetland hydrology must be present, unless disturbed or problematic.
Hydrophytic Vegetation Present? Yes X No
Remarks:

US Army Corps of Engineers Arid West – Version 2.0
SOIL Sampling Point: W7-01
Profile Description: (Describe to the depth needed to document the indicator or confirm the absence of indicators.)
Depth Matrix Redox Features (inches) Color (moist) % Color (moist) % Type1 Loc2 Texture Remarks
0-16 7.5 YR 2.5/ 1 100 5 C M Clay
1Type: C=Concentration, D=Depletion, RM=Reduced Matrix, CS=Covered or Coated Sand Grains. 2Location: PL=Pore Lining, M=Matrix. Hydric Soil Indicators: (Applicable to all LRRs, unless otherwise noted.) Indicators for Problematic Hydric Soils3:
Histosol (A1) Sandy Redox (S5) 1 cm Muck (A9) (LRR C)
Histic Epipedon (A2) Stripped Matrix (S6) 2 cm Muck (A10) (LRR B)
Black Histic (A3) Loamy Mucky Mineral (F1) Reduced Vertic (F18)
Hydrogen Sulfide (A4) Loamy Gleyed Matrix (F2) Red Parent Material (TF2)
Stratified Layers (A5) (LRR C) Depleted Matrix (F3) Other (Explain in Remarks)
1 cm Muck (A9) (LRR D) X Redox Dark Surface (F6)
Depleted Below Dark Surface (A11) Depleted Dark Surface (F7)
Thick Dark Surface (A12) Redox Depressions (F8) 3Indicators of hydrophytic vegetation and
Sandy Mucky Mineral (S1) Vernal Pools (F9) wetland hydrology must be present,
Sandy Gleyed Matrix (S4) unless disturbed or problematic.
Restrictive Layer (if present):
Type:
Depth (inches):
Hydric Soil Present? Yes X No
Remarks:
Soil has matrix value of 3 or less and chroma of 2 or less and 5 percent or more redox concentrations,
HYDROLOGY
Wetland Hydrology Indicators:
Primary Indicators (minimum of one required; check all that apply) Secondary Indicators (2 or more required)
Surface Water (A1) Salt Crust (B11) Water Marks (B1) (Riverine)
High Water Table (A2) Biotic Crust (B12) Sediment Deposits (B2) (Riverine)
Saturation (A3) Aquatic Invertebrates (B13) Drift Deposits (B3) (Riverine)
Water Marks (B1) (Nonriverine) Hydrogen Sulfide Odor (C1) Drainage Patterns (B10)
Sediment Deposits (B2) (Nonriverine) Oxidized Rhizospheres along Living Roots (C3) Dry-Season Water Table (C2)
Drift Deposits (B3) (Nonriverine) Presence of Reduced Iron (C4) Crayfish Burrows (C8)
Surface Soil Cracks (B6) Recent Iron Reduction in Tilled Soils (C6) Saturation Visible on Aerial Imagery (C9)
Inundation Visible on Aerial Imagery (B7) Thin Muck Surface (C7) Shallow Aquitard (D3)
Water-Stained Leaves (B9) Other (Explain in Remarks) FAC-Neutral Test (D5)
Field Observations:
Surface Water Present? Yes No X Depth (inches):
Water Table Present? Yes No X Depth (inches):
Saturation Present? Yes No X Depth (inches): (includes capillary fringe)
Wetland Hydrology Present? Yes No X
Describe Recorded Data (stream gauge, monitoring well, aerial photos, previous inspections), if available:
Remarks: Sampling point is at base of under-road drainage.

US Army Corps of Engineers Arid West – Version 2.0
WETLAND DETERMINATION DATA FORM – Arid West Region
Project/Site: Avila Tank Farm City/County: Avila Beach/San Luis Obispo County Sampling Date: 12/15/11
Applicant/Owner: Chevron Business and Real Estate Services State: CA Sampling Point: W7-02
Investigator(s): Thea Benson, Jennifer Langford, Padre Associates Section, Township, Range: San Miguelito Spanish Land Grant
Landform (hillslope, terrace, etc.): hillslope Local relief (concave, convex, none): flat Slope (%): 0-3
Subregion (LRR): Lat: 35.176 Long: -120.723 Datum: UGS 84
Soil Map Unit Name: Cropley clay, 0 to 2 percent slopes NWI classification: Paulistrine emergent wetland
Are climatic / hydrologic conditions on the site typical for this time of year? Yes X No (If no, explain in Remarks.)
Are Vegetation No , Soil No , or Hydrology No significantly disturbed? Are “Normal Circumstances” present? Yes X No
Are Vegetation Yes , Soil No , or Hydrology No naturally problematic? (If needed, explain any answers in Remarks.)
SUMMARY OF FINDINGS – Attach site map showing sampling point locations, transects, important features, etc.
Hydrophytic Vegetation Present? Yes X No
Hydric Soil Present? Yes X No
Wetland Hydrology Present? Yes No X
Is the Sampled Area within a Federal Wetland? Yes No X Is the Sampled Area within a State Wetland? Yes X No
Remarks: Area is at base of hills and would have drained into the San Luis Creek if not impounded by the construction of Avila Road. An under-road drainage is present at this sampling point. The area is regularly mowed for fuel reduction.
VEGETATION – Use scientific names of plants.
Absolute Dominant Indicator Tree Stratum (Plot size: ) % Cover Species? Status
1.
2.
3.
4.
= Total Cover Sapling/Shrub Stratum (Plot size: )
1.
2.
3.
4.
5.
= Total Cover Herb Stratum (Plot size: 3 meter radius )
1. Picris echioides 40 Yes FAC
2.
3.
4.
5.
6.
7.
8.
40 = Total Cover Woody Vine Stratum (Plot size: )
1.
2.
= Total Cover % Bare Ground in Herb Stratum 60 % Cover of Biotic Crust 0
Dominance Test worksheet:
Number of Dominant Species That Are OBL, FACW, or FAC: 1 (A) Total Number of Dominant Species Across All Strata: 1 (B) Percent of Dominant Species That Are OBL, FACW, or FAC: 100% (A/B)
Prevalence Index worksheet:
Total % Cover of: Multiply by:
OBL species x 1 =
FACW species x 2 =
FAC species x 3 =
FACU species x 4 =
UPL species x 5 =
Column Totals: (A) (B)
Prevalence Index = B/A =
Hydrophytic Vegetation Indicators:
X Dominance Test is >50%
Prevalence Index is ≤3.01
Morphological Adaptations1 (Provide supporting data in Remarks or on a separate sheet)
Problematic Hydrophytic Vegetation1 (Explain)
1Indicators of hydric soil and wetland hydrology must be present, unless disturbed or problematic.
Hydrophytic Vegetation Present? Yes X No
Remarks: At time of survey many herbal species germinating but not identifiable. Other species present in area include Distichlis spicata, Rumex crispus, Cyperus eragrostis, and Juncus spp.

US Army Corps of Engineers Arid West – Version 2.0
SOIL Sampling Point: W7-02
Profile Description: (Describe to the depth needed to document the indicator or confirm the absence of indicators.)
Depth Matrix Redox Features (inches) Color (moist) % Color (moist) % Type1 Loc2 Texture Remarks
0-16 7.5 YR 2.5/ 1 100 5 C M Clay
1Type: C=Concentration, D=Depletion, RM=Reduced Matrix, CS=Covered or Coated Sand Grains. 2Location: PL=Pore Lining, M=Matrix. Hydric Soil Indicators: (Applicable to all LRRs, unless otherwise noted.) Indicators for Problematic Hydric Soils3:
Histosol (A1) Sandy Redox (S5) 1 cm Muck (A9) (LRR C)
Histic Epipedon (A2) Stripped Matrix (S6) 2 cm Muck (A10) (LRR B)
Black Histic (A3) Loamy Mucky Mineral (F1) Reduced Vertic (F18)
Hydrogen Sulfide (A4) Loamy Gleyed Matrix (F2) Red Parent Material (TF2)
Stratified Layers (A5) (LRR C) Depleted Matrix (F3) Other (Explain in Remarks)
1 cm Muck (A9) (LRR D) X Redox Dark Surface (F6)
Depleted Below Dark Surface (A11) Depleted Dark Surface (F7)
Thick Dark Surface (A12) Redox Depressions (F8) 3Indicators of hydrophytic vegetation and
Sandy Mucky Mineral (S1) Vernal Pools (F9) wetland hydrology must be present,
Sandy Gleyed Matrix (S4) unless disturbed or problematic.
Restrictive Layer (if present):
Type:
Depth (inches):
Hydric Soil Present? Yes X No
Remarks:
Soil has matrix value of 3 or less and chroma of 2 or less and 5 percent or more redox concentrations,
HYDROLOGY
Wetland Hydrology Indicators:
Primary Indicators (minimum of one required; check all that apply) Secondary Indicators (2 or more required)
Surface Water (A1) Salt Crust (B11) Water Marks (B1) (Riverine)
High Water Table (A2) Biotic Crust (B12) Sediment Deposits (B2) (Riverine)
Saturation (A3) Aquatic Invertebrates (B13) Drift Deposits (B3) (Riverine)
Water Marks (B1) (Nonriverine) Hydrogen Sulfide Odor (C1) Drainage Patterns (B10)
Sediment Deposits (B2) (Nonriverine) Oxidized Rhizospheres along Living Roots (C3) Dry-Season Water Table (C2)
Drift Deposits (B3) (Nonriverine) Presence of Reduced Iron (C4) Crayfish Burrows (C8)
Surface Soil Cracks (B6) Recent Iron Reduction in Tilled Soils (C6) Saturation Visible on Aerial Imagery (C9)
Inundation Visible on Aerial Imagery (B7) Thin Muck Surface (C7) Shallow Aquitard (D3)
Water-Stained Leaves (B9) Other (Explain in Remarks) FAC-Neutral Test (D5)
Field Observations:
Surface Water Present? Yes No X Depth (inches):
Water Table Present? Yes No X Depth (inches):
Saturation Present? Yes No X Depth (inches): (includes capillary fringe)
Wetland Hydrology Present? Yes No X
Describe Recorded Data (stream gauge, monitoring well, aerial photos, previous inspections), if available:
Remarks: Sampling point is at upland from first point.

US Army Corps of Engineers Arid West – Version 2.0
WETLAND DETERMINATION DATA FORM – Arid West Region
Project/Site: Avila Tank Farm City/County: Avila Beach/San Luis Obispo County Sampling Date: 12/15/11
Applicant/Owner: Chevron Business and Real Estate Services State: CA Sampling Point: W7-03
Investigator(s): Thea Benson, Jennifer Langford, Padre Associates Section, Township, Range: San Miguelito Spanish Land Grant
Landform (hillslope, terrace, etc.): hillslope Local relief (concave, convex, none): flat Slope (%): 0-3
Subregion (LRR): Lat: 35.176 Long: -120.723 Datum: UGS 84
Soil Map Unit Name: Cropley clay, 0 to 2 percent slopes NWI classification: Paulistrine emergent wetland
Are climatic / hydrologic conditions on the site typical for this time of year? Yes X No (If no, explain in Remarks.)
Are Vegetation No , Soil No , or Hydrology No significantly disturbed? Are “Normal Circumstances” present? Yes X No
Are Vegetation Yes , Soil No , or Hydrology No naturally problematic? (If needed, explain any answers in Remarks.)
SUMMARY OF FINDINGS – Attach site map showing sampling point locations, transects, important features, etc.
Hydrophytic Vegetation Present? Yes No X
Hydric Soil Present? Yes No X
Wetland Hydrology Present? Yes No X
Is the Sampled Area within a Federal Wetland? Yes No X Is the Sampled Area within a State Wetland? Yes No X
Remarks: Area is at base of hills and would have drained into the San Luis Creek if not impounded by the construction of Avila Road. An under-road drainage is present at this sampling point. The area is regularly mowed for fuel reduction.
VEGETATION – Use scientific names of plants.
Absolute Dominant Indicator Tree Stratum (Plot size: ) % Cover Species? Status
1.
2.
3.
4.
= Total Cover Sapling/Shrub Stratum (Plot size: )
1.
2.
3.
4.
5.
= Total Cover Herb Stratum (Plot size: 3 meter radius )
1. Picris echioides 40 Yes FAC
2. Avena sp. 25 Yes
3.
4.
5.
6.
7.
8.
40 = Total Cover Woody Vine Stratum (Plot size: )
1.
2.
= Total Cover % Bare Ground in Herb Stratum 60 % Cover of Biotic Crust 0
Dominance Test worksheet:
Number of Dominant Species That Are OBL, FACW, or FAC: 1 (A) Total Number of Dominant Species Across All Strata: 2 (B) Percent of Dominant Species That Are OBL, FACW, or FAC: 50% (A/B)
Prevalence Index worksheet:
Total % Cover of: Multiply by:
OBL species x 1 =
FACW species x 2 =
FAC species x 3 =
FACU species x 4 =
UPL species x 5 =
Column Totals: (A) (B)
Prevalence Index = B/A =
Hydrophytic Vegetation Indicators:
Dominance Test is >50%
Prevalence Index is ≤3.01
Morphological Adaptations1 (Provide supporting data in Remarks or on a separate sheet)
Problematic Hydrophytic Vegetation1 (Explain)
1Indicators of hydric soil and wetland hydrology must be present, unless disturbed or problematic.
Hydrophytic Vegetation Present? Yes No X
Remarks: At time of survey many herbal species germinating but not identifiable. Remnants of Avena spp. Found in quadrat, and it was assumed that grass germinating in quad is Avena. Other species present in area include Quercus agrifolia and Bacccharis pilularis.

US Army Corps of Engineers Arid West – Version 2.0
SOIL Sampling Point: W7-03
Profile Description: (Describe to the depth needed to document the indicator or confirm the absence of indicators.)
Depth Matrix Redox Features (inches) Color (moist) % Color (moist) % Type1 Loc2 Texture Remarks
0-16 10 YR 3/2 100 Sandy
1Type: C=Concentration, D=Depletion, RM=Reduced Matrix, CS=Covered or Coated Sand Grains. 2Location: PL=Pore Lining, M=Matrix. Hydric Soil Indicators: (Applicable to all LRRs, unless otherwise noted.) Indicators for Problematic Hydric Soils3:
Histosol (A1) Sandy Redox (S5) 1 cm Muck (A9) (LRR C)
Histic Epipedon (A2) Stripped Matrix (S6) 2 cm Muck (A10) (LRR B)
Black Histic (A3) Loamy Mucky Mineral (F1) Reduced Vertic (F18)
Hydrogen Sulfide (A4) Loamy Gleyed Matrix (F2) Red Parent Material (TF2)
Stratified Layers (A5) (LRR C) Depleted Matrix (F3) Other (Explain in Remarks)
1 cm Muck (A9) (LRR D) X Redox Dark Surface (F6)
Depleted Below Dark Surface (A11) Depleted Dark Surface (F7)
Thick Dark Surface (A12) Redox Depressions (F8) 3Indicators of hydrophytic vegetation and
Sandy Mucky Mineral (S1) Vernal Pools (F9) wetland hydrology must be present,
Sandy Gleyed Matrix (S4) unless disturbed or problematic.
Restrictive Layer (if present):
Type:
Depth (inches):
Hydric Soil Present? Yes No X
Remarks:
No redox observed in matrix.
HYDROLOGY
Wetland Hydrology Indicators:
Primary Indicators (minimum of one required; check all that apply) Secondary Indicators (2 or more required)
Surface Water (A1) Salt Crust (B11) Water Marks (B1) (Riverine)
High Water Table (A2) Biotic Crust (B12) Sediment Deposits (B2) (Riverine)
Saturation (A3) Aquatic Invertebrates (B13) Drift Deposits (B3) (Riverine)
Water Marks (B1) (Nonriverine) Hydrogen Sulfide Odor (C1) Drainage Patterns (B10)
Sediment Deposits (B2) (Nonriverine) Oxidized Rhizospheres along Living Roots (C3) Dry-Season Water Table (C2)
Drift Deposits (B3) (Nonriverine) Presence of Reduced Iron (C4) Crayfish Burrows (C8)
Surface Soil Cracks (B6) Recent Iron Reduction in Tilled Soils (C6) Saturation Visible on Aerial Imagery (C9)
Inundation Visible on Aerial Imagery (B7) Thin Muck Surface (C7) Shallow Aquitard (D3)
Water-Stained Leaves (B9) Other (Explain in Remarks) FAC-Neutral Test (D5)
Field Observations:
Surface Water Present? Yes No X Depth (inches):
Water Table Present? Yes No X Depth (inches):
Saturation Present? Yes No X Depth (inches): (includes capillary fringe)
Wetland Hydrology Present? Yes No X
Describe Recorded Data (stream gauge, monitoring well, aerial photos, previous inspections), if available:
Remarks:

APPENDIX C
NRCS SOIL SURVEY RESULTS

United StatesDepartment ofAgriculture
A product of the NationalCooperative Soil Survey,a joint effort of the UnitedStates Department ofAgriculture and otherFederal agencies, Stateagencies including theAgricultural ExperimentStations, and localparticipants
Custom Soil ResourceReport forSan Luis ObispoCounty, California,Coastal PartAvila Tank Farm
NaturalResourcesConservationService
December 16, 2011

PrefaceSoil surveys contain information that affects land use planning in survey areas. Theyhighlight soil limitations that affect various land uses and provide information aboutthe properties of the soils in the survey areas. Soil surveys are designed for manydifferent users, including farmers, ranchers, foresters, agronomists, urban planners,community officials, engineers, developers, builders, and home buyers. Also,conservationists, teachers, students, and specialists in recreation, waste disposal,and pollution control can use the surveys to help them understand, protect, or enhancethe environment.
Various land use regulations of Federal, State, and local governments may imposespecial restrictions on land use or land treatment. Soil surveys identify soil propertiesthat are used in making various land use or land treatment decisions. The informationis intended to help the land users identify and reduce the effects of soil limitations onvarious land uses. The landowner or user is responsible for identifying and complyingwith existing laws and regulations.
Although soil survey information can be used for general farm, local, and wider areaplanning, onsite investigation is needed to supplement this information in some cases.Examples include soil quality assessments (http://soils.usda.gov/sqi/) and certainconservation and engineering applications. For more detailed information, contactyour local USDA Service Center (http://offices.sc.egov.usda.gov/locator/app?agency=nrcs) or your NRCS State Soil Scientist (http://soils.usda.gov/contact/state_offices/).
Great differences in soil properties can occur within short distances. Some soils areseasonally wet or subject to flooding. Some are too unstable to be used as afoundation for buildings or roads. Clayey or wet soils are poorly suited to use as septictank absorption fields. A high water table makes a soil poorly suited to basements orunderground installations.
The National Cooperative Soil Survey is a joint effort of the United States Departmentof Agriculture and other Federal agencies, State agencies including the AgriculturalExperiment Stations, and local agencies. The Natural Resources ConservationService (NRCS) has leadership for the Federal part of the National Cooperative SoilSurvey.
Information about soils is updated periodically. Updated information is availablethrough the NRCS Soil Data Mart Web site or the NRCS Web Soil Survey. The SoilData Mart is the data storage site for the official soil survey information.
The U.S. Department of Agriculture (USDA) prohibits discrimination in all its programsand activities on the basis of race, color, national origin, age, disability, and whereapplicable, sex, marital status, familial status, parental status, religion, sexualorientation, genetic information, political beliefs, reprisal, or because all or a part of anindividual's income is derived from any public assistance program. (Not all prohibitedbases apply to all programs.) Persons with disabilities who require alternative means
2

for communication of program information (Braille, large print, audiotape, etc.) shouldcontact USDA's TARGET Center at (202) 720-2600 (voice and TDD). To file acomplaint of discrimination, write to USDA, Director, Office of Civil Rights, 1400Independence Avenue, S.W., Washington, D.C. 20250-9410 or call (800) 795-3272(voice) or (202) 720-6382 (TDD). USDA is an equal opportunity provider andemployer.
3

ContentsPreface....................................................................................................................2How Soil Surveys Are Made..................................................................................5Soil Map..................................................................................................................7
Soil Map................................................................................................................8Legend..................................................................................................................9Map Unit Legend................................................................................................10Map Unit Descriptions........................................................................................10
San Luis Obispo County, California, Coastal Part..........................................12107—Beaches.............................................................................................12127—Cropley clay, 0 to 2 percent slopes....................................................12131—Diablo and Cibo clays, 15 to 30 percent slopes.................................14143—Gazos-Lodo clay loams, 15 to 30 percent slopes..............................15155—Lopez very shaly clay loam, 9 to 30 percent slopes..........................17204—Santa Lucia shaly clay loam, 50 to 75 percent slopes.......................18
References............................................................................................................20
4
How Soil Surveys Are MadeSoil surveys are made to provide information about the soils and miscellaneous areasin a specific area. They include a description of the soils and miscellaneous areas andtheir location on the landscape and tables that show soil properties and limitationsaffecting various uses. Soil scientists observed the steepness, length, and shape ofthe slopes; the general pattern of drainage; the kinds of crops and native plants; andthe kinds of bedrock. They observed and described many soil profiles. A soil profile isthe sequence of natural layers, or horizons, in a soil. The profile extends from thesurface down into the unconsolidated material in which the soil formed or from thesurface down to bedrock. The unconsolidated material is devoid of roots and otherliving organisms and has not been changed by other biological activity.
Currently, soils are mapped according to the boundaries of major land resource areas(MLRAs). MLRAs are geographically associated land resource units that sharecommon characteristics related to physiography, geology, climate, water resources,soils, biological resources, and land uses (USDA, 2006). Soil survey areas typicallyconsist of parts of one or more MLRA.
The soils and miscellaneous areas in a survey area occur in an orderly pattern that isrelated to the geology, landforms, relief, climate, and natural vegetation of the area.Each kind of soil and miscellaneous area is associated with a particular kind oflandform or with a segment of the landform. By observing the soils and miscellaneousareas in the survey area and relating their position to specific segments of thelandform, a soil scientist develops a concept, or model, of how they were formed. Thus,during mapping, this model enables the soil scientist to predict with a considerabledegree of accuracy the kind of soil or miscellaneous area at a specific location on thelandscape.
Commonly, individual soils on the landscape merge into one another as theircharacteristics gradually change. To construct an accurate soil map, however, soilscientists must determine the boundaries between the soils. They can observe onlya limited number of soil profiles. Nevertheless, these observations, supplemented byan understanding of the soil-vegetation-landscape relationship, are sufficient to verifypredictions of the kinds of soil in an area and to determine the boundaries.
Soil scientists recorded the characteristics of the soil profiles that they studied. Theynoted soil color, texture, size and shape of soil aggregates, kind and amount of rockfragments, distribution of plant roots, reaction, and other features that enable them toidentify soils. After describing the soils in the survey area and determining theirproperties, the soil scientists assigned the soils to taxonomic classes (units).Taxonomic classes are concepts. Each taxonomic class has a set of soilcharacteristics with precisely defined limits. The classes are used as a basis forcomparison to classify soils systematically. Soil taxonomy, the system of taxonomicclassification used in the United States, is based mainly on the kind and character ofsoil properties and the arrangement of horizons within the profile. After the soilscientists classified and named the soils in the survey area, they compared the
5

individual soils with similar soils in the same taxonomic class in other areas so thatthey could confirm data and assemble additional data based on experience andresearch.
The objective of soil mapping is not to delineate pure map unit components; theobjective is to separate the landscape into landforms or landform segments that havesimilar use and management requirements. Each map unit is defined by a uniquecombination of soil components and/or miscellaneous areas in predictableproportions. Some components may be highly contrasting to the other components ofthe map unit. The presence of minor components in a map unit in no way diminishesthe usefulness or accuracy of the data. The delineation of such landforms andlandform segments on the map provides sufficient information for the development ofresource plans. If intensive use of small areas is planned, onsite investigation isneeded to define and locate the soils and miscellaneous areas.
Soil scientists make many field observations in the process of producing a soil map.The frequency of observation is dependent upon several factors, including scale ofmapping, intensity of mapping, design of map units, complexity of the landscape, andexperience of the soil scientist. Observations are made to test and refine the soil-landscape model and predictions and to verify the classification of the soils at specificlocations. Once the soil-landscape model is refined, a significantly smaller number ofmeasurements of individual soil properties are made and recorded. Thesemeasurements may include field measurements, such as those for color, depth tobedrock, and texture, and laboratory measurements, such as those for content ofsand, silt, clay, salt, and other components. Properties of each soil typically vary fromone point to another across the landscape.
Observations for map unit components are aggregated to develop ranges ofcharacteristics for the components. The aggregated values are presented. Directmeasurements do not exist for every property presented for every map unitcomponent. Values for some properties are estimated from combinations of otherproperties.
While a soil survey is in progress, samples of some of the soils in the area generallyare collected for laboratory analyses and for engineering tests. Soil scientists interpretthe data from these analyses and tests as well as the field-observed characteristicsand the soil properties to determine the expected behavior of the soils under differentuses. Interpretations for all of the soils are field tested through observation of the soilsin different uses and under different levels of management. Some interpretations aremodified to fit local conditions, and some new interpretations are developed to meetlocal needs. Data are assembled from other sources, such as research information,production records, and field experience of specialists. For example, data on cropyields under defined levels of management are assembled from farm records and fromfield or plot experiments on the same kinds of soil.
Predictions about soil behavior are based not only on soil properties but also on suchvariables as climate and biological activity. Soil conditions are predictable over longperiods of time, but they are not predictable from year to year. For example, soilscientists can predict with a fairly high degree of accuracy that a given soil will havea high water table within certain depths in most years, but they cannot predict that ahigh water table will always be at a specific level in the soil on a specific date.
After soil scientists located and identified the significant natural bodies of soil in thesurvey area, they drew the boundaries of these bodies on aerial photographs andidentified each as a specific map unit. Aerial photographs show trees, buildings, fields,roads, and rivers, all of which help in locating boundaries accurately.
Custom Soil Resource Report
6

Soil MapThe soil map section includes the soil map for the defined area of interest, a list of soilmap units on the map and extent of each map unit, and cartographic symbolsdisplayed on the map. Also presented are various metadata about data used toproduce the map, and a description of each soil map unit.
7

Front St
Avila Beach Dr
Cave Landing R
d
Blue Herron Dr
San Luis St
San
Raf
ael S
t
1st St
155
131127
204
143
143
107
706600
706600
706700
706700
706800
706800
706900
706900
707000
707000
707100
707100
707200
707200
707300
707300
707400
707400
707500
707500
3894
600
3894
600
3894
700
3894
700
3894
800
3894
800
3894
900
3894
900
3895
000
3895
000
3895
100
3895
100
3895
200
3895
200
3895
300
3895
300
3895
400
3895
400
3895
500
3895
500
3895
600
3895
600
3895
700
3895
700
3895
800
3895
800
0 400 800 1,200200Feet
0 100 200 30050Meters
±
35° 11' 3''
120°
43'
12'
'
35° 10' 20''
120°
43'
14'
'
35° 10' 21''
35° 11' 4''12
0° 4
3' 5
2''
120°
43'
51'
'
Map Scale: 1:6,340 if printed on A size (8.5" x 11") sheet.
Custom Soil Resource ReportSoil Map

MAP LEGEND MAP INFORMATION
Area of Interest (AOI)Area of Interest (AOI)
SoilsSoil Map Units
Special Point FeaturesBlowout
Borrow Pit
Clay Spot
Closed Depression
Gravel Pit
Gravelly Spot
Landfill
Lava Flow
Marsh or swamp
Mine or Quarry
Miscellaneous Water
Perennial Water
Rock Outcrop
Saline Spot
Sandy Spot
Severely Eroded Spot
Sinkhole
Slide or Slip
Sodic Spot
Spoil Area
Stony Spot
Very Stony Spot
Wet Spot
Other
Special Line FeaturesGully
Short Steep Slope
Other
Political FeaturesCities
Water FeaturesStreams and Canals
TransportationRails
Interstate Highways
US Routes
Major Roads
Local Roads
Map Scale: 1:6,340 if printed on A size (8.5" × 11") sheet.
The soil surveys that comprise your AOI were mapped at 1:24,000.
Warning: Soil Map may not be valid at this scale.
Enlargement of maps beyond the scale of mapping can causemisunderstanding of the detail of mapping and accuracy of soil lineplacement. The maps do not show the small areas of contrastingsoils that could have been shown at a more detailed scale.
Please rely on the bar scale on each map sheet for accurate mapmeasurements.
Source of Map: Natural Resources Conservation ServiceWeb Soil Survey URL: http://websoilsurvey.nrcs.usda.govCoordinate System: UTM Zone 10N NAD83
This product is generated from the USDA-NRCS certified data as ofthe version date(s) listed below.
Soil Survey Area: San Luis Obispo County, California, CoastalPartSurvey Area Data: Version 4, Jan 2, 2008
Date(s) aerial images were photographed: 6/6/2005
The orthophoto or other base map on which the soil lines werecompiled and digitized probably differs from the backgroundimagery displayed on these maps. As a result, some minor shiftingof map unit boundaries may be evident.
Custom Soil Resource Report

Map Unit Legend
San Luis Obispo County, California, Coastal Part (CA664)
Map Unit Symbol Map Unit Name Acres in AOI Percent of AOI
107 Beaches 0.2 0.2%
127 Cropley clay, 0 to 2 percent slopes 4.5 4.6%
131 Diablo and Cibo clays, 15 to 30percent slopes
8.4 8.7%
143 Gazos-Lodo clay loams, 15 to 30percent slopes
1.6 1.7%
155 Lopez very shaly clay loam, 9 to 30percent slopes
80.0 82.7%
204 Santa Lucia shaly clay loam, 50 to 75percent slopes
2.0 2.1%
Totals for Area of Interest 96.7 100.0%
Map Unit DescriptionsThe map units delineated on the detailed soil maps in a soil survey represent the soilsor miscellaneous areas in the survey area. The map unit descriptions, along with themaps, can be used to determine the composition and properties of a unit.
A map unit delineation on a soil map represents an area dominated by one or moremajor kinds of soil or miscellaneous areas. A map unit is identified and namedaccording to the taxonomic classification of the dominant soils. Within a taxonomicclass there are precisely defined limits for the properties of the soils. On the landscape,however, the soils are natural phenomena, and they have the characteristic variabilityof all natural phenomena. Thus, the range of some observed properties may extendbeyond the limits defined for a taxonomic class. Areas of soils of a single taxonomicclass rarely, if ever, can be mapped without including areas of other taxonomicclasses. Consequently, every map unit is made up of the soils or miscellaneous areasfor which it is named and some minor components that belong to taxonomic classesother than those of the major soils.
Most minor soils have properties similar to those of the dominant soil or soils in themap unit, and thus they do not affect use and management. These are callednoncontrasting, or similar, components. They may or may not be mentioned in aparticular map unit description. Other minor components, however, have propertiesand behavioral characteristics divergent enough to affect use or to require differentmanagement. These are called contrasting, or dissimilar, components. They generallyare in small areas and could not be mapped separately because of the scale used.Some small areas of strongly contrasting soils or miscellaneous areas are identifiedby a special symbol on the maps. If included in the database for a given area, thecontrasting minor components are identified in the map unit descriptions along withsome characteristics of each. A few areas of minor components may not have beenobserved, and consequently they are not mentioned in the descriptions, especiallywhere the pattern was so complex that it was impractical to make enough observationsto identify all the soils and miscellaneous areas on the landscape.
Custom Soil Resource Report
10

The presence of minor components in a map unit in no way diminishes the usefulnessor accuracy of the data. The objective of mapping is not to delineate pure taxonomicclasses but rather to separate the landscape into landforms or landform segments thathave similar use and management requirements. The delineation of such segmentson the map provides sufficient information for the development of resource plans. Ifintensive use of small areas is planned, however, onsite investigation is needed todefine and locate the soils and miscellaneous areas.
An identifying symbol precedes the map unit name in the map unit descriptions. Eachdescription includes general facts about the unit and gives important soil propertiesand qualities.
Soils that have profiles that are almost alike make up a soil series. Except fordifferences in texture of the surface layer, all the soils of a series have major horizonsthat are similar in composition, thickness, and arrangement.
Soils of one series can differ in texture of the surface layer, slope, stoniness, salinity,degree of erosion, and other characteristics that affect their use. On the basis of suchdifferences, a soil series is divided into soil phases. Most of the areas shown on thedetailed soil maps are phases of soil series. The name of a soil phase commonlyindicates a feature that affects use or management. For example, Alpha silt loam, 0to 2 percent slopes, is a phase of the Alpha series.
Some map units are made up of two or more major soils or miscellaneous areas.These map units are complexes, associations, or undifferentiated groups.
A complex consists of two or more soils or miscellaneous areas in such an intricatepattern or in such small areas that they cannot be shown separately on the maps. Thepattern and proportion of the soils or miscellaneous areas are somewhat similar in allareas. Alpha-Beta complex, 0 to 6 percent slopes, is an example.
An association is made up of two or more geographically associated soils ormiscellaneous areas that are shown as one unit on the maps. Because of present oranticipated uses of the map units in the survey area, it was not considered practicalor necessary to map the soils or miscellaneous areas separately. The pattern andrelative proportion of the soils or miscellaneous areas are somewhat similar. Alpha-Beta association, 0 to 2 percent slopes, is an example.
An undifferentiated group is made up of two or more soils or miscellaneous areas thatcould be mapped individually but are mapped as one unit because similarinterpretations can be made for use and management. The pattern and proportion ofthe soils or miscellaneous areas in a mapped area are not uniform. An area can bemade up of only one of the major soils or miscellaneous areas, or it can be made upof all of them. Alpha and Beta soils, 0 to 2 percent slopes, is an example.
Some surveys include miscellaneous areas. Such areas have little or no soil materialand support little or no vegetation. Rock outcrop is an example.
Custom Soil Resource Report
11

San Luis Obispo County, California, Coastal Part
107—Beaches
Map Unit SettingElevation: 0 to 10 feetMean annual precipitation: 42 to 48 inchesMean annual air temperature: 52 to 57 degrees FFrost-free period: 190 to 210 days
Map Unit CompositionBeaches: 90 percentMinor components: 6 percent
Description of Beaches
SettingLandform: BeachesLandform position (three-dimensional): Tread
Properties and qualitiesSlope: 0 to 2 percentDrainage class: Poorly drainedCapacity of the most limiting layer to transmit water (Ksat): High to very high (5.95
to 19.98 in/hr)Depth to water table: About 0 to 72 inchesFrequency of flooding: FrequentMaximum salinity: Very slightly saline to moderately saline (4.0 to 16.0 mmhos/cm)Available water capacity: Very low (about 2.4 inches)
Interpretive groupsLand capability classification (irrigated): 8wLand capability (nonirrigated): 8w
Typical profile0 to 6 inches: Sand6 to 60 inches: Sand
Minor Components
DunelandPercent of map unit: 3 percent
Rock outcroppingsPercent of map unit: 3 percent
127—Cropley clay, 0 to 2 percent slopes
Map Unit SettingElevation: 100 to 700 feetMean annual precipitation: 14 to 20 inches
Custom Soil Resource Report
12

Mean annual air temperature: 57 degrees FFrost-free period: 250 to 330 days
Map Unit CompositionCropley and similar soils: 85 percentMinor components: 14 percent
Description of Cropley
SettingLandform: Alluvial fans, alluvial flatsLandform position (two-dimensional): Footslope, toeslopeLandform position (three-dimensional): TreadDown-slope shape: LinearAcross-slope shape: LinearParent material: Alluvium derived from sedimentary rock
Properties and qualitiesSlope: 0 to 2 percentDepth to restrictive feature: More than 80 inchesDrainage class: Moderately well drainedCapacity of the most limiting layer to transmit water (Ksat): Moderately low to
moderately high (0.06 to 0.20 in/hr)Depth to water table: More than 80 inchesFrequency of flooding: NoneFrequency of ponding: NoneCalcium carbonate, maximum content: 5 percentMaximum salinity: Nonsaline (0.0 to 2.0 mmhos/cm)Available water capacity: Moderate (about 8.0 inches)
Interpretive groupsLand capability classification (irrigated): 2sLand capability (nonirrigated): 3sEcological site: CLAYEY (R014XD001CA)
Typical profile0 to 36 inches: Clay36 to 60 inches: Silty clay loam
Minor Components
Concepcion loamPercent of map unit: 3 percent
Diablo clayPercent of map unit: 3 percent
Salinas silty clay loamPercent of map unit: 3 percent
UnnamedPercent of map unit: 3 percent
UnnamedPercent of map unit: 2 percentLandform: Drainageways
Custom Soil Resource Report
13

131—Diablo and Cibo clays, 15 to 30 percent slopes
Map Unit SettingElevation: 200 to 3,000 feetMean annual precipitation: 14 to 28 inchesMean annual air temperature: 59 degrees FFrost-free period: 275 to 350 days
Map Unit CompositionCibo and similar soils: 45 percentDiablo and similar soils: 45 percentMinor components: 8 percent
Description of Diablo
SettingLandform: Hills, mountainsLandform position (two-dimensional): Backslope, summitLandform position (three-dimensional): Mountainflank, side slope, crestDown-slope shape: Convex, linearAcross-slope shape: ConvexParent material: Residuum weathered from mudstone, sandstone and/or shale
Properties and qualitiesSlope: 15 to 30 percentDepth to restrictive feature: 45 to 58 inches to paralithic bedrockDrainage class: Well drainedCapacity of the most limiting layer to transmit water (Ksat): Very low (0.00 in/hr)Depth to water table: More than 80 inchesFrequency of flooding: NoneFrequency of ponding: NoneCalcium carbonate, maximum content: 5 percentMaximum salinity: Nonsaline (0.0 to 2.0 mmhos/cm)Available water capacity: High (about 9.8 inches)
Interpretive groupsLand capability classification (irrigated): 4eLand capability (nonirrigated): 4eEcological site: CLAYEY (R015XD001CA)
Typical profile0 to 38 inches: Clay38 to 58 inches: Clay58 to 62 inches: Weathered bedrock
Description of Cibo
SettingLandform: Mountains, hillsLandform position (two-dimensional): Backslope, summit
Custom Soil Resource Report
14

Landform position (three-dimensional): Mountainflank, side slope, crestDown-slope shape: Linear, convexAcross-slope shape: ConvexParent material: Residuum weathered from metasedimentary rock
Properties and qualitiesSlope: 15 to 30 percentDepth to restrictive feature: 20 to 40 inches to lithic bedrockDrainage class: Well drainedCapacity of the most limiting layer to transmit water (Ksat): Very low (0.00 in/hr)Depth to water table: More than 80 inchesFrequency of flooding: NoneFrequency of ponding: NoneAvailable water capacity: Moderate (about 6.2 inches)
Interpretive groupsLand capability classification (irrigated): 4eLand capability (nonirrigated): 4eEcological site: CLAYEY (R015XD001CA)
Typical profile0 to 31 inches: Clay31 to 39 inches: Clay39 to 43 inches: Unweathered bedrock
Minor Components
Lodo clay loamPercent of map unit: 2 percent
Los osos loamPercent of map unit: 2 percent
Zaca clayPercent of map unit: 2 percent
Rock outcropPercent of map unit: 2 percent
143—Gazos-Lodo clay loams, 15 to 30 percent slopes
Map Unit SettingElevation: 300 to 2,000 feetMean annual precipitation: 15 to 28 inchesMean annual air temperature: 57 degrees FFrost-free period: 250 to 350 days
Map Unit CompositionGazos and similar soils: 45 percentLodo and similar soils: 40 percentMinor components: 15 percent
Custom Soil Resource Report
15

Description of Gazos
SettingLandform: Mountains, hillsLandform position (two-dimensional): Backslope, summitLandform position (three-dimensional): Mountainflank, crest, side slopeDown-slope shape: Linear, convexAcross-slope shape: ConvexParent material: Residuum weathered from sandstone and shale
Properties and qualitiesSlope: 15 to 30 percentDepth to restrictive feature: 22 to 38 inches to lithic bedrockDrainage class: Well drainedCapacity of the most limiting layer to transmit water (Ksat): Very low (0.00 in/hr)Depth to water table: More than 80 inchesFrequency of flooding: NoneFrequency of ponding: NoneAvailable water capacity: Low (about 5.4 inches)
Interpretive groupsLand capability classification (irrigated): 6eLand capability (nonirrigated): 6eEcological site: FINE LOAMY (R015XD024CA)
Typical profile0 to 30 inches: Clay loam30 to 34 inches: Unweathered bedrock
Description of Lodo
SettingLandform: Hills, mountainsLandform position (two-dimensional): Backslope, summitLandform position (three-dimensional): Mountainflank, side slope, crestDown-slope shape: Convex, linearAcross-slope shape: ConvexParent material: Residuum weathered from sandstone and shale
Properties and qualitiesSlope: 15 to 30 percentDepth to restrictive feature: 4 to 20 inches to lithic bedrockDrainage class: Somewhat excessively drainedCapacity of the most limiting layer to transmit water (Ksat): Very low (0.00 in/hr)Depth to water table: More than 80 inchesFrequency of flooding: NoneFrequency of ponding: NoneAvailable water capacity: Very low (about 1.9 inches)
Interpretive groupsLand capability classification (irrigated): 4eLand capability (nonirrigated): 4eEcological site: SHALLOW FINE LOAMY (R015XD070CA)
Typical profile0 to 12 inches: Clay loam12 to 16 inches: Unweathered bedrock
Custom Soil Resource Report
16
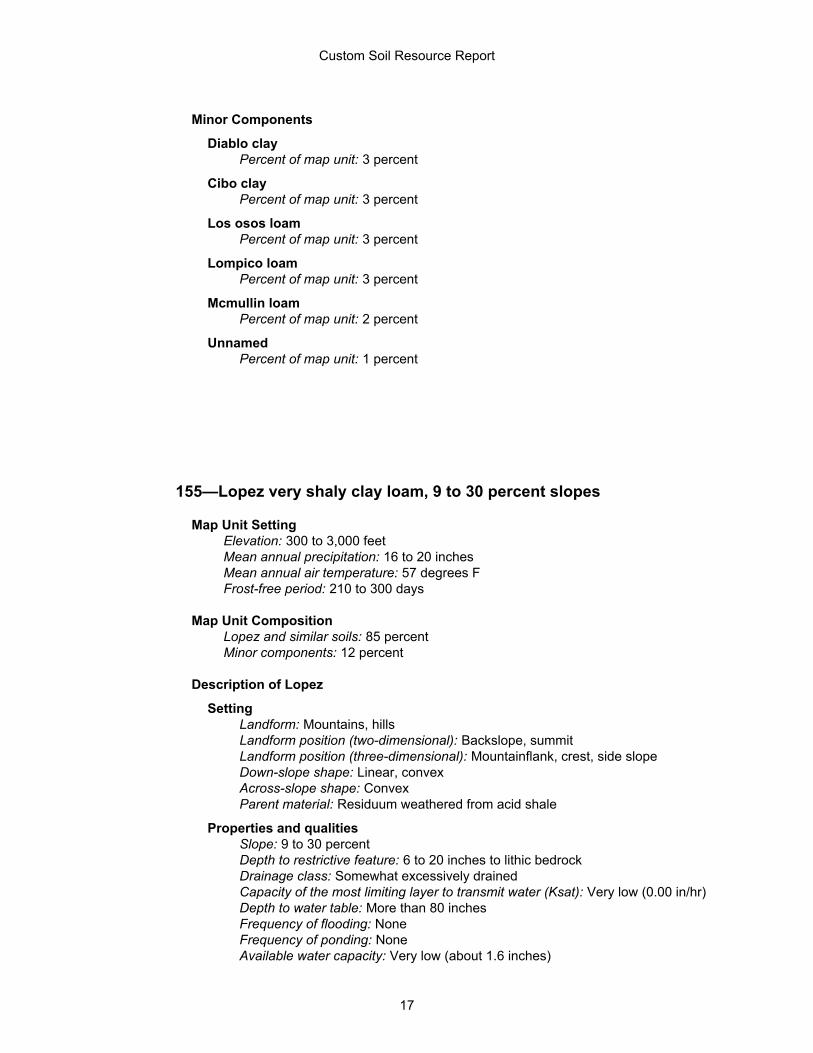
Minor Components
Diablo clayPercent of map unit: 3 percent
Cibo clayPercent of map unit: 3 percent
Los osos loamPercent of map unit: 3 percent
Lompico loamPercent of map unit: 3 percent
Mcmullin loamPercent of map unit: 2 percent
UnnamedPercent of map unit: 1 percent
155—Lopez very shaly clay loam, 9 to 30 percent slopes
Map Unit SettingElevation: 300 to 3,000 feetMean annual precipitation: 16 to 20 inchesMean annual air temperature: 57 degrees FFrost-free period: 210 to 300 days
Map Unit CompositionLopez and similar soils: 85 percentMinor components: 12 percent
Description of Lopez
SettingLandform: Mountains, hillsLandform position (two-dimensional): Backslope, summitLandform position (three-dimensional): Mountainflank, crest, side slopeDown-slope shape: Linear, convexAcross-slope shape: ConvexParent material: Residuum weathered from acid shale
Properties and qualitiesSlope: 9 to 30 percentDepth to restrictive feature: 6 to 20 inches to lithic bedrockDrainage class: Somewhat excessively drainedCapacity of the most limiting layer to transmit water (Ksat): Very low (0.00 in/hr)Depth to water table: More than 80 inchesFrequency of flooding: NoneFrequency of ponding: NoneAvailable water capacity: Very low (about 1.6 inches)
Custom Soil Resource Report
17

Interpretive groupsLand capability classification (irrigated): 7eLand capability (nonirrigated): 7eEcological site: SHALLOW GRAVELLY FINE LOAMY (R015XD145CA)
Typical profile0 to 18 inches: Very channery clay loam18 to 22 inches: Unweathered bedrock
Minor Components
Lodo clay loamPercent of map unit: 3 percent
Los osos loamPercent of map unit: 3 percent
Rock outcropPercent of map unit: 3 percent
Santa lucia very shaly clay loamPercent of map unit: 3 percent
204—Santa Lucia shaly clay loam, 50 to 75 percent slopes
Map Unit SettingElevation: 100 to 2,500 feetMean annual precipitation: 18 to 25 inchesMean annual air temperature: 55 degrees FFrost-free period: 330 to 365 days
Map Unit CompositionSanta lucia and similar soils: 85 percentMinor components: 12 percent
Description of Santa Lucia
SettingLandform: MountainsLandform position (two-dimensional): BackslopeLandform position (three-dimensional): MountainflankDown-slope shape: LinearAcross-slope shape: ConvexParent material: Residuum weathered from acid shale
Properties and qualitiesSlope: 50 to 75 percentDepth to restrictive feature: 20 to 40 inches to lithic bedrockDrainage class: Well drainedCapacity of the most limiting layer to transmit water (Ksat): Very low (0.00 in/hr)Depth to water table: More than 80 inchesFrequency of flooding: None
Custom Soil Resource Report
18

Frequency of ponding: NoneAvailable water capacity: Low (about 3.9 inches)
Interpretive groupsLand capability classification (irrigated): 7eLand capability (nonirrigated): 7eEcological site: NORTH SLOPE GRAVELLY FINE LOAMY (R015XD147CA)
Typical profile0 to 17 inches: Channery clay loam17 to 36 inches: Very channery clay loam36 to 40 inches: Unweathered bedrock
Minor Components
Calodo loamPercent of map unit: 3 percent
Gazos clay loamPercent of map unit: 3 percent
Nacimiento silty clay loamPercent of map unit: 3 percent
Lopez very shaly clay loamPercent of map unit: 3 percent
Custom Soil Resource Report
19

ReferencesAmerican Association of State Highway and Transportation Officials (AASHTO). 2004.Standard specifications for transportation materials and methods of sampling andtesting. 24th edition.
American Society for Testing and Materials (ASTM). 2005. Standard classification ofsoils for engineering purposes. ASTM Standard D2487-00.
Cowardin, L.M., V. Carter, F.C. Golet, and E.T. LaRoe. 1979. Classification ofwetlands and deep-water habitats of the United States. U.S. Fish and Wildlife ServiceFWS/OBS-79/31.
Federal Register. July 13, 1994. Changes in hydric soils of the United States.
Federal Register. September 18, 2002. Hydric soils of the United States.
Hurt, G.W., and L.M. Vasilas, editors. Version 6.0, 2006. Field indicators of hydric soilsin the United States.
National Research Council. 1995. Wetlands: Characteristics and boundaries.
Soil Survey Division Staff. 1993. Soil survey manual. Soil Conservation Service. U.S.Department of Agriculture Handbook 18. http://soils.usda.gov/
Soil Survey Staff. 1999. Soil taxonomy: A basic system of soil classification for makingand interpreting soil surveys. 2nd edition. Natural Resources Conservation Service,U.S. Department of Agriculture Handbook 436. http://soils.usda.gov/
Soil Survey Staff. 2006. Keys to soil taxonomy. 10th edition. U.S. Department ofAgriculture, Natural Resources Conservation Service. http://soils.usda.gov/
Tiner, R.W., Jr. 1985. Wetlands of Delaware. U.S. Fish and Wildlife Service andDelaware Department of Natural Resources and Environmental Control, WetlandsSection.
United States Army Corps of Engineers, Environmental Laboratory. 1987. Corps ofEngineers wetlands delineation manual. Waterways Experiment Station TechnicalReport Y-87-1.
United States Department of Agriculture, Natural Resources Conservation Service.National forestry manual. http://soils.usda.gov/
United States Department of Agriculture, Natural Resources Conservation Service.National range and pasture handbook. http://www.glti.nrcs.usda.gov/
United States Department of Agriculture, Natural Resources Conservation Service.National soil survey handbook, title 430-VI. http://soils.usda.gov/
United States Department of Agriculture, Natural Resources Conservation Service.2006. Land resource regions and major land resource areas of the United States, theCaribbean, and the Pacific Basin. U.S. Department of Agriculture Handbook 296.http://soils.usda.gov/
20

United States Department of Agriculture, Soil Conservation Service. 1961. Landcapability classification. U.S. Department of Agriculture Handbook 210.
Custom Soil Resource Report
21

Memorandum
To: William Almas, Chevron Land and
Development
From: Michael Josselyn, PhD PWS
Cc: Debbie Rudd, RRM Design Group
Date:
Subject:
January 15, 2014
Revised Wetland Boundary, Avila Tank Farm
PURPOSE
The purpose of this memorandum is to provide Chevron with an update on findings related to awetland feature on the property and adjacent to Avila Beach Drive that had been identified during aninitial reconnaissance by Padre and Associates. A subsequent investigation using the most updatedfederal list of wetland indicator plants (2012) has resulted in a modification of the boundaries of thiswetland feature. This memo describes the basis for this revision.
BACKGROUND
Padre Associates conducted a wetland delineation at the Project Site in December 2011 andidentified seven areas containing wetland vegetation totaling approximately 1.69 acres. Six of thesefeatures were either associated with former stormwater basins or were found within the foundationsof ASTs that have been removed. One of these wetland features (Wetland 7; Padre Associates 2011)was located north of the former tank farm adjacent Avila Beach Drive. While the Corps of Engineershas expressed its opinion that none of the features containing wetland vegetation are consideredjurisdictional under Section 404 of the Clean Water Act due to exclusions under the regulationsimplementing the Act; these features may still be considered jurisdictional features under theCoastal Act which uses the presence of any one of the wetland indicators (as compared to the Corpsof Engineers which requires all three–hydrophytes, hydric soils, and hydrology–to be present).

1http://www.usace.army.mil/Portals/2/docs/civilworks/regulatory/techbio/nwpl_may2012_factsheet.pdf
BASIS FOR REVISION
The dominance of species classified as “hydrophytes” serves as the basis for a determination that aparticular area is a wetland under the Coastal Act definition. Furthermore, hydrophytes are definedas those species listed on a National Wetland Plant Indicator List as either obligate, facultative wet,or facultative plant species. If 50% of the species in an area fall within these categories, the area isdetermined to be a wetland according to the Coastal Act definition.
The National Wetland Plant Indicator List is regularly updated by the Corps of Engineers, with publicand agency input. Based on the best scientific information available, the wetland status of individualspecies may be changed. The list was updated in 20121 and one of the dominant species observedon the site, bristly ox-tongue (Helminthotheca echioides) is no longer considered a hydrophyte. As aresult, vegetation within the higher elevations mapped by Padre is not dominated by hydrophyticvegetation. Indicators of wetland hydrology are also lacking in the upper portions of this previouslymapped feature, although some prolonged surface ponding may occur immediately adjacent to AvilaBeach Drive.
FINDINGS
WRA staff conducted a field study in November 2013 using transects and a point interceptmethodology to determine the dominance by hydrophytic vegetation. The point interceptmethodology is an objective procedure that uses a transect and a point frame sampling device toaccurately determine the percent cover by individual species. Four transects were established overthe previously reported wetland and cover by each species present was determined using the pointframe at 10 ft intervals along each transect. The species were then classified according to theirwetland indicator status and those areas that contained more than 50% wetland species wereconsidered to represent a wetland area under the Coastal Act definition. Using these data, a newwetland boundary was determined and was subsequently mapped using a submeter Trimble GPS.
Vegetation within Wetland 7 is dominated primarily by saltgrass (Distichlis spicata) and bristlyox-tongue (Helminthotheca echioides). Saltgrass is considered a hydrophyte, whereas bristly ox-tongue is not. The boundary was therefore determined primarily by the upper edge of the saltgrassdominated areas. As a result, the previously mapped “wetland area” was reduced in size from 0.98acre to 0.17 acre (see attached figure).
WRA also installed two temporary hydrology monitoring stations at the site and will monitor surfacewater throughout the winter-spring of 2013-4 to confirm the findings related to vegetativedominance.

&<
&<
!A1
2Tra
nsec
t C
Trans
ect D
Transect A
Transect B
Date: December 2013Map By: Michael Rochelle
WRA Coastal Act Wetland DelineationNovember 2013 Site Visit Determination
Avila PointAvila BeachSan Luis Obispo County, California
0 50 10025Feet
.
Path: L:\Acad 2000 Files\22000\22209\GIS\ArcMap\GPS Nov 2013.mxd
Wetland 7 - 2012
Wetland 7 - 2013<
!A Culvert&< Hydrology Monitoring Location
Vegetation TransectsWetland Delineation 2013 (0.17 acre)Wetland Delineation 2012 (0.98 acre)