appendix - jicaopen_jicareport.jica.go.jp/pdf/12175634_02.pdf · the project for the improvement of...
TRANSCRIPT

The Project for the Improvement of Water Supply, Sewerage and Drainage System in Yangon City Vol VI Sewerage and Drainage System Master Plan, Appendix
Project for the Improvement of
Water Supply, Sewerage and Drainage System
in Yangon City
Final Report
Volume VI
Sewerage and Drainage System Mater Plan
Appendix


The Project for the Improvement of Water Supply, Sewerage and Drainage System in Yangon City Vol VI Sewerage and Drainage System Master Plan, Appendix
i
Appendix
Table of Contents
A. WATER QUALITY INVESTIGATION ...................................................................................... A-1
B. COST ESTIMATION OF SEWERAGE WORKS ....................................................................... B-1
C. FINANCIAL SIMULATION ....................................................................................................... C-1
D. DRAINAGE FACILITIES PLAN ............................................................................................... D-1
E. COST ESTIMATION OF DRAINAGE WORKS ........................................................................ E-1
F. WASTEWATER GENERATION BY TOWNSHIPS AND SEWERAGE ZONES ..................... F-1
G. HOUSEHOLDS INTERVIEW SURVEY ................................................................................... G-1
H. FLOW CALCULATION OF TRUNK MAINS .......................................................................... H-1
I. DESIGN CALCULATION OF WWTP ........................................................................................ I-1
J. WATER PURIFICATION DEMONSTRATION EXPERIMENT AT KANDAWGYI LAKE ..... J-1
K. CHANGE OF SITES FOR WWTPS ........................................................................................... K-1


The Project for the Improvement of Water Supply, Sewerage and Drainage System in Yangon City Vol VI Sewerage and Drainage System Master Plan, Appendix
A-1
A. WATER QUALITY INVESTIGATION
1. OUTLINE OF WATER QUALITY INVESTIGATION
This water quality investigation consists of following 4 investigations;
- Water quality of Kandawgyi Lake and its pollution source
Sampling and water quality investigation of Kandawgyi Lake water and wastewater of
restaurant and drainage around Kandawgyi Lake are implemented.
- Water quality of YCDC public water bodies
Sampling and water quality investigation of public water body which is managed by YCDC
(i.e. drainage and river) are implemented.
- Functional assessment of existing WWTP
Through the measurement of water quality (Inflow pit, Primary sedimentation tank, Aeration
tank and Final settling tank) and characteristic of activated sludge, existing condition of
WWTP is assessed.
- Water quality of industrial / hospital wastewater
Sampling and water quality investigation of industrial wastewater (3 factories) and hospital
wastewater (3 hospitals) are implemented.
2. SAMPLING POINT AND ANALYSIS ITEM
(1) Sampling point
Sampling point is listed below. Kandawgyi Lake (Lake water: 3 samples, Drainage: 3 samples and
Restaurant: 3 samples), YCDC urban drainage: 6 samples, River: 8 samples, Factory: 3 samples,
Hospital: 3 samples and WWTP (4 sampling points in WWTP), Total 34 sampling points.
Through this investigation, characteristic of water quality of Kandawgyi Lake, Drainage, River,
Industrial / Hospital wastewater and WWTP are investigated.
This investigation is implemented 2 times, i.e. rainy season: 1 time and dry season: 1 time.

The Project for the Improvement of Water Supply, Sewerage and Drainage System in Yangon City Vol VI Sewerage and Drainage System Master Plan, Appendix
A-2
Table A.1 Sampling Point No. of sample
Classification Name of sampling point Number of sample
WW - 1~3 Restaurants Restaurant-A, B, C and D Rainy season: Restaurant- A, B and C Dry season: Restaurant- B, C and D
4
WW - 4~6 Factory Factory-A, B and C 3
WW - 7~9 Hospital
Yangon General Hospital (Department of plastic, manila facial and oral surgery) Yangon General Hospital Yangon New General Hospital
3
WW - 10~21 WWTP
Inflow pit Primary sedimentation tank Aeration tank Final settling tank
12 (4 point× 3 times)
WW - 22~24 Kandawgyi Lake Kandawgyi Lake (3 points) 3 WW - 25~27 Drainage 3 Drainage discharging into Kandawgyi Lake 3
WW - 28~35 River
Hlaing River Yangon River Bago River Nga Moe Yeik Creek Pu Zun Taung Creek
8
WW - 36~41 Drainage
Pauk Tar Chaung Yoe Gyi Chaung Thamaing Chaung Padauk Chaung Tbebyu Chaung Nat Chaung
6
Total (34 Sampling points) 42
(2) Analysis item
Analysis item is shown below. Water quality is to be analyzed with respect to 10 parameters, in case
of WWTP (aeration tank) assessment is to be made for 7 items.
Table A.2 Analysis Item
Sample Analysis item
Lake, Drainage, River
and Waste water
Water temperature, pH, Suspended solid, CODCr, BOD, T-N, Ammonium nitrogen,
Kjeldahl nitrogen, T-P and Electrical conductivity (EC)
Aeration tank Water temperature, pH, Mixed liquor suspended solids (MLSS), Sludge volume
(SV), Sludge volume index (SVI), Mixed liquor dissolved oxygen (MLDO), and EC
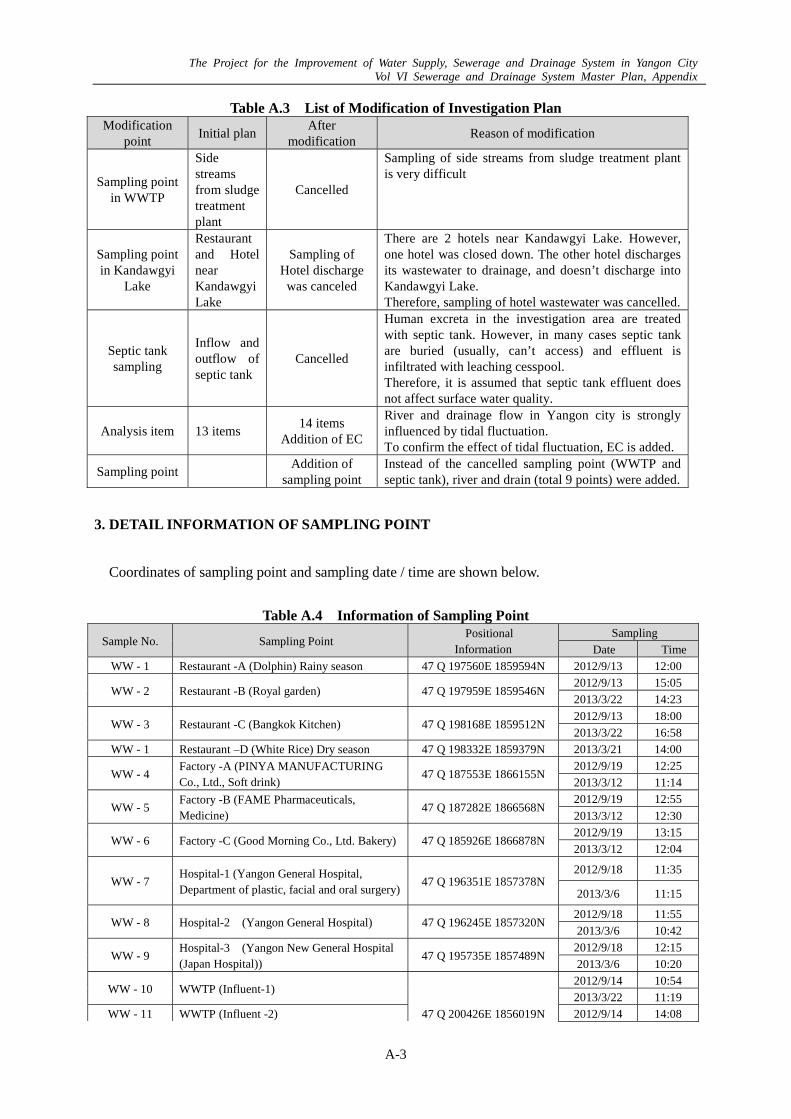
(3) Modification of investigation plan
From the preparatory investigation of sampling point, investigation plan was modified.
Modification is described in following table.
The Project for the Improvement of Water Supply, Sewerage and Drainage System in Yangon City Vol VI Sewerage and Drainage System Master Plan, Appendix
A-3
Table A.3 List of Modification of Investigation Plan Modification
point Initial plan
After modification
Reason of modification
Sampling point in WWTP
Side streams from sludge treatment plant
Cancelled
Sampling of side streams from sludge treatment plant is very difficult
Sampling point in Kandawgyi
Lake
Restaurant and Hotel near Kandawgyi Lake
Sampling of Hotel discharge was canceled
There are 2 hotels near Kandawgyi Lake. However, one hotel was closed down. The other hotel discharges its wastewater to drainage, and doesn’t discharge into Kandawgyi Lake. Therefore, sampling of hotel wastewater was cancelled.
Septic tank sampling
Inflow and outflow of septic tank
Cancelled
Human excreta in the investigation area are treated with septic tank. However, in many cases septic tank are buried (usually, can’t access) and effluent is infiltrated with leaching cesspool. Therefore, it is assumed that septic tank effluent does not affect surface water quality.
Analysis item 13 items 14 items
Addition of EC
River and drainage flow in Yangon city is strongly influenced by tidal fluctuation. To confirm the effect of tidal fluctuation, EC is added.
Sampling point Addition of
sampling point Instead of the cancelled sampling point (WWTP and septic tank), river and drain (total 9 points) were added.
3. DETAIL INFORMATION OF SAMPLING POINT
Coordinates of sampling point and sampling date / time are shown below.
Table A.4 Information of Sampling Point
Sample No. Sampling Point Positional
Information Sampling
Date Time
WW - 1 Restaurant -A (Dolphin) Rainy season 47 Q 197560E 1859594N 2012/9/13 12:00
WW - 2 Restaurant -B (Royal garden) 47 Q 197959E 1859546N 2012/9/13 15:05
2013/3/22 14:23
WW - 3 Restaurant -C (Bangkok Kitchen) 47 Q 198168E 1859512N 2012/9/13 18:00
2013/3/22 16:58
WW - 1 Restaurant –D (White Rice) Dry season 47 Q 198332E 1859379N 2013/3/21 14:00
WW - 4 Factory -A (PINYA MANUFACTURING Co., Ltd., Soft drink)
47 Q 187553E 1866155N 2012/9/19 12:25
2013/3/12 11:14
WW - 5 Factory -B (FAME Pharmaceuticals, Medicine)
47 Q 187282E 1866568N 2012/9/19 12:55
2013/3/12 12:30
WW - 6 Factory -C (Good Morning Co., Ltd. Bakery) 47 Q 185926E 1866878N 2012/9/19 13:15
2013/3/12 12:04
WW - 7 Hospital-1 (Yangon General Hospital, Department of plastic, facial and oral surgery)
47 Q 196351E 1857378N 2012/9/18 11:35
2013/3/6 11:15
WW - 8 Hospital-2 (Yangon General Hospital) 47 Q 196245E 1857320N 2012/9/18 11:55
2013/3/6 10:42
WW - 9 Hospital-3 (Yangon New General Hospital (Japan Hospital))
47 Q 195735E 1857489N 2012/9/18 12:15
2013/3/6 10:20
WW - 10 WWTP (Influent-1) 2012/9/14 10:54
2013/3/22 11:19
WW - 11 WWTP (Influent -2) 47 Q 200426E 1856019N 2012/9/14 14:08

The Project for the Improvement of Water Supply, Sewerage and Drainage System in Yangon City Vol VI Sewerage and Drainage System Master Plan, Appendix
A-4
Sample No. Sampling Point Positional
Information Sampling
Date Time
(WWTP Office) 2013/3/22 16:16
WW - 12 WWTP (Influent -3) 2012/9/18 16:00
2013/3/22 18:00
WW - 13 WWTP (Effluent of Primary Sedimentation Tank -1)
2012/9/14 11:00
2013/3/22 11:27
WW - 14 WWTP (Effluent of Primary Sedimentation Tank -2)
2012/9/14 14:14
2013/3/22 16:20
WW - 15 WWTP (Effluent of Primary Sedimentation Tank -3)
2012/9/18 16:10
2013/3/22 18:15
WW - 16 WWTP (Aeration Tank-1) 2012/9/14 11:15
2013/3/22 11:34
WW - 17 WWTP (Aeration Tank-2) 2012/9/14 14:33
2013/3/22 16:40
WW - 18 WWTP (Aeration Tank-3) 2012/9/18 16:35
2013/3/22 18:30
WW - 19 WWTP (Effluent of Final Sedimentation Tank -1)
2012/9/14 11:10
2013/3/22 11:47
WW - 20 WWTP (Effluent of Final Sedimentation Tank -2)
2012/9/14 14:20
2013/3/22 16:25
WW - 21 WWTP (Effluent of Final Sedimentation Tank -3)
2012/9/18 16:20
2013/3/22 18:20
WW - 22 Kandawgyi Lake -1 47 Q 198010E 1859227N 2012/9/13 16:05
2013/3/22 16:27
WW - 23 Kandawgyi Lake -2 47 Q 197660E 1859050N 2012/9/13 16:15
2013/3/22 16:17
WW - 24 Kandawgyi Lake -3 47 Q 197396E 1859201N 2012/9/13 16:35
2013/3/22 16:08
WW - 25 Kandawgyi Lake –Drainage canal 47 Q 197657E 1859587N 2012/9/13 11:45
2013/3/22 15:41
WW - 26 Kandawgyi Lake -Drainage canal 47 Q 197134E 1859652N 2012/9/18 8:30
2013/3/22 15:18
WW - 27 Kandawgyi Lake -Drainage canal 47 Q 198120E 1859581N 2012/9/18 8:45
2013/3/22 14:42
WW - 28 River -1 (Hlaing River, Wartayar Village, upstream)
47 Q 184689E 1879702N 2012/9/20 12:00
2013/3/7 11:46
WW - 29 River -2 (Hlaing River, midstream) 47 Q 192410E 1863250N 2012/9/20 14:20
2013/3/7 10:22
WW - 30 River -3 (Hlaing River, downstream, Myanmar Industrial Port)
47 Q 194073E 1856740N 2012/9/20 15:10
2013/3/7 09:51
WW - 31 River -4 (Yangon River, Near Bo Ta Htaung Pagoda)
47 Q 198562E 1855824N 2012/9/20 15:50
2013/3/6 14:52
WW - 32 River -5 (Bago River, upstream) 47 Q 216735E 1871825N 2012/9/17 18:20
2013/3/7 14:31
WW - 33 River -6 (Bago River, downstream, Near Thanlyin - Yangon Bridge)
47 Q 205651E 1859927N 2012/9/20 16:50
2013/3/6 13:59
WW - 34 River -7 (Nga Moe Yeik Creek) 47 Q 206632E 1877475N 2012/9/19 8:35
2013/3/7 14:02
WW - 35 River -8 (Pu Zun Taung Creek) 47 Q 199242E 1857450N 2012/9/20 17:25
2013/3/6 14:35
WW - 36 YCDC Drainage Canal -1 (Pauk Tar Chaung)
47 Q 190860E 1868852N 2012/9/20 13:10
2013/3/12 14:43
WW - 37 YCDC Drainage Canal -2 (Yoe Gyi Chaung)
47 Q 191584E 1867124N 2012/9/20 13:45
2013/3/12 14:21

The Project for the Improvement of Water Supply, Sewerage and Drainage System in Yangon City Vol VI Sewerage and Drainage System Master Plan, Appendix
A-5
Sample No. Sampling Point Positional
Information Sampling
Date Time
WW - 38 YCDC Drainage Canal -3 (Thamaing change)
47 Q 191759E 1865890N 2012/9/19 14:15
2013/3/12 13:15
WW - 39 YCDC Drainage Canal -4 (Padauk Chaung) 47 Q 192248E 1864571N 2012/9/19 14:30
2013/3/12 13:26
WW - 40 YCDC Drainage Canal -5 (Tbebyu Chaung) 47 Q 198134E 1858082N 2012/9/18 15:10
2013/3/6 11:31
WW - 41 YCDC Drainage Canal -6 (Nat Chaung) 47 Q 199327E 1860842N 2012/9/18 15:30
2013/3/6 12:03
(1) Sampling point of Kandawgyi Lake
Detailed location of Kandawgyi Lake sampling point is shown below;
Figure A.1 Sampling Point of Kandawgyi Lake
Table A.5 Detailed Information of Restaurant Sampling Point Name General Description
WW-1 (Rainy season) Restaurant-A Dolphin (Myanmar and Chinese food)
Address: Nat Mouk Road, Bahan T/S, Tel: 01-542893, 01-546924 Respondent: U Paw San Number of Seats: 1,000 seats (maximum), 136 seats (daily average) Customers: number of customers per day is from 30 in June to September (minimum) to 1,000 in October to May (maximum) Business hour: from 6:00 to 22:00 Water Consumption: around 600 m3/month (for July 2012) Treatment facilities: 2 chambers for filtration Sampling point: at chamber of filtration
WW-1 (Dry season)
Address: Opposite of Eye Special Hospital, Kandawgyi Park, Natmauk Rd.,01-556837
Restaurant-B Restaurant-CRestaurant-A
The Project for the Improvement of Water Supply, Sewerage and Drainage System in Yangon City Vol VI Sewerage and Drainage System Master Plan, Appendix
A-6
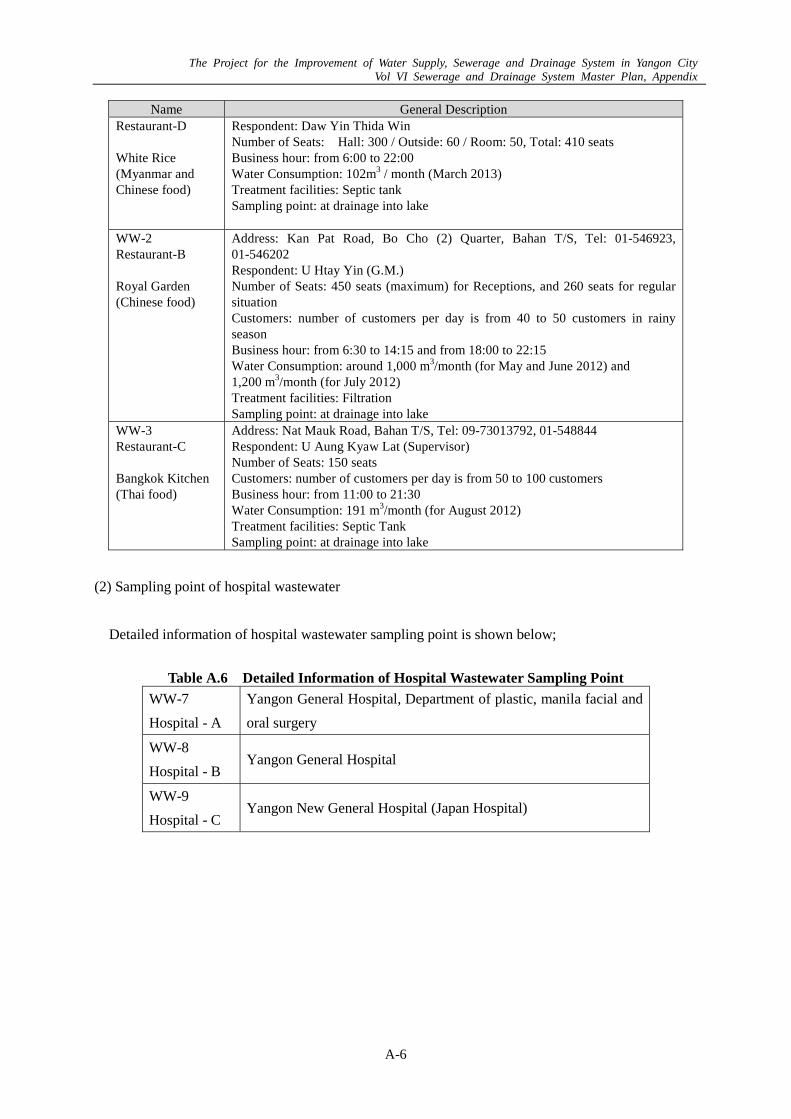
Name General Description Restaurant-D White Rice (Myanmar and Chinese food)
Respondent: Daw Yin Thida Win Number of Seats: Hall: 300 / Outside: 60 / Room: 50, Total: 410 seats Business hour: from 6:00 to 22:00 Water Consumption: 102m3 / month (March 2013) Treatment facilities: Septic tank Sampling point: at drainage into lake
WW-2 Restaurant-B Royal Garden (Chinese food)
Address: Kan Pat Road, Bo Cho (2) Quarter, Bahan T/S, Tel: 01-546923, 01-546202 Respondent: U Htay Yin (G.M.) Number of Seats: 450 seats (maximum) for Receptions, and 260 seats for regular situation Customers: number of customers per day is from 40 to 50 customers in rainy season Business hour: from 6:30 to 14:15 and from 18:00 to 22:15 Water Consumption: around 1,000 m3/month (for May and June 2012) and 1,200 m3/month (for July 2012) Treatment facilities: Filtration Sampling point: at drainage into lake
WW-3 Restaurant-C Bangkok Kitchen (Thai food)
Address: Nat Mauk Road, Bahan T/S, Tel: 09-73013792, 01-548844 Respondent: U Aung Kyaw Lat (Supervisor) Number of Seats: 150 seats Customers: number of customers per day is from 50 to 100 customers Business hour: from 11:00 to 21:30 Water Consumption: 191 m3/month (for August 2012) Treatment facilities: Septic Tank Sampling point: at drainage into lake
(2) Sampling point of hospital wastewater
Detailed information of hospital wastewater sampling point is shown below;
Table A.6 Detailed Information of Hospital Wastewater Sampling Point
WW-7
Hospital - A
Yangon General Hospital, Department of plastic, manila facial and
oral surgery
WW-8
Hospital - B Yangon General Hospital
WW-9
Hospital - C Yangon New General Hospital (Japan Hospital)
The Project for the Improvement of Water Supply, Sewerage and Drainage System in Yangon City Vol VI Sewerage and Drainage System Master Plan, Appendix
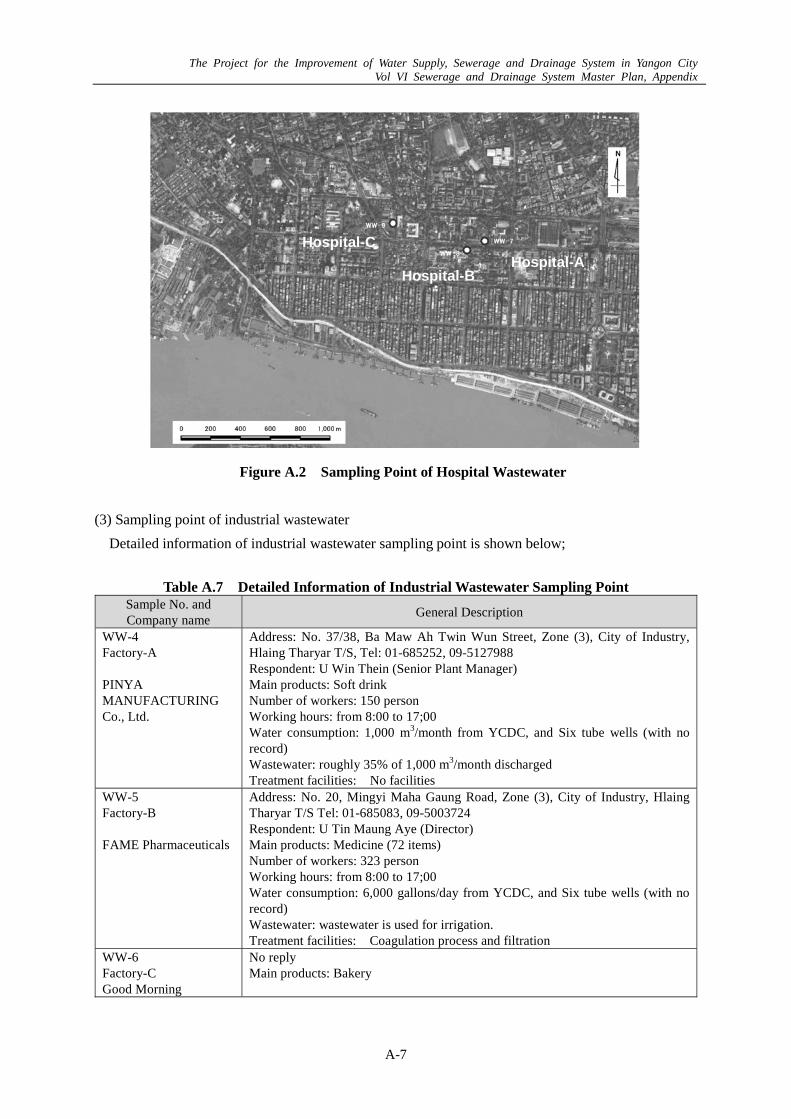
A-7
Figure A.2 Sampling Point of Hospital Wastewater
(3) Sampling point of industrial wastewater
Detailed information of industrial wastewater sampling point is shown below;
Table A.7 Detailed Information of Industrial Wastewater Sampling Point
Sample No. and Company name
General Description
WW-4 Factory-A PINYA MANUFACTURING Co., Ltd.
Address: No. 37/38, Ba Maw Ah Twin Wun Street, Zone (3), City of Industry, Hlaing Tharyar T/S, Tel: 01-685252, 09-5127988 Respondent: U Win Thein (Senior Plant Manager) Main products: Soft drink Number of workers: 150 person Working hours: from 8:00 to 17;00 Water consumption: 1,000 m3/month from YCDC, and Six tube wells (with no record) Wastewater: roughly 35% of 1,000 m3/month discharged Treatment facilities: No facilities
WW-5 Factory-B FAME Pharmaceuticals
Address: No. 20, Mingyi Maha Gaung Road, Zone (3), City of Industry, Hlaing Tharyar T/S Tel: 01-685083, 09-5003724 Respondent: U Tin Maung Aye (Director) Main products: Medicine (72 items) Number of workers: 323 person Working hours: from 8:00 to 17;00 Water consumption: 6,000 gallons/day from YCDC, and Six tube wells (with no record) Wastewater: wastewater is used for irrigation. Treatment facilities: Coagulation process and filtration
WW-6 Factory-C Good Morning
No reply Main products: Bakery
Hospital-A Hospital-B
Hospital-C

The Project for the Improvement of Water Supply, Sewerage and Drainage System in Yangon City Vol VI Sewerage and Drainage System Master Plan, Appendix
A-8
Figure A.3 Sampling Point of Industrial Wastewater
(4) Sampling point of river and drainage
Detailed information of river and drainage sampling point is shown below;
Table A.8 Detailed Information of River and Drainage Sampling Point Sample No. Location of Sampling Point
WW - 28 River -1 (Hlaing River, Wartayar Village, upstream)
WW - 29 River -2 (Hlaing River, midstream)
WW - 30 River -3 (Hlaing River, downstream, Myanmar Industrial Port)
WW - 31 River -4 (Yangon River, Near Bo Ta Htaung Pagoda)
WW - 32 River -5 (Bago River, upstream)
WW - 33 River -6 (Bago River, downstream, Near Thanlyin - Yangon Bridge)
WW - 34 River -7 (Nga Moe Yeik Creek)
WW - 35 River -8 (Pu Zun Taung Creek)
WW - 36 Drainage Canal -1 (Pauk Tar Chaung)
WW - 37 Drainage Canal -2 (Yoe Gyi Chaung)
WW - 38 Drainage Canal -3 (Thamaing Chaung)
WW - 39 Drainage Canal -4 (Padauk Chaung)
WW - 40 Drainage Canal -5 (Tbebyu Chaung)
WW - 41 Drainage Canal -6 (Nat Chaung)
Factory-C Factory-B
Factory-A

The Project for the Improvement of Water Supply, Sewerage and Drainage System in Yangon City Vol VI Sewerage and Drainage System Master Plan, Appendix
A-9
Figure A.4 Sampling Point of River and Drainage
(5) Sampling point of WWTP
Sampling point of WWTP is shown below.
Figure A.5 Sampling Point of WWTP (1)

The Project for the Improvement of Water Supply, Sewerage and Drainage System in Yangon City Vol VI Sewerage and Drainage System Master Plan, Appendix
A-10
Figure A.6 Sampling Point of WWTP (2)

A-11
The P
roject for the Improvem
ent of Water Supply, Sew
erage and Drainage System
in Yangon City
Vol VI Sew
erage and Drainage System
Master P
lan, Appendix
4. RESULT OF WATER QUALITY INVESTIGATION
Result of water quality analysis is shown below in table, and assessment of WWTP is shown in Figure A.7 and A.8.
Table A.9 Result of Water Quality Analysis, Rainy Season (1) Factory and Hospital
Parameter Unit Factory Hospital
WW - 4 WW - 5 WW - 6 WW - 7 WW - 8 WW - 9
Air Temperature oC 36 34 36 33 33 33
Water Temperature oC 41.1 30.3 30.7 28.9 28.7 19.1
pH - 11.5 7.7 7.0 8.4 6.8 7.5
Electrical Conductivity μS/cm 4,100 950 500 720 230 600
Suspended Solid (SS) mg/l 75 200 220 280 110 60
CODCr mg/l 968 620 640 96 96 96
BOD mg/l 630 510 510 21 60 12
T-N mg/l 10.3 21.5 14.9 43.8 21.1 52.8
NH4-N mg/l 1.92 1.15 0.96 N.D. N.D. N.D.
TKN mg/l 0.82 12.9 12.0 17.8 11.1 31.6
T-P mg/l 0.17 1.19 0.29 0.61 0.19 1.23

A-12
The P
roject for the Improvem
ent of Water Supply, Sew
erage and Drainage System
in Yangon City
Vol VI Sew
erage and Drainage System
Master P
lan, Appendix
Table A.10 Result of Water Quality Analysis, Rainy Season (2) WWTP
Parameter Unit Inflow
1st sedimentation tank effluent
Aeration tank Final sedimentation tank
effluent
WW - 10 WW - 11 WW - 12 WW - 13 WW - 14 WW - 15 WW - 16 WW - 17 WW - 18 WW - 19 WW - 20 WW - 21
Air Temperature oC 31 28.5 31 30 28.5 31 30 28 31 30 28 31
Water Temperature oC 28.7 28.5 29.0 28.7 28.3 29.2 28.5 28.2 29.4 28.2 28.0 29.2
pH - 7.2 7.3 7.4 7.1 7.2 7.2 7.3 7.3 7.1 7.1 7.1 7.1
Electrical Conductivity μS/cm 800 810 1,410 880 840 1,380 560 560 560 450 430 570
Suspended Solid (SS) mg/l 1,180 1,652 1,820 998 1,468 1,200 - - - 160 142 295
CODCr mg/l 1,280 2,560 960 480 960 640 - - - 32 32 32
BOD mg/l 600 900 540 270 435 420 - - - 18 23 15
T-N mg/l 131 97.0 214 122 84.6 370 - - - 15.2 16.4 17.4
NH4-N mg/l 2.50 2.69 2.88 2.88 2.69 2.30 - - - 0.96 0.77 1.34
TKN mg/l 127 93.1 207 118 80.6 364 - - - 2.37 2.47 1.64
T-P mg/l 8.48 12.5 13.1 9.68 12.5 12.3 - - - 8.31 8.44 8.21
MLSS mg/l - - - - - - 6,400 5,450 6,250 - - -
SV % - - - - - - 28.0 25.0 36.5 - - -
SVI - - - - - - - 43.8 45.9 58.4 - - -
MLDO (First Tank) mg/l - - - - - - 2.1 0.7 0.7 - - -
MLDO (Second Tank) mg/l - - - - - - 3.4 1.8 1.8 - - -

A-13
The P
roject for the Improvem
ent of Water Supply, Sew
erage and Drainage System
in Yangon City
Vol VI Sew
erage and Drainage System
Master P
lan, Appendix
Table A.11 Result of Water Quality Analysis, Rainy Season (3) Kandawgyi Lake
Parameter Unit Restaurant Lake water Drainage
WW - 1* WW - 2 WW - 3 WW - 22 WW - 23 WW - 24 WW - 25 WW - 26 WW - 27
Air Temperature oC 31 31 30 31 31 31 35 31 32
Water Temperature oC 28.2 29.5 27.7 31.6 30.6 30.0 28.7 27.7 31.6
pH - 6.0 7.5 6.9 9.5 9.2 9.2 6.7 7.3 7.1Electrical Conductivity μS/cm 250 570 124 132 129 143 195 240 125Suspended Solid (SS) mg/l 89 59 52 62 68 64 36 68 25CODCr mg/l 620 1280 928 96 160 160 192 64 160BOD mg/l 540 750 360 60 48 60 42 24 48T-N mg/l 68.8 13.9 13.0 2.17 1.98 1.69 4.53 4.03 3.03NH4-N mg/l N.D. N.D. N.D. N.D. N.D. N.D. N.D. 0.19 0.13TKN mg/l 57.8 13.4 8.64 1.33 1.09 0.81 3.43 3.03 2.47T-P mg/l 10.2 1.67 0.94 0.13 0.13 0.14 0.35 0.13 0.19
*Restaurant-A (Dolphin)

A-14
The P
roject for the Improvem
ent of Water Supply, Sew
erage and Drainage System
in Yangon City
Vol VI Sew
erage and Drainage System
Master P
lan, Appendix
Table A.12 Result of Water Quality Analysis, Rainy Season (4) River
Parameter Unit Hlaing River
Yangon River
Bago River Nga Moe
Yeik Creek
Pu Zun TaungCreek
WW - 28 WW - 29 WW - 30 WW - 31 WW - 32 WW - 33 WW - 34 WW - 35
Air Temperature oC 32 36 33 32 28 30 33 29
Water Temperature oC 29.6 29.6 29.6 29.3 29.1 29.7 29.0 28.9
pH - 7.6 7.7 7.6 7.6 7.3 7.5 7.0 7.7
Electrical Conductivity μS/cm 124 133 130 128 70 135 68 135
Suspended Solid (SS) mg/l 105 128 116 136 370 142 310 160
CODCr mg/l 1280 2560 960 480 960 640 96 128
BOD mg/l 600 900 540 270 435 420 27 50
T-N mg/l 0.98 1.34 1.16 1.06 0.98 1.49 0.84 1.37
NH4-N mg/l 0.10 0.10 0.10 0.10 0.19 0.1 0.19 0.10
TKN mg/l 0.48 0.50 0.50 0.44 0.48 0.69 0.33 0.66
T-P mg/l 0.13 0.20 0.14 0.20 0.25 0.59 0.05 0.33

A-15
The P
roject for the Improvem
ent of Water Supply, Sew
erage and Drainage System
in Yangon City
Vol VI Sew
erage and Drainage System
Master P
lan, Appendix
Table A.13 Result of Water Quality Analysis, Rainy Season (5) Drain
Parameter Unit
Pauk Tar Chaung
Yoe Gyi Chaung
Thamaing Chaung
Padauk Chaung
Tbebyu Chaung
Nat Chaung
WW - 36 WW - 37 WW - 38 WW - 39 WW - 40 WW - 41
Air Temperature oC 34 33.5 34.5 34 30 28.5
Water Temperature oC 29.0 29.9 30.1 29.9 28.8 28.0
pH - 7.3 6.9 7.2 7.1 7.2 7.1
Electrical Conductivity μS/cm 500 330 310 340 330 420
Suspended Solid (SS) mg/l 480 510 130 186 58 44
CODCr mg/l 192 128 96 160 224 224
BOD mg/l 60 35 6 12 39 62
T-N mg/l 17.8 22.5 8.73 5.42 19.3 10.8
NH4-N mg/l 2.69 2.50 0.38 0.57 0.28 0.19
TKN mg/l 15.5 17.4 6.36 3.37 15.5 8.14
T-P mg/l 1.41 1.78 0.30 0.54 1.22 1.03

A-16
The P
roject for the Improvem
ent of Water Supply, Sew
erage and Drainage System
in Yangon City
Vol VI Sew
erage and Drainage System
Master P
lan, Appendix
Table A.14 Result of Water Quality Analysis, Dry Season (1) Factory and Hospital
Parameter unit Factory Hospital
WW - 4 WW - 5 WW - 6 WW - 7 WW - 8 WW - 9
Air Temperature oC 40.5 36.5 36.5 34.5 34.5 35.5
Water Temperature oC 42.5 29.0 31.0 33.0 30.0 30.0
pH - 7.81 6.94 5.61 5.4 7.00 7.33
Electrical Conductivity μS/cm 7,740 1,200 2,370 270 240 1,290
Suspended Solid (SS) mg/l 216 264 488 5 22 78
CODCr mg/l 989 700 422 84 90 96
BOD mg/l 540 492 200 18 36 21
T-N mg/l 7.17 27.1 71.2 4.99 10.1 186
NH4-N mg/l 1.20 1.32 1.20 N.D. N.D. 0.21
TKN mg/l 1.27 24.6 62.6 1.67 6.45 176
T-P mg/l 2.88 2.53 0.74 0.07 0.39 3.08

A-17
The P
roject for the Improvem
ent of Water Supply, Sew
erage and Drainage System
in Yangon City
Vol VI Sew
erage and Drainage System
Master P
lan, Appendix
Table A.15 Result of Water Quality Analysis, Dry Season (2) WWTP
Parameter unit Inflow
1st sedimentation tank effluent
Aeration tank Final sedimentation tank
effluent
WW - 10 WW - 11 WW - 12 WW - 13 WW - 14 WW - 15 WW - 16 WW - 17 WW - 18 WW - 19 WW - 20 WW - 21
Air Temperature oC 36.5 37.0 35.0 36.5 37.0 35.0 36.5 37.0 35.0 36.5 37.0 34.0
Water Temperature oC 30.7 30.9 30.7 32.0 31.3 30.7 30.1 29.3 27.7 29.2 29.7 28.0
pH - 7.55 7.37 7.35 7.24 7.28 7.15 7.33 7.40 7.44 7.19 7.18 7.20
EC μS/cm 1,740 1,850 1,640 1,980 1,810 1,780 1,040 1,000 940 750 770 740
Suspended Solid (SS) mg/l 936 1010 880 885 728 922 - - - 116 80 132
CODCr mg/l 188 172 168 80 68 164 - - - 38 36 33
BOD mg/l 82 64 90 30 30 76 - - - 16 20 20
T-N mg/l 276 191 197 453 367 354 - - - 15.2 11.0 13.9
NH4-N mg/l 0.29 0.80 0.32 0.33 0.26 0.40 - - - 0.25 0.11 0.11
TKN mg/l 273 187 195 451 366 351 - - - 7.46 4.16 7.74
T-P mg/l 1.11 21.3 1.50 2.20 21.9 24.8 - - - 9.48 9.32 0.87
MLSS mg/l - - - - - - 9,920 4,870 12,880 - - -
SV % - - - - - - 89 90 91 - - -
SVI - - - - - - - 90 185 71 - - -
MLDO mg/l - - - - - - 0.45 0.00 0.32 - - -

A-18
The P
roject for the Improvem
ent of Water Supply, Sew
erage and Drainage System
in Yangon City
Vol VI Sew
erage and Drainage System
Master P
lan, Appendix
Table A.16 Result of Water Quality Analysis, Dry Season (3) Kandawgyi Lake
Parameter unit Restaurant Lake water Drainage
WW - 1* WW - 2 WW - 3 WW - 22 WW – 23 WW - 24 WW - 25 WW - 26 WW - 27
Air Temperature oC 36.5 35.5 34.0 35.0 35.0 34.0 34.0 34.0 37.0
Water Temperature oC 31.5 30.5 28.7 32.2 23.9 33.9 30.0 29.7 31.0
pH - 5.42 6.69 8.00 11.09 11.06 10.96 7.06 7.12 7.19
Electrical Conductivity μS/cm 480 810 210 270 230 290 290 610 350
Suspended Solid (SS) mg/l 242 310 165 58 78 82 55 36 68
CODCr mg/l 680 882 388 93 155 158 222 73 150
BOD mg/l 270 372 184 52 50 68 88 30 44
T-N mg/l 36.3 87.6 5.2 19.9 11.3 7.74 5.65 59.7 31.1
NH4-N mg/l N.D. N.D. N.D. N.D. N.D. N.D. N.D. N.D. N.D.
TKN mg/l 25.1 25.1 4.96 19.5 10.9 7.46 4.81 55.6 28.5
T-P mg/l 2.88 2.88 2.88 0.19 0.17 0.03 0.31 2.52 0.28
*Restaurant-D (White Rice)

A-19
The P
roject for the Improvem
ent of Water Supply, Sew
erage and Drainage System
in Yangon City
Vol VI Sew
erage and Drainage System
Master P
lan, Appendix
Table A.17 Result of Water Quality Analysis, Dry Season (4) River
Parameter unit Hlaing river
Yangon River
Bago river Nga Moe Yeik
Creek Pu Zun
Taung Creek
WW - 28 WW - 29 WW - 30 WW - 31 WW - 32 WW - 33 WW - 34 WW - 35
Air Temperature oC 36.5 34.0 33.0 31.5 32.5 33.5 38.0 31.0
Water Temperature oC 31.5 31.5 30.5 31.0 31.5 31.5 36.0 31.0
pH - 7.93 7.90 7.74 7.58 7.59 7.58 7.16 7.54
Electrical Conductivity μS/cm 890 3,330 6,640 163,100 8,990 14,580 160 14,450
Suspended Solid (SS) mg/l 400 562 400 325 335 330 202 418
CODCr mg/l 932 980 960 562 985 520 110 216
BOD mg/l 520 520 436 280 362 364 50 88
T-N mg/l 3.65 5.94 9.80 16.4 11.9 14.1 0.58 11.9
NH4-N mg/l 0.09 0.10 0.08 0.10 0.10 0.10 N.D. 0.10
TKN mg/l 0.83 0.53 0.89 0.42 0.47 1.90 0.23 0.45
T-P mg/l 0.54 0.08 0.18 0.10 0.17 2.82 0.03 0.05

A-20
The P
roject for the Improvem
ent of Water Supply, Sew
erage and Drainage System
in Yangon City
Vol VI Sew
erage and Drainage System
Master P
lan, Appendix
Table A.18 Result of Water Quality Analysis, Dry Season (5) Drain
Parameter unit
Pauk Tar Chaung
Yoe Gyi Chaung
Thamaing Chaung
Padauk Chaung
Tbebyu Chaung
Nat Chaung
WW - 36 WW - 37 WW - 38 WW - 39 WW - 40 WW - 41
Air Temperature oC 34.5 38.1 35.0 34.5 36.5 35.5
Water Temperature oC 28.5 33.5 29.5 30.5 31.0 32.0
pH - 7.18 6.68 7.09 7.17 6.85 6.89
Electrical Conductivity μS/cm 920 1,250 520 1,450 460 550
Suspended Solid (SS) mg/l 303 208 110 160 294 210
CODCr mg/l 190 128 100 182 320 322
BOD mg/l 60 40 28 52 96 58
T-N mg/l 54.1 64.8 21.9 66.2 20.9 24.3
NH4-N mg/l 3.30 1.20 0.46 1.20 0.22 0.14
TKN mg/l 46.6 57.4 16.7 50.5 18.4 22.9
T-P mg/l 2.64 4.93 1.81 2.53 2.64 3.13
The Project for the Improvement of Water Supply, Sewerage and Drainage System in Yangon City Vol VI Sewerage and Drainage System Master Plan, Appendix
A-21
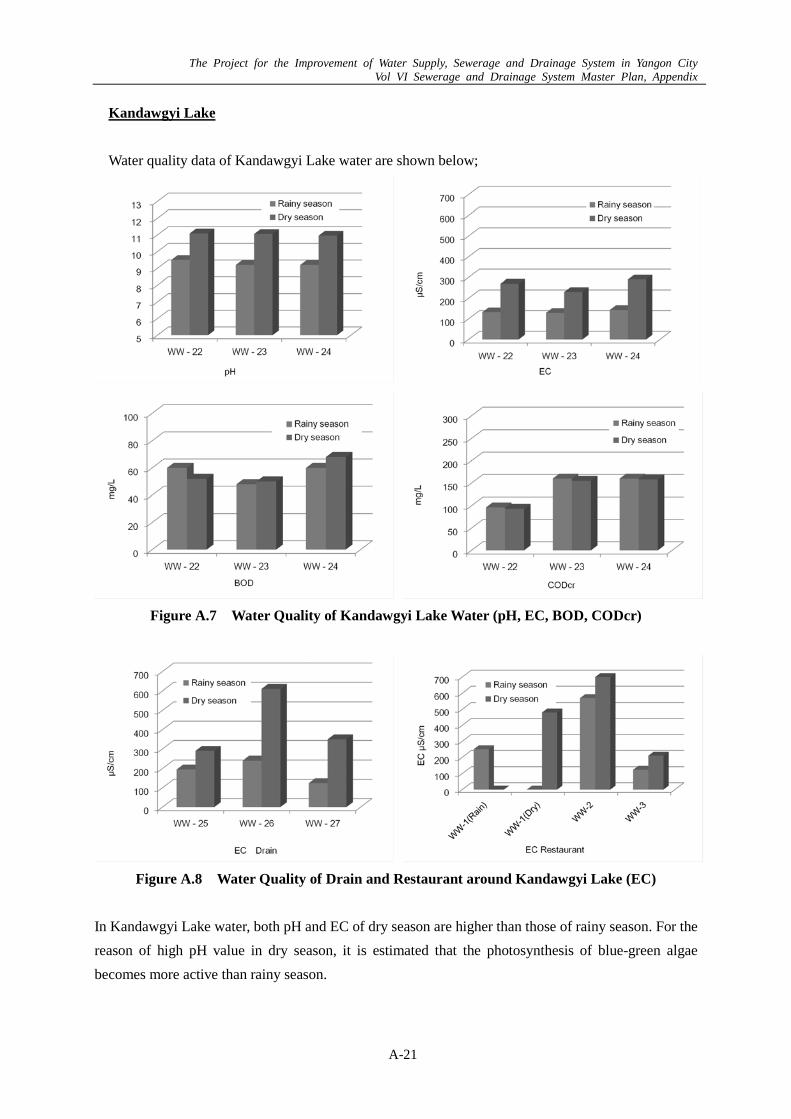
Kandawgyi Lake
Water quality data of Kandawgyi Lake water are shown below;
Figure A.7 Water Quality of Kandawgyi Lake Water (pH, EC, BOD, CODcr)
Figure A.8 Water Quality of Drain and Restaurant around Kandawgyi Lake (EC)
In Kandawgyi Lake water, both pH and EC of dry season are higher than those of rainy season. For the
reason of high pH value in dry season, it is estimated that the photosynthesis of blue-green algae
becomes more active than rainy season.

The Project for the Improvement of Water Supply, Sewerage and Drainage System in Yangon City Vol VI Sewerage and Drainage System Master Plan, Appendix
A-22
On the other hand, the reason of high pH in dry season is estimated to be the effect of drain and
restaurant drainage which contain high EC substance.
Figure A.9 Water Quality of Drain and Restaurant around Kandawgyi Lake (EC)
BOD of lake water in rainy season and dry season are similar. CODcr shows same tendency. However,
both BOD and CODcr of lake water in the western part (WW-23 and WW-24) are higher than those of
the eastern part (WW-22). Therefore, pollution of western part of the lake is progressing faster than
eastern part.
Relationship of BOD of lake water, drain and restaurant drainage is shown in above figure. BOD
values of drain and restaurant drainage are higher than lake water. Therefore, BOD pollution of lake
water is effected by drain and restaurant drainage. Same tendency is observed in terms of CODcr.
Figure A.10 Water Quality of Kandawgyi Lake Water (T-N, TKN)
T-N in dry season is higher than rainy season. The reason of this increase may be due to the progress
of pollution or seasonal change. Major ingredient of T-N is TKN.
Relationship of T-N of lake water, drain and restaurant drainage shows that T-N in drain and restaurant
drainage is higher than that in lake water.

The Project for the Improvement of Water Supply, Sewerage and Drainage System in Yangon City Vol VI Sewerage and Drainage System Master Plan, Appendix
A-23
Both T-N and TKN in eastern part of lake are higher than western part. There are many restaurants and
cafes on the west bank of the lake. Therefore, the major source of this nitrogen pollution is attributed
to the wastewater discharge from restaurant and café.
Figure A.11 Nitrogen Ingredients of Kandawgyi Lake Water
Figure A.12 Water Quality of Kandawgyi Lake Water, Drain and Restaurant Drainage (T-N,
TKN)
Figure A.13 Water Quality of Kandawgyi Lake Water (T-P)
The Project for the Improvement of Water Supply, Sewerage and Drainage System in Yangon City Vol VI Sewerage and Drainage System Master Plan, Appendix
A-24
In rainy season, T-P in lake water is near uniformity. However, in dry season, east part of lake water
shows higher T-P. The reason of this difference may be due to the effect of lake water agitation by
strong rainfall or release of lake water.
T-P in restaurant drainage shows higher value than that of lake water and drain. Therefore, major
source of T-P is discharge from restaurant.
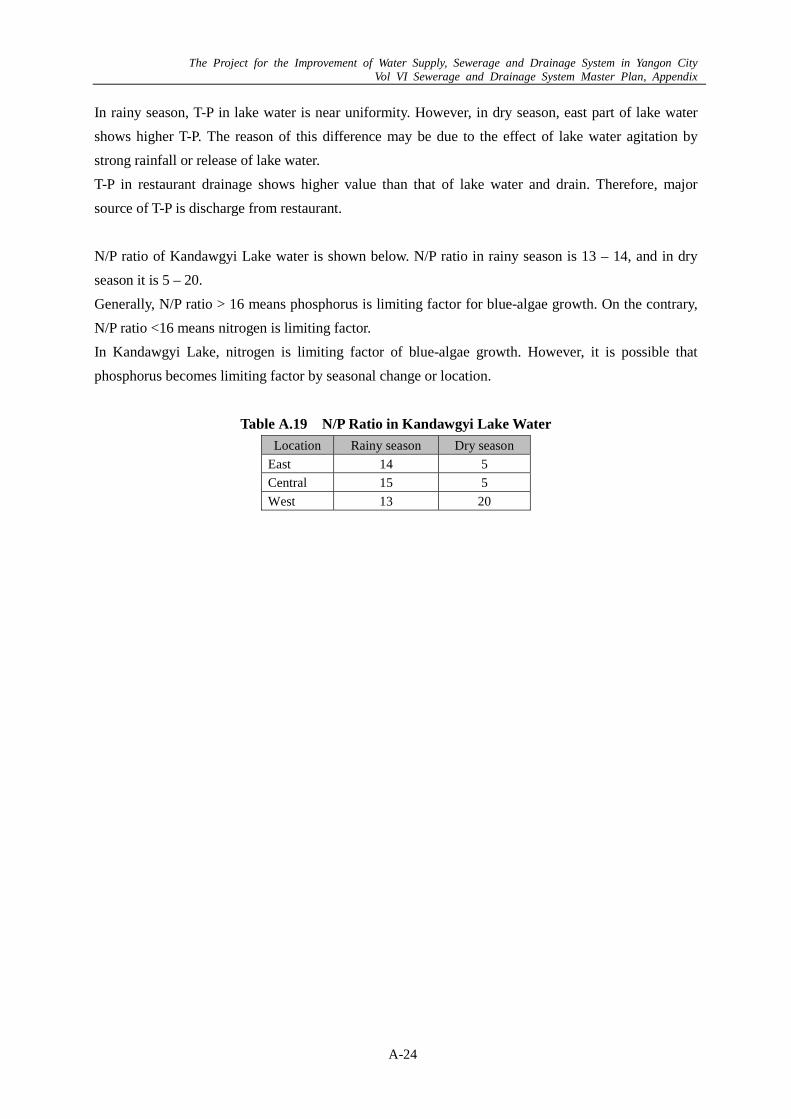
N/P ratio of Kandawgyi Lake water is shown below. N/P ratio in rainy season is 13 – 14, and in dry
season it is 5 – 20.
Generally, N/P ratio > 16 means phosphorus is limiting factor for blue-algae growth. On the contrary,
N/P ratio <16 means nitrogen is limiting factor.
In Kandawgyi Lake, nitrogen is limiting factor of blue-algae growth. However, it is possible that
phosphorus becomes limiting factor by seasonal change or location.
Table A.19 N/P Ratio in Kandawgyi Lake Water
Location Rainy season Dry season
East 14 5
Central 15 5
West 13 20

The Project for the Improvement of Water Supply, Sewerage and Drainage System in Yangon City Vol VI Sewerage and Drainage System Master Plan, Appendix
A-25
Factory and Hospital
Water quality of Factory and Hospital drain is shown below;
Figure A.14 Water Quality of Factory and Hospital Effluent (Water Temperature, pH, EC, SS,
BOD, CODcr)
Water temperature of Beverage factory (WW-4) shows higher temperature than other wastewater. This
wastewater shows higher pH in rainy season. Possible explanation of this difference is the difference
in manufactured item.

The Project for the Improvement of Water Supply, Sewerage and Drainage System in Yangon City Vol VI Sewerage and Drainage System Master Plan, Appendix
A-26
WW-7 in dry season shows low pH. When water sampling was done, this hospital implemented
surgical operation. Therefore, possible explanation of this pH decrease is due to discharge of medical
material after surgical operation.
Industrial wastewater shows higher organic pollution (BOD and CODcr) than hospital wastewater.
Figure A.15 Water Quality of Factory and Hospital Effluent (NH4-N, TKN, T-N, T-P)
Figure A.16 Nitrogen Ingredients in Factory and Hospital Wastewater
Major nitrogen ingredient of beverage factory is other-nitrogen which is assumed inorganic nitrogen

The Project for the Improvement of Water Supply, Sewerage and Drainage System in Yangon City Vol VI Sewerage and Drainage System Master Plan, Appendix
A-27
compound. On the contrary, other factory (Pharmaceutical and Bread-making) and hospital wastewater
contains organic-nitrogen.
Beverage factory and pharmaceutical factory show higher T-P than bread-making factory. In the
beverage factory, usage of phosphorus containing sour agent is a possible reason. In the same way,
usage of phosphorus containing agent may be possible reason of T-P in pharmaceutical wastewater.
Table A.20 Assessment of Wastewater Quality
Rainy season
Item Limitation
Value (Myanmar)
Factory A
Factory B
Factory C
Hospital A
Hospital B
Hospital C
Effluent standard (Japan)
pH 6 - 9.5 11.5 7.7 7 8.4 6.8 7.5 5.8-8.6 SS 200 mg/L 75 200 220 280 110 60 200 mg/L BOD5 20 - 60 mg/L 630 510 510 21 60 12 200 mg/L
CODcr 200 mg/L 968 620 640 96 96 96 160 mg/L (CODMn)
T-N Not decided 10.3 21.5 14.9 43.8 21.1 52.8 120 mg/L T-P Not decided 0.17 1.19 0.29 0.61 0.19 1.23 16 mg/L
Dry season
Item Limitation
Value (Myanmar)
Factory A
Factory B
Factory C
Hospital A
Hospital B
Hospital C
Effluent standard (Japan)
pH 6 - 9.5 7.81 6.94 5.61 5.4 7.0 7.33 5.8-8.6 SS 200 mg/L 216 264 488 5 22 78 200 mg/L BOD5 20 - 60 mg/L 540 492 200 18 36 21 200 mg/L
CODcr 200 mg/L 989 700 422 84 90 96 160 mg/L (CODMn)
T-N Not decided 7.17 27.1 71.2 4.99 10.1 186 120 mg/L T-P Not decided 2.88 2.53 0.74 0.07 0.39 3.08 16 mg/L
Wastewater quality is assessed on pH, SS, BOD, CODcr, T-N and T-P.
Both BOD and CODcr of Factory-A, -B and -C exceed limitation value of Myanmar. Among these 3
factories, Factory-A and Factory-C discharge their wastewater into river. Therefore, it is necessary to
control these wastewater discharges via administrative guidance.
Limitation value of T-N and T-P is not decided in Myanmar. At present, T-N and T-P in factory
wastewater does not exceed effluent standard of Japan.
Wastewater of hospital largely satisfies the limitation value of Myanmar. However, pH and SS of
Hospital-A and T-N of Hospital-C exceed Japanese effluent standard.
However, when dialysis treatment and other high quality specialized medical treatment become
popular in future, attention should be paid to characteristics of hospital wastewater.

The Project for the Improvement of Water Supply, Sewerage and Drainage System in Yangon City Vol VI Sewerage and Drainage System Master Plan, Appendix
A-28
River and Drainage
Figure A.17 Water Quality of River and Drainage (EC, SS, BOD, CODcr)
River water in dry season shows high EC value. Especially, downstream area shows higher EC value
because of the effect of salt water intrusion. In the southern part of Yangon city, EC of Yangon River
is: 163,000μS/cm, Downstream of Bago River the value is: 14,580μS/cm and Pu Zun Taung Creek,
EC is: 14,450μS/cm.
On the other hand, EC and SS of drainage increase in rainy season. The possible explanation of this
increase is the washout of deposit from branch drainage or road surface during rainy season.
BOD and CODcr in river are higher than those of drainage. Moreover, BOD and CODcr in rainy
season are higher than dry season.
The reason of this increase is not clear, however, washout of deposit in drainage is considered as
possible reason.

The Project for the Improvement of Water Supply, Sewerage and Drainage System in Yangon City Vol VI Sewerage and Drainage System Master Plan, Appendix
A-29
Figure A.18 Water Quality of River and Drainage (NH4-N, TKN, T-N, T-P)
Drainage shows higher NH4-N, TKN and T-N than river. Especially, Pauk Tar Chaung and Yoe Gyi
Chaung show high NH4-N concentration both in rainy season and dry season.
T-P shows same tendency, that is, drainage shows higher T-P than river. Similar to the observation of
NH4-N, Pauk Tar Chaung and Yoe Gyi Chaung show high T-P concentration.
From these observations, it is said that pollution of Pauk Tar Chaung and Yoe Gyi Chaung is serious
compared to other drainage.

The Project for the Improvement of Water Supply, Sewerage and Drainage System in Yangon City Vol VI Sewerage and Drainage System Master Plan, Appendix
A-30
Figure A.19 Nitrogen Ingredients in Drainage
Figure A.20 Nitrogen Ingredients in Drainage
Above figures show the different of nitrogen ingredient of drainage water and river water. In drainage,
major ingredient is Organic-N. Possible reason of this is that the major nitrogen source of drainage is
domestic wastewater.
In river water, major ingredient of nitrogen is different in rainy season and dry season. In rainy season,
major ingredient is organic-N and other-N. On the contrary, in dry season, other-N becomes dominant
ingredient and NH4-N is decreased.
In dry season, water temperature of river was 30.5 – 36.0 deg C (rainy season: 28.9 – 29.7 deg C).
That is, it is assumed that this high water temperature in dry season activates nitrogen compound
degradation (mineralization) in river water.

The Project for the Improvement of Water Supply, Sewerage and Drainage System in Yangon City Vol VI Sewerage and Drainage System Master Plan, Appendix
A-31
WWTP
Figure A.21 Water Quality in WWTP Treatment Process (Rainy Season)

The Project for the Improvement of Water Supply, Sewerage and Drainage System in Yangon City Vol VI Sewerage and Drainage System Master Plan, Appendix
A-32
Figure A.22 Water Quality in WWTP Treatment Process (Dry Season)

The Project for the Improvement of Water Supply, Sewerage and Drainage System in Yangon City Vol VI Sewerage and Drainage System Master Plan, Appendix
A-33
Water quality changes in WWTP treatment process is shown below;
Figure A.23 Change of Water Quality in Treatment Process (EC, SS, CODcr, BOD)
BOD, CODcr and SS are removed in 1st sedimentation tank, and many of them are removed through
aerobic tank and final sedimentation tank.
EC is reduced after aeration process and in final sedimentation tank.
BOD and CODcr in dry season is very low, however, trend of removal is same as in rainy season.

The Project for the Improvement of Water Supply, Sewerage and Drainage System in Yangon City Vol VI Sewerage and Drainage System Master Plan, Appendix
A-34
Figure A.24 Change of Water Quality in Treatment Process (HN4-N, TKN, T-N, T-P)
Figure A.25 Change of Nitrogen Compounds in Treatment Process
Change of HN4-N, TKN, T-N, T-P and nitrogen compounds in treatment process are shown above.
Major component of nitrogen compound in inflow water is organic-N. Many of these nitrogen
compounds are removed through aerobic tank and final sedimentation tank.

The Project for the Improvement of Water Supply, Sewerage and Drainage System in Yangon City Vol VI Sewerage and Drainage System Master Plan, Appendix
A-35
T-P is removed through aerobic tank and final sedimentation tank. However, degree of T-P removal is
smaller than nitrogen compounds.
Operating condition of WWTP
Operation condition of WWTP is as follows;
- Operating time of WWTP: 8 hours / day
- Operating time of aeration: Intermittent 2 hours (i.e. total aeration time is 4 hours / day)
- Capacity of WWTP: 14,775m3/day
- Wastewater inflow: 2,300m3/day
In spite of 4 hours / day of aeration time, rejection ratio of pollutants is high. Pollution removal ratio is
shown in figure below.
Figure A.26 Removal Ratio of Each Water Quality Items
Removal ratio of CODcr and BOD reduces in dry season. However, removal ratio of these items
surpasses 70%.
T-N and TKN is removed more than 80%, and removal ratio of NH4-N is around 60%. However,
removal ratio of T-P remains around 20%.
In spite of insufficient condition of aerator operation, removal ratios of each water quality items are
relatively high.
Possible explanations are as follows;
The Project for the Improvement of Water Supply, Sewerage and Drainage System in Yangon City Vol VI Sewerage and Drainage System Master Plan, Appendix
A-36
- The small volume of wastewater inflow below WWTP capacity causes longer retention time.
- Removal of BOD, COD and SS is accelerated by precipitation because of this longer
retention time.
- Removal of T-N and T-P is accelerated by the intermittent aeration, because this operating
condition has possibilities to bring anaerobic – anoxic – aerobic condition in aeration tank.
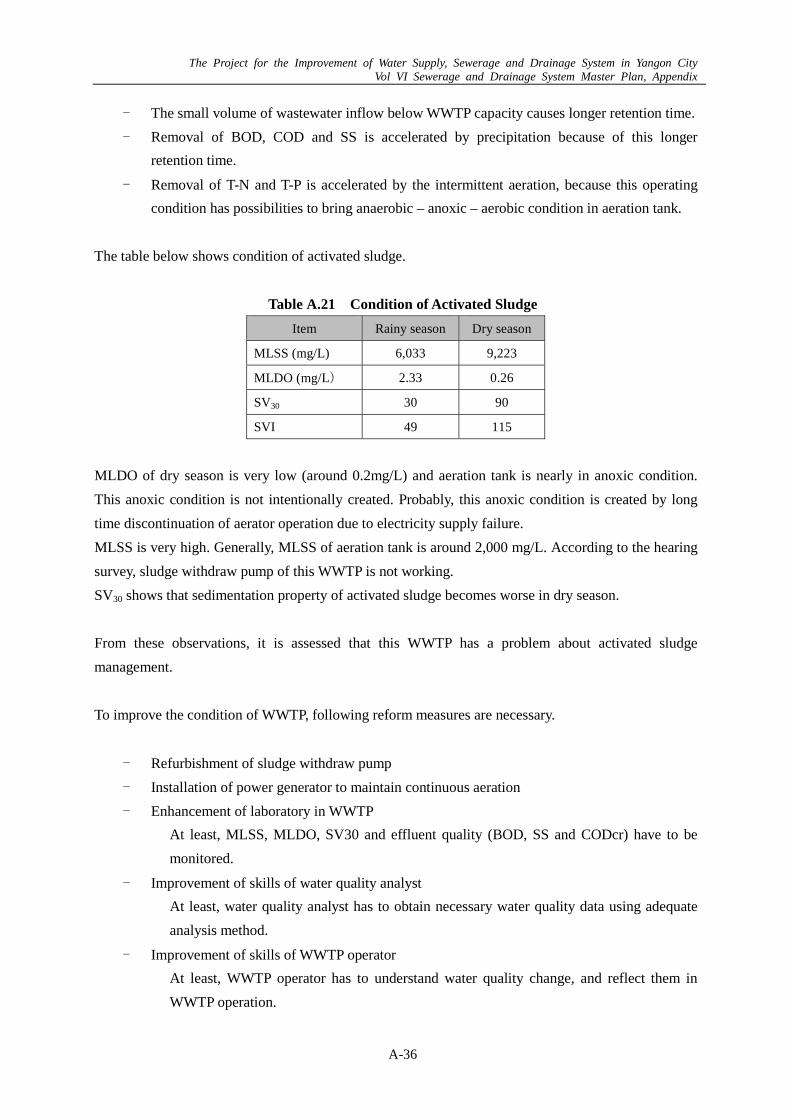
The table below shows condition of activated sludge.
Table A.21 Condition of Activated Sludge
Item Rainy season Dry season
MLSS (mg/L) 6,033 9,223
MLDO (mg/L) 2.33 0.26
SV30 30 90
SVI 49 115
MLDO of dry season is very low (around 0.2mg/L) and aeration tank is nearly in anoxic condition.
This anoxic condition is not intentionally created. Probably, this anoxic condition is created by long
time discontinuation of aerator operation due to electricity supply failure.
MLSS is very high. Generally, MLSS of aeration tank is around 2,000 mg/L. According to the hearing
survey, sludge withdraw pump of this WWTP is not working.
SV30 shows that sedimentation property of activated sludge becomes worse in dry season.
From these observations, it is assessed that this WWTP has a problem about activated sludge
management.
To improve the condition of WWTP, following reform measures are necessary.
- Refurbishment of sludge withdraw pump
- Installation of power generator to maintain continuous aeration
- Enhancement of laboratory in WWTP
At least, MLSS, MLDO, SV30 and effluent quality (BOD, SS and CODcr) have to be
monitored.
- Improvement of skills of water quality analyst
At least, water quality analyst has to obtain necessary water quality data using adequate
analysis method.
- Improvement of skills of WWTP operator
At least, WWTP operator has to understand water quality change, and reflect them in
WWTP operation.

The P
roject for the Improvem
ent of Water Supply, Sew
erage and Drainage System
in Yangon City
Vol VI Sew
erage and Drainage System
Master P
lan, Appendix
A-37
Figure A.27 Sludge Settling Property (Rainy season)

The P
roject for the Improvem
ent of Water Supply, Sew
erage and Drainage System
in Yangon City
Vol VI Sew
erage and Drainage System
Master P
lan, Appendix
A-38
Figure A.28 Sludge Settling Property (Rainy season)

The Project for the Improvement of Water Supply, Sewerage and Drainage System in Yangon City Vol VI Sewerage and Drainage System Master Plan, Appendix
B-1
B. COST ESTIMATION OF SEWERAGE WORKS
The project cost, implementation plan and the detailed operation and maintenance cost regarding
sewerage works are shown in the following pages.

The P
roject for the Improvem
ent of Water Supply, Sew
erage and Drainage System
in Yangon City
Vol VI Sew
erage and Drainage System
Master P
lan, Appendix
B-2
Table B.1 Implementation Plan of Sewerage works
2012 2013 2014 2015 2016 2017 2018 2019 2020 2021 2022 2023 2024 2025 2026 2027 2028 2029 2030 2031 2032 2033 2034 2035 2036 2037 2038 2039 2040
DD
Construction
DD
Construction
DD
Construction
DD
Construction
DD
Construction
DD
Construction
DD
Construction
DD
Construction
DD
Construction
DD
Construction
DD
Construction
DD
Construction
Implementation period
SewerageZone
ComponentsYear
C1
F/S
Preparation of Fund
WWTP
SewerNetwork
W1
F/S
Preparation of Fund
WWTP
SewerNetwork
C2+E1
F/S
Preparation of Fund
WWTP
SewerNetwork
W2
F/S
Preparation of Fund
WWTP
SewerNetwork
N1
F/S
Preparation of Fund
WWTP
SewerNetwork
E3
F/S
Preparation of Fund
WWTP
SewerNetwork

The Project for the Improvement of Water Supply, Sewerage and Drainage System in Yangon City Vol VI Sewerage and Drainage System Master Plan, Appendix
B-3
Table B.2 Project Cost of Sewerage Works (Case That Separate System is Adopted in All Sewerage Zones)
Table B.3 Unit Cost of Waste Water Treatment Plant (Case That Separate System is Adopted in All Sewerage Zones)
Non-disclosure Information
Non-disclosure Information

The Project for the Improvement of Water Supply, Sewerage and Drainage System in Yangon City Vol VI Sewerage and Drainage System Master Plan, Appendix
B-4
Table B.4 Project Cost of Sewerage Works (Cost for Each Sewerage Zone (Case That Separate System is Adopted in C1, W1 and a Part of C2, and Interceptor System with Primary Treatment
is Adopted in the Others)
Table B.5 Unit Cost of Waste Water Treatment Plant (Cost for Each Sewerage Zone (Case That Separate System is Adopted in C1, W1 and a Part of C2, and Interceptor System is
Adopted in the Others)
Non-disclosure Information
Non-disclosure Information

The Project for the Improvement of Water Supply, Sewerage and Drainage System in Yangon City Vol VI Sewerage and Drainage System Master Plan, Appendix
B-5
Table B.6 Project Cost of Sewerage Works (Cost for Each Sewerage Zone (Case That Separate System is Adopted in C1, W1 and a Part of C2, and Interceptor System with Secondary
Treatment is Adopted in the Others)
Non-disclosure Information
The P
roject for the Improvem
ent of Water Supply, Sew
erage and Drainage System
in Yangon City
Vol VI Sew
erage and Drainage System
Master P
lan, Appendix
B-6
Area(ha) area (ha) area (ha) area (ha) area (ha) area (ha) area (ha) area (ha)
Pabedan 62 100.0% 62Kyauktada 70 100.0% 70Botahtaung 260 100.0% 260Pazundaung 107 100.0% 107Bahan 847 83.2% 705 16.8% 142Tarmwe 499 100.0% 499Mingalar Taung Nyunt 494 100.0% 494Yankin 479 100.0% 479Thingangyun 1,312 100.0% 1312Mayangone 2,588 69.2% 1791 30.8% 797South Okkalapa 822 100.0% 822Latha 60 100.0% 60Lanmadaw 131 100.0% 131Ahlone 338 100.0% 338Kyee Myin Daing 457 39.8% 182Sanchaung 240 100.0% 240Dagon 489 100.0% 489Kamaryut 647 11.1% 72 88.9% 575Hlaing 984 100.0% 984Insein 3,163 100.0% 3163North Okkalapa 2,766 100.0% 2766North Dagon 2,418 100.0% 2418Dawbon 311 100.0% 311Thaketa 1,356 100.0% 1356South Dagon 3,751 100.0% 3751Total (ha) 24,651 Total area of C1 499 Total area of C2 6102 Total area of E2 5184 Total area of W1 1654 Total area of W2 2356 Total area of N1 3163 Total area of E3 5418
Total area of C2 and E1 11286Design pop. 178,000 1,902,000 483,000 350,000 377,000 921,000No. of households (all) 28,254 163,231 138,674 76,667 55,556 59,841 146,190Total No. of household in 3 Pabedan 3511 11 Bahan 18859 23 North Okkalapa 73992 11 Bahan 6582 20 Mayangone 18794 21 Insein 59,841 15 Dawbon 8391each township 4 Kyauktada 3963 12 Tarmwe 13348 30 North Dagon 64682 1 Latha 2781 16 Kamaryut 13559 25 Thaketa 36588
5 Botahtaung 14722 13 Mingalar Taung Nyunt 13215 2 Lanmadaw 6072 17 Hlaing 23203 31 South Dagon 1012116 Pazundaung 6058 18 Yankin 12813 7 Ahlone 15667
19 Thingangyun 35097 8 Kyee Myin Daing 843620 Mayangone 47910 9 Sanchaung 1112524 South Okkalapa 21989 10 Dagon 22666
16 Kamaryut 3338Total 28,254 Total 163,231 Total 138,674 Total 76,667 Total 55,556 Total 59,841 Total 146,190
% of apartment in each township 3 Pabedan 95.5% 11 Bahan 44.2% 23 North Okkalapa 1.2% 11 Bahan 44.2% 20 Mayangone 13.9% 21 Insein 1.7% 15 Dawbon 3.7%4 Kyauktada 94.6% 12 Tarmwe 76.6% 30 North Dagon 7.8% 1 Latha 88.1% 16 Kamaryut 59.9% 25 Thaketa 3.9%5 Botahtaung 72.8% 13 Mingalar Taung Nyunt 73.8% 2 Lanmadaw 74.0% 17 Hlaing 33.0% 31 South Dagon 0.7%6 Pazundaung 79.4% 18 Yankin 39.6% 7 Ahlone 83.5%
19 Thingangyun 13.6% 8 Kyee Myin Daing 27.7%20 Mayangone 13.9% 9 Sanchaung 67.6%24 South Okkalapa 0.0% 10 Dagon 48.7%
16 Kamaryut 59.9%No. of househols in apartment 3 Pabedan 3,351 11 Bahan 8,330 23 North Okkalapa 905 11 Bahan 2,907 20 Mayangone 2,621 21 Insein 1,012 15 Dawbon 308
4 Kyauktada 3,749 12 Tarmwe 10,223 30 North Dagon 5,070 1 Latha 2,449 16 Kamaryut 8,116 25 Thaketa 1,4435 Botahtaung 10,720 13 Mingalar Taung Nyunt 9,757 2 Lanmadaw 4,491 17 Hlaing 7,645 31 South Dagon 6826 Pazundaung 4,812 18 Yankin 5,070 7 Ahlone 13,085
19 Thingangyun 4,772 8 Kyee Myin Daing 2,33920 Mayangone 6,682 9 Sanchaung 7,52124 South Okkalapa 0 10 Dagon 11,042
16 Kamaryut 1,998
Sub total 22,632 Sub total 44,834 Sub total 5,975 Sub total 45,832 Sub total 18,382 Sub total 1,012 Sub total 2,433No. of HC for apartment 30 754 1494 199 1528 613 34 8130 households/apartmentNo. of HC for detached house 5,622 118,397 132,699 30,835 37,174 58,829 143,757Total no of HC 6,376 119,891 132,898 32,363 37,787 58,863 143,838
C1+E1 252,789C1(50%) 59,946
% of served township in E3Township
Source: result of socio-economic survey
% of served township in C1 % of served township in C2 % of served township in E1 % of served township in W1 % of served township in W2 % of served township in N2C1 C2 E1 W1 W2 E3N1
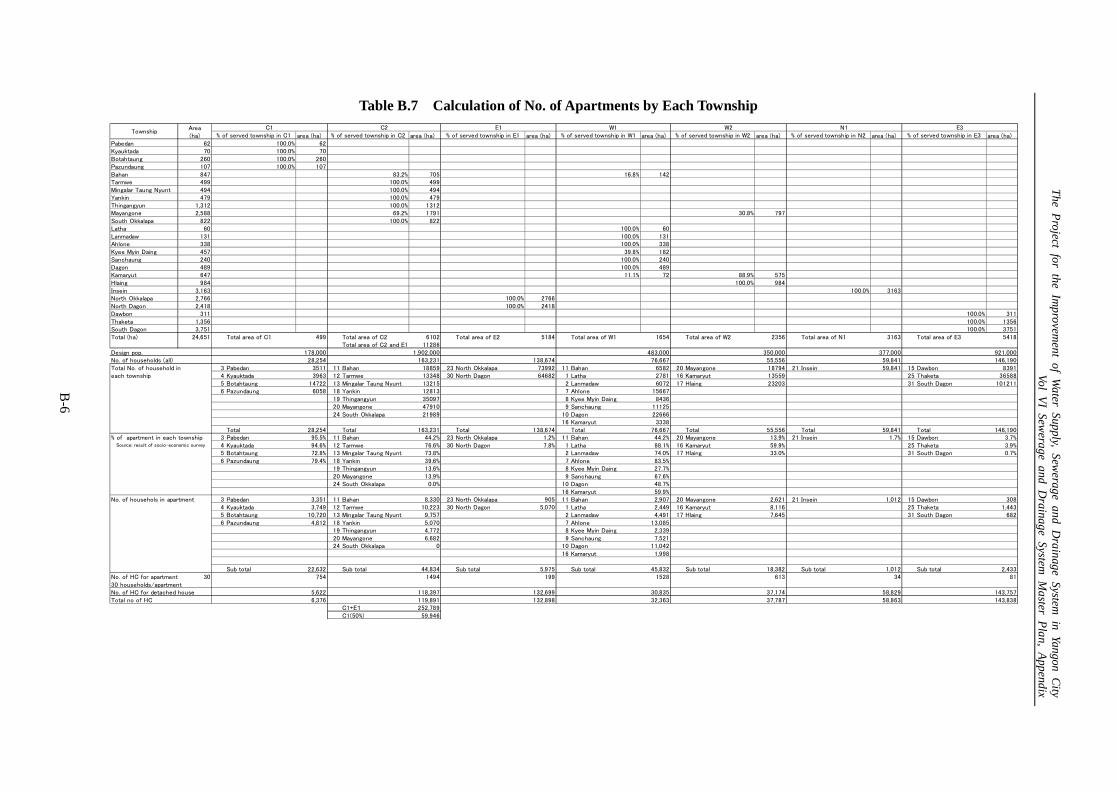
Table B.7 Calculation of No. of Apartments by Each Township

The Project for the Improvement of Water Supply, Sewerage and Drainage System in Yangon City Vol VI Sewerage and Drainage System Master Plan, Appendix
B-7
Table B.8 Operation and Maintenance Cost for Each Sewerage Zone (Case That Separate System is Adopted in all Sewerage Zones)
(Unit: Mil. JPY/year)
*: The total OM cost of C1 with the capacity of 70,200m3/d
Table B.9 Operation and Maintenance (Cost for Each Sewerage Zone (Case That Separate
System is Adopted in C1, W1 and a Part of C2, and Interceptor System with Primary Treatment is Adopted in the Others)
(Unit: Mil. JPY/year)
Table B.10 Operation and Maintenance (Cost for Each Sewerage Zone (Case That Separate System is Adopted in C1, W1 and a Part of C2, and Interceptor System with Secondary
Treatment is Adopted in the Others)
Items C1 C2&E1 W1 W2 E3 N1 TotalSalary 3.5 7.1 5.9 5.9 5.9 4.6 32.9Electricity 24.4 260.5 64.3 44.5 92.6 49.2 535.5Maintenance(Spare parts ) 20.5 202.5 52.7 43.4 68.6 43.4 431.1Sludge cake 7.5 80.5 19.9 13.7 28.6 15.2 165.4Chemical 28.4 302.4 74.6 51.6 107.6 57.2 621.8Sewer 4.3 24.0 7.5 10.6 21.0 12.9 80.3Other cost 1.7 17.1 4.3 3.2 6.1 3.4 35.8
Total 90.3 894 229 173 330 186 1,902.8
Items C1 C2&E1 W1 W2 E3 N1 TotalSalary 3.5 6.6 5.9 5.4 5.4 4.2 31.0Electricity 24.4 161.6 64.3 19.3 40.1 21.3 331.0Maintenance(Spare parts ) 20.5 83.7 52.7 19.2 28.8 19.2 224.1Sludge cake 7.5 56.2 19.9 7.6 15.7 8.4 115.3Chemical 28.4 230.1 74.6 18.2 38.0 20.2 409.5Sewer 4.3 7.4 7.5 0.0 0.0 0.0 19.2Other cost 1.7 10.8 4.3 1.4 2.6 1.5 22.3
Total 90.3 556 229 71 131 75 1,152.4
Items C1 C2&E1 W1 W2 E3 N1 TotalSalary 3.5 6.6 5.9 5.4 5.4 4.2 31.0Electricity 24.4 260.5 64.3 44.5 92.6 49.2 535.5Maintenance(Spare parts ) 20.5 202.5 52.7 43.4 68.6 43.4 431.1Sludge cake 7.5 80.5 19.9 13.7 28.6 15.2 165.4Chemical 28.4 302.4 74.6 51.6 107.6 57.2 621.8Sewer 4.3 7.4 7.5 0.0 0.0 0.0 19.2Other cost 1.7 17.1 4.3 3.2 6.1 3.4 35.8
Total 90.3 877 229 162 309 173 1,839.8


The Project for the Improvement of Water Supply, Sewerage and Drainage System in Yangon City Vol VI Sewerage and Drainage System Master Plan, Appendix
C-1
C. FINANCIAL SIMULATION
Table C.1 Sewerage Financial Simulation 1 Separate/Secondary Treatment (Capital Subsidy 80% Annual Tariff Increase 3.9%)
Non-disclosure Information
Non-disclosure Information

The Project for the Improvement of Water Supply, Sewerage and Drainage System in Yangon City Vol VI Sewerage and Drainage System Master Plan, Appendix
C-2
Table C.2 Sewerage Financial Simulation 2 Interceptor/Secondary Treatment (Capital Subsidy 80% Annual Tariff Increase 2.7%)
The Project for the Improvement of Water Supply, Sewerage and Drainage System in Yangon City Vol VI Sewerage and Drainage System Master Plan, Appendix
C-3
Table C.3 Sewerage Financial Simulation 3 Interceptor/Primary Treatment (Capital Subsidy 80% Annual Tariff Increase 1.7%)
Non-disclosure Information

The Project for the Improvement of Water Supply, Sewerage and Drainage System in Yangon City Vol VI Sewerage and Drainage System Master Plan, Appendix
C-4
Table C.4 Sewerage Financial Simulation 4 Separate/Secondary Treatment (Capital Subsidy 60% Annual Tariff Increase 5.0%)
Non-disclosure Information

The Project for the Improvement of Water Supply, Sewerage and Drainage System in Yangon City Vol VI Sewerage and Drainage System Master Plan, Appendix
C-5
Table C.5 Sewerage Financial Simulation 5 Interceptor/Secondary Treatment (Capital Subsidy 60% Annual Tariff Increase 3.9%)
Non-disclosure Information
The Project for the Improvement of Water Supply, Sewerage and Drainage System in Yangon City Vol VI Sewerage and Drainage System Master Plan, Appendix
C-6
Table C.6 Sewerage Financial Simulation 6 Interceptor/Primary Treatment (Capital Subsidy 60% Annual Tariff Increase 3.0%)
Non-disclosure Information

The Project for the Improvement of Water Supply, Sewerage and Drainage System in Yangon City Vol VI Sewerage and Drainage System Master Plan, Appendix
C-7
Table C.7 Sewerage Financial Simulation 7 Separate/Secondary Treatment (Capital Subsidy 40% Annual Tariff Increase 5.9%)
Non-disclosure Information

The Project for the Improvement of Water Supply, Sewerage and Drainage System in Yangon City Vol VI Sewerage and Drainage System Master Plan, Appendix
C-8
Table C.8 Sewerage Financial Simulation 8 Interceptor/Secondary Treatment (Capital Subsidy 40% Annual Tariff Increase 4.9%)
Non-disclosure Information

The Project for the Improvement of Water Supply, Sewerage and Drainage System in Yangon City Vol VI Sewerage and Drainage System Master Plan, Appendix
C-9
Table C.9 Sewerage Financial Simulation 9 Interceptor/Primary Treatment (Capital Subsidy 40% Annual Tariff Increase 4.0%)
Non-disclosure Information

The Project for the Improvement of Water Supply, Sewerage and Drainage System in Yangon City Vol VI Sewerage and Drainage System Master Plan, Appendix
C-10
Table C.10 Sewerage Financial Simulation 10 Separate/Secondary Treatment (Capital Subsidy 0% Annual Tariff Increase 7.3%)
Non-disclosure Information

The Project for the Improvement of Water Supply, Sewerage and Drainage System in Yangon City Vol VI Sewerage and Drainage System Master Plan, Appendix
C-11
Table C.11 Sewerage Financial Simulation 11 Interceptor/Secondary Treatment (Capital Subsidy 0% Annual Tariff Increase 6.3%)
Non-disclosure Information

The Project for the Improvement of Water Supply, Sewerage and Drainage System in Yangon City Vol VI Sewerage and Drainage System Master Plan, Appendix
C-12
Table C.12 Sewerage Financial Simulation 12 Interceptor/Primary Treatment (Capital Subsidy 0% Annual Tariff Increase 5.4%)
Non-disclosure Information

The P
roject for the Improvem
ent of Water Supply, Sew
erage and Drainage System
in Yangon City
Vol VI Sew
erage and Drainage System
Master P
lan, Appendix
D-1
D.
DR
AIN
AG
E FA
CIL
ITIE
S PL
AN
Table D.1 Evaluation of Flow Capacity for Existing Major Drainage Channels
The P
roject for the Improvem
ent of Water Supply, Sew
erage and Drainage System
in Yangon City
Vol VI Sew
erage and Drainage System
Master P
lan, Appendix
D-2
L Total A ti t2 T I Cratio over
totalcatchment
A Discharge Slope VelocityFlow
Capacity
(m) (ha) (min) (min) (min) (mm/h) (ha) (m3/s) (-) (m/s) (m3/s)inlet traveling total
(1) (2) (3) (4) (5) (6) (7) (8) (9) (10)
No1-1 600 318.5 20 5.0 25.0 117.1 0.5 0.3 95.6 15.5 4.50 x 2.25 0.00050 1.795 16.354No1-2 640 318.5 5.3 30.3 102.4 0.5 0.5 159.3 22.6 5.50 x 2.75 0.00040 1.835 24.979No1-3 770 318.5 6.4 36.7 89.5 0.5 0.7 223.0 27.7 6.00 x 3.00 0.00037 1.870 30.298No1-4 760 318.5 6.3 43.0 80.1 0.5 1.0 318.5 35.4 6.50 x 3.25 0.00034 1.891 35.954Total 2,770No2-1 800 517.0 25 6.7 31.7 99.2 0.5 0.5 258.5 35.6 6.50 x 3.25 0.00034 1.891 35.954No2-2 300 517.0 2.5 34.2 94.1 0.5 0.7 361.9 47.3 7.50 x 3.75 0.00030 1.954 49.465No2-3 280 517.0 2.3 36.5 89.9 0.5 0.8 413.6 51.6 8.00 x 4.00 0.00028 1.971 56.762No2-4 1,230 517.0 10.3 46.8 75.5 0.5 1.0 517.0 54.2 8.00 x 4.00 0.00028 1.971 56.762Total 2,610No3-1 560 213.0 15 4.7 19.7 138.4 0.5 0.4 85.2 16.4 4.50 x 2.25 0.00055 1.882 17.152No3-2 890 213.0 7.4 27.1 110.7 0.5 0.7 149.1 22.9 5.50 x 2.75 0.00050 2.052 27.927No3-3 1,010 213.0 8.4 35.5 91.6 0.5 1.0 213.0 27.1 5.50 x 2.75 0.00050 2.052 27.927Total 2,460No4-1 260 404.7 25 2.2 27.2 110.4 0.5 0.5 202.4 31.0 6.00 x 3.00 0.00040 1.945 31.502No4-2 800 404.7 6.7 33.9 94.7 0.5 0.7 283.3 37.3 6.50 x 3.25 0.00040 2.051 38.998No4-3 990 404.7 8.3 42.2 81.2 0.5 1.0 404.7 45.6 7.00 x 3.50 0.00040 2.155 47.519Total 2,050No6-1 290 1151.6 30 2.4 32.4 97.7 0.5 0.4 460.6 62.5 8.50 x 4.25 0.00025 1.939 63.047No6-2 420 1151.6 3.5 35.9 90.9 0.5 0.5 575.8 72.7 9.00 x 4.50 0.00025 2.014 73.427No6-3 540 1151.6 4.5 40.4 83.7 0.5 0.6 691.0 80.3 9.50 x 4.75 0.00025 2.088 84.815Total 1,250No5-1 470 1151.6 20 3.9 23.9 120.9 0.5 0.1 115.2 19.3 5.00 x 2.50 0.00040 1.722 19.373No5-2 930 1151.6 7.8 31.7 99.2 0.5 0.2 172.7 23.8 5.50 x 2.75 0.00040 1.835 24.979No5-3 1,170 1151.6 9.8 50.2 71.9 0.5 0.8 921.3 92.0 9.50 x 4.75 0.00030 2.288 92.911No5-4 780 1151.6 6.5 56.7 66.0 0.5 0.9 978.9 89.7 9.50 x 4.75 0.00030 2.288 92.911No5-5 340 1151.6 2.8 59.5 63.8 0.5 0.9 1,036.4 91.8 9.50 x 4.75 0.00030 2.288 92.911No.5-6 720 1151.6 6.0 65.5 59.7 0.5 1.0 1,151.6 95.5 10.00 x 5.00 0.00030 2.367 106.529Total 4,410No7-1 180 317.9 20 1.5 21.5 130.2 0.5 0.4 127.2 23.0 5.50 x 2.75 0.00035 1.716 23.366No 7-2 160 317.9 1.3 22.8 124.9 0.5 0.5 159.0 27.6 6.00 x 3.00 0.00035 1.819 29.468No7-3 620 317.9 5.2 28.0 108.2 0.5 0.8 254.3 38.2 7.00 x 3.50 0.00030 1.866 41.153No7-4 530 317.9 4.4 32.4 97.7 0.5 1.0 317.9 43.1 7.50 x 3.75 0.00030 1.954 49.465Total 1,490No8-1 860 343.9 20 7.2 27.2 110.4 0.5 0.3 103.2 15.8 4.50 x 2.25 0.00050 1.795 16.354No8-2 320 343.9 2.7 29.9 103.3 0.5 0.5 172.0 24.7 5.50 x 2.75 0.00040 1.835 24.979No8-3 360 343.9 3.0 32.9 96.7 0.5 0.7 240.7 32.3 6.50 x 3.25 0.00034 1.891 35.954No8-4 820 343.9 6.8 39.7 84.7 0.5 1.0 343.9 40.5 7.00 x 3.50 0.00032 1.928 42.502Total 2,360No9-1 520 316.9 30 4.3 34.3 93.9 0.5 0.65 206.0 26.9 5.50 x 2.75 0.00050 2.052 27.927No9-2 370 316.9 3.1 37.4 88.4 0.5 0.7 221.8 27.2 5.50 x 2.75 0.00050 2.052 27.927No9-3 490 316.9 4.1 41.5 82.2 0.5 0.8 253.5 28.9 6.00 x 3.00 0.00050 2.174 35.221No9-4 460 316.9 3.8 45.3 77.3 0.5 1.0 316.9 34.0 6.00 x 3.00 0.00050 2.174 35.221
Total 1,840
Dimension
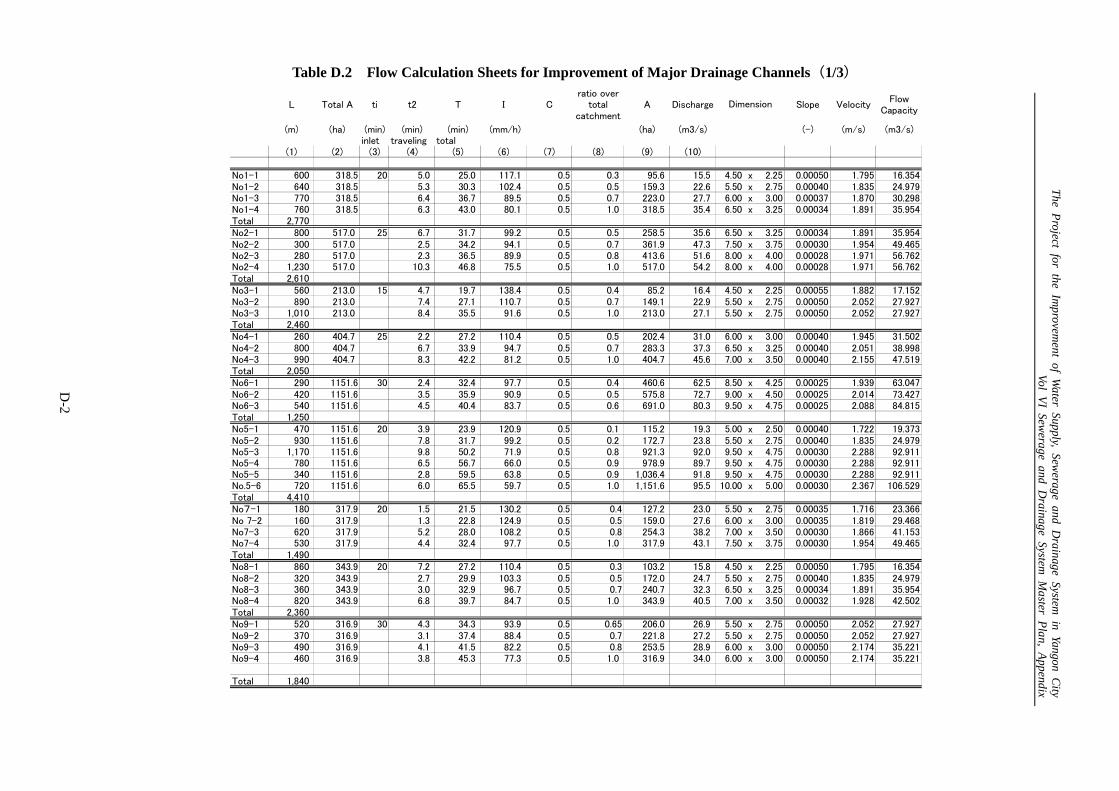
Table D.2 Flow Calculation Sheets for Improvement of Major Drainage Channels(1/3)
The P
roject for the Improvem
ent of Water Supply, Sew
erage and Drainage System
in Yangon City
Vol VI Sew
erage and Drainage System
Master P
lan, Appendix
D-3
L Total A ti t2 T I Cratio over
totalcatchment
A Discharge Slope VelocityFlow
Capacity
(m) (ha) (min) (min) (min) (mm/h) (ha) (m3/s) (-) (m/s) (m3/s)inlet traveling total
(1) (2) (3) (4) (5) (6) (7) (8) (9) (10)
No10-1 300 273.9 20 2.5 22.5 126.1 0.6 0.2 54.8 11.5 4.00 x 2.00 0.00050 1.659 11.946No10-2 300 273.9 2.5 25.0 117.1 0.6 0.4 109.6 21.4 5.00 x 2.50 0.00050 1.925 21.659No10-3 290 273.9 2.4 27.4 109.9 0.6 0.5 137.0 25.1 5.50 x 2.75 0.00045 1.946 26.494No10-4 240 273.9 2.0 29.4 104.6 0.6 0.6 164.3 28.6 6.00 x 3.00 0.00045 2.063 33.413No10-5 500 273.9 4.2 33.6 95.2 0.6 1.0 273.9 43.5 7.00 x 3.50 0.00040 2.155 47.519Total 1,630No11-1 580 779.2 25 4.8 29.8 103.6 0.6 0.5 389.6 67.3 8.50 x 4.25 0.00030 2.124 69.064No11-2 910 779.2 7.6 37.4 88.4 0.6 0.7 545.4 80.4 9.00 x 4.50 0.00030 2.207 80.436No11-3 700 779.2 5.8 43.2 79.9 0.6 0.8 623.4 83.0 9.50 x 4.75 0.00030 2.288 92.911No11-4 1,230 779.2 10.3 53.5 68.8 0.6 1.0 779.2 89.3 9.50 x 4.75 0.00030 2.288 92.911
3,420No12-1 360 128.1 20 3.0 23.0 124.2 0.6 0.4 51.2 10.6 3.50 x 1.75 0.00085 1.979 10.909No12-2 400 128.1 3.3 26.3 113.1 0.6 0.6 76.9 14.5 4.00 x 2.00 0.00075 2.032 14.631No12-3 330 128.1 2.8 29.1 105.3 0.6 0.8 102.5 18.0 4.50 x 2.25 0.00065 2.046 18.647No12-4 240 128.1 2.0 31.1 100.5 0.6 1.0 128.1 21.5 5.00 x 2.50 0.00060 2.109 23.727Total 1,330No14-1 510 466.1 30 4.3 34.3 93.9 0.6 0.4 186.4 29.2 5.50 x 2.75 0.00055 2.152 29.290No14-2 510 466.1 4.3 38.6 86.4 0.6 0.5 233.1 33.6 6.00 x 3.00 0.00050 2.174 35.221No14-3 320 466.1 2.7 41.3 82.4 0.6 0.6 279.7 38.4 6.50 x 3.25 0.00045 2.176 41.363
1,340No13-1 360 466.1 20 3.0 23.0 124.2 0.6 0.2 93.2 19.3 5.00 x 2.50 0.00040 1.722 19.373No13-2 560 466.1 4.7 27.7 109.0 0.6 0.3 116.5 21.2 5.50 x 2.75 0.00040 1.835 24.979No13-3 480 466.1 4.0 31.7 99.2 0.6 0.3 139.8 23.1 5.50 x 2.75 0.00040 1.835 24.979No13-4 400 466.1 3.3 44.6 78.1 0.6 1.0 466.1 60.7 8.00 x 4.00 0.00035 2.204 63.462Total 1,800No15-1 470 698.1 30 3.9 33.9 94.7 0.6 0.4 279.2 44.1 7.00 x 3.50 0.00035 2.016 44.450No15-2 640 698.1 5.3 39.2 85.5 0.6 0.5 349.1 49.7 8.00 x 4.00 0.00030 2.040 58.755No15-3 730 698.1 6.1 45.3 77.3 0.6 0.6 418.9 54.0 8.00 x 4.00 0.00030 2.040 58.755No15-4 1,350 698.1 11.3 56.6 66.1 0.6 0.7 488.7 53.8 8.00 x 4.00 0.00030 2.040 58.755No15-5 1,180 698.1 9.8 66.4 59.1 0.6 0.9 628.3 61.9 8.50 x 4.25 0.00030 2.124 69.064No15-6 370 698.1 3.1 69.5 57.3 0.6 1.0 698.1 66.7 8.50 x 4.25 0.00030 2.124 69.064Total 4,740No16-1 630 801.3 20 5.3 25.3 116.2 0.6 0.2 160.3 31.0 6.00 x 3.00 0.00040 1.945 31.502No16-2 690 801.3 5.8 31.1 100.5 0.6 0.4 320.5 53.7 8.00 x 4.00 0.00030 2.040 58.755No16-3 1,040 801.3 8.7 39.8 84.6 0.6 0.6 480.8 67.8 8.50 x 4.25 0.00030 2.124 69.064No16-4 1,500 801.3 12.5 52.3 69.9 0.6 0.8 641.0 74.7 9.00 x 4.50 0.00030 2.207 80.436No16-5 510 801.3 4.3 56.6 66.1 0.6 1.0 801.3 88.3 9.50 x 4.75 0.00030 2.288 92.911Total 4,370
Dimension
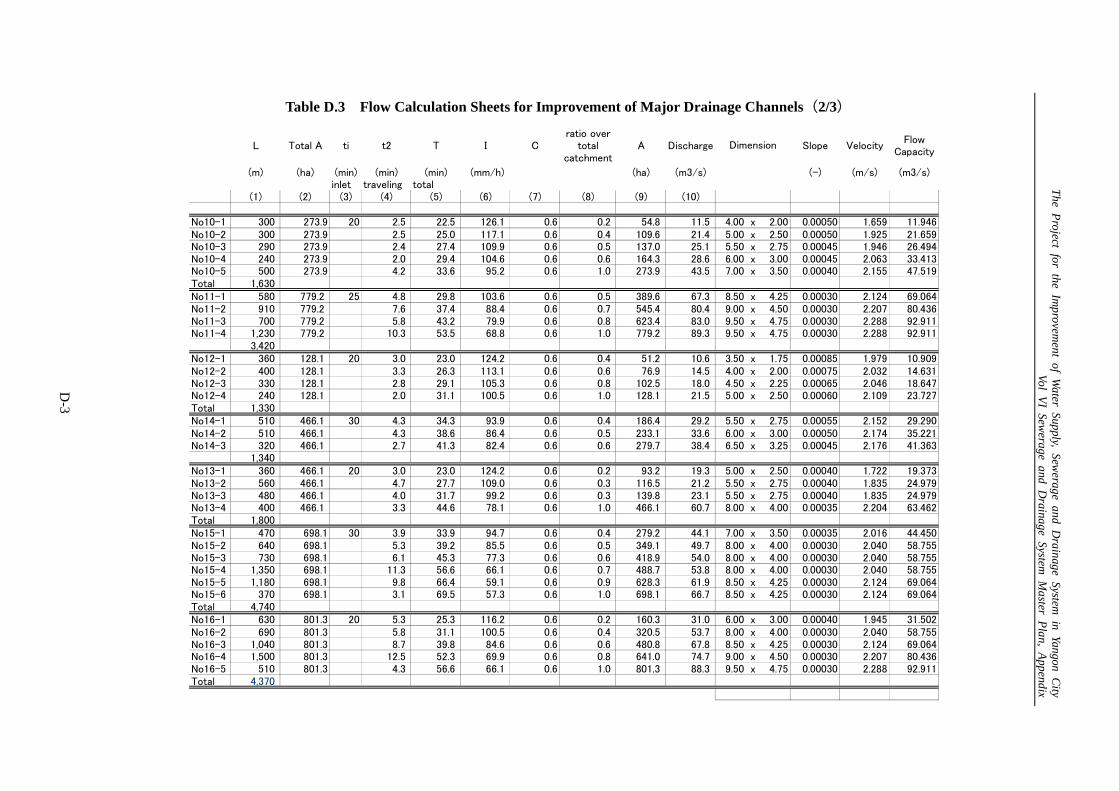
Table D.3 Flow Calculation Sheets for Improvement of Major Drainage Channels(2/3)

The P
roject for the Improvem
ent of Water Supply, Sew
erage and Drainage System
in Yangon City
Vol VI Sew
erage and Drainage System
Master P
lan, Appendix
D-4
L Total A ti t2 T I C
ratio overtotal
catchmentA Discharge Slope Velocity
FlowCapacity
(m) (ha) (min) (min) (min) (mm/h) (ha) (m3/s) (-) (m/s) (m3/s)inlet traveling total
(1) (2) (3) (4) (5) (6) (7) (8) (9) (10)
No17-1 1,120 1433.1 30 9.3 39.3 85.3 0.6 0.3 429.9 61.1 8.00 x 4.00 0.00035 2.204 63.462Total 1,120No18-1 900 1433.1 25 7.5 46.8 75.5 0.6 0.3 429.9 54.1 8.00 x 4.00 0.00028 1.971 56.762No18-2 450 1433.1 3.8 50.6 71.5 0.6 0.4 573.2 68.3 9.00 x 4.50 0.00025 2.014 73.427No18-3 1,660 1433.1 13.8 64.4 60.4 0.6 0.8 1,146.5 115.4 11.50 x 5.75 0.00020 2.122 126.265No18-4 220 1433.1 1.8 66.2 59.2 0.6 1.0 1,433.1 141.4 12.00 x 6.00 0.00020 2.183 141.440Total 3,230No19-1 360 230.2 20 3.0 23.0 124.2 0.4 0.3 69.1 9.5 3.50 x 1.75 0.00065 1.731 9.540No19-2 410 230.2 3.4 26.4 112.8 0.4 0.4 92.1 11.5 4.00 x 2.00 0.00055 1.740 12.529No19-3 400 230.2 3.3 29.7 103.8 0.4 0.8 184.2 21.2 5.00 x 2.50 0.00050 1.925 21.659No19-4 150 230.2 1.3 31.0 100.8 0.4 1.0 230.2 25.8 5.50 x 2.75 0.00045 1.946 26.494Total 1,320No20-1 540 620.8 30 4.5 34.5 93.5 0.4 0.2 124.2 12.9 4.00 x 2.00 0.00060 1.818 13.086No20-2 640 620.8 5.3 39.8 84.6 0.4 0.6 372.5 35.0 6.50 x 3.25 0.00035 1.919 36.479No20-3 810 620.8 6.8 46.6 75.8 0.4 1.0 620.8 52.3 7.50 x 3.75 0.00035 2.111 53.428Total 1,990No21-1 1,040 759.9 30 8.7 38.7 86.3 0.4 0.3 228.0 21.9 5.00 x 2.50 0.00055 2.019 22.717No21-2 670 759.9 5.6 44.3 78.5 0.4 0.4 266.0 23.2 5.50 x 2.75 0.00050 2.052 27.927No21-3 960 759.9 30 8.0 38.0 87.4 0.4 0.2 152.0 14.8 4.50 x 2.25 0.00050 1.795 16.354No21-4 330 759.9 2.8 40.8 83.1 0.4 0.3 228.0 21.0 5.00 x 2.50 0.00050 1.925 21.659No21-5 1,180 759.9 9.8 54.1 68.2 0.4 0.8 607.9 46.1 7.00 x 3.50 0.00040 2.155 47.519No21-6 300 759.9 2.5 56.6 66.1 0.4 1.0 759.9 55.8 7.50 x 3.75 0.00040 2.256 57.117Total 4,480(No22-1) 2,800 1525.6 50 23.3 73.3 55.2 0.4 0.4 610.2 37.4 6.50 x 3.25 0.00045 2.176 41.363No22-2 1,710 1525.6 14.3 87.6 48.7 0.4 0.5 686.5 37.1 6.50 x 3.25 0.00045 2.176 41.363No22-3 1,830 1525.6 15.3 102.9 43.5 0.4 0.5 762.8 36.9 6.50 x 3.25 0.00045 2.176 41.363No22-4 1,670 1525.6 30 13.9 43.9 79.0 0.4 0.3 457.7 40.2 6.50 x 3.25 0.00045 2.176 41.363No22-4 550 1525.6 4.6 107.5 42.2 0.4 0.9 1,373.0 64.4 8.50 x 4.25 0.00035 2.294 74.598No22-4 450 1525.6 3.8 111.3 41.2 0.4 1.0 1,525.6 69.8 8.50 x 4.25 0.00035 2.294 74.598
9,010
Dimension
Table D.4 Flow Calculation Sheets for Improvement of Major Drainage Channels(3/3)

The P
roject for the Improvem
ent of Water Supply, Sew
erage and Drainage System
in Yangon City
Vol VI Sew
erage and Drainage System
Master P
lan, Appendix
D-5
L Total A ti t2 T I Cratio over
totalcatchment
A Discharge Slope VelocityFlow
Capacity
(m) (ha) (min) (min) (min) (mm/h) (ha) (m3/s) (-) (m/s) (m3/s)inlet traveling total
(1) (2) (3) (4) (5) (6) (7) (8) (9) (10)
G-1 295.2 14.2 5 2.5 7.5 272.1 0.8 1.0 14.2 8.6 2.20 x 2.20 0.00105 1.978 8.618G-2 348.5 15.9 5 2.9 7.9 262.4 0.8 1.0 15.9 9.3 2.40 x 2.40 0.00095 1.994 10.338G-3 386.9 18.6 5 3.2 8.2 255.6 0.8 1.0 18.6 10.6 2.60 x 2.60 0.00085 1.990 12.106G-4 637.0 37.6 5 5.3 10.3 217.9 0.8 1.0 37.6 18.2 3.20 x 3.20 0.00065 1.998 18.417G-5 889.3 41.8 5 7.4 12.4 191.4 0.8 1.0 41.8 17.8 3.20 x 3.20 0.00065 1.998 18.417G-6 1,220.1 48.4 5 10.2 15.2 166.0 0.8 1.0 48.4 17.9 3.20 x 3.20 0.00065 1.998 18.417G-7 984.1 19.9 5 8.2 13.2 183.2 0.8 1.0 19.9 8.1 2.20 x 2.20 0.00105 1.978 8.618G-8 1,009.9 34.7 5 8.4 13.4 181.3 0.8 1.0 34.7 14.0 2.80 x 2.80 0.00080 2.028 14.311G-9 1,164.2 29.0 5 9.7 14.7 169.9 0.8 1.0 29.0 10.9 2.60 x 2.60 0.00085 1.990 12.106G-10 1,223.1 54.1 5 10.2 15.2 166.0 0.8 1.0 54.1 20.0 3.40 x 3.40 0.00060 1.999 20.799G-11 1,134.2 40.4 5 9.5 14.5 171.5 0.8 1.0 40.4 15.4 3.00 x 3.00 0.00070 1.986 16.090G-12 1,209.6 38.9 5 10.1 15.1 166.7 0.8 1.0 38.9 14.4 3.00 x 3.00 0.00070 1.986 16.090G-13 1,033.5 75.0 5 8.6 13.6 179.4 0.8 1.0 75.0 29.9 4.40 x 4.40 0.00045 2.056 35.824G-14 520.0 49.5 5 4.3 9.3 234.1 0.8 1.0 49.5 25.8 4.40 x 4.40 0.00045 2.056 35.824G-15 632.3 37.5 5 5.3 10.3 217.9 0.8 1.0 37.5 18.2 3.20 x 3.20 0.00065 1.998 18.417
Total 12,688
Average velocity: 2.0m/s(assumption)
Dimension
Table D.5 Flow Calculation Sheets for Improvement of Major Drainage Channels in CBD

The Project for the Improvement of Water Supply, Sewerage and Drainage System in Yangon City Vol VI Sewerage and Drainage System Master Plan, Appendix
D-6
Table D.6 Flow Calculation Sheets for Storage Pipe(Inlet to Pumping Station)in CBD (1/2 )

The Project for the Improvement of Water Supply, Sewerage and Drainage System in Yangon City Vol VI Sewerage and Drainage System Master Plan, Appendix
D-7
Table D.7 Flow Calculation Sheets for Storage Pipe(Inlet to Pumping Station)in CBD (2/2 )


The Project for the Improvement of Water Supply, Sewerage and Drainage System in Yangon City Vol VI Sewerage and Drainage System Master Plan, Appendix
E-1
E. COST ESTIMATION OF DRAINAGE WORKS
The project cost and the detailed operation and maintenance cost regarding drainage works are
shown in the following pages.

The P
roject for the Improvem
ent of Water Supply, Sew
erage and Drainage System
in Yangon City
Vol VI Sew
erage and Drainage System
Master P
lan, Appendix
E-2
Table E.2 Summary of Project Cost of Drainage Works
Table E.1 Detailed Project Cost of Drainage Works (CBD)
Non-disclosure Information
Non-disclosure Information
The P
roject for the Improvem
ent of Water Supply, Sew
erage and Drainage System
in Yangon City
Vol VI Sew
erage and Drainage System
Master P
lan, Appendix
E-3
Table E.3 Detailed Project Cost of Drainage Works(No.1~22)
Non-disclosure Information

The Project for the Improvement of Water Supply, Sewerage and Drainage System in Yangon City Vol VI Sewerage and Drainage System Master Plan, Appendix
E-4
Table E.4 Operation and Maintenance Cost of Drainage Works
Unit: USD/yearItems Total
Salary 276,408Electricity 2,380,572Maintenance(Spare parts ) 5,151,560Other cost 156,171
Total 7,964,711Total (Except for electricity)
Unit: Mil. JPY/yearItems Total
Salary 23.4Electricity 201.5Maintenance(Spare parts ) 436.0Other cost 13.2
Total 674.1Total (Except for electricity) 459.4

The Project for the Improvement of Water Supply, Sewerage and Drainage System in Yangon City Vol VI Sewerage and Drainage System Master Plan, Appendix
F-1
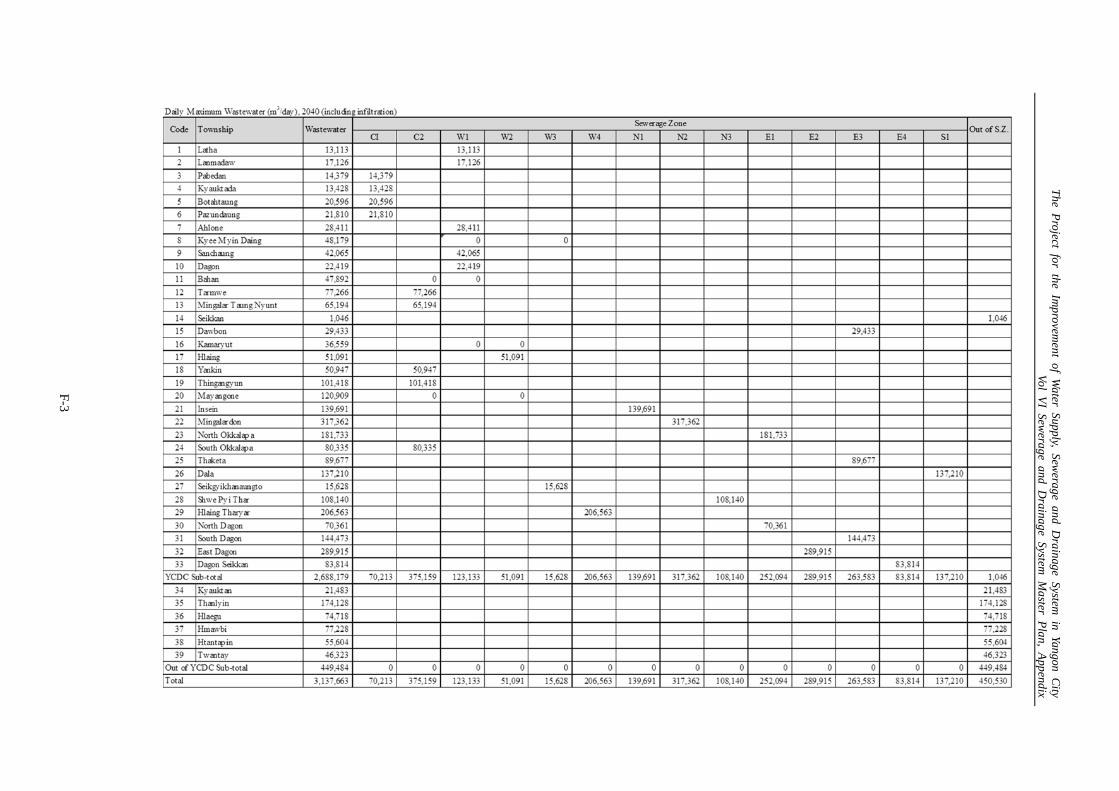
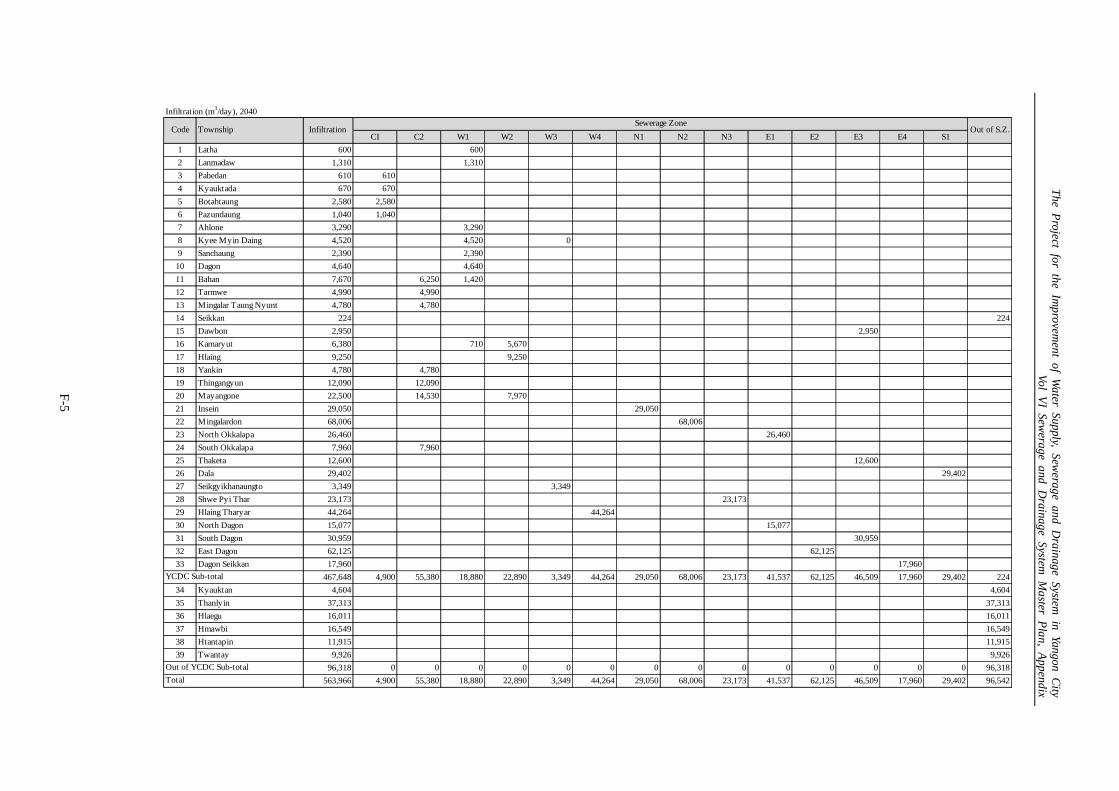
F. WASTEWATER GENERATION BY TOWNSHIPS AND SEWERAGE ZONES

The P
roject for the Improvem
ent of Water Supply, Sew
erage and Drainage System
in Yangon City
Vol VI Sew
erage and Drainage System
Master P
lan, Appendix
F-2
CI C2 W1 W2 W3 W4 N1 N2 N3 E1 E2 E3 E4 S1
1 Latha 11,975 11,975
2 Lanmadaw 15,688 15,688
3 Pabedan 13,127 13,127
4 Kyauktada 12,268 12,268
5 Botahtaung 18,958 18,958
6 Pazundaung 19,922 19,922
7 Ahlone 26,127 26,127
8 Kyee Myin Daing 44,210 44,210 0
9 Sanchaung 38,458 38,458
10 Dagon 20,803 20,803
11 Bahan 44,235 36,045 8,190
12 Tarmwe 70,695 70,695
13 Mingalar Taung Nyunt 59,702 59,702
14 Seikkan 971 971
15 Dawbon 27,025 27,025
16 Kamaryut 33,815 3,763 30,052
17 Hlaing 47,287 47,287
18 Yankin 46,750 46,750
19 Thingangyun 93,297 93,297
20 Mayangone 111,963 72,303 39,660
21 Insein 129,633 129,633
22 Mingalardon 294,693 294,693
23 North Okkalapa 167,617 167,617
24 South Okkalapa 73,755 73,755
25 Thaketa 82,670 82,670
26 Dala 127,409 127,409
27 Seikgyikhanaungto 14,512 14,512
28 Shwe Pyi Thar 100,416 100,416
29 Hlaing Tharyar 191,809 191,809
30 North Dagon 65,335 65,335
31 South Dagon 134,154 134,154
32 East Dagon 269,207 269,207
33 Dagon Seikkan 77,827 77,827
YCDC Sub-total 2,486,312 64,275 452,548 169,214 116,999 14,512 191,809 129,633 294,693 100,416 232,952 269,207 243,849 77,827 127,409 971
34 Kyauktan 19,949 19,949
35 Thanlyin 161,690 161,690
36 Hlaegu 69,381 69,381
37 Hmawbi 71,712 71,712
38 Htantapin 51,632 51,632
39 Twantay 43,014 43,014
Out of YCDC Sub-total 417,378 0 0 0 0 0 0 0 0 0 0 0 0 0 0 417,378
2,903,690 64,275 452,548 169,214 116,999 14,512 191,809 129,633 294,693 100,416 232,952 269,207 243,849 77,827 127,409 418,349
Daily Average Wastewater (m3/day), 2040 (including infiltration)
Total
Out of S.Z.Code Township WastewaterSewerage Zone
The P
roject for the Improvem
ent of Water Supply, Sew
erage and Drainage System
in Yangon City
Vol VI Sew
erage and Drainage System
Master P
lan, Appendix
F-3

The P
roject for the Improvem
ent of Water Supply, Sew
erage and Drainage System
in Yangon City
Vol VI Sew
erage and Drainage System
Master P
lan, Appendix
F-4
Hourly Maximum Wastewater (m3/day), 2040 (including infiltration)
CI C2 W1 W2 W3 W4 N1 N2 N3 E1 E2 E3 E4 S1
1 Latha 19,369 19,369
2 Lanmadaw 25,034 25,034
3 Pabedan 21,263 21,263
4 Kyauktada 19,807 19,807
5 Botahtaung 29,604 29,604
6 Pazundaung 32,195 32,195
7 Ahlone 40,971 40,971
8 Kyee Myin Daing 70,009 70,009 0
9 Sanchaung 61,902 61,902
10 Dagon 31,309 31,309
11 Bahan 68,002 55,413 12,590
12 Tarmwe 113,403 113,403
13 Mingalar Taung Nyunt 95,401 95,401
14 Seikkan 1,457 1,457
15 Dawbon 42,674 42,674
16 Kamaryut 51,648 5,748 45,900
17 Hlaing 72,011 72,011
18 Yankin 74,031 74,031
19 Thingangyun 146,082 146,082
20 Mayangone 170,114 109,856 60,258
21 Insein 195,012 195,012
22 Mingalardon 442,040 442,040
23 North Okkalapa 259,369 259,369
24 South Okkalapa 116,522 116,522
25 Thaketa 128,216 128,216
26 Dala 191,114 191,114
27 Seikgyikhanaungto 21,768 21,768
28 Shwe Pyi Thar 150,624 150,624
29 Hlaing Tharyar 287,713 287,713
30 North Dagon 98,003 98,003
31 South Dagon 201,230 201,230
32 East Dagon 403,810 403,810
33 Dagon Seikkan 116,741 116,741
YCDC Sub-total 3,798,444 102,869 710,707 266,931 178,169 21,768 287,713 195,012 442,040 150,624 357,372 403,810 372,120 116,741 191,114 1,457
34 Kyauktan 29,923 29,923
35 Thanlyin 242,535 242,535
36 Hlaegu 104,072 104,072
37 Hmawbi 107,568 107,568
38 Htantapin 77,448 77,448
39 Twantay 64,522 64,522
Out of YCDC Sub-total 626,067 0 0 0 0 0 0 0 0 0 0 0 0 0 0 626,067
4,424,511 102,869 710,707 266,931 178,169 21,768 287,713 195,012 442,040 150,624 357,372 403,810 372,120 116,741 191,114 627,524
Out of S.Z.
Total
Code Township WastewaterSewerage Zone
The P
roject for the Improvem
ent of Water Supply, Sew
erage and Drainage System
in Yangon City
Vol VI Sew
erage and Drainage System
Master P
lan, Appendix
F-5
Infiltration (m3/day), 2040
CI C2 W1 W2 W3 W4 N1 N2 N3 E1 E2 E3 E4 S1
1 Latha 600 600
2 Lanmadaw 1,310 1,310
3 Pabedan 610 610
4 Kyauktada 670 670
5 Botahtaung 2,580 2,580
6 Pazundaung 1,040 1,040
7 Ahlone 3,290 3,290
8 Kyee Myin Daing 4,520 4,520 0
9 Sanchaung 2,390 2,390
10 Dagon 4,640 4,640
11 Bahan 7,670 6,250 1,420
12 Tarmwe 4,990 4,990
13 Mingalar Taung Nyunt 4,780 4,780
14 Seikkan 224 224
15 Dawbon 2,950 2,950
16 Kamaryut 6,380 710 5,670
17 Hlaing 9,250 9,250
18 Yankin 4,780 4,780
19 Thingangyun 12,090 12,090
20 Mayangone 22,500 14,530 7,970
21 Insein 29,050 29,050
22 Mingalardon 68,006 68,006
23 North Okkalapa 26,460 26,460
24 South Okkalapa 7,960 7,960
25 Thaketa 12,600 12,600
26 Dala 29,402 29,402
27 Seikgyikhanaungto 3,349 3,349
28 Shwe Pyi Thar 23,173 23,173
29 Hlaing Tharyar 44,264 44,264
30 North Dagon 15,077 15,077
31 South Dagon 30,959 30,959
32 East Dagon 62,125 62,125
33 Dagon Seikkan 17,960 17,960
467,648 4,900 55,380 18,880 22,890 3,349 44,264 29,050 68,006 23,173 41,537 62,125 46,509 17,960 29,402 224
34 Kyauktan 4,604 4,604
35 Thanlyin 37,313 37,313
36 Hlaegu 16,011 16,011
37 Hmawbi 16,549 16,549
38 Htantapin 11,915 11,915
39 Twantay 9,926 9,926
96,318 0 0 0 0 0 0 0 0 0 0 0 0 0 0 96,318
563,966 4,900 55,380 18,880 22,890 3,349 44,264 29,050 68,006 23,173 41,537 62,125 46,509 17,960 29,402 96,542
Out of S.Z.
YCDC Sub-total
Out of YCDC Sub-total
Total
Sewerage ZoneCode Township Infiltration


The Project for the Improvement of Water Supply, Sewerage and Drainage System in Yangon City Vol VI Sewerage and Drainage System Master Plan, Appendix
G-1
G. HOUSEHOLDS INTERVIEW SURVEY
Table G.1 Q55 Access to Toilet Facility Access to Toilet Facility
No Toilet Pit Latrine Pour-flush Toilet
Flush Toilet No Answer
Total
No. 64 1,105 8,315 584 1 10,069
% 0.6% 11.0% 82.6% 5.8% 0.0% 100.0%
Table G.2 Q56 Sanitation Treatment by Type of Water Sanitation Treatment by Type of Water
Sewerage System
Septic Tank
No Treatment
No Answer
Total
Number Black Water 938 4,344 4,786 1 10,069
Gray Water 1,359 2,705 6,001 4 10,069
% of Total
Black Water 9.3% 43.1% 47.5% 0.0% 100.0%
Gray Water 13.5% 26.9% 59.6% 0.0% 100.0%
Table G.3 Q57 Assessment on Sanitary Condition Assessment on Sanitary Condition
Very Bad Bad So-so Good Very Good No Answer Total
No. 155 1,759 1,495 6,565 93 2 10,069
% 1.5% 17.5% 14.8% 65.2% 0.9% 0.0% 100.0%
Table G.4 Q58 Frequency of Problem, for responses answered "Very Bad" or "Bad" or "So-so" in Q57
Frequency of Problem
Always Sometimes No Problem No Answer Total Number Offensive Odor (Bad Smell) 758 2,147 489 15 3,409
Pipe Clogging 346 1,250 1,795 18 3,409
Overflow of Wastewater 516 1,510 1,366 17 3,409
% of Total
Offensive Odor (Bad Smell) 22.2% 63.0% 14.3% 0.4% 100.0%
Pipe Clogging 10.1% 36.7% 52.7% 0.5% 100.0%
Overflow of Wastewater 15.1% 44.3% 40.1% 0.5% 100.0%
Table G.5 Q59 Acceptance of Black Water Use Acceptance of Black Water Use
Direct Use is Acceptable
Utilization with Composting (Appropriate Non-bacterial Treatment) is Acceptable
Hard to Accept
No Answer
Total
No. 646 6,604 2,817 2 10,069
% 6.4% 65.6% 28.0% 0.0% 100.0%
Table G.6 Q60 Willingness to Pay for Sanitation Willingness to Pay for Sanitation
Less than 500
501 ~ 1,000
1,001 ~ 2,000
2,001 ~ 3,000
3,001 ~ 5,000
5,001 ~ 7,000
More than 7,000
No Answer
Total
No. 4,378 2,687 990 585 403 65 960 1 10,069
% 43.5% 26.7% 9.8% 5.8% 4.0% 0.6% 9.5% 0.0% 100.0%

The Project for the Improvement of Water Supply, Sewerage and Drainage System in Yangon City Vol VI Sewerage and Drainage System Master Plan, Appendix
G-2
Table G.7 Q61a Access to Drainage Access to Drainage
Yes No No Answer Total
No. 8,590 1,478 1 10,069
% 85.3% 14.7% 0.0% 100.0%
Table G.8 Q61b Assessment on Drainage Control, for Responses Answered “Yes” in Q61a Assessment on Drainage Condition
Very Bad Bad So-so Good Very Good No Answer Total
No. 316 2,283 1,658 4,292 30 11 8,590
% 3.7% 26.6% 19.3% 50.0% 0.3% 0.1% 100.0%
Table G.9 Q62 Assessment on Odor of Drainage Assessment on Odor of Drainage
Very Bad Bad So-so Good Very Good No Answer Total
No. 268 2,250 1,640 5,749 42 120 10,069
% 2.7% 22.3% 16.3% 57.1% 0.4% 1.2% 100.0%
Table G.10 Q63 Frequency of Odor of Drainage, for Responses Answered "Very Bad" or "Bad" or "So-so" in Q62
Frequency of Odor of Drainage
1 Time per Month
1 Time per 3 Month
1 Time per Half Year
Every Time when It Floods
Rarely Never No Answer
Total
No. 775 162 178 2,037 970 15 21 4,158
% 18.6% 3.9% 4.3% 49.0% 23.3% 0.4% 0.5% 100.0%
Table G.11 Q64 Organization in Charge for Cleaning Organization in Charge for Cleaning
Cleaning Crew from
YCDC
Cleaning Crew Hired by Yourself
Residents in Your
Community
None No Answer
Total
No. 1,033 781 6,421 1,823 11 10,069
% 10.3% 7.8% 63.8% 18.1% 0.1% 100.0%
Table G.12 Q65 Frequency of Flooding of Drainage Frequency of Flooding of Drainage
Every Month
Every Year
Every 2 Years
Every 10 Years
More than 10 Years
Never Experienced
No Answer
Total
No. 124 4,191 234 48 47 5,422 3 10,069
% 1.2% 41.6% 2.3% 0.5% 0.5% 53.8% 0.0% 100.0%

The Project for the Improvement of Water Supply, Sewerage and Drainage System in Yangon City Vol VI Sewerage and Drainage System Master Plan, Appendix
G-3
Table G.13 Q66 Level of Flooding, Except for responses Answered "Never" in Q65
Level of Flooding
Water Level Duration of the Flood
Up to Ankles
Up to Knees
Up to Waist
More than
Waist
No Answer
Total Less than Half Day
Half Day ~ 1
Day
More than 1
~ 3 Days
More than 3
~ 5 Days
More than 6 Days
No Answer
Total
No. Normal Flooding
2,421 1,904 175 23 121 4,644 2,722 805 462 215 315 125 4,644
The most serious flooding in the past
165 363 136 43 3,937 4,644 283 170 86 35 129 3,941 4,644
% Normal Flooding
52.1% 41.0% 3.8% 0.5% 2.6%100.0% 58.6% 17.3% 9.9% 4.6% 6.8% 2.7%100.0%
The most serious flooding in the past
3.6% 7.8% 2.9% 0.9% 84.8%100.0% 6.1% 3.7% 1.9% 0.8% 2.8% 84.9%100.0%
Level of Flooding
Inundation Speed Flow Velocity
Very Fast (Within a
Few Minutes)
Fast (Within
One Hour)
Slow (Within a
Few Hours)
Very Slow
No Answer
Total VeryFast
Fast Slow Very Slow
No Answer
Total
No. Normal Flooding
692 2,791 968 70 123 4,644 469 1,696 2,023 329 127 4,644
The most serious flooding in the past
110 408 167 16 3,943 4,644 52 211 340 99 3,942 4,644
% Normal Flooding
14.9% 60.1% 20.8% 1.5% 2.6% 100.0% 10.1% 36.5% 43.6% 7.1% 2.7% 100.0%
The most serious flooding in the past
2.4% 8.8% 3.6% 0.3% 84.9% 100.0% 1.1% 4.5% 7.3% 2.1% 84.9% 100.0%
Table G.14 Q67 Willingness to Pay for Drainage Willingness to Pay for Drainage
Less than 500
501 ~ 1,000
1,001 ~ 2,000
2,001 ~ 3,000
3,001 ~ 5,000
5,001 ~ 7,000
More than 7,000
No Answer
Total
No. 4,627 2,801 936 490 277 39 898 1 10,069
% 46.0% 27.8% 9.3% 4.9% 2.8% 0.4% 8.9% 0.0% 100.0%

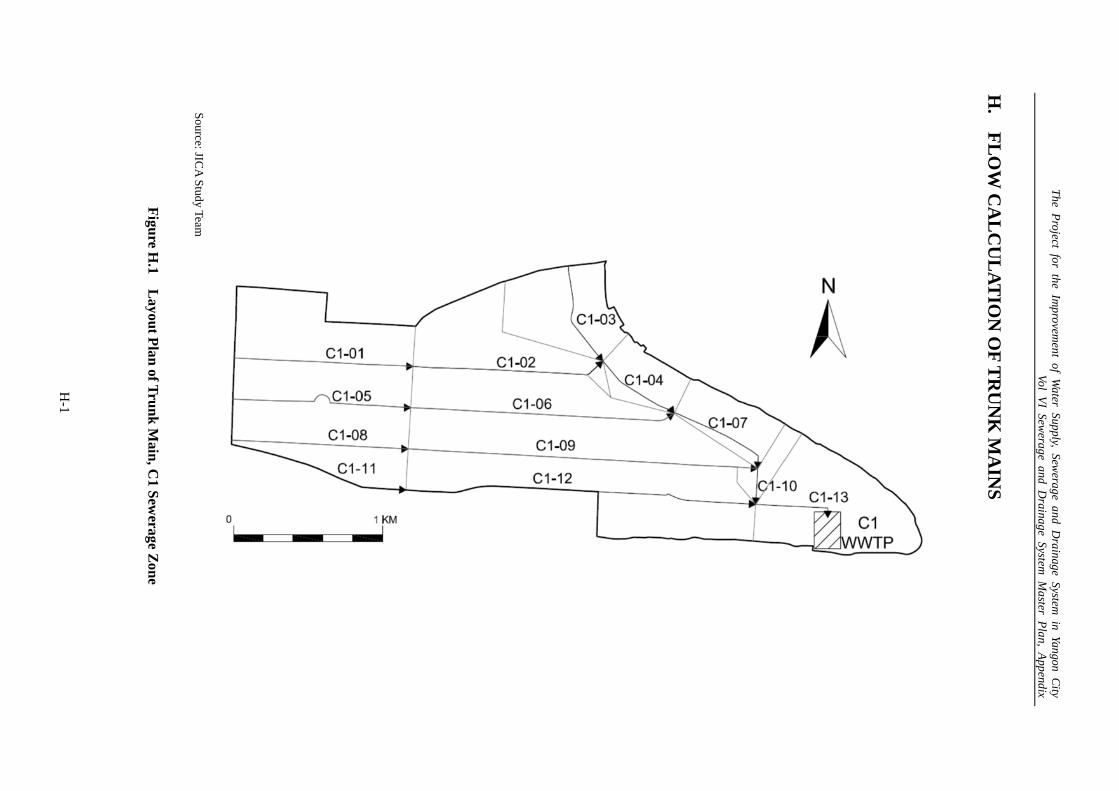
The P
roject for the Improvem
ent of Water Supply, Sew
erage and Drainage System
in Yangon City
Vol VI Sew
erage and Drainage System
Master P
lan, Appendix
H-1
H.
FL
OW
CA
LC
UL
AT
ION
OF
TR
UN
K M
AIN
S
S
ource: JICA
Study Team
Figu
re H.1 L
ayout Plan
of Tru
nk
Main
, C1 S
ewerage Z
one

The P
roject for the Improvem
ent of Water Supply, Sew
erage and Drainage System
in Yangon City
Vol VI Sew
erage and Drainage System
Master P
lan, Appendix
H-2
Table H.1 Flow Calculation of Trunk Main, C1 Sewerage Zone (1/2)

The P
roject for the Improvem
ent of Water Supply, Sew
erage and Drainage System
in Yangon City
Vol VI Sew
erage and Drainage System
Master P
lan, Appendix
H-3
Table H.1 Flow Calculation of Trunk Main, C1 Sewerage Zone (2/2)

The Project for the Improvement of Water Supply, Sewerage and Drainage System in Yangon City Vol VI Sewerage and Drainage System Master Plan, Appendix
H-4
Source: JICA Study Team
Figure H.2 Layout Plan of Trunk Main, C2+E1 Sewerage Zone
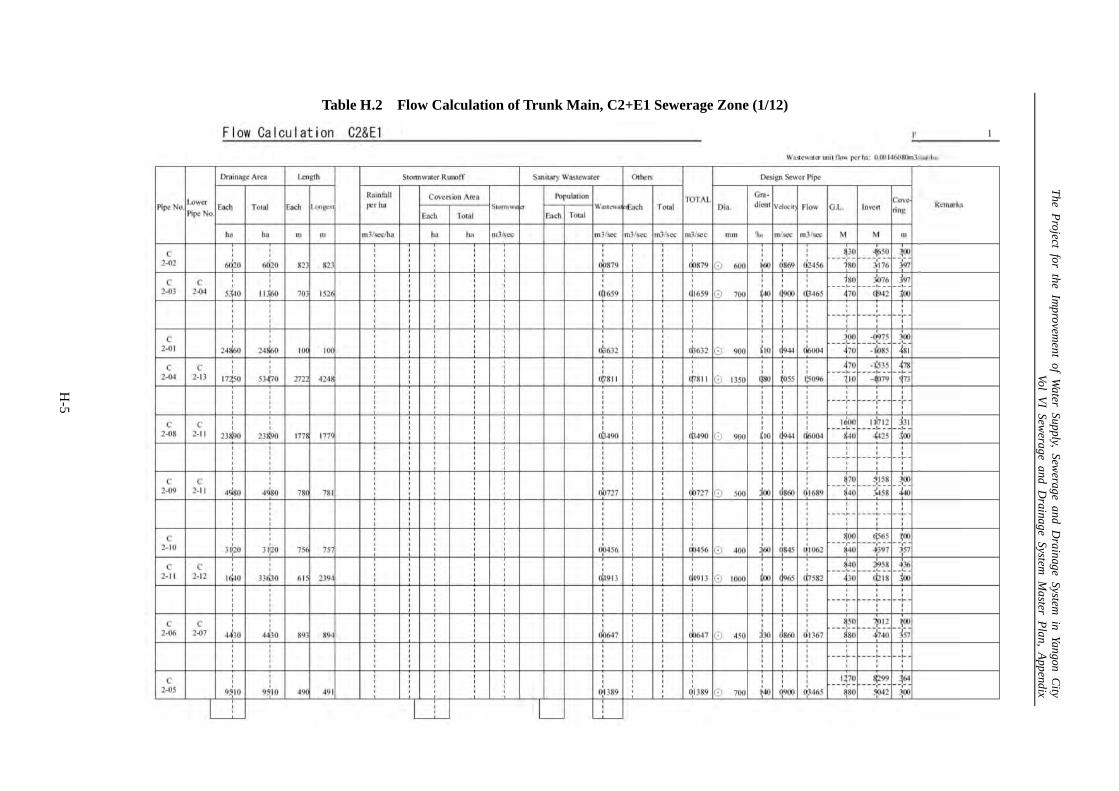
The P
roject for the Improvem
ent of Water Supply, Sew
erage and Drainage System
in Yangon City
Vol VI Sew
erage and Drainage System
Master P
lan, Appendix
H-5
Table H.2 Flow Calculation of Trunk Main, C2+E1 Sewerage Zone (1/12)

The P
roject for the Improvem
ent of Water Supply, Sew
erage and Drainage System
in Yangon City
Vol VI Sew
erage and Drainage System
Master P
lan, Appendix
H-6
Table H.2 Flow Calculation of Trunk Main, C2+E1 Sewerage Zone (2/12)

The P
roject for the Improvem
ent of Water Supply, Sew
erage and Drainage System
in Yangon City
Vol VI Sew
erage and Drainage System
Master P
lan, Appendix
H-7
Table H.2 Flow Calculation of Trunk Main, C2+E1 Sewerage Zone (3/12)

The P
roject for the Improvem
ent of Water Supply, Sew
erage and Drainage System
in Yangon City
Vol VI Sew
erage and Drainage System
Master P
lan, Appendix
H-8
Table H.2 Flow Calculation of Trunk Main, C2+E1 Sewerage Zone (4/12)

The P
roject for the Improvem
ent of Water Supply, Sew
erage and Drainage System
in Yangon City
Vol VI Sew
erage and Drainage System
Master P
lan, Appendix
H-9
Table H.2 Flow Calculation of Trunk Main, C2+E1 Sewerage Zone (5/12)

The P
roject for the Improvem
ent of Water Supply, Sew
erage and Drainage System
in Yangon City
Vol VI Sew
erage and Drainage System
Master P
lan, Appendix
H-10
Table H.2 Flow Calculation of Trunk Main, C2+E1 Sewerage Zone (6/12)

The P
roject for the Improvem
ent of Water Supply, Sew
erage and Drainage System
in Yangon City
Vol VI Sew
erage and Drainage System
Master P
lan, Appendix
H-11
Table H.2 Flow Calculation of Trunk Main, C2+E1 Sewerage Zone (7/12)

The P
roject for the Improvem
ent of Water Supply, Sew
erage and Drainage System
in Yangon City
Vol VI Sew
erage and Drainage System
Master P
lan, Appendix
H-12
Table H.2 Flow Calculation of Trunk Main, C2+E1 Sewerage Zone (8/12)
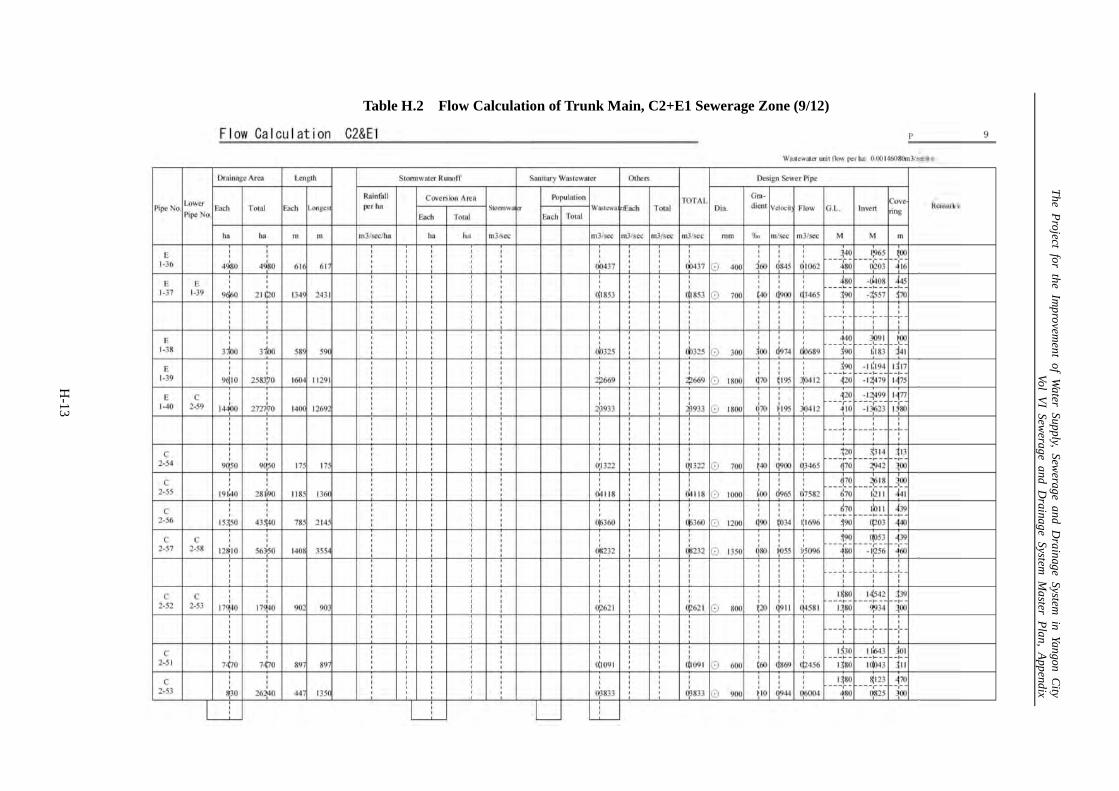
The P
roject for the Improvem
ent of Water Supply, Sew
erage and Drainage System
in Yangon City
Vol VI Sew
erage and Drainage System
Master P
lan, Appendix
H-13
Table H.2 Flow Calculation of Trunk Main, C2+E1 Sewerage Zone (9/12)

The P
roject for the Improvem
ent of Water Supply, Sew
erage and Drainage System
in Yangon City
Vol VI Sew
erage and Drainage System
Master P
lan, Appendix
H-14
Table H.2 Flow Calculation of Trunk Main, C2+E1 Sewerage Zone (10/12)

The P
roject for the Improvem
ent of Water Supply, Sew
erage and Drainage System
in Yangon City
Vol VI Sew
erage and Drainage System
Master P
lan, Appendix
H-15
Table H.2 Flow Calculation of Trunk Main, C2+E1 Sewerage Zone (11/12)
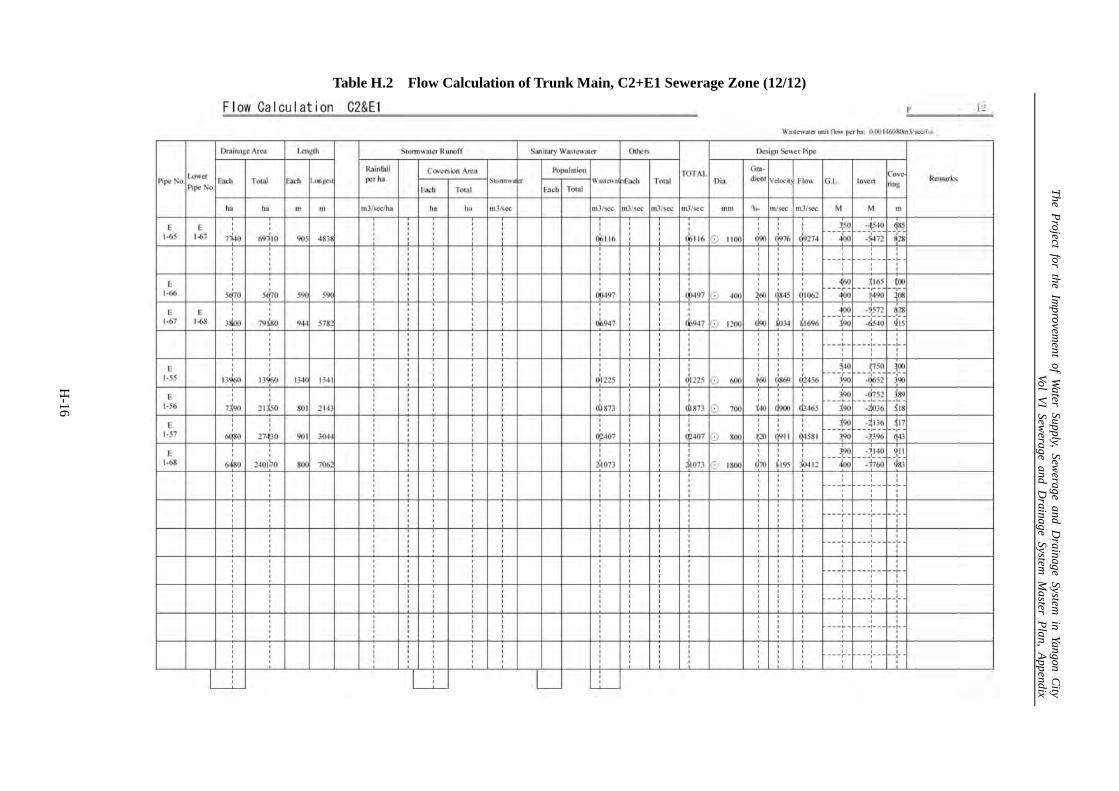
The P
roject for the Improvem
ent of Water Supply, Sew
erage and Drainage System
in Yangon City
Vol VI Sew
erage and Drainage System
Master P
lan, Appendix
H-16
Table H.2 Flow Calculation of Trunk Main, C2+E1 Sewerage Zone (12/12)

The Project for the Improvement of Water Supply, Sewerage and Drainage System in Yangon City Vol VI Sewerage and Drainage System Master Plan, Appendix
H-17
Source: JICA Study Team
Figure H.3 Layout Plan of Trunk Main, W1 Sewerage Zone

The P
roject for the Improvem
ent of Water Supply, Sew
erage and Drainage System
in Yangon City
Vol VI Sew
erage and Drainage System
Master P
lan, Appendix
H-18
Table H.3 Flow Calculation of Trunk Main, W1 Sewerage Zone (1/3)

The P
roject for the Improvem
ent of Water Supply, Sew
erage and Drainage System
in Yangon City
Vol VI Sew
erage and Drainage System
Master P
lan, Appendix
H-19
Table H.3 Flow Calculation of Trunk Main, W1 Sewerage Zone (2/3)

The P
roject for the Improvem
ent of Water Supply, Sew
erage and Drainage System
in Yangon City
Vol VI Sew
erage and Drainage System
Master P
lan, Appendix
H-20
Table H.3 Flow Calculation of Trunk Main, W1 Sewerage Zone (3/3)

The Project for the Improvement of Water Supply, Sewerage and Drainage System in Yangon City Vol VI Sewerage and Drainage System Master Plan, Appendix
H-21
Source: JICA Study Team
Figure H.4 Layout Plan of Trunk Main, W2 Sewerage Zone

The P
roject for the Improvem
ent of Water Supply, Sew
erage and Drainage System
in Yangon City
Vol VI Sew
erage and Drainage System
Master P
lan, Appendix
H-22
Table H.4 Flow Calculation of Trunk Main, W2 Sewerage Zone (1/3)

The P
roject for the Improvem
ent of Water Supply, Sew
erage and Drainage System
in Yangon City
Vol VI Sew
erage and Drainage System
Master P
lan, Appendix
H-23
Table H.4 Flow Calculation of Trunk Main, W2 Sewerage Zone (2/3)

The P
roject for the Improvem
ent of Water Supply, Sew
erage and Drainage System
in Yangon City
Vol VI Sew
erage and Drainage System
Master P
lan, Appendix
H-24
Table H.4 Flow Calculation of Trunk Main, W2 Sewerage Zone (3/3)

The Project for the Improvement of Water Supply, Sewerage and Drainage System in Yangon City Vol VI Sewerage and Drainage System Master Plan, Appendix
H-25
Source: JICA Study Team
Figure H.5 Layout Plan of Trunk Main, N1 Sewerage Zone

The P
roject for the Improvem
ent of Water Supply, Sew
erage and Drainage System
in Yangon City
Vol VI Sew
erage and Drainage System
Master P
lan, Appendix
H-26
Table H.5 Flow Calculation of Trunk Main, N1 Sewerage Zone (1/6)

The P
roject for the Improvem
ent of Water Supply, Sew
erage and Drainage System
in Yangon City
Vol VI Sew
erage and Drainage System
Master P
lan, Appendix
H-27
Table H.5 Flow Calculation of Trunk Main, N1 Sewerage Zone (2/6)

The P
roject for the Improvem
ent of Water Supply, Sew
erage and Drainage System
in Yangon City
Vol VI Sew
erage and Drainage System
Master P
lan, Appendix
H-28
Table H.5 Flow Calculation of Trunk Main, N1 Sewerage Zone (3/6)

The P
roject for the Improvem
ent of Water Supply, Sew
erage and Drainage System
in Yangon City
Vol VI Sew
erage and Drainage System
Master P
lan, Appendix
H-29
Table H.5 Flow Calculation of Trunk Main, N1 Sewerage Zone (4/6)

The P
roject for the Improvem
ent of Water Supply, Sew
erage and Drainage System
in Yangon City
Vol VI Sew
erage and Drainage System
Master P
lan, Appendix
H-30
Table H.5 Flow Calculation of Trunk Main, N1 Sewerage Zone (5/6)

The P
roject for the Improvem
ent of Water Supply, Sew
erage and Drainage System
in Yangon City
Vol VI Sew
erage and Drainage System
Master P
lan, Appendix
H-31
Table H.5 Flow Calculation of Trunk Main, N1 Sewerage Zone (6/6)
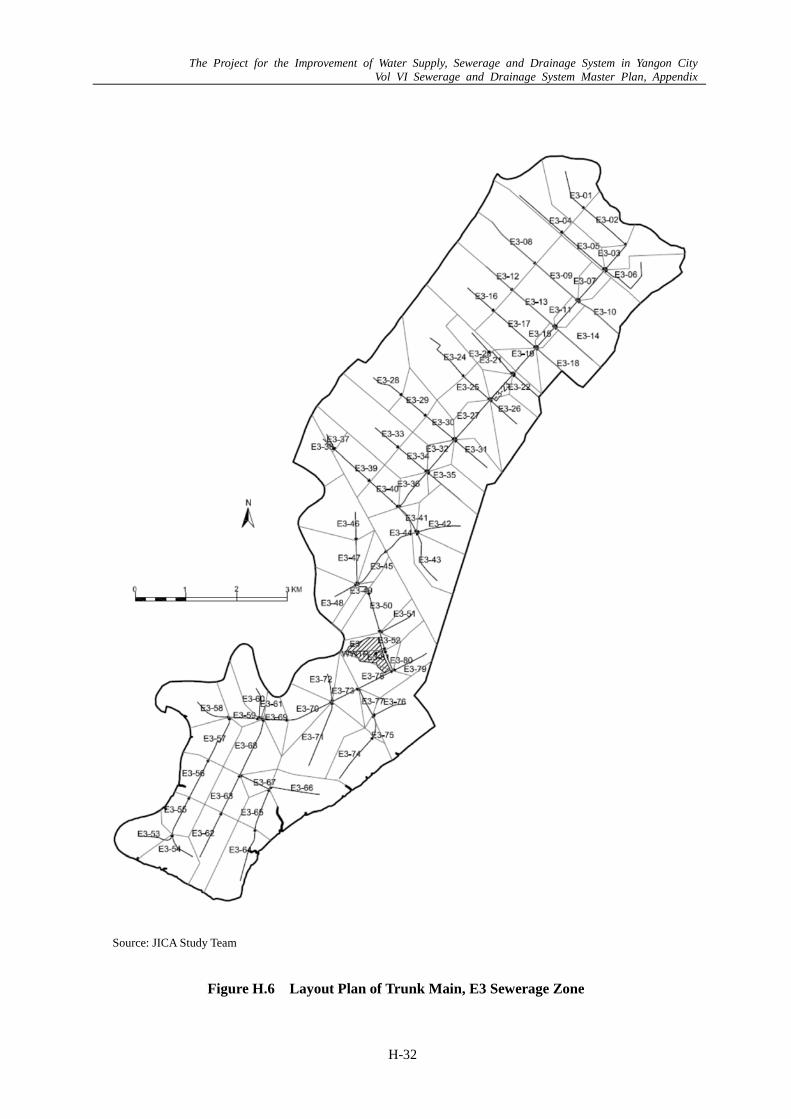
The Project for the Improvement of Water Supply, Sewerage and Drainage System in Yangon City Vol VI Sewerage and Drainage System Master Plan, Appendix
H-32
Source: JICA Study Team
Figure H.6 Layout Plan of Trunk Main, E3 Sewerage Zone

The P
roject for the Improvem
ent of Water Supply, Sew
erage and Drainage System
in Yangon City
Vol VI Sew
erage and Drainage System
Master P
lan, Appendix
H-33
Table H.6 Flow Calculation of Trunk Main, E3 Sewerage Zone (1/8)
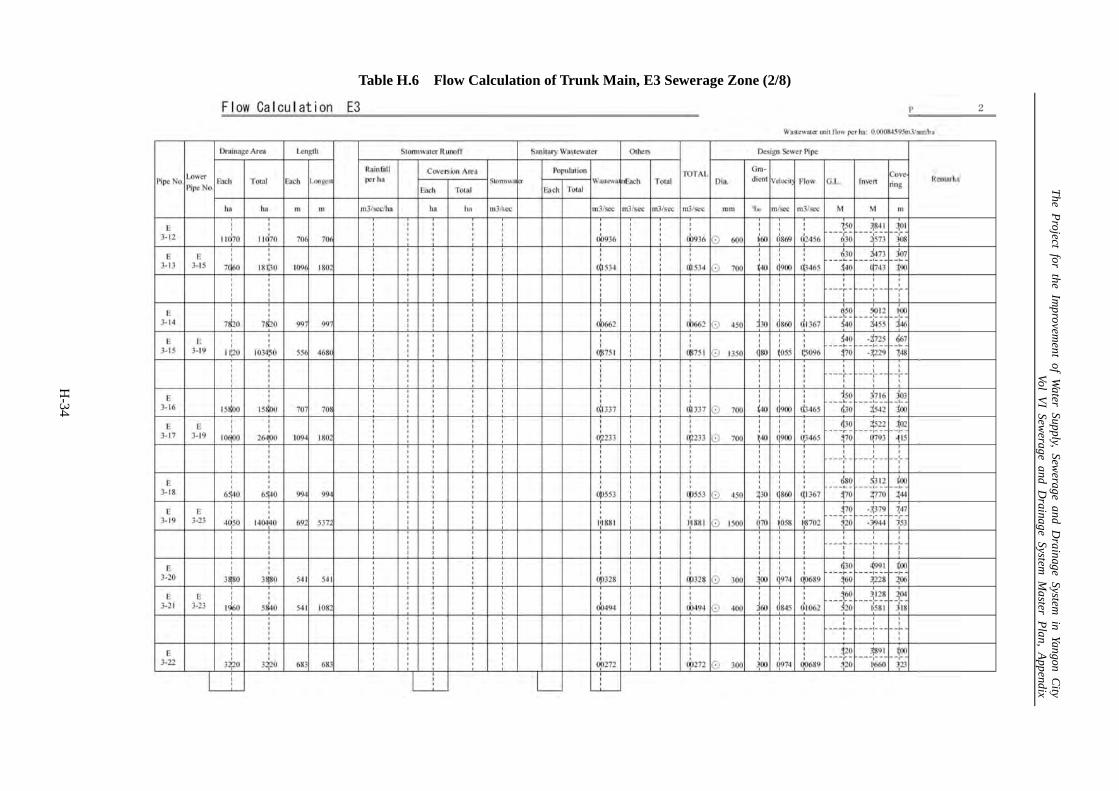
The P
roject for the Improvem
ent of Water Supply, Sew
erage and Drainage System
in Yangon City
Vol VI Sew
erage and Drainage System
Master P
lan, Appendix
H-34
Table H.6 Flow Calculation of Trunk Main, E3 Sewerage Zone (2/8)

The P
roject for the Improvem
ent of Water Supply, Sew
erage and Drainage System
in Yangon City
Vol VI Sew
erage and Drainage System
Master P
lan, Appendix
H-35
Table H.6 Flow Calculation of Trunk Main, E3 Sewerage Zone (3/8)

The P
roject for the Improvem
ent of Water Supply, Sew
erage and Drainage System
in Yangon City
Vol VI Sew
erage and Drainage System
Master P
lan, Appendix
H-36
Table H.6 Flow Calculation of Trunk Main, E3 Sewerage Zone (4/8)

The P
roject for the Improvem
ent of Water Supply, Sew
erage and Drainage System
in Yangon City
Vol VI Sew
erage and Drainage System
Master P
lan, Appendix
H-37
Table H.6 Flow Calculation of Trunk Main, E3 Sewerage Zone (5/8)

The P
roject for the Improvem
ent of Water Supply, Sew
erage and Drainage System
in Yangon City
Vol VI Sew
erage and Drainage System
Master P
lan, Appendix
H-38
Table H.6 Flow Calculation of Trunk Main, E3 Sewerage Zone (6/8)

The P
roject for the Improvem
ent of Water Supply, Sew
erage and Drainage System
in Yangon City
Vol VI Sew
erage and Drainage System
Master P
lan, Appendix
H-39
Table H.6 Flow Calculation of Trunk Main, E3 Sewerage Zone (7/8)

The P
roject for the Improvem
ent of Water Supply, Sew
erage and Drainage System
in Yangon City
Vol VI Sew
erage and Drainage System
Master P
lan, Appendix
H-40
Table H.6 Flow Calculation of Trunk Main, E3 Sewerage Zone (8/8)

The Project for the Improvement of Water Supply, Sewerage and Drainage System in Yangon City Vol VI Sewerage and Drainage System Master Plan, Appendix
I-1
I. DESIGN CALCULATION OF WWTP
Table I.1 Design Calculation of C1 WWTP (1/16)

The Project for the Improvement of Water Supply, Sewerage and Drainage System in Yangon City Vol VI Sewerage and Drainage System Master Plan, Appendix
I-2
Table I.1 Design Calculation of C1 WWTP (2/16)
1-3 Design Sewage Flow
(Year 2020)
(Year 2040)
1-4 Design Sewage Quality
1-5 Process Flow Diagram
Raw sludge
Return sludge
Waste Sludge
Primary SedimentationTank
Aeration Tank
0
Influent
Screen and Grit Chamber
m3/day
0.0m3/hr
Lift Pump Station
m3/hr
0.0
(mg/l) (mg/l) (mg/l)Item
BOD SS
m3/min
m3/secm3/min
m3/sec
0.000.00 0.000
0.000
1.19170,200102,900 4,287.5 71.46
2,925.0 48.75 0.813
T-N
Influent 200 -Effluent
18030 -20
Effluent to the river
Gravity ThickenerFinal Sedimentation
Tank
Disinfection Channel
Disposal site (Land Fill)and/or Reuse (Future)
Mixed Sludge Tank
Sludge Dewatering
Oil&Greese
(mg/l)-5
Coli-group
(MPN/cm3)
-3,000
Maximum Hourly Flow
ItemMaximum Daily Flow
Maximum Hourly Flow
ItemMaximum Daily Flow
m3/day

The Project for the Improvement of Water Supply, Sewerage and Drainage System in Yangon City Vol VI Sewerage and Drainage System Master Plan, Appendix
I-3
Table I.1 Design Calculation of C1 WWTP (3/16)
1.6 Design Criteria
ITEMS UNIT Formula or Value Application
1 Grit Chamber (For Maximum Hourly Flow)
(1) Hydraulic Load m3/m2/day 1,800 1,800
(2) Average Velocity m/sec 0.3 0.3
2 Primary Sedimentation Tank (For Maximum Daily Flow)
(1) Hydraulic Load m3/m2/day 35.0-70.0 50
(2) Settling Time (Ref.) hour 1.5 1.5
(3) Water Depth m 2.5-4.0 3.5
(4) Weir Loading m3/m/day 250 250
3 Aeration Tank (For Maximum Daily Flow)
(1) Hydraulic Retention Time (HRT) hour 6 - 8 6.0
(2) MLSS Concentration mg/l 1,500 -2,000 2,000
(3) BOD-SS Load (Reference only) kg/kg/day 0.2 - 0.4 -
4 Final Sedimentation Tank (For Maximum Daily Flow)
(1) Hydraulic Load m3/m2/day 20.0-30.0 25
(2) Settling Time (Ref.) hour 3.0-4.0 -
(3) Water Depth m 2.5-4.0 3.5
(4) Weir Loading m3/m/day 150 150
5 Disinfection Tank (For Maximum Daily Flow)
(1) Retention (Chlorination) Time min 15 15
6 Gravity Thickener (For Maximum Daily Flow)
(1) Solids Loading kg/m2/day 60-90 75
(2) Water Depth m 4.0
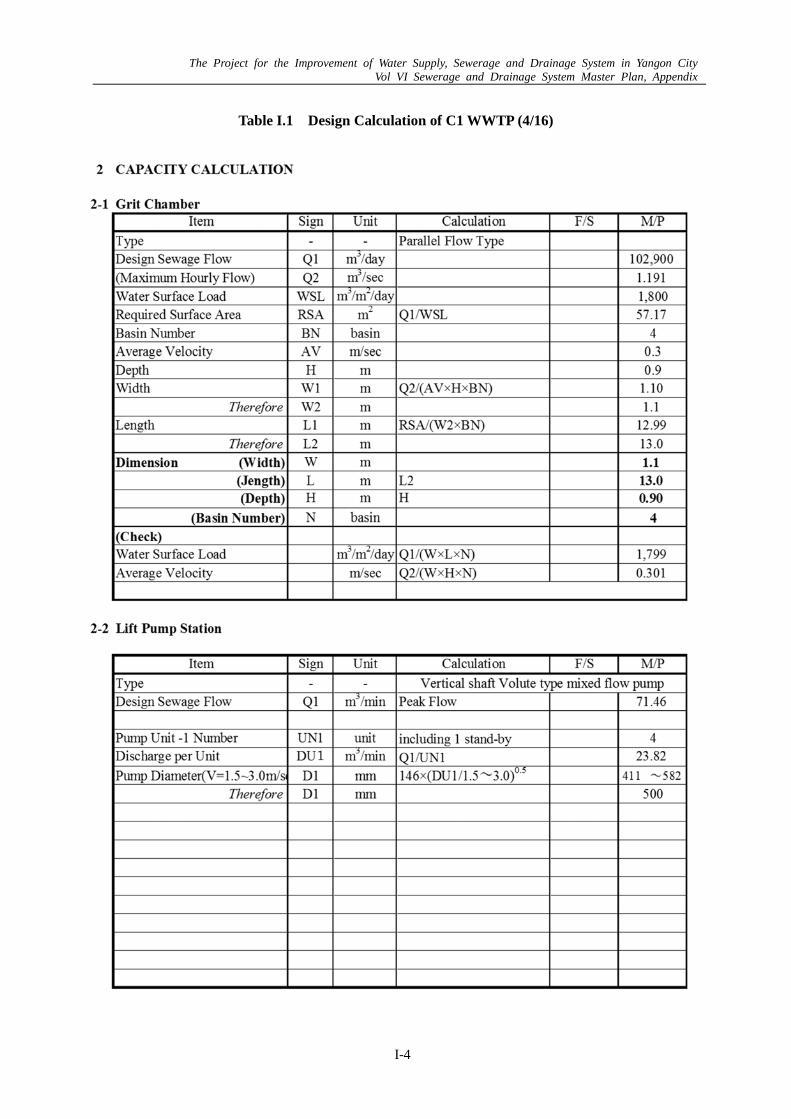
The Project for the Improvement of Water Supply, Sewerage and Drainage System in Yangon City Vol VI Sewerage and Drainage System Master Plan, Appendix
I-4
Table I.1 Design Calculation of C1 WWTP (4/16)

The Project for the Improvement of Water Supply, Sewerage and Drainage System in Yangon City Vol VI Sewerage and Drainage System Master Plan, Appendix
I-5
Table I.1 Design Calculation of C1 WWTP (5/16)
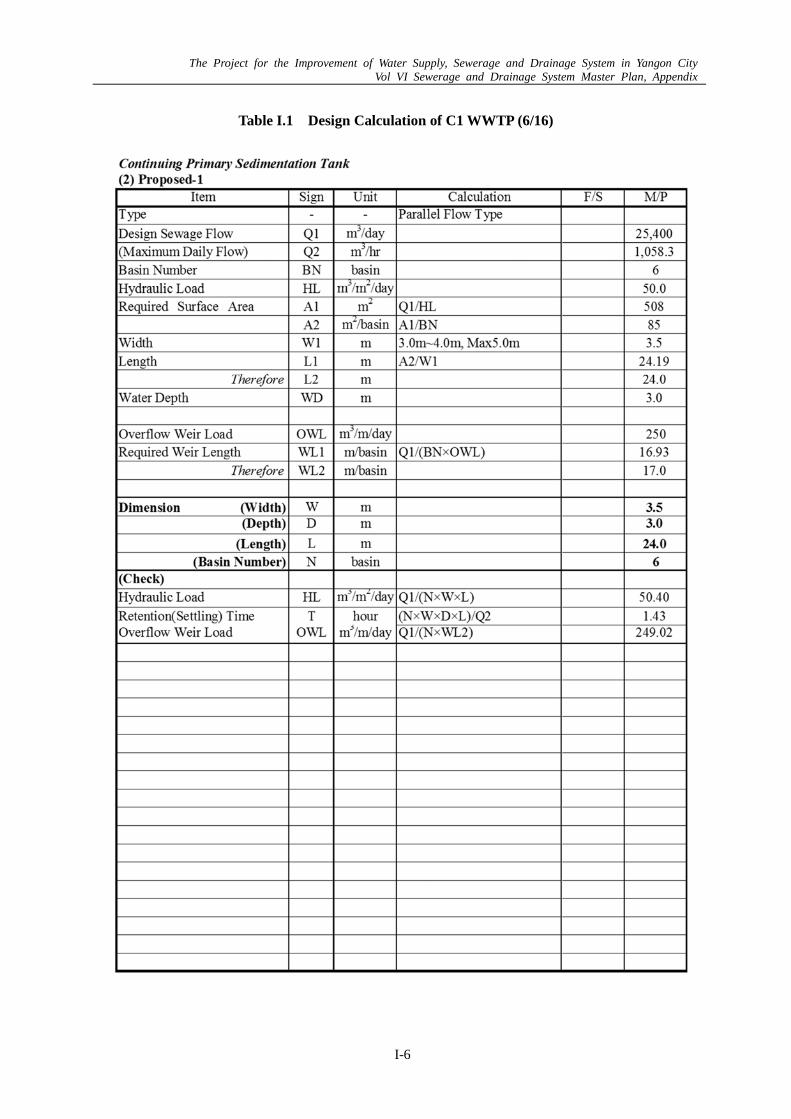
The Project for the Improvement of Water Supply, Sewerage and Drainage System in Yangon City Vol VI Sewerage and Drainage System Master Plan, Appendix
I-6
Table I.1 Design Calculation of C1 WWTP (6/16)

The Project for the Improvement of Water Supply, Sewerage and Drainage System in Yangon City Vol VI Sewerage and Drainage System Master Plan, Appendix
I-7
Table I.1 Design Calculation of C1 WWTP (7/16)

The Project for the Improvement of Water Supply, Sewerage and Drainage System in Yangon City Vol VI Sewerage and Drainage System Master Plan, Appendix
I-8
Table I.1 Design Calculation of C1 WWTP (8/16)

The Project for the Improvement of Water Supply, Sewerage and Drainage System in Yangon City Vol VI Sewerage and Drainage System Master Plan, Appendix
I-9
Table I.1 Design Calculation of C1 WWTP (9/16)

The Project for the Improvement of Water Supply, Sewerage and Drainage System in Yangon City Vol VI Sewerage and Drainage System Master Plan, Appendix
I-10
Table I.1 Design Calculation of C1 WWTP (10/16)

The Project for the Improvement of Water Supply, Sewerage and Drainage System in Yangon City Vol VI Sewerage and Drainage System Master Plan, Appendix
I-11
Table I.1 Design Calculation of C1 WWTP (11/16)

The Project for the Improvement of Water Supply, Sewerage and Drainage System in Yangon City Vol VI Sewerage and Drainage System Master Plan, Appendix
I-12
Table I.1 Design Calculation of C1 WWTP (12/16)

The Project for the Improvement of Water Supply, Sewerage and Drainage System in Yangon City Vol VI Sewerage and Drainage System Master Plan, Appendix
I-13
Table I.1 Design Calculation of C1 WWTP (13/16)

The Project for the Improvement of Water Supply, Sewerage and Drainage System in Yangon City Vol VI Sewerage and Drainage System Master Plan, Appendix
I-14
Table I.1 Design Calculation of C1 WWTP (14/16)

The P
roject for the Improvem
ent of Water Supply, Sew
erage and Drainage System
in Yangon City
Vol VI Sew
erage and Drainage System
Master P
lan, Appendix
I-15
Table I.1 Design Calculation of C1 WWTP (15/16)

The P
roject for the Improvem
ent of Water Supply, Sew
erage and Drainage System
in Yangon City
Vol VI Sew
erage and Drainage System
Master P
lan, Appendix
I-16
Material Balance Sheet
0:Inlet 1:Inlet to Primary Tank 3:Inlet to Secondary Tank 5-1:Effluent-1
Q0( m3/D ) 70,200 Q1( m3/D ) 71,705 Q3( m3/D ) 71,224 Q5( m3/D ) 70,202 Q5-1( m3/D ) 70,147
T0(t・DS/D) 12.636 T1(t・DS/D) 14.428 T3(t・DS/D) 7.214 T5(t・DS/D) 2.106 T5-1(t・DS/D) 1.995
S0( mg/l ) 180 S1( mg/l ) 201 S3( mg/l ) 101 S5( mg/l ) 30 S5-1( mg/l ) 30
X1 ( % ) 114.2 X3 ( % ) 57.1 X5 ( % ) 16.7 X5-1 ( % ) 15.8
Primary Sedimentation Secondary Tank ・Outlet
(SS Removal : %)
8:Water for Chemical
2:Primary Sludge 4:Excess Sludge Q8( m3/D ) 55
Q2( m3/D ) 481 Q4( m3/D ) 1,022 T8(t・DS/D) 0.111
T2(t・DS/D) 7.214 T4(t・DS/D) 5.108 S8( mg/l ) 2,000
S2( mg/l ) 15,000 S4( mg/l ) 5,000 X8 ( % ) 0.9
X2 ( % ) 57.1 X4 ( % ) 40.4
12:Total Supernatants
Q12( m3/D ) 1,505 * Sludge to Thickener
T12(t・DS/D) 1.792 Q( m3/D ) 1,503 Thickening Tank Chemical Dosage Dewatering
S12( mg/l ) 1,191 T(t・DS/D) 12.322 ・Carry Out X12 ( % ) 14.2 S( mg/l ) 8,201 (SS Recovery : %) (SS Recovery : %)
6:Thickened Sludge 9:Sludge with Chemical
Q6( m3/D ) 554 Q9( m3/D ) 610 10:Sludge Cake
T6(t・DS/D) 11.090 T9(t・DS/D) 11.201 Q10( m3/D ) 53
S6( mg/l ) 20,000 S9( mg/l ) 18,364 T10(t・DS/D) 10.641
X6 ( % ) 87.8 X9 ( % ) 88.6 S10( mg/l ) 200,000
X10 ( % ) 84.2
7:Thickener Supernatant 11:Dewatering Supernatant
Q7( m3/D ) 948 Q11( m3/D ) 557
T7(t・DS/D) 1.232 T11(t・DS/D) 0.560
S7( mg/l ) 1,300 S11( mg/l ) 1,006
X7 ( % ) 9.8 X11 ( % ) 4.4
LEGENDQ:Water Flow : (m3/day)
T:Solid Matter : (t・DS/day)
S:Solid Concentration : (mg/l)
X:Ratio for Inlet Solid : (%)
・ Water
・ Sludge
・ Supernatant
Tank
5:Outlet from Secondary Tank
Table I.1 Design Calculation of C1 WWTP (16/16)