appendix k - gov.mb.ca · appendix k air quality impact assessment ... 2.5 cooling tower (sacti)...
TRANSCRIPT
APPENDIX K
Air Quality Impact AssessmentBrandon Generating Station
Licence Review
Prepared for:
Manitoba Hydro820 Taylor Avenue
Winnipeg, MB R3C 2P4
Prepared by:
SENES Consultants Limited1338 West Broadway, Suite 303
Vancouver, B.C. V6H 1H2
20 June 2006
Brandon Generating Station Licence ReviewAir Quality Impact Assessment
38106 – 20 June 2006 i SENES Consultants Limited
TABLE OF CONTENTSPage No.
EXECUTIVE SUMMARY .........................................................................................................1
1.0 INTRODUCTION.........................................................................................................101.1 Historical Operations..............................................................................................11
2.0 MODELLING METHODOLOGY ................................................................................132.1 Model Descriptions ................................................................................................14
2.1.1 CALPUFF Model ...................................................................................142.1.2 ISCST3 Model .......................................................................................152.1.3 SACTI Model.........................................................................................16
2.2 CALMET Meteorological Model ...........................................................................162.2.1 Modelling Domain for CALMET ...........................................................172.2.2 Meteorology...........................................................................................172.2.3 Terrain....................................................................................................202.2.4 Land Use Categories...............................................................................212.2.5 CALMET Configuration.........................................................................23
2.3 CALPUFF Model...................................................................................................232.3.1 Discrete Receptors..................................................................................242.3.2 Unit #5 Stack Parameters........................................................................262.3.3 Combustion Turbines (CTs) ...................................................................27
2.4 ISCST3 Modelling .................................................................................................282.5 Cooling Tower (SACTI) Modelling........................................................................29
2.5.1 Plume Parameters ...................................................................................30
3.0 EMISSIONS DATA......................................................................................................323.1 Unit #5 Fuel Delivery System Description..............................................................333.2 Description of Operating Scenarios Modelled.........................................................353.2 Description of Operating Scenarios Modelled.........................................................363.3 Coal Quality ...........................................................................................................373.4 Estimated Contaminant Emissions..........................................................................43
3.4.1 Common Air Contaminants ....................................................................433.4.2 Trace Contaminants................................................................................443.4.3 Volatile Organic Compounds (VOCs) ....................................................473.4.4 Greenhouse Gases (GHGs) .....................................................................48
3.5 Fugitive Dust Emissions.........................................................................................493.5.1 Coal Handling and Storage .....................................................................493.5.2 Ash Lagoon............................................................................................523.5.3 Particle Size Distributions for Particulate Matter ....................................533.5.4 Chemical Composition of Fugitive Dust Emissions ................................54
3.6 Water Vapour Emissions ........................................................................................573.7 Combustion Turbines .............................................................................................57
4.0 EXISTING AIR QUALITY...........................................................................................59
Brandon Generating Station Licence ReviewAir Quality Impact Assessment
38106 – 20 June 2006 ii SENES Consultants Limited
5.0 PREDICTED AIR QUALITY .......................................................................................635.1 Ambient Air Quality Criteria ..................................................................................655.2 Ambient Concentrations due to Unit #5 Emissions .................................................67
5.2.1 Common Air Contaminants ....................................................................755.2.2 Volatile Organic Compounds (VOCs) ....................................................975.2.3 Trace Inorganics.....................................................................................985.2.4 Trace Organics .......................................................................................99
5.3 Deposition due to Unit #5 Emissions ....................................................................1015.3.1 Trace Inorganic Elements and Organic Compounds..............................1015.3.2 Mercury................................................................................................104
5.4 Fugitive Dust Emissions from Coal Storage Pile and Ash Lagoon ........................1065.4 Fugitive Dust Emissions from Coal Storage Pile and Ash Lagoon ........................107
5.4.1 Fugitive Dust Concentrations................................................................1075.4.2 Fugitive Dust Deposition ......................................................................115
5.5 Cooling Tower Emissions.....................................................................................1175.5.1 Fogging and Icing.................................................................................1175.5.2 Visible Plumes .....................................................................................1175.5.3 Water and Salt Deposition ....................................................................1205.5.3 Water and Salt Deposition ....................................................................121
5.6 Combustion Turbine (CT) Emissions....................................................................1245.6.1 Air Quality due to CT Emissions ..........................................................1245.6.2 CT Emissions Combined with Unit #5 Emissions .................................132
6.0 CONCLUSIONS.........................................................................................................1366.1 Nitrogen Dioxide..................................................................................................137
6.1.1 1-hour Average NO2 Concentrations.....................................................1376.1.2 24-Hour Average NO2 Concentrations..................................................1396.1.3 Annual Average NO2 Concentrations ...................................................139
6.2 Sulphur Dioxide ...................................................................................................1396.2.1 1-hour Average SO2 Concentrations .....................................................1396.2.2 24-hour Average SO2 Concentrations ...................................................1406.2.3 Annual Average SO2 Concentrations ....................................................140
6.3 Carbon Monoxide.................................................................................................1406.4 Particulate Matter .................................................................................................141
6.4.1 PM2.5 Concentrations ............................................................................1416.4.2 PM10 Concentrations ............................................................................1416.4.3 SPM Concentrations .............................................................................142
6.5 Trace Contaminants..............................................................................................1436.5.1 Mercury................................................................................................1436.5.2 Other Trace Elements and Compounds .................................................143
6.6 Greenhouse Gases ................................................................................................1436.7 Cooling Tower Emissions.....................................................................................144
REFERENCES .......................................................................................................................145
Brandon Generating Station Licence ReviewAir Quality Impact Assessment
38106 – 20 June 2006 iii SENES Consultants Limited
ATTACHMENT A: Sample CALMET Control File ..............................................................150ATTACHMENT B: Sample CALPUFF Control File .............................................................168ATTACHMENT C: Predicted COPC Concentrations and Depositions for OS1 and OS3 .......218
LIST OF TABLESPage No.
1.1 Annual Power Generation at Brandon G.S. ....................................................................112.1 Vertical Layers Used in CALMET Meteorological Modelling .......................................182.2 CALMET Land Use Categories.....................................................................................222.3 CALMET Model Configuration.....................................................................................232.4 CALPUFF Model Configuration....................................................................................242.5 Discrete Receptor Coordinates.......................................................................................242.6 Modelled Stack Parameters used for Brandon G.S. Unit #5............................................262.7 Mercury Deposition Parameters used in CALPUFF Modelling ......................................272.8 Modelled Stack Parameters used for Brandon G.S. Combustion Turbines......................282.9 Source Characteristics for Fugitive Dust Emissions .......................................................293.1 Definition of Operational Scenarios Considered in the Air Quality
Modelling Analysis .......................................................................................................373.2 Coal Quality Data- Proximate Analysis .........................................................................403.3 Coal Quality Data – Trace Element Concentrations (mg/kg) ..........................................413.4 Ratios of Coal Constituent Emissions Relative to Spring Creek Coal.............................423.5 Emission Rates for Common Air Contaminants and Mercury ........................................443.6 Estimated Emission Rates of Hydrogen Chloride and Hydrogen Fluoride ......................453.7 Estimated Emission Rates for Trace Inorganic Elements................................................453.8 Estimated Emission Rates for Polycyclic Aromatic Hydrocarbons (PAH)......................463.9 Estimated Emission Rates for Polychlorinated Dibenzo-p-Dioxins (PCDD) and
Polychlorinated Dibenzofurans (PCDF).........................................................................473.10 VOC Emission Factors and Estimated Emission Rates...................................................473.11 Estimated Emission Rates for Greenhouse Gases...........................................................483.12 Assumptions Used to Characterize Fugitive Dust Emissions Due to Coal Handling
and Storage....................................................................................................................513.13 Emission Equations used for Estimating Emissions Due to Coal Handling
and Storage....................................................................................................................513.14 Coal Particle Size Distribution Used for ISCST3 Dispersion Modelling.........................533.15 Alternative Cumulative Size Distributions for Fugitive Dust Emissions
from Ash Lagoon...........................................................................................................543.16 Chemical Composition of Coal Stock and Ash Waste ....................................................553.17 Maximum Emission Rates of Common Air Contaminants for CTs ................................57
Brandon Generating Station Licence ReviewAir Quality Impact Assessment
38106 – 20 June 2006 iv SENES Consultants Limited
3.18 CT Stack Test Measured Emission Rates .......................................................................574.1 Ambient Air Quality Levels in Brandon.........................................................................594.2 Measured CO Concentrations ( g/m3) in Winnipeg .......................................................604.3 Mean Concentrations (ng/m3) of Trace Organic Compounds Measured
in Winnipeg (1995-1996)...............................................................................................614.4 Mean Concentrations ( g/m3) of Selected Volatile Organic Compounds (VOCs)
Measured in Winnipeg (1995-1996) ..............................................................................614.5 Maximum and Mean Concentrations ( g/m3) of Selected Trace Elements
Measured in Winnipeg (2004) .......................................................................................625.1 Manitoba Ambient Air Quality Criteria .........................................................................665.2 Selected Ambient Air Quality Criteria from Other Jurisdictions.....................................675.3 Maximum Ground-level Concentrations at Maximum Point of Impingement.................695.4a Maximum Incremental Concentrations ( g/m3) of CACs Due to Unit #5 Emissions
with Relevant Ambient Air Quality Criteria in Manitoba ...............................................735.4b Maximum Incremental Concentrations ( g/m3) of Inorganic and Organic Compounds
Due to Unit #5 Emissions with Relevant Ambient Air Quality Criteria ..........................745.5 NO/NO2 Conversion Rates by Distance from the Brandon G.S. Stack ...........................775.6 Comparison of Maximum NO2 Concentrations Using Different Prediction
Methodologies...............................................................................................................785.7 Frequency Distribution of Maximum Predicted NO2 Concentrations
Due to Unit #5 Emissions ..............................................................................................795.8 Comparison Between Predicted Concentrations of Selected Trace Organics in Brandon
and Observed Concentrations in Estevan, SK...............................................................1015.9 Annual Average Deposition for Current and Future Coal Supplies...............................1025.10 Maximum Annual Mercury Deposition Rates ( g/m3) .................................................1055.11 Maximum Annual Mercury Deposition Rates ( g/m3) at Sensitive Receptor Locations1055.12 Maximum Off-site Air Concentrations ( g/m3) of Particulate Matter
due to Fugitive Dust Emissions....................................................................................1075.13 Maximum Annual Deposition of Trace Elements due to Coal Handling.......................1155.14 Maximum Annual Deposition of Trace Elements and Compounds due to Fugitive
Emissions from the Ash Lagoon ..................................................................................1165.15 Maximum Predicted Short-term Concentrations from CT Operations ..........................1245.16 Maximum Predicted Short-term Concentrations with Combined Unit #5
and CT Operations.......................................................................................................1325.17 Frequency Distribution of Maximum Predicted NO2 Concentrations due to
Combined Emissions from Unit #5 and CTs ................................................................133
Brandon Generating Station Licence ReviewAir Quality Impact Assessment
38106 – 20 June 2006 v SENES Consultants Limited
LIST OF FIGURESPage No.
1.1 Brandon, MB and Surrounding Area..............................................................................122.1 CALMET Surface (10m) Winds at Brandon Airport......................................................192.2 CALMET Layer 5 (150m) Winds at Brandon Airport....................................................192.3 CALMET Terrain..........................................................................................................202.4 CALMET Land Use Categories.....................................................................................212.5 Location of Discrete Receptors used in CALPUFF Modelling .......................................252.6 Characteristics of a Cooling Tower Plume .....................................................................313.1 Schematic Diagram of Unit #5 Boiler ............................................................................353.2 Maximum Range of Potential Increased/Decreased Emissions For Alternative
Coals Relative to Spring Creek Coal..............................................................................435.1 Locations of Maximum Predicted Point of Impingement (POI) Pollutant
Concentrations Due to Unit #5 and Fugitive Dust Emissions .........................................685.2 Maximum Predicted Incremental 1-hour NO2 Concentrations ( g/m3) due to
Unit #5 Emissions using 100% Conversion of NO to NO2 at Stack Top.........................805.3 Maximum Predicted Incremental 1-hour NO2 Concentrations ( g/m3) due to Unit #5
Emissions using Janssen Method Conversion Rates of NO to NO2 ................................815.4 Maximum Predicted Incremental 1-hour NO2 Concentrations ( g/m3) due to
Unit #5 Emissions using 100% Conversion of NO to NO2 at Stack Top.........................825.5 Maximum Predicted Incremental 1-hour NO2 Concentrations ( g/m3) due to
Unit #5 Emissions using Janssen Method Conversion Rates of NO to NO2 ...................835.6 Maximum Predicted Incremental 24-hour NO2 Concentrations ( g/m3) due to
Unit #5 Emissions using 100% Conversion of NO to NO2 ............................................845.7 Maximum Predicted Incremental 24-hour NO2 Concentrations ( g/m3) due to
Unit #5 Emissions using Janssen Method Conversion Rates of NO to NO2 ...................855.8 Maximum Predicted Incremental 24-hour NO2 Concentrations ( g/m3) due to
Unit #5 Emissions using 100% Conversion of NO to NO2 ............................................865.9 Maximum Predicted Incremental 24-hour NO2 Concentrations ( g/m3) due to
Unit #5 Emissions using Janssen Method Conversion Rates of NO to NO2 ...................875.10 Maximum Predicted Incremental Annual Average NO2 Concentrations ( g/m3)
due to Unit #5 Emissions using 100% Conversion Method of NO to NO2 .....................885.11 Maximum Predicted Incremental 1-hour Average SO2 Concentrations ( g/m3)
due to Unit #5 Emissions ...............................................................................................905.12 Maximum Predicted Incremental 24-hour Average SO2 Concentrations ( g/m3)
due to Unit #5 Emissions ...............................................................................................915.13 Maximum Predicted Incremental Annual Average SO2 Concentrations ( g/m3)
due to Unit #5 Emissions ...............................................................................................925.14 Maximum Predicted Incremental 24-hour Average PM10 Concentrations ( g/m3)
Brandon Generating Station Licence ReviewAir Quality Impact Assessment
38106 – 20 June 2006 vi SENES Consultants Limited
due to Unit #5 Emissions ...............................................................................................955.15 Maximum Predicted Incremental 24-hour Average PM2.5 Concentrations ( g/m3)
due to Unit #5 Emissions ...............................................................................................965.16 Maximum Predicted Incremental Mean Annual VOC Concentrations ( g/m3)
from Brandon G.S. versus Annual Mean Observed Levels in Downtown Winnipeg.......975.17 Maximum Predicted Incremental Mean Annual Trace Element Concentrations
g/m3) from Brandon G.S. versus Annual Mean Observed Levels in Winnipeg............985.18 Maximum Predicted Incremental Mean Annual PAH Concentrations ( g/m3)
from Brandon G.S. versus Annual Mean Observed Levels in Downtown Winnipeg.......995.19 Maximum Predicted Incremental Mean Annual Dioxin/Furan Concentrations ( g/m3)
from Brandon G.S. Versus Annual Mean Observed Levels in Downtown Winnipeg....1005.20 Maximum Annual Average Mercury Deposition Rate ( g/m3).....................................1065.21 Maximum 24-hour Average SPM Concentrations ( g/m3)
due to Coal Dust Emissions .........................................................................................1095.22 Maximum 24-hour Average PM10 Concentrations ( g/m3)
due to Coal Dust Emissions .........................................................................................1105.23 Maximum 24-hour Average PM2.5 Concentrations ( g/m3)
due to Coal Dust Emissions .........................................................................................1115.24 Maximum 24-hour Average Fugitive SPM Concentrations ( g/m3) due to Fugitive
Dust Emissions from the Ash Lagoon..........................................................................1125.25 Maximum 24-hour Average PM10 Concentrations ( g/m3) due to Fugitive Dust
Emissions from the Ash Lagoon ..................................................................................1135.26 Maximum 24-hour Average PM2.5 Concentrations ( g/m3) due to Fugitive Dust
Emissions from the Ash Lagoon ..................................................................................1145.27 Annual Hours of Fogging due to Cooling Tower Emissions.........................................1185.28 Annual Hours of Icing due to Cooling Tower Emissions..............................................1195.29 Annual Plume Length Frequencies due to Cooling Tower Emissions...........................1205.30 Water Deposition due to Cooling Tower Emissions (g/m2/month) ...............................1225.31 Salt Deposition due to Cooling Tower Emissions (g/m2/month)...................................1235.32 Maximum Predicted 1-hour Average NO2 Concentrations ( g/m3)
due to CT Emissions – 100% Conversion of NO to NO2 ............................................1255.33 Maximum Predicted 1-hour Average NO2 Concentrations ( g/m3)
due to CT Emissions – Janssen Method .......................................................................1265.34 Maximum Predicted 24-hour Average NO2 Concentrations ( g/m3)
due to CT Emissions – 100% Conversion of NO to NO2 ............................................1275.35 Maximum Predicted 24-hour Average NO2 Concentrations ( g/m3)
due to CT Emissions – Janssen Method .......................................................................1285.36 Maximum Predicted 1-hour Average CO Concentrations ( g/m3)
due to CT Emissions....................................................................................................129
Brandon Generating Station Licence ReviewAir Quality Impact Assessment
38106 – 20 June 2006 vii SENES Consultants Limited
5.37 Maximum Predicted 8-hour Average CO Concentrations ( g/m3)due to CT Emissions....................................................................................................130
5.38 Maximum Predicted 24-hour Average PM2.5 Concentrations ( g/m3)due to CT Emissions....................................................................................................131
5.39 Maximum Predicted 1-hour Average NO2 Concentrations ( g/m3) due to CombinedEmissions from Unit #5 and CTs (100% conversion of NO to NO2) ............................134
5.40 Maximum Predicted 1-hour Average NO2 Concentrations ( g/m3) due to CombinedEmissions from Unit #5 and CTs (Janssen Method) .....................................................135
Brandon Generating Station Licence ReviewAir Quality Impact Assessment
38106 – 20 June 2006 1 SENES Consultants Limited
EXECUTIVE SUMMARY
The Brandon Generating Station (Brandon G.S.), located on the eastern boundary of the City ofBrandon, on the southern shore of the Assiniboine River, is an important part of ManitobaHydro’s integrated system. This document provides an air quality impact assessment to theEnvironmental Impact Statement (EIS) that has been prepared as part of the Environment ActLicence Review (EALR) for the coal-fired operation of Brandon Unit 5 (Unit #5).
The potential effects of air pollutant emissions from the Bandon G.S. on ambient air quality wereevaluated using plume dispersion models to simulate the transport and diffusion of air pollutantsthat would be emitted from the boiler, sources of fugitive dust, and cooling tower emissions.Dispersion modelling was performed using two sets of coal properties (i.e., heating value,sulphur content, ash content, trace metal concentrations): one set representing the current coalthat is being used at the plant, and a second set representing the range of properties associatedwith coal from ten potential alternative suppliers that could be used in the future. In addition, inorder to account for the range of performance variation associated with the different burner rowcombinations in the boiler, dispersion modelling was performed for the most efficientcombination and the least efficient combination. Modelling results for the most efficient (andmost commonly used) burner row combination are referred to as Operating Scenario 1 (OS1),while results for the alternative (less efficient burner row combination) are referred to asOperating Scenario 2 (OS2). The modelling results for the OS2 estimate represent the greatestpossible emission rates; however, they do not characterize typical Unit #5 operation. Airdispersion modelling results based on the current coal properties were used for the OS1 and OS2emission estimates, while results based on the set of alternative (upper-bound) coal propertieswere assessed as Operational Scenario 3 (OS3) emission estimates.
The practical maximum generation for Unit #5 is expected to be 830 GWh (i.e., 90% of itsmaximum rated capacity of 920 GWh). The maximum annual generation in any given year from1992-2005 was 639.6 GWh per year in 2003, or 69% of its rated capacity. The averagegeneration rate over the most recent 5-year period 2001-2005 was 434.6 GWh, or 47% of Unit#5’s rated capacity. However, for the purposes of the air quality and risk assessments, theanalysis has been conservatively conducted at 100% capacity factor, or 920 GWh.
The air emissions from sub-bituminous coal combustion primarily consist of commoncontaminants such as oxides of nitrogen (NOx) and carbon monoxide (CO), sulphur dioxide(SO2) and particulate matter (SPM, PM10 and PM2.5). There are also small quantities of somevolatile organic compounds, hydrogen chloride (HCl), hydrogen fluoride (HF), and tracequantities of both organic compounds and inorganic elements associated with the particulatematter. The combustion of coal also results in emissions of carbon dioxide (CO2), and small
Brandon Generating Station Licence ReviewAir Quality Impact Assessment
38106 – 20 June 2006 2 SENES Consultants Limited
quantities of other greenhouse gases such as methane (CH4) and nitrous oxide (N2O). Ambientground level concentrations were calculated for common contaminants (CO, NO2, SO2 andparticulate matter), volatile organic compounds (VOCs), as well as trace organic (PAHs) andinorganic (e.g., metals) species. Deposition rates were calculated for particulate matter, as wellas trace organic and inorganic contaminants. The predicted concentrations of commoncontaminants were compared with observed ambient air quality data from stations in Brandon.For pollutants not monitored in Brandon, comparisons were also made for available data fromWinnipeg. Predicted air quality impacts were evaluated with respect to ambient air qualityobjectives standards and guidelines established by Manitoba Conservation. In addition, selectedVOCs and trace contaminants were evaluated by comparison with ambient air quality criteriaadopted in other provinces.
The results from the air quality impact assessment were then used to conduct screening-levelhuman health and ecological (trees, plants, wild and domestic animals) risk assessments forcommon air contaminants, as well as for trace quantities of organic and inorganic emissions thatare not covered by provincial or federal ambient air quality standards, objectives or guidelines.The results of the human health and ecological risk assessments are presented in the report:Human Health and Ecological Risk Assessment, Brandon Generating Station Licence Review,Appendix N.
Existing Air Quality
The NO2 monitoring data in Brandon indicate that the Manitoba Maximum Acceptableobjectives have not been exceeded over the available period of monitoring data since 1997. Theannual average NO2 concentration from all sources is only about one-tenth of the MaximumAcceptable Objective required by Manitoba Conservation. Similarly, the maximum observed 1-hour and 24-hour average NO2 concentrations in Brandon are only about 25-35% of theprovincial Maximum Acceptable objectives.
There is currently no SO2 monitoring in Brandon. SO2 monitoring was discontinued in Brandonin 1989, but readings prior to that were too low to register (0.0 ppm). Similarly, there is no COmonitoring for Brandon.
Fine particulate matter (PM2.5) has been monitored in Brandon since 2001. PM2.5 concentrationsfrom all sources are well below the Canada-Wide Standard (CWS) level. No data are availablefor total suspended particulate matter (SPM), but the measured maximum 24-hour average PM10
concentrations at the Assiniboine Community College consistently exceed the ManitobaGuideline value of 50 µg/m3. As discussed below, the contribution of Unit #5 to PM10
concentrations in Brandon is insignificant. Therefore, the primary cause for the high levels of
Brandon Generating Station Licence ReviewAir Quality Impact Assessment
38106 – 20 June 2006 3 SENES Consultants Limited
PM10 is believed to be related to fugitive dust emissions from agricultural activity in the area, aswell as possibly due to seasonal burning of agricultural waste and stubble in fields. Themagnitude of the highest PM10 concentrations also suggests that the provincial MaximumAcceptable SPM objective of 120 µg/m3 is also being exceeded.
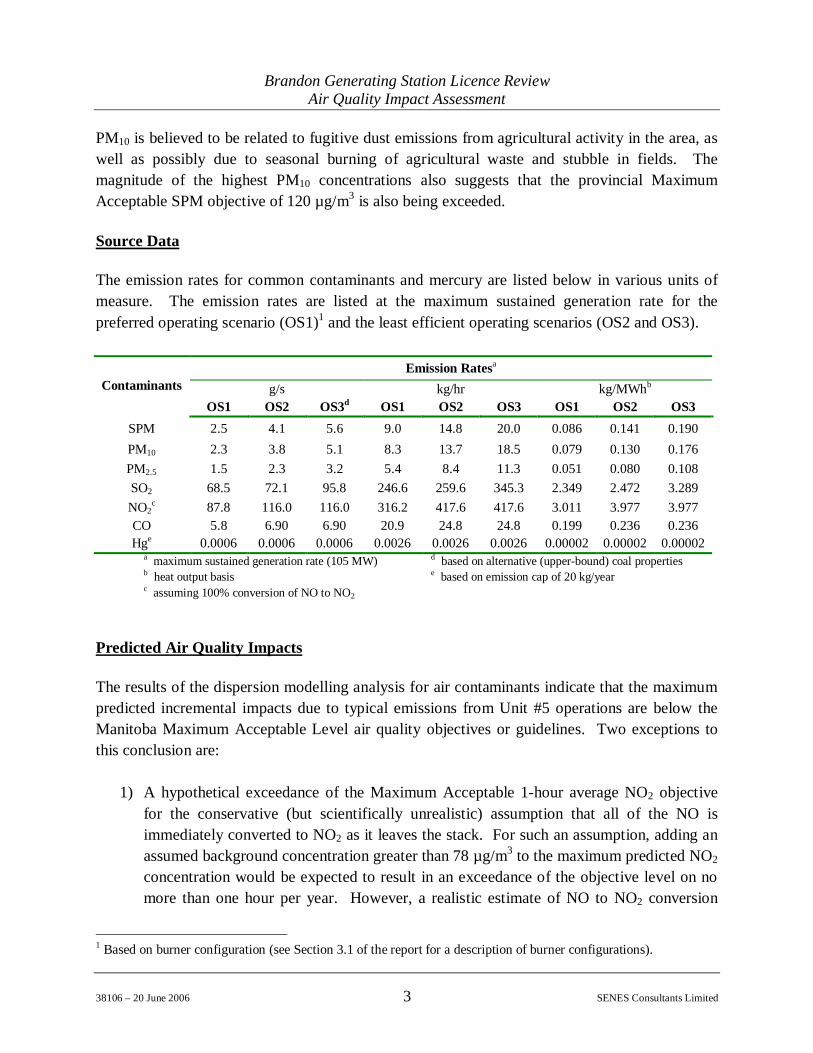
Source Data
The emission rates for common contaminants and mercury are listed below in various units ofmeasure. The emission rates are listed at the maximum sustained generation rate for thepreferred operating scenario (OS1)1 and the least efficient operating scenarios (OS2 and OS3).
Emission Ratesa
g/s kg/hr kg/MWhbContaminantsOS1 OS2 OS3d OS1 OS2 OS3 OS1 OS2 OS3
SPM 2.5 4.1 5.6 9.0 14.8 20.0 0.086 0.141 0.190PM10 2.3 3.8 5.1 8.3 13.7 18.5 0.079 0.130 0.176PM2.5 1.5 2.3 3.2 5.4 8.4 11.3 0.051 0.080 0.108SO2 68.5 72.1 95.8 246.6 259.6 345.3 2.349 2.472 3.289NO2
c 87.8 116.0 116.0 316.2 417.6 417.6 3.011 3.977 3.977CO 5.8 6.90 6.90 20.9 24.8 24.8 0.199 0.236 0.236Hge 0.0006 0.0006 0.0006 0.0026 0.0026 0.0026 0.00002 0.00002 0.00002
a maximum sustained generation rate (105 MW) d based on alternative (upper-bound) coal propertiesb heat output basis e based on emission cap of 20 kg/yearc assuming 100% conversion of NO to NO2
Predicted Air Quality Impacts
The results of the dispersion modelling analysis for air contaminants indicate that the maximumpredicted incremental impacts due to typical emissions from Unit #5 operations are below theManitoba Maximum Acceptable Level air quality objectives or guidelines. Two exceptions tothis conclusion are:
1) A hypothetical exceedance of the Maximum Acceptable 1-hour average NO2 objectivefor the conservative (but scientifically unrealistic) assumption that all of the NO isimmediately converted to NO2 as it leaves the stack. For such an assumption, adding anassumed background concentration greater than 78 µg/m3 to the maximum predicted NO2
concentration would be expected to result in an exceedance of the objective level on nomore than one hour per year. However, a realistic estimate of NO to NO2 conversion
1 Based on burner configuration (see Section 3.1 of the report for a description of burner configurations).
Brandon Generating Station Licence ReviewAir Quality Impact Assessment
38106 – 20 June 2006 4 SENES Consultants Limited
indicates that the objective would never actually be exceeded under any operatingconditions.
2) Conservatively estimated SPM emission rates for coal handling and storage suggest thatthe maximum predicted 24-hour average SPM concentrations may, on occasion, approachthe provincial Maximum Acceptable objective at or near the fenceline. Coupled with thealready high background SPM levels in the area, fugitive coal dust emissions may thusoccasionally contribute to exceedances of the objective level. However, the emissionestimates used for the dispersion modelling analysis do not fully account for all of thebest management practices for controlling emissions that are employed at the plant.Consequently, the magnitude of the maximum predicted fugitive coal dust concentrationsis uncertain, but is likely overestimated in this assessment.
Nitrogen Dioxide (NO2)
The Manitoba Maximum Acceptable objective value for 1-hour average NO2 concentrations is400 g/m3. The highest NOx emissions from the Unit #5 boiler occur with the less efficientOS22 burner configuration. The OS2 configuration is only used 10% of the time, compared with60% for the most efficient OS1 configuration.
The major portion (64%) of NOx emitted from the Unit #5 stack is emitted as NO, which issubsequently converted to NO2 as the plume is transported downwind. For regulatory purposes,NOx emissions are often evaluated using an assumption that all of the NO is immediatelyconverted to NO2 when it leaves the stack. This is an overly conservative assumption because, inreality, it takes quite a bit of time for this conversion to occur in the atmosphere. For thepurposes of this assessment, the predicted NO2 impacts due to Unit #5 NOx emissions have beenevaluated using both the conservative assumption of 100% conversion at the stack tip, as well asusing a more realistic conversion estimate (referred to in the assessment as the Janssen method).
The maximum predicted 1-hour average NO2 concentration using the preferred OS1 burnerconfiguration is 243 µg/m3. Adding the estimated background NO2 concentrations to thepredicted concentration for Unit #5 for the preferred OS1 configuration would not result in anyexceedance of the provincial Maximum Acceptable objective, regardless of which NO to NO2
conversion scheme is used.
At the measured NOx emission rates for Unit #5 under the OS2 burner configuration, the highestoff-site 1-hour average NO2 concentration would be 322 µg/m3, if the analysis is based on theassumption that all the NO is instantaneously converted to NO2 as the exhaust gas leaves the
2 Note that emissions for the OS3 burner configuration are the same as for the OS2 configuration.
Brandon Generating Station Licence ReviewAir Quality Impact Assessment
38106 – 20 June 2006 5 SENES Consultants Limited
stack. This value is predicted to occur on 1 hour per year at a location SE of the Brandon G.S.,near the sewage treatment plant. However, 99.95 percent of the time the predicted NO2
concentration would be less than 75 µg/m3 at this location. Adding an estimated3 backgroundNO2 concentration of 102 g/m3 to the maximum predicted concentration of 322 g/m3 suggeststhat the provincial objective of 400 g/m3 might be exceeded on no more than 1 day per year. Amore realistic assessment of maximum potential NO2 impacts using the Janssen method indicatesthat the maximum predicted 1-hour average NO2 concentrations due to Unit #5 emissions wouldbe only 119 µg/m3 for the OS2 configuration, and adding the background NO2 concentration tothis value would mean that the provincial objective would not in fact be exceeded at any timewhen operating in the OS2 configuration.
Air quality impacts due to NOx emissions were also evaluated for the combined emissions ofUnit #5 and the two combustion turbines at the plant (Units #6 and #7). The maximum predicted1-hour average NO2 concentration is 360 µg/m3, which is predicted to occur on only 1 day peryear if it is assumed that all of the NO from Unit #5 and the CTs is immediately converted toNO2 upon leaving the stacks. If the background NO2 concentration is assumed to be 102 µg/m3,the provincial Maximum Acceptable objective of 400 µg/m3 could be exceeded on one hour peryear. If the more realistic Janssen conversion method is used, the maximum predicted 1-houraverage NO2 concentration for combined operations would be only 119 µg/m3, and theprovincial objective would not be exceeded.
Assuming 100% conversion of NO to NO2 at the stack, the maximum predicted 24-hour averageNO2 concentration is estimated to be 24 µg/m3 for OS2, and 17 µg/m3 for OS1. If the highest24-hour average NO2 concentration of 57 µg/m3 recorded in Brandon over the 5-year period2000-2004 is assumed to be representative of background NO2 levels at the maximum point ofimpingement for the Unit #5 plume, the combined impact of background levels plus emissionsfrom Unit #5 would not exceed the Maximum Acceptable objective of 200 µg/m3. Theprovincial Maximum Acceptable objective would also not be exceeded at any location even withthe combined emissions of Unit #5 and the two combustion turbines.
The maximum predicted annual average NO2 concentration due to emissions from the BrandonG.S. is estimated to provide an insignificant contribution of less than 1 µg/m3 to overall NO2
levels in the Brandon area.
3 The background NO2 concentration at the Assiniboine Community College monitoring station was estimated bysubtracting the maximum predicted NO2 concentration due to Unit #5 emissions at that location from the maximumobserved NO2 concentration during the period 2000-2004.
Brandon Generating Station Licence ReviewAir Quality Impact Assessment
38106 – 20 June 2006 6 SENES Consultants Limited
Sulphur Dioxide (SO2)
For power generation using the current coal supplied from the Spring Creek mine, maximumpredicted 1-hour average SO2 concentrations range from 200 µg/m3 for OS2 to 190 µg/m3 for thepreferred OS1. After reviewing the coal properties of 16 other suppliers of coal, ManitobaHydro screened out those that would not be considered acceptable on the basis of sulphurcontent. For alternative sub-bituminous coals that might be used in the future, the maximum 1-hour average SO2 concentrations for OS3 would not exceed 265.5 µg/m3. The results indicatethat the provincial objective of 900 µg/m3 would not be exceeded either for current or potentialfuture operations using coal with a slightly higher sulphur content.
The maximum predicted 24-hour average SO2 concentrations of 13.9 µg/m3 for OS1 and 14.6µg/m3 for OS2 are well below the provincial Maximum Acceptable objective of 300 µg/m3.Even if in the future the plant were to burn a coal with 33% higher sulphur content, the predictedconcentrations of 18.5 µg/m3 and 19.5 µg/m3 for the two operating scenarios, respectively,would still be well below the provincial objective of 300 µg/m3.
The maximum predicted annual average SO2 concentration due to emissions from the BrandonG.S. is estimated to provide an insignificant contribution of less than 1 µg/m3 to overall SO2
levels in the Brandon area.
Carbon Monoxide (CO)
The maximum predicted 1-hour average CO concentrations of 19.1 µg/m3 for OS2 and 16.1µg/m3 for OS1 are insignificant compared with the provincial Maximum Acceptable objective of35,000 µg/m3. Similarly, the maximum predicted 8-hour average CO concentrations of 4.2µg/m3 for OS2 and 3.5 µg/m3 for OS1 are insignificant compared with the provincial MaximumAcceptable objective of 15,000 µg/m3.
Maximum predicted CO concentrations for combined emissions from Unit #5 and the twocombustion turbines results in much higher 1-hour and 8-hour average CO concentrations due tothe higher impacts of the CO emissions from the combustion turbines. The maximum predicted1-hour average CO concentration for combined emissions is 192 µg/m3, consisting primarily of188 µg/m3 from the two turbines. Similarly, the maximum predicted 8-hour average COconcentration of 63 µg/m3 for combined emissions is entirely derived from the turbines becausethe contribution of Unit #5 emissions to total CO concentration is insignificant at the maximumpoint of impingement for the emissions from the two CTs. Even with the higher predictedconcentrations for the combined emissions from Unit #5 and the two combustion turbines, the
Brandon Generating Station Licence ReviewAir Quality Impact Assessment
38106 – 20 June 2006 7 SENES Consultants Limited
provincial objectives for 1-hour and 8-hour averaged CO concentrations would not be exceededat any time.
Particulate Matter (SPM, PM10 & PM2.5)
The Canada-Wide Standard (CWS) parameter for PM2.5 is 30 g/m3 (98th percentile, averagedover three consecutive years). Manitoba Conservation also uses a value of 30 ug/m3 (100th
percentile with no 3-year averaging) when evaluating emission sources for regulatory permitting.The value of the CWS parameter measured at the Assiniboine Community College in 2004 was16 g/m3. At the maximum point of impingement, the highest predicted 24-hour average PM2.5
concentration due to emissions from the Brandon G.S. Unit #5 stack is less than 0.7 µg/m3,which would make it undetectable by a standard PM2.5 monitor. The predicted concentration atthe Assiniboine Community College monitoring station would be less than 0.3 g/m3. Even withcombined emissions from Unit #5 and the two CTs, the maximum predicted PM2.5 concentrationwould still be less than 1 µg/m3.
The maximum predicted 24-hour average PM2.5 concentrations for fugitive dust from coal andash storage are conservatively estimated at 15 µg/m3 and 1 µg/m3, respectively. At the point ofmaximum predicted concentration, the 98th percentile 24-hour average concentration for fugitivecoal dust is only 1.7 µg/m3, while that for ash is much less than 1 µg/m3. Although themaximum point of impingement for the Unit #5 stack emissions and fugitive coal/ash emissionsdo not occur at the same location, the CWS parameter in the area would not be exceeded even ifthey did coincide and were added to the 98th percentile level of 16 g/m3 measured at theAssiniboine Community College in Brandon.
The Manitoba guideline value for 24-hour averaged PM10 is 50 g/m3. For PM10 emissions fromthe Unit #5 stack, the maximum predicted 24-hour average incremental concentration is less than1 µg/m3. Based on potential future coal supplies having up to 35% higher ash content, themaximum predicted 24-hour average PM10 concentrations would be 1.1 µg/m3 for OS2 and 0.7µg/m3 for the preferred OS1 burner configuration. These values are at or below themeasurement accuracy of a PM10 monitor. Therefore, the contributions of particulate matteremissions from the Unit #5 stack do not significantly contribute to the exceedances of theprovincial PM10 guideline of 50 µg/m3 that have been consistently recorded at the PM10 monitorin Brandon.
The maximum predicted PM10 concentrations for fugitive dust emissions are conservativelyestimated at: 1) 27 µg/m3 for coal dust in a location approximately 200 metres south of the plant,and 2) at 7 µg/m3 for ash emissions along the northern boundary of the ash storage area. Ninety-nine percent (99%) of the time, the maximum contribution of fugitive coal dust to ambient PM10
Brandon Generating Station Licence ReviewAir Quality Impact Assessment
38106 – 20 June 2006 8 SENES Consultants Limited
levels anywhere in the area would be less than 15 µg/m3. Moreover, the maximum predictedPM10 concentrations are less than 0.5 µg/m3 at the Riverview Elementary School (i.e., in theclosest residential area west of the Brandon G.S. and near the air quality monitoring station at theAssiniboine Community College), as well as at the nearest residence east of the plant. As such,the PM10 concentrations due to fugitive dust emissions would not be measurable at the nearestresidences, and the fugitive emissions from the Brandon G.S. alone would not be sufficient tocause the high PM10 concentrations measured in Brandon.
The Manitoba objective value for 24-hour averaged SPM is 120 g/m3. The maximum 24-houraverage incremental SPM concentrations of 0.8 µg/m3 due to Unit #5 stack emissions ispredicted to occur near the northwest corner of the Brandon G.S. property line. If the ash contentof future coals that might be burned at the plant were up to 35% higher than for Spring Creekcoal, the maximum predicted concentration (for the OS3 scenario) would be 1.1 µg/m3. As such,the maximum contribution of any of the coals that may be considered suitable for future use inUnit #5 to the measured SPM levels in the Brandon area is negligible.
Maximum predicted SPM concentrations for fugitive dust from the coal and ash storage areas are105 µg/m3 and 8 µg/m3, respectively. Background SPM concentrations are known, but may beassumed to be above the Maximum Acceptable objective at least some of the time, based onobserved PM10 concentrations. In combination with background SPM concentrations, there is apotential for coal dust emissions from the coal storage area to occasionally contribute to suchexceedances of the objective level at the fenceline. However, the estimate of fugitive coal dustcontributions to ambient SPM concentrations in this assessment is considered to be conservative,in that the estimated SPM emission rates from the coal storage area cannot take into account allof the emission control measures that are used by the plant operators to reduce any suchemissions. Consequently, it is likely that the predicted maximum SPM emissions estimated forthe modelling analysis overstate actual emission rates. Even so, predicted concentrations wouldbe less than 80 µg/m3 on all but one day per year. Ninety-nine percent of the time (i.e., 361 of365 days per year), the maximum predicted contribution to ambient SPM levels due to fugitivecoal dust would be less than 27 µg/m3. Furthermore, the predicted SPM concentrations at thenearest residential areas west of the plant due to fugitive dust from coal and ash storage of 0.5µg/m3 and 0.3 µg/m3 respectively are negligible, and less than 0.2 µg/m3 at the nearest residenceeast of the plant. Therefore, fugitive dust emissions from the Brandon G.S. alone would not besufficient to account for the high PM10 (and by extension, SPM) concentrations that have beenmeasured in Brandon.

Brandon Generating Station Licence ReviewAir Quality Impact Assessment
38106 – 20 June 2006 9 SENES Consultants Limited
Trace Contaminants
As part of the Canada-wide Standard (CWS) proposed by the Canadian Council of Ministers ofthe Environment, Manitoba’s’ mercury stack emissions from the Brandon G.S. would be capped,commencing in the year 2010, at 20 kg/year. Manitoba Hydro has committed to meeting this capeffective immediately, and the dispersion modelling assessment has been conducted on thisbasis. At this emission rate, the contribution of mercury emissions from the Brandon G.S. tototal mercury deposition in the area surrounding the plant represents approximately 2-4% of thetotal mercury deposition including all global sources.
For the remaining trace contaminants in the exhaust emissions (i.e., VOCs, as well as traceorganics and inorganics), only HCl, HF, formaldehyde, arsenic, cadmium, copper, lead, nickel,and zinc have established ambient air quality guidelines in Manitoba. The maximum predicted24-hour average HF concentration is 1.5% of the guideline level. All other constituents are lessthan 0.1% of the Manitoba guideline values. Comparisons of maximum predicted concentrationsfor constituents with available air quality criteria from other jurisdictions indicate that all impactsare less than or equal to 0.6% of criteria levels, with the exception of the 1-hour average HFconcentration at 3.7% of the Alberta objective level. The potential health impacts of theseemissions are addressed in Appendix N.
Greenhouse Gases (GHG)
At 100% of capacity factor, the total potential greenhouse gas (GHG) emissions from Unit #5 areestimated at 1.04 megatonnes/year (Mt/yr). Thus, the maximum potential GHG emissions fromthe Brandon G.S. are estimated at 5.7% of Manitoba’s total GHG emissions, but on average thestation will produce fewer emissions than this. Total GHG emissions in Manitoba representapproximately 3% of Canada’s total GHG emissions, and Canada contributes approximately 2%of the world’s GHG emissions.
Cooling Tower Emissions
From the modelling that was undertaken it was determined that the potential impact from thecooling tower, it was concluded that the water vapour and dissolved salt emissions have aminimal impact on adjacent areas. Fogging or icing were predicted to occur off-site onapproximately 1 hour per year and thus there is only minimal impact on the nearby roads.Assuming that the plant operates 100% of the time, a visible plume from the cooling tower of500 m in length is predicted to occur up to 175 hours per year, while a plume up to 2 km inlength may be visible for up to 88 hours per year. The amount of water and salt that may bedeposited from the plume is negligible.
Brandon Generating Station Licence ReviewAir Quality Impact Assessment
38106 – 20 June 2006 10 SENES Consultants Limited
1.0 INTRODUCTION
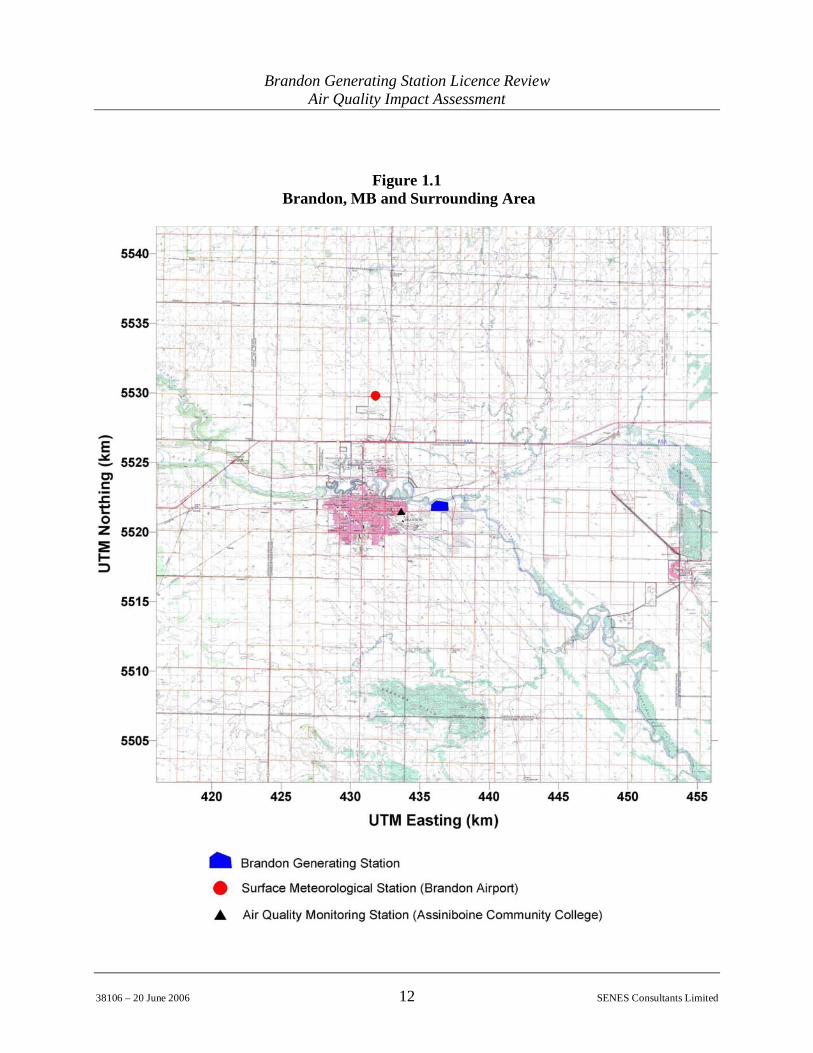
This document provides an air quality impact assessment to the Environmental Impact Statement(EIS) that has been prepared as part of the Environment Act Licence Review (EALR) forBrandon Unit 5 (Unit #5). The Brandon Generating Station (Brandon G.S.), located on theeastern boundary of the City of Brandon, on the southern shore of the Assiniboine River, is animportant part of Manitoba Hydro’s integrated system. Figure 1.1 provides an illustration ofBrandon Manitoba and surrounding area with the relative locations of the Manitoba HydroBrandon Thermal Generating Station and the Brandon Airport (which has a meteorologicalobservation station).
Unit #5 (105 MW rated power) at the Brandon G.S. entered into service in 1969. Since thattime, the station has undergone several provincial environmental reviews. Formal environmental,regulatory approvals for the Brandon Generating Station date back to April 1972 when theManitoba Hydro-Electric Board submitted an application to the Clean Environment Commission(“CEC”) for a licence to operate the station. This eventually resulted in the issuance of CECOrder No. 340 on March 19, 1974 by the Commission. This approval dealt entirely with stationeffluents entering the Assiniboine River.
The first full Environmental Impact Assessment (“EIA”) was completed in 1976 (EnvironmentalImpact Assessment of the Operations of the Brandon Generating Station, James F. MacLarenLtd.). Specific terms and conditions regarding air emissions were established on April 22, 1984with the issuance of CEC Order No. 1039. This order was subsequently revised in 1986 as OrderNo. 1039 VC and was significantly updated afterwards on January 26, 1989 as Environment ActLicence No. 1246. Licence No. 1246, however, remained entirely focused on air quality relatedissues.
In 1992, Manitoba Hydro submitted a proposal to upgrade the Brandon G.S. to assure reliableoperation until 2006. This included a comprehensive EIA of all aspects of the operation of thestation, and a full regulatory review under the Environment Act. This review resulted in theissuance of Environment Act Licence No. 1703, which was a comprehensive licence containingterms and conditions regarding air, water and solid waste. As part of this review, a closed-loopcooling system and electrostatic precipitator were installed on Unit #5. This licence was revisedon February 14, 1994 as Licence No. 1703 R and is currently still in effect for the operation ofthe Brandon G.S. until 2006. It requires a review of the licence if Brandon G.S. Unit #5continues operation beyond 2006.
Brandon Generating Station Licence ReviewAir Quality Impact Assessment
38106 – 20 June 2006 11 SENES Consultants Limited
In 2001, Manitoba Conservation issued Licence No. 2497 for the operation of two CombustionTurbine Units (CTs) at the Brandon G.S. (260 MW rated power). The licence for the operationof the CTs was subsequently revised in 2003 as Licence No. 2497 R.
1.1 HISTORICAL OPERATIONS
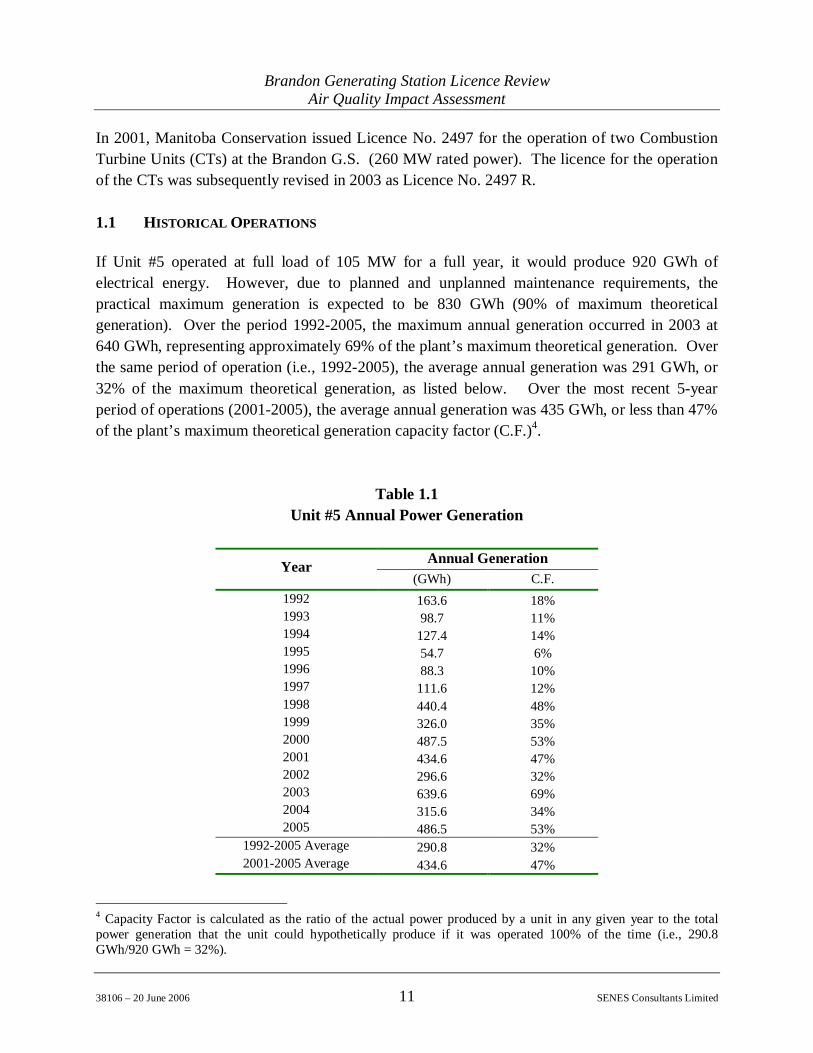
If Unit #5 operated at full load of 105 MW for a full year, it would produce 920 GWh ofelectrical energy. However, due to planned and unplanned maintenance requirements, thepractical maximum generation is expected to be 830 GWh (90% of maximum theoreticalgeneration). Over the period 1992-2005, the maximum annual generation occurred in 2003 at640 GWh, representing approximately 69% of the plant’s maximum theoretical generation. Overthe same period of operation (i.e., 1992-2005), the average annual generation was 291 GWh, or32% of the maximum theoretical generation, as listed below. Over the most recent 5-yearperiod of operations (2001-2005), the average annual generation was 435 GWh, or less than 47%of the plant’s maximum theoretical generation capacity factor (C.F.)4.
Table 1.1Unit #5 Annual Power Generation
Annual GenerationYear(GWh) C.F.
1992 163.6 18%1993 98.7 11%1994 127.4 14%1995 54.7 6%1996 88.3 10%1997 111.6 12%1998 440.4 48%1999 326.0 35%2000 487.5 53%2001 434.6 47%2002 296.6 32%2003 639.6 69%2004 315.6 34%2005 486.5 53%
1992-2005 Average 290.8 32%2001-2005 Average 434.6 47%
4 Capacity Factor is calculated as the ratio of the actual power produced by a unit in any given year to the totalpower generation that the unit could hypothetically produce if it was operated 100% of the time (i.e., 290.8GWh/920 GWh = 32%).
Brandon Generating Station Licence ReviewAir Quality Impact Assessment
38106 – 20 June 2006 12 SENES Consultants Limited
Figure 1.1 Brandon, MB and Surrounding Area
Brandon Generating Station Licence ReviewAir Quality Impact Assessment
38106 – 20 June 2006 13 SENES Consultants Limited
2.0 MODELLING METHODOLOGY
Due to the variety of sources present at the Brandon G.S., a number of different computersimulations were required to assess and characterize the emissions from the plant. Specifically,the sources that needed to be considered include:
• the Unit #5 exhaust gas stack;• the associated cooling tower;• fugitive dust from coal handling operations and residual ash storage; and,• the combined emissions from Unit #5 and the two natural gas CTs.
The modelling methodology to be used for evaluating the emissions from these sources was firstdiscussed with Manitoba Conservation to confirm the appropriateness of these methods for thepurposes of the plant’s licence review.
Emissions from the Unit #5 exhaust stack were modelled using the California Puff (CALPUFF)modelling system. CALPUFF is a sophisticated dispersion modelling system that was developedby Sigma Research Corporation (now part of Earth Tech Inc.) for the United StatesEnvironmental Protection Agency (USEPA). CALPUFF continues to be supported by EarthTech and is listed as an ‘Appendix A’ preferred/recommended dispersion model in the USEPAGuideline on Air Quality Models (US EPA 2005). The CALPUFF model has previously beenused for air quality assessment of the Selkirk G.S. (SENES 2001, 2005).
The CALPUFF system was the core model used in conducting the dispersion analyses forcombustion related emissions. The meteorological processor within CALPUFF (CALMET) wasused to construct 3-dimensional meteorological fields for the year 2003. These fields were thenused with the CALPUFF dispersion model to assess the air contaminant releases from elevatedsources (Unit 5 and the natural gas combustion turbines).
In addition, fugitive coal dust caused by wind erosion and handling and storage of coal and ashwere assessed with the Industrial Source Complex Short Term Version 3 (ISCST3). Althoughthe CALPUFF model is capable of modelling the dispersion of fugitive dust from large areasources, the deposition algorithm within the ISCST3 model is considered by the CALPUFFmodel’s own developer to provide a better representation of plume transport from an area source.
Water-related emissions from the cooling tower were assessed using the Seasonal AnnualCooling Tower Impacts (SACTI) model. The SACTI model has previously been used to model
Brandon Generating Station Licence ReviewAir Quality Impact Assessment
38106 – 20 June 2006 14 SENES Consultants Limited
emissions from the (at that time) proposed cooling tower for the licence review at the BrandonG.S. completed in 1992.
Both the ISCST3 and SACTI models require (simplified) meteorological inputs. These inputswere developed from the CALMET fields and are therefore consistent with the fields used forthe elevated emission sources.
Deposition of air contaminants to the ground and water was also determined with the CALPUFF,SACTI and ISCST3 models. Due to an increased awareness and concern regarding deposition ofmercury, separate modelling runs were completed using the CALPUFF model to assess annualdeposition of oxidized, elemental and particulate-bound mercury from the combustion exhauststack. The characteristic settling velocities and precipitation scavenging ratios for the modellingwere based on a recent published study by the Brookhaven National Laboratory (Sullivan et al.2003).
2.1 MODEL DESCRIPTIONS
2.1.1 CALPUFF Model
CALPUFF is a modern, non-steady-state air quality modelling system that includes adeterministic meteorological model (CALMET), the dispersion model itself (CALPUFF), and apostprocessor for analyzing and viewing output fields. There are many differences between thenewer CALPUFF model and the Industrial Source Complex (ISC) model that has been used tomodel industrial air emissions from many facilities (including the Brandon G.S.) in the past. Inparticular, the CALPUFF model is able to treat emissions in a rigorous fashion with time-dependent releases of material that are transported and diluted within a 3-dimensional simulationof the atmosphere. In Canada, CALPUFF is considered a refined dispersion model that isrecommended for situations involving complex terrain or complex atmospheric circulations. Forelevated source releases from the Brandon G.S., SENES considers CALPUFF a moreappropriate model to use than ISC.
CALPUFF advects ‘puffs’ of material released from modelled sources. Sources of aircontaminants can be represented with point, area, line or volume designation. Released materialsare subject to chemical removal, wet and dry deposition, complex terrain algorithms (i.e.,channelling), building downwash, fumigation, and other effects. As opposed to earlier gaussianplume models (such as ISC), CALPUFF is a lagrangian model that requires 3-dimensional fieldsof wind and temperature, along with associated 2-dimensional fields such as mixing heights,surface characteristics and dispersion properties. To develop these fields, CALMET requiresboth hourly surface and twice-daily upper-air data from meteorological monitoring stations.
Brandon Generating Station Licence ReviewAir Quality Impact Assessment
38106 – 20 June 2006 15 SENES Consultants Limited
Another benefit of using the CALPUFF model is its ability to use meteorological inputs from aprognostic mesoscale (weather forecasting) model. Although prognostic models havesophisticated numerical code that commonly requires supercomputing facilities, the output fromsuch models can now be purchased from research organizations for a region and specific timeinterval of interest. Typically, CALPUFF uses surface and upper-air meteorological station dataas input. However, in situations where nearby station data are not available, the use ofprognostic model fields represents a significant advancement over previous modelling methodswhere station data from a distant meteorological station are used with or without some manualadjustments.
2.1.2 ISCST3 Model
The Industrial Source Complex, Short-Term model (ISCST3) is a steady-state gaussian plumemodel that can be used to assess contaminant concentrations from a wide variety of sourcesassociated with an industrial complex. The model is capable of explicitly handling multiplesources and types (point, area, and volume), building effects, particle deposition, and producesan hourly concentration for all terrain heights. ISCST3 uses actual hour-by-hour meteorologicaldata that represent the conditions experienced by the source emissions to estimate ambientconcentrations for differing sequential averaging periods (e.g., a multiple of one hour [2, 3, 4, 6,8, and 12], daily, and annual) for an array of user-specified receptors. In addition, sourceemission rates can be treated as constant throughout the modelling period, or may vary bymonth, season, hour-of-day, or other time period. ISCST3 includes algorithms for modelling theeffects of settling and removal of large particulates (dry deposition). In addition, there arealgorithms to determine wet deposition of gases and particulates. Wet and dry depositions can becombined to provide total deposition.
Although SENES considers the CALPUFF model to be superior to the ISCST3 model forsimulating emissions from elevated point sources such as the Unit #5 exhaust stack, an exceptionwas made for the case of modelling fugitive coal dust from unloading and moving coal from coaltrains to the storage pile and ultimately Brandon Unit #5, as well as for the wind erosion of ashfrom the ash storage area. According to J. Scire of Earth Tech Inc. (personal communication,May 2005), the developer of the CALPUFF model, the ISCST3 model provides a betterrepresentation of the vertical distribution of pollutant concentrations from an area source. In theCALPUFF model, the concentration of pollutants in a plume is evenly distributed in the verticaldimension, whereas in reality pollutant concentrations would tend to be more highlyconcentrated closer to the ground than above the surface, especially for larger particles. Thelatter is in fact how the ISCST3 model represents emissions from an area source. Since the vastmajority of fugitive coal dust is of larger particulate size and settles out relatively close to the
Brandon Generating Station Licence ReviewAir Quality Impact Assessment
38106 – 20 June 2006 16 SENES Consultants Limited
source, the ISCST3 model provides a more scientifically-correct representation of theseemissions.
The ISCST3 model (Version 02035) was used to model fugitive emissions of coal dust within2km of the coal and ash storage areas. ISCST3 is a simpler model than CALPUFF, and treatscontaminant emissions as a continuous plume of material that advects and disperses with themean wind each hour. Although a simpler model, ISCST3 is well suited to represent ground-level area sources of fugitive dust. ISCST3 requires surface meteorological data and mixingheights each hour. The needed data were extracted from the CALMET meteorological fields atthe location of the coal storage pile and used for all ISCST3 model runs.
2.1.3 SACTI Model
The effects of air emissions from the Brandon G.S. cooling tower were modelled separately withthe Seasonal Annual Cooling Tower Impacts (SACTI) model. Cooling towers remove heat fromindustrial cooling systems by exposing the coolant to the atmosphere. In the process, emissionsof water droplets and water vapour occur. Plume effects from the cooling tower include driftdeposition of salts, fogging, icing and solar energy loss at ground level due to shadowing.SACTI, a mathematical model that was designed specifically for cooling tower emissions, wasdeveloped by the Argonne National Laboratory, the University of Illinois at Urbana and theUniversity of Illinois at Chicago for the Electric Power Research Institute (EPRI). This modelhas been available to the dispersion modelling community since 1984 and can represent thedifferent types of cooling towers and controlling devices such as drift eliminators. A completedescription of the model, with test case scenarios was published in Atmospheric Environment(Policastro et al. 1994).
SACTI chooses from 30 to 100 different representative meteorological scenarios by analyzing afull year of local meteorological data. The frequency of occurrence of each case is also recorded.The plume model itself then simulates each scenario using the cooling tower characteristics (size,orientation and circulation rates) and provides summaries by season or year of quantities such ashours of fogging and water or salt deposition.
2.2 CALMET METEOROLOGICAL MODEL
There are no upper-air meteorological stations near the Brandon G.S. To capture the variety ofclimatological conditions experienced in and around Brandon, the full year of 2003 wassimulated with the CALMET model. The CALMET meteorological fields were then used for allCALPUFF and ISCST3 simulations and for meteorological inputs required by SACTI.
Brandon Generating Station Licence ReviewAir Quality Impact Assessment
38106 – 20 June 2006 17 SENES Consultants Limited
Instead of using upper-air data from stations located at Dauphin and The Pas in Manitoba, andBismarck in North Dakota, that may not provide a good representation of conditions overBrandon, SENES purchased 6-hourly analysis fields that were generated by the U.S. NationalCenters for Environmental Prediction (NCEP) ‘Eta’ model during 2003. This model is runoperationally four times a day to produce forecast fields over North America at 12 km horizontalresolution. The analysis fields are produced by the model via a four-dimensional dataacquisition (4DDA) routine that ingests all available surface and upper-air data in North Americato produce dynamically balanced meteorological fields over the continent every six hours. Theseanalysis fields are used to drive the Eta forecasts; however, the actual forecasts themselves werenot used by CALMET. CALMET internally interpolates between the 6-hourly fields based ontime of day and magnitude of surface energy fluxes. The Eta fields were purchased from QueTech, Inc., of Fort Collins CO, who archive the Eta output.
Local meteorological data were also used in the CALMET simulation. At a relatively coarseresolution of 12 km, Eta winds are somewhat ‘smoothed’ and may not be an appropriaterepresentation of localized winds near the earth’s surface in certain areas of the modellingdomain (i.e., in or near the river valley). Surface data from the Brandon (airport) meteorologicalstation were purchased from Environment Canada. The surface station data were used inCALMET to ‘correct’ the Eta winds in the vicinity of Brandon. In addition, the station data onprecipitation, cloud cover and ceiling height parameters were used to determine precipitation andstability factors for the entire modelling domain.
The CALMET input file is presented in Attachment A, which includes a record of allmeteorological modelling options used in this study. A summary of the important features of themeteorological simulation is provided below.
2.2.1 Modelling Domain for CALMET
A modelling domain of 30 km by 30 km was used, with individual grid cell spacing of 200m inboth east-west and north-south direction. The CALMET/CALPUFF modelling domain used forthis assessment is depicted in Figure 1.1 (see Section 1.1).
2.2.2 Meteorology
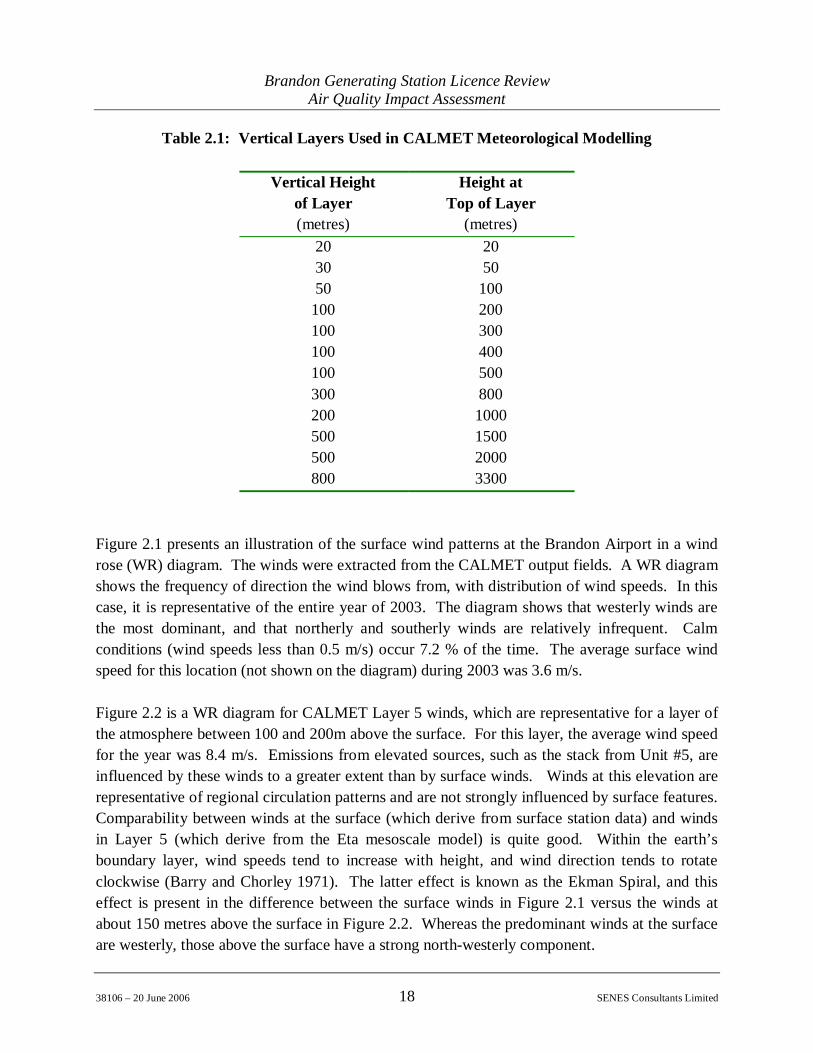
Table 2.1 lists the atmospheric levels used in the CALMET modelling. Greater verticalresolution was used near the earth’s surface, which gradually was reduced with height. Thismethodology is suggested in the CALMET user’s manual (TRC 2006), due to greater potentialvariation in meteorological variables near the surface.
Brandon Generating Station Licence ReviewAir Quality Impact Assessment
38106 – 20 June 2006 18 SENES Consultants Limited
Table 2.1: Vertical Layers Used in CALMET Meteorological Modelling
Vertical Heightof Layer(metres)
Height atTop of Layer
(metres)20 2030 5050 100
100 200100 300100 400100 500300 800200 1000500 1500500 2000800 3300
Figure 2.1 presents an illustration of the surface wind patterns at the Brandon Airport in a windrose (WR) diagram. The winds were extracted from the CALMET output fields. A WR diagramshows the frequency of direction the wind blows from, with distribution of wind speeds. In thiscase, it is representative of the entire year of 2003. The diagram shows that westerly winds arethe most dominant, and that northerly and southerly winds are relatively infrequent. Calmconditions (wind speeds less than 0.5 m/s) occur 7.2 % of the time. The average surface windspeed for this location (not shown on the diagram) during 2003 was 3.6 m/s.
Figure 2.2 is a WR diagram for CALMET Layer 5 winds, which are representative for a layer ofthe atmosphere between 100 and 200m above the surface. For this layer, the average wind speedfor the year was 8.4 m/s. Emissions from elevated sources, such as the stack from Unit #5, areinfluenced by these winds to a greater extent than by surface winds. Winds at this elevation arerepresentative of regional circulation patterns and are not strongly influenced by surface features.Comparability between winds at the surface (which derive from surface station data) and windsin Layer 5 (which derive from the Eta mesoscale model) is quite good. Within the earth’sboundary layer, wind speeds tend to increase with height, and wind direction tends to rotateclockwise (Barry and Chorley 1971). The latter effect is known as the Ekman Spiral, and thiseffect is present in the difference between the surface winds in Figure 2.1 versus the winds atabout 150 metres above the surface in Figure 2.2. Whereas the predominant winds at the surfaceare westerly, those above the surface have a strong north-westerly component.

Brandon Generating Station Licence ReviewAir Quality Impact Assessment
38106 – 20 June 2006 19 SENES Consultants Limited
Figure 2.1 CALMET Surface (10m) Winds at Brandon Airport
18%
18%
12%
12%
6%
6%
N
NE
E
SE
S
SW
W
NW
>10.0 m/s
5.0 - 10.0 m/s
2.0 - 5.0 m/s
1.0 - 2.0 m/s
0.5 - 1.0 m/s
7.2%Calm (<=0.5 m/s) =
Figure 2.2 CALMET Layer 5 (150m) Winds at Brandon Airport
18%
18%
12%
12%
6%
6%
N
NE
E
SE
S
SW
W
NW
>10.0 m/s
5.0 - 10.0 m/s
2.0 - 5.0 m/s
1.0 - 2.0 m/s
0.5 - 1.0 m/s
0.2%Calm (<=0.5 m/s) =
Brandon Generating Station Licence ReviewAir Quality Impact Assessment
38106 – 20 June 2006 20 SENES Consultants Limited
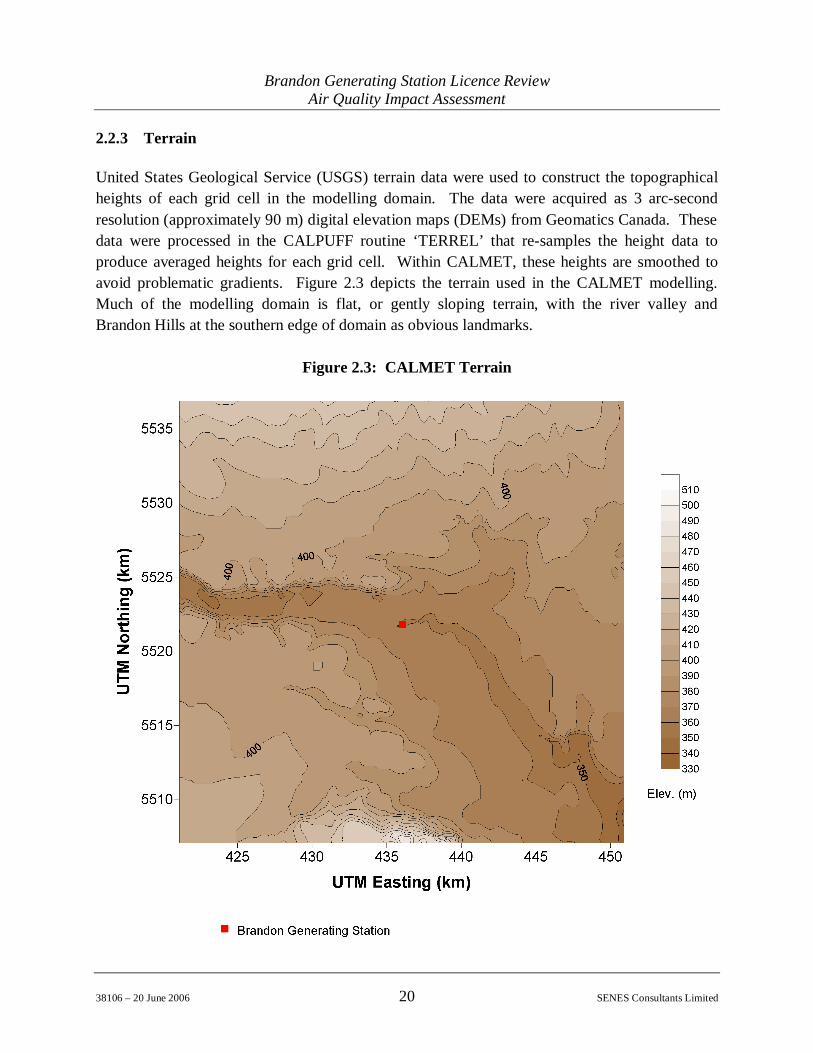
2.2.3 Terrain
United States Geological Service (USGS) terrain data were used to construct the topographicalheights of each grid cell in the modelling domain. The data were acquired as 3 arc-secondresolution (approximately 90 m) digital elevation maps (DEMs) from Geomatics Canada. Thesedata were processed in the CALPUFF routine ‘TERREL’ that re-samples the height data toproduce averaged heights for each grid cell. Within CALMET, these heights are smoothed toavoid problematic gradients. Figure 2.3 depicts the terrain used in the CALMET modelling.Much of the modelling domain is flat, or gently sloping terrain, with the river valley andBrandon Hills at the southern edge of domain as obvious landmarks.
Figure 2.3: CALMET Terrain
Brandon Generating Station Licence ReviewAir Quality Impact Assessment
38106 – 20 June 2006 21 SENES Consultants Limited
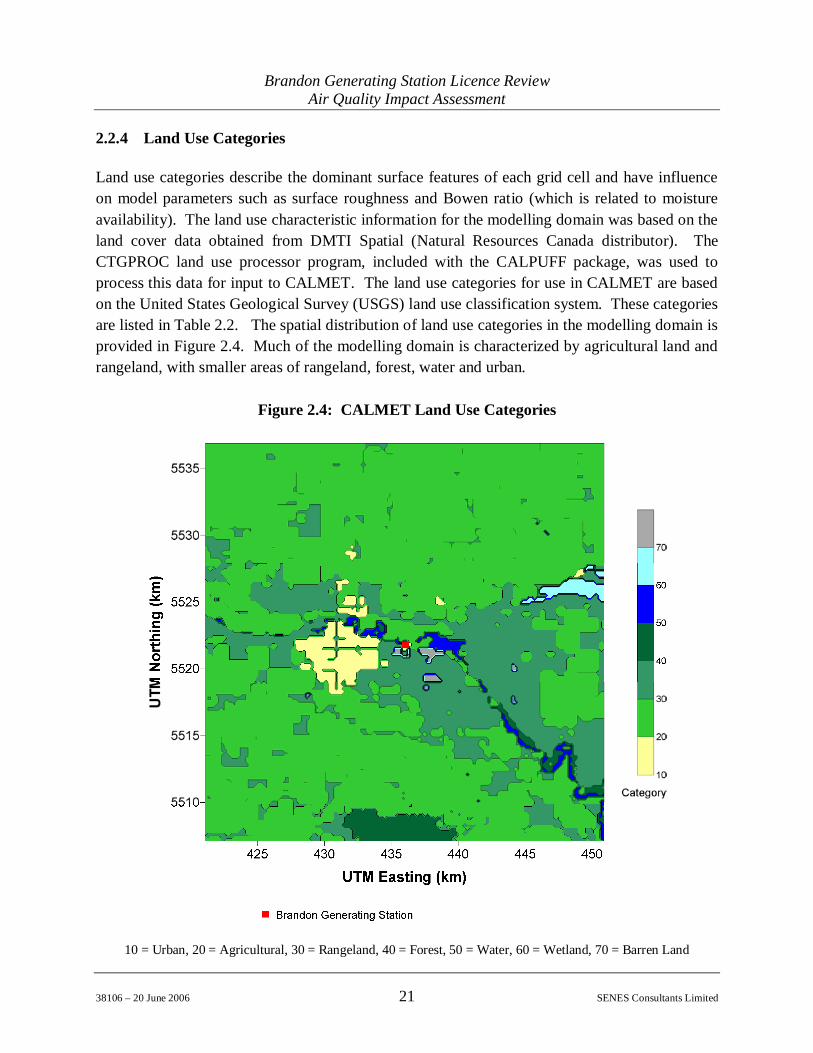
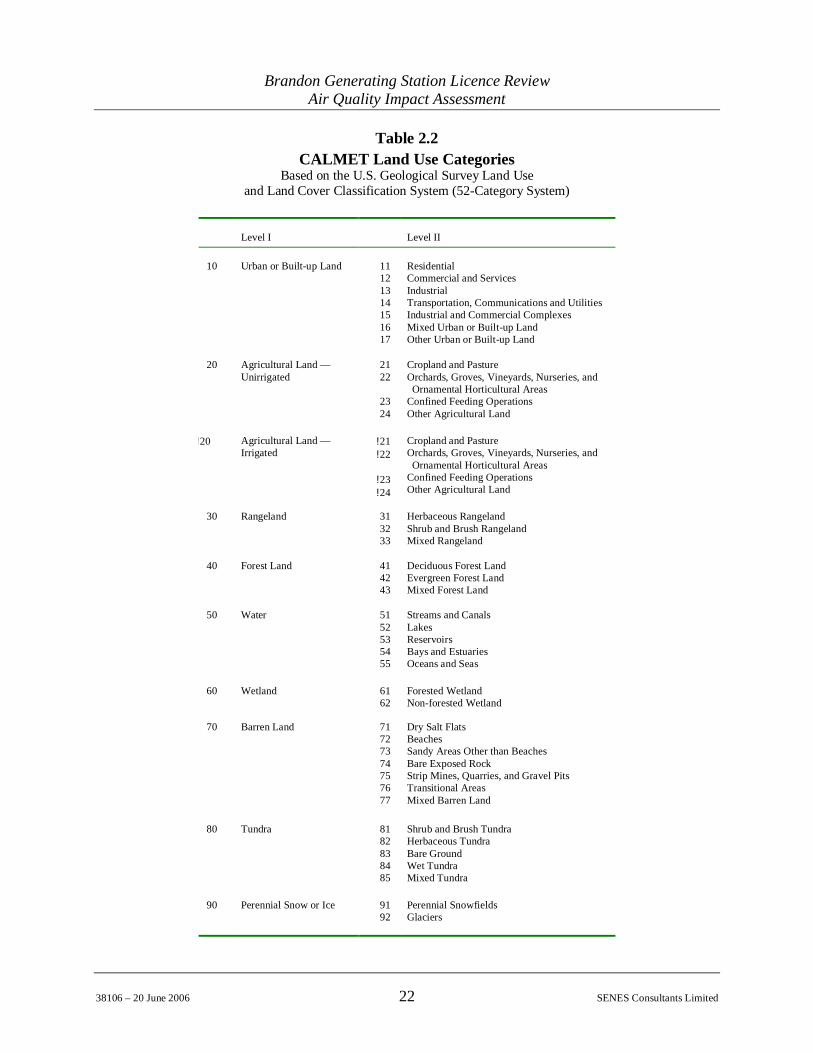
2.2.4 Land Use Categories
Land use categories describe the dominant surface features of each grid cell and have influenceon model parameters such as surface roughness and Bowen ratio (which is related to moistureavailability). The land use characteristic information for the modelling domain was based on theland cover data obtained from DMTI Spatial (Natural Resources Canada distributor). TheCTGPROC land use processor program, included with the CALPUFF package, was used toprocess this data for input to CALMET. The land use categories for use in CALMET are basedon the United States Geological Survey (USGS) land use classification system. These categoriesare listed in Table 2.2. The spatial distribution of land use categories in the modelling domain isprovided in Figure 2.4. Much of the modelling domain is characterized by agricultural land andrangeland, with smaller areas of rangeland, forest, water and urban.
Figure 2.4: CALMET Land Use Categories
10 = Urban, 20 = Agricultural, 30 = Rangeland, 40 = Forest, 50 = Water, 60 = Wetland, 70 = Barren Land
Brandon Generating Station Licence ReviewAir Quality Impact Assessment
38106 – 20 June 2006 22 SENES Consultants Limited
Table 2.2CALMET Land Use Categories
Based on the U.S. Geological Survey Land Useand Land Cover Classification System (52-Category System)
Level I Level II
10 Urban or Built-up Land 11121314151617
ResidentialCommercial and ServicesIndustrialTransportation, Communications and UtilitiesIndustrial and Commercial ComplexesMixed Urban or Built-up LandOther Urban or Built-up Land
20 Agricultural Land —Unirrigated
2122
2324
Cropland and PastureOrchards, Groves, Vineyards, Nurseries, and Ornamental Horticultural AreasConfined Feeding OperationsOther Agricultural Land
!20 Agricultural Land —Irrigated
!21!22
!23!24
Cropland and PastureOrchards, Groves, Vineyards, Nurseries, and Ornamental Horticultural AreasConfined Feeding OperationsOther Agricultural Land
30 Rangeland 313233
Herbaceous RangelandShrub and Brush RangelandMixed Rangeland
40 Forest Land 414243
Deciduous Forest LandEvergreen Forest LandMixed Forest Land
50 Water 5152535455
Streams and CanalsLakesReservoirsBays and EstuariesOceans and Seas
60 Wetland 6162
Forested WetlandNon-forested Wetland
70 Barren Land 71727374757677
Dry Salt FlatsBeachesSandy Areas Other than BeachesBare Exposed RockStrip Mines, Quarries, and Gravel PitsTransitional AreasMixed Barren Land
80 Tundra 8182838485
Shrub and Brush TundraHerbaceous TundraBare GroundWet TundraMixed Tundra
90 Perennial Snow or Ice 9192
Perennial SnowfieldsGlaciers
Brandon Generating Station Licence ReviewAir Quality Impact Assessment
38106 – 20 June 2006 23 SENES Consultants Limited
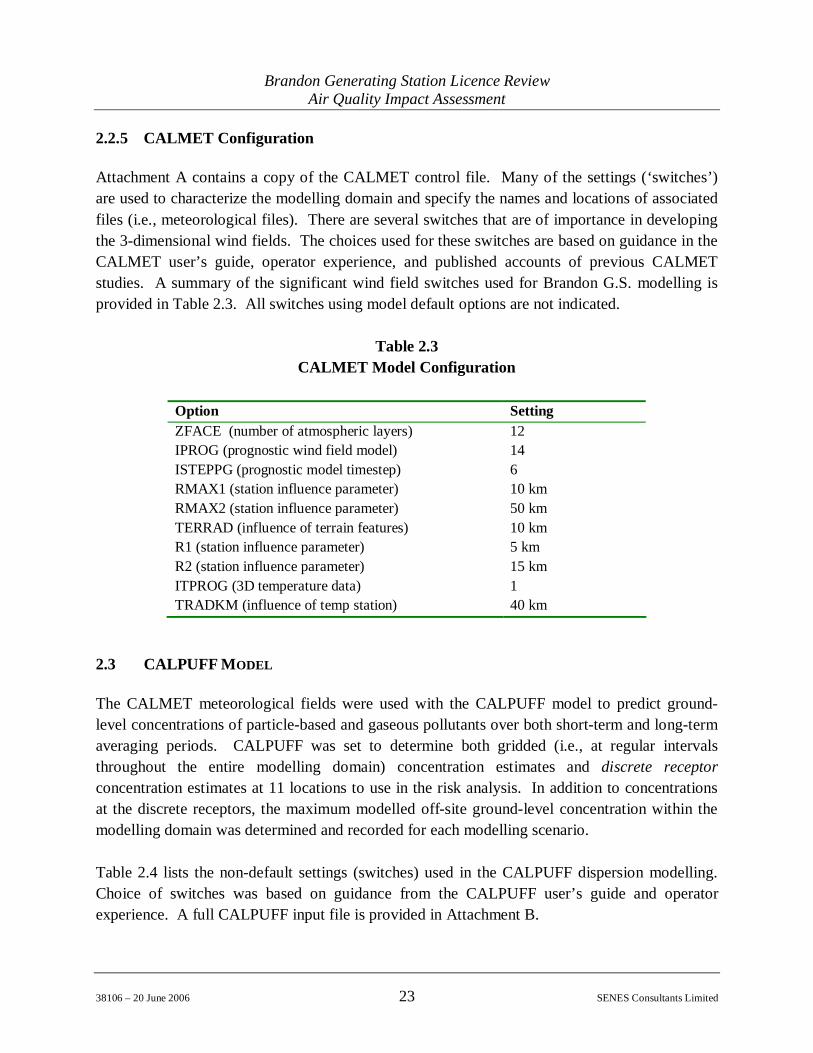
2.2.5 CALMET Configuration
Attachment A contains a copy of the CALMET control file. Many of the settings (‘switches’)are used to characterize the modelling domain and specify the names and locations of associatedfiles (i.e., meteorological files). There are several switches that are of importance in developingthe 3-dimensional wind fields. The choices used for these switches are based on guidance in theCALMET user’s guide, operator experience, and published accounts of previous CALMETstudies. A summary of the significant wind field switches used for Brandon G.S. modelling isprovided in Table 2.3. All switches using model default options are not indicated.
Table 2.3CALMET Model Configuration
Option SettingZFACE (number of atmospheric layers) 12IPROG (prognostic wind field model) 14ISTEPPG (prognostic model timestep) 6RMAX1 (station influence parameter) 10 kmRMAX2 (station influence parameter) 50 kmTERRAD (influence of terrain features) 10 kmR1 (station influence parameter) 5 kmR2 (station influence parameter) 15 kmITPROG (3D temperature data) 1TRADKM (influence of temp station) 40 km
2.3 CALPUFF MODEL
The CALMET meteorological fields were used with the CALPUFF model to predict ground-level concentrations of particle-based and gaseous pollutants over both short-term and long-termaveraging periods. CALPUFF was set to determine both gridded (i.e., at regular intervalsthroughout the entire modelling domain) concentration estimates and discrete receptorconcentration estimates at 11 locations to use in the risk analysis. In addition to concentrationsat the discrete receptors, the maximum modelled off-site ground-level concentration within themodelling domain was determined and recorded for each modelling scenario.
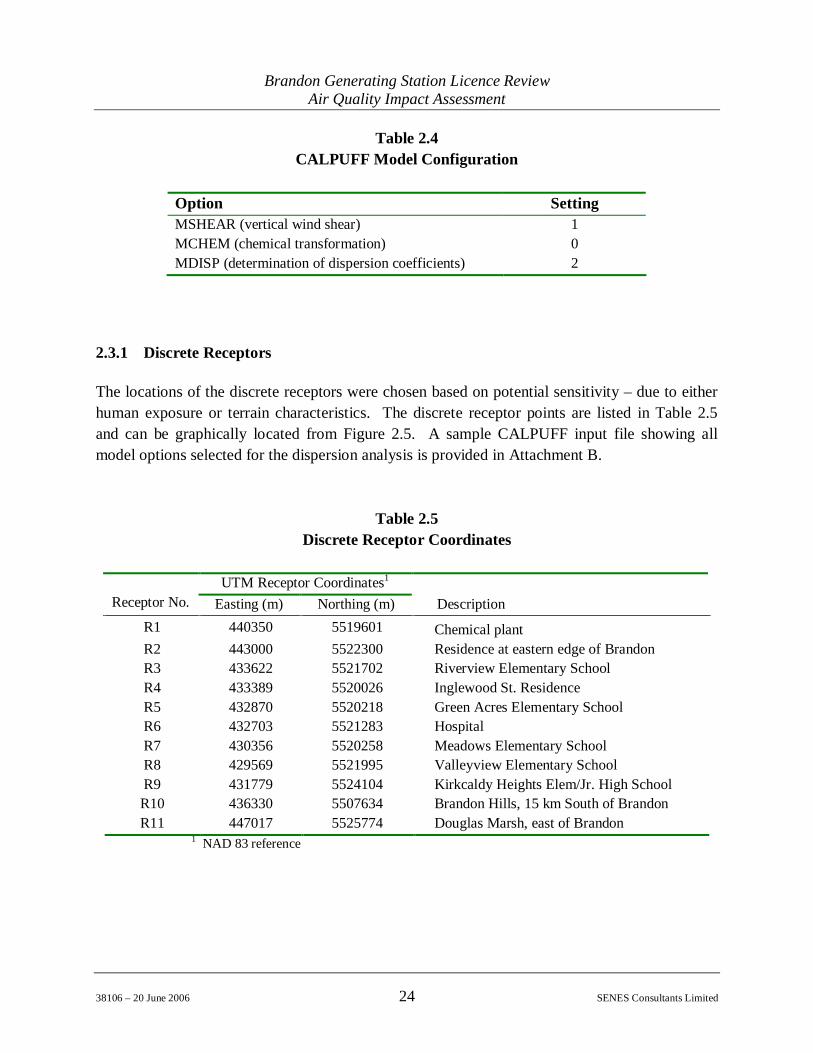
Table 2.4 lists the non-default settings (switches) used in the CALPUFF dispersion modelling.Choice of switches was based on guidance from the CALPUFF user’s guide and operatorexperience. A full CALPUFF input file is provided in Attachment B.
Brandon Generating Station Licence ReviewAir Quality Impact Assessment
38106 – 20 June 2006 24 SENES Consultants Limited
Table 2.4CALPUFF Model Configuration
Option SettingMSHEAR (vertical wind shear) 1MCHEM (chemical transformation) 0MDISP (determination of dispersion coefficients) 2
2.3.1 Discrete Receptors
The locations of the discrete receptors were chosen based on potential sensitivity – due to eitherhuman exposure or terrain characteristics. The discrete receptor points are listed in Table 2.5and can be graphically located from Figure 2.5. A sample CALPUFF input file showing allmodel options selected for the dispersion analysis is provided in Attachment B.
Table 2.5Discrete Receptor Coordinates
UTM Receptor Coordinates1
Receptor No. Easting (m) Northing (m) DescriptionR1 440350 5519601 Chemical plantR2 443000 5522300 Residence at eastern edge of BrandonR3 433622 5521702 Riverview Elementary SchoolR4 433389 5520026 Inglewood St. ResidenceR5 432870 5520218 Green Acres Elementary SchoolR6 432703 5521283 HospitalR7 430356 5520258 Meadows Elementary SchoolR8 429569 5521995 Valleyview Elementary SchoolR9 431779 5524104 Kirkcaldy Heights Elem/Jr. High SchoolR10 436330 5507634 Brandon Hills, 15 km South of BrandonR11 447017 5525774 Douglas Marsh, east of Brandon
1 NAD 83 reference
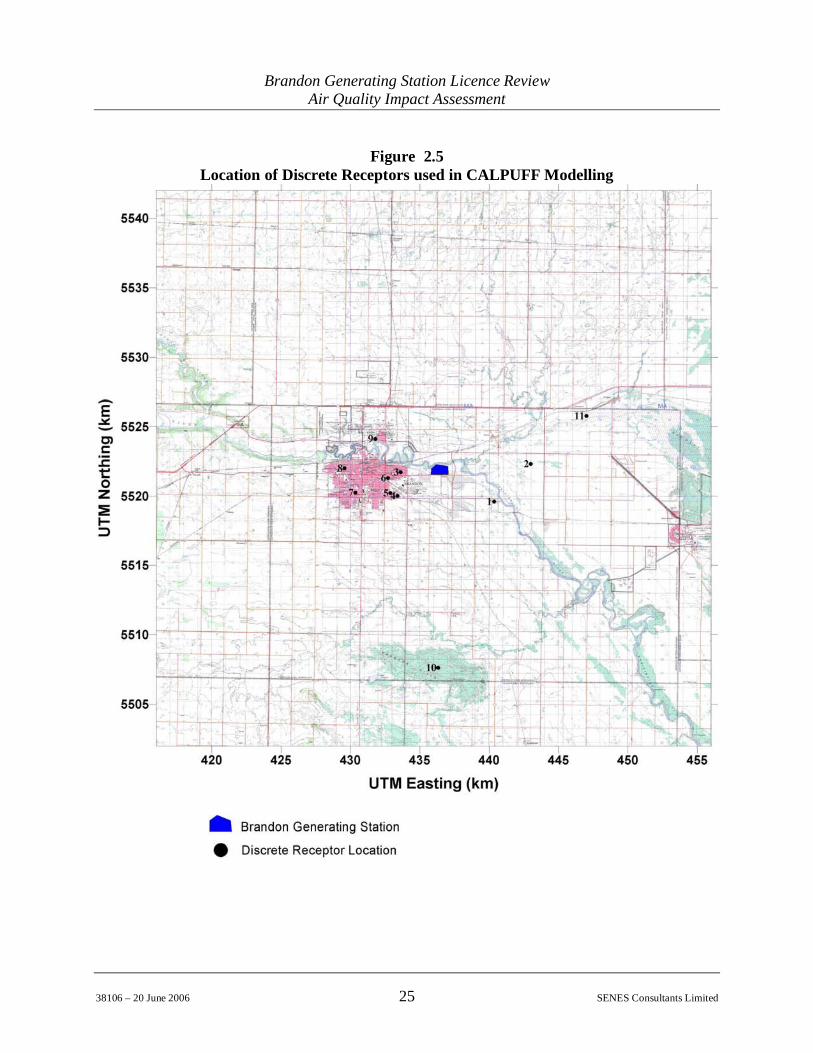
Brandon Generating Station Licence ReviewAir Quality Impact Assessment
38106 – 20 June 2006 25 SENES Consultants Limited
Figure 2.5Location of Discrete Receptors used in CALPUFF Modelling
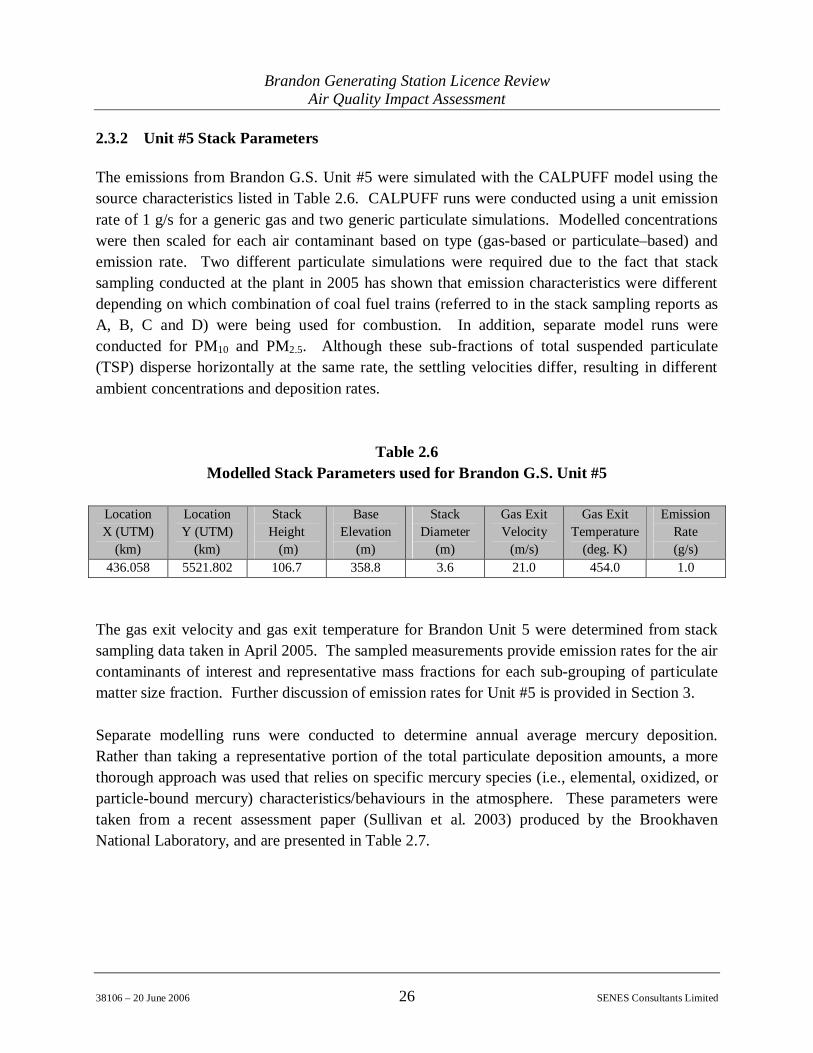
Brandon Generating Station Licence ReviewAir Quality Impact Assessment
38106 – 20 June 2006 26 SENES Consultants Limited
2.3.2 Unit #5 Stack Parameters
The emissions from Brandon G.S. Unit #5 were simulated with the CALPUFF model using thesource characteristics listed in Table 2.6. CALPUFF runs were conducted using a unit emissionrate of 1 g/s for a generic gas and two generic particulate simulations. Modelled concentrationswere then scaled for each air contaminant based on type (gas-based or particulate–based) andemission rate. Two different particulate simulations were required due to the fact that stacksampling conducted at the plant in 2005 has shown that emission characteristics were differentdepending on which combination of coal fuel trains (referred to in the stack sampling reports asA, B, C and D) were being used for combustion. In addition, separate model runs wereconducted for PM10 and PM2.5. Although these sub-fractions of total suspended particulate(TSP) disperse horizontally at the same rate, the settling velocities differ, resulting in differentambient concentrations and deposition rates.
Table 2.6Modelled Stack Parameters used for Brandon G.S. Unit #5
LocationX (UTM)
(km)
LocationY (UTM)
(km)
StackHeight (m)
BaseElevation
(m)
StackDiameter
(m)
Gas ExitVelocity
(m/s)
Gas ExitTemperature
(deg. K)
EmissionRate(g/s)
436.058 5521.802 106.7 358.8 3.6 21.0 454.0 1.0
The gas exit velocity and gas exit temperature for Brandon Unit 5 were determined from stacksampling data taken in April 2005. The sampled measurements provide emission rates for the aircontaminants of interest and representative mass fractions for each sub-grouping of particulatematter size fraction. Further discussion of emission rates for Unit #5 is provided in Section 3.
Separate modelling runs were conducted to determine annual average mercury deposition.Rather than taking a representative portion of the total particulate deposition amounts, a morethorough approach was used that relies on specific mercury species (i.e., elemental, oxidized, orparticle-bound mercury) characteristics/behaviours in the atmosphere. These parameters weretaken from a recent assessment paper (Sullivan et al. 2003) produced by the BrookhavenNational Laboratory, and are presented in Table 2.7.

Brandon Generating Station Licence ReviewAir Quality Impact Assessment
38106 – 20 June 2006 27 SENES Consultants Limited
Table 2.7Mercury Deposition Parameters used in CALPUFF Modelling
Form of Mercury Liquid ScavengingCoefficient (s-mm/hr)-1
Frozen ScavengingCoefficient (s-mm/hr)-1
Deposition Velocity(cm/s)
Hg – elemental 3.31 x 10⁻⁷ 1.0 x 10⁻⁷ 0.06Hg – reactive 2.5 x 10⁻⁴ 5.0 x 10⁻⁵ 2.9Hg particle(< 2.5 µm)
7.0 x 10⁻⁵ 2.0 x 10⁻⁵ 0.09
Hg particle(> 2.5 µm)
2.8 x 10⁻⁴ 5.0 x 10⁻⁵ 0.45
As with other modelling runs, the mercury deposition simulations were completed using unitemission rates, and resulting deposition amounts were scaled to the measured mercury emissionrates from recent stack testing in April 2005. Three separate simulations were completed, toaccount for the different behaviours of emitted mercury species (elemental, reactive (gaseous)and particle-based). The particle simulation separated emissions into a fine component, withaverage diameter of 0.68 microns, and a coarser component with average diameter of 3.5microns. Finally, the total annual deposition amount was determined by summing the depositionvalues from the three simulations.
2.3.3 Combustion Turbines (CTs)
The combustion turbines at the Brandon G.S. operate under a separate permit, and as such arenot a formal part of the Brandon G.S. licence review. However, in view of the fact that there isa potential for the CTs to be operating at the same time that Unit #5 is operating, the combinedimpacts on air quality from emissions due to both the CTs and Unit #5 were evaluated in thisassessment.
Table 2.8 lists the source characteristics used for each CT in the CALPUFF model. Turbineproperties were available from ABB Alstom Ltd. (Switzerland), the CT manufacturers, who alsoprovide operational data such as gas exit temperature and velocity under different loads(percentage of maximum power).
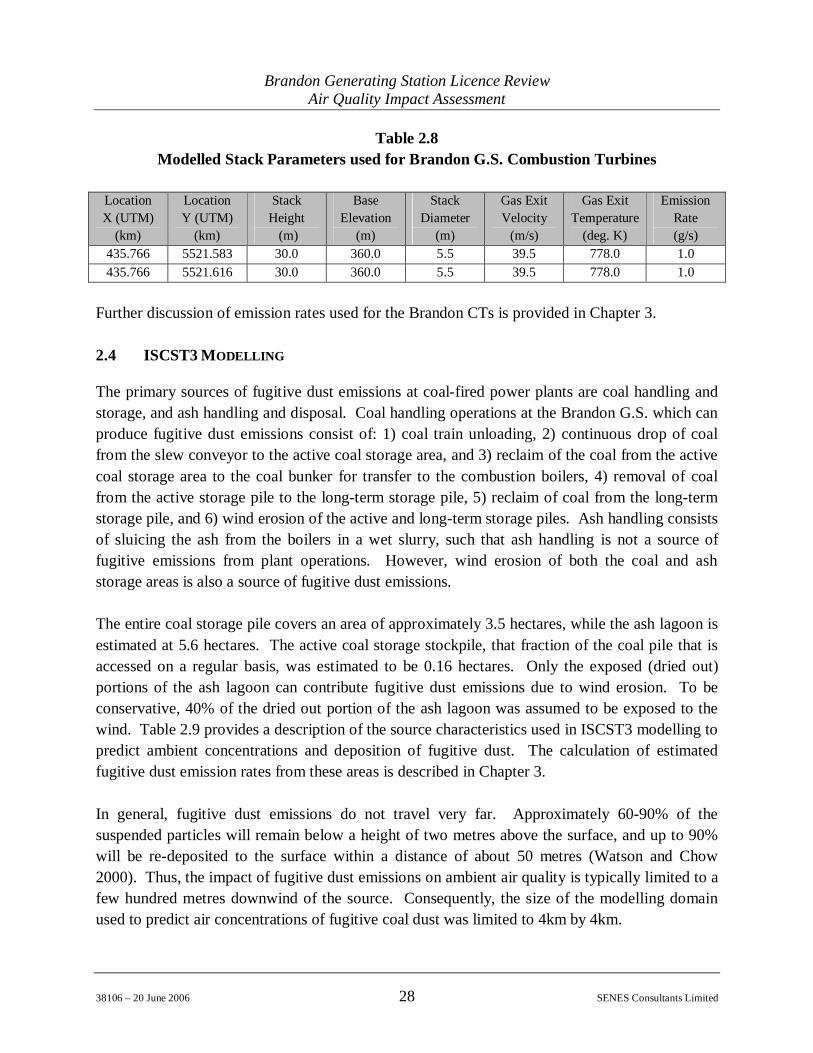
Brandon Generating Station Licence ReviewAir Quality Impact Assessment
38106 – 20 June 2006 28 SENES Consultants Limited
Table 2.8Modelled Stack Parameters used for Brandon G.S. Combustion Turbines
LocationX (UTM)
(km)
LocationY (UTM)
(km)
StackHeight (m)
BaseElevation
(m)
StackDiameter
(m)
Gas ExitVelocity
(m/s)
Gas ExitTemperature
(deg. K)
EmissionRate(g/s)
435.766 5521.583 30.0 360.0 5.5 39.5 778.0 1.0435.766 5521.616 30.0 360.0 5.5 39.5 778.0 1.0
Further discussion of emission rates used for the Brandon CTs is provided in Chapter 3.
2.4 ISCST3 MODELLING
The primary sources of fugitive dust emissions at coal-fired power plants are coal handling andstorage, and ash handling and disposal. Coal handling operations at the Brandon G.S. which canproduce fugitive dust emissions consist of: 1) coal train unloading, 2) continuous drop of coalfrom the slew conveyor to the active coal storage area, and 3) reclaim of the coal from the activecoal storage area to the coal bunker for transfer to the combustion boilers, 4) removal of coalfrom the active storage pile to the long-term storage pile, 5) reclaim of coal from the long-termstorage pile, and 6) wind erosion of the active and long-term storage piles. Ash handling consistsof sluicing the ash from the boilers in a wet slurry, such that ash handling is not a source offugitive emissions from plant operations. However, wind erosion of both the coal and ashstorage areas is also a source of fugitive dust emissions.
The entire coal storage pile covers an area of approximately 3.5 hectares, while the ash lagoon isestimated at 5.6 hectares. The active coal storage stockpile, that fraction of the coal pile that isaccessed on a regular basis, was estimated to be 0.16 hectares. Only the exposed (dried out)portions of the ash lagoon can contribute fugitive dust emissions due to wind erosion. To beconservative, 40% of the dried out portion of the ash lagoon was assumed to be exposed to thewind. Table 2.9 provides a description of the source characteristics used in ISCST3 modelling topredict ambient concentrations and deposition of fugitive dust. The calculation of estimatedfugitive dust emission rates from these areas is described in Chapter 3.
In general, fugitive dust emissions do not travel very far. Approximately 60-90% of thesuspended particles will remain below a height of two metres above the surface, and up to 90%will be re-deposited to the surface within a distance of about 50 metres (Watson and Chow2000). Thus, the impact of fugitive dust emissions on ambient air quality is typically limited to afew hundred metres downwind of the source. Consequently, the size of the modelling domainused to predict air concentrations of fugitive coal dust was limited to 4km by 4km.
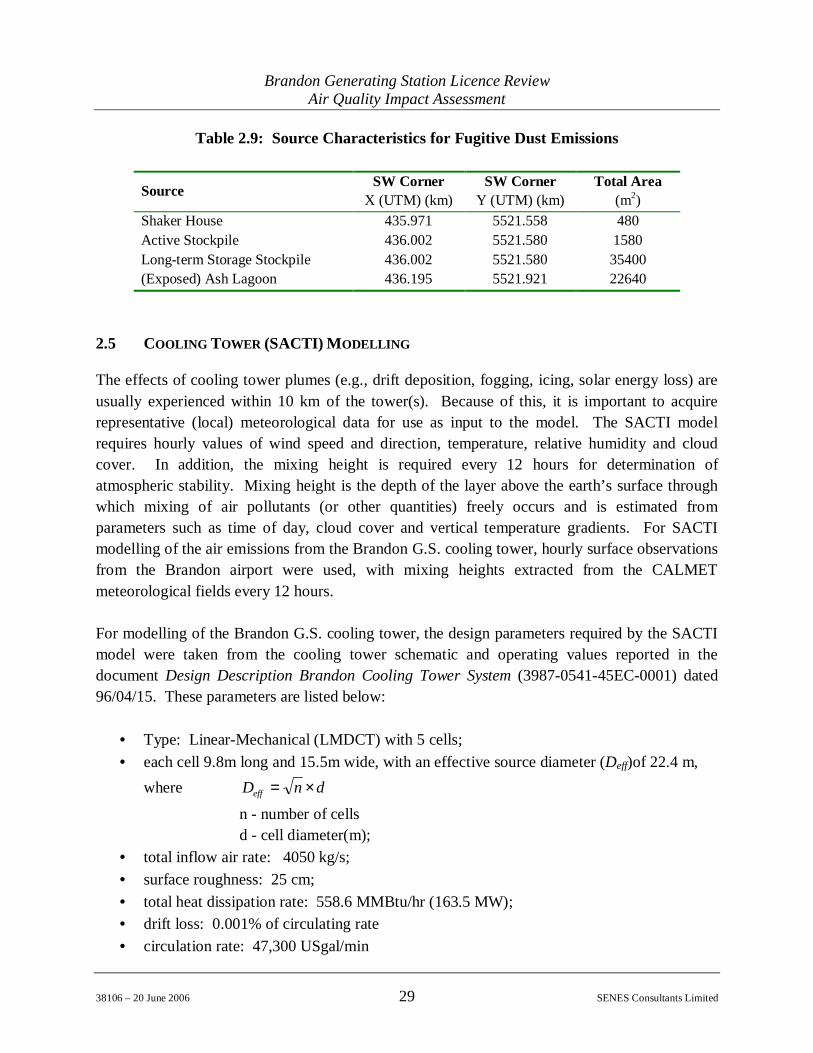
Brandon Generating Station Licence ReviewAir Quality Impact Assessment
38106 – 20 June 2006 29 SENES Consultants Limited
Table 2.9: Source Characteristics for Fugitive Dust Emissions
Source SW CornerX (UTM) (km)
SW CornerY (UTM) (km)
Total Area(m2)
Shaker House 435.971 5521.558 480Active Stockpile 436.002 5521.580 1580Long-term Storage Stockpile 436.002 5521.580 35400(Exposed) Ash Lagoon 436.195 5521.921 22640
2.5 COOLING TOWER (SACTI) MODELLING
The effects of cooling tower plumes (e.g., drift deposition, fogging, icing, solar energy loss) areusually experienced within 10 km of the tower(s). Because of this, it is important to acquirerepresentative (local) meteorological data for use as input to the model. The SACTI modelrequires hourly values of wind speed and direction, temperature, relative humidity and cloudcover. In addition, the mixing height is required every 12 hours for determination ofatmospheric stability. Mixing height is the depth of the layer above the earth’s surface throughwhich mixing of air pollutants (or other quantities) freely occurs and is estimated fromparameters such as time of day, cloud cover and vertical temperature gradients. For SACTImodelling of the air emissions from the Brandon G.S. cooling tower, hourly surface observationsfrom the Brandon airport were used, with mixing heights extracted from the CALMETmeteorological fields every 12 hours.
For modelling of the Brandon G.S. cooling tower, the design parameters required by the SACTImodel were taken from the cooling tower schematic and operating values reported in thedocument Design Description Brandon Cooling Tower System (3987-0541-45EC-0001) dated96/04/15. These parameters are listed below:
• Type: Linear-Mechanical (LMDCT) with 5 cells;• each cell 9.8m long and 15.5m wide, with an effective source diameter (Deff)of 22.4 m,
where dnDeff ×=
n - number of cellsd - cell diameter(m);
• total inflow air rate: 4050 kg/s;• surface roughness: 25 cm;• total heat dissipation rate: 558.6 MMBtu/hr (163.5 MW);• drift loss: 0.001% of circulating rate• circulation rate: 47,300 USgal/min
Brandon Generating Station Licence ReviewAir Quality Impact Assessment
38106 – 20 June 2006 30 SENES Consultants Limited
• length of LMDCT housing: 50.0 m;• width of LMDCT housing: 22.5 m;• height of tower: 18.4 m;• LMDCT orientation: east – west;• number of water drop sizes: 31;• water salt concentration: 0.0044 g salt / g solution, and;• salt density: 2.17g/cm3.
2.5.1 Plume Parameters
Important properties of the cooling tower plumes and their effects are described below.
Relative Humidity
Water vapour is the major emission to the atmosphere from a cooling tower. The amount ofwater vapour in the air is referred to as humidity. Relative humidity is defined as the ratio ofobserved vapour pressure to the saturation vapour pressure for the observed temperature. Therelative humidity can increase either by the increase in vapour content by evaporation or by thedecrease of the saturation vapour pressure from a decrease in temperature. If the relativehumidity is raised above 100 percent by either of these processes, condensation will occur.When the relative humidity exceeds the saturation point of the air immediately above the groundsurface, fog forms; when this occurs aloft, clouds develop. When the temperature is below 0ºC,icing may occur on the ground or on buildings.
Visible Plume
The plume is visible when the initial flux of moisture is greater than the saturation deficit flux,which is function of height. Both of these parameters have to be known for calculations ofvisible plume. The important parameters which describe visible plume are: plume height (H),plume length (L) and plume radius (R), (Figure 2.6). The idealized "shadowing plume" is alsoshown in Figure 2.6. The projection of this plume to the ground represents shadow and it ismeasured and expressed as the number of hours in a season or year during which shadowingeffects occur on the ground.
Energy Loss
During visible plume shadowing, there can be a decrease in the amount of short wave (solar)radiation reaching the ground. This effect, expressed as hours of shadowing, may be importantabove agricultural land. The actual amount of radiation attenuation is not determined.
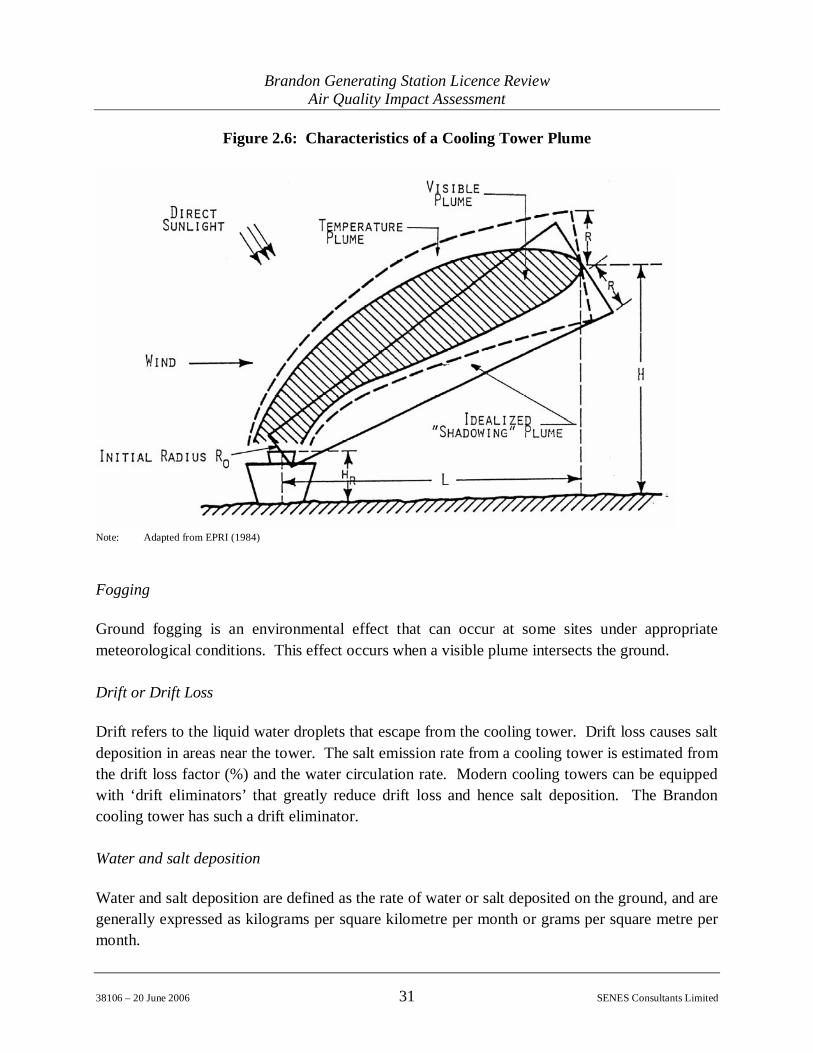
Brandon Generating Station Licence ReviewAir Quality Impact Assessment
38106 – 20 June 2006 31 SENES Consultants Limited
Figure 2.6: Characteristics of a Cooling Tower Plume
Note: Adapted from EPRI (1984)
Fogging
Ground fogging is an environmental effect that can occur at some sites under appropriatemeteorological conditions. This effect occurs when a visible plume intersects the ground.
Drift or Drift Loss
Drift refers to the liquid water droplets that escape from the cooling tower. Drift loss causes saltdeposition in areas near the tower. The salt emission rate from a cooling tower is estimated fromthe drift loss factor (%) and the water circulation rate. Modern cooling towers can be equippedwith ‘drift eliminators’ that greatly reduce drift loss and hence salt deposition. The Brandoncooling tower has such a drift eliminator.
Water and salt deposition
Water and salt deposition are defined as the rate of water or salt deposited on the ground, and aregenerally expressed as kilograms per square kilometre per month or grams per square metre permonth.
Brandon Generating Station Licence ReviewAir Quality Impact Assessment
38106 – 20 June 2006 32 SENES Consultants Limited
3.0 EMISSIONS DATA
Coal is the primary fuel with No. 2 fuel oil used for lighting off the burners and flamestabilization during low load operation on Unit #5. Since emissions of various contaminants ofpotential concern (COPC) are higher for coal operations than for fuel oil operations, only theimpacts due to coal-fired operations were considered in this assessment.
The air emissions from coal combustion primarily consist of common air contaminants such asoxides of nitrogen (NOx), carbon monoxide (CO), sulphur dioxide (SO2) and particulate matter.There are also small quantities of some volatile organic compounds, and trace quantities of bothorganic compounds and inorganic elements associated with the particulate matter, as well asemissions of carbon dioxide (CO2) and small quantities of other greenhouse gases such asmethane (CH4) and nitrous oxide (N2O).
Air emissions from natural gas combustion in the two combustion turbines contain much of thesame air contaminants, but in different proportions. In particular, the emission of particulatematter and sulphur dioxide from natural gas combustion is significantly lower compared to coalcombustion. In addition to combustion products from the use of natural gas as an energy source,direct venting of the gas in the section of pipeline leading to the combustion turbines mayinfrequently occur.
There are two general methods of determining air emissions from sources of air contaminants.Where possible, the preferred method is to use direct measurement data from samplingprograms. The emission rates for the common air contaminants, as well as for most of theinorganic (trace metal species) and organic compounds (polycyclic aromatic hydrocarbons(PAH), dioxins and furans) were derived from stack sampling tests conducted in 2005 (ORTECH2005). The sampling was conducted on the exhaust from Unit #5, operating at an averagegeneration rate of 102 MW, and scaled upward to 105 MW to represent the potential maximumemissions rate at the maximum (short-term) sustained generation rate of 105 MW. Maximumsustained generation assumes a coal combustion rate of 60 tonnes/hr at the rated capacity of 105MW.
The second method involves use of activity-based emission factors available from the U.S. EPA(AP-42, 1.1). An emission factor ”…is a representative value that attempts to relate the quantityof a pollutant released to the atmosphere with an activity associated with the release of thatpollutant.” (US EPA AP-42 1995). Associated emissions of volatile organic compounds(VOCs) from coal combustion in Unit #5 were estimated in this manner. The emission factorswere used with the maximum hourly coal consumption rate.
Brandon Generating Station Licence ReviewAir Quality Impact Assessment
38106 – 20 June 2006 33 SENES Consultants Limited
The emission factor approach is also widely used for estimating fugitive dust emissions, sincethese are much harder to measure than stack emissions. The emission factors are empiricallydetermined using data from previous sampling programs and are specific to industrial activity.In many cases, the equations also factor in environmental variables such as moisture and windspeed. Typically, the equations are very conservative and represent ‘upper-bound’ conditions.As such, the EPA recommends a general approach that accounts for mitigative measures such aswatering to reduce dust transport. The equation shown below is representative of this approach(US EPA 1995):
E = A x EF x (1 – ER/100)
where: E = emission rateA = activityEF = emission factorER = emission reduction (or control) efficiency (%)
Fugitive coal dust emissions are in the form of particulate matter, and mainly consist of largersize fractions (i.e., TSP rather than PM10 or PM2.5). Trace quantities of inorganic elements,including some heavy metal species are included within the TSP. In addition, emissions fromash lagoons also include trace inorganic elements and organic products of incompletecombustion.
The emission rates at the maximum sustained power generation rate (100% capacity factor) wereused to calculate all short-term and long-term ambient air concentrations (i.e., 1-hour, 8-hour,24-hour and annual averages) for comparison with Provincial and Federal ambient air qualityguidelines and objectives, as well as for estimating deposition rates for organic and inorganiccontaminants. Thus, all potential human health and ecological risks (Appendix N) werecalculated assuming Unit #5 operates entirely at a capacity factor of 100%.
Emissions from a cooling tower include salts and water vapour. In sufficient quantities, saltdeposition can be damaging to crops, vegetation or aquatic life. Ambient water vapourconcentrations can lead to a reduction of visibility, an unattractive viewscape or icing due toimpingement of the plume on the ground.
3.1 UNIT #5 FUEL DELIVERY SYSTEM DESCRIPTION
The Unit #5 boiler has four rows of burners designated A, B, C, and D, with row A located at thehighest elevation and row D located at the lowest. Each row has three individual burners for atotal of 12 burners. Pulverized coal is delivered to the burner rows by “fuel trains” which
Brandon Generating Station Licence ReviewAir Quality Impact Assessment
38106 – 20 June 2006 34 SENES Consultants Limited
correspond to each row of burners. Each fuel train consists of the following major components;a raw coal bunker to store the coal, a coal feeder to control the flow of coal, a pulverizer to grindthe coal, piping to deliver the pulverized coal to the burner row, and the burner row itself. Rawcoal moves from the bunker through the feeder, then to the pulverizer where is it ground into afine powder, mixed with air, and delivered by pipes to the burner row for combustion. Theboiler can be operated at maximum load using only three of the four rows of burners and isusually operated in this configuration as operation with all four burner rows results in decreasedboiler efficiency and increased pulverizer maintenance costs. For this reason there is usually a“spare” burner row and associated fuel train that is not in service when the boiler is in operationat full load. The result is that there are five possible combinations of burner rows that can beused to operate the boiler at maximum load; ABC, ABD, ACD, BCD, and ABCD. Figure 3.1below provides a schematic of the Unit #5 boiler with the B row illustrating a typical fuel train.
Each burner row combination has different operational and thermodynamic characteristics. Ofthe five possible burner row combinations, combination BCD provides the best operational andthermodynamic performance. This is the preferred combination for normal full-load operation,with the boiler being operated in the BCD burner row combination approximately 60% of thetime. Burner row combination ABC provides the least efficient operational and thermodynamicperformance. Operation of the boiler in this combination (ABC) is minimized to the extentpossible and is estimated to be used approximately 10% of the time. However, due to fuel trainequipment maintenance requirements and occasional operational problems, such as frozen coalplugging bunkers, chutes, and feeders in the winter, operation in the preferred combination is notalways possible and the boiler must be operated in one of the other four burner row combinationsapproximately 40% of the time (i.e., approximately 10% of the time in each of ABC, ABD,ACD, and ABCD).
Stack emission tests conducted in 2005 have shown that, for some air contaminants, amountsreleased can be substantially lower with the preferred burner row combination BCD than withthe least efficient burner row combination ABC. This is the case for nitrogen dioxide (NO2) andparticulate matter, and to a lesser extent for SO2 and CO emissions.
When Unit #5 is on-line, there are often periods of time when full load operation is not required.During these periods, two rows of burners are typically used instead of three. In this mode ofoperation, the preferred burner row combinations are AB and AC. Relative to full load operationwith three rows of burners, there is a significant reduction in the amount of contaminantsreleased when operating the boiler at part load with two rows of burners regardless of the burnercombinations used. Because emissions are lower during this type of operation, these emissionswere not considered in the air quality impact assessment.
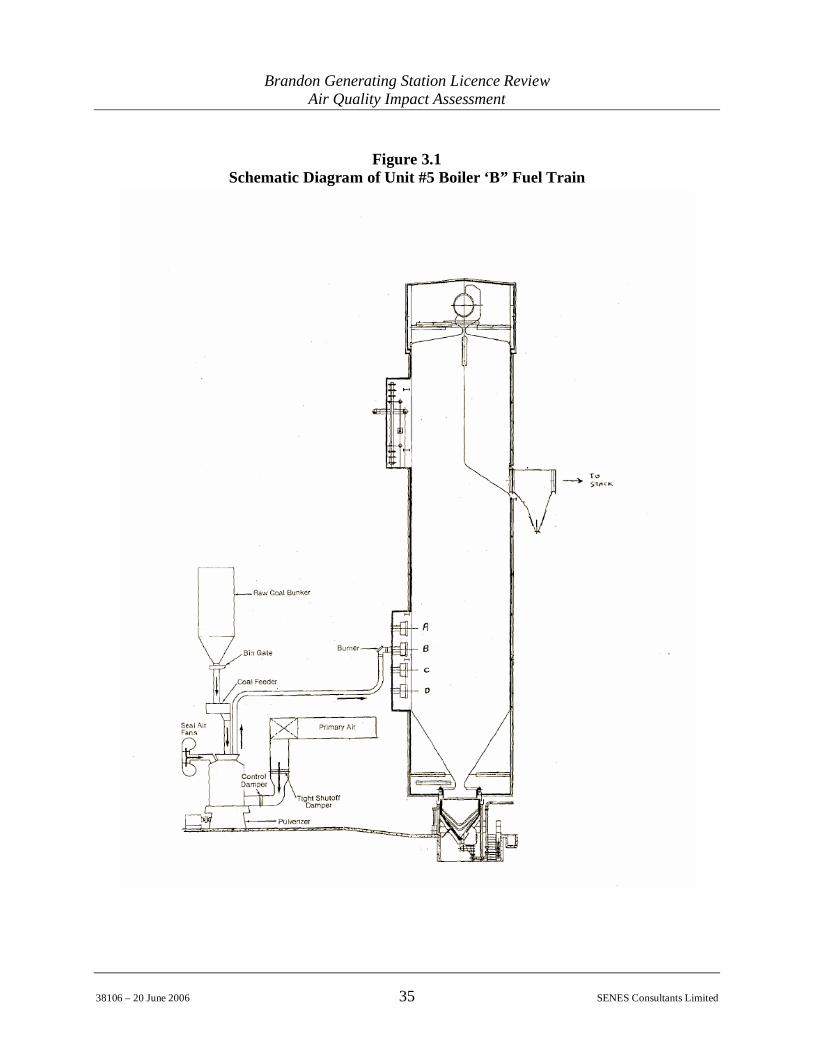
Brandon Generating Station Licence ReviewAir Quality Impact Assessment
38106 – 20 June 2006 35 SENES Consultants Limited
Figure 3.1Schematic Diagram of Unit #5 Boiler ‘B” Fuel Train
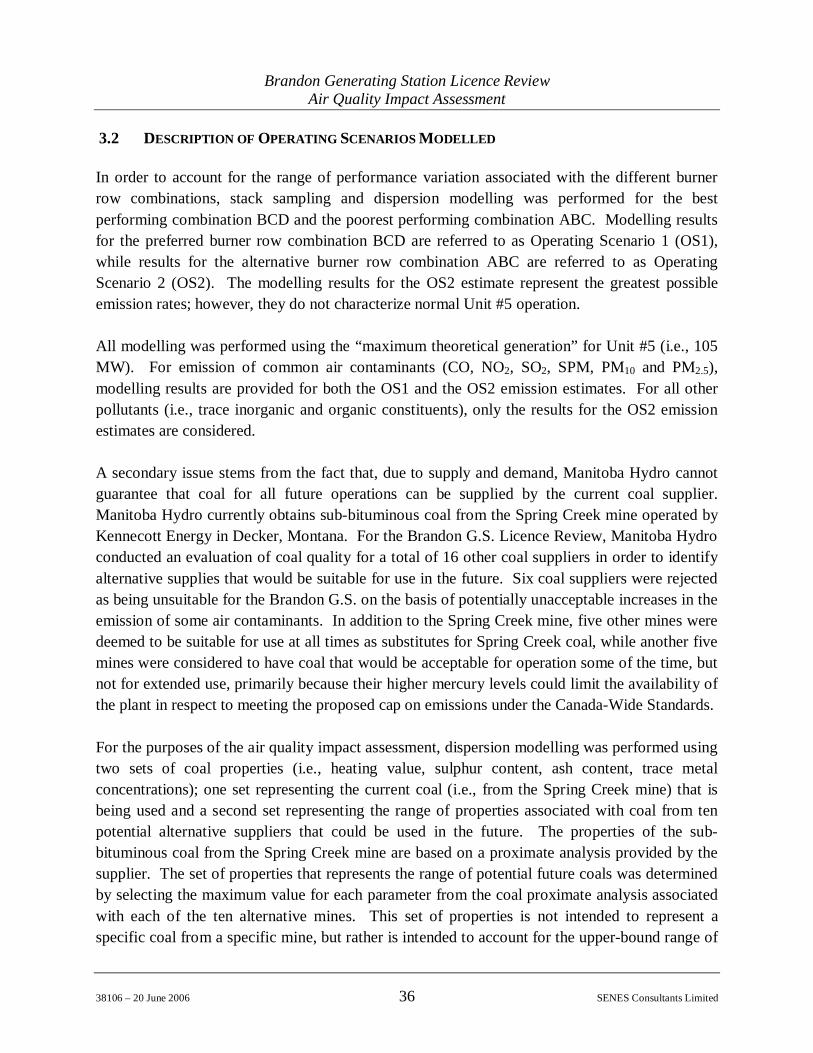
Brandon Generating Station Licence ReviewAir Quality Impact Assessment
38106 – 20 June 2006 36 SENES Consultants Limited
3.2 DESCRIPTION OF OPERATING SCENARIOS MODELLED
In order to account for the range of performance variation associated with the different burnerrow combinations, stack sampling and dispersion modelling was performed for the bestperforming combination BCD and the poorest performing combination ABC. Modelling resultsfor the preferred burner row combination BCD are referred to as Operating Scenario 1 (OS1),while results for the alternative burner row combination ABC are referred to as OperatingScenario 2 (OS2). The modelling results for the OS2 estimate represent the greatest possibleemission rates; however, they do not characterize normal Unit #5 operation.
All modelling was performed using the “maximum theoretical generation” for Unit #5 (i.e., 105MW). For emission of common air contaminants (CO, NO2, SO2, SPM, PM10 and PM2.5),modelling results are provided for both the OS1 and the OS2 emission estimates. For all otherpollutants (i.e., trace inorganic and organic constituents), only the results for the OS2 emissionestimates are considered.
A secondary issue stems from the fact that, due to supply and demand, Manitoba Hydro cannotguarantee that coal for all future operations can be supplied by the current coal supplier.Manitoba Hydro currently obtains sub-bituminous coal from the Spring Creek mine operated byKennecott Energy in Decker, Montana. For the Brandon G.S. Licence Review, Manitoba Hydroconducted an evaluation of coal quality for a total of 16 other coal suppliers in order to identifyalternative supplies that would be suitable for use in the future. Six coal suppliers were rejectedas being unsuitable for the Brandon G.S. on the basis of potentially unacceptable increases in theemission of some air contaminants. In addition to the Spring Creek mine, five other mines weredeemed to be suitable for use at all times as substitutes for Spring Creek coal, while another fivemines were considered to have coal that would be acceptable for operation some of the time, butnot for extended use, primarily because their higher mercury levels could limit the availability ofthe plant in respect to meeting the proposed cap on emissions under the Canada-Wide Standards.
For the purposes of the air quality impact assessment, dispersion modelling was performed usingtwo sets of coal properties (i.e., heating value, sulphur content, ash content, trace metalconcentrations); one set representing the current coal (i.e., from the Spring Creek mine) that isbeing used and a second set representing the range of properties associated with coal from tenpotential alternative suppliers that could be used in the future. The properties of the sub-bituminous coal from the Spring Creek mine are based on a proximate analysis provided by thesupplier. The set of properties that represents the range of potential future coals was determinedby selecting the maximum value for each parameter from the coal proximate analysis associatedwith each of the ten alternative mines. This set of properties is not intended to represent aspecific coal from a specific mine, but rather is intended to account for the upper-bound range of
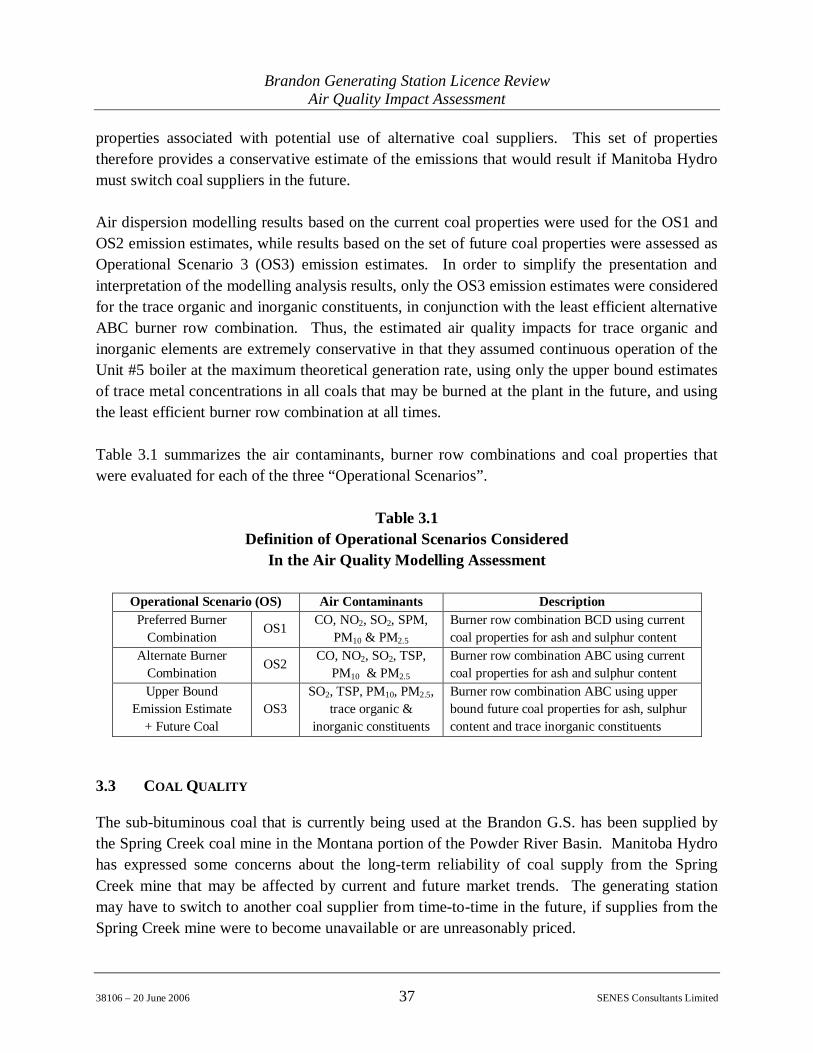
Brandon Generating Station Licence ReviewAir Quality Impact Assessment
38106 – 20 June 2006 37 SENES Consultants Limited
properties associated with potential use of alternative coal suppliers. This set of propertiestherefore provides a conservative estimate of the emissions that would result if Manitoba Hydromust switch coal suppliers in the future.
Air dispersion modelling results based on the current coal properties were used for the OS1 andOS2 emission estimates, while results based on the set of future coal properties were assessed asOperational Scenario 3 (OS3) emission estimates. In order to simplify the presentation andinterpretation of the modelling analysis results, only the OS3 emission estimates were consideredfor the trace organic and inorganic constituents, in conjunction with the least efficient alternativeABC burner row combination. Thus, the estimated air quality impacts for trace organic andinorganic elements are extremely conservative in that they assumed continuous operation of theUnit #5 boiler at the maximum theoretical generation rate, using only the upper bound estimatesof trace metal concentrations in all coals that may be burned at the plant in the future, and usingthe least efficient burner row combination at all times.
Table 3.1 summarizes the air contaminants, burner row combinations and coal properties thatwere evaluated for each of the three “Operational Scenarios”.
Table 3.1Definition of Operational Scenarios Considered
In the Air Quality Modelling Assessment
Operational Scenario (OS) Air Contaminants DescriptionPreferred Burner
CombinationOS1 CO, NO2, SO2, SPM,
PM10 & PM2.5
Burner row combination BCD using currentcoal properties for ash and sulphur content
Alternate BurnerCombination
OS2 CO, NO2, SO2, TSP,PM10 & PM2.5
Burner row combination ABC using currentcoal properties for ash and sulphur content
Upper BoundEmission Estimate
+ Future CoalOS3
SO2, TSP, PM10, PM2.5,trace organic &
inorganic constituents
Burner row combination ABC using upperbound future coal properties for ash, sulphurcontent and trace inorganic constituents
3.3 COAL QUALITY
The sub-bituminous coal that is currently being used at the Brandon G.S. has been supplied bythe Spring Creek coal mine in the Montana portion of the Powder River Basin. Manitoba Hydrohas expressed some concerns about the long-term reliability of coal supply from the SpringCreek mine that may be affected by current and future market trends. The generating stationmay have to switch to another coal supplier from time-to-time in the future, if supplies from theSpring Creek mine were to become unavailable or are unreasonably priced.
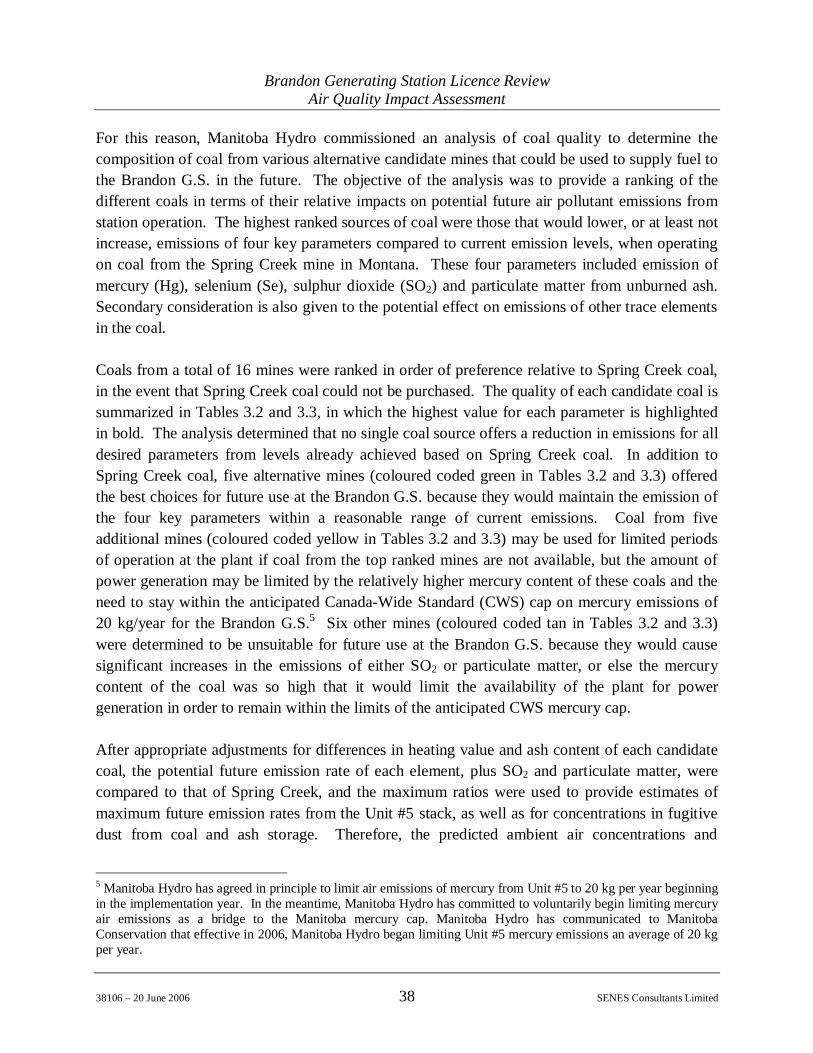
Brandon Generating Station Licence ReviewAir Quality Impact Assessment
38106 – 20 June 2006 38 SENES Consultants Limited
For this reason, Manitoba Hydro commissioned an analysis of coal quality to determine thecomposition of coal from various alternative candidate mines that could be used to supply fuel tothe Brandon G.S. in the future. The objective of the analysis was to provide a ranking of thedifferent coals in terms of their relative impacts on potential future air pollutant emissions fromstation operation. The highest ranked sources of coal were those that would lower, or at least notincrease, emissions of four key parameters compared to current emission levels, when operatingon coal from the Spring Creek mine in Montana. These four parameters included emission ofmercury (Hg), selenium (Se), sulphur dioxide (SO2) and particulate matter from unburned ash.Secondary consideration is also given to the potential effect on emissions of other trace elementsin the coal.
Coals from a total of 16 mines were ranked in order of preference relative to Spring Creek coal,in the event that Spring Creek coal could not be purchased. The quality of each candidate coal issummarized in Tables 3.2 and 3.3, in which the highest value for each parameter is highlightedin bold. The analysis determined that no single coal source offers a reduction in emissions for alldesired parameters from levels already achieved based on Spring Creek coal. In addition toSpring Creek coal, five alternative mines (coloured coded green in Tables 3.2 and 3.3) offeredthe best choices for future use at the Brandon G.S. because they would maintain the emission ofthe four key parameters within a reasonable range of current emissions. Coal from fiveadditional mines (coloured coded yellow in Tables 3.2 and 3.3) may be used for limited periodsof operation at the plant if coal from the top ranked mines are not available, but the amount ofpower generation may be limited by the relatively higher mercury content of these coals and theneed to stay within the anticipated Canada-Wide Standard (CWS) cap on mercury emissions of20 kg/year for the Brandon G.S.5 Six other mines (coloured coded tan in Tables 3.2 and 3.3)were determined to be unsuitable for future use at the Brandon G.S. because they would causesignificant increases in the emissions of either SO2 or particulate matter, or else the mercurycontent of the coal was so high that it would limit the availability of the plant for powergeneration in order to remain within the limits of the anticipated CWS mercury cap.
After appropriate adjustments for differences in heating value and ash content of each candidatecoal, the potential future emission rate of each element, plus SO2 and particulate matter, werecompared to that of Spring Creek, and the maximum ratios were used to provide estimates ofmaximum future emission rates from the Unit #5 stack, as well as for concentrations in fugitivedust from coal and ash storage. Therefore, the predicted ambient air concentrations and
5 Manitoba Hydro has agreed in principle to limit air emissions of mercury from Unit #5 to 20 kg per year beginningin the implementation year. In the meantime, Manitoba Hydro has committed to voluntarily begin limiting mercuryair emissions as a bridge to the Manitoba mercury cap. Manitoba Hydro has communicated to ManitobaConservation that effective in 2006, Manitoba Hydro began limiting Unit #5 mercury emissions an average of 20 kgper year.

Brandon Generating Station Licence ReviewAir Quality Impact Assessment
38106 – 20 June 2006 39 SENES Consultants Limited
deposition rates presented in this report provide an assessment of both current and potentialfuture impacts from operations using any of the coals deemed to be suitable (highlighted in greenand yellow in Table 3.2) for use at the Brandon G.S. The values used for the human health andecological risk assessments also considered risk due to operations with Spring Creek coal as wellas for potential increases due to operations using other suitable coals. Only the six minesdeemed to be unsuitable were not considered further in this analysis.
In order to account for the varying hating value and ash content between the various coals, theemission rates of trace elements from the Unit #5 ESP outlet (expressed in g/MWh) wereobtained from the stack sampling program completed in 2005. Trace element emission rates (ing/MWh) for other candidate coals were then estimated by adjusting for the difference in traceelement concentration between coals and the average heating value of the candidate coals. Thiswas done to account for the differential partitioning that occurs in the boiler for differentelements during the combustion process. However, the correction was not applied to mercurybecause this element is primarily released in gaseous form. In addition, the calculated emissionrate was further adjusted for the difference in ash content between Spring Creek coal and theother candidate coals. The following is a sample calculation for arsenic from the Mine H coalversus Spring Creek (A) coal:
As (g/kWh)H = (HVA / HVH) x (CH / CA) x ERA x (AshH / AshA)
whereHVA is the as supplied heating value of Spring Creek coal (9350 BTU/lb)HVH is the as supplied heating value of Mine H coal (8781 BTU/lb)CH is the arsenic concentration in Mine H coal (1.04 mg/kg)CA is the arsenic concentration in Spring Creek coal (1.50 mg/kg)AshH is the ash content of Mine H coal (6.49 lb/MMBTU)AshH is the ash content of Spring Creek coal (4.55 lb/MMBTU)ERA is the measured arsenic emission rate for Spring Creek coal (0.016 g/MWh)
Using this method, the arsenic emission rate for Mine H coal is estimated at 0.0168 g/MWh.
Table 3.4 lists the ratios of estimated emission rates for the 10 alternative candidate coalsconsidered to be suitable for use at the Brandon G.S. relative to coal from the Spring Creek minethat is currently in use at the station. The highest ratios (indicated in bold) are those that wereused for defining the upper bound emission rates for operation scenario OS3. The relativedifference in emissions (both higher and lower) measured emission rates for Spring Creek coal in2005 and the 10 alternative candidate coals is illustrated in Figure 3.2, where Spring Creek coalemissions are designated as zero on the X-axis.
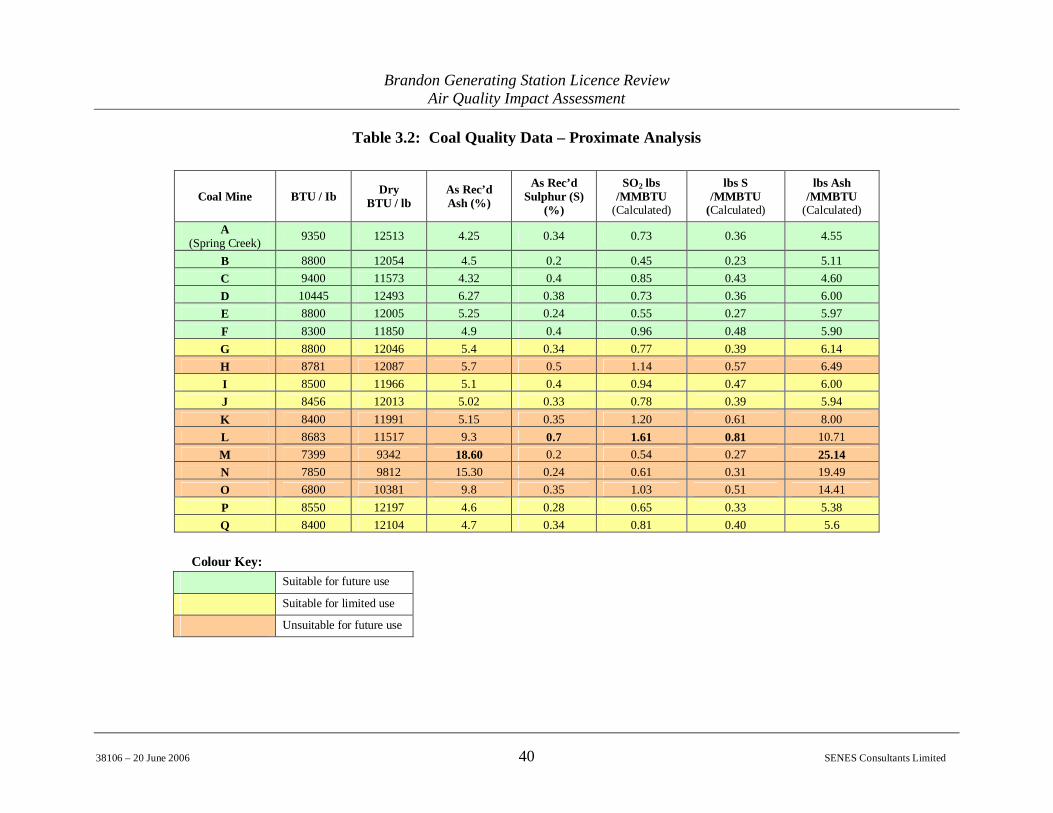
Brandon Generating Station Licence ReviewAir Quality Impact Assessment
38106 – 20 June 2006 40 SENES Consultants Limited
Table 3.2: Coal Quality Data – Proximate Analysis
Coal Mine BTU / Ib DryBTU / lb
As Rec’dAsh (%)
As Rec’dSulphur (S)
(%)
SO2 lbs/MMBTU
(Calculated)
lbs S/MMBTU
(Calculated)
lbs Ash/MMBTU
(Calculated)A
(Spring Creek) 9350 12513 4.25 0.34 0.73 0.36 4.55
B 8800 12054 4.5 0.2 0.45 0.23 5.11C 9400 11573 4.32 0.4 0.85 0.43 4.60D 10445 12493 6.27 0.38 0.73 0.36 6.00E 8800 12005 5.25 0.24 0.55 0.27 5.97F 8300 11850 4.9 0.4 0.96 0.48 5.90G 8800 12046 5.4 0.34 0.77 0.39 6.14H 8781 12087 5.7 0.5 1.14 0.57 6.49I 8500 11966 5.1 0.4 0.94 0.47 6.00J 8456 12013 5.02 0.33 0.78 0.39 5.94K 8400 11991 5.15 0.35 1.20 0.61 8.00L 8683 11517 9.3 0.7 1.61 0.81 10.71M 7399 9342 18.60 0.2 0.54 0.27 25.14N 7850 9812 15.30 0.24 0.61 0.31 19.49O 6800 10381 9.8 0.35 1.03 0.51 14.41P 8550 12197 4.6 0.28 0.65 0.33 5.38Q 8400 12104 4.7 0.34 0.81 0.40 5.6
Colour Key:Suitable for future use
Suitable for limited use
Unsuitable for future use
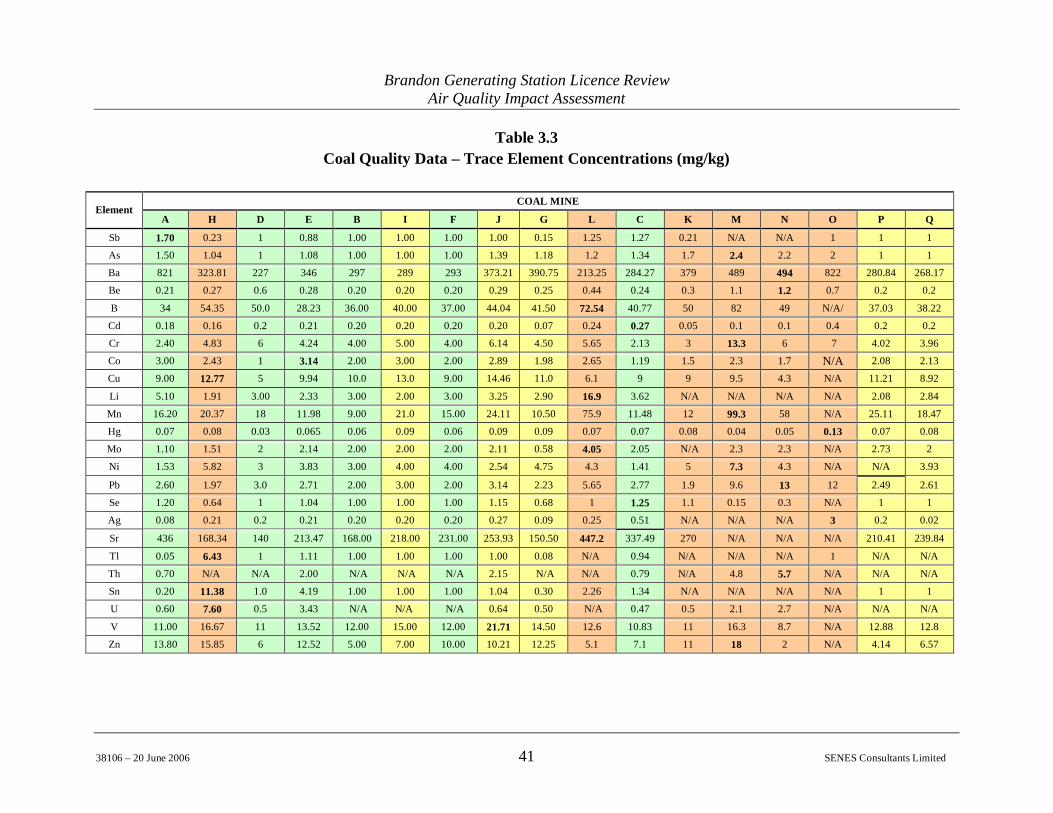
Brandon Generating Station Licence ReviewAir Quality Impact Assessment
38106 – 20 June 2006 41 SENES Consultants Limited
Table 3.3Coal Quality Data – Trace Element Concentrations (mg/kg)
COAL MINEElement
A H D E B I F J G L C K M N O P Q
Sb 1.70 0.23 1 0.88 1.00 1.00 1.00 1.00 0.15 1.25 1.27 0.21 N/A N/A 1 1 1
As 1.50 1.04 1 1.08 1.00 1.00 1.00 1.39 1.18 1.2 1.34 1.7 2.4 2.2 2 1 1
Ba 821 323.81 227 346 297 289 293 373.21 390.75 213.25 284.27 379 489 494 822 280.84 268.17
Be 0.21 0.27 0.6 0.28 0.20 0.20 0.20 0.29 0.25 0.44 0.24 0.3 1.1 1.2 0.7 0.2 0.2
B 34 54.35 50.0 28.23 36.00 40.00 37.00 44.04 41.50 72.54 40.77 50 82 49 N/A/ 37.03 38.22
Cd 0.18 0.16 0.2 0.21 0.20 0.20 0.20 0.20 0.07 0.24 0.27 0.05 0.1 0.1 0.4 0.2 0.2
Cr 2.40 4.83 6 4.24 4.00 5.00 4.00 6.14 4.50 5.65 2.13 3 13.3 6 7 4.02 3.96
Co 3.00 2.43 1 3.14 2.00 3.00 2.00 2.89 1.98 2.65 1.19 1.5 2.3 1.7 N/A 2.08 2.13
Cu 9.00 12.77 5 9.94 10.0 13.0 9.00 14.46 11.0 6.1 9 9 9.5 4.3 N/A 11.21 8.92
Li 5.10 1.91 3.00 2.33 3.00 2.00 3.00 3.25 2.90 16.9 3.62 N/A N/A N/A N/A 2.08 2.84
Mn 16.20 20.37 18 11.98 9.00 21.0 15.00 24.11 10.50 75.9 11.48 12 99.3 58 N/A 25.11 18.47
Hg 0.07 0.08 0.03 0.065 0.06 0.09 0.06 0.09 0.09 0.07 0.07 0.08 0.04 0.05 0.13 0.07 0.08
Mo 1.10 1.51 2 2.14 2.00 2.00 2.00 2.11 0.58 4.05 2.05 N/A 2.3 2.3 N/A 2.73 2
Ni 1.53 5.82 3 3.83 3.00 4.00 4.00 2.54 4.75 4.3 1.41 5 7.3 4.3 N/A N/A 3.93
Pb 2.60 1.97 3.0 2.71 2.00 3.00 2.00 3.14 2.23 5.65 2.77 1.9 9.6 13 12 2.49 2.61
Se 1.20 0.64 1 1.04 1.00 1.00 1.00 1.15 0.68 1 1.25 1.1 0.15 0.3 N/A 1 1
Ag 0.08 0.21 0.2 0.21 0.20 0.20 0.20 0.27 0.09 0.25 0.51 N/A N/A N/A 3 0.2 0.02
Sr 436 168.34 140 213.47 168.00 218.00 231.00 253.93 150.50 447.2 337.49 270 N/A N/A N/A 210.41 239.84
Tl 0.05 6.43 1 1.11 1.00 1.00 1.00 1.00 0.08 N/A 0.94 N/A N/A N/A 1 N/A N/A
Th 0.70 N/A N/A 2.00 N/A N/A N/A 2.15 N/A N/A 0.79 N/A 4.8 5.7 N/A N/A N/A
Sn 0.20 11.38 1.0 4.19 1.00 1.00 1.00 1.04 0.30 2.26 1.34 N/A N/A N/A N/A 1 1
U 0.60 7.60 0.5 3.43 N/A N/A N/A 0.64 0.50 N/A 0.47 0.5 2.1 2.7 N/A N/A N/A
V 11.00 16.67 11 13.52 12.00 15.00 12.00 21.71 14.50 12.6 10.83 11 16.3 8.7 N/A 12.88 12.8
Zn 13.80 15.85 6 12.52 5.00 7.00 10.00 10.21 12.25 5.1 7.1 11 18 2 N/A 4.14 6.57
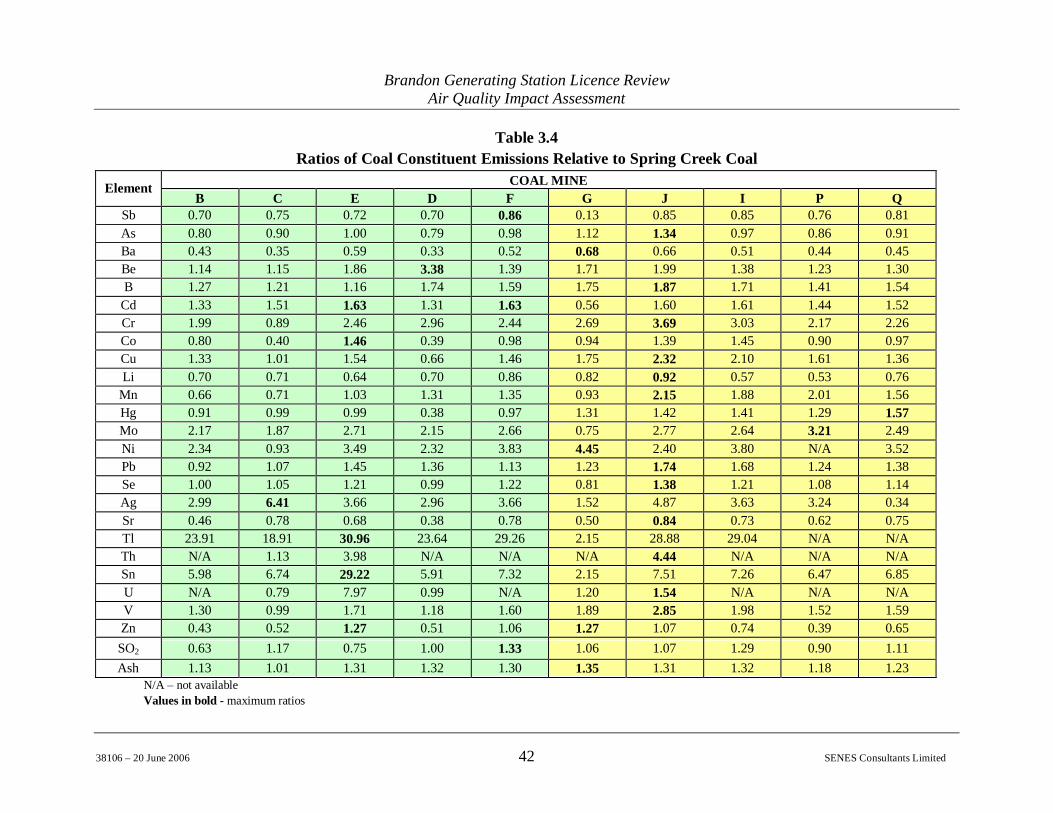
Brandon Generating Station Licence ReviewAir Quality Impact Assessment
38106 – 20 June 2006 42 SENES Consultants Limited
Table 3.4Ratios of Coal Constituent Emissions Relative to Spring Creek Coal
COAL MINEElementB C E D F G J I P Q
Sb 0.70 0.75 0.72 0.70 0.86 0.13 0.85 0.85 0.76 0.81As 0.80 0.90 1.00 0.79 0.98 1.12 1.34 0.97 0.86 0.91Ba 0.43 0.35 0.59 0.33 0.52 0.68 0.66 0.51 0.44 0.45Be 1.14 1.15 1.86 3.38 1.39 1.71 1.99 1.38 1.23 1.30B 1.27 1.21 1.16 1.74 1.59 1.75 1.87 1.71 1.41 1.54
Cd 1.33 1.51 1.63 1.31 1.63 0.56 1.60 1.61 1.44 1.52Cr 1.99 0.89 2.46 2.96 2.44 2.69 3.69 3.03 2.17 2.26Co 0.80 0.40 1.46 0.39 0.98 0.94 1.39 1.45 0.90 0.97Cu 1.33 1.01 1.54 0.66 1.46 1.75 2.32 2.10 1.61 1.36Li 0.70 0.71 0.64 0.70 0.86 0.82 0.92 0.57 0.53 0.76
Mn 0.66 0.71 1.03 1.31 1.35 0.93 2.15 1.88 2.01 1.56Hg 0.91 0.99 0.99 0.38 0.97 1.31 1.42 1.41 1.29 1.57Mo 2.17 1.87 2.71 2.15 2.66 0.75 2.77 2.64 3.21 2.49Ni 2.34 0.93 3.49 2.32 3.83 4.45 2.40 3.80 N/A 3.52Pb 0.92 1.07 1.45 1.36 1.13 1.23 1.74 1.68 1.24 1.38Se 1.00 1.05 1.21 0.99 1.22 0.81 1.38 1.21 1.08 1.14Ag 2.99 6.41 3.66 2.96 3.66 1.52 4.87 3.63 3.24 0.34Sr 0.46 0.78 0.68 0.38 0.78 0.50 0.84 0.73 0.62 0.75Tl 23.91 18.91 30.96 23.64 29.26 2.15 28.88 29.04 N/A N/ATh N/A 1.13 3.98 N/A N/A N/A 4.44 N/A N/A N/ASn 5.98 6.74 29.22 5.91 7.32 2.15 7.51 7.26 6.47 6.85U N/A 0.79 7.97 0.99 N/A 1.20 1.54 N/A N/A N/AV 1.30 0.99 1.71 1.18 1.60 1.89 2.85 1.98 1.52 1.59Zn 0.43 0.52 1.27 0.51 1.06 1.27 1.07 0.74 0.39 0.65SO2 0.63 1.17 0.75 1.00 1.33 1.06 1.07 1.29 0.90 1.11Ash 1.13 1.01 1.31 1.32 1.30 1.35 1.31 1.32 1.18 1.23
N/A – not availableValues in bold - maximum ratios
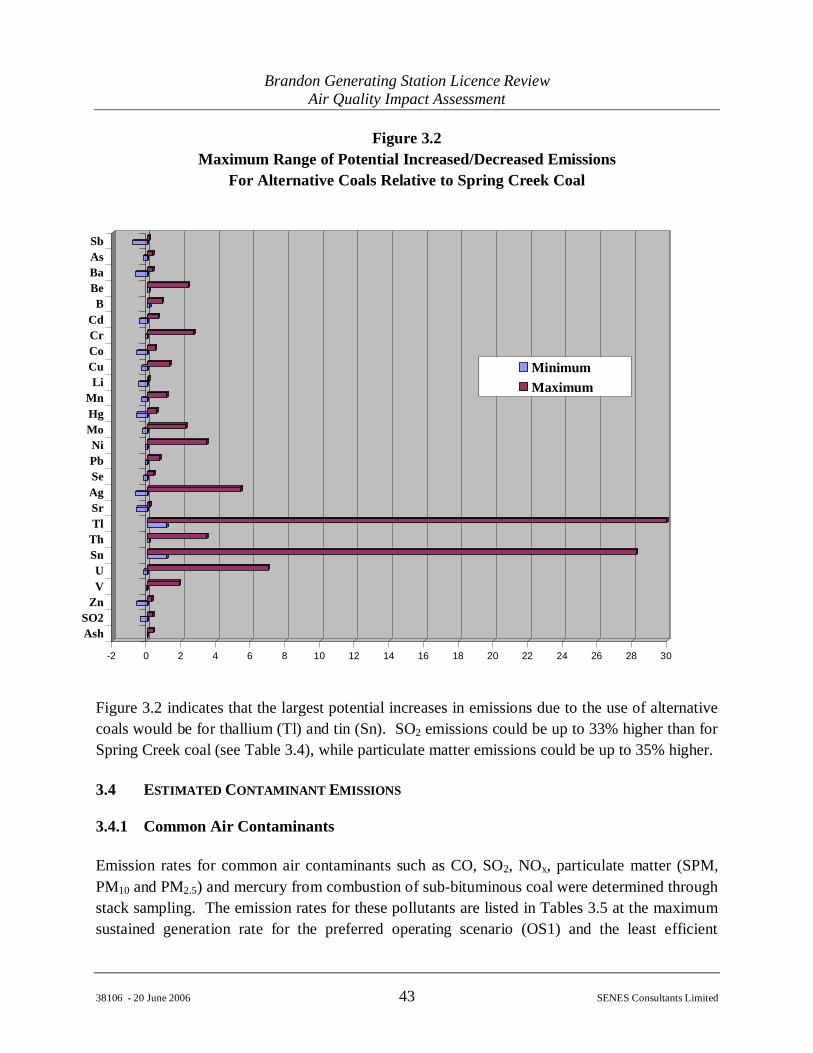
Brandon Generating Station Licence ReviewAir Quality Impact Assessment
38106 - 20 June 2006 43 SENES Consultants Limited
Figure 3.2Maximum Range of Potential Increased/Decreased Emissions
For Alternative Coals Relative to Spring Creek Coal
Figure 3.2 indicates that the largest potential increases in emissions due to the use of alternativecoals would be for thallium (Tl) and tin (Sn). SO2 emissions could be up to 33% higher than forSpring Creek coal (see Table 3.4), while particulate matter emissions could be up to 35% higher.
3.4 ESTIMATED CONTAMINANT EMISSIONS
3.4.1 Common Air Contaminants
Emission rates for common air contaminants such as CO, SO2, NOx, particulate matter (SPM,PM10 and PM2.5) and mercury from combustion of sub-bituminous coal were determined throughstack sampling. The emission rates for these pollutants are listed in Tables 3.5 at the maximumsustained generation rate for the preferred operating scenario (OS1) and the least efficient
-2 0 2 4 6 8 10 12 14 16 18 20 22 24 26 28 30
SbAsBaBeB
CdCrCoCuLi
MnHgMoNiPbSeAgSrTl
ThSnUV
ZnSO2Ash
MinimumMaximum
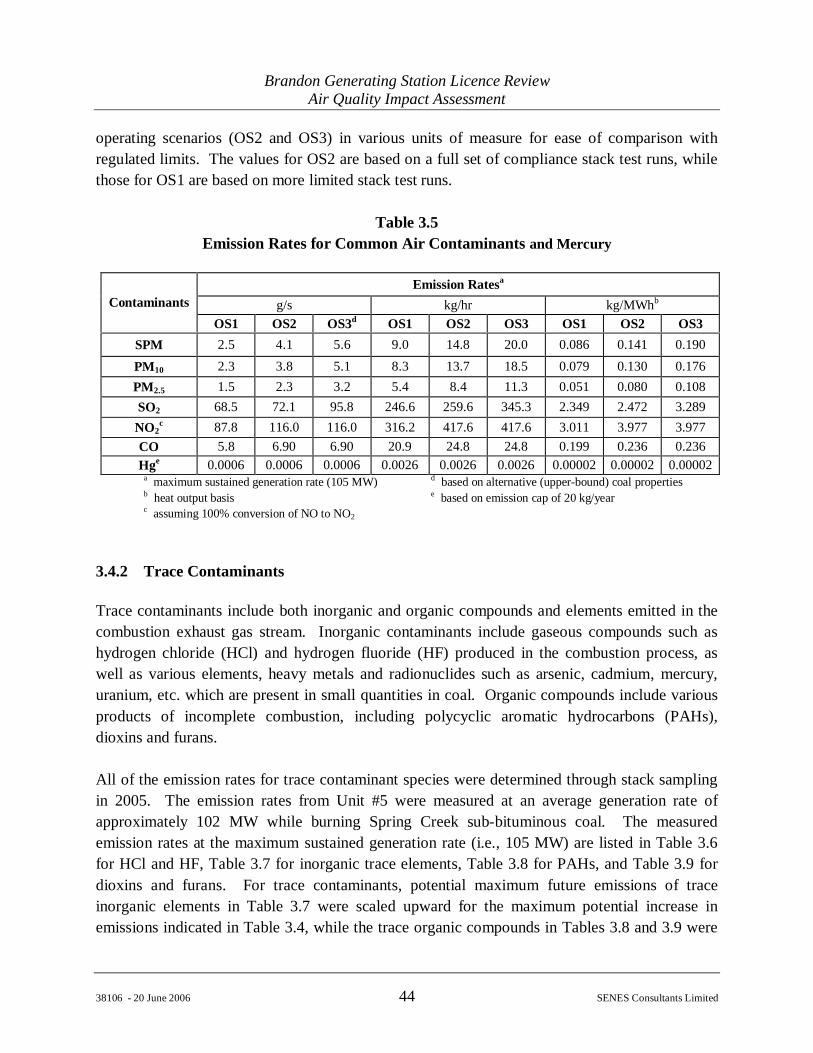
Brandon Generating Station Licence ReviewAir Quality Impact Assessment
38106 - 20 June 2006 44 SENES Consultants Limited
operating scenarios (OS2 and OS3) in various units of measure for ease of comparison withregulated limits. The values for OS2 are based on a full set of compliance stack test runs, whilethose for OS1 are based on more limited stack test runs.
Table 3.5Emission Rates for Common Air Contaminants and Mercury
a maximum sustained generation rate (105 MW) d based on alternative (upper-bound) coal propertiesb heat output basis e based on emission cap of 20 kg/yearc assuming 100% conversion of NO to NO2
3.4.2 Trace Contaminants
Trace contaminants include both inorganic and organic compounds and elements emitted in thecombustion exhaust gas stream. Inorganic contaminants include gaseous compounds such ashydrogen chloride (HCl) and hydrogen fluoride (HF) produced in the combustion process, aswell as various elements, heavy metals and radionuclides such as arsenic, cadmium, mercury,uranium, etc. which are present in small quantities in coal. Organic compounds include variousproducts of incomplete combustion, including polycyclic aromatic hydrocarbons (PAHs),dioxins and furans.
All of the emission rates for trace contaminant species were determined through stack samplingin 2005. The emission rates from Unit #5 were measured at an average generation rate ofapproximately 102 MW while burning Spring Creek sub-bituminous coal. The measuredemission rates at the maximum sustained generation rate (i.e., 105 MW) are listed in Table 3.6for HCl and HF, Table 3.7 for inorganic trace elements, Table 3.8 for PAHs, and Table 3.9 fordioxins and furans. For trace contaminants, potential maximum future emissions of traceinorganic elements in Table 3.7 were scaled upward for the maximum potential increase inemissions indicated in Table 3.4, while the trace organic compounds in Tables 3.8 and 3.9 were
Emission Ratesa
g/s kg/hr kg/MWhbContaminantsOS1 OS2 OS3d OS1 OS2 OS3 OS1 OS2 OS3
SPM 2.5 4.1 5.6 9.0 14.8 20.0 0.086 0.141 0.190
PM10 2.3 3.8 5.1 8.3 13.7 18.5 0.079 0.130 0.176PM2.5 1.5 2.3 3.2 5.4 8.4 11.3 0.051 0.080 0.108SO2 68.5 72.1 95.8 246.6 259.6 345.3 2.349 2.472 3.289NO2
c 87.8 116.0 116.0 316.2 417.6 417.6 3.011 3.977 3.977CO 5.8 6.90 6.90 20.9 24.8 24.8 0.199 0.236 0.236Hge 0.0006 0.0006 0.0006 0.0026 0.0026 0.0026 0.00002 0.00002 0.00002
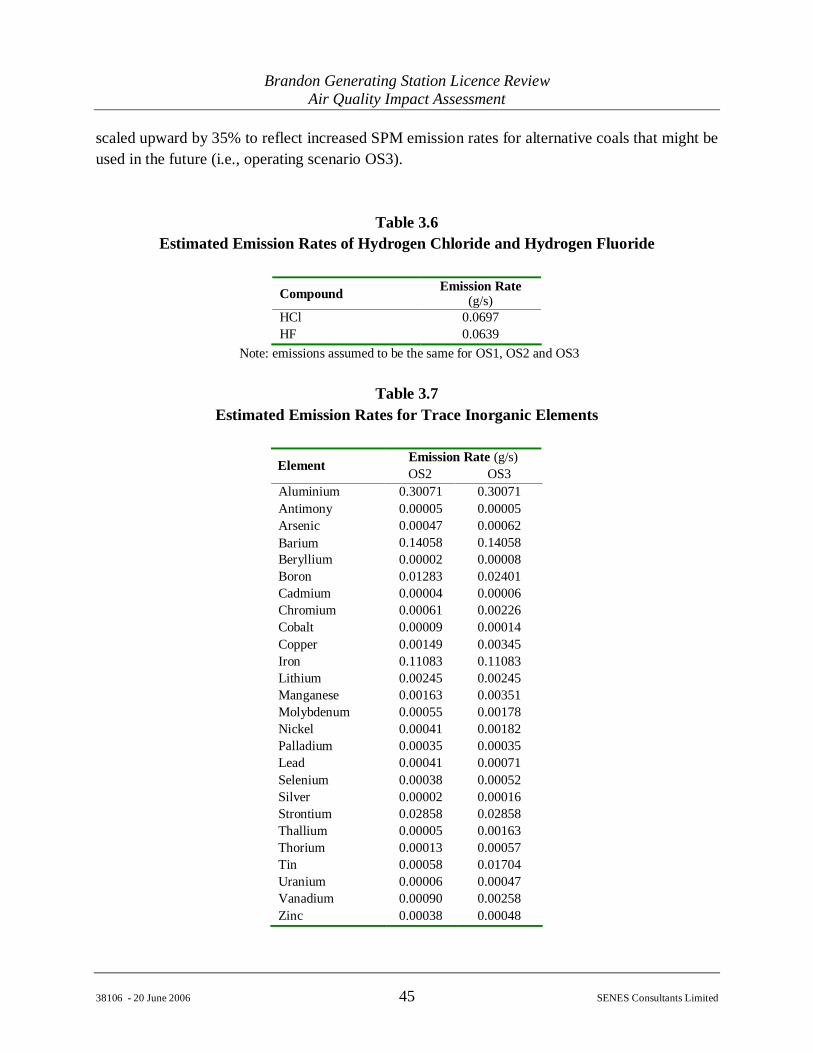
Brandon Generating Station Licence ReviewAir Quality Impact Assessment
38106 - 20 June 2006 45 SENES Consultants Limited
scaled upward by 35% to reflect increased SPM emission rates for alternative coals that might beused in the future (i.e., operating scenario OS3).
Table 3.6Estimated Emission Rates of Hydrogen Chloride and Hydrogen Fluoride
Compound Emission Rate(g/s)
HCl 0.0697HF 0.0639
Note: emissions assumed to be the same for OS1, OS2 and OS3
Table 3.7Estimated Emission Rates for Trace Inorganic Elements
Emission Rate (g/s)Element OS2 OS3Aluminium 0.30071 0.30071Antimony 0.00005 0.00005Arsenic 0.00047 0.00062Barium 0.14058 0.14058Beryllium 0.00002 0.00008Boron 0.01283 0.02401Cadmium 0.00004 0.00006Chromium 0.00061 0.00226Cobalt 0.00009 0.00014Copper 0.00149 0.00345Iron 0.11083 0.11083Lithium 0.00245 0.00245Manganese 0.00163 0.00351Molybdenum 0.00055 0.00178Nickel 0.00041 0.00182Palladium 0.00035 0.00035Lead 0.00041 0.00071Selenium 0.00038 0.00052Silver 0.00002 0.00016Strontium 0.02858 0.02858Thallium 0.00005 0.00163Thorium 0.00013 0.00057Tin 0.00058 0.01704Uranium 0.00006 0.00047Vanadium 0.00090 0.00258Zinc 0.00038 0.00048
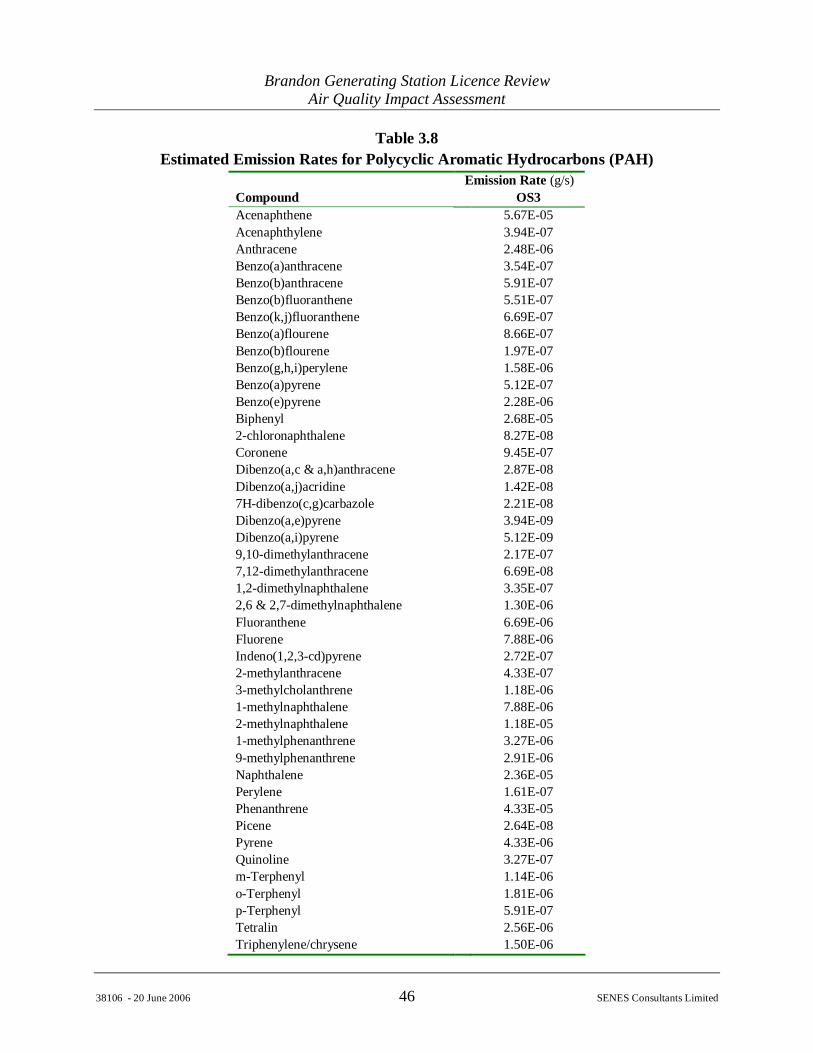
Brandon Generating Station Licence ReviewAir Quality Impact Assessment
38106 - 20 June 2006 46 SENES Consultants Limited
Table 3.8Estimated Emission Rates for Polycyclic Aromatic Hydrocarbons (PAH)
Emission Rate (g/s)Compound OS3Acenaphthene 5.67E-05Acenaphthylene 3.94E-07Anthracene 2.48E-06Benzo(a)anthracene 3.54E-07Benzo(b)anthracene 5.91E-07Benzo(b)fluoranthene 5.51E-07Benzo(k,j)fluoranthene 6.69E-07Benzo(a)flourene 8.66E-07Benzo(b)flourene 1.97E-07Benzo(g,h,i)perylene 1.58E-06Benzo(a)pyrene 5.12E-07Benzo(e)pyrene 2.28E-06Biphenyl 2.68E-052-chloronaphthalene 8.27E-08Coronene 9.45E-07Dibenzo(a,c & a,h)anthracene 2.87E-08Dibenzo(a,j)acridine 1.42E-087H-dibenzo(c,g)carbazole 2.21E-08Dibenzo(a,e)pyrene 3.94E-09Dibenzo(a,i)pyrene 5.12E-099,10-dimethylanthracene 2.17E-077,12-dimethylanthracene 6.69E-081,2-dimethylnaphthalene 3.35E-072,6 & 2,7-dimethylnaphthalene 1.30E-06Fluoranthene 6.69E-06Fluorene 7.88E-06Indeno(1,2,3-cd)pyrene 2.72E-072-methylanthracene 4.33E-073-methylcholanthrene 1.18E-061-methylnaphthalene 7.88E-062-methylnaphthalene 1.18E-051-methylphenanthrene 3.27E-069-methylphenanthrene 2.91E-06Naphthalene 2.36E-05Perylene 1.61E-07Phenanthrene 4.33E-05Picene 2.64E-08Pyrene 4.33E-06Quinoline 3.27E-07m-Terphenyl 1.14E-06o-Terphenyl 1.81E-06p-Terphenyl 5.91E-07Tetralin 2.56E-06Triphenylene/chrysene 1.50E-06
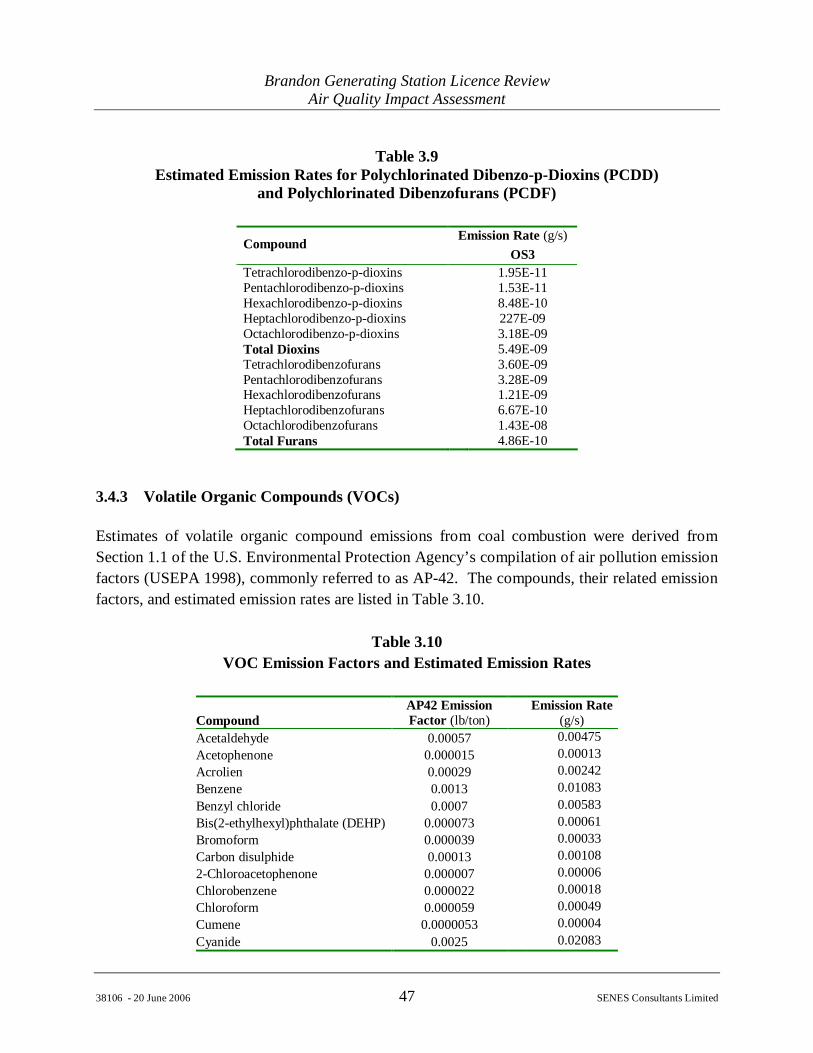
Brandon Generating Station Licence ReviewAir Quality Impact Assessment
38106 - 20 June 2006 47 SENES Consultants Limited
Table 3.9Estimated Emission Rates for Polychlorinated Dibenzo-p-Dioxins (PCDD)
and Polychlorinated Dibenzofurans (PCDF)
Emission Rate (g/s)CompoundOS3
Tetrachlorodibenzo-p-dioxins 1.95E-11Pentachlorodibenzo-p-dioxins 1.53E-11Hexachlorodibenzo-p-dioxins 8.48E-10Heptachlorodibenzo-p-dioxins 227E-09Octachlorodibenzo-p-dioxins 3.18E-09Total Dioxins 5.49E-09Tetrachlorodibenzofurans 3.60E-09Pentachlorodibenzofurans 3.28E-09Hexachlorodibenzofurans 1.21E-09Heptachlorodibenzofurans 6.67E-10Octachlorodibenzofurans 1.43E-08Total Furans 4.86E-10
3.4.3 Volatile Organic Compounds (VOCs)
Estimates of volatile organic compound emissions from coal combustion were derived fromSection 1.1 of the U.S. Environmental Protection Agency’s compilation of air pollution emissionfactors (USEPA 1998), commonly referred to as AP-42. The compounds, their related emissionfactors, and estimated emission rates are listed in Table 3.10.
Table 3.10VOC Emission Factors and Estimated Emission Rates
CompoundAP42 EmissionFactor (lb/ton)
Emission Rate(g/s)
Acetaldehyde 0.00057 0.00475Acetophenone 0.000015 0.00013Acrolien 0.00029 0.00242Benzene 0.0013 0.01083Benzyl chloride 0.0007 0.00583Bis(2-ethylhexyl)phthalate (DEHP) 0.000073 0.00061Bromoform 0.000039 0.00033Carbon disulphide 0.00013 0.001082-Chloroacetophenone 0.000007 0.00006Chlorobenzene 0.000022 0.00018Chloroform 0.000059 0.00049Cumene 0.0000053 0.00004Cyanide 0.0025 0.02083
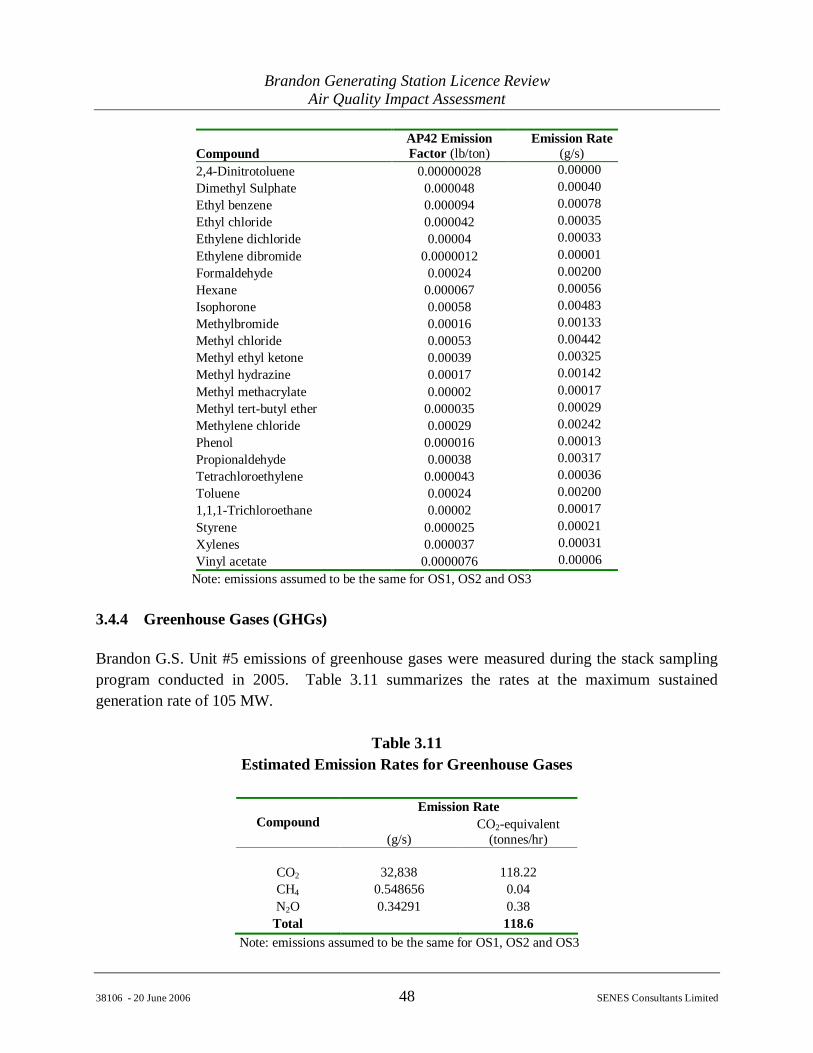
Brandon Generating Station Licence ReviewAir Quality Impact Assessment
38106 - 20 June 2006 48 SENES Consultants Limited
CompoundAP42 EmissionFactor (lb/ton)
Emission Rate(g/s)
2,4-Dinitrotoluene 0.00000028 0.00000Dimethyl Sulphate 0.000048 0.00040Ethyl benzene 0.000094 0.00078Ethyl chloride 0.000042 0.00035Ethylene dichloride 0.00004 0.00033Ethylene dibromide 0.0000012 0.00001Formaldehyde 0.00024 0.00200Hexane 0.000067 0.00056Isophorone 0.00058 0.00483Methylbromide 0.00016 0.00133Methyl chloride 0.00053 0.00442Methyl ethyl ketone 0.00039 0.00325Methyl hydrazine 0.00017 0.00142Methyl methacrylate 0.00002 0.00017Methyl tert-butyl ether 0.000035 0.00029Methylene chloride 0.00029 0.00242Phenol 0.000016 0.00013Propionaldehyde 0.00038 0.00317Tetrachloroethylene 0.000043 0.00036Toluene 0.00024 0.002001,1,1-Trichloroethane 0.00002 0.00017Styrene 0.000025 0.00021Xylenes 0.000037 0.00031Vinyl acetate 0.0000076 0.00006
Note: emissions assumed to be the same for OS1, OS2 and OS3
3.4.4 Greenhouse Gases (GHGs)
Brandon G.S. Unit #5 emissions of greenhouse gases were measured during the stack samplingprogram conducted in 2005. Table 3.11 summarizes the rates at the maximum sustainedgeneration rate of 105 MW.
Table 3.11Estimated Emission Rates for Greenhouse Gases
Emission RateCompound
(g/s)CO2-equivalent
(tonnes/hr)
CO2 32,838 118.22CH4 0.548656 0.04N2O 0.34291 0.38
Total 118.6Note: emissions assumed to be the same for OS1, OS2 and OS3
Brandon Generating Station Licence ReviewAir Quality Impact Assessment
38106 - 20 June 2006 49 SENES Consultants Limited
The global warming potential of these compounds is often expressed as CO2–equivalents bymultiplying the methane emission rate by a factor of 21, and the N2O emission rate by a factor of310. Thus, the total GHG emission rate in CO2-equivalents at the maximum sustainedgeneration rate is estimated at 118.6 tonnes/hr.
3.5 FUGITIVE DUST EMISSIONS
The primary sources of fugitive dust emissions at coal-fired power plants are coal handling andstorage, and ash handling and disposal. At the Brandon G.S., ash handling consists of sluicingthe ash from the Unit #5 boiler in a wet slurry, such that ash handling is not a source of fugitiveemissions from plant operations.
As previously discussed, fugitive emissions from bulk material storage and handling aregenerally estimated using emission factors. Much of the information about fugitive emissionsfrom coal-fired power plants was first developed or published in the mid-1970’s. Most of thereported emission factors are not based on actual test data, are highly variable, and are oftencontradictory. According to a report published by the Electric Power Research Institute (EPRI1984), much of the information in published sources is based on conjecture and is thus ofquestionable validity. As such, a conservative approach was used, based on methodologies thatare well supported in the literature.
3.5.1 Coal Handling and Storage
Coal handling operations at the Brandon G.S. that can produce fugitive dust emissions consist of:1) coal train unloading, 2) continuous drop of coal from the slew conveyor to the active coalstorage area, 3) reclaim of the coal from the active coal storage area to the coal bunker fortransfer to the combustion boiler, 4) removal of coal from active storage pile to long-term storagepile, 5) reclaim of coal from the long-term storage pile, and 6) wind erosion of the active andlong-term storage piles. Emission factors for these operations were based on emission equationspublished in a Canadian Council of Ministers of the Environment (CCME) study of fugitive coaldust emissions (Cope and Bhattacharyya 2001), and AP-42 Emission Factors (US EPA 1995;Chapter 11 – Mineral Products Industry).
An hour-by-hour emissions estimation methodology was used with the goal of representing bothcontinual emissions due to coal handling activities and sporadic bursts of emissions due toerosion during high wind speeds. As such, dispersion modelling results are indicative of bothlong-term (monthly, annual) and short-term maximum (24-hour) ambient air concentrations anddeposition amounts. To be conservative, one coal train was assumed to arrive every week, with
Brandon Generating Station Licence ReviewAir Quality Impact Assessment
38106 - 20 June 2006 50 SENES Consultants Limited
unloading of 13,425 tonnes of coal occurring over 2 ½ days. A total of 1,440 tonnes of coal perday (i.e., 66 tons per hour) was assumed to be fed directly into the Unit #5 boiler, while theremainder of 3,930 tonnes was assumed to be directed onto the active coal storage pile. For theremaining 4 ½ days, coal was assumed to be reclaimed from the active storage pile at a rate of1,440 tonnes per day. On all days, erosion of the coal storage piles was simulated.
The coal storage pile was subdivided into two distinct areas: 1) the active area where the coal isunloaded from the railcars and distributed in an arc by a mechanical, pivoted conveyor system,and 2) a longer term storage area where the coal is disturbed less frequently, thus reducing thepotential for fugitive dust emissions. The entire coal storage pile covers an area ofapproximately 3.5 hectares. The active coal storage pile comprises approximately 5% of theentire coal storage area.
The longer term coal storage area experiences far less frequent disturbance. Such areasexperience much lower emission rates because a surface crust forms after the suspendablematerial is removed in a few erosion events between disturbances. In addition, this portion of thecoal storage area tends to freeze over during the winter, and much of the area tends to remainfrozen through the spring until July. In order to further reduce fugitive dust emissions from thisarea, Manitoba Hydro applies a chemical binder to the surface over the summer months. Suchbinders are estimated to reduce fugitive dust emissions from exposed areas by up to 90%. Theeffects of freezing and the chemical binder were incorporated into the dispersion modelling byapplication of control factors. On an infrequent basis, a scraper may be used to move or reshapea portion of the long-term storage pile. Although this activity leads to fugitive emissions, it is adiscretionary activity that can be curtailed if it causes unacceptably high emission rates. Assuch, these emissions were not represented in the modelling. The conservative assumption that acoal train arrives every week (thus ensuring that the active storage pile always has sufficientquantity to supply Unit #5), leads to higher emissions than if the long-term storage pile wasaccessed. Therefore, the conservative approach of coal handling activity being ‘on’ during theentire year was used. This likely leads to an over-estimate of annual emissions, but is morerepresentative of maximum short-term (i.e., 24-hour) emissions.
Erosion of a coal storage pile depends on the frequency of disturbance, the size of the storagepile, and the magnitude of short-term gust wind speeds. On a very infrequent basis, a sustainedgust has a high enough speed to liberate a large amount of particulate matter from the activestorage pile. For each hour of the year, the fastest mile wind speed was estimated and if thisspeed was higher than the threshold speed required to liberate dust from the active storage pile, acalculation of dust emission for that hour was performed. This approach assumes that theerosion potential (amount of material available for suspension) is completely replenished eachhour, which in reality is only true for active storage piles that are being continuously disturbed.
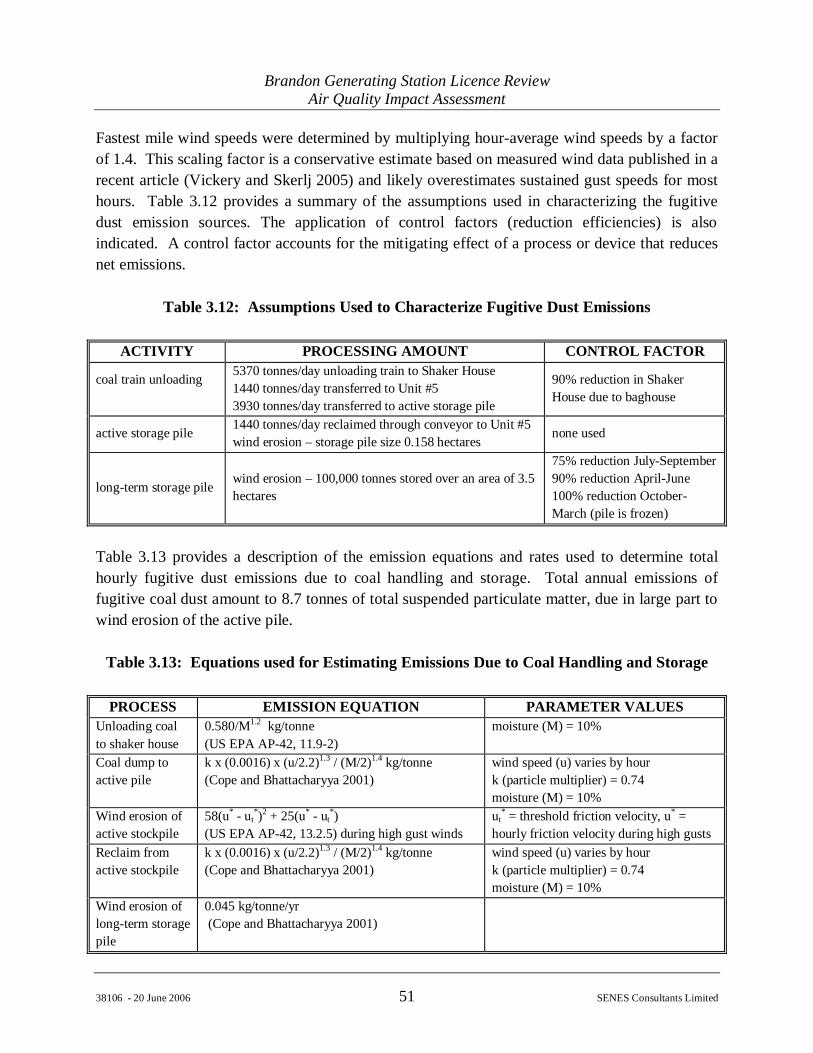
Brandon Generating Station Licence ReviewAir Quality Impact Assessment
38106 - 20 June 2006 51 SENES Consultants Limited
Fastest mile wind speeds were determined by multiplying hour-average wind speeds by a factorof 1.4. This scaling factor is a conservative estimate based on measured wind data published in arecent article (Vickery and Skerlj 2005) and likely overestimates sustained gust speeds for mosthours. Table 3.12 provides a summary of the assumptions used in characterizing the fugitivedust emission sources. The application of control factors (reduction efficiencies) is alsoindicated. A control factor accounts for the mitigating effect of a process or device that reducesnet emissions.
Table 3.12: Assumptions Used to Characterize Fugitive Dust Emissions
ACTIVITY PROCESSING AMOUNT CONTROL FACTOR
coal train unloading 5370 tonnes/day unloading train to Shaker House1440 tonnes/day transferred to Unit #53930 tonnes/day transferred to active storage pile
90% reduction in ShakerHouse due to baghouse
active storage pile 1440 tonnes/day reclaimed through conveyor to Unit #5wind erosion – storage pile size 0.158 hectares
none used
long-term storage pilewind erosion – 100,000 tonnes stored over an area of 3.5hectares
75% reduction July-September90% reduction April-June100% reduction October-March (pile is frozen)
Table 3.13 provides a description of the emission equations and rates used to determine totalhourly fugitive dust emissions due to coal handling and storage. Total annual emissions offugitive coal dust amount to 8.7 tonnes of total suspended particulate matter, due in large part towind erosion of the active pile.
Table 3.13: Equations used for Estimating Emissions Due to Coal Handling and Storage
PROCESS EMISSION EQUATION PARAMETER VALUESUnloading coalto shaker house
0.580/M1.2 kg/tonne(US EPA AP-42, 11.9-2)
moisture (M) = 10%
Coal dump toactive pile
k x (0.0016) x (u/2.2)1.3 / (M/2)1.4 kg/tonne(Cope and Bhattacharyya 2001)
wind speed (u) varies by hourk (particle multiplier) = 0.74moisture (M) = 10%
Wind erosion ofactive stockpile
58(u* - ut*)2 + 25(u* - ut
*)(US EPA AP-42, 13.2.5) during high gust winds
ut* = threshold friction velocity, u* =
hourly friction velocity during high gustsReclaim fromactive stockpile
k x (0.0016) x (u/2.2)1.3 / (M/2)1.4 kg/tonne(Cope and Bhattacharyya 2001)
wind speed (u) varies by hourk (particle multiplier) = 0.74moisture (M) = 10%
Wind erosion oflong-term storagepile
0.045 kg/tonne/yr (Cope and Bhattacharyya 2001)
Brandon Generating Station Licence ReviewAir Quality Impact Assessment
38106 - 20 June 2006 52 SENES Consultants Limited
Two of the equations listed in Table 3.13 have a dependence on coal moisture level. A moisturevalue of 20% was considered, which is the average coal moisture content from the most recentstack testing assessment of Unit #5 (ORTECH 2005). Instead of using this value, a 10%moisture level was used in the emission equations, since these equations were not developed forcoal with a high moisture level. The use of the lower moisture level results in a higher emissionrate from the equation than might actually occur. As such, the estimated coal dump fugitiveemission amounts are likely over-estimated.
Use of the emission methodologies listed in Table 3.13 results in the following annual emissionestimates of fugitive coal dust:
Erosion of the active storage pile: 5.59 tonnesUnloading of the coal trains: 2.50 tonnesCoal handling at the active storage pile: 210 kgErosion of the long-term storage pile: 400 kg
Wind erosion of the active coal storage pile occurs on relatively few days. As a maximum, anemission rate of 130 g/s (470 kg/hour) was determined.
Mitigation measures used by Manitoba Hydro cannot be accounted for in the dispersion/dusttransport modelling. In particular, proactive management procedures that reduce or stop coalhandling processes during periods with observed off-site dust transport and the interception ofhorizontal dust transport by terrain and vegetation surrounding the coal pile are not represented.This is because there is simply no practical method to determine how much reduction inemissions is/was achieved by the implementation of these measures. Similarly, there is nopractical method in the dispersion modelling analysis for incorporating the effect of interceptionof fugitive emissions by surface features such as trees or buildings, or the effect of buildings onwind speed near the active storage coal pile.
3.5.2 Ash Lagoon
Ash from Unit #5 is sluiced to one of two ash lagoons. The disposal of ash into one of thelagoons is alternated such that one lagoon is used at a time, while the other is dewatered. Thetotal area covered by the one ash lagoon was estimated at 5.66 hectares. From aerialphotographs of the site, it was estimated that over 80% of the ash lagoon is covered by eitherwater or vegetation.
An emission factor of 0.85 tonnes per hectare per year was applied to the exposed areas of theash lagoon. This value is representative of fugitive dust emissions due to wind erosion of

Brandon Generating Station Licence ReviewAir Quality Impact Assessment
38106 - 20 June 2006 53 SENES Consultants Limited
exposed areas (AP-42 Section 11.9). To be conservative, the emission factor was applied to 40%of the total area, to account for the possibility of greater areas exposed to wind erosion from useof one or both of the two ash lagoons. This resulted in a consistent emission rate of 0.15 g/s ofTSP, which results in an estimated 4.7 tonnes of fugitive dust being emitted over a full year.
3.5.3 Particle Size Distributions for Particulate Matter
Separate particle size distributions were defined for the particulate matter emitted from the coaland ash storage areas. The equations described in Table 3.13 were used to estimate totalemissions of fugitive suspended particulate matter (i.e., SPM). To partition the fugitive SPMinto size categories, the particle size distributions listed in Table 3.14 were used. For fugitivedust due to coal pile erosion and handling, the particle size distribution was taken from AP-42(11.9-2).
For the ash lagoon, there were two possible choices for defining the particle size distribution,namely: 1) using the distribution for wind erosion of stockpiles defined in US EPA AP-42(1995), or 2) the distribution used in a dispersion modelling analysis in a report submitted to theU.S. Congress on managing wastes from the combustion of fossil fuels (US EPA 1998). Thelatter was directed specifically at fugitive emissions from ash impoundments at coal-fired powerplants. Although the analysis was specific to the type of waste being considered for the emissionof fugitive dust from the ash lagoon at the Brandon G.S., the particle size distribution used in thereport to Congress was based on an earlier analysis (US EPA 1990) in which the particle sizedistribution was largely based on conjecture and not on any actual measurements of emittedparticles. The two particle size fractions for fugitive emissions from the ash lagoon from AP-42and the report to Congress were as listed in Table 3.15, below.
Table 3.14Coal Particle Size Distribution Used for ISCST3 Dispersion Modelling
Cumulative Particle Size Fractions (Percent Passing)Particle SizeCategories (µm) <1 <2.5 <5 <10 <20 <30Mid-class Diameter (µm) 0.5 1.625 3.25 7.5 15 25
Fugitive Coal Dust 1% 1.95% 7.5% 20% 50% 100%Fugitive Ash Dust 10% 20% 50% 70% 100%
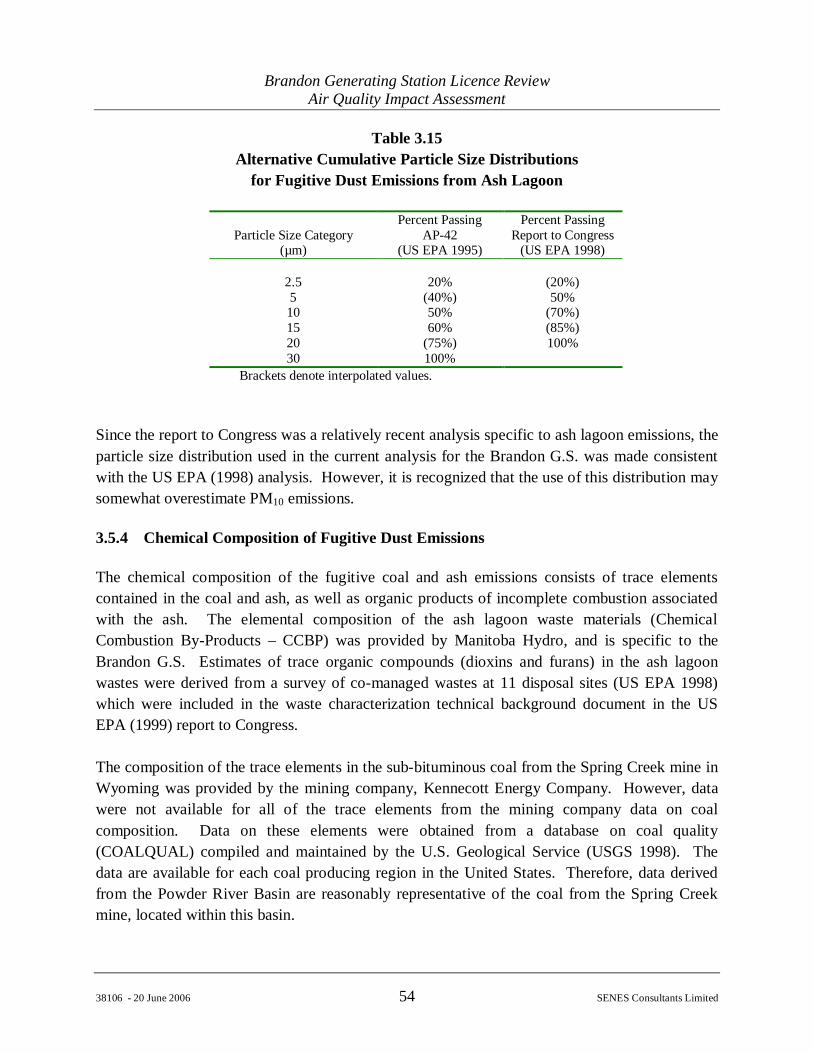
Brandon Generating Station Licence ReviewAir Quality Impact Assessment
38106 - 20 June 2006 54 SENES Consultants Limited
Table 3.15Alternative Cumulative Particle Size Distributions
for Fugitive Dust Emissions from Ash Lagoon
Particle Size Category(µm)
Percent PassingAP-42
(US EPA 1995)
Percent PassingReport to Congress
(US EPA 1998)
2.5 20% (20%)5 (40%) 50%10 50% (70%)15 60% (85%)20 (75%) 100%30 100%
Brackets denote interpolated values.
Since the report to Congress was a relatively recent analysis specific to ash lagoon emissions, theparticle size distribution used in the current analysis for the Brandon G.S. was made consistentwith the US EPA (1998) analysis. However, it is recognized that the use of this distribution maysomewhat overestimate PM10 emissions.
3.5.4 Chemical Composition of Fugitive Dust Emissions
The chemical composition of the fugitive coal and ash emissions consists of trace elementscontained in the coal and ash, as well as organic products of incomplete combustion associatedwith the ash. The elemental composition of the ash lagoon waste materials (ChemicalCombustion By-Products – CCBP) was provided by Manitoba Hydro, and is specific to theBrandon G.S. Estimates of trace organic compounds (dioxins and furans) in the ash lagoonwastes were derived from a survey of co-managed wastes at 11 disposal sites (US EPA 1998)which were included in the waste characterization technical background document in the USEPA (1999) report to Congress.
The composition of the trace elements in the sub-bituminous coal from the Spring Creek mine inWyoming was provided by the mining company, Kennecott Energy Company. However, datawere not available for all of the trace elements from the mining company data on coalcomposition. Data on these elements were obtained from a database on coal quality(COALQUAL) compiled and maintained by the U.S. Geological Service (USGS 1998). Thedata are available for each coal producing region in the United States. Therefore, data derivedfrom the Powder River Basin are reasonably representative of the coal from the Spring Creekmine, located within this basin.
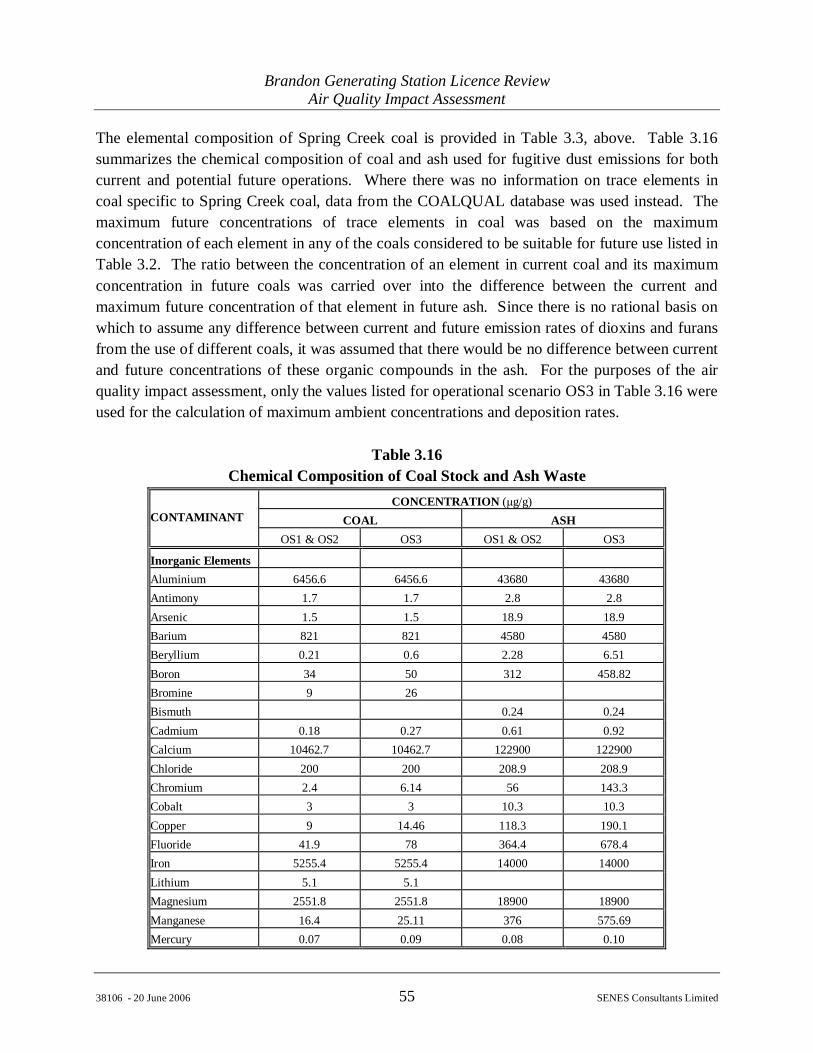
Brandon Generating Station Licence ReviewAir Quality Impact Assessment
38106 - 20 June 2006 55 SENES Consultants Limited
The elemental composition of Spring Creek coal is provided in Table 3.3, above. Table 3.16summarizes the chemical composition of coal and ash used for fugitive dust emissions for bothcurrent and potential future operations. Where there was no information on trace elements incoal specific to Spring Creek coal, data from the COALQUAL database was used instead. Themaximum future concentrations of trace elements in coal was based on the maximumconcentration of each element in any of the coals considered to be suitable for future use listed inTable 3.2. The ratio between the concentration of an element in current coal and its maximumconcentration in future coals was carried over into the difference between the current andmaximum future concentration of that element in future ash. Since there is no rational basis onwhich to assume any difference between current and future emission rates of dioxins and furansfrom the use of different coals, it was assumed that there would be no difference between currentand future concentrations of these organic compounds in the ash. For the purposes of the airquality impact assessment, only the values listed for operational scenario OS3 in Table 3.16 wereused for the calculation of maximum ambient concentrations and deposition rates.
Table 3.16Chemical Composition of Coal Stock and Ash Waste
CONCENTRATION ( g/g)COAL ASHCONTAMINANT
OS1 & OS2 OS3 OS1 & OS2 OS3
Inorganic ElementsAluminium 6456.6 6456.6 43680 43680Antimony 1.7 1.7 2.8 2.8Arsenic 1.5 1.5 18.9 18.9Barium 821 821 4580 4580Beryllium 0.21 0.6 2.28 6.51Boron 34 50 312 458.82Bromine 9 26Bismuth 0.24 0.24Cadmium 0.18 0.27 0.61 0.92Calcium 10462.7 10462.7 122900 122900Chloride 200 200 208.9 208.9Chromium 2.4 6.14 56 143.3Cobalt 3 3 10.3 10.3Copper 9 14.46 118.3 190.1Fluoride 41.9 78 364.4 678.4Iron 5255.4 5255.4 14000 14000Lithium 5.1 5.1Magnesium 2551.8 2551.8 18900 18900Manganese 16.4 25.11 376 575.69Mercury 0.07 0.09 0.08 0.10
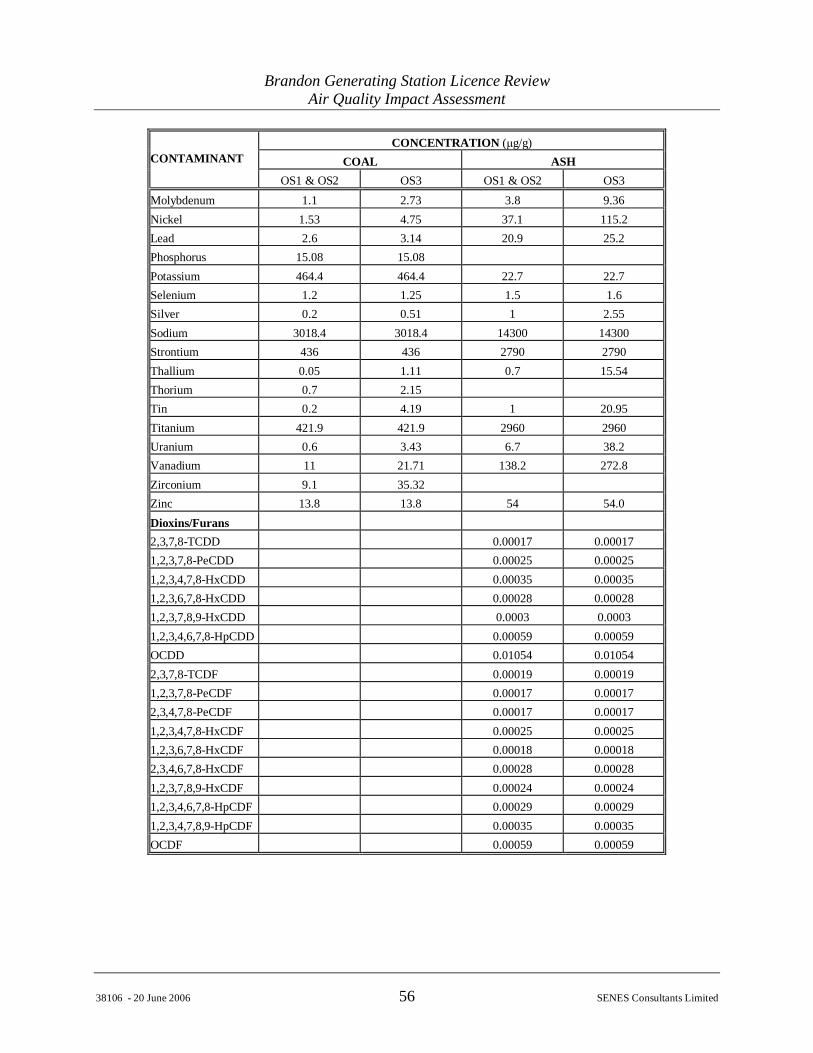
Brandon Generating Station Licence ReviewAir Quality Impact Assessment
38106 - 20 June 2006 56 SENES Consultants Limited
CONCENTRATION ( g/g)COAL ASHCONTAMINANT
OS1 & OS2 OS3 OS1 & OS2 OS3Molybdenum 1.1 2.73 3.8 9.36Nickel 1.53 4.75 37.1 115.2Lead 2.6 3.14 20.9 25.2Phosphorus 15.08 15.08Potassium 464.4 464.4 22.7 22.7Selenium 1.2 1.25 1.5 1.6Silver 0.2 0.51 1 2.55Sodium 3018.4 3018.4 14300 14300Strontium 436 436 2790 2790Thallium 0.05 1.11 0.7 15.54Thorium 0.7 2.15Tin 0.2 4.19 1 20.95Titanium 421.9 421.9 2960 2960Uranium 0.6 3.43 6.7 38.2Vanadium 11 21.71 138.2 272.8Zirconium 9.1 35.32Zinc 13.8 13.8 54 54.0Dioxins/Furans2,3,7,8-TCDD 0.00017 0.000171,2,3,7,8-PeCDD 0.00025 0.000251,2,3,4,7,8-HxCDD 0.00035 0.000351,2,3,6,7,8-HxCDD 0.00028 0.000281,2,3,7,8,9-HxCDD 0.0003 0.00031,2,3,4,6,7,8-HpCDD 0.00059 0.00059OCDD 0.01054 0.010542,3,7,8-TCDF 0.00019 0.000191,2,3,7,8-PeCDF 0.00017 0.000172,3,4,7,8-PeCDF 0.00017 0.000171,2,3,4,7,8-HxCDF 0.00025 0.000251,2,3,6,7,8-HxCDF 0.00018 0.000182,3,4,6,7,8-HxCDF 0.00028 0.000281,2,3,7,8,9-HxCDF 0.00024 0.000241,2,3,4,6,7,8-HpCDF 0.00029 0.000291,2,3,4,7,8,9-HpCDF 0.00035 0.00035OCDF 0.00059 0.00059
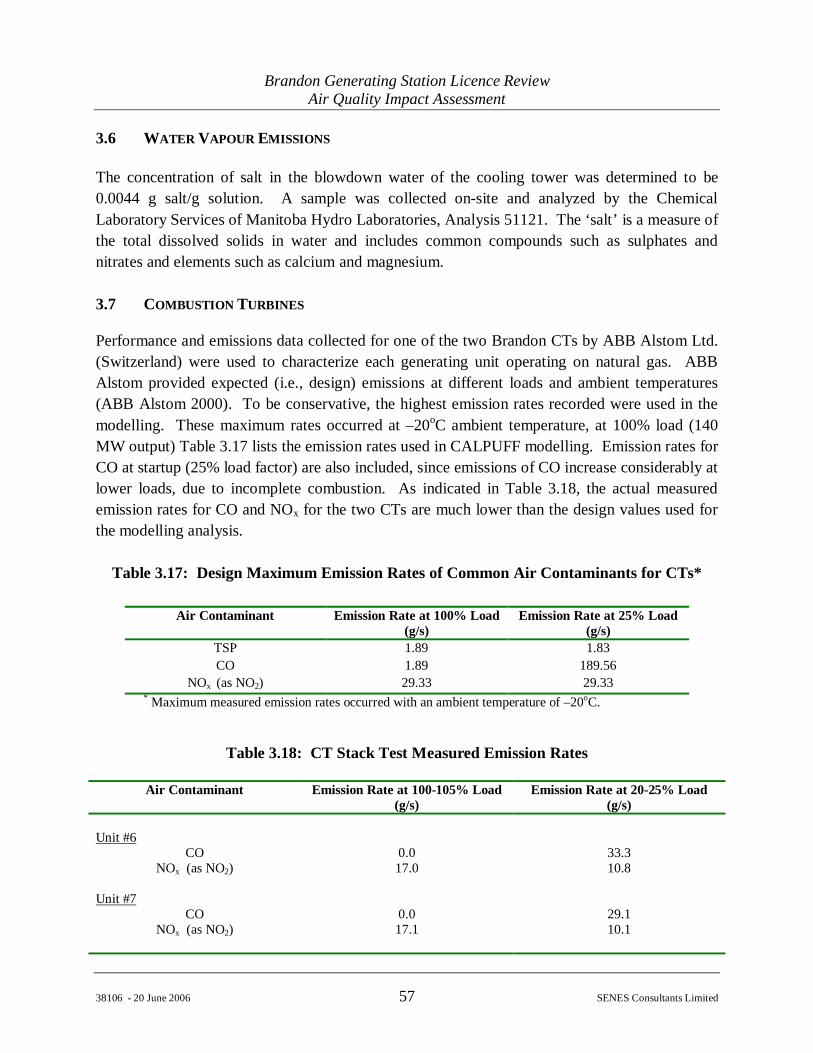
Brandon Generating Station Licence ReviewAir Quality Impact Assessment
38106 - 20 June 2006 57 SENES Consultants Limited
3.6 WATER VAPOUR EMISSIONS
The concentration of salt in the blowdown water of the cooling tower was determined to be0.0044 g salt/g solution. A sample was collected on-site and analyzed by the ChemicalLaboratory Services of Manitoba Hydro Laboratories, Analysis 51121. The ‘salt’ is a measure ofthe total dissolved solids in water and includes common compounds such as sulphates andnitrates and elements such as calcium and magnesium.
3.7 COMBUSTION TURBINES
Performance and emissions data collected for one of the two Brandon CTs by ABB Alstom Ltd.(Switzerland) were used to characterize each generating unit operating on natural gas. ABBAlstom provided expected (i.e., design) emissions at different loads and ambient temperatures(ABB Alstom 2000). To be conservative, the highest emission rates recorded were used in themodelling. These maximum rates occurred at –20oC ambient temperature, at 100% load (140MW output) Table 3.17 lists the emission rates used in CALPUFF modelling. Emission rates forCO at startup (25% load factor) are also included, since emissions of CO increase considerably atlower loads, due to incomplete combustion. As indicated in Table 3.18, the actual measuredemission rates for CO and NOx for the two CTs are much lower than the design values used forthe modelling analysis.
Table 3.17: Design Maximum Emission Rates of Common Air Contaminants for CTs*
Air Contaminant Emission Rate at 100% Load(g/s)
Emission Rate at 25% Load(g/s)
TSP 1.89 1.83CO 1.89 189.56
NOx (as NO2) 29.33 29.33* Maximum measured emission rates occurred with an ambient temperature of –20oC.
Table 3.18: CT Stack Test Measured Emission Rates
Air Contaminant Emission Rate at 100-105% Load(g/s)
Emission Rate at 20-25% Load(g/s)
Unit #6CO 0.0 33.3
NOx (as NO2) 17.0 10.8
Unit #7CO 0.0 29.1
NOx (as NO2) 17.1 10.1
Brandon Generating Station Licence ReviewAir Quality Impact Assessment
38106 - 20 June 2006 58 SENES Consultants Limited
Other contaminant species than those listed in Table 3.17 are also produced during natural gascombustion. These species were not considered in the dispersion modelling either due toinsignificant amounts released (e.g., SO2) or lack of ambient guidelines or standards (i.e.,VOCs). For particulate matter, virtually all SPM released from the combustion of natural gas isin the form of respirable particulate matter (PM2.5). As such, particulate matter emissions fromthe CTs were considered to be entirely in the form of PM2.5. Further information aboutemissions and ambient concentrations due to the operation of the CTs can be found in a recentenvironmental impact assessment conducted in 2000 (UMA and Jacques Whitford 2000).
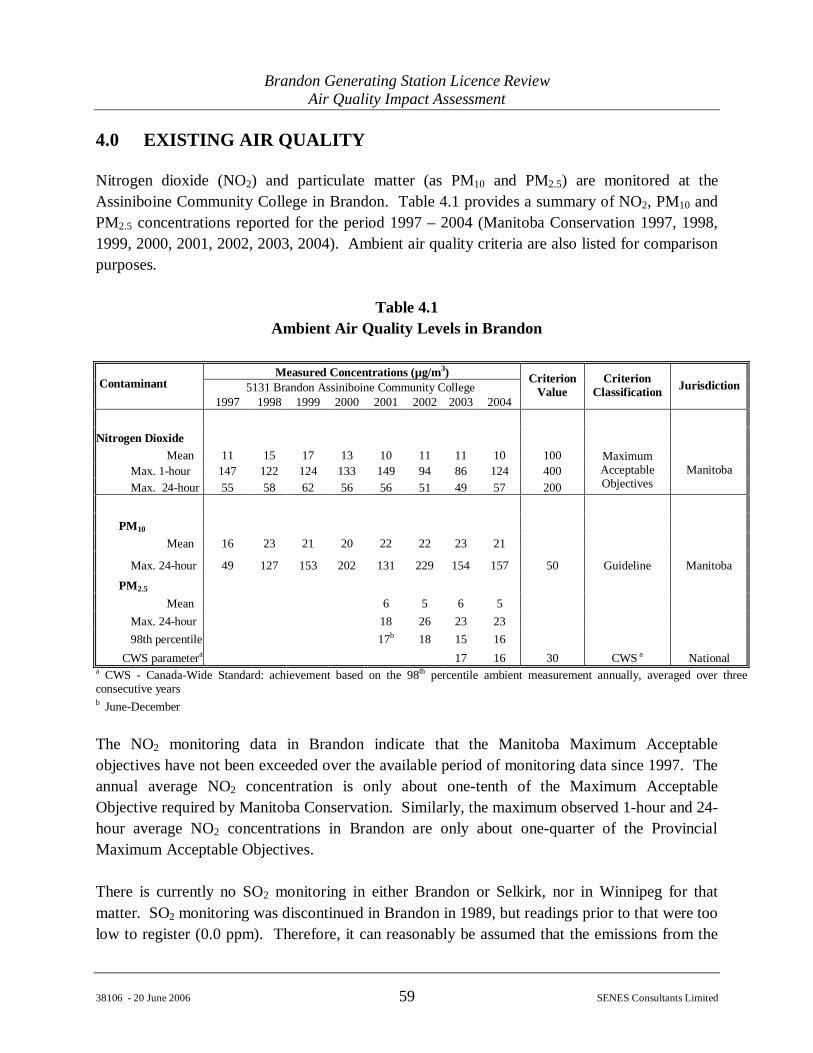
Brandon Generating Station Licence ReviewAir Quality Impact Assessment
38106 - 20 June 2006 59 SENES Consultants Limited
4.0 EXISTING AIR QUALITY
Nitrogen dioxide (NO2) and particulate matter (as PM10 and PM2.5) are monitored at theAssiniboine Community College in Brandon. Table 4.1 provides a summary of NO2, PM10 andPM2.5 concentrations reported for the period 1997 – 2004 (Manitoba Conservation 1997, 1998,1999, 2000, 2001, 2002, 2003, 2004). Ambient air quality criteria are also listed for comparisonpurposes.
Table 4.1Ambient Air Quality Levels in Brandon
Measured Concentrations (µg/m3) Contaminant 5131 Brandon Assiniboine Community College
1997 1998 1999 2000 2001 2002 2003 2004
CriterionValue
CriterionClassification Jurisdiction
Nitrogen DioxideMean 11 15 17 13 10 11 11 10 100
Max. 1-hour 147 122 124 133 149 94 86 124 400Max. 24-hour 55 58 62 56 56 51 49 57 200
MaximumAcceptableObjectives
Manitoba
PM10
Mean 16 23 21 20 22 22 23 21
Max. 24-hour 49 127 153 202 131 229 154 157 50 Guideline Manitoba
PM2.5
Mean 6 5 6 5Max. 24-hour 18 26 23 2398th percentile 17b 18 15 16
CWS parametera 17 16 30 CWS a Nationala CWS - Canada-Wide Standard: achievement based on the 98th percentile ambient measurement annually, averaged over threeconsecutive yearsb June-December
The NO2 monitoring data in Brandon indicate that the Manitoba Maximum Acceptableobjectives have not been exceeded over the available period of monitoring data since 1997. Theannual average NO2 concentration is only about one-tenth of the Maximum AcceptableObjective required by Manitoba Conservation. Similarly, the maximum observed 1-hour and 24-hour average NO2 concentrations in Brandon are only about one-quarter of the ProvincialMaximum Acceptable Objectives.
There is currently no SO2 monitoring in either Brandon or Selkirk, nor in Winnipeg for thatmatter. SO2 monitoring was discontinued in Brandon in 1989, but readings prior to that were toolow to register (0.0 ppm). Therefore, it can reasonably be assumed that the emissions from the
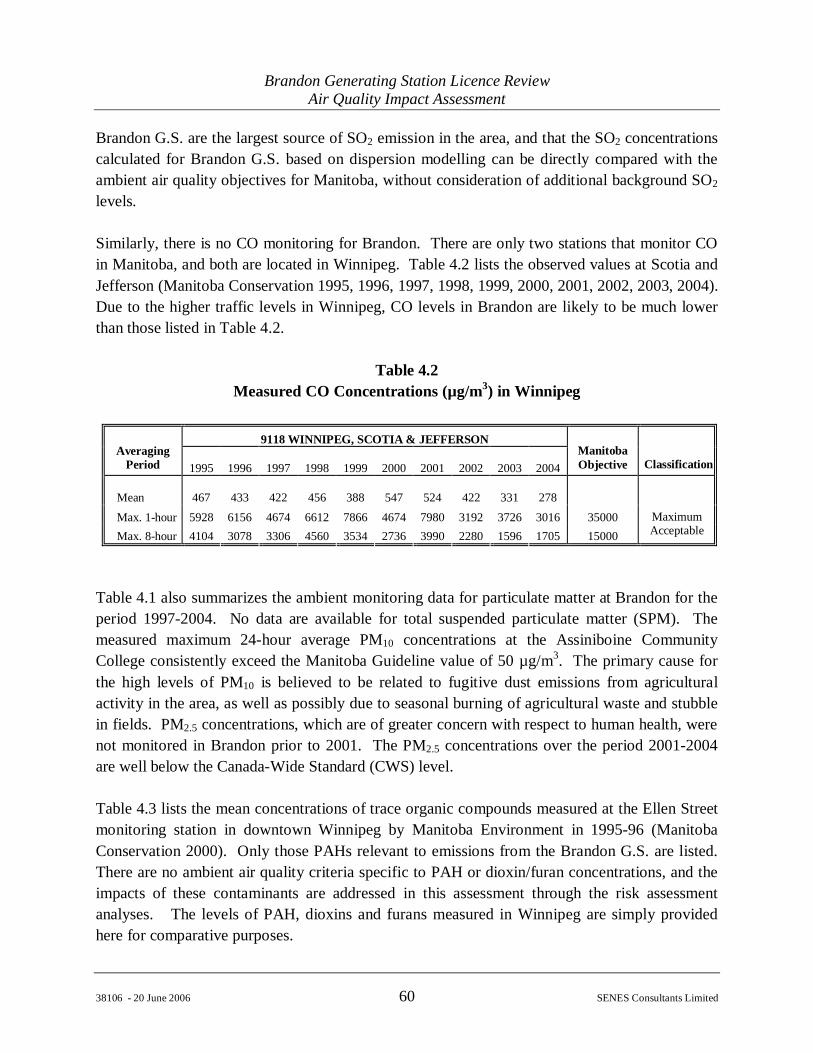
Brandon Generating Station Licence ReviewAir Quality Impact Assessment
38106 - 20 June 2006 60 SENES Consultants Limited
Brandon G.S. are the largest source of SO2 emission in the area, and that the SO2 concentrationscalculated for Brandon G.S. based on dispersion modelling can be directly compared with theambient air quality objectives for Manitoba, without consideration of additional background SO2
levels.
Similarly, there is no CO monitoring for Brandon. There are only two stations that monitor COin Manitoba, and both are located in Winnipeg. Table 4.2 lists the observed values at Scotia andJefferson (Manitoba Conservation 1995, 1996, 1997, 1998, 1999, 2000, 2001, 2002, 2003, 2004).Due to the higher traffic levels in Winnipeg, CO levels in Brandon are likely to be much lowerthan those listed in Table 4.2.
Table 4.2Measured CO Concentrations (µg/m3) in Winnipeg
9118 WINNIPEG, SCOTIA & JEFFERSONAveraging
Period 1995 1996 1997 1998 1999 2000 2001 2002 2003 2004ManitobaObjective Classification
Mean 467 433 422 456 388 547 524 422 331 278Max. 1-hour 5928 6156 4674 6612 7866 4674 7980 3192 3726 3016 35000Max. 8-hour 4104 3078 3306 4560 3534 2736 3990 2280 1596 1705 15000
MaximumAcceptable
Table 4.1 also summarizes the ambient monitoring data for particulate matter at Brandon for theperiod 1997-2004. No data are available for total suspended particulate matter (SPM). Themeasured maximum 24-hour average PM10 concentrations at the Assiniboine CommunityCollege consistently exceed the Manitoba Guideline value of 50 µg/m3. The primary cause forthe high levels of PM10 is believed to be related to fugitive dust emissions from agriculturalactivity in the area, as well as possibly due to seasonal burning of agricultural waste and stubblein fields. PM2.5 concentrations, which are of greater concern with respect to human health, werenot monitored in Brandon prior to 2001. The PM2.5 concentrations over the period 2001-2004are well below the Canada-Wide Standard (CWS) level.
Table 4.3 lists the mean concentrations of trace organic compounds measured at the Ellen Streetmonitoring station in downtown Winnipeg by Manitoba Environment in 1995-96 (ManitobaConservation 2000). Only those PAHs relevant to emissions from the Brandon G.S. are listed.There are no ambient air quality criteria specific to PAH or dioxin/furan concentrations, and theimpacts of these contaminants are addressed in this assessment through the risk assessmentanalyses. The levels of PAH, dioxins and furans measured in Winnipeg are simply providedhere for comparative purposes.
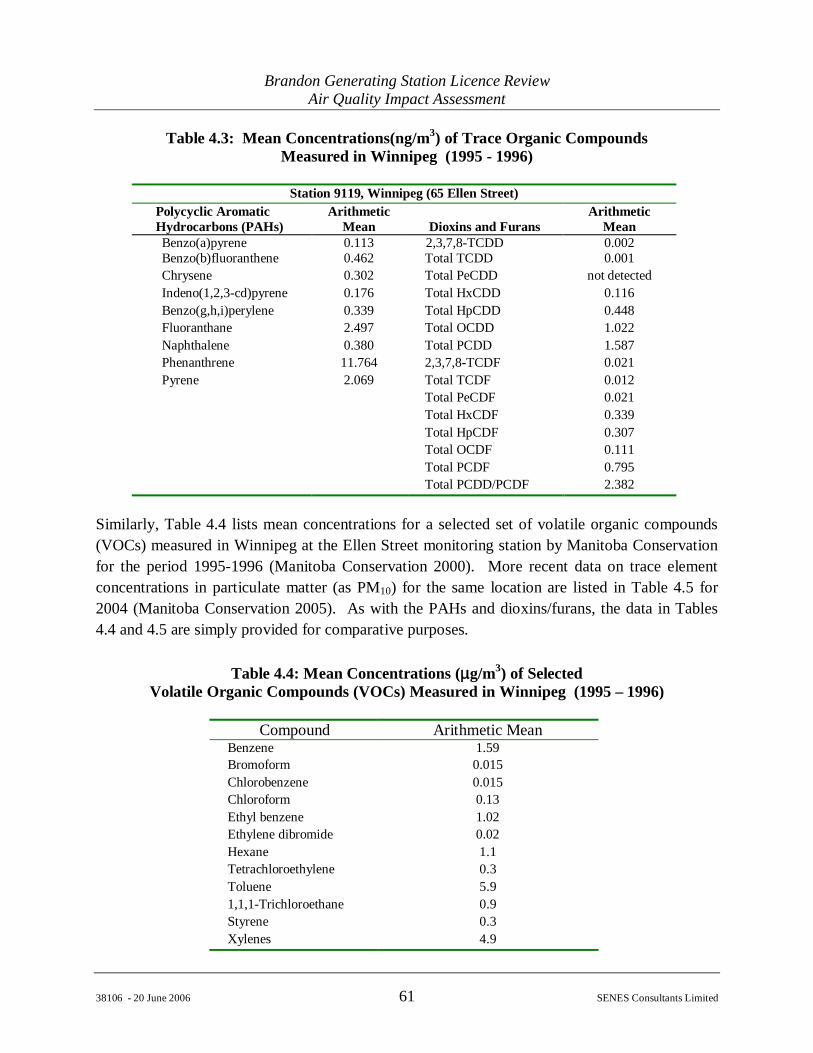
Brandon Generating Station Licence ReviewAir Quality Impact Assessment
38106 - 20 June 2006 61 SENES Consultants Limited
Table 4.3: Mean Concentrations(ng/m3) of Trace Organic CompoundsMeasured in Winnipeg (1995 - 1996)
Station 9119, Winnipeg (65 Ellen Street)Polycyclic AromaticHydrocarbons (PAHs)
ArithmeticMean Dioxins and Furans
ArithmeticMean
Benzo(a)pyrene 0.113 2,3,7,8-TCDD 0.002Benzo(b)fluoranthene 0.462 Total TCDD 0.001Chrysene 0.302 Total PeCDD not detectedIndeno(1,2,3-cd)pyrene 0.176 Total HxCDD 0.116Benzo(g,h,i)perylene 0.339 Total HpCDD 0.448Fluoranthane 2.497 Total OCDD 1.022Naphthalene 0.380 Total PCDD 1.587Phenanthrene 11.764 2,3,7,8-TCDF 0.021Pyrene 2.069 Total TCDF 0.012
Total PeCDF 0.021Total HxCDF 0.339Total HpCDF 0.307Total OCDF 0.111Total PCDF 0.795Total PCDD/PCDF 2.382
Similarly, Table 4.4 lists mean concentrations for a selected set of volatile organic compounds(VOCs) measured in Winnipeg at the Ellen Street monitoring station by Manitoba Conservationfor the period 1995-1996 (Manitoba Conservation 2000). More recent data on trace elementconcentrations in particulate matter (as PM10) for the same location are listed in Table 4.5 for2004 (Manitoba Conservation 2005). As with the PAHs and dioxins/furans, the data in Tables4.4 and 4.5 are simply provided for comparative purposes.
Table 4.4: Mean Concentrations (µg/m3) of SelectedVolatile Organic Compounds (VOCs) Measured in Winnipeg (1995 – 1996)
Compound Arithmetic MeanBenzene 1.59Bromoform 0.015Chlorobenzene 0.015Chloroform 0.13Ethyl benzene 1.02Ethylene dibromide 0.02Hexane 1.1Tetrachloroethylene 0.3Toluene 5.91,1,1-Trichloroethane 0.9Styrene 0.3Xylenes 4.9
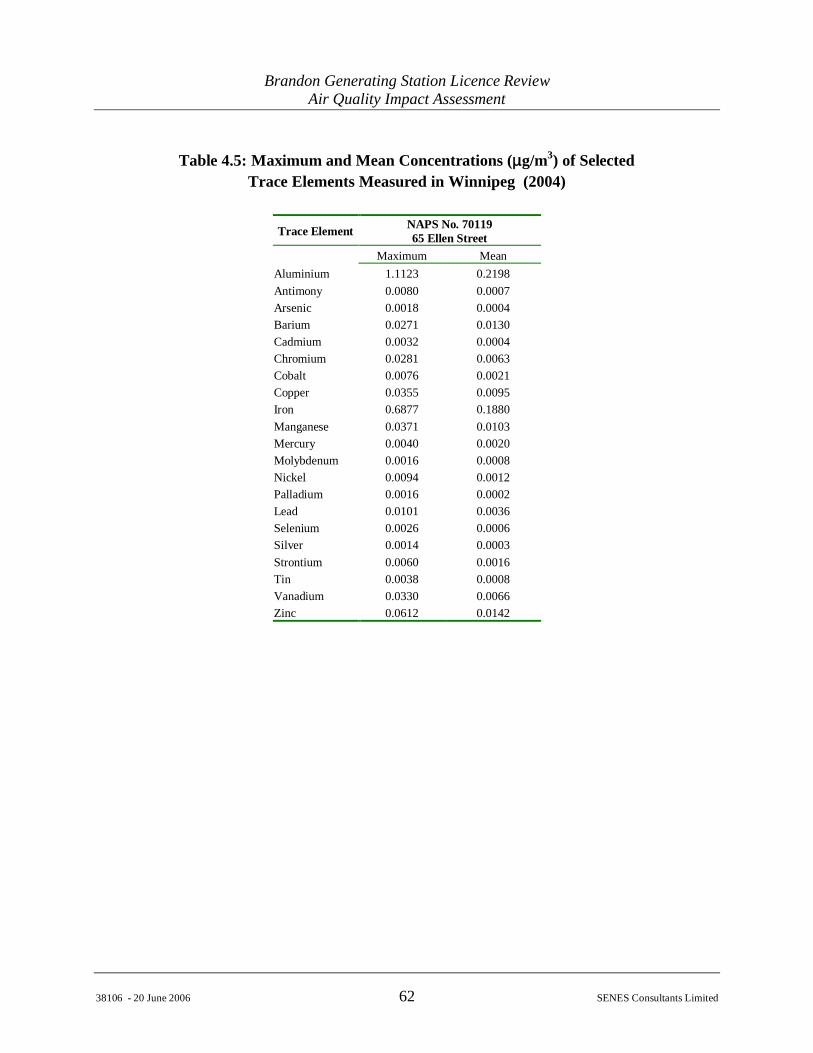
Brandon Generating Station Licence ReviewAir Quality Impact Assessment
38106 - 20 June 2006 62 SENES Consultants Limited
Table 4.5: Maximum and Mean Concentrations (µg/m3) of SelectedTrace Elements Measured in Winnipeg (2004)
Trace Element NAPS No. 7011965 Ellen Street
Maximum MeanAluminium 1.1123 0.2198Antimony 0.0080 0.0007Arsenic 0.0018 0.0004Barium 0.0271 0.0130Cadmium 0.0032 0.0004Chromium 0.0281 0.0063Cobalt 0.0076 0.0021Copper 0.0355 0.0095Iron 0.6877 0.1880Manganese 0.0371 0.0103Mercury 0.0040 0.0020Molybdenum 0.0016 0.0008Nickel 0.0094 0.0012Palladium 0.0016 0.0002Lead 0.0101 0.0036Selenium 0.0026 0.0006Silver 0.0014 0.0003Strontium 0.0060 0.0016Tin 0.0038 0.0008Vanadium 0.0330 0.0066Zinc 0.0612 0.0142
Brandon Generating Station Licence ReviewAir Quality Impact Assessment
38106 - 20 June 2006 63 SENES Consultants Limited
5.0 PREDICTED AIR QUALITY
The results from the dispersion modelling analysis are presented in the following sections. Theanalysis is presented for emissions from coal-fired operation of the Unit #5 stack, fugitive dustemissions from the coal and ash storage areas, and the associated cooling tower. In addition, theanalysis provides an assessment of the combined impacts for common air contaminants (CO,NO2 and PM2.5) from the operation of Unit #5 concurrent with the two natural gas-firedcombustion turbines (CTs – Units #6 and #7). Although Manitoba Hydro operates the CTs undera separate permit and the operation of the CTs is not part of this licence review for Unit #5, thepotential for cumulative short-term impacts on air quality was considered an appropriate issuefor consideration in this review.
In addition to a discussion of predicted ambient air quality concentrations, significantcharacteristics of the meteorological fields are also described. Where appropriate, the predictedconcentrations [expressed in units of micrograms per cubic metre of air (µg/m³)] have beencompared to applicable ambient air quality criteria for Manitoba. Deposition of trace aircontaminants to the surface [expressed in units of micrograms per square metre per year (µg/m2-year)] was also calculated by accounting for aerodynamic settling velocities (‘dry’ deposition)and precipitation amounts with contaminant-specific scavenging ratios (‘wet’ deposition).Emissions of SO2, particulate matter and the inorganic trace elements, which are associated withparticulate matter from the Unit #5 stack and fugitive coal dust, were based on both current coalquality and upper-bound coal quality in the future. The evaluation of potential risks to humanhealth and the environment for both short-term and long-term exposure due to ambient airconcentrations and deposition of Contaminants of Potential Concern (COPC) is addressed in aseparate document (Appendix N).
For some air contaminants, there are chemical transformations that occur over time as emittedamounts mix with the ambient air, although in most cases the transformations have significanceonly at large distances from the source(s). Of importance to this assessment, most of the NOx
emitted from high temperature combustion is in the form of NO. Much of the NO is transformedinto NO2 by a variety of free radical species such as oxygen (O2), ozone (O3), hydrogen peroxide(H2O2) and hydroperoxyl (HO2) (Radojevic 1992). To account for the maximum ambient NO2
concentrations in the community, a conservative approach can be used, which assumes that all ofthe NO is released from the combustion process in the form of NO2. Alternatively, arepresentative conversion rate can be applied to provide a more realistic estimate of NO2
concentration. Both approaches are used and presented in this report.
Dispersion modelling results of Unit #5 stack emissions in the following sections of the reportare presented as follows:
Brandon Generating Station Licence ReviewAir Quality Impact Assessment
38106 - 20 June 2006 64 SENES Consultants Limited
1) ambient concentrations for the common air contaminants CO, NO2, are presented for boththe preferred operating scenario (OS1; see discussion of operating scenarios in Sections3.1 and 3.2) and the least efficient operating scenario (OS2);
2) ambient concentrations for SO2, PM10 and PM2.5are presented for all three operatingscenarios (i.e., OS1, OS2 and OS3);
3) ambient concentrations for selected trace inorganic elements, trace organic compounds,and VOCs for which there exist ambient air quality criteria, are presented for the upperbound estimate of emissions (OS3); ;
4) ambient concentrations for trace organic compounds (PAH, dioxins and furans) arepresented in Section 5.0for the upper bound estimate of emissions (OS3), and theseestimates are subsequently used for human health risk assessment;
5) results for VOCs are assumed to be the same for all three operating scenarios;6) annual average deposition of trace inorganic elements (except mercury) and organic
compounds is presented for the upper bound estimate of emissions (OS3);7) ambient concentrations and annual average deposition rates for mercury are presented
based on an emission cap of 20 kg/year; and,8) ambient concentrations for CO, NO2 and PM2.5 from the combined emissions of Unit #5
for the OS2 scenario and the two CTs operating on natural gas.
Dispersion modelling results for fugitive dust from coal and ash storage and handling arepresented as 24-hour average concentrations of particulate matter, and as annual averagedeposition rates for the upper bound estimate of trace element emissions.
Modelling results for the cooling tower are presented for:
1) total annual hours of fogging and icing;2) annual visible plume length frequencies; and3) total annual water and salt deposition.
Finally, it should be recognized that the dispersion model (i.e., CALPUFF) used in the BrandonG.S. air quality assessment of the Unit #5 emission stack and CTs is a newer-generation modelthat has a significantly improved structure for evaluating fine scale atmospheric motions. Windshear and obstacle-induced turbulence are represented to an extent that was not possible withprevious regulatory models. Vigorous vertical mixing induced by wind shear and turbulence cancause dramatically higher ground-level concentrations of air pollutants, but on a very infrequentbasis, for tall stacks such as the 107 metre stack on Unit #5. The CALPUFF model representsthese occurrences, whereas models used in pervious assessments (e.g., for the 1992 licencereview of the Brandon G.S.) may not have captured such atmospheric motions. A study
Brandon Generating Station Licence ReviewAir Quality Impact Assessment
38106 - 20 June 2006 65 SENES Consultants Limited
conducted by the U.S. Environmental Protection Agency (EPA) found that short-term ground-level concentrations predicted by CALPUFF can be significantly higher near a tall stack thanthose predicted with the Industrial Source Complex Short-term (Version 3 – ISCST3) dispersionmodel (US EPA 1998).
On the other hand, the CALPUFF model does not accurately represent emission plumes offugitive dust from area sources. The model assumes a uniform vertical distribution of particlesin the emission plume, whereas actual particle distributions would have higher concentrationscloser to the surface. The ISC model provides a better representation of such plumes. For thisreason, and with prior approval from Manitoba Conservation, the fugitive dust emissions fromthe coal and ash storage areas have been modelled using the ISCST3 model instead of theCALPUFF model.
Emissions from the cooling tower were modelled using the SACTI model developed by EPRI.This is the same model that was previously used to estimate the impacts of the proposed coolingtower in the 1992 licence review for the Brandon G.S.
5.1 AMBIENT AIR QUALITY CRITERIA
The Province of Manitoba has adopted a set of time-based maximum pollutant concentrationlevels for the protection and preservation of ambient air quality. Criteria for each contaminantare classified as either objectives or guidelines depending upon several factors. The ‘objective’classification is intended to be applied to those air pollutants that are sufficiently ubiquitous inpresence (i.e., common contaminants) and potential environmental effect that national limitshave been developed. The ‘guideline’ classification is used for those pollutants of a morelocalized presence for which provincial limits have been developed.
Manitoba air quality criteria are specified for the following two levels:
• The Maximum Tolerable Level which denotes a time-based concentration of aircontaminant beyond which, due to a diminishing margin of safety, appropriate actionis required to protect the health of the general population;
• The Maximum Acceptable Level that is deemed essential to provide adequateprotection for soils, water, vegetation, materials, animals, visibility, personal comfortand well-being.
The selection of the appropriate level depends upon the degree of protection to be afforded toaffected receptors. Maximum Tolerable Levels are only intended for evaluation purposes toidentify the severity of an anthropogenic or natural phenomenon in order to protect public health
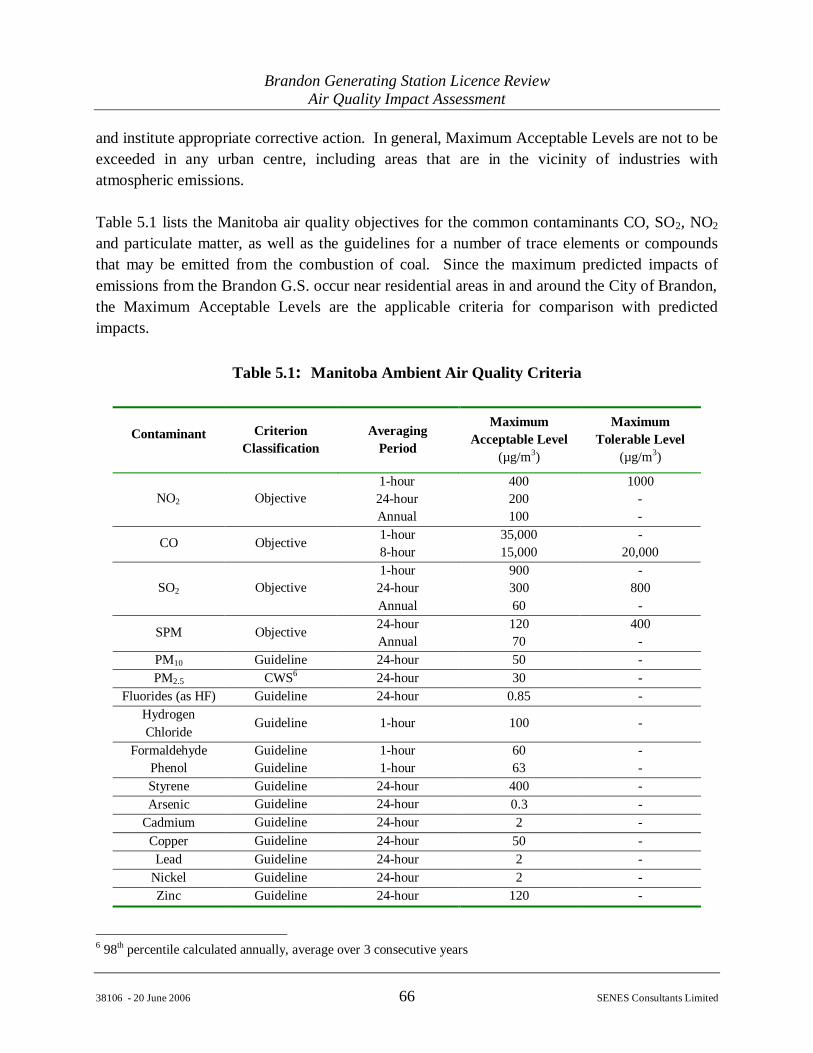
Brandon Generating Station Licence ReviewAir Quality Impact Assessment
38106 - 20 June 2006 66 SENES Consultants Limited
and institute appropriate corrective action. In general, Maximum Acceptable Levels are not to beexceeded in any urban centre, including areas that are in the vicinity of industries withatmospheric emissions.
Table 5.1 lists the Manitoba air quality objectives for the common contaminants CO, SO2, NO2
and particulate matter, as well as the guidelines for a number of trace elements or compoundsthat may be emitted from the combustion of coal. Since the maximum predicted impacts ofemissions from the Brandon G.S. occur near residential areas in and around the City of Brandon,the Maximum Acceptable Levels are the applicable criteria for comparison with predictedimpacts.
Table 5.1: Manitoba Ambient Air Quality Criteria
Contaminant CriterionClassification
AveragingPeriod
MaximumAcceptable Level
(µg/m3)
MaximumTolerable Level
(µg/m3)
1-hour 400 100024-hour 200 -NO2 ObjectiveAnnual 100 -1-hour 35,000 -CO Objective8-hour 15,000 20,0001-hour 900 -24-hour 300 800SO2 ObjectiveAnnual 60 -24-hour 120 400SPM ObjectiveAnnual 70 -
PM10 Guideline 24-hour 50 -PM2.5 CWS6 24-hour 30 -
Fluorides (as HF) Guideline 24-hour 0.85 -HydrogenChloride
Guideline 1-hour 100 -
Formaldehyde Guideline 1-hour 60 -Phenol Guideline 1-hour 63 -Styrene Guideline 24-hour 400 -Arsenic Guideline 24-hour 0.3 -
Cadmium Guideline 24-hour 2 -Copper Guideline 24-hour 50 -Lead Guideline 24-hour 2 -
Nickel Guideline 24-hour 2 -Zinc Guideline 24-hour 120 -
6 98th percentile calculated annually, average over 3 consecutive years
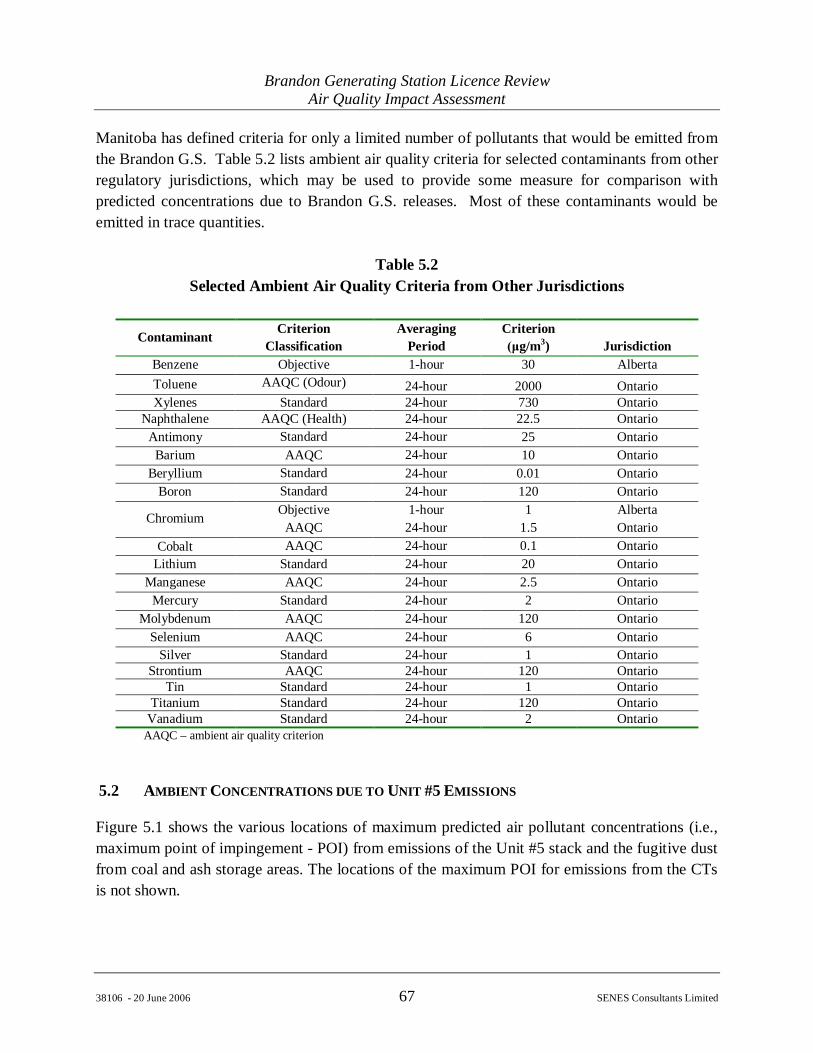
Brandon Generating Station Licence ReviewAir Quality Impact Assessment
38106 - 20 June 2006 67 SENES Consultants Limited
Manitoba has defined criteria for only a limited number of pollutants that would be emitted fromthe Brandon G.S. Table 5.2 lists ambient air quality criteria for selected contaminants from otherregulatory jurisdictions, which may be used to provide some measure for comparison withpredicted concentrations due to Brandon G.S. releases. Most of these contaminants would beemitted in trace quantities.
Table 5.2Selected Ambient Air Quality Criteria from Other Jurisdictions
Contaminant CriterionClassification
AveragingPeriod
Criteriong/m3) Jurisdiction
Benzene Objective 1-hour 30 AlbertaToluene AAQC (Odour) 24-hour 2000 OntarioXylenes Standard 24-hour 730 Ontario
Naphthalene AAQC (Health) 24-hour 22.5 OntarioAntimony Standard 24-hour 25 Ontario
Barium AAQC 24-hour 10 OntarioBeryllium Standard 24-hour 0.01 Ontario
Boron Standard 24-hour 120 Ontario
Chromium ObjectiveAAQC
1-hour24-hour
11.5
AlbertaOntario
Cobalt AAQC 24-hour 0.1 OntarioLithium Standard 24-hour 20 Ontario
Manganese AAQC 24-hour 2.5 OntarioMercury Standard 24-hour 2 Ontario
Molybdenum AAQC 24-hour 120 OntarioSelenium AAQC 24-hour 6 Ontario
Silver Standard 24-hour 1 OntarioStrontium AAQC 24-hour 120 Ontario
Tin Standard 24-hour 1 OntarioTitanium Standard 24-hour 120 Ontario
Vanadium Standard 24-hour 2 OntarioAAQC – ambient air quality criterion
5.2 AMBIENT CONCENTRATIONS DUE TO UNIT #5 EMISSIONS
Figure 5.1 shows the various locations of maximum predicted air pollutant concentrations (i.e.,maximum point of impingement - POI) from emissions of the Unit #5 stack and the fugitive dustfrom coal and ash storage areas. The locations of the maximum POI for emissions from the CTsis not shown.