appendix l - files.ceqanet.opr.ca.gov
TRANSCRIPT
Appendix LWater Supply Assessment


City of San Diego Public Utilities Department Water Supply Assessment Report
Riverwalk Project
Table of Contents
Section 1 - Purpose ................................................................................................... 1
Section 2 - Project Description ............................................................................... 2
Section 3 - Findings ................................................................................................. 3
Section 4 - City of San Diego Public Utilities Department ................................. 6
4.1 Overview of Potable System Facilities .............................................. 6 4.2 Overview of Recycled System Facilities ............................................. 7
Section 5 - Existing and Projected Supplies ......................................................... 9
5.1 Metropolitan Water District of Southern California ...................... 10 5.2 San Diego County Water Authority .................................................. 16 5.3 2009 Comprehensive Water Package….…….………………………………20 5.4 Public Utilities Department ..............................................................22
5.4.1 Demonstrating the Availability of Sufficient Supplies ........22 5.4.2 Plans for Acquiring Additional Supplies .............................. 26
Section 6 - Projected Demands............................................................................. 31
6.1 Water Sales to Other Agencies ......................................................... 34 6.2 Projected Single-Dry Year Water Supply and Demand………………37 6.3 Projected Multiple-Dry Year Water Supply and Demand……..……37
Section 7 - Conclusion - Availability of Sufficient Supplies ............................ 39
Source Documents ................................................................................................. 42
Appendix A …………………………………………………………………………………….……......43 Appendix B ……………………………………………………………………………………………….46


City of San Diego Public Utilities Department Water Supply Assessment Report Kearny Mesa Community Plan Update Project
1
Section 1 - Purpose
On January 1, 2002, Senate Bill 610 (SB 610) and Senate Bill 221 (SB 221) took effect. The intent of SB 610 and SB 221 was to improve the link between information on water supply availability and certain land use decisions made by cities and counties. Under SB 610 (codified in the Water Code beginning at Section 10910), a water supply assessment (WSA) must be furnished to cities and counties for inclusion in any environmental documentation of projects (defined in the Water Code) that propose to construct five hundred (500) or more residential units, or that will use an amount of water equivalent to what would be used by five hundred (500) residential units and that are subject to the California Environmental Quality Act (CEQA). Under SB 221, approval by a city or county of certain residential subdivisions requires an affirmative written verification of sufficient water supply or water supply verification (WSV).
Not every project that is subject to the requirements of SB 610 is subject to the mandatory water verification of SB 221. Conversely, not every project that is subject to the requirements of SB 221 is subject to SB 610.
A foundational document for compliance for both SB 610 and SB 221 is the Urban Water Management Plan (UWMP) of the relevant water agency. Both SB 610 and SB 221 identify the UWMP as a planning document that can be used by a water supplier to meet the standards set forth in both statutes. Thorough and complete UWMPs will allow water suppliers to fulfill the specific requirements of the two statutes. Cities, counties, water districts, property owners, and developers utilize their respective UWMPs when planning for and proposing new projects. It is crucial that cities, counties, and water suppliers work together when developing and updating these planning documents. The City of San Diego 2015 UWMP was developed in collaboration with the San Diego County Water Authority (Water Authority) and adopted by the San Diego City Council in June of 2016 and serves as the basis for this Water Supply Assessment Report (Report).
The City of San Diego Planning Department requested that the City of San Diego Public Utilities Department (PUD) prepare this Report as part of the environmental review for the Kearny Mesa Community Plan Update Project (Project). A more detailed description of the Project is provided in Section 2 of this Report. This Report evaluates water supplies that are or will be available during normal, single-dry year, and multiple-dry water years during a twenty (20) year projection to meet the projected demands of the Project in addition to existing and planned future water demands of the PUD. This Report provides an assessment of the availability of water supplies for the Project only and does not constitute approval of the Project.
This Report also includes identification of existing water supply entitlements, water rights, water service contracts or agreements relevant to the identified water supply for the Project and quantities of water received in prior years pursuant to those entitlements, rights, contracts and agreements. This Report has been prepared in compliance with the requirements under SB 610 by the PUD in consultation with DSD, the Water Authority and the Metropolitan Water District of Southern California (MWD).

City of San Diego Public Utilities Department Water Supply Assessment Report Kearny Mesa Community Plan Update Project
2
Section 2 - Project Description
Kearny Mesa encompasses approximately 4,400 acres at the geographic center of the City of San Diego (City; Figure 2-1). The Community Plan Planning Area is generally bounded by State Route 52 (SR 52) on the north, Interstate 15 (I-15) on the east, properties south of Aero Drive on the south, and I-805 on the west. Kearny Mesa is bordered by several other community planning areas including Tierrasanta to the east; Serra Mesa to the south; and Clairemont Mesa to the west. Marine Corps Air Station (MCAS) Miramar is located to the north. The Project is a comprehensive update of the Kearny Mesa Community Plan. The updated Community Plan includes policies to strengthen the employment base, integrate housing in key locations and improve connections. The proposed land uses will support mixed-use, transit-oriented, and pedestrian-friendly development. The Draft Community Plan will result in additional housing units which will reduce the total acres of industrial land uses and proposed areas with a mixed-use land use designation.
FIGURE 2-1 VICINITY MAP OF PROJECT

City of San Diego Public Utilities Department Water Supply Assessment Report Kearny Mesa Community Plan Update Project
3
Section 3 - Findings
Water Assessment Project: This Report identifies that the proposed water demand projections for the Project are included in the regional water resource planning documents of the City, Water Authority and MWD. Current and future water supplies as well as actions necessary to develop the future water supplies, have been identified. This Report demonstrates that there will be sufficient water supplies available during normal, single-dry year, and multiple-dry water years over a 20-year projection to meet the unanticipated demands of the Project. Based on the 2015 UWMPs from the City and the Water Authority, there is sufficient water planned to supply the Project’s estimated annual average usage (Table 3-1). The estimated water demands of the Project are 8,744,448 gallons per day (GPD), or 9,795.04 acre-feet per year (AFY). In the City’s 2015 UWMP, the planned water demand of this project site is 6,999,608 GPD (7,840.57 AFY) in 2040. As such, the remaining portion of the estimated demand, calculated to be 1,744,840 GPD (1,954.47 AFY), is accounted for through the AFG demand increment of the Water Authority’s 2015 UWMP (Appendix A). The City and other member agencies of the Water Authority which utilize the AFG demand increment as a part of their WSA may receive assistance from the Water Authority to document the availability and adequacy of regional water supply for inclusion in their certified Environmental Impact Reports (EIRs). An example is provided in Appendix B.
Accelerated Forecasted Growth (AFG) The Water Authority’s 2015 UWMP provides a comprehensive planning analysis at a regional level, and includes water demand associated with accelerated forecasted residential development as part of its municipal and industrial sector demand projections. These housing units were identified by the San Diego Association of Governments’ (SANDAG’s) land use plan in the course of its regional housing needs assessment, but are not yet included in existing general land use plans of local jurisdictions. The water demand associated with accelerated forecasted residential development is intended to account for SANDAG’s land use development currently projected to occur between 2040 and 2050, but has the likely potential to occur on an accelerated schedule. SANDAG estimates that this accelerated forecasted residential development could occur within the planning horizon (2015 to 2040) of the 2015 UWMP. These units are not yet included in local jurisdiction general plans, so their projected demands are incorporated at a regional level. When necessary, this additional demand increment, termed Accelerated Forecasted Growth (AFG), can be used by Water Authority’s member agencies, including the City, to meet the demands of development projects not identified in the general land use plans.

City of San Diego Public Utilities Department Water Supply Assessment Report Kearny Mesa Community Plan Update Project
4
TABLE 3-1 WATER DEMAND ANALYSIS
1. Low to high density multi-family residential water consumption is based on the City's water demand
factor of 176 GPD/DU. This demand factor accounts for 80 GPCD (inclusive of nominal landscaping demand) and 2.2 persons per household (City Data).
2. Average commercial employee water use (administrative, operations, retail, etc.) is based on the City's acceptable standard water demand factor of 60 GPCD (City Data).
3. Single family residential water consumption is based on the City's water demand factor of 359.6 GPD/DU. This demand factor accounts for 116 GPCD (inclusive of nominal landscaping demand) and 3.1 persons per household (City Data).
4. This WSA analysis assumes that all industrial, mobile park, and business park land use will be converted to a residential land use category (draft Community Plan amendments).
Existing and Future Developments Planned to Occur by 2040: The City’s 2015 UWMP demonstrates there will be sufficient water supplies available to meet demands for existing and planned future developments that are projected to occur by 2040. Based on a normal water supply year, the estimated water supply projected in five-year increments for a 20-year projection will meet the City’s projected water demand of 200,984 acre-feetA (AF) in 2020, to 273,408 AF in 2040 (Table 6-6) for these developments. Similarly, based on a single-dry year forecast (Table 6-7), the estimated water supply will meet the projected water demand of 290,292 AF (2040). Based on a multiple-dry year, third year supply (Table 6-8), the estimated water supply will meet the projected demands of 208,665, 251,402, 275,139, 284,412, and 284,058 AF in 2020, 2025, 2030, 2035, and 2040, respectively. A An acre-foot of water equals 325,851 gallons which is enough water for two (2) average families of four (4) for one (1) year.
Gallons per Day (GPD) Acre-Foot per Year (AFY)
Dwelling Units (DUs)1 4,093 DUs 720,368 806.92
Employees2 104,654 Persons 6,279,240 7,033.65
6,999,608 7,840.57
Employees2 104,654 Persons 6,279,240 7,033.65
Single Family Residential3 599 DUs 215,400 241.28Multi-Family Residential1,4
12,783 DUs 2,249,808 2,520.11
8,744,448 9,795.04
8,744,448 9,795.04
6,999,608 7,840.57
1,744,840 1,954.47
0 0Net Unanticipated Demands
Total
Net Water Demands
Projected Demand
City of San Diego 2015 UWMP – Planned Demand
Water Authority AFG – Planned Demand
City Planned Water Demands for Project (2015 UWMP)
CategoryEstimated Potable Water Demand
SANDAG SERIES 13: 2040
Total
Quantity
Quantity
Projected Water Demands for Long-Range Development Plan by Year 2040
Category GPD AFY
City of San Diego Public Utilities Department Water Supply Assessment Report Kearny Mesa Community Plan Update Project
5
Conclusion In summary, these findings substantiate that there is sufficient planned water supply to serve this Project’s future water demands within the PUD’s water service area in normal, single-dry year and multiple-dry water year forecasts.
Therefore, this Report concludes that the projected level of water demand for this Project is within the regional water resource planning documents of the City, Water Authority, and MWD. Current and future water supplies, as well as the actions necessary to develop these supplies, have been identified in the water resources planning documents of the PUD, Water Authority, and MWD to serve the projected demands of the Project in addition to existing and planned future water demands of the PUD.
City of San Diego Public Utilities Department Water Supply Assessment Report Kearny Mesa Community Plan Update Project
6
Section 4 - City of San Diego Public Utilities Department
The City purchased its initial water system in 1901 from the privately-owned San Diego Water & Telephone Company. Since then, continual expansion of the water system has been required to meet the demands of the growing population of the City. To meet the demand, the PUD purchased a number of reservoirs between 1913 and 1935 to supplement local water supplies. Despite low annual precipitation in the area (approximately 10 inches per year), these reservoirs supplied the City’s growing demands until the year of 1940. The need to import water emerged with the increased demand generated by the presence of the United States Navy prior to and during World War II, and the ensuing population growth. As a result, the PUD and other local retail water distributors formed the Water Authority in 1944 for the purpose of purchasing Colorado River water from MWD. The PUD and other local retail water distributors began receiving imported water from the Colorado River in 1947.
Today, the PUD treats and delivers more than 160,000 AFY of water to approximately 1.39 million residents. The water system extends over 400 square miles, including 330 square miles in the City. The PUD potable water system serves the City and certain surrounding areas, including both retail and wholesale customers. The Project is located within the PUD’s water service area. In addition to delivering potable water, the City has a recycled water program. Its objectives are to optimize the use of local water supplies, lessen reliance on imported water, and free up capacity in the potable water system. Recycled water provides the City a dependable, year-round, locally produced and controlled water resource.
4.1 Overview of Potable System Facilities
The water system consists of: nine (9) raw water storage facilities with up to 569,021 AF of storage capacity, three (3) water treatment plants, 29 treated water storage facilities, and over 3,295 miles of transmission and distribution lines. The PUD maintains and operates nine (9) local surface raw water storage facilities which are connected to the City’s water treatment operations. The Lower Otay, Barrett and Morena Reservoirs (135,349 AF total capacity) service the Otay Water Treatment Plant (Otay WTP) in south San Diego; El Capitan, San Vicente, Sutherland, and Lake Murray Reservoirs (396,357 AF total capacity) service the Alvarado Water Treatment Plant (Alvarado WTP) in central San Diego; and the Miramar Reservoir (6,682 AF total capacity) services the Miramar Water Treatment Plant (Miramar WTP) in north San Diego. Lake Hodges Reservoir has a total capacity of 30,633 AF and is connected to Olivenhain Reservoir, which is owned by the Water Authority. Olivenhain Reservoir is connected to the Water Authority’s second aqueduct. Through this connection, Lake Hodges water can be delivered to all City treatment plants. The City has the ability to access 50 percent of the local water available in Hodges Reservoir via the Water Authority’s delivery system. The PUD maintains and operates three (3) water treatment plants mentioned above with a combined total rated capacity of 423,414 AFY, or 378 million gallons per day (MGD). The Miramar WTP, originally constructed in 1962, has a rated capacity of 161,300 AFY (144 MGD) with the ability to increase to 240,830 AFY (215 MGD) in the future. Construction to replace the two (2) old clearwells at the plant began in June of 2016 and is scheduled to be completed in August of 2020. The Miramar WTP generally serves the City’s geographical area north of the San Diego River (north San Diego). The Alvarado WTP, operational since 1951, had an initial

City of San Diego Public Utilities Department Water Supply Assessment Report Kearny Mesa Community Plan Update Project
7
capacity rating of 73,929 AFY (66 MGD). Several hydraulic improvements and upgrades were completed in 2011, which increased the capacity of the plant to 224,028 AFY (200 MGD). The State Water Resources Control Board (SWRCB) has approved this rating for the Alvarado WTP. The plant generally serves the geographical area from National City to the San Diego River (central San Diego). The Otay Water Treatment Plant (Otay WTP) was constructed in 1940 and has a current rated capacity of 38,084 AFY (34 MGD). The Otay WTP has hydraulic capacity to increase to 44,835 AFY (40 MGD) in the future. Upgrade work was completed in 2012, including the construction of a third flocculation and sedimentation basin as well as filter piping and media improvements. The Otay WTP generally serves the geographical area bordering Mexico (south San Diego) and parts of the southeastern portion of central San Diego. The PUD maintains and operates 29 treated water storage facilities including steel tanks, standpipes, concrete tanks and rectangular concrete reservoirs with capacities varying from less than one to 35 million gallons. The water system consists of more than 3,293 miles of pipelines, including transmission lines up to 84 inches in diameter and distribution lines as small as four (4) inches in diameter. Transmission lines are pipelines 16 inches and larger in diameter that convey raw water to the water treatment plants and convey treated water from the water treatment plants to the treated water storage facilities. Distribution lines are pipelines 16 inches and smaller in diameter that directly service the retail users connected to a meter. In addition, the PUD maintains and operates water pump stations that deliver treated water from the water treatment plants to approximately 280,000 metered service connections in 128 individual pressure zones in the City’s retail service area. The PUD also maintains several emergency connections to and from neighboring water agencies, including the Santa Fe Irrigation District (connected to Miramar WTP), the City of Poway (connected to Miramar WTP), Olivenhain Municipal Water District (connected to Miramar WTP), the Cal-American Water Company (connected to Alvarado and Otay WTPs), Sweetwater Authority (connected to Otay WTP), and the Otay Water District (connected to Otay WTP).
4.2 Overview of Recycled System Facilities
The City’s recycled water system consists of two (2) water reclamation plants with a combined total wastewater treatment capacity of 50,406 AFY (45.00 MGD), three (3) recycled water storage facilities with over 12 million gallons of storage capacity, and more than 98 miles of transmission and distribution lines.
Located in the Miramar area, the North City Water Reclamation Plant (NCWRP) treats an average of 17,698 AFY (15.80 MGD) of wastewater and has an ultimate treatment capability of 33,604 AFY (30.00 MGD). In fiscal year (FY) 2018, a total of 8,950 AFY (7.99 MGD) was beneficially reused (E. Molas, pers. comm.). The PUD maintains and operates the Northern Service Area distribution system which consists of approximately 94.7 miles of recycled water pipeline, two (2) storage facilities (reservoirs) and two (2) pump stations. By the end of FY 2018, 718 meters were served by the recycled water distribution system. PUD staff continues to work with potential “in-fill” customers interested in using recycled water for irrigation and/or industrial purposes that are located within close proximity of the recycled water distribution system.
Located at the end of Dairy Mart Road near the International Border with Mexico, the South Bay Water Reclamation Plant (SBWRP) treats an average of 7,583 AFY (6.77 MGD) of wastewater. The SBWRP has a treatment capability of 16,802 AFY (15.0 MGD). In FY 2018, an average of 4,447 AFY (3.97 MGD) was beneficially reused (E. Molas, pers. comm.). The PUD maintains and

City of San Diego Public Utilities Department Water Supply Assessment Report Kearny Mesa Community Plan Update Project
8
operates the Southern Service Area distribution system which consists of three (3) miles of recycled water pipeline, one (1) storage tank, one (1) pump station and service to three (3) meters. Due to the limited size of the distribution system, the majority of the recycled water is sold to the Otay Water District.

City of San Diego Public Utilities Department Water Supply Assessment Report Kearny Mesa Community Plan Update Project
9
Section 5 - Existing and Projected Supplies
The PUD relies on purchased water from a regional wholesale water provider, the Water Authority, as its major water supply source. The Water Authority is a public agency that is governed by its 24 member retail water agencies, including the City of San Diego. The Water Authority maintains a diverse portfolio of water supplies including purchases of imported water from a large wholesale water provider, the Metropolitan Water District of Southern California (MWD). The Water Authority, in turn, is a member agency of MWD and participates in its governance along with 25 other water agencies. The statutory authorities granted to the Water Authority and MWD establish the scope of the PUD’s entitlements to water. Due to the PUD’s reliance on purchased water from these agencies, this Report relies on and includes information on the existing and projected supplies, supply programs and related projects of the Water Authority and MWD. The City relies on the long-term water resources planning documents of the Water Authority and MWD to support the work on this Report. Each agency must update its Urban Water Management Plan (UWMP) every five (5) years. The 2015 UWMPs were completed and submitted to the State on July 1, 2016, and are the most current references available at the following websites and contacts:
Until the 1990s, the Water Authority was 95 percent dependent on imported water supplies from MWD to meet demands in the San Diego region. In the year of 1991, the Water Authority faced a potential 50 percent cutback in supplies from MWD that was abated by the “March Miracle” rains. Immediately following, the Water Authority embarked upon an aggressive water supply diversification strategy coupled with an innovative water storage program that has resulted in greater water supply reliability for the region. Additionally, MWD has increased its regional storage ten-fold. and has provided financial incentives toward local water supply development by its member agencies. A brief overview of MWD and the Water Authority, including the PUD relationship to these agencies, is included below. A description of local surface and local recycled water supplies available to the PUD can be found in Section 5.4 of this Report. This information was current at the time this document was prepared.
San Diego County Water Authority – Contact: Ms. Dana Friehauf, Water Resources Manager (858) 522-6749
http://www.sdcwa.org/uwmp
Metropolitan Water District of Southern California – Contact:
Ms. Grace Chan, Resource Planning & Development Manager (213) 217-6798
http://mwdh2o.com/PDF_About_Your_Water/2.4.2_Regional_Urban_Water_Management_Plan.pdf
City of San Diego Public Utilities Department Water Supply Assessment Report Kearny Mesa Community Plan Update Project
10
5.1 Metropolitan Water District of Southern California
The MWD was created in 1928 under the authority of the Metropolitan Water District ActB (the “MWD Act”). MWD has no retail customers and its primary purpose is to provide a supplemental supply of wholesale water to its member agencies.
Today, MWD’s service area comprises approximately 5,200 square miles. It includes portions of six (6) counties: Los Angeles, Orange, Riverside, San Bernardino, San Diego and Ventura. The 26 MWD member agencies consists of 14 cities, 11 municipal water districts, and the Water Authority, which is MWD’s largest customer.
A Board of Directors, currently numbering 38 members, governs MWD. Each constituent agency has at least one (1) representative on the MWD Board. Representation and voting rights are based upon the assessed valuation of property within each constituent agency. The Water Authority has four (4) members represented on the MWD Board with 17.48 percent of the weighted vote. The total population of the MWD service area is currently estimated at more than 19 million people.
MWD’s existing water supplies have been historically sufficient to meet demands within its service area during years of normal precipitation. Although MWD plans and manages reserve supplies to account for normal occurrences of dry conditions, regulatory actions, including, but not limited to, restrictions under the Federal and California Endangered Species Acts, have at times placed limitations on MWD’s ability to provide water to its member agencies. Extreme drought conditions have also caused MWD supply restrictions occasionally. MWD provides a baseline allocation system expressed in terms of a percentage right of MWD’s available water supplies, known as “Preferential Rights,” which can only be enacted when called upon by a member agency. To date, Preferential Rights has not been called upon. The Water Authority’s current Preferential Rights consists of 24.22 percent of MWD’s total water supply. In the future, population growth, regulatory restrictions and other factors such as climate change could impact MWD’s ability to supply its member agencies even in normal years. However, it is important to note that the cost of MWD’s water supplies is approaching a point at which the development of local water supplies is increasingly cost-competitive. As such, major initiatives are underway by retail water agencies to develop local water supplies and reduce reliance on MWD deliveries. This suggests that a new scenario may be emerging in which MWD may have surplus supplies on a more frequent basis as its member agencies increasingly roll off imported water supplies in favor of local water supplies. MWD Water Supply MWD’s 2015 Integrated Water Resources Plan (IRP) update acknowledged that numerous challenges facing its traditional imported supplies from the Colorado River and the State Water Project (SWP), and utilized a robust portfolio approach to long-range water planning that balance the use of local water resources and conservation with imported supplies to meet future needs. For example, MWD is currently evaluating the potential construction of a Regional Recycled Water Program in partnership with the Sanitation Districts of Los Angeles County. The Program aims to purify wastewater to produce high quality drinking water. The program will B California Statutes 1927, Chapter 429, as reenacted in 1969 as Chapter 209, as amended
City of San Diego Public Utilities Department Water Supply Assessment Report Kearny Mesa Community Plan Update Project
11
start with a demonstration facility and could eventually become one of the largest advanced water treatment plants in the worldC. MWD’s Water Surplus and Drought Management Plan (WSDM) sets forth policy guidelines that identify a sequence of management actions to minimize the probability of severe shortages and reduce the possibility of extreme shortages and water allocations. MWD annually evaluates available water supplies and existing water storage levels and adopts management actions in accordance with the WSDM Plan. In times of prolonged or severe shortages, MWD manages its water supplies through implementation of its Water Supply Allocation Plan (WSAP) which provides a formula for equitable distribution of available water supplies within its service area. The WSAP has been implemented three times since its adoption in 2008. Based upon current hydrologic conditions and current SWP allocation estimates, MWD does not anticipate implementing the WSAP for FY 2019. Colorado River Water The Secretary of the Interior (Secretary) is vested with the responsibility of managing the mainstream waters of the lower Colorado River pursuant to federal law. The Bureau of Reclamation is the agency that is designated to act on the Secretary’s behalf with respect to these matters. Each year, the Secretary is required to declare the Colorado River water supply availability conditions for the Lower Colorado River Basin States as Normal, Surplus, or Shortage. The Colorado River was MWD’s original source of water after its establishment in 1928. MWD owns and operates the 242-mile Colorado River Aqueduct (CRA), which transports water from Lake Havasu in Arizona to its terminus at Diamond Valley Lake in Riverside County. The Lower Basin of the Colorado River is comprised of parts of the states of Arizona, California, Nevada, New Mexico, and Utah within and from which waters naturally drain into the Colorado River below Lees Ferry as well as all parts of these states that are not part of the Colorado River’s drainage system but which may benefit from water diverted from the Colorado River below Lees Ferry. Under numerous compacts, federal laws, court decisions and decrees, contracts, and regulatory guidelines, collectively known as the “Law of the River,” that govern the use of water from the Colorado River, California is entitled to 4.4 million AF of Colorado River water annually. Under the priority system that governs the distribution of Colorado River water made available to California, MWD holds the 4th priority right of within California’s basic annual apportionment. MWD also retains a “call” on 100,000 AF per year on water transferred to the Coachella Valley Water District and the Desert Water Agency, if needed, so long as they pay for the financial obligations associated with the water during the call period. Colorado River Operations, Shortage, and Surplus Guidelines Spurred by repeated multi-year droughts, decrease in the amount of the stored water, and increasing demand for Colorado River water, the Department of Interior developed focused guidelines (Guidelines) to better manage and operate key reservoirs in order to sustain the annual deliveries to the lower Colorado River Basin States.
C For more information, please see: www.mwdh2o.com/DocSvcsPubs/rrwp/index.html#home.

City of San Diego Public Utilities Department Water Supply Assessment Report Kearny Mesa Community Plan Update Project
12
In December 2007, the Secretary issued the final Guidelines through a Record of Decision (“Record of Decision: Colorado River Interim Guidelines for Lower Basin Shortages and the Coordinated Operations for Lake Powell and Lake Mead”). This ROD, together with the accompanying agreement among the Colorado River Basin States, protects reservoir levels by reducing deliveries during drought periods, encourages agencies to develop conservation programs, and allows the Lower Colorado River Basin States to develop and store new water supplies. However, it is worth noting that the Colorado River Basin Project Act of 1968 insulates California from shortages in all but the most extreme hydrologic conditions. Consistent with these legal protections under the guidelines, California would not have to share in any of the potential reductions, as Arizona and Nevada are first subject to the initial annual shortages identified by the Secretary, up to 500,000 AF. Development of Lower Basin Drought Contingency Plan Due to ongoing drought conditions in the Colorado River Basin, flows into Lake Powell fell to approximately one-third of average for the April-July period in 2018. Federal officials have indicated that the Department of Interior could declare a shortage in 2020. The Interim Surplus Guidelines governing current drought operations expire in 2026 and negotiations for the replacement guidelines are scheduled to begin in 2020. Under existing legislation and guidelines, California does not face cutbacks due to its high priority rights in the Lower Basin. However, discussions amongst the Colorado River Basin States, including California, on a Drought Contingency Plan (DCP) began in the year of 2015 to help build elevation in Lake Mead and reduce the chance of a future shortage declaration through additional cutbacks.D Lower Basin parties have formed working groups to resolve remaining issues and finalize numerous intrastate and interstate agreements and Lower Basin DCP. In October 2018, a proposed Lower Basin DCP (LBDCP) was announced in which California would reduce diversions earlier in a shortage than it would if the Lower Basin states strictly adhered to the water rights reduction order under the applicable law, guidelines, and agreements. Key LBDCP components include: DCP contribution amounts, rules for DCP Intentionally Created Surplus (DCP ICS), ICS recovery and ICS flexibility, allowance for interstate banking during shortage years, and a commitment to protect elevation at 1,020 feet in Lake Mead. This 1,020 feet “backstop” would be an agreed upon threshold in the LBDCP in which the Lower Basin parties would commit to individual and collective actions to prevent Lake Mead from declining below this level. To incentivize additional conservation and storage in Lake Mead, the LBDCP would include greater flexibility for DCP ICS by increasing the maximum annual ICS creation volume for each Lower Basin state by 200,000 AF, with sharing of the unused capacity amongst states extended from the elevation of 1,075 feet down to an elevation of 1,045 feet. Implementation would be established by the USBR’s 24-month study projections. In any two successive years where Lake Mead’s elevation is projected to be at or below 1,030 feet, the Lower Basin parties would agree to consult and determine which additional measures should be taken to prevent Lake Mead from declining beyond the “backstop” of 1,020 feet.
D For more information, please see: https://www.usbr.gov/dcp/

City of San Diego Public Utilities Department Water Supply Assessment Report Kearny Mesa Community Plan Update Project
13
Environmental Considerations Several fish species and other wildlife species either directly or indirectly have the potential to affect Colorado River operations, thus changing power operations and the amount of water deliveries to the CRA. A number of species that are on either “endangered” or “threatened” lists under the Federal Endangered Species Act or the California Endangered Species Act are present in the area of the Lower Colorado River. To address this issue, a broad-based jurisdictional and non-jurisdictional partnership of water, hydroelectric, land use, and wildlife management agencies in Arizona, California and Nevada, developed the Lower Colorado River Multi-Species Conservation Program (MSCP) for the main stem of the Lower Colorado River. The MSCP allows MWD to obtain federal and state permits for any incidental take of protected species resulting from current and future water and power operations of its Colorado River facilities and to minimize any uncertainty from additional listings of endangered species. The MSCP also covers operations of federal dams and power plants on the Colorado River. Seismic Considerations Portions of the CRA are located near earthquake faults, including the San Andreas Fault. The five pumping plants on the CRA have been buttressed to better withstand seismic events. Other components of the CRA are monitored for any necessary rehabilitation and repair. Supplies are dispersed throughout MWD’s service area, and a six-month reserve supply of water normally held in local storage provides reasonable assurance of continuing water supplies during and following seismic events. MWD has developed an emergency plan that calls for specific levels of response appropriate to an earthquake’s magnitude and location. However, no assurance can be made that a significant seismic event would not cause damage to project structures, which could thereby interrupt the supply of water from the CRA. State Water Project MWD’s other major source of water is the State Water Project (SWP). The SWP is owned by the State of California and operated by the State Department of Water Resources (DWR). The SWP’s source waters originate in Northern California with water captured from the Feather River Watershed behind Oroville Dam. The Oroville Dam releases water into the Feather River which is tributary to the Sacramento River, where it combines with other drainages from the western Sierras in the Sacramento-San Joaquin River Delta east of the San Francisco Bay Estuary. MWD receives water pumped from the Harvey O. Banks Pumping Plant in the southern portion of the Sacramento-San Joaquin River Delta via the 444 mile long California Aqueduct to four (4) delivery points near the northern and eastern boundaries of MWD. MWD is one of 29 agencies (Contractors) that have long-term contracts for water service from DWR, and it is the largest agency in terms of the population served, the share of SWP water to which it is entitled, and the total amount of annual payments made to DWR. MWD’s contract with DWR provides for the ultimate delivery of up to 1,911,400 AFY (46 percent of the total SWP entitlement). The SWP was originally intended to meet demands of 4.2 million AFY. Initial SWP facilities were completed in the early 1970s, and it was envisioned that additional facilities would be constructed as contractor demands increased. Several factors, including public opposition, increased costs, and increased non-SWP demands for limited water supplies, combined to delay the construction of additional facilities. Water supplies received from the SWP by MWD includes contracted water, water from transfers, groundwater banking on the system, and exchange programs. The supply can vary significantly from year to year. For example, from 2004 to 2017, DWR’s allocation to MWD varied from a low of approximately 593,000 AF in calendar year 2015 to a high of approximately 1,800,000 AF in calendar year 2004. In calendar year 2017, DWR’s allocation to MWD was 1,625,000 AF.

City of San Diego Public Utilities Department Water Supply Assessment Report Kearny Mesa Community Plan Update Project
14
The quantity of SWP water available for delivery each year is controlled by hydrology, environmental and operational considerations. In addition to its importance to urban and agricultural water users, the San Francisco Bay/Sacramento-San Joaquin Delta Estuary (Bay-Delta) is of critical ecological importance. The Bay-Delta is the largest estuary on the west coast of the United States and provides habitat for more than 750 plant and animal species. Over 150 years of human activity have contributed to the destruction of habitat, the decline of several estuarine and anadromous fish species, and the deterioration of water quality. These activities include: increasing water demands from urban and agricultural uses, the dredging and filling of
tidal marshes, the construction of levees, urban runoff, agricultural drainage, runoff from abandoned mines, and the introduction of non-native species, thus affecting the supply and reliability of this source. Late each year, DWR announces an initial allocation estimate for the upcoming year, but may revise the estimate throughout the year if warranted by developing precipitation and water supply conditions. For example, in calendar year 2018, DWR’s initial allocation estimate to SWP Contractors was announced on November 30, 2017, as 15 percent of contracted amounts, or 286,725 AF, for MWD. On January 29, 2018, DWR increased the allocation estimate to 20 percent. The allocation was increased again on April 24, 2018, to 30 percent and then again on May 21, 2018, to 35 percent. The current estimated allocation of 35 percent reflects recent precipitation, runoff, and existing storage in SWP conservation reservoirs as well as other factors such as lower storage levels in Lake Oroville and federally mandated environmental restrictions imposed upon water deliveries from the Bay-Delta, including the biological opinions as discussed previously. As in previous dry years, MWD may augment these deliveries using withdrawals from its storage programs along the SWP and through water transfer and exchange programs. In light of current water conditions in California and the estimated 2018 allocation, MWD expects that projected demands will roughly balance with available supplies. Additional MWD Water Supplies and Storage MWD has a number of water transfer, storage, and exchange programs with state, federal, public and private water districts and individuals in order to augment its imported water supplies. MWD has entered into groundwater basin storage agreements with the Arvin Edison Water Storage District and the Semitropic Water Storage District, groundwater banking and exchange transfer agreements with the Kern Delta Water District, the Mojave Water Agency, and the Antelope Valley-East Kern Water Agency, and water exchange agreements with San Gabriel Valley Municipal Water District, Coachella Valley Water District, and the Desert Water Agency. MWD
California Water Fix The California Department of Water Resources (DWR) is in the process of introducing a plan known as the California Water Fix. Which would construct 35 miles of twin tunnels capable of transferring 9,000 cubic feet per second of freshwater from three intake facilities north of the Delta to the expanded Clifton Court Forebay located south of the Delta. Two (2) pumping plants would be constructed to maintain optimal water levels in the forebay for the existing State Water Project (SWP) and Central Valley Project (CVP) pumping facilities to better facilitate water exports during times of large rain events. The proposed project is expected to provide water supply reliability for water importers, although the benefits will still be weather dependent.

City of San Diego Public Utilities Department Water Supply Assessment Report Kearny Mesa Community Plan Update Project
15
also has additional agreements with other SWP Contractors and water agencies to augment its supply. In addition to making its imported water supplies available for annual consumptive uses, MWD also purchases and stores excess imported water in wet years for use in dry years. MWD reports that its storage capacity is approximately 6.04 million AF, which includes reservoirs, conjunctive use and other groundwater storage programs within its service area, and groundwater and surface storage programs along the SWP and CRA. MWD forecasts that, with anticipated supply reductions from the SWP due to pumping restrictions, it will need to draw down on storage in about seven (7) of ten (10) years and will be able to replenish storage in about three (3) years out of ten (10). This reduction in available supplies extends the time required for storage to recover from drawdowns and could require MWD to implement its WSAP during extended dry periods. For example, following several years of withdrawals from storage, MWD returned water to storage reserves in years 2016 and 2017. As of January 1, 2018, MWD had 3.0 million AF in reserves. The actual withdrawal from storage will vary depending on supply conditions and member agencies response to MWD’s call to reduce demand. Drought Response and Long-Term Water Use Efficiency Governor Brown declared a drought state of emergency in California on January 17, 2014, and, in addition, on April 1, 2015, he issued an Executive Order (Order) calling for a 25 percent reduction in consumer water use in response to the historically dry conditions throughout the State. The Order was implemented through an emergency regulation adopted by the SWRCB. The emergency regulation included specific conservation standards that took effect June 1, 2015, and required urban water suppliers to reduce usage through February 2016, as compared to the amount used in 2013. On May 18, 2016, the SWRCB adopted modifications to the emergency regulation which replaced the state-mandated conservation targets with a supply-based approach that mandates that urban water suppliers take actions to ensure at least a three (3) year supply of water to their customers under drought conditions. On April 7, 2017, Governor Brown lifted the drought state of emergency in most of California while maintaining water reporting requirements and prohibitions on wasteful practices. Pursuant to Order B37-16, new water management planning legislation (SB 606 and AB 1668) was developed and chaptered into law in the year of 2018 that established guidelines for efficient water use and a framework for the implementation and oversight of new standards expected to be in place by year 2022. The two bills strengthen the state’s water resiliency in the face of future droughts with provisions that include: establishing an indoor per capita water use goal of 55 gallons per day until 2025, 52.5 gallons from 2025 to 2030 and 50 gallons per person per day beginning in 2030, creating incentives for water suppliers to recycle water, requiring both urban and agricultural water suppliers to set annual water budgets and prepare for drought, and setting water use objectives for urban and commercial water suppliers. The new legislation also establishes urban water use objectives and water use reporting requirements, including a requirement that an urban water supplier must calculate an aggregate urban water use objective for the previous calendar year beginning in November of 2023. Urban water suppliers will also be required to establish urban water use objectives and reporting standards for indoor and outdoor residential and commercial use. Urban water suppliers will be required to submit an annual report to DWR including the urban water use objective and actual water use and the State legislature will hold oversight hearings with the SWRCB and DWR in 2026 to assess compliance.

City of San Diego Public Utilities Department Water Supply Assessment Report Kearny Mesa Community Plan Update Project
16
5.2 San Diego County Water Authority
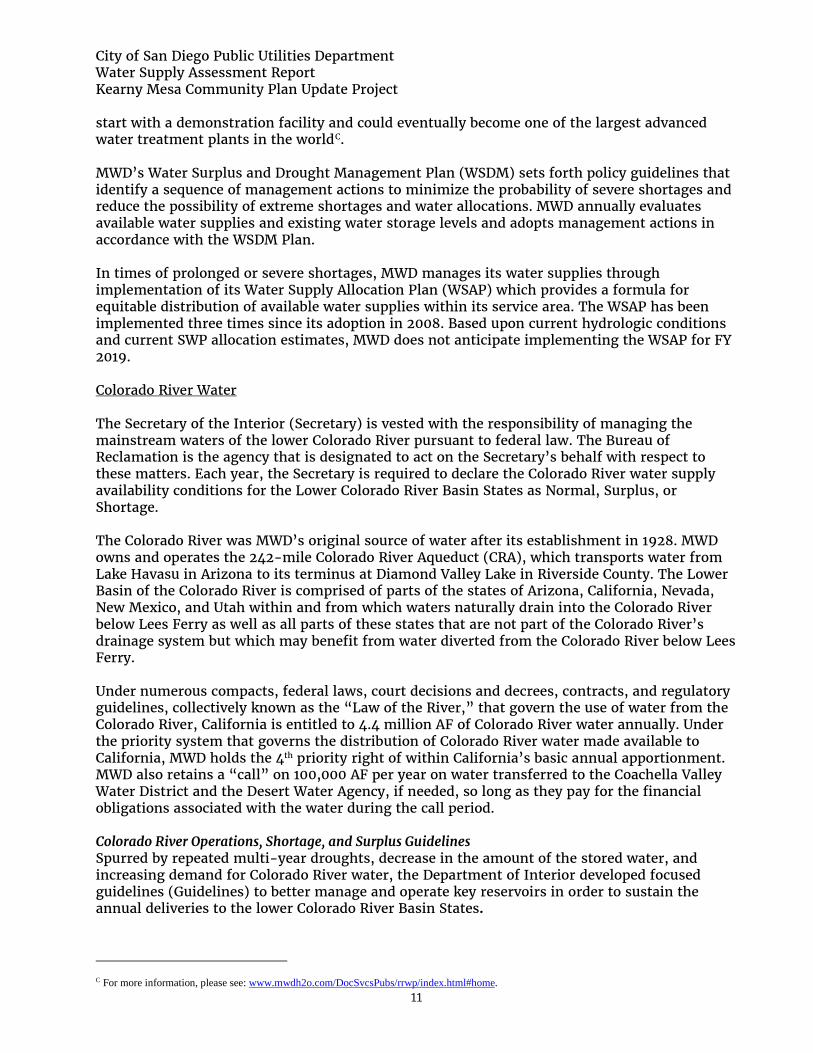
The Water Authority’s mission is to provide its member agencies with a safe and reliable water supply. Historically, the principal source of supply for the Water Authority’s service area has been water purchased from MWD for sale to the Water Authority’s member agencies. However, drought conditions and population growth in the Water Authority’s service area have highlighted the need for diversification of the region’s water supplies. The Water Authority service area lies within the foothill and coastal areas of the westerly third of San Diego County, encompassing 952,208 acres (1,488 square miles). When the Water Authority was established in 1944, its service area consisted of 94,707 acres. Of the total population of San Diego County, approximately 97 percent live within the Water Authority’s service area. Growth has primarily resulted from the addition and annexation of service areas by member agencies. The City, with a population of approximately 1.38 million served, and a service area of 210,726 acres, is by far the Water Authority’s largest member agency and customer. Local surface water and groundwater supplies met eight (8) percent of regional demand in FY 2017. Fourteen percent of regional supply was generated from the use of recycled water, brackish groundwater, and desalinated water. The remaining 78 percent of water supply is from sources outside of the region. Since 1990, the Water Authority has provided, on average, 85 percent of the water supply within its service area. As a wholesaling entity, the Water Authority provides water delivery, storage, and treatment services to its 24 member agencies. Consistent with its mission statement, the Water Authority has actively pursued a strategy of supply diversification that includes the acquisition and importation of additional water supplies, the development of additional local water supply projects, and augmentation of its water supply via local and regional water storage capacity (Figure 5-1).
City of San Diego Public Utilities Department Water Supply Assessment Report Kearny Mesa Community Plan Update Project
17
FIGURE 5-1 WATER AUTHORITY’S HISTORIC AND PROJECTED WATER SALES
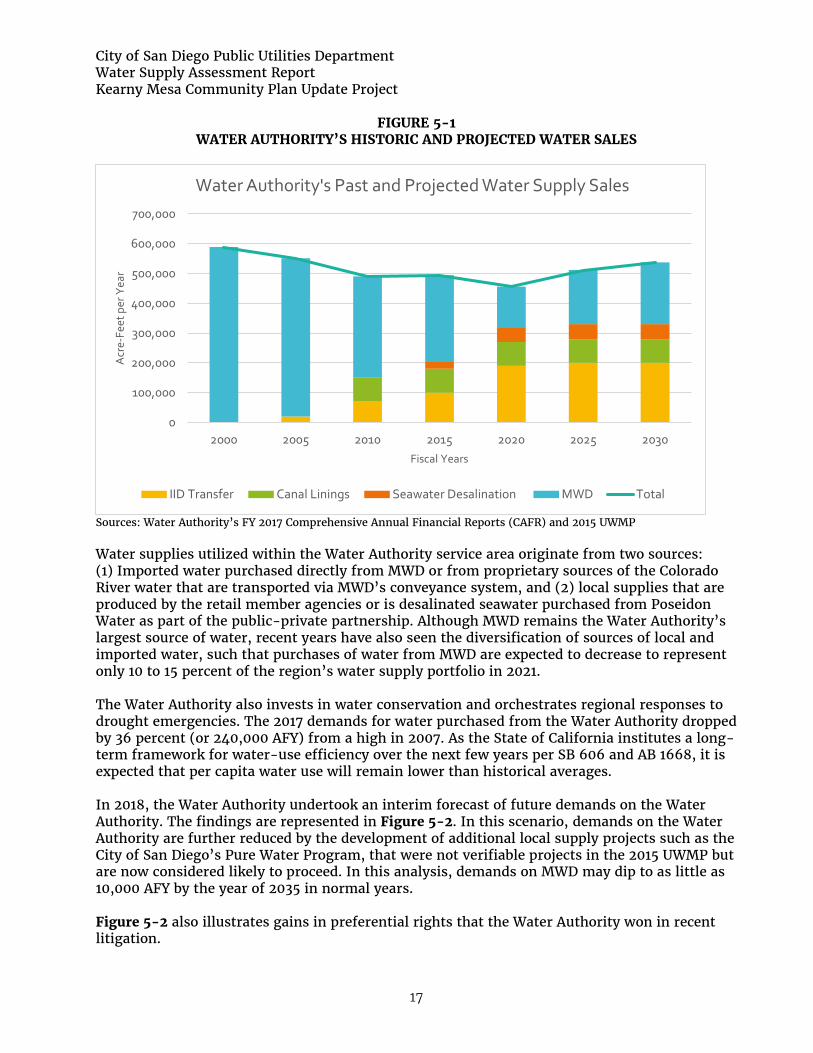
Sources: Water Authority’s FY 2017 Comprehensive Annual Financial Reports (CAFR) and 2015 UWMP Water supplies utilized within the Water Authority service area originate from two sources: (1) Imported water purchased directly from MWD or from proprietary sources of the Colorado River water that are transported via MWD’s conveyance system, and (2) local supplies that are produced by the retail member agencies or is desalinated seawater purchased from Poseidon Water as part of the public-private partnership. Although MWD remains the Water Authority’s largest source of water, recent years have also seen the diversification of sources of local and imported water, such that purchases of water from MWD are expected to decrease to represent only 10 to 15 percent of the region’s water supply portfolio in 2021. The Water Authority also invests in water conservation and orchestrates regional responses to drought emergencies. The 2017 demands for water purchased from the Water Authority dropped by 36 percent (or 240,000 AFY) from a high in 2007. As the State of California institutes a long-term framework for water-use efficiency over the next few years per SB 606 and AB 1668, it is expected that per capita water use will remain lower than historical averages. In 2018, the Water Authority undertook an interim forecast of future demands on the Water Authority. The findings are represented in Figure 5-2. In this scenario, demands on the Water Authority are further reduced by the development of additional local supply projects such as the City of San Diego’s Pure Water Program, that were not verifiable projects in the 2015 UWMP but are now considered likely to proceed. In this analysis, demands on MWD may dip to as little as 10,000 AFY by the year of 2035 in normal years. Figure 5-2 also illustrates gains in preferential rights that the Water Authority won in recent litigation.
0
100,000
200,000
300,000
400,000
500,000
600,000
700,000
2000 2005 2010 2015 2020 2025 2030
Acr
e-Fe
et p
er Y
ear
Fiscal Years
Water Authority's Past and Projected Water Supply Sales
IID Transfer Canal Linings Seawater Desalination MWD Total
City of San Diego Public Utilities Department Water Supply Assessment Report Kearny Mesa Community Plan Update Project
18
FIGURE 5-2 WATER AUTHORITY’S HISTORIC AND PROJECTED WATER SALES
The Quantification Settlement Agreement The Quantification Settlement Agreement (QSA) for the Colorado River was completed in October 2003. This historic agreement was enacted to help settle disputes regarding the persistent over-drafting of the state's 4.4 million AF basic annual apportionment of Colorado River water. The agreement includes a long-term transfer of conserved water from the Imperial Irrigation District (IID) to the Water Authority. The QSA also commits the state to a restoration path for the environmentally sensitive Salton Sea and provides full mitigation for these water supply programs. Specific programs under the QSA that directly benefit the Water Authority include the Water Authority-IID water transfer agreement which currently transfers 100,000 AF of high priority Colorado River water to the Water Authority and will provide up to 200,000 AF of water per year through water conservation measures in Imperial Valley in 2021. The QSA also allows for the transfer of water from the IID for water conserved through the implementation of the Water Authority performed projects to install concrete linings on portions of the previously earthen All American and Coachella Canals. The canal lining projects reduced the losses of water that historically occurred through seepage. MWD assigned to the Water Authority its right to develop approximately 77,700 AF of conserved Colorado River water annually. The QSA ensures that the San Diego region receives a minimum of 75 years of stable Colorado River water supplies. On November 5, 2003, the IID filed a validation action in Imperial County Superior Court seeking a judicial determination that 13 agreements associated with the Water Authority-IID water transfer and the QSA are valid, legal and binding. Other lawsuits also were filed contemporaneously challenging the execution, approval and implementation of the QSA on

City of San Diego Public Utilities Department Water Supply Assessment Report Kearny Mesa Community Plan Update Project
19
various grounds. All QSA cases were coordinated in the Sacramento Superior Court. A final judgment, invalidating 11 of the 13 agreements in Phase 1 of the trial, was entered on February 11, 2010, and subsequently appealed. On December 7, 2011, the Court of Appeal issued its opinion reversing the judgment and remanding the cases to the trial court for further proceedings. The appellate Court decision resolved many issues in the case, including the validity and constitutionality of the QSA. A trial on compliance with the California Environmental Quality Act was held in November of 2012. On June 4, 2013, the court validated the 2003 QSA and related 12 agreements regarding transfers and exchanges of Colorado River water between southern California water agencies. The IID, Coachella Valley Water District, MWD, and Water Authority all sought validation of the agreements from the court under California Water Code, Section 22762, and California Code of Civil Procedure, Section 860 et seq., quantifying the amount of Colorado River water each agency may divert and subsequently transfer. The court found the agreements to be valid and adopted in compliance with the requirements of the Brown Act and the California Environmental Quality Act (CEQA). Conserved Water from Canal Lining Projects In 2003, as part of the execution of the QSA on the Colorado River, the Water Authority contracted for 77,700 AFY of conserved water from projects to line the All American and Coachella Canals. Deliveries of this conserved water from the Coachella Canal reached the region in the year of 2007 and deliveries from the All American Canal reached the region in 2010. Seawater Desalination In late November 2012 the Water Authority’s Board of Directors approved a 30-year Water Purchase Agreement with Poseidon Water, a private investor-owned company, to purchase water from the proposed Carlsbad Desalination Plant which is a fully-permitted ocean desalination plant and conveyance pipeline. The plant began producing 50 MGD in December 2015 and is now operating at full-scale. The Water Authority has contracted to purchase between a minimum of 42,000 AFY and a maximum of 50,000 AFY while two of Water Authority’s member agencies (Carlsbad and Vallecitos MWD) have contracted to purchase 6,000 AFY, for a total available production of 56,000 AFY. In addition to developing its own regional supplies of water, the Water Authority has also encouraged the development of additional local water supply projects, such as water recycling and groundwater projects, through the award of Local Water Supply Development (LWSD) incentives of up to $200 per AF for recycled water and groundwater produced and beneficially reused within its service area. The purpose of the LWSD program is to promote the development of cost-effective water recycling and groundwater projects that reduce demand for imported water and improve regional water supply reliability. The LWSD program reimburses member agencies for all, or a portion, of the difference between the actual per acre-foot cost of producing recycled water and the revenue generated by the LWSD participant through the sale of that acre-foot of recycled water (not to exceed $200 per AF). Emergency and Carryover Storage Programs In addition to the region’s investments in new supplies, the Water Authority has also undertaken a multi-phased Emergency Storage Program (ESP) aimed at increasing the amount of water available in storage to help attenuate dry year availability of water. In 2003, the Water Authority completed construction of a dam, creating the Olivenhain Reservoir that created 24,000 AF of emergency storage capacity. In 2015, the Water Authority raised the City-owned and operated San Vicente Dam to increase emergency and carryover storage in the region by 176,000 AF. The additional storage capacity will allow the Water Authority and its member agencies to be prepared for emergency conditions and buffer against dry year reductions in

City of San Diego Public Utilities Department Water Supply Assessment Report Kearny Mesa Community Plan Update Project
20
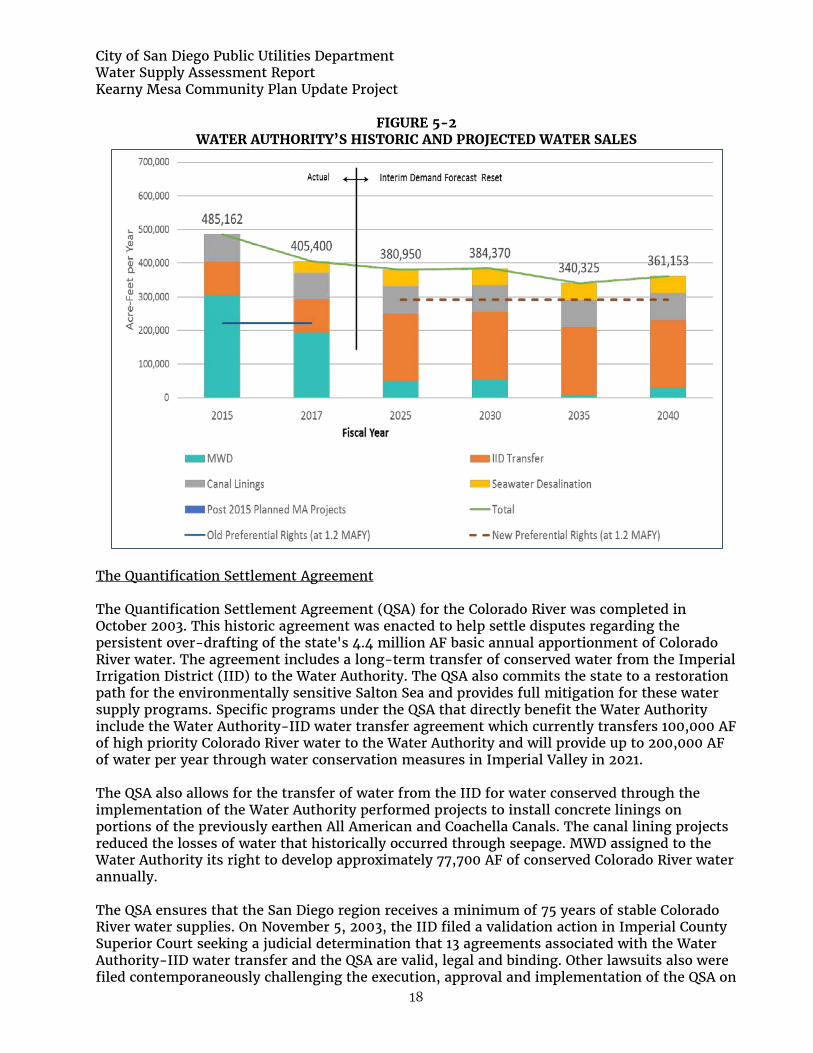
deliveries from imported supplies. Additionally, the Water Authority has rights to an additional 70,000 AF of groundwater storage in the Central Valley. These accounts with the Semitropic-Rosalind Water Bank Authority and the Semitropic Original Water Bank allow for annual withdrawals of 14,000 AF. As a result of the efforts undertaken by the Water Authority and its member agencies to diversify supplies and augment local storage (Figure 5.3), the region was able to certify supply sufficiency and achieve a zero percent conservation standard in response to the State Water Resources Control Board’s May 18, 2016, adopted rule requiring stress test analysisE. 5.3 2009 Comprehensive Water Package
On November 4, 2009, the California State Legislature passed a comprehensive package of water legislation (“2009 State Water Legislation”) that was subsequently signed by Governor Schwarzenegger, addressing California’s statewide water situation, with particular emphasis on the San Francisco Bay/Sacramento-San Joaquin-Delta (Bay-Delta). The 2009 State Water Legislation included an urban water conservation mandate of 20 percent for most localities in the State by 2020 (“20x2020 requirement”) and new regulations establishing strategic monitoring of groundwater levels around the state. The 2009 State Water Legislation also created two (2) new governmental agencies – the Delta Stewardship Council and the Sacramento-San Joaquin Delta Conservancy. The Delta Stewardship Council is charged with developing and implementing a Delta Plan which would include the Bay Delta Conservation Plan upon meeting certain conditions. The Sacramento-San Joaquin Delta Conservancy will implement ecosystem restoration activities in the Bay-Delta. In addition, the 2009 State Water Legislation included legislation addressing unauthorized Bay-Delta water diversions. Additionally, the 2009 Legislation package included an $11.1 billion State general obligation bond measure. The water bond measure was originally certified to be on the State’s 2010 ballot, but was subsequently pulled due to unfavorable public polling. That same bond measure was subsequently delayed twice. During the previous 2013-2014 legislative session, several bills were introduced with the intent of reducing and reconfiguring the dedicated expenditures in the original water bond measure. In late 2014, the legislature introduced the “Water Quality, Supply, and Infrastructure Improvement Act of 2014,” which proposed a trimmed down version of the 2009 bond measure for a total of $7.5 billion. It was subsequently placed on the November 4, 2014 statewide ballot as Proposition 1 and approved by voters. Proposition 1 is a general obligation bond measure to fund a variety of state water supply infrastructure projects, such as public water system improvements, surface and groundwater storage, drinking water protection, water recycling and advanced water treatment technology, water supply management and conveyance, wastewater treatment, drought relief, emergency water supplies, and ecosystem and watershed protection and restoration. The bond funds are distributed through a competitive grant process overseen by various state agencies, including the DWR, the SWRCB, and the California Water Commission. The State has adopted guidelines for a number of funding programs contained in Proposition 1, including the Water Recycling Funding Program (WRFP) and the Water Storage Investment Program (WSIP).
G http://www.sdcwa.org/regional-supply-sufficiency
City of San Diego Public Utilities Department Water Supply Assessment Report Kearny Mesa Community Plan Update Project
21
FIGURE 5-3 SAN DIEGO COUNTY WATER AUTHORITY’S WATER SUPPLY DIVERSIFICATION STRATEGY

City of San Diego Public Utilities Department Water Supply Assessment Report Kearny Mesa Community Plan Update Project
22
5.4 Public Utilities Department
The PUD currently purchases approximately 90 percent of its water from the Water Authority which supplies the water (raw and treated) through two (2) aqueducts consisting of five (5) pipelines. While the PUD imports the majority of its water, it also uses four (4) local supply sources to meet or offset potable demands: local surface water, groundwater, conservation, and recycled water (Figure 5-2). The adequacy of water supplies to serve existing and planned uses within the PUD’s service area is demonstrated in prior discussion on the water supply reliability of MWD and the Water Authority. The City has been receiving water from the Water Authority since 1947 and has purchased between 155,300 and 228,300 AFY during the past 20 years. In FY 2018, water purchases totaled approximately 155,000 AF. Depending on demands, growth and the success of local water supply initiatives, the volume purchases may remain constant, or increase to a projected maximum of 295,998 AFY in 2035 during normal years. For the purpose of this analysis the maximum is used. 5.4.1 Demonstrating the Availability of Sufficient Supplies Imported Supplies Section 5, Subdivision 11, of the County Water Authority Act, states that the Water Authority “as far as practicable, shall provide each of its member agencies with adequate supplies of water to meet their expanding and increasing needs.” Depending on local weather and supply conditions, the Water Authority provides between 75 to 95 percent of the total supplies used by its 24 member agencies. Local Surface Water Supplies The PUD maintains and operates nine (9) local surface raw water storage reservoirs which are connected directly or indirectly to water treatment operations. In the San Diego region, approximately 13 percent of local precipitation produces surface run-off to streams that supply PUD reservoirs. Approximately half of this runoff is used for the municipal water supply, while the remainder evaporates during reservoir storage. In very wet years, the runoff remainder may spill over the reservoir dams and return to the Pacific Ocean. Average rainfall produces less than half of the average runoff in San Diego. The local climate requires about average rainfall to saturate the soils sufficiently for significant surface runoff to occur. Therefore, most of the runoff to reservoirs is produced in years with much greater than average rainfall. Some flooding may occur even during average or below average rainfall years if the annual rainfall is concentrated in a few intense storms. The use of local water is affected by availability and water resource management policies. The PUD’s policy is to use local water first to reduce imported water purchases and costs. The PUD also operates emergency and seasonal storage programs in conjunction with its policy. The purpose of emergency storage is to increase the reliability of the water supply system. This is accomplished by maintaining an accessible amount of stored water that could provide an uninterrupted supply of water to the City’s water treatment facilities should an interruption to the supply of imported water occur. The management of reservoirs is guided by Council Policy 400-04 which outlines the City’s Emergency Water Storage Program. The policy mandates that the PUD store sufficient water in active, available storage to meet six-tenths (6/10) of the normal annual City water demand requirements (excluding conservation), which

City of San Diego Public Utilities Department Water Supply Assessment Report Kearny Mesa Community Plan Update Project
23
equates to approximately 7.2 months of supply. Active, available storage is defined as the portion of stored water that is above the lowest usable outlet of each reservoir. The volume specific to the emergency storage requirement is adjusted monthly based on the upcoming seven (7) months anticipated water demand. This results in a seasonally fluctuating emergency storage requirement, generally peaking in April and reaching its minimum in October. This seasonally fluctuating requirement makes a portion of the required emergency storage capacity available for impounding or seasonal storage. The purpose of seasonal storage is to increase imported water supply. This is done by storing surplus imported water in the wet winter season for use during the dry summer season. This may also be accomplished by increased use of imported water in lieu of local water in the winter when local water may be saved in reservoirs or groundwater basins for summer use. In addition to increased water yield, this type of seasonal operation also reduces summer peaking on the imported water delivery system. Conservation In keeping with its historically innovative practices, the PUD provides various indoor and outdoor water conservation rebate programs and services throughout the year. The programs and services are developed and administered by the Water Conservation Program. Water conservation funding is obtained from various sources including the Integrated Regional Water Management (IRWM) programs, PUD, the City’s Transportation and Storm Water Department and MWD. The PUD’s Water Conservation Program was established by the City Council in 1985 and is instrumental in promoting permanent water savings within the City. Over the past 20 years, the Water Conservation Program has accounted for approximately 27,000 AFY in water savings. These savings have been achieved by creating a water conservation ethic throughout the City. Water conservation efforts include adopting programs designed to promote efficient water use practices, implement water wise policies and ordinances, and comprehensive public information and education campaigns. The City offers a broad range of conservation strategies to help meet the needs of our residential and commercial water customers. The City offers both rebate incentives as well as free services. These include, but are not limited to, the following:
Rebates
• Replacing grass with water wise landscapes • Micro-irrigation systems and weather based irrigation controllers • Residential rain gutter rebates • Rain barrel and downspout redirects • Graywater systems • Pressure regulating valves (PRV)
Services
• Commercial Landscape Survey Program (CLSP) • Residential interior/exterior water use surveys • Public education and outreach • Water Wise Business Survey

City of San Diego Public Utilities Department Water Supply Assessment Report Kearny Mesa Community Plan Update Project
24
As discussed in Section 5.1, on April 7, 2017, Governor Brown declared an end to the drought conditions in California with Executive Order B-40-17. However, the City continues to maintain an active water conservation program that has consistently resulted in water savings. Table 5-1 shows the continued decrease in total usage (indoor and outdoor) as measured in gallons per capita day (GPCD). This trend is largely attributed to the conservation efforts by the City and its customers.
Table 5-1 GPCD Reductions
Fiscal Year City of San Diego Service Area Population Water Production (AF) Citywide GPCD
2014 1,292,496 198,174 137 2015 1,314,290 180,177 122 2016 1,339,958 158,493 106 2017 1,354,134 165,866 109
4-year GPCD Average 119 Efforts to promote water conservation is an ongoing process. The Water Conservation Program undergo periodic evaluation for effectiveness, feasibility, and innovation. The PUD continues to work with proven water conservation strategies while researching new concepts, collaborative opportunities, and effective outreach to maximize water savings. Recycled Water Supplies In FY 2018, the beneficial reuse of the recycled water was 13,805 AF (8,614.4 AF from the North County Water Reclamation Plant and 4,190.6 AF from the South Bay Water Reclamation Plant). Landscape irrigation continues to be the leading use of the recycled water. However, the customer base has become more varied over the years with an increase in the number of industrial and dual plumbed meter connections. During the same period, financial incentives from the Water Authority’s LWSD and MWD’s Local Resources Programs resulted in $2.58 million in savings based on the City’s recycled water sales. By the end of FY 2018, the City provided recycled water service to 721 retail meters and five (5) wholesale meter connections, including the City of Poway, Olivenhain Municipal Water District, and Otay Water District. The top 10 FY 2018 retail customers included: City’s Park and Recreation Department, City’s Environmental Services Department, University of California San Diego, Santaluz Golf Course, Miramar Marine Corps Air Station, El Camino Memorial Park, California Department of Transportation, Village Nurseries Wholesale, Qualcomm Inc., and San Diego Community College District. Partnering with the City’s Park and Recreation Department, PUD has actively pursued opportunities to retrofit City parkland, street landscaping and open space to promote the use of recycled instead of potable water for irrigation. As of end of FY 2018, the number of such connections was 111 meter connections. Groundwater Supplies The PUD is actively planning and developing several groundwater basins for municipal water supply and other beneficial uses. Currently, the annual groundwater available for beneficial use is 500 AF from existing production wells in the San Diego River Valley Groundwater Basin. In the Coastal Plain of San Diego Groundwater Basin (previously known as the San Diego
City of San Diego Public Utilities Department Water Supply Assessment Report Kearny Mesa Community Plan Update Project
25
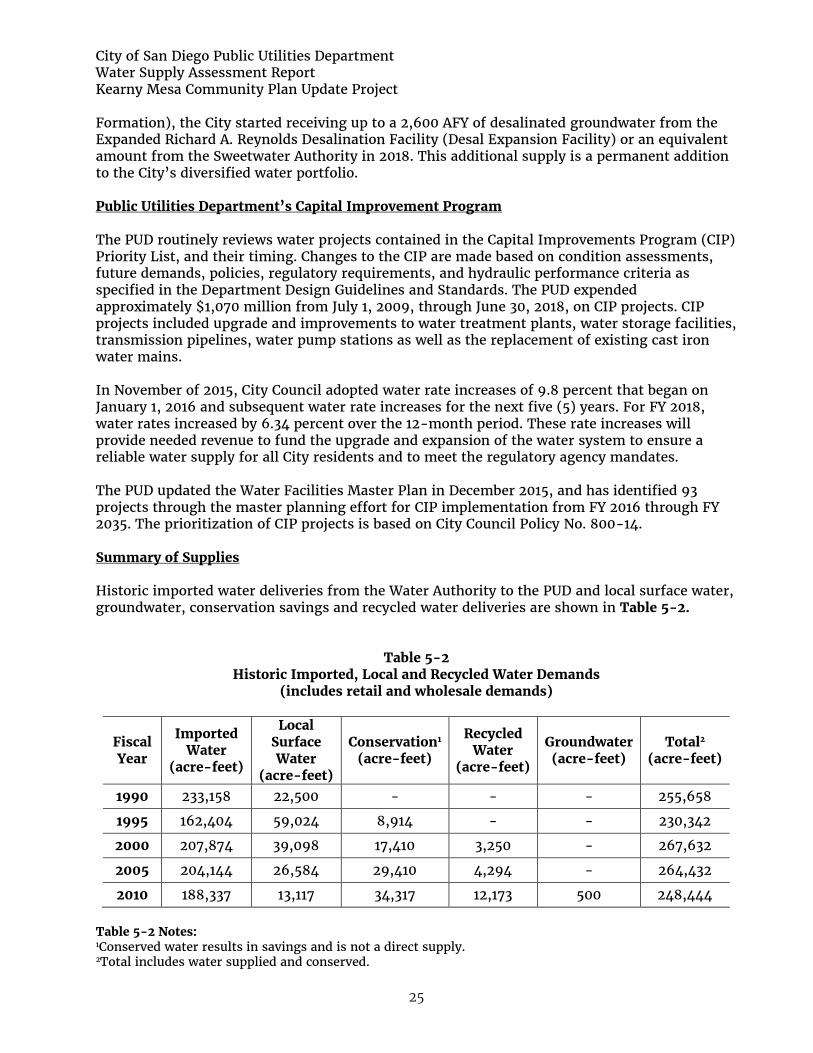
Formation), the City started receiving up to a 2,600 AFY of desalinated groundwater from the Expanded Richard A. Reynolds Desalination Facility (Desal Expansion Facility) or an equivalent amount from the Sweetwater Authority in 2018. This additional supply is a permanent addition to the City’s diversified water portfolio. Public Utilities Department’s Capital Improvement Program The PUD routinely reviews water projects contained in the Capital Improvements Program (CIP) Priority List, and their timing. Changes to the CIP are made based on condition assessments, future demands, policies, regulatory requirements, and hydraulic performance criteria as specified in the Department Design Guidelines and Standards. The PUD expended approximately $1,070 million from July 1, 2009, through June 30, 2018, on CIP projects. CIP projects included upgrade and improvements to water treatment plants, water storage facilities, transmission pipelines, water pump stations as well as the replacement of existing cast iron water mains. In November of 2015, City Council adopted water rate increases of 9.8 percent that began on January 1, 2016 and subsequent water rate increases for the next five (5) years. For FY 2018, water rates increased by 6.34 percent over the 12-month period. These rate increases will provide needed revenue to fund the upgrade and expansion of the water system to ensure a reliable water supply for all City residents and to meet the regulatory agency mandates. The PUD updated the Water Facilities Master Plan in December 2015, and has identified 93 projects through the master planning effort for CIP implementation from FY 2016 through FY 2035. The prioritization of CIP projects is based on City Council Policy No. 800-14. Summary of Supplies Historic imported water deliveries from the Water Authority to the PUD and local surface water, groundwater, conservation savings and recycled water deliveries are shown in Table 5-2.
Table 5-2 Historic Imported, Local and Recycled Water Demands
(includes retail and wholesale demands)
Fiscal Year
Imported Water
(acre-feet)
Local Surface Water
(acre-feet)
Conservation1 (acre-feet)
Recycled Water
(acre-feet)
Groundwater (acre-feet)
Total2 (acre-feet)
1990 233,158 22,500 - - - 255,658
1995 162,404 59,024 8,914 - - 230,342
2000 207,874 39,098 17,410 3,250 - 267,632
2005 204,144 26,584 29,410 4,294 - 264,432
2010 188,337 13,117 34,317 12,173 500 248,444 Table 5-2 Notes: 1Conserved water results in savings and is not a direct supply. 2Total includes water supplied and conserved.
City of San Diego Public Utilities Department Water Supply Assessment Report Kearny Mesa Community Plan Update Project
26
5.4.2 Plans for Acquiring Additional Supplies Future Supplies On December 10, 2013, the Council approved the 2012 Long-Range Water Resources Plan (2012 LRWRP) which is a high-level strategy document that evaluates water supply and demand-side objectives against multiple planning objectives. The 2012 LRWRP was crafted based on a stakeholder-driven process that evaluated over 20 water supply options such as water conservation, recycled water, groundwater storage, brackish groundwater desalination, rainwater harvesting, graywater and potable reuse. The plan takes a long-range viewpoint through the year 2035 in addressing risk and the uncertainty of future water supply conditions. It is a plan that sets the tone or direction of where the City places its efforts in developing local water supplies. Conservation and water recycling programs have been implemented and are under investigation for ways to be expanded or increased. The PUD is also actively developing groundwater resources and potable reuse. Conservation The City is on target to meet the 20x2020 requirements. Aside from the existing programs listed in Section 5.4.1 of this report, the City is also implementing the following programs to help reduce overall water consumption: Conservation-oriented rate structures: A new rate structure, which took effect in January 2014, added a fourth new tier for single-family residential customers that recognizes water conservation efforts and increases the rates for higher tiers to discourage high volume usage. The Council voted to maintain this four (4) tier residential rate structure through FY 2019. Advanced Metering Infrastructure (AMI): The PUD has completed the installation of a citywide AMI fixed network, and the installation of all AMI meters is expected to be completed by February of 2018. Data from the AMI system/endpoint became available to customers and customer service staff in July of 2016. This information gives customers an additional tool to manage their water use and help detect leaks. Potable Reuse / Pure Water San Diego The City has taken multiple actions in recent years to investigate and expand its recycled water use. Based on the past recycled water investigations, the City has developed long-term water resources strategies that recommend the maximization of water reuse to be most cost-effectively achieved through potable reuse. Potable Reuse is an approach the City is implementing for maximizing water reuse. Recycled water that is used for non-drinking uses, like irrigation and industrial processes, would undergo advanced water purification (AWP) to render it safe for reuse as a drinking water supply. The City’s specific AWP process uses multiple treatment barriers to remove contaminants from the water and to prevent them from re-entering the water supply. It begins with ozonation, biological filtration, and membrane filtration, followed by reverse osmosis and ending with advanced oxidation. The result is purified water that meets all drinking water standards and is similar in quality to distilled water.
City of San Diego Public Utilities Department Water Supply Assessment Report Kearny Mesa Community Plan Update Project
27
There are two (2) types of potable reuse: Indirect Potable Reuse (IPR) and Direct Potable Reuse (DPR). With IPR, the purified water is sent either to a reservoir or groundwater basin, both of which act as an environmental buffer. The City’s Pure Water program plans to send the water to a reservoir and subsequently treat it at a drinking water treatment plant before distributing it for drinking purposes. DPR differs in that there is no environmental buffer, and instead, additional treatment above and beyond the AWP process would provide the buffer. City continues to monitor DPR regulations to ensure successful potable reuse implementation. The City’s Water Purification Demonstration Project (2013) showed that IRP with reservoir augmentation (IPR/RA) is feasible and would create a local and sustainable source of water for San Diego. The City Council unanimously adopted the final project report in April of 2013; the report is available at the following link: www.purewatersd.org/projectreports. The Council also directed staff to develop an implementation plan and schedule that considers potable reuse options for maximizing local water supply and reduced flows to the Point Loma Wastewater Treatment Plant (PLWTP). The Pure Water Program will deliver 83 million gallons per day (MGD) of potable water by the year of 2035; which will meet a third of the City’s water demand. Pure Water will be built in phases. In Phase 1 a new Pure Water facility will be built at North City which will produce 30 MGD of purified water to be conveyed to the Miramar Reservoir. The water will be treated at the adjacent Miramar Water Treatment Plant before being distributed. Phase 1 will be online in the year of 2021. The remaining 53 MGD of the Pure Water Program will all be produced in the central area of the City, or both the central and southern areas. Under all scenarios the water will be treated again at a drinking water plant before being distributed for consumption. The City's application for a modified National Pollution Discharge Elimination Permit (modified permit) for the PLWTP was received by the United States Environmental Protection Agency (USEPA) and the Regional Water Quality Control Board (RWQCB) in January of 2015. In October of 2016, the USEPA announced their tentative decision to approve the renewal of the modified permit. This action initiated the public hearing process that culminated in a final decision. Following several public meetings, RWQCB approved the modified permit in April of 2017, citing the benefits of Pure Water as a new source of potable water, while also reducing the discharge to the ocean. Thereafter, the California Coastal Commission approved the permit in May of 2017 and subsequently the USEPA approved it in August of 2017. The new permit became effective in October of 2017 and it is in place for the following five (5) years. Pure Water was integral to both the application to renew PLWTP’s permit and the proposed permanent solution for future permits to be considered as a secondary equivalent. Groundwater There are several groundwater basins in the San Diego region over which the City has water rights, concerns, jurisdiction and an interest in developing for municipal water supply or other beneficial uses. These basins are:
• San Pasqual Valley Basin • Mission Valley Basin • San Diego River Valley Basin (also known as Santee/El Monte Basin) • Coastal Plain of San Diego (formerly known as the San Diego Formation, which includes
the Sweetwater Valley Basin, Otay Valley Basin, and Tijuana Basin)F F
As part of the Sustainable Groundwater Management Act of 2014, a “Basin Boundary Modification” was submitted to the California Department of Water Resources (DWR) in 2016 requesting a modification to the boundaries of the
City of San Diego Public Utilities Department Water Supply Assessment Report Kearny Mesa Community Plan Update Project
28
The City is committed to protecting its groundwater resources and preserving its established Pueblo water rights throughout the San Diego River Valley Basin and in the Coastal Plain of San Diego which extends outside the municipal boundary. This right attaches to it the use of all surface waters and groundwater of the streams that flowed through the original pueblo, including their tributaries, from their source to their mouth. The City’s Pueblo right protects its ability to extract water from the groundwater basin to the extent of the needs of its inhabitants.
The City currently is utilizing groundwater from two (2) of the aforementioned basins including production wells in the San Diego River Valley Basin and a joint project with Sweetwater Authority in the Coastal Plain of San Diego Basin. These projects can be viewed as evidence of the City’s intent, ability and ongoing efforts to develop groundwater resources. The City is also finalizing several CIPs to utilize groundwater which will verify and confirm the City’s intent to develop and assert its right to develop all available groundwater needed for its inhabitants.
The groundwater quality from these basins is predominantly brackish. Technological improvements over the last few decades have enhanced the treatability of certain water sources, such as brackish groundwater and reduced the associated costs. As mentioned previously, groundwater development is part of the City’s planning and CIP efforts and remains a viable and cost-effective water resource. Local water supply projects, such as groundwater supply exploration, offer multiple benefits to City rate payers; including protection against drought, and interruptions in imported water supplies and enhanced local control. Furthermore, the Sustainable Groundwater Management Act (SGMA) of 2014 provides a framework for sustainable management of groundwater supplies by local authorities. Under guidance from DWR, local agencies involved in SGMA implementation were required to form local groundwater sustainability agencies (GSAs) for each medium and high-priority groundwater basin by June of 2017. The City has two (2) groundwater basins that need to be effectively managed by GSAs that are governed by SGMA legislation: San Pasqual Valley Groundwater Basin and the San Diego River Valley Groundwater Basin. On June 27, 2017, the San Diego City Council (Council) approved forming a GSA and the preparation of a Groundwater Sustainability Plan (GSP) for each basin to comply with the requirements of SGMA. The GSPs must be adopted by the year of 2022. By the year of 2042, groundwater agencies in these medium and high-priority basins need to achieve sustainable groundwater management to avoid undesirable results, such as chronic depletion of groundwater, reduction of groundwater storage, degradation of water quality, depletion of surface water or subsidence. Groundwater Basin Descriptions San Pasqual Valley Basin The San Pasqual Valley Basin (SPVB) is an alluvial groundwater basin that underlies the designated agricultural preserve in San Pasqual Valley. SPVB is valued for its groundwater and surface water resources. Nearly all the land overlaying SPVB is owned and managed by the City. Much of this property is leased to individuals for various agricultural and commercial land uses. SPVB is located approximately 25 miles northeast of downtown San Diego. The total surface
Sweetwater Valley, Otay Valley, and Tijuana Valley groundwater basins as defined by DWR Bulletin No. 118. The requested Modification was approved in October of 2016 and the three (3) basins were consolidated to include the whole of the underlying San Diego Formation aquifer as a ‘new’ groundwater basin – referred to as the “Coastal Plain of San Diego.”

City of San Diego Public Utilities Department Water Supply Assessment Report Kearny Mesa Community Plan Update Project
29
area of the SPVB is approximately 4,540 acres, with storage capacity of 58,000AF and a safe yield of approximately 5,800 AFY. The City is the Monitoring Entity for the SPVB as identified by the California Statewide Groundwater Elevation Monitoring (CASGEM) program. Working cooperatively with the DWR, the City established a network of monitoring wells for CASGEM to regularly and systematically track seasonal and long-term trends in groundwater elevations for this alluvial groundwater basin. Included in the monitoring network plan are three (3) multi-level monitoring wells that were installed by the United States Geological Survey (USGS) under a cooperative agreement with the City. Participation in the statewide CASGEM program allows basin groundwater data to be maintained and readily available through DWR’s public data base. The City has completed several feasibility studies to understand the enhancement of the long-term sustainability and quality of surface and groundwater within the SPVB. Currently, the City is exploring synergistic opportunities for regional water use amongst North County agencies and water districts surrounding the SPVB. The City continues to explore opportunities for protecting the groundwater resources for beneficial uses, including: water supply, agriculture and the environment. Mission Valley Basin The Mission Valley Basin (MVB) is a historic and valuable source of drinking water for the City. The PUD continues to demonstrate ability and intent to resume utilization of this resource as a water supply. Topographically, Mission Valley is a narrow, east-west trending valley carved out by the San Diego River as it drains westward from Mission Gorge to the Pacific Ocean. The most conducive portion of the groundwater basin lies within the extent of a historical well field where the City has retained ownership of the property and where a substantial portion is overlain by a football stadium (Stadium) and its parking lot. In 1963, a fuel tank farm was built in Mission Valley at the mouth of Murphy Canyon, known as Mission Valley Terminal (MVT). Underground fuel contamination was suspected to begin in 1986. From 1986 to 1991, approximately 200,000 gallons of gasoline were released underground from the MVT located upstream of the Stadium and contaminated the groundwater in the MVB. The contamination extended from the tank farm beneath Stadium property to approximately where Interstate 805 crosses the San Diego River. During subsequent years, the City temporarily suspended plans for water resource development in the MVB due to ongoing litigation with the party responsible for the petroleum contamination. Following settlement of the litigation in 2016, the City resumed planning activities for development of MVB for municipal supply. The MVB is currently classified as a low priority on DWR’s Basin Priority List. Most recently, in 2016, the City installed a test well west of the Stadium site to determine if the area is suitable for installation of production wells and continues to collect hydrogeological and water quality data on the MVB to support water supply development. San Diego River Valley Basin The City has been producing groundwater from the San Diego River Valley Basin, also know as Santee/El Monte Basin, which is located in the upper reach of the San Diego River. The City’s existing San Vicente Production Well was constructed in 2004 and pumps a maximum of 600 gallons per minute. The well conveys groundwater directly to the City’s existing raw water line and ultimately to the City’s Alvarado Water Treatment Plant. The City is evaluating the expansion of groundwater facilities near the San Vicente Production Well, in addition to a well downstream of El Capitan Reservoir.

City of San Diego Public Utilities Department Water Supply Assessment Report Kearny Mesa Community Plan Update Project
30
Similar to the SPVB, the City is the approved Monitoring Entity for the DWR’s CASGEM program for the San Diego River Valley Basin. In 2015, a Memorandum of Understanding establishing a Voluntary Cooperative Groundwater Monitoring Association was executed with Padre Dam Municipal Water District, Lakeside Water District, and Helix Water District. On file with DWR is an approved San Diego River Valley Basin monitoring plan. Coastal Plain of San Diego (formerly known as the San Diego Formation) The Coastal Plain of San Diego is a groundwater basin covering much of National City and the City of Chula Vista in the southern portion of San Diego County. The Coastal Plain of San Diego is a confined groundwater basin that underlies the Otay Valley Basin, Sweetwater Valley Basin, and Tijuana Basin as identified by DWR in Bulletin No. 118. The City desires to use the Coastal Plain of San Diego for groundwater municipal supply and seeks to manage the safe yield of the groundwater system in a prudent and efficient manner. The City has been better able to characterize the water quality and quantity in the Coastal Plain of San Diego through aquifer testing and monitoring well installation that has occurred since 2007. In addition, the City has been working with the USGS to develop an integrated and comprehensive understanding of the geology and hydrology of the Coastal Plain of San Diego and to use this understanding to evaluate a sustainable, long-term environmentally sound use of the basin for municipal supply.
In 2013, the Sweetwater Authority reached an agreement with the City to share potable water from the Richard A. Reynolds Desalination Facility after its expansion and jointly fund the project. The Expansion Project, completed in 2017, increased the capacity of the brackish groundwater desalination facility from 3,600 AFY to 8,800 AFY. Under the terms of this agreement, the City receives 50 percent of any water produced over 3,600 AFY at the facility. Beginning in water year 2018-2019 (April 1 through March 31) the projected volume will be approximately 2,600 AFY. Even with the projected supply reaching 2,600 AFY, the City is assumed to average 1,900 AFY. The Sweetwater Authority is responsible for owning and operating the brackish groundwater desalination facility.

City of San Diego Public Utilities Department Water Supply Assessment Report Kearny Mesa Community Plan Update Project
31
Section 6 - Projected Demands
Approximately every three (3) years the PUD calculates projected water demands within its service area for planning purposes. A computer model is used (IWR-MAIN) to break down water-use by four (4) major sectors: commercial, industrial, residential and public uses. Using past water-use data from the PUD and demographic data provided by the SANDAG land use, the model is able to correlate the data to determine sector water demands. Using this correlated data, forecasted demographic data is used to project water demands. The model also accounts for water conservation, weather and water rate changes.
In addition to the PUD, the Water Authority and MWD use regional growth forecasts to calculate projected water demands within their respective service areas. This provides for consistency between the retail and wholesale agencies projected water demands, thereby ensuring that adequate supplies are being planned for the PUD’s existing and future water users. The SANDAG forecasts are based on adopted community plan land use, but not citywide zoning. SANDAG forecasts the number of residents, dwelling units, and employees in an area, but not square footage, hotel rooms, or visitors (non-residents or non-employees). For urban areas, the smallest forecast geography is typically at the block level, but the forecast geography can be larger for suburban and less developed areas. SANDAG typically updates the regional growth forecast every three (3) to four (4) years. The PUD water demand projections, based on the SANDAG Series 13 Forecast for land use, are incorporated into the City’s 2015 UWMP which is updated every five (5) years. The 2015 UWMP was completed and adopted in June of 2016. The time extension was mandated by Assembly Bill 2067 and implemented by DWR. The projections with the City’s 2015 UWMP were forwarded to the Water Authority for use in the preparation of the Water Authority’s UWMP, which is subsequently incorporated into MWD’s UWMP to calculate the ultimate water demands of the region (Figure 6-1). Recently, water demands for the City have been greatly suppressed due to mandatory water use restrictions and public education that were put in place by the City as a result of the current statewide mandate for conservation in response to emergency drought conditions. Because of these suppressed demands, the City developed near-term water demand projections for its 2015 Cost of Service Study (COSS), which was utilized to set water rates through 2020. A method was developed to bridge the gap between the short-term water demand projections and long-term water demand forecast. This method assumes that once mandatory water use restrictions are lifted, water demands would return to pre-drought (i.e., 2008) levels within 15 years. In past droughts, it took five (5) to seven (7) years for water demands to return to pre-drought levels. However, due to the severity of the ongoing drought at the time of the COSS, it was assumed that it will take longer for the bounce back in water demands to occur. The demands from the 2015 UWMP are used throughout this Report. The historical and projected water demands for a normal year are shown in Table 6-1. As part of the requirement for complying with SB 610, Table 6-7 and Table 6-8 show the single-dry year and consecutive multiple-dry year demands. All tables in this section are based on data from the 2015 UWMP.
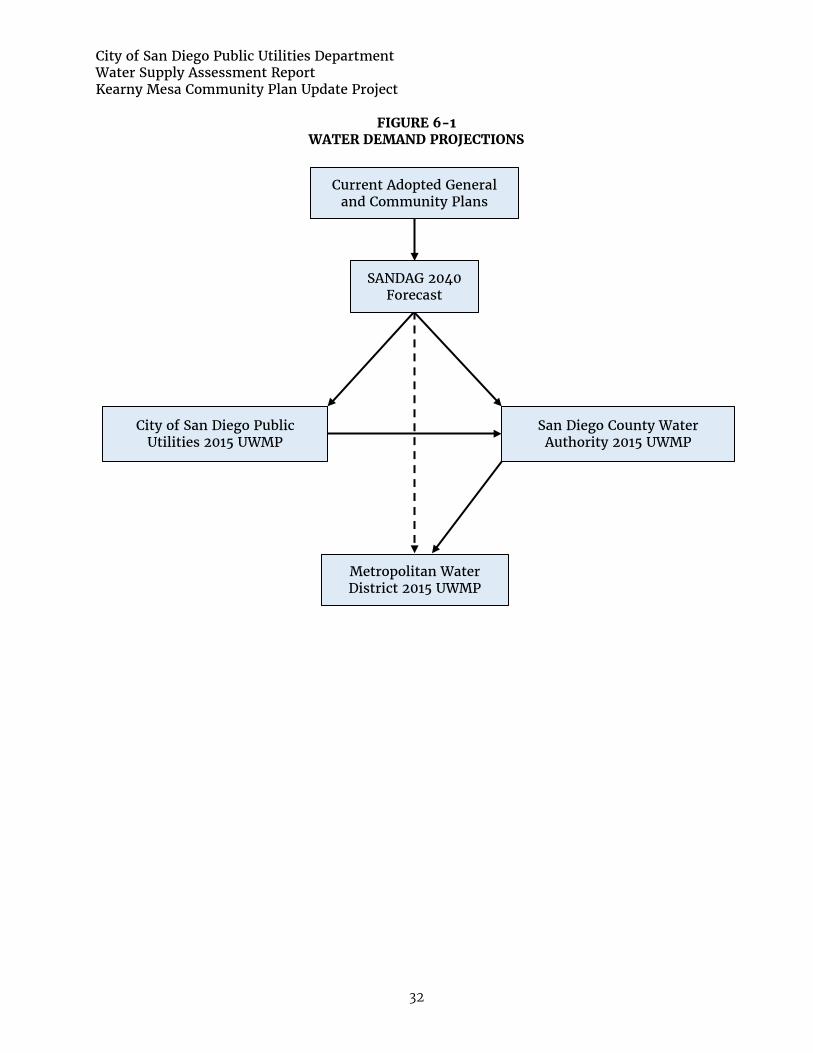
City of San Diego Public Utilities Department Water Supply Assessment Report Kearny Mesa Community Plan Update Project
32
FIGURE 6-1 WATER DEMAND PROJECTIONS
City of San Diego Public Utilities 2015 UWMP
SANDAG 2040 Forecast
Current Adopted General and Community Plans
San Diego County Water Authority 2015 UWMP
Metropolitan Water District 2015 UWMP
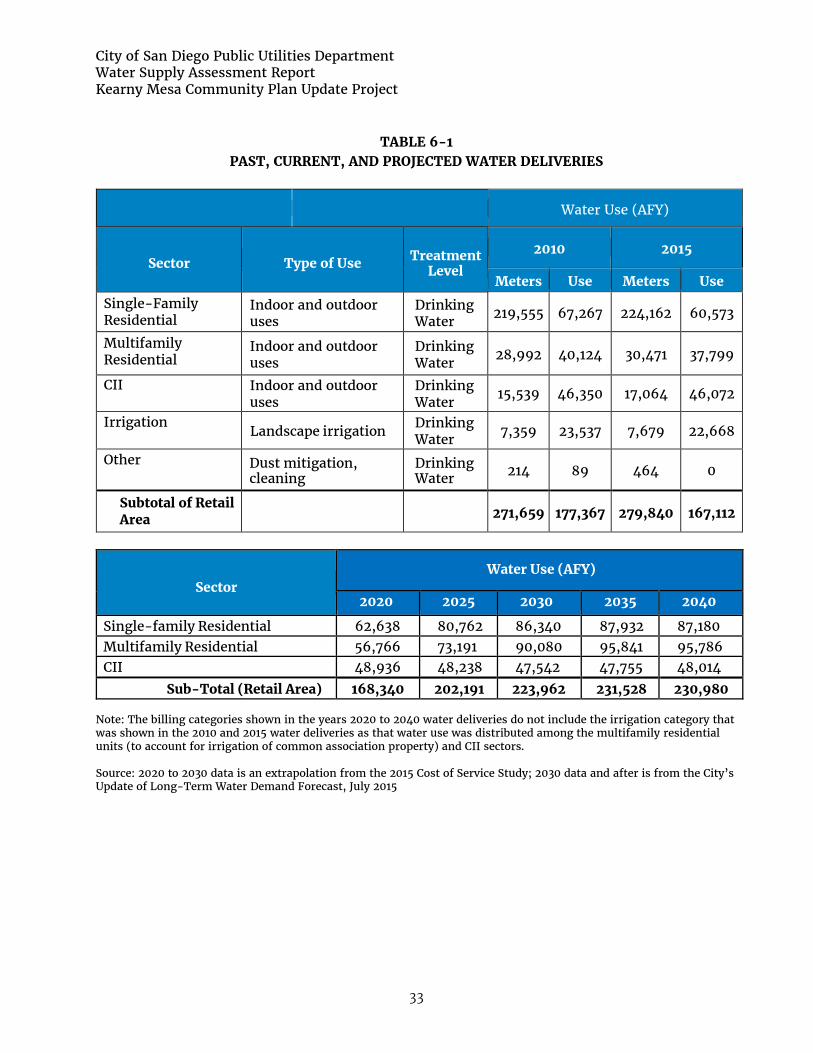
City of San Diego Public Utilities Department Water Supply Assessment Report Kearny Mesa Community Plan Update Project
33
TABLE 6-1
PAST, CURRENT, AND PROJECTED WATER DELIVERIES
Water Use (AFY)
Sector Type of Use Treatment Level
2010 2015
Meters Use Meters Use
Single-Family Residential
Indoor and outdoor uses
Drinking Water 219,555 67,267 224,162 60,573
Multifamily Residential
Indoor and outdoor uses
Drinking Water 28,992 40,124 30,471 37,799
CII Indoor and outdoor uses
Drinking Water 15,539 46,350 17,064 46,072
Irrigation Landscape irrigation Drinking
Water 7,359 23,537 7,679 22,668
Other Dust mitigation, cleaning
Drinking Water 214 89 464 0
Subtotal of Retail Area
271,659 177,367 279,840 167,112
Sector
Water Use (AFY)
2020 2025 2030 2035 2040
Single-family Residential 62,638 80,762 86,340 87,932 87,180 Multifamily Residential 56,766 73,191 90,080 95,841 95,786 CII 48,936 48,238 47,542 47,755 48,014
Sub-Total (Retail Area) 168,340 202,191 223,962 231,528 230,980 Note: The billing categories shown in the years 2020 to 2040 water deliveries do not include the irrigation category that was shown in the 2010 and 2015 water deliveries as that water use was distributed among the multifamily residential units (to account for irrigation of common association property) and CII sectors. Source: 2020 to 2030 data is an extrapolation from the 2015 Cost of Service Study; 2030 data and after is from the City’s Update of Long-Term Water Demand Forecast, July 2015

City of San Diego Public Utilities Department Water Supply Assessment Report Kearny Mesa Community Plan Update Project
34
Table 6-2 Summarizes the current and planned water sources the City is relying on to meet future demands.
TABLE 6-2 PLANNED WATER SUPPLY SOURCES
Basin
Average Year Water Supply (AFY)
2015* 2020 2025 2030 2035 2040
Verifiable Supply (Existing and Planned)
Surface Water 6,279 22,900 22,800 22,700 22,600 22,500 Groundwater 500 3,100 3,100 3,100 3,100 3,100 Recycled Water (non-potable) 8,195 13,650 13,650 13,650 13,650 13,650 Total Verifiable Local Water Supplies 14,974 39,650 39,550 39,450 39,350 39,250
SDCWA Water Purchases with Verifiable Regional Water Supplies 173,754 161,334 202,488 225,390 234,398 234,158
Total Verifiable Water Supplies 198,957 200,984 242,038 264,840 273,748 273,408 *2015 represents actual supplies under very dry hydrologic conditions – resulting in very low surface water supplies. 6.1 Water Sales to Other Agencies
Potable Water The City, through past agreements, sells treated water to the California American Water Company (Cal-Am), which provides water service to the cities of Coronado, Imperial Beach and the Naval Air Station North Island. The population of the Naval Air Station North Island is located within the City of Coronado, whereas the other military bases that the City serves are within the City. The City also sells untreated water to the Santa Fe Irrigation District and the San Dieguito Water District. Table 6-3 presents the water sales to other agencies.
Per the agreement between the City and Cal-Am, only local surface water is sold to Cal-Am to provide water to supply Cal-Am customers. A portion of City residents in the South Bay area are also served by Cal-Am and can be served by imported water as well. Per the agreement between the City and the City of Del Mar, the City takes deliveries of water which the City of Del Mar purchases from the Water Authority through the Second Aqueduct Connection at Miramar. This water is then treated at the City’s Miramar WTP and transported to the City of Del Mar through several interconnections.
The City has agreements to provide surplus treated water to Otay Water District and untreated exchange water to the Ramona Municipal Water District. These water deliveries occur infrequently and for short periods of time and are therefore not shown in Table 6-3.

City of San Diego Public Utilities Department Water Supply Assessment Report Kearny Mesa Community Plan Update Project
35
TABLE 6-3
SALES TO OTHER AGENCIES-POTABLE
Sector
Water Use (AFY)
2015 2020 2025 2030 2035 2040
Wholesale Water Sales 10,229 12,200 14,106 15,453 15,759 15,821
Source: 2020 to 2030 data is an extrapolation from the 2015 Cost of Service Study; 2030 data and after is from City’s Update of Long-Term Water Demand Forecast, July 2015
Recycled and Non-Revenue Water The City has three (3) separate agreements to sell recycled water. The Olivenhain Municipal Water District and the City of Poway are provided recycled water from the City’s North City Water Reclamation Plant while Otay Water District receives recycled water from the City’s South Bay Water Reclamation Plant. Non-Revenue Water (NRW) is the difference between the potable water supplied to the system (also known as potable water production) and the potable water sold to customers (also known as metered water deliveries). NRW typically includes legitimate uses that are not metered, such as street cleaning, line flushing and fire suppression as well as unaccounted for water. Unaccounted for water can be attributed to unauthorized consumption, meter inaccuracies, data errors, leakage on mains, leakage and overflow at storage and leakage at service connections. Typically, NRW is presented as a percentage of total potable water production. Historically, the City reported 4.3 percent of NRW in the 2005 UWMP, and 9 percent of NRW in the 2010 UWMP. Non-Revenue Water for the year 2015 was determined to be 7.4 percent, estimated at 13,421 AFY based on the American Water Works Association’s Water Audit Software, as required by the 2015 UWMP.
TABLE 6-4 ADDITIONAL WATER USES AND LOSSES
Use
Water Use (AFY)
2010 2015 2020 2025 2030 2035 2040
Non-Revenue Water 12,593 13,421 15,700 18,809 18,020 18,613 18,576
Recycled Water1 7,951 8,195 13,650 13,650 13,650 13,650 13,650
Excludes wholesale recycled water that the City provides outside of its service area. Table 6-5 is a summary of and displays City’s past water use/demand from 2010 and 2015 with projected water use/demand shown for 2020 through 2040.

City of San Diego Public Utilities Department Water Supply Assessment Report Kearny Mesa Community Plan Update Project
36
TABLE 6-5
TOTAL WATER-USE
Use
Water Demand (AFY)
2010 2015 2020 2025 2030 2035 2040
Retail Potable Water Sales 177,368 167,112 168,340 202,191 223,962 231,528 230,980 Wholesale Potable Water Sales 11,493 10,229 12,200 14,106 15,453 15,759 15,821 Non-Revenue Water 12,593 13,421 15,700 18,809 18,020 18,613 18,576
Sub-Total (Potable) 201,454 190,762 196,240 235,106 257,435 265,900 265,377
Recycled Water (Non-Potable) 7,951 8,195 13,650 13,650 13,650 13,650 13,650
Total Demand 209,405 198,957 209,890 248,756 271,085 279,550 279,027 The analysis in Table 6-6 compares the projected normal water supply and customer demands from 2010 to 2040 in five-year increments.
TABLE 6-6
PROJECTED NORMAL SUPPLY AND DEMAND COMPARISON
Normal Year Demands/Supplies
Demand and Supplies (AFY)
2020 2025 2030 2035 2040
Water Demand (with wholesale and conservation)
200,984 242,038 264,840 273,748 273,408
Local Water Supplies Recycled Water (City service area only)
13,650 13,650 13,650 13,650 13,650
Local Surface Supply 22,900 22,800 22,700 22,600 22,500 Groundwater 3,100 3,100 3,100 3,100 3,100 Sub-Total Local Supplies 39,650 39,550 39,450 39,350 39,250
Water Supply from SDCWA (purchased water) 161,334 202,488 225,390 234,398 234,158
Total City Water Supplies 200,984 242,038 264,840 273,748 273,408 Estimated Water Shortages 0 0 0 0 0

City of San Diego Public Utilities Department Water Supply Assessment Report Kearny Mesa Community Plan Update Project
37
6.2 Projected Single-Dry Year Water Supply and Demand Table 6-7 provides a comparison of a single-dry year water supply with projected total water demand over the next 25 years in five-year increments. The City’s demands in single-dry years are projected to be higher, similar in proportion to the increase in regional water demands projected in the Water Authority’s 2015 UWMP. An increase in demand for landscape irrigation accounts for most of the increase in demands. It is assumed that recycled water demands would not increase in single-dry years. The wholesale water supplies from the Water Authority are assumed to increase to meet the difference between the City’s increased water demands and reduced local water supplies.
TABLE 6-7 PROJECTED SINGLE-DRY YEAR SUPPLY AND DEMAND COMPARISON
Single-Dry Year (1990) Demands/Supplies
Demand and Supplies (AFY)
2020 2025 2030 2035 2040
Water Demand (with wholesale and conservation) 213,161 256,883 281,167 290,654 290,292
Local Water Supplies Recycled Water (City service area only) 13,650 13,650 13,650 13,650 13,650
Local Surface Supply 16,657 16,584 16,512 16,439 16,366 Groundwater 3,100 3,100 3,100 3,100 3,100
Sub-Total Local Supplies 33,407 33,334 33,262 33,189 33,116 Water Supply from SDCWA (purchased water)
179,754 223,549 247,906 257,466 257,176
Total City Water Supplies 213,161 256,883 281,167 290,654 290,292 Estimated Water Shortages 0 0 0 0 0
6.3 Projected Multiple-Dry Year Water Supply and Demand Table 6-8 compares the total water supply available in multiple-dry water years with projected total water demand over the next 25 years. The City’s demands in multiple-dry years are projected to be higher, similar in proportion to the increase in regional water demands projected in the Water Authority’s 2015 UWMP. It is presumed that recycled water demands would not increase in multiple-dry years. The wholesale water supplies from Water Authority are assumed to increase to meet the difference between the City’s increased water demands and reduced local water supplies. Multiple-dry year scenarios represent hot, dry weather periods which may generate urban water demands that are greater than normal.
No extraordinary conservation measures are reflected in the demand projections. The recycled water supplies are assumed to experience no reduction in a dry year.
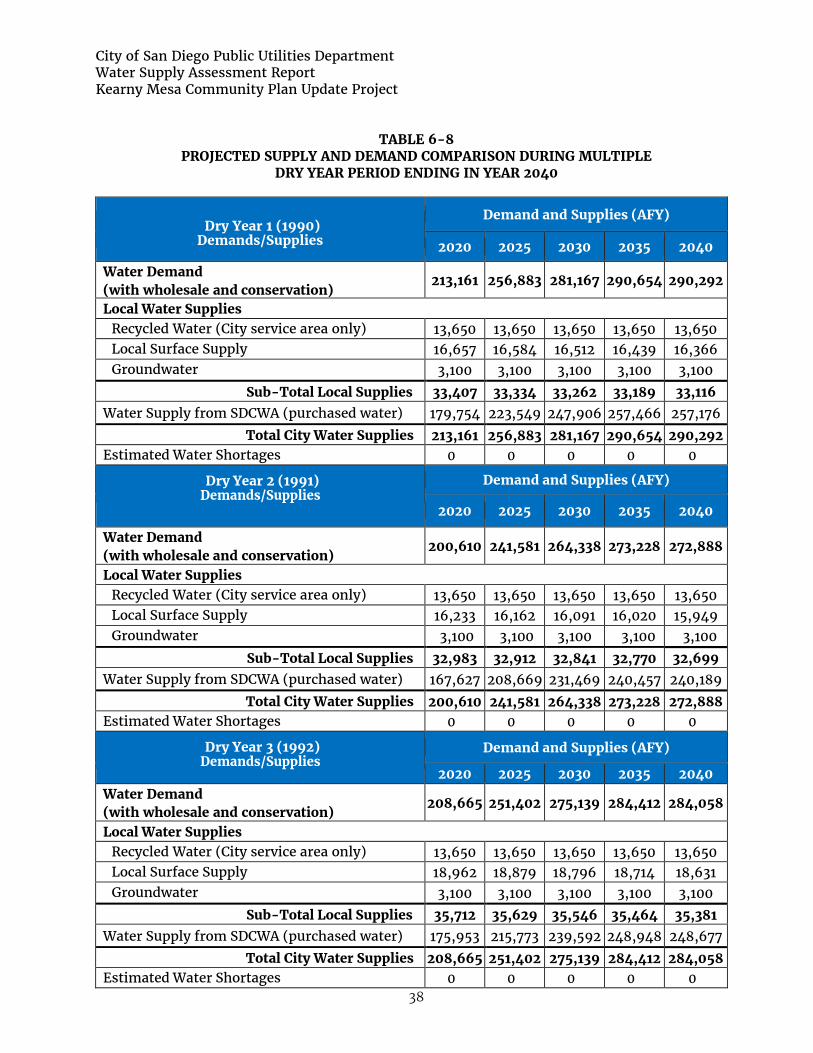
City of San Diego Public Utilities Department Water Supply Assessment Report Kearny Mesa Community Plan Update Project
38
TABLE 6-8
PROJECTED SUPPLY AND DEMAND COMPARISON DURING MULTIPLE DRY YEAR PERIOD ENDING IN YEAR 2040
Dry Year 1 (1990) Demands/Supplies
Demand and Supplies (AFY)
2020 2025 2030 2035 2040
Water Demand (with wholesale and conservation)
213,161 256,883 281,167 290,654 290,292
Local Water Supplies Recycled Water (City service area only) 13,650 13,650 13,650 13,650 13,650 Local Surface Supply 16,657 16,584 16,512 16,439 16,366 Groundwater 3,100 3,100 3,100 3,100 3,100
Sub-Total Local Supplies 33,407 33,334 33,262 33,189 33,116 Water Supply from SDCWA (purchased water) 179,754 223,549 247,906 257,466 257,176
Total City Water Supplies 213,161 256,883 281,167 290,654 290,292 Estimated Water Shortages 0 0 0 0 0
Dry Year 2 (1991) Demands/Supplies
Demand and Supplies (AFY)
2020 2025 2030 2035 2040
Water Demand (with wholesale and conservation)
200,610 241,581 264,338 273,228 272,888
Local Water Supplies Recycled Water (City service area only) 13,650 13,650 13,650 13,650 13,650 Local Surface Supply 16,233 16,162 16,091 16,020 15,949 Groundwater 3,100 3,100 3,100 3,100 3,100
Sub-Total Local Supplies 32,983 32,912 32,841 32,770 32,699 Water Supply from SDCWA (purchased water) 167,627 208,669 231,469 240,457 240,189
Total City Water Supplies 200,610 241,581 264,338 273,228 272,888 Estimated Water Shortages 0 0 0 0 0
Dry Year 3 (1992) Demands/Supplies
Demand and Supplies (AFY)
2020 2025 2030 2035 2040 Water Demand (with wholesale and conservation)
208,665 251,402 275,139 284,412 284,058
Local Water Supplies Recycled Water (City service area only) 13,650 13,650 13,650 13,650 13,650 Local Surface Supply 18,962 18,879 18,796 18,714 18,631 Groundwater 3,100 3,100 3,100 3,100 3,100
Sub-Total Local Supplies 35,712 35,629 35,546 35,464 35,381 Water Supply from SDCWA (purchased water) 175,953 215,773 239,592 248,948 248,677
Total City Water Supplies 208,665 251,402 275,139 284,412 284,058 Estimated Water Shortages 0 0 0 0 0

City of San Diego Public Utilities Department Water Supply Assessment Report Kearny Mesa Community Plan Update Project
39
Section 7 - Conclusion - Availability of Sufficient Supplies
The Project is consistent with water demand assumptions in the regional water resource planning documents of the City, Water Authority, and MWD. The PUD receives the majority of its water supply from MWD through the Water Authority. In addition, MWD and Water Authority have developed water supply plans to improve reliability and reduce dependence on existing imported supplies. MWD’s Regional Urban Water Management Plan and Integrated Resources Plan, and Water Authority’s 2015 UWMP and annual water supply report include projects that meet long-term supply needs through securing water from the State Water Project, Colorado River, local water supply development, conservation, and water reuse. The forecasted normal year water demands compared with projected supplies for the PUD are shown in Table 7-1. This demonstrates that with existing supplies and implementation of the projects discussed in the three agencies planning documents, there will be adequate water supplies to serve all anticipated growth (existing and future planned uses) and development.
TABLE 7-1 PROJECTED SUPPLY AND DEMAND COMPARISON – NORMAL YEAR
Normal Year Demands/Supplies Demand and Supplies (AFY)
2020 2025 2030 2035 2040 Water Demand (with wholesale and conservation) 200,984 242,038 264,840 273,748 273,408
Local Water Supplies Recycled Water (City service area only) 13,650 13,650 13,650 13,650 13,650 Local Surface Supply 22,900 22,800 22,700 22,600 22,500 Groundwater 3,100 3,100 3,100 3,100 3,100
Sub-Total Local Supplies 39,650 39,550 39,450 39,350 39,250 Water Supply from SDCWA (purchased water)
161,334 202,488 225,390 234,398 234,158
Total City Water Supplies 200,984 242,038 264,840 273,748 273,408 Estimated Water Shortages 0 0 0 0 0
Table 7-2 provides a comparison of a single-dry year water supply with projected total water use/demand over the next 25 years, in five-year increments.

City of San Diego Public Utilities Department Water Supply Assessment Report Kearny Mesa Community Plan Update Project
40
TABLE 7-2
PROJECTED SINGLE-DRY YEAR SUPPLY AND DEMAND COMPARISON
Single-Dry Year (1990)
Demand and Supplies (AFY) 2020 2025 2030 2035 2040
Water Demand (with wholesale and conservation)
213,161 256,883 281,167 290,654 290,292
Local Water Supplies Recycled Water (City service area only) 13,650 13,650 13,650 13,650 13,650 Local Surface Supply 16,657 16,584 16,512 16,439 16,366 Groundwater 3,100 3,100 3,100 3,100 3,100
Sub-Total Local Supplies 33,407 33,334 33,262 33,189 33,116 Water Supply from SDCWA (purchased water) 179,754 223,549 247,906 257,466 257,176
Total City Water Supplies 213,161 256,883 281,167 290,654 290,292 Estimated Water Shortages 0 0 0 0 0
The multiple-dry year scenarios, within a 25 year projection, are shown in Table 7-3. This demonstrates that supplies will be adequate to meet all anticipated growth (existing and future planned uses) and development in multiple-dry year periods. In summary, this Report demonstrates that there are sufficient water supplies over a 25 year planning horizon to meet the projected demands of the Project, as well as, the existing and other planned development projects within the PUD service area in normal, dry year and multiple-dry year forecasts. This Project is proposing water demands which are included in the regional water resource planning documents of the City, the Water Authority and MWD.

City of San Diego Public Utilities Department Water Supply Assessment Report Kearny Mesa Community Plan Update Project
41
TABLE 7-3 PROJECTED SUPPLY AND DEMAND COMPARISON DURING MULTIPLE
DRY YEAR PERIOD ENDING IN 2040
Dry Year 1 (1990) Demands/Supplies
Demand and Supplies (AFY)
2020 2025 2030 2035 2040
Water Demand (with wholesale and conservation)
213,161 256,883 281,167 290,654 290,292
Local Water Supplies Recycled Water (City service area only) 13,650 13,650 13,650 13,650 13,650 Local Surface Supply 16,657 16,584 16,512 16,439 16,366 Groundwater 3,100 3,100 3,100 3,100 3,100
Sub-Total Local Supplies 33,407 33,334 33,262 33,189 33,116 Water Supply from SDCWA (purchased water) 179,754 223,549 247,906 257,466 257,176
Total City Water Supplies 213,161 256,883 281,167 290,654 290,292 Estimated Water Shortages 0 0 0 0 0
Dry Year 2 (1991) Demands/Supplies
Demand and Supplies (AFY) 2020 2025 2030 2035 2040
Water Demand (with wholesale and conservation)
200,610 241,581 264,338 273,228 272,888
Local Water Supplies Recycled Water (City service area only) 13,650 13,650 13,650 13,650 13,650 Local Surface Supply 16,233 16,162 16,091 16,020 15,949 Groundwater 3,100 3,100 3,100 3,100 3,100
Sub-Total Local Supplies 32,983 32,912 32,841 32,770 32,699 Water Supply from SDCWA (purchased water) 167,627 208,669 231,469 240,457 240,189
Total City Water Supplies 200,610 241,581 264,338 273,228 272,888 Estimated Water Shortages 0 0 0 0 0
Dry Year 3 (1992) Demands/Supplies
Demand and Supplies (AFY) 2020 2025 2030 2035 2040
Water Demand (with wholesale and conservation)
208,665 251,402 275,139 284,412 284,058
Local Water Supplies Recycled Water (City service area only) 13,650 13,650 13,650 13,650 13,650 Local Surface Supply 18,962 18,879 18,796 18,714 18,631 Groundwater 3,100 3,100 3,100 3,100 3,100
Sub-Total Local Supplies 35,712 35,629 35,546 35,464 35,381 Water Supply from SDCWA (purchased water) 175,953 215,773 239,592 248,948 248,677
Total City Water Supplies 208,665 251,402 275,139 284,412 284,058 Estimated Water Shortages 0 0 0 0 0
City of San Diego Public Utilities Department Water Supply Assessment Report Kearny Mesa Community Plan Update Project
42
Source Documents
California Department of Water Resources (DWR), Progress on Incorporating Climate Change into Management of California’s Water Resources, July 2006 Report California Climate Change Center, 2006 Biennial Report: Our Changing Climate: Assessing the Risks to California, 2006 California Department of Water Resources Guidebook for Implementation of Senate Bill 610 and Senate Bill 221 of 2001, March 2011 DSD Memorandum - Request for assessment and project description, February 2013 MWD 2010 Regional Urban Water Management Plan MWD Report on Metropolitan’s Water Supplies, A Blueprint for Water Reliability, March 2003 MWD Integrated Resources Plan Update, Oct 2010 Public Utilities Department 2015 Urban Water Management Plan Public Utilities Department Annual 2012 Water Conservation Report Public Utilities Department Recycled Water Study July 2012 Public Utilities Department Recycled Water Master Plan August 2011 Public Utilities Department Water Purification Demonstration Project Report Water Authority 2010 Urban Water Management Plan Water Authority Regional Water Facilities Master Plan, 2003 Water Department Long-Range Water Resources Plan (2002-2030), December 2002 Water Department The City of San Diego Subordinated Water Revenue Bonds, Series 2002, October 2002

City of San Diego Public Utilities Department Water Supply Assessment Report Kearny Mesa Community Plan Update Project
43
APPENDIX A
San Diego County Water Authority’s Approval Email for the use of the Accelerated Forecast Growth (AFG) of its 2015 UWMP

City of San Diego Public Utilities Department Water Supply Assessment Report Kearny Mesa Community Plan Update Project
44
Khuram, Thank you for your email regarding the water use figures for the City of San Diego’s Kearny Mesa Community Plan Update Project (Kearny Mesa Project). The following is the Water Authority’s response to your request to use the Accelerated Forecasted Growth (AFG) component of the Water Authority’s 2015 Urban Water Management Plan to meet the unanticipated water demands associated with the Kearny Mesa Project. The purpose of the AFG component of the demand forecast is to estimate, on a regional basis, additional demand associated with proposed projects not yet included in local jurisdictions’ general plans and to plan for sufficient regional supplies to reliably meet the water demand of those projects. The Kearny Mesa Project identified in your March 19, 2019 e-mail meets the criteria for the AFG component of the Water Authority’s 2015 UWMP, and we are planning to have water supplies to reliably meet the updated demand associated with the project. Our accounting of the remaining AFG component will be adjusted to reflect the additional revised demand associated with the proposed Kearny Mesa Project. In order to accurately account for utilization of the AFG, we request that the City of San Diego send the Water Authority notification of when this project or any other project that utilized the AFG demand component is approved and included in the City of San Diego’s land-use plans provided to the San Diego Association of Governments for their long-term growth forecasting. Please let me know if you have any questions or wish to discuss this matter further. Kind Regards, Tim Tim Bombardier Principal Water Resources Specialist San Diego County Water Authority (858) 522-6757 [email protected]
City of San Diego Public Utilities Department Water Supply Assessment Report Kearny Mesa Community Plan Update Project
45
From: Shah, Khuram <[email protected]> Sent: Tuesday, March 19, 2019 9:47 PM To: Bombardier, Tim <[email protected]> Cc: Danek, Karina <[email protected]>; Adrian, George <[email protected]>; Tabatabaii, Elham <[email protected]>; Wiborg, Lan <[email protected]>; Friehauf, Dana <[email protected]>; Bista, Seevani <[email protected]> Subject: Requesting Use of Accelerated Forecasted Growth (AFG): WSA for Kearny Mesa Community Plan Update Project Tim,
The City of San Diego is preparing a Water Supply Assessment for the Kearny Mesa Community Plan Update Project in accordance with the assessment requirements of SB 610.
The Project is a comprehensive update of the Kearny Mesa Community Plan. The Draft Community Plan will result in additional housing units which will reduce the total acres of industrial land uses and increase areas proposed with a mixed-use land use designation.
Water demands are summarized below and the City is requesting the use of the Accelerated Forecasted Growth (AFG) component of the Water Authority’s 2015 Urban Water Management Plan to meet 1,954.47 AFY of unaccounted demand associated with this project, similar to other projects requested in the past. Projected Demand of 9,795.04 AFY City of San Diego 2015 UWMP, Planned Demand of 7,840.57 AFY Water Authority AFG – Planned Demand (Requested) for 1,954.47 AFY
An updated AFG balance sheet is attached for reference, indicating the AFG increments requested to date.
Sincerely, Khuram Shah Associate Civil Engineer Long Range Planning & Water Resources Division Public Utilities Department O: 619.533.4222

City of San Diego Public Utilities Department Water Supply Assessment Report Kearny Mesa Community Plan Update Project
46
APPENDIX B
San Diego County Water Authority’s Accelerated Forecast Growth (AFG) Demand Track

City of San Diego Public Utilities Department Water Supply Assessment Report Kearny Mesa Community Plan Update Project
47
TABLE B-1: 2015 UWMP Accelerated Forecast Growth
Note: CoSD: City of San Diego PoSD: Port of San Diego CivicSD: Civic San Diego CCDC: Centre City Development Corporation
Response Date Agency Project Estimated
(AF) Running
Total (AF)
Date EIR Certified
Value carried forward from Total AFG Demand Increment Needed based on 2010 UWMP – Series 12 See Table B-2
2,583.5 2,583.3
Projects based on Series 12 - 2010 UWMP (2015 UWMP not yet adopted) 04/07/2016 CivicSD 7th and Market 115.5 2,699.0 04/07/2016 CoSD Town & Country 192.3 2,891.3 3/20/2018 Projects based on Series 13 – 2015 UWMP
07/26/2016 CivicSD Broadway Block Amendment 69.5 2,960.8
08/03/2016 CoSD University of San Diego Master Plan Update 231.8 3,192.6
9/11/2017
09/16/2016 CoSD Preserve at Torrey Highlands 138.1 3,330.7 In process
10/31/2016 CoSD Pacific Village 34.5 3,365.2
MND Adopted 3/5/2018
11/10/2016 CivicSD 499 West Ash 76.4 3,441.6 04/03/2017 CoSD Costa Verde Revitalization 126.1 3,567.7 In process 02/22/2018 CoSD UCSD LRDP Update 1,618.8 5,186.5 In process
05/22/2018 CoSD San Diego International Airport Development Plan 405.5 5,592.0 In process
12/04/2018 CoSD UCSD Hillcrest 2019 LRDP 320.61 5,912.61 In process 01/09/2019 CoSD Junipers Project 433.54 6,346.15 In process 02/13/2019 CoSD 3 Roots Project 121.49 6,467.64 In process 03/11/2019 CivicSD Park and Broadway 69.38 6,537.02 In process 03/29/2019 CoSD Kearny Mesa CPU 1,954.47 8,491.49 In process Running Total 8,491.49
Total City Usage 8,491.49
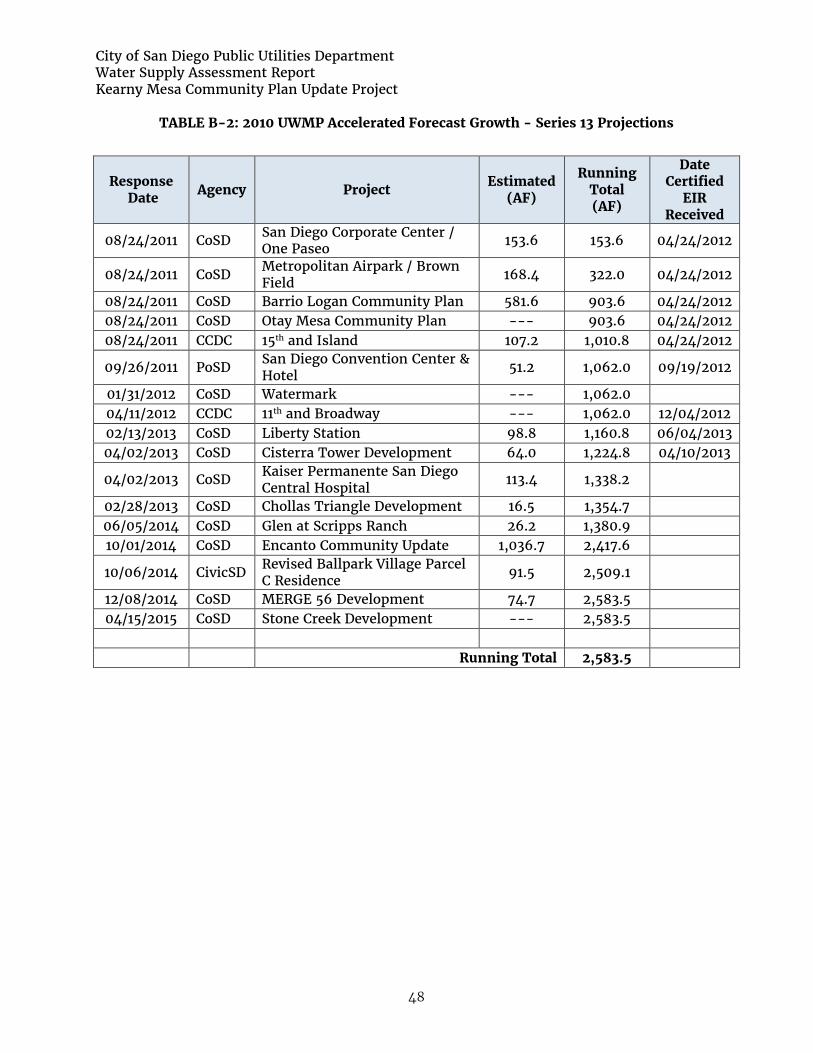
City of San Diego Public Utilities Department Water Supply Assessment Report Kearny Mesa Community Plan Update Project
48
TABLE B-2: 2010 UWMP Accelerated Forecast Growth - Series 13 Projections
Response Date Agency Project Estimated
(AF)
Running Total (AF)
Date Certified
EIR Received
08/24/2011 CoSD San Diego Corporate Center / One Paseo 153.6 153.6 04/24/2012
08/24/2011 CoSD Metropolitan Airpark / Brown Field 168.4 322.0 04/24/2012
08/24/2011 CoSD Barrio Logan Community Plan 581.6 903.6 04/24/2012 08/24/2011 CoSD Otay Mesa Community Plan --- 903.6 04/24/2012 08/24/2011 CCDC 15th and Island 107.2 1,010.8 04/24/2012
09/26/2011 PoSD San Diego Convention Center & Hotel 51.2 1,062.0 09/19/2012
01/31/2012 CoSD Watermark --- 1,062.0 04/11/2012 CCDC 11th and Broadway --- 1,062.0 12/04/2012 02/13/2013 CoSD Liberty Station 98.8 1,160.8 06/04/2013 04/02/2013 CoSD Cisterra Tower Development 64.0 1,224.8 04/10/2013
04/02/2013 CoSD Kaiser Permanente San Diego Central Hospital 113.4 1,338.2
02/28/2013 CoSD Chollas Triangle Development 16.5 1,354.7 06/05/2014 CoSD Glen at Scripps Ranch 26.2 1,380.9 10/01/2014 CoSD Encanto Community Update 1,036.7 2,417.6
10/06/2014 CivicSD Revised Ballpark Village Parcel C Residence 91.5 2,509.1
12/08/2014 CoSD MERGE 56 Development 74.7 2,583.5 04/15/2015 CoSD Stone Creek Development --- 2,583.5
Running Total 2,583.5