appendix m - webcast.ottawa.ca
TRANSCRIPT

VOLUME III GEOLOGY, HYDROGEOLOGY & GEOTECHNICAL REPORT CAPITAL REGION RESOURCE RECOVERY CENTRE
APPENDIX M Technical Memorandum – Dug Well Assessment
December 2014 Report No. 12-1125-0045/4500/vol III
Golder Associates Ltd.
32 Steacie Drive, Kanata, Ontario, Canada K2K 2A9 Tel: +1 (613) 592 9600 Fax: +1 (613) 592 9601 www.golder.com
Golder Associates: Operations in Africa, Asia, Australasia, Europe, North America and South America
Golder, Golder Associates and the GA globe design are trademarks of Golder Associates Corporation.
Private water supply in the area of the Capital Region Resource Recovery Centre (CRRRC) Site (Site) is primarily from dug wells. Dug wells may also be used for (all or part of) the Site water supply. A hydrogeological investigation was completed on two existing dug wells situated on the Site for purposes of assessing water supply: (1) for the Environmental Assessment in terms of gathering information to assist in addressing concerns from residents about potential impacts of the project on their dug well water supply quantity and quality, and, (2) to provide information that could be used during the design of the water supply for the Site.
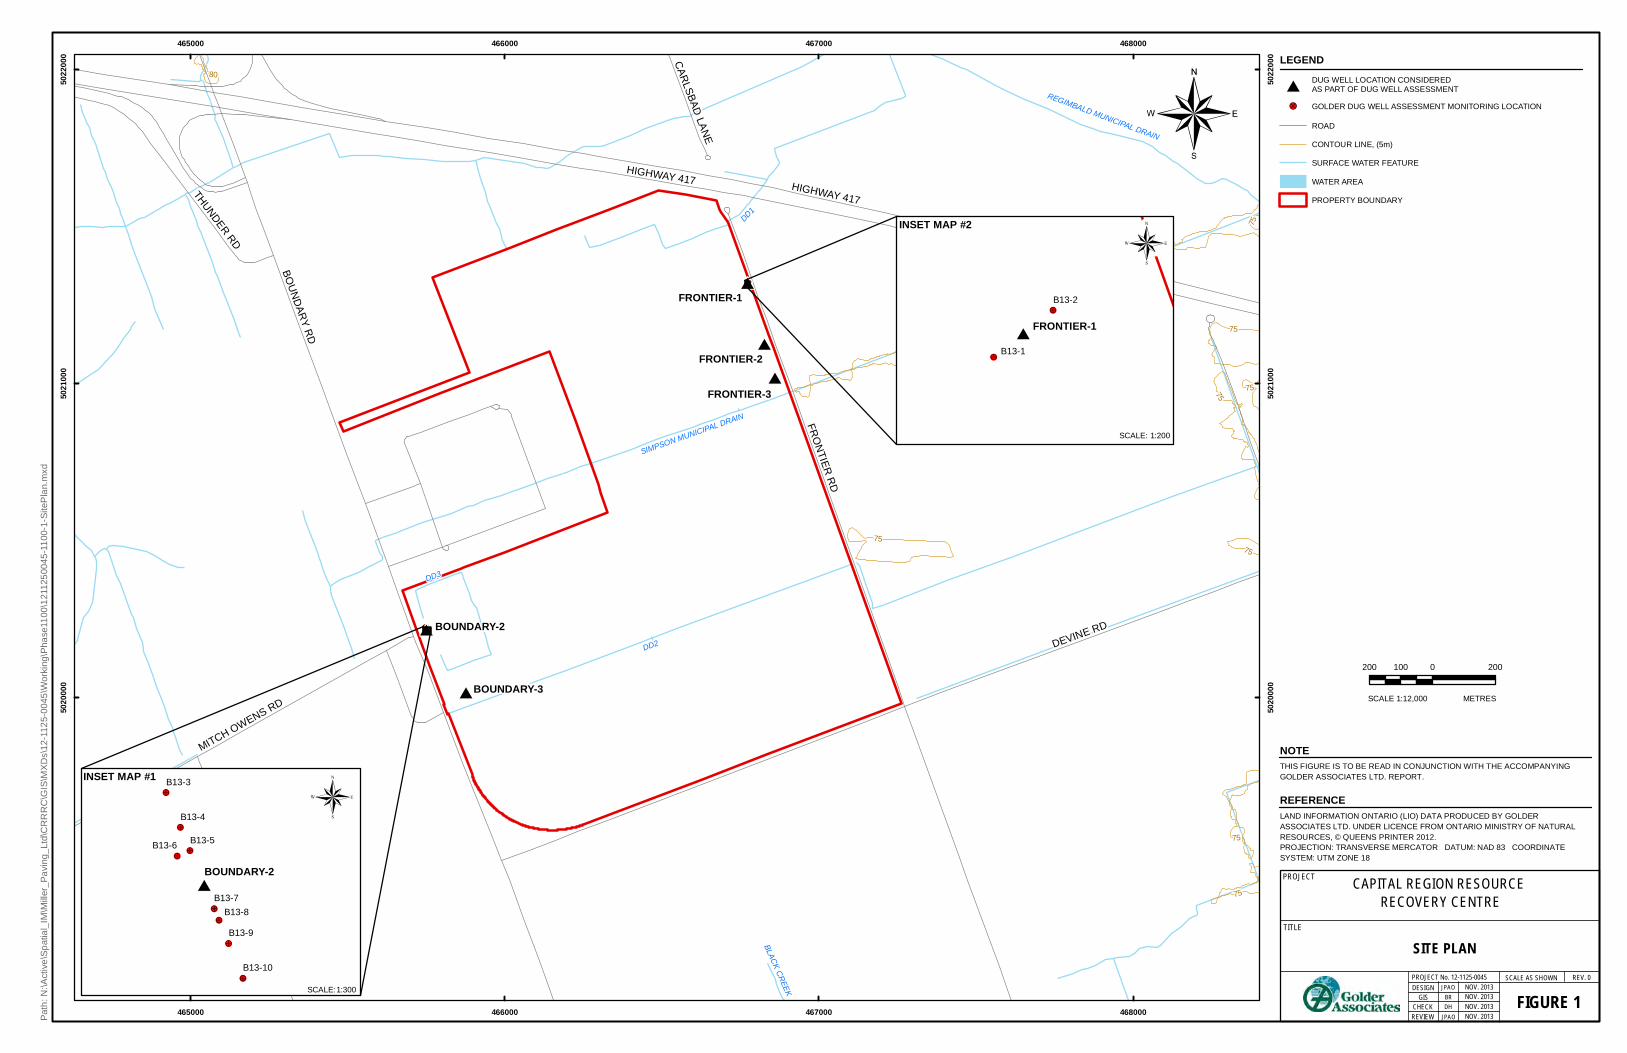
This technical memorandum provides a description of the methodology used to assess the hydrogeological properties of two existing dug wells, referred to as Frontier-1 and Boundary-2, situated on the Site (see locations on Figure 1). The assessment was designed to provide information on the yield of dug wells, how groundwater levels fluctuate within a dug well during typical operation, and to estimate the radius of influence (i.e., the zone around the well that experiences drawdown in groundwater levels) associated with the water taking from a dug well. The dug well assessment was divided into the following five tasks:
Task 1 – Assess Construction Details and Selection of Dug Wells;
Task 2 – Monitoring Well Installations;
Task 3 – Groundwater Level Monitoring Program – Typical Use;
Task 4 – Groundwater Level Monitoring Program – Pumping Test; and,
Task 5 – Data Analysis.
The results of the above tasks are described below.
Assess Construction Details and Selection of Dug Wells As an initial step, six dug well locations on or nearby the Site were identified as potential locations for use during the dug well assessment. Five of the dug wells are located on the Site, and one is located to the northwest of the Site. The dug wells are identified as Frontier-1 through Frontier-3 and Boundary-1 through Boundary-3. All dug wells are currently in use as water supply wells with the exception of Boundary-2. The dug wells at Frontier-1, Frontier-2 and Boundary-1 were sampled in January 2013 as part of the residential well sampling program completed in the vicinity of the Site. A water well and sewage disposal system survey was completed with the residents prior to sampling in January 2013. As part of the dug well assessment, the same survey was also completed at Frontier-3, Boundary-2 and Boundary-3.
DATE November 2013 PROJECT No. 12-1125-0045/4500
DUG WELL ASSESSMENT – CRRRC SITE, OTTAWA, ONTARIO
12-1125-0045/4500 November 2013
2/6
The following information relating to well construction was obtained from the surveys:
Frontier-1 – the dug well is approximately 3.6 metres deep, 0.91 metres in diameter and is accessible;
Frontier-2 – the depth and diameter of the dug well is unknown and the well is currently inaccessible (i.e., buried). The approximate location of the dug well is known;
Frontier-3 – the dug well is approximately 4.2 metres deep, 0.91 metres in diameter and is accessible;
Boundary-1 – the dug well is 5.5 metres deep, 0.91 metres in diameter and is accessible;
Boundary-2 – the dug well is approximately 3.7 metres deep, 0.91 metres in diameter and is accessible; and,
Boundary-3 – the dug well is approximately 5.9 metres deep, 0.91 metres in diameter and is accessible.
All six dug wells are interpreted to obtain water primarily from the surficial silty sand layer. Dug wells Frontier-1 and Boundary-2 were selected for the hydrogeological assessment (see locations on Figure 1). The dug well assessment involved a groundwater level monitoring program under typical well use at Frontier-1, and an aquifer testing program at Boundary-2, which are described in further detail below.
Monitoring Well Installation As part of the dug well assessment, a total of ten boreholes were completed within the vicinity of the selected dug wells. The boreholes were drilled to confirm the geological conditions in the vicinity of the dug wells, and to permit the installation of groundwater monitoring wells. The boreholes drilled as part of the dug well assessment are identified as B13-1 through B13-10, and are shown on Figure 1. Strata Drilling Group (Strata) of Carleton Place, Ontario completed the borehole drilling program using a track-mounted Geoprobe drill rig. The drilling and monitoring well installations in the vicinity of Frontier-1 (B13-1 and B13-2, two metres radial distance) and Boundary-2 (B13-3 through B13-10, one to eight metres radial distance) were completed on October 21, 2013 and October 28, 2013, respectively.
The monitoring wells installed within boreholes B13-1 and B13-2 allowed for the observation of groundwater levels in the shallow overburden (surficial silty sand) during typical operation of a dug well (i.e., the residence where this dug well is located is still occupied). The monitoring wells installed within boreholes B13-3 to B13-10 allowed for the observations of groundwater levels in the shallow overburden during a pumping test completed using dug well Boundary-2. The geological conditions encountered at locations B13-1 through B13-10, as well as the monitoring well completion details are provided on the borehole records in Attachment A.
Groundwater Level Monitoring Program – Typical Dug Well Use Pressure transducers/data loggers were installed in dug well Frontier-1 and nearby monitoring wells B13-1 and B13-2 completed within the surficial silty sand. The data loggers recorded groundwater levels at specified intervals (one reading every 5 minutes October 15 to 23, 2013 and one reading every 20 to 30 seconds October 23 to November 29, 2013). The data loggers were installed on October 15, 2013 (Frontier-1) and October 23, 2013 (B13-1 and B13-2) and left in place for approximately one month to observe the changes in groundwater levels under typical water supply demands for domestic use. The one month monitoring period also allowed for observation of the change in water levels in the monitoring wells and the dug well in response to local precipitation events. The data logger within the dug well also provided information on the time required to recharge the dug well after each use, and the drawdown within the well under typical use. Occasional manual measurements of groundwater levels were taken to verify and supplement the measurements recorded by the data loggers.

12-1125-0045/4500 November 2013
3/6
Groundwater Level Monitoring Program – Pumping Test A pumping test was completed at Boundary-2 on November 5, 2013 to assess the yield and associated radius of influence for a typical dug well completed within the vicinity of the Site. This well was selected for the pumping test because it is not currently in use, so there were no issues related to the interruption of water supply at this location. The pumping test was approximately 460 minutes in duration and involved a two-step process to (1) initially lower the water level in the dug well and adjacent storage area, and (2) maintain a target constant drawdown of approximately 2.5 metres. Dug well Boundary-2 was initially pumped at 20 litres per minute (L/min) for 100 minutes to a target drawdown (2.45 metres). The pumping rate was reduced to 4 L/min for a duration of 360 minutes in order to maintain a constant level of drawdown in the dug well. The drawdown and recovery was measured in the pumping well and in the monitoring wells completed within the shallow overburden consisting of fill and silty sand (B13-3, B13-4, B13-4, B13-6, B13-8, B13-9 and B13-10) and within a 0.5 metre thick silty layer encountered at a depth of approximately 5.6 metres below ground surface (B13-5 and B13-7). Groundwater levels were collected manually and using data loggers recording groundwater levels at 30 second intervals. The data loggers continued recording groundwater levels in the pumping well and monitoring wells at the end of the 460 minute pumping test for the duration of the recovery period, approximately 2.7 days.
Data Analysis Groundwater Level Monitoring Program – Typical Use
Groundwater levels measured within the shallow overburden during the typical operation of a dug well (Frontier-1) between October 15, 2013 and November 29, 2013 are presented in Figure 2 (data logger data, occasional manual readings and precipitation data). Manual groundwater levels measured throughout the program are presented in Table 1.
Table 1: Manual Groundwater Level Measurements Observed During Typical Use
Date Groundwater Levels (mbgs)
Frontier-1 B13-1 B13-2
October 23, 2013 0.32 0.66 0.43
October 29, 2013 0.37 0.67 0.43
November 5, 2013 0.31 0.64 0.42
November 12, 2013 0.23 0.65 0.36
November 20, 2013 0.30 0.65 0.42
Note: mbgs (metres below ground surface)
The depth below ground surface to the water table shows some variation between the three monitoring locations (Frontier-1, B13-1 and B13-2); however, the observed changes in water levels associated with pumping the dug well and recharge precipitation events are consistent at all three locations (see Figure 2). Household water use is shown on Figure 2 as periodic sharp declines in the depth to groundwater level at dug well Frontier-1. As shown on Figure 2, the water taking at dug well Frontier-1 results in an associated lowering of the water levels in the nearby monitoring wells. However, the decrease in the water level in the monitoring wells is less pronounced. Groundwater levels observed in dug well Frontier-1 ranged from 0.07 to 0.55 mbgs and fluctuated on average 0.13 metres daily with household use. The recovery periods of the groundwater level within the dug well in response to pumping varied according to the duration of water use, and ranged from approximately one to two hours. At a distance of two metres from dug well Frontier-1, the groundwater level in the monitoring wells

12-1125-0045/4500 November 2013
4/6
varied by typically less than five centimetres as a result of water taking for household use. Based on these observations, it is interpreted that the radius of influence associated with the water taking at dug well Frontier-1 would be less than 10 metres around the well.
As shown on Figure 2, peak groundwater levels in all three monitoring locations coincide with precipitation recharge events which occurred on October 17, 19 and 26, 2013 and November 1, 9 and 18, 2013, based on daily precipitation data from the Environment Canada climatic station, Ottawa CDA (6105976). The spikes in groundwater levels associated with precipitation events occurred during or shortly after the precipitation events indicating that recharge for the well occurs locally (i.e., close to the well). The groundwater spikes associated with local precipitation events typically dissipate quickly.
Groundwater Level Monitoring Program – Pumping Test
A two-step pumping test was carried out at dug well Boundary-2 on November 5, 2013. Dug well Boundary-2 was initially pumped at 20 litres per minute (L/min) for 100 minutes to a target drawdown (2.45 metres) in order to dewater the wellbore storage in the dug well. The pumping rate was then reduced to 4 L/min for a duration of 360 minutes in order to maintain a constant level of drawdown in the dug well. After a cumulative 460 minutes of pumping, the final drawdown in dug well Boundary-2 measured 2.54 metres (See Figures 3 and 4). The drawdown and recovery was measured in the pumped well and in the monitoring wells completed within the shallow overburden consisting of fill and silty sand (B13-3, B13-4, B13-4, B13-6, B13-8, B13-9 and B13-10) and in the silty layer (B13-5 and B13-7). Figure 4 presents a cross-section showing the geological conditions encountered in the vicinity of dug well Boundary-2, the locations of the monitoring well installations, the initial groundwater levels prior to starting the pumping test and the final groundwater levels at the end of the pumping test. The water table prior to pumping is flat, which consistent with the groundwater level monitoring completed at the Site. There is a slight downward gradient between the fill/silty sand layer and the silty layer encountered at approximately 5.6 metres below ground surface. Figure 4 shows the symmetrical shape of the drawdown cone associated with the pumping test.
Table 2 below presents a compilation of the achieved drawdowns on November 5, 2013 after 100 minutes of pumping at 20 L/min, followed by 360 minutes of pumping at 4 L/min and percent recovery data collected on November 8, 2013.
Table 2: Drawdown and Water Levels Observed During Boundary-2 Pumping Test
Location Radial
Distance to Pumping Well (m)
Initial Groundwater Level (mbgs)
November 5, 2013 Pumping Duration
= 100 min Pumping Rate
= 20 L/min
November 5, 2013 Pumping Duration
= 360 min (460 min cumulative)
Pumping Rate = 4 L/min
November 8, 2013 Recovery Period
Water Level
(mbgs) Drawdown
(mbgs) Water Level
(mbgs) Drawdown
(mbgs) Water Level
(mbgs) Percent
Recovered
B13-3 8 0.66 0.78 0.12 0.94 0.27 0.71 81
B13-4 5 0.65 0.89 0.24 1.10 0.38 0.70 87
B13-5 3 1.01 1.01 0 1.01 0 0.99 -
B13-6 3 0.67 1.08 0.41 1.34 0.57 0.71 93
Bou-2 0 0.53 2.98 2.45 3.07 2.54 0.66 95

12-1125-0045/4500 November 2013
5/6
Location Radial
Distance to Pumping Well (m)
Initial Groundwater Level (mbgs)
November 5, 2013 Pumping Duration
= 100 min Pumping Rate
= 20 L/min
November 5, 2013 Pumping Duration
= 360 min (460 min cumulative)
Pumping Rate = 4 L/min
November 8, 2013 Recovery Period
Water Level
(mbgs) Drawdown
(mbgs) Water Level
(mbgs) Drawdown
(mbgs) Water Level
(mbgs) Percent
Recovered
B13-7 1 0.97 0.97 0 0.97 0 0.99 -
B13-8 2 0.64 0.96 0.32 1.21 0.67 0.69 93
B13-9 5 0.65 0.78 0.13 1.03 0.45 0.70 89
B13-10 8 0.64 0.73 0.09 0.91 0.28 0.67 89
Note: Bou-2 = Dug Well Boundary-2
Drawdown related to the pumping was observed at all monitoring wells completed within the shallow overburden wells (B13-3, B13-4, B13-6, B13-8, B13-9 and B13-10). No response to pumping was observed at monitoring wells B13-5 and B13-7 completed within the silty layer, situated at approximately 5.6 to 6.2 metres depth. The groundwater level in dug well Boundary-2 recovered by 95 percent approximately 2.7 days following the end of the pumping test, whereas groundwater levels within the shallow overburden wells recovered between 81 and 93 percent as shown in Table 2.
The transmissivity of the surficial silty sand layer was estimated by applying the Papadopulos-Cooper solution to the observed drawdown and recovery data. The following assumptions were made in support of the Papadopulos-Cooper analysis of the aquifer test data:
The surficial silty sand layer is confined, isotropic, homogenous, of uniform thickness and has an infinite areal extent;
Flow to dug well Boundary-2 is horizontal; and,
Dug Well Boundary-2 fully penetrates the shallow overburden aquifer.
Using the Papadopulos-Cooper solution, the transmissivity of the surficial sand layer is estimated to be between 1.3 and 2.6 m2/day. The Papadopulos-Cooper solution accounts for wellbore storage effects in a large-diameter (finite-diameter) pumping well; however, it is intended for a confined aquifer. The silty sand providing water to dug well Boundary-2 is considered unconfined; however, due to the relatively short duration of the pumping test (460 minutes), the unconfined behavior of the aquifer (release of water from storage reducing the rate of drawdown) was not observed. As such, the Papadopulos-Cooper solution provides the best estimate of transmissivity based on the available data. The Papadopulos-Cooper analysis of the pumping test is presented graphically on Figure 5. Assuming a saturated aquifer thickness of 3.7 metres, the hydraulic conductivity of the surficial silty sand within the vicinity of dug well Boundary-2 is approximately 4x10⁻⁶ to 8x10⁻⁶ metres per second.
The Thiem-Jacob distance-drawdown equation was used to estimate the radius of influence of the pumping test. The radius of influence associated with pumping dug well Boundary-2 at 20 L/min for 100 minutes is estimated to be 10 metres (see Figure 6). The radius of influence associated with the combined two-step pumping rate duration of 460 minutes is estimated to be up to 20 metres (see Figure 7).

12-1125-0045/4500 November 2013
6/6
Discussion The surficial silty sand layer is characterized as moderately transmissive based on the estimated hydraulic conductivity and the radius of influence observed during the groundwater level monitoring program at dug well Frontier-1 and the pumping test at dug well Boundary-2. The range in hydraulic conductivity values of the fill/silty sand layer estimated from the pumping test at dug well Boundary-2 are consistent with the results of slug tests completed within the shallow overburden at the Site. Based on water level observations made during precipitation events, it is interpreted that the recharge for dug wells in the vicinity of the Site is local (i.e., close to the well).
The results of the pumping test at dug well Boundary-2 suggest that dug wells completed within the shallow overburden have the ability to sustain a pumping rate of approximately 4 L/min (following the removal of approximately 2,000 Litres of wellbore storage which contributes significantly to the ability of the dug well to provide a water supply). Under typical use, the radius of influence (area of drawdown associated with the water taking) is interpreted to be less than 10 metres. Based on the pumping test at dug well Boundary-2, when the wellbore storage is rapidly removed and the well is pumped for an additional six hours at close to the maximum sustainable rate (i.e., a significantly greater water demand than observed under typical use), the associated radius of influence was approximately 20 metres.
GOLDER ASSOCIATES LTD.
Dale Holtze, M.Sc., P.Geo. Jaime Oxtobee, M.Sc., P.Geo. Hydrogeologist Senior Hydrogeologist, Associate DH/JPAO/sg n:\active\2012\1125 - environmental and civil engineering\12-1125-0045 crrrc ea eastern on\phase 4500_final_easr\vol 3 - g h&g\appendices\appendix m\appendix m - tech memo final.docx
Attachments: Figure 1 – Site Plan Figure 2 – Groundwater Level Monitoring Program at Dug Well Frontier-1, B13-1 and B13-2 Figure 3 – Dug Well Boundary-2 Pumping Test Groundwater Levels Figure 4 – Cross-Section: Dug Well Boundary-2 Pumping Test Figure 5 – Papadopulos-Cooper Pumping Test Analysis Figure 6 – Theim-Jacob Distance Drawdown Plot at T=100 min Figure 7 – Theim-Jacob Distance Drawdown Plot at T=460 min Attachment A – Borehole Records
!>!>
!>!>!>!>!>!>!>!>
`
`
`
`
`
FRONTIER-1
FRONTIER-2
FRONTIER-3
BOUNDARY-2
BOUNDARY-3
BOU
ND
ARY R
D
MITCH OWENS RD
HIGHWAY 417
HIGHWAY 417
CAR
LSBAD LAN
E
BLACKC
REEK R
D
THUNDER RD
FRO
NTIER
RD
DEVINE RD
BLACK CREEK
DD3
REGIMBALD MUNICIPAL DRAIN
75
80
75
75
75
75
75
75
75
75
75
75
DD1
SIMPSON MUNICIPAL DRAIN
DD2
465000
465000
466000
466000
467000
467000
468000
468000
5020
000
5020
000
5021
000
5021
000
5022
000
5022
000 LEGEND
METRES
REV. 0DESIGN
SITE PLAN
FIGURE 1PROJECT No. 12-1125-0045 SCALE AS SHOWN
PROJECT
TITLE
GIS
REVIEW
JPAO NOV. 2013
CHECK
CAPITAL REGION RESOURCE RECOVERY CENTRE
BR NOV. 2013
¬
LAND INFORMATION ONTARIO (LIO) DATA PRODUCED BY GOLDER ASSOCIATES LTD. UNDER LICENCE FROM ONTARIO MINISTRY OF NATURAL RESOURCES, © QUEENS PRINTER 2012.PROJECTION: TRANSVERSE MERCATOR DATUM: NAD 83 COORDINATE SYSTEM: UTM ZONE 18
REFERENCE
Path
: N:\A
ctiv
e\Sp
atia
l_IM
\Mill
er_P
avin
g_Lt
d\C
RR
RC
\GIS
\MXD
s\12
-112
5-00
45\W
orki
ng\P
hase
1100
\121
1250
045-
1100
-1-S
iteP
lan.
mxd
`DUG WELL LOCATION CONSIDERED AS PART OF DUG WELL ASSESSMENT
!> GOLDER DUG WELL ASSESSMENT MONITORING LOCATION
ROAD
CONTOUR LINE, (5m)
SURFACE WATER FEATURE
WATER AREA
PROPERTY BOUNDARY
THIS FIGURE IS TO BE READ IN CONJUNCTION WITH THE ACCOMPANYING GOLDER ASSOCIATES LTD. REPORT.
NOTE
200 0 200100
1:12,000SCALE
!>!>
!>
!>
!>
!>
!>
!>
`
B13-5B13-6
B13-4
B13-3
B13-7B13-8
B13-9
B13-10
BOUNDARY-2
!>
!>
`
B13-1
B13-2
FRONTIER-1
INSET MAP #1
INSET MAP #2
®
1:200SCALE:
SCALE:1:300
®
DH NOV. 2013JPAO NOV. 2013

Groundwater Level Monitoring Program at Dug Well Frontier-1, B13-1 and B13-2
FIGURE 2PROJECT No. 12-1125-0045
NOV 2013NOV 2014JPAO
DHCreated byReviewed by
PROJECT
TITLE
ENVIRONMENTAL ASSESSMENT OF THECAPITAL REGION RESOURCE RECOVERY CENTRE
0
2
4
6
8
10
12
14
16
180.00
0.05
0.10
0.15
0.20
0.25
0.30
0.35
0.40
0.45
0.50
0.55
0.60
0.65
0.70
0.75
0.80
10/15/2013 10/22/2013 10/29/2013 11/5/2013 11/12/2013 11/19/2013 11/26/2013
Precipita
tion (m
m)
Water Level (mbgs)Date (m/d/y)
Precipitation Frontier‐1 Logger Frontier‐1 Manual B13‐1 Logger B13‐1 Manual B13‐2 Logger B13‐2 Manual

Dug Well Boundary-2 Pumping Test Groundwater LevelsFIGURE 3
PROJECT No. 12-1125-0045 NOV 2013NOV 2014JPAO
DHCreated byReviewed by
PROJECT
TITLE
ENVIRONMENTAL ASSESSMENT OF THECAPITAL REGION RESOURCE RECOVERY CENTRE
0.0
0.5
1.0
1.5
2.0
2.5
3.0
3.5
0 400 800 1200 1600 2000 2400 2800 3200 3600 4000 4400Water Level (m
bgs)
Time (min)
Boundary‐2 13‐3 13‐4 13‐513‐6 13‐7 13‐8 13‐913‐10 Start of Pumping at 4 L/min End of Pumping


Papadopulos-Cooper Pumping Test AnalysisFIGURE 5
PROJECT No. 12-1125-0045 NOV 2013NOV 2014JPAO
DHCreated byReviewed by
PROJECT
TITLE
ENVIRONMENTAL ASSESSMENT OF THECAPITAL REGION RESOURCE RECOVERY CENTRE
Dug Well Assessmet
0.001 0.01 0.1 1. 10. 100. 1000. 1.0E+4 1.0E+50.001
0.01
0.1
1.
10.
Time, t/r2 (min/m2)
Dis
plac
emen
t (m
)
Obs. WellsBoundary-2
Aquifer ModelConfined
SolutionPapadopulos-Cooper
ParametersT = 1.293 m2/dayS = 0.004369r(w) = 0.5 mr(c) = 0.5 m
Dug Well Assessmet
0.001 0.01 0.1 1. 10. 100. 1000. 1.0E+4 1.0E+50.001
0.01
0.1
1.
10.
Time, t/r2 (min/m2)
Dis
plac
emen
t (m
)
Obs. WellsBoundary-2B13-3B13-4B13-6B13-8B13-9B13-10
Aquifer ModelConfined
SolutionPapadopulos-Cooper
ParametersT = 2.559 m2/dayS = 0.006358r(w) = 0.5 mr(c) = 0.5 m

0
0.5
1
1.5
2
2.5
3
0.01 0.1 1 10
Drawdo
wn (m
)
Radial Distance to Pumping Well Boundary‐2 (m)
Distance drawdown of monitoring wells north of Boundary‐2 Distance drawdown of monitoring wells south of Boundary‐2
Theim-Jacob Distance Drawdown Plot at T=100 minFIGURE 6
PROJECT No. 12-1125-0045 NOV 2013NOV 2014JPAO
DHCreated byReviewed by
PROJECT
TITLE
ENVIRONMENTAL ASSESSMENT OF THECAPITAL REGION RESOURCE RECOVERY CENTRE
Radius of influence = 10 metres
Boundary-2
B13-6
B13-4B13-8
B13-9B13-3
B13-10

Theim-Jacob Distance Drawdown Plot at T = 460 minFIGURE 7
PROJECT No. 12-1125-0045 NOV 2013NOV 2014JPAO
DHCreated byReviewed by
PROJECT
TITLE
ENVIRONMENTAL ASSESSMENT OF THECAPITAL REGION RESOURCE RECOVERY CENTRE
Radius of influence = 20 m
0.00
0.50
1.00
1.50
2.00
2.50
3.00
0.01 0.1 1 10
Drawdo
wn (m
)
Radial Distance from Pumping Well Boundary‐2 (m)
Distance drawdown of monitoring wells north of Boundary‐2 Distance drawdown of monitoring wells south of Boundary‐2
Boundary-2
B13-6
B13-4B13-8
B13-9B13-3
B13-10