appendix n air quality assessment - mississauga · novus environmental inc. | 150 research lane,...
TRANSCRIPT

Appendix N
Air Quality Assessment
Air Quality | Sound & Vibration | Sustainable Water | Wind & Climate Novus Environmental Inc. | 150 Research Lane, Suite 105, Guelph, Ontario, Canada N1G 4T2
Novus West Inc. | 906 – 12 Avenue SW, Suite 600, Calgary, Alberta, Canada T2R 1K7
Local Air Quality Assessment Mavis Road – Class EA From Courtneypark Drive West to the North City Limit Regional Municipality of Peel, Ontario Novus Reference No. 15-0367 Version No. 2 (FINAL) May 29, 2017
NOVUS PROJECT TEAM:
Engineer: Jenny Vesely, P.Eng. Senior Engineer: Jason Slusarczyk, P. Eng. Project Manager/Specialist: Scott Shayko, Hon. B. Comm., B.Sc.

This page intentionally left blank
for 2-sided printing purposes

Mavis Rd – Courtneypark Drive West to North City Limit May 29, 2017
Novus Environmental | 1
Table of Contents
Introduction ......................................................................................................................... 3
1.1 Study Objectives ....................................................................................................... 3 1.2 Contaminants of Interest .......................................................................................... 4 1.3 Applicable Guidelines .............................................................................................. 5 1.4 General Assessment Methodology ........................................................................... 6
Background Ambient Data .................................................................................................. 7
2.1 Overview .................................................................................................................. 7 2.2 Selection of Relevant Ambient Monitoring Stations ............................................... 8 2.3 Selection of Worst-Case Monitoring Stations ........................................................ 10 2.4 Detailed Analysis of Selected Worst-case Monitoring Stations ............................ 11
Local Air Quality Assessment .......................................................................................... 13
3.1 Overview ................................................................................................................ 13 3.2 Location of Sensitive Receptors within the Study Area ......................................... 13 3.3 Road Traffic Data ................................................................................................... 16 3.4 Meteorological Data ............................................................................................... 18 3.5 Motor Vehicle Emission Rates ............................................................................... 19 3.6 Re-suspended Particulate Matter Emission Rates .................................................. 21 3.7 Air Dispersion Modelling Using CAL3QHCR ...................................................... 22 3.8 Modelling Results ................................................................................................... 23
Greenhouse Gas Assessment ............................................................................................. 34 Air Quality Impacts During Construction ......................................................................... 36 Conclusions and Recommendations ................................................................................. 37 References ......................................................................................................................... 39
List of Tables
Table 1: Contaminants of Interest ................................................................................................. 5 Table 2: Applicable Contaminant Guidelines ............................................................................... 6 Table 3: Relevant MOECC and NAPS Station Information ........................................................ 9 Table 4: Comparison and Selection of Background Concentrations .......................................... 11 Table 5: 2015 Traffic Volumes (AADT) Used in the Assessment ............................................. 16 Table 6: 2041 Traffic Volumes (AADT) Used in the Assessment ............................................. 17 Table 7: Hourly Vehicle Distribution ......................................................................................... 18 Table 8: MOVES Input Parameters ............................................................................................ 20 Table 9: MOVES Output Emission Factors for Roadway Vehicles (g/VMT); Idle
Emission Rates are grams per vehicle hour .............................................................. 21 Table 10: Re-suspended Particulate Matter Emission Factors ................................................... 22 Table 11: CAL3QHCR Model Input Parameters ........................................................................ 23
Mavis Rd – Courtneypark Drive West to North City Limit May 29, 2017
Novus Environmental | 2
Table 12: Worst-Case Sensitive Receptors for 2041 Future Build Scenario .............................. 24 Table 13: Summary of Predicted NO2 Concentrations ............................................................... 25 Table 14: Summary of Predicted CO Concentrations ................................................................. 26 Table 15: Summary of Predicted PM2.5 Concentrations ............................................................. 27 Table 16: Summary of Predicted PM10 Concentrations .............................................................. 28 Table 17: Summary of Predicted TSP Concentrations ............................................................... 29 Table 18: Summary of Predicted Acetaldehyde Concentrations ................................................ 30 Table 19: Summary of Predicted Acrolein Concentrations ........................................................ 31 Table 20: Summary of Predicted Benzene Concentrations ........................................................ 32 Table 21: Summary of Predicted 1,3-Butadiene Concentrations ................................................ 33 Table 22: Summary of Predicted Formaldehyde Concentrations ............................................... 34 Table 23: Summary of Mavis Road Traffic Volumes, Roadway Length and Emission
Rates .......................................................................................................................... 35 Table 24: Predicted GHG Emissions .......................................................................................... 36 Table 25: Summary of 2041 Future Build Results ..................................................................... 38
List of Figures
Figure 1: Study Area Showing the Proposed Roadway Widening (Shown in Orange) ............... 3 Figure 2: Motor Vehicle Emission Sources .................................................................................. 4 Figure 3: Effect of Trans-Boundary Air Pollution (MOECC, 2005) ............................................ 7 Figure 4: Typical Wind Direction during an Ontario Smog Episode ........................................... 8 Figure 5: Relevant MOECC (shown in red) and NAPS (shown in green) Monitoring
Stations; Windsor NAPS Station Not Shown; Study Area in Orange ........................ 9 Figure 6: Summary of Background Conditions .......................................................................... 12 Figure 7: Receptors R1-R16 Locations Within the Study Area (Courtneypark Drive
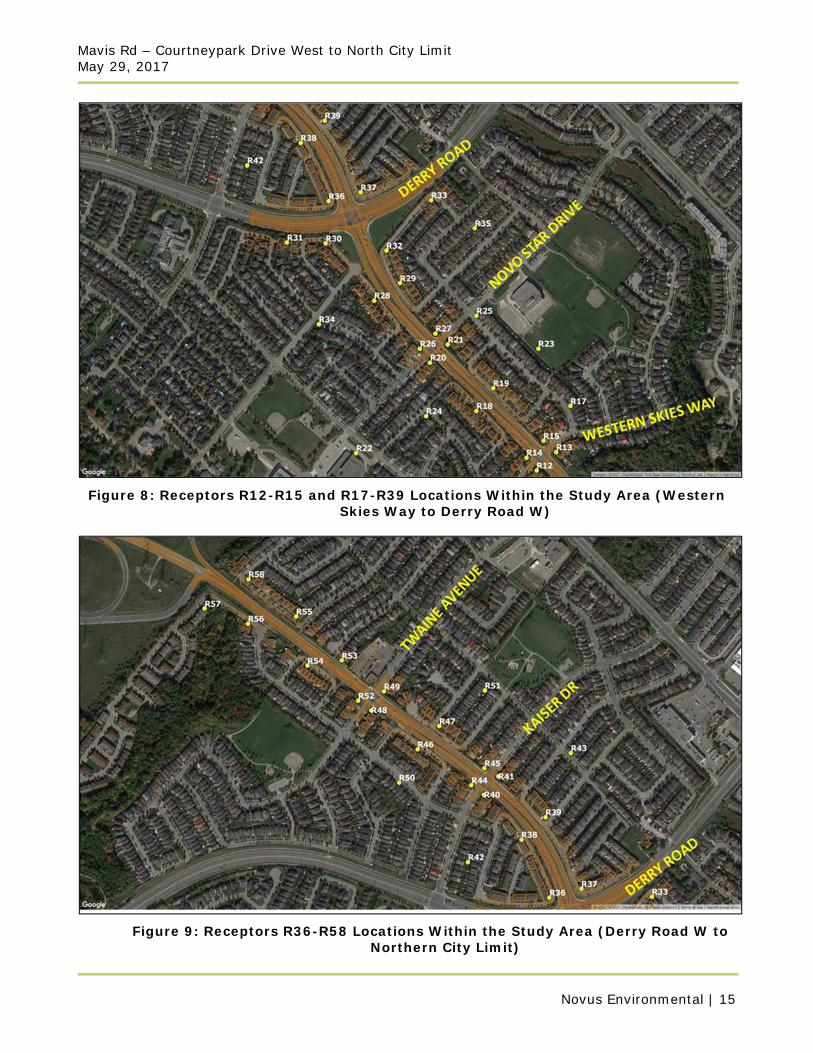
West to Western Skies Way) .................................................................................... 14 Figure 8: Receptors R12-R15 and R17-R39 Locations Within the Study Area (Western
Skies Way to Derry Road W) ................................................................................... 15 Figure 9: Receptors R36-R58 Locations Within the Study Area (Derry Road W to
Northern City Limit) ................................................................................................. 15 Figure 10: Wind Frequency Diagram for Toronto Pearson International Airport (2011-
2015) ......................................................................................................................... 19
Mavis Rd – Courtneypark Drive West to North City Limit May 29, 2017
Novus Environmental | 3
Introduction
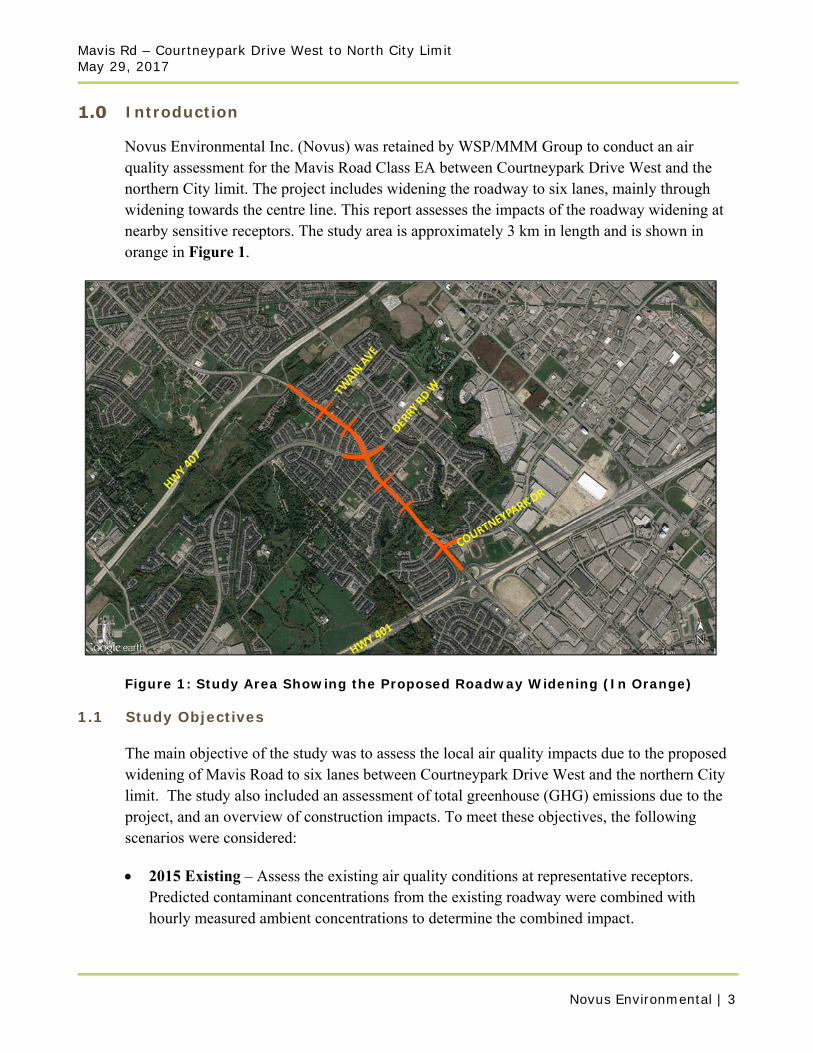
Novus Environmental Inc. (Novus) was retained by WSP/MMM Group to conduct an air quality assessment for the Mavis Road Class EA between Courtneypark Drive West and the northern City limit. The project includes widening the roadway to six lanes, mainly through widening towards the centre line. This report assesses the impacts of the roadway widening at nearby sensitive receptors. The study area is approximately 3 km in length and is shown in orange in Figure 1.
Figure 1: Study Area Showing the Proposed Roadway Widening (In Orange)
1.1 Study Objectives
The main objective of the study was to assess the local air quality impacts due to the proposed widening of Mavis Road to six lanes between Courtneypark Drive West and the northern City limit. The study also included an assessment of total greenhouse (GHG) emissions due to the project, and an overview of construction impacts. To meet these objectives, the following scenarios were considered:
2015 Existing – Assess the existing air quality conditions at representative receptors. Predicted contaminant concentrations from the existing roadway were combined with hourly measured ambient concentrations to determine the combined impact.
Mavis Rd – Courtneypark Drive West to North City Limit May 29, 2017
Novus Environmental | 4
2041 Future Build – Assess the future air quality conditions for the proposed roadway improvements. Predicted contaminant concentrations from the proposed roadway improvements were combined with hourly measured ambient concentrations to determine the combined impact.
1.2 Contaminants of Interest
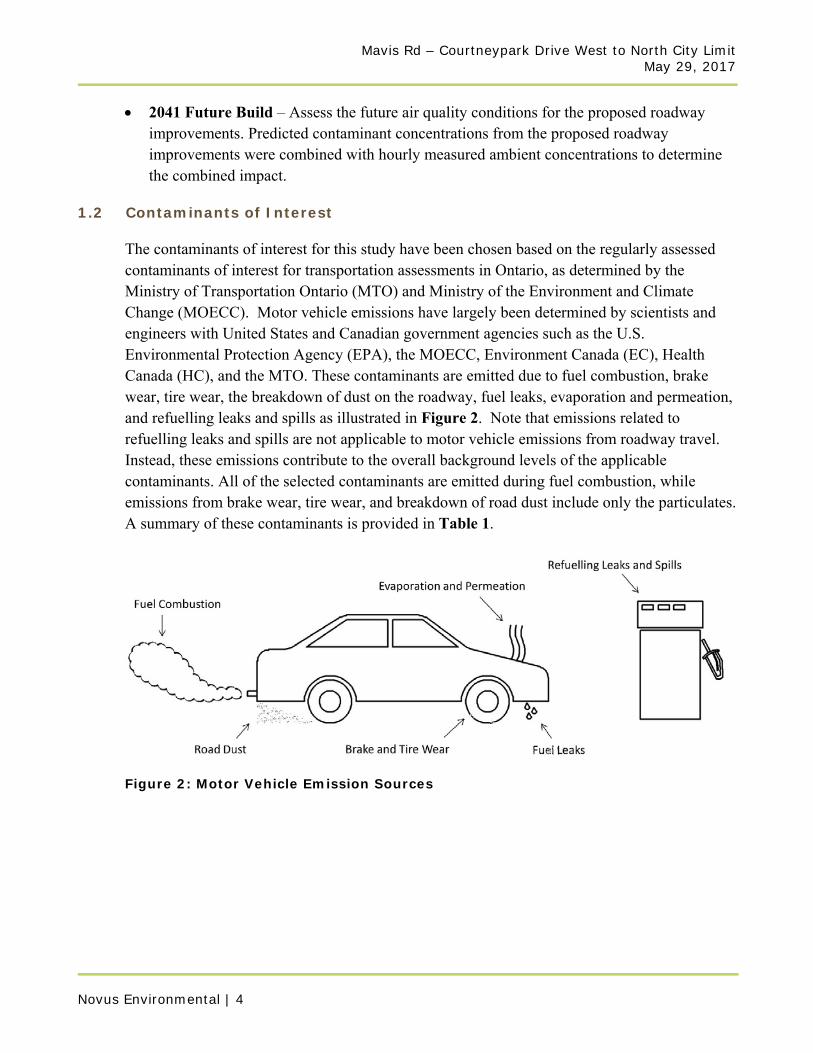
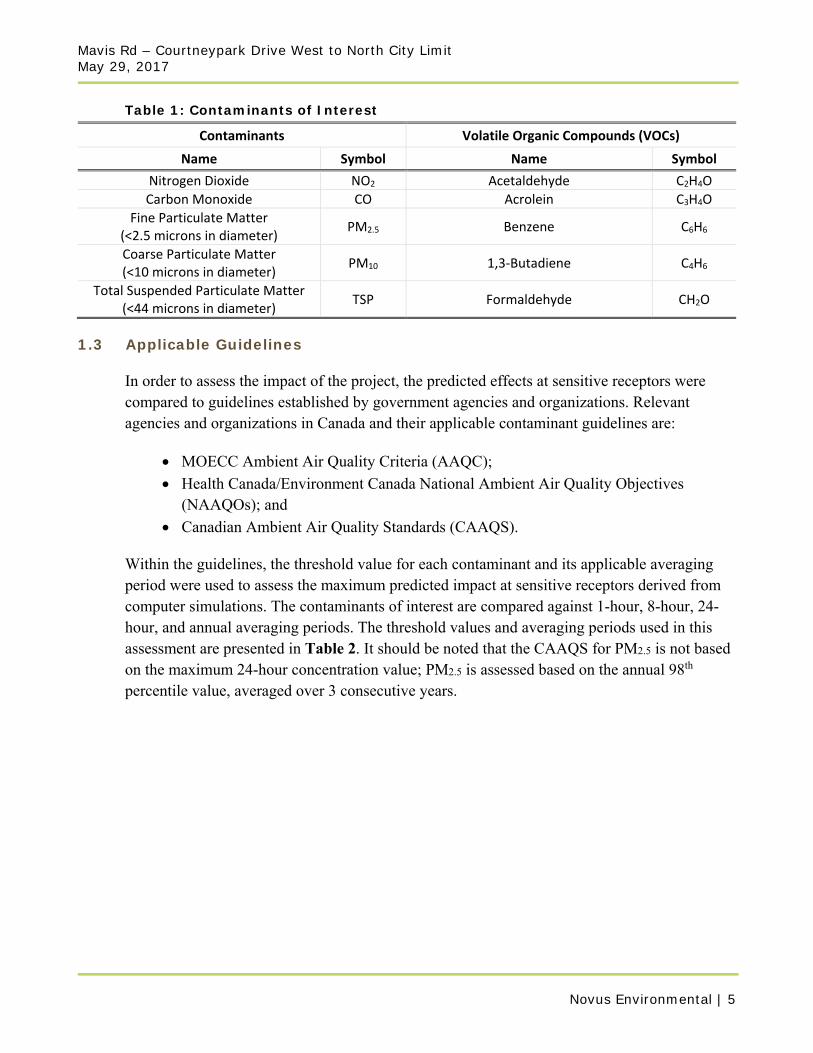
The contaminants of interest for this study have been chosen based on the regularly assessed contaminants of interest for transportation assessments in Ontario, as determined by the Ministry of Transportation Ontario (MTO) and Ministry of the Environment and Climate Change (MOECC). Motor vehicle emissions have largely been determined by scientists and engineers with United States and Canadian government agencies such as the U.S. Environmental Protection Agency (EPA), the MOECC, Environment Canada (EC), Health Canada (HC), and the MTO. These contaminants are emitted due to fuel combustion, brake wear, tire wear, the breakdown of dust on the roadway, fuel leaks, evaporation and permeation, and refuelling leaks and spills as illustrated in Figure 2. Note that emissions related to refuelling leaks and spills are not applicable to motor vehicle emissions from roadway travel. Instead, these emissions contribute to the overall background levels of the applicable contaminants. All of the selected contaminants are emitted during fuel combustion, while emissions from brake wear, tire wear, and breakdown of road dust include only the particulates. A summary of these contaminants is provided in Table 1.
Figure 2: Motor Vehicle Emission Sources
Mavis Rd – Courtneypark Drive West to North City Limit May 29, 2017
Novus Environmental | 5
Table 1: Contaminants of Interest
Contaminants Volatile Organic Compounds (VOCs)
Name Symbol Name Symbol
Nitrogen Dioxide NO2 Acetaldehyde C2H4O
Carbon Monoxide CO Acrolein C3H4O
Fine Particulate Matter (<2.5 microns in diameter)
PM2.5 Benzene C6H6
Coarse Particulate Matter (<10 microns in diameter)
PM10 1,3‐Butadiene C4H6
Total Suspended Particulate Matter (<44 microns in diameter)
TSP Formaldehyde CH2O
1.3 Applicable Guidelines
In order to assess the impact of the project, the predicted effects at sensitive receptors were compared to guidelines established by government agencies and organizations. Relevant agencies and organizations in Canada and their applicable contaminant guidelines are:
MOECC Ambient Air Quality Criteria (AAQC);
Health Canada/Environment Canada National Ambient Air Quality Objectives (NAAQOs); and
Canadian Ambient Air Quality Standards (CAAQS).
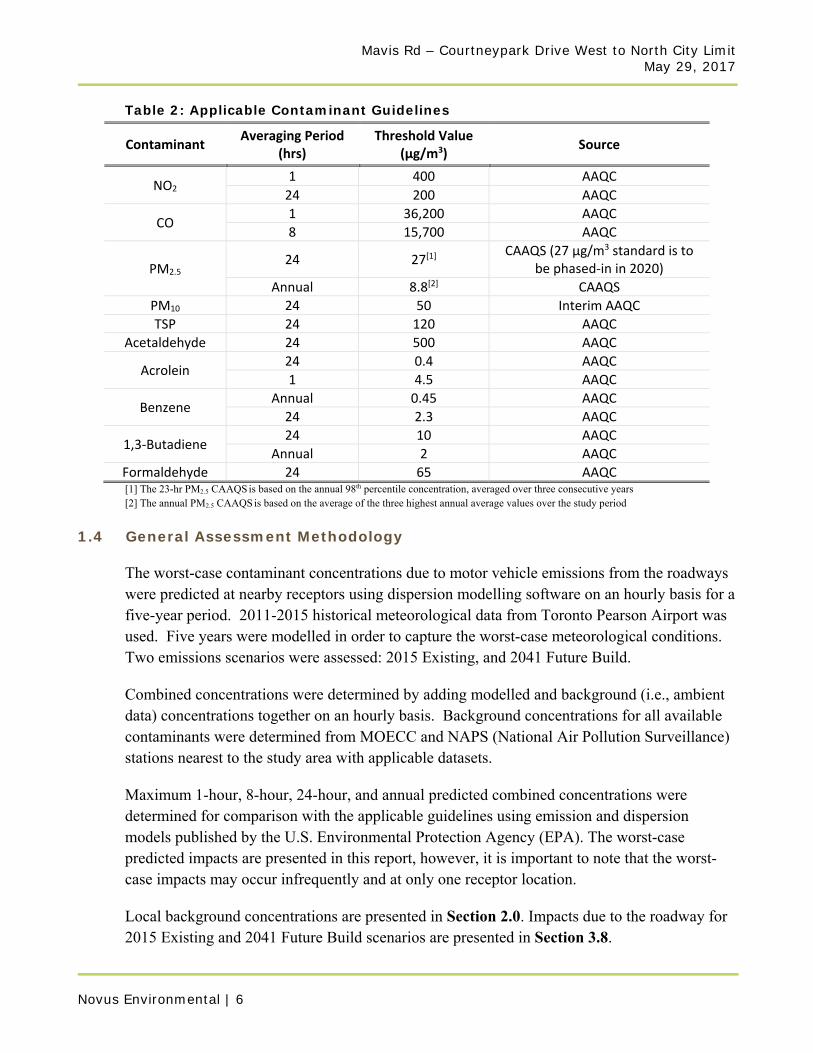
Within the guidelines, the threshold value for each contaminant and its applicable averaging period were used to assess the maximum predicted impact at sensitive receptors derived from computer simulations. The contaminants of interest are compared against 1-hour, 8-hour, 24-hour, and annual averaging periods. The threshold values and averaging periods used in this assessment are presented in Table 2. It should be noted that the CAAQS for PM2.5 is not based on the maximum 24-hour concentration value; PM2.5 is assessed based on the annual 98th percentile value, averaged over 3 consecutive years.
Mavis Rd – Courtneypark Drive West to North City Limit May 29, 2017
Novus Environmental | 6
Table 2: Applicable Contaminant Guidelines
Contaminant Averaging Period
(hrs) Threshold Value
(µg/m3) Source
NO2 1 400 AAQC
24 200 AAQC
CO 1 36,200 AAQC
8 15,700 AAQC
PM2.5 24 27[1]
CAAQS (27 µg/m3 standard is to be phased‐in in 2020)
Annual 8.8[2] CAAQS
PM10 24 50 Interim AAQC
TSP 24 120 AAQC
Acetaldehyde 24 500 AAQC
Acrolein 24 0.4 AAQC
1 4.5 AAQC
Benzene Annual 0.45 AAQC
24 2.3 AAQC
1,3‐Butadiene 24 10 AAQC
Annual 2 AAQC
Formaldehyde 24 65 AAQC [1] The 23-hr PM2.5 CAAQS is based on the annual 98th percentile concentration, averaged over three consecutive years [2] The annual PM2.5 CAAQS is based on the average of the three highest annual average values over the study period
1.4 General Assessment Methodology
The worst-case contaminant concentrations due to motor vehicle emissions from the roadways were predicted at nearby receptors using dispersion modelling software on an hourly basis for a five-year period. 2011-2015 historical meteorological data from Toronto Pearson Airport was used. Five years were modelled in order to capture the worst-case meteorological conditions. Two emissions scenarios were assessed: 2015 Existing, and 2041 Future Build.
Combined concentrations were determined by adding modelled and background (i.e., ambient data) concentrations together on an hourly basis. Background concentrations for all available contaminants were determined from MOECC and NAPS (National Air Pollution Surveillance) stations nearest to the study area with applicable datasets.
Maximum 1-hour, 8-hour, 24-hour, and annual predicted combined concentrations were determined for comparison with the applicable guidelines using emission and dispersion models published by the U.S. Environmental Protection Agency (EPA). The worst-case predicted impacts are presented in this report, however, it is important to note that the worst-case impacts may occur infrequently and at only one receptor location.
Local background concentrations are presented in Section 2.0. Impacts due to the roadway for 2015 Existing and 2041 Future Build scenarios are presented in Section 3.8.
Mavis Rd – Courtneypark Drive West to North City Limit May 29, 2017
Novus Environmental | 7
Background Ambient Data
2.1 Overview
Background (ambient) conditions are measured contaminant concentrations that are independent of emissions from the proposed project infrastructure. These concentrations consist of trans-boundary (macro-scale), regional (meso-scale), and local (micro-scale) emission sources and result from both primary and secondary formation. Primary contaminants are emitted directly by the source and secondary contaminants are formed by complex chemical reactions in the atmosphere. Secondary pollution is generally formed over great distances in the presence of sunlight and heat and most noticeably results in the formation of fine particulate matter (PM2.5) and ground-level ozone (O3), also considered smog.
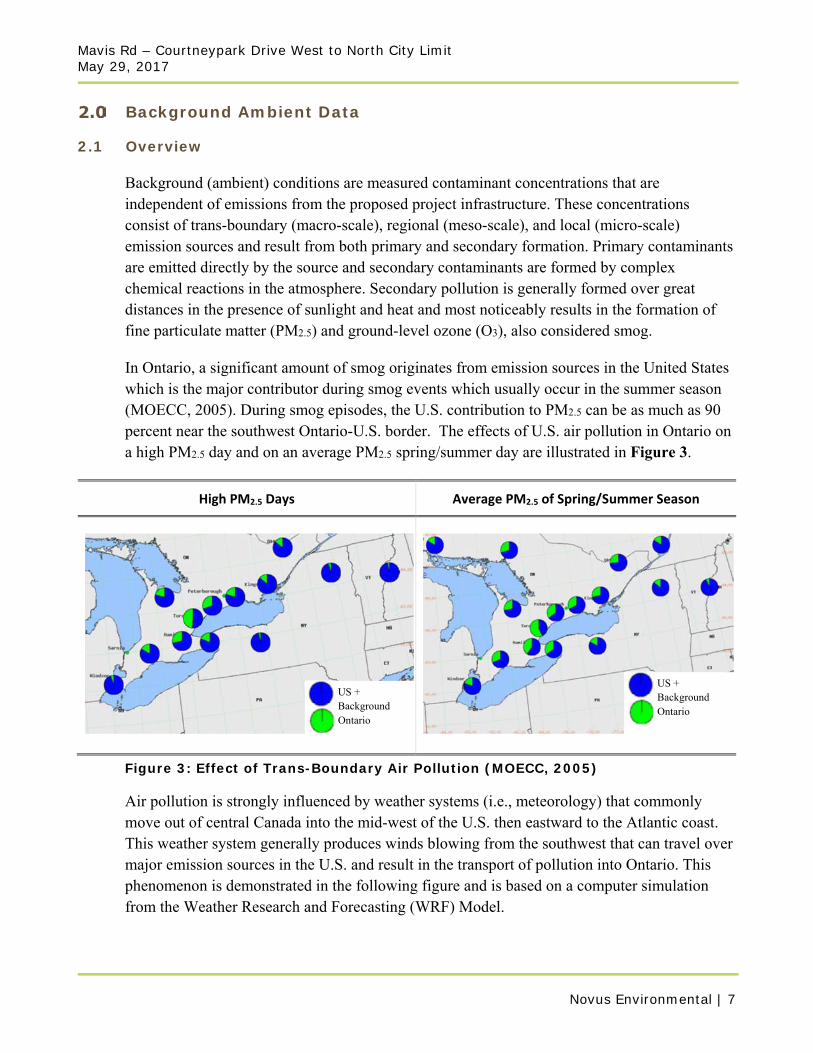
In Ontario, a significant amount of smog originates from emission sources in the United States which is the major contributor during smog events which usually occur in the summer season (MOECC, 2005). During smog episodes, the U.S. contribution to PM2.5 can be as much as 90 percent near the southwest Ontario-U.S. border. The effects of U.S. air pollution in Ontario on a high PM2.5 day and on an average PM2.5 spring/summer day are illustrated in Figure 3.
High PM2.5 Days Average PM2.5 of Spring/Summer Season
Figure 3: Effect of Trans-Boundary Air Pollution (MOECC, 2005)
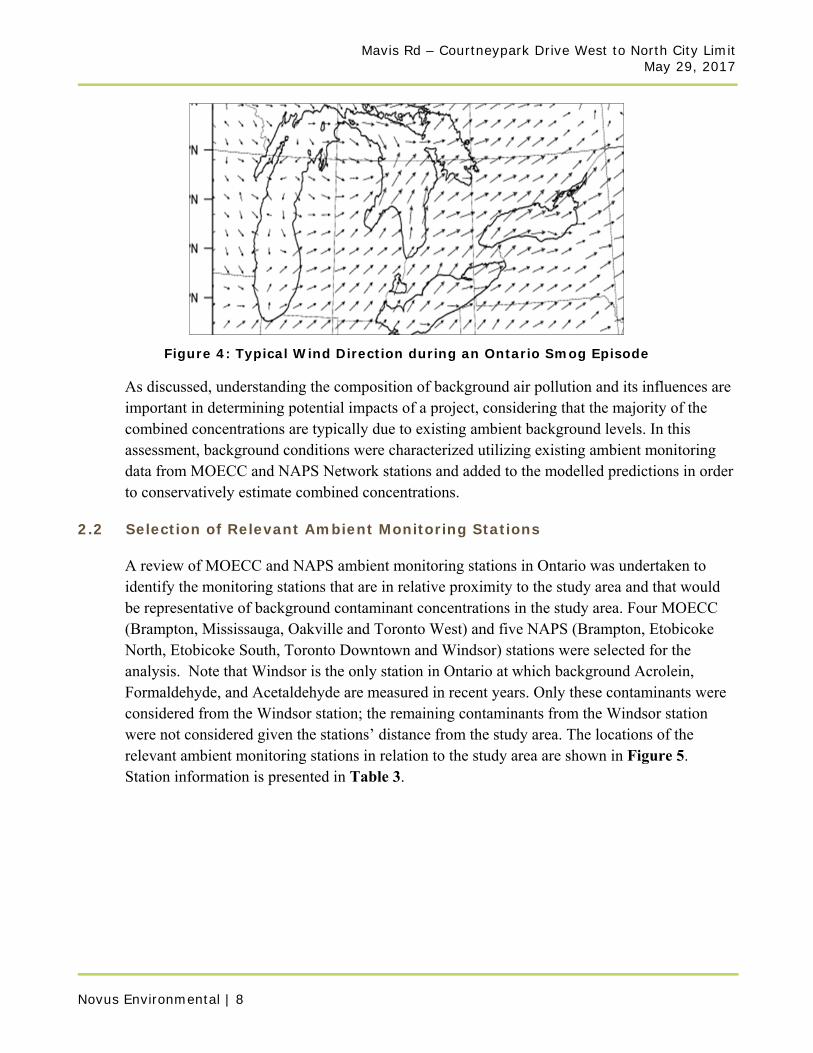
Air pollution is strongly influenced by weather systems (i.e., meteorology) that commonly move out of central Canada into the mid-west of the U.S. then eastward to the Atlantic coast. This weather system generally produces winds blowing from the southwest that can travel over major emission sources in the U.S. and result in the transport of pollution into Ontario. This phenomenon is demonstrated in the following figure and is based on a computer simulation from the Weather Research and Forecasting (WRF) Model.
US + Background Ontario
US + Background Ontario
Mavis Rd – Courtneypark Drive West to North City Limit May 29, 2017
Novus Environmental | 8
Figure 4: Typical Wind Direction during an Ontario Smog Episode
As discussed, understanding the composition of background air pollution and its influences are important in determining potential impacts of a project, considering that the majority of the combined concentrations are typically due to existing ambient background levels. In this assessment, background conditions were characterized utilizing existing ambient monitoring data from MOECC and NAPS Network stations and added to the modelled predictions in order to conservatively estimate combined concentrations.
2.2 Selection of Relevant Ambient Monitoring Stations
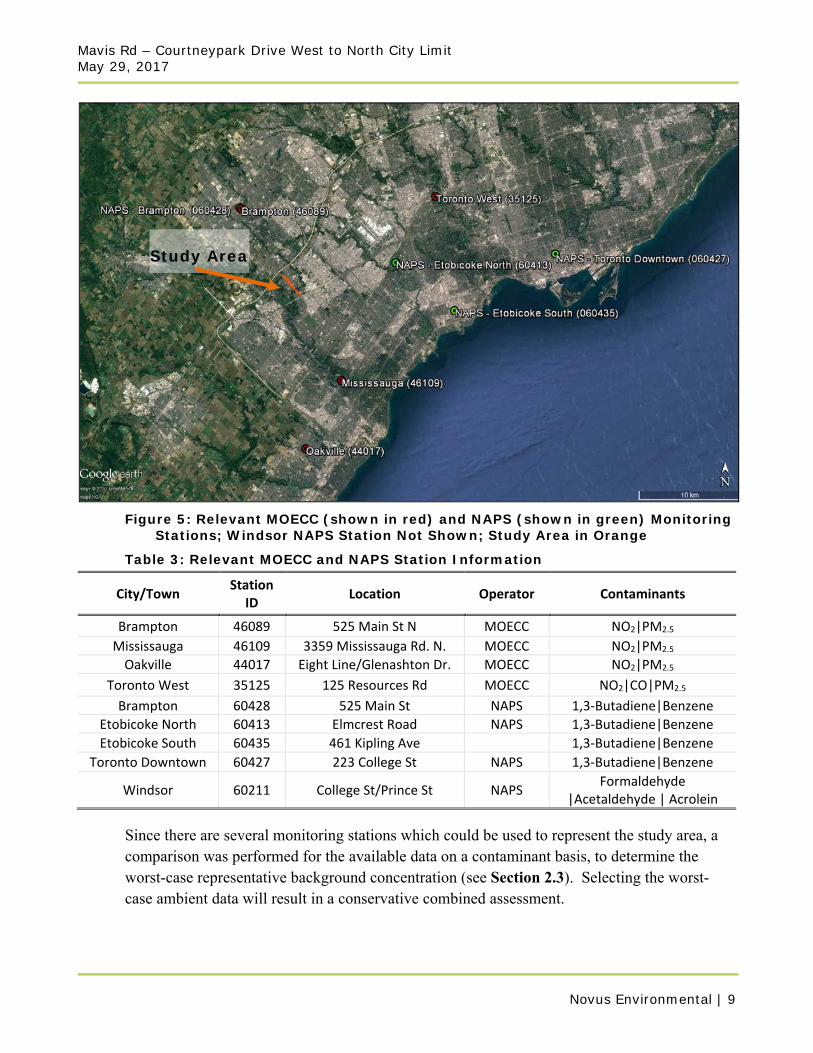
A review of MOECC and NAPS ambient monitoring stations in Ontario was undertaken to identify the monitoring stations that are in relative proximity to the study area and that would be representative of background contaminant concentrations in the study area. Four MOECC (Brampton, Mississauga, Oakville and Toronto West) and five NAPS (Brampton, Etobicoke North, Etobicoke South, Toronto Downtown and Windsor) stations were selected for the analysis. Note that Windsor is the only station in Ontario at which background Acrolein, Formaldehyde, and Acetaldehyde are measured in recent years. Only these contaminants were considered from the Windsor station; the remaining contaminants from the Windsor station were not considered given the stations’ distance from the study area. The locations of the relevant ambient monitoring stations in relation to the study area are shown in Figure 5. Station information is presented in Table 3.
Mavis Rd – Courtneypark Drive West to North City Limit May 29, 2017
Novus Environmental | 9
Figure 5: Relevant MOECC (shown in red) and NAPS (shown in green) Monitoring
Stations; Windsor NAPS Station Not Shown; Study Area in Orange
Table 3: Relevant MOECC and NAPS Station Information
City/Town Station
ID Location Operator Contaminants
Brampton 46089 525 Main St N MOECC NO2|PM2.5
Mississauga 46109 3359 Mississauga Rd. N. MOECC NO2|PM2.5
Oakville 44017 Eight Line/Glenashton Dr. MOECC NO2|PM2.5
Toronto West 35125 125 Resources Rd MOECC NO2|CO|PM2.5
Brampton 60428 525 Main St NAPS 1,3‐Butadiene|Benzene
Etobicoke North 60413 Elmcrest Road NAPS 1,3‐Butadiene|Benzene
Etobicoke South 60435 461 Kipling Ave 1,3‐Butadiene|Benzene
Toronto Downtown 60427 223 College St NAPS 1,3‐Butadiene|Benzene
Windsor 60211 College St/Prince St NAPS Formaldehyde
|Acetaldehyde | Acrolein
Since there are several monitoring stations which could be used to represent the study area, a comparison was performed for the available data on a contaminant basis, to determine the worst-case representative background concentration (see Section 2.3). Selecting the worst-case ambient data will result in a conservative combined assessment.
Study Area

Mavis Rd – Courtneypark Drive West to North City Limit May 29, 2017
Novus Environmental | 10
2.3 Selection of Worst-Case Monitoring Stations
Year 2011 to 2015 hourly ambient monitoring data from the selected stations were statistically summarized for the desired averaging periods: 1-hour, 8-hour, 24-hour, and annual. Note that VOC monitoring data for 2015 is not yet publicly available. 2010-2014 data was used for benzene and 1,3-butadiene. Formaldehyde, acetaldehyde and acrolein are only recently measured at the Windsor station, and were not measured in 2014. Therefore 2009-2013 data was used for these VOCs. For consistency with the combined effects analysis (using 2011-2015 meteorological data to predict roadway concentrations), the actual date of measured VOC data within 2011-2015 was used when possible.
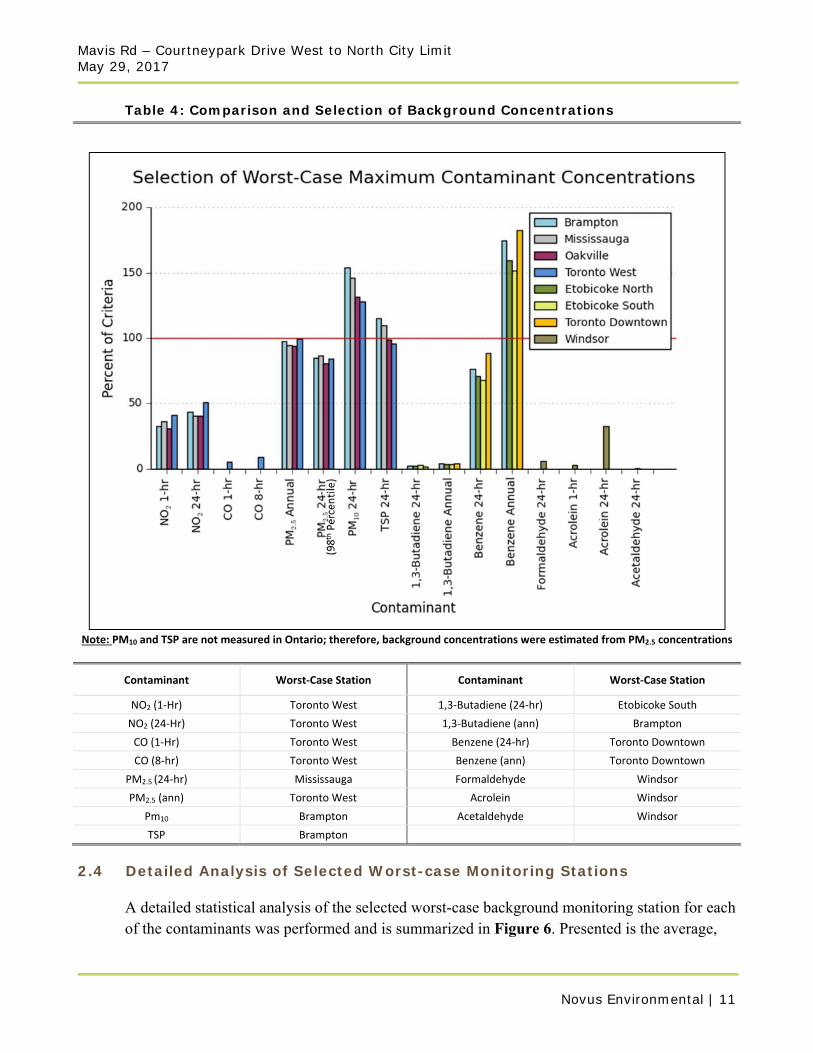
The station with the highest maximum value over the five-year period for each contaminant and averaging period was selected to represent background concentrations in the study area. The maximum concentration represents an absolute worst-case background scenario. Note that PM10 and TSP are not measured in Ontario; therefore, background concentrations were estimated by applying a PM2.5/PM10 ratio of 0.54 and a PM2.5/TSP ratio of 0.3 (Lall et al., 2004). Ambient VOC data is not monitored hourly, but is typically measured every six days. To combine this dataset with the hourly modelled concentrations, each measured six-day value was applied to all hours between measurement dates, when there were 6 days between measurements. When there was greater than 6 days between measurements, the 90th percentile measured value for the year in question was applied for those days in order to determine combined concentrations. This method is conservative as it applies the 10th percentile highest concentrations whenever data was not available.
Following the above methodology, the worst-case concentrations for each contaminant and averaging period were summarized for each of the selected monitoring stations. The station with the highest concentration, for each contaminant and averaging period, was selected for the analysis. Table 4 shows a comparison of the contaminant concentrations from each station and the selection of the worst-case station.
Mavis Rd – Courtneypark Drive West to North City Limit May 29, 2017
Novus Environmental | 11
Table 4: Comparison and Selection of Background Concentrations
Note: PM10 and TSP are not measured in Ontario; therefore, background concentrations were estimated from PM2.5 concentrations
Contaminant Worst‐Case Station Contaminant Worst‐Case Station
NO2 (1‐Hr) Toronto West 1,3‐Butadiene (24‐hr) Etobicoke South
NO2 (24‐Hr) Toronto West 1,3‐Butadiene (ann) Brampton
CO (1‐Hr) Toronto West Benzene (24‐hr) Toronto Downtown
CO (8‐hr) Toronto West Benzene (ann) Toronto Downtown
PM2.5 (24‐hr) Mississauga Formaldehyde Windsor
PM2.5 (ann) Toronto West Acrolein Windsor
Pm10 Brampton Acetaldehyde Windsor
TSP Brampton
2.4 Detailed Analysis of Selected Worst-case Monitoring Stations
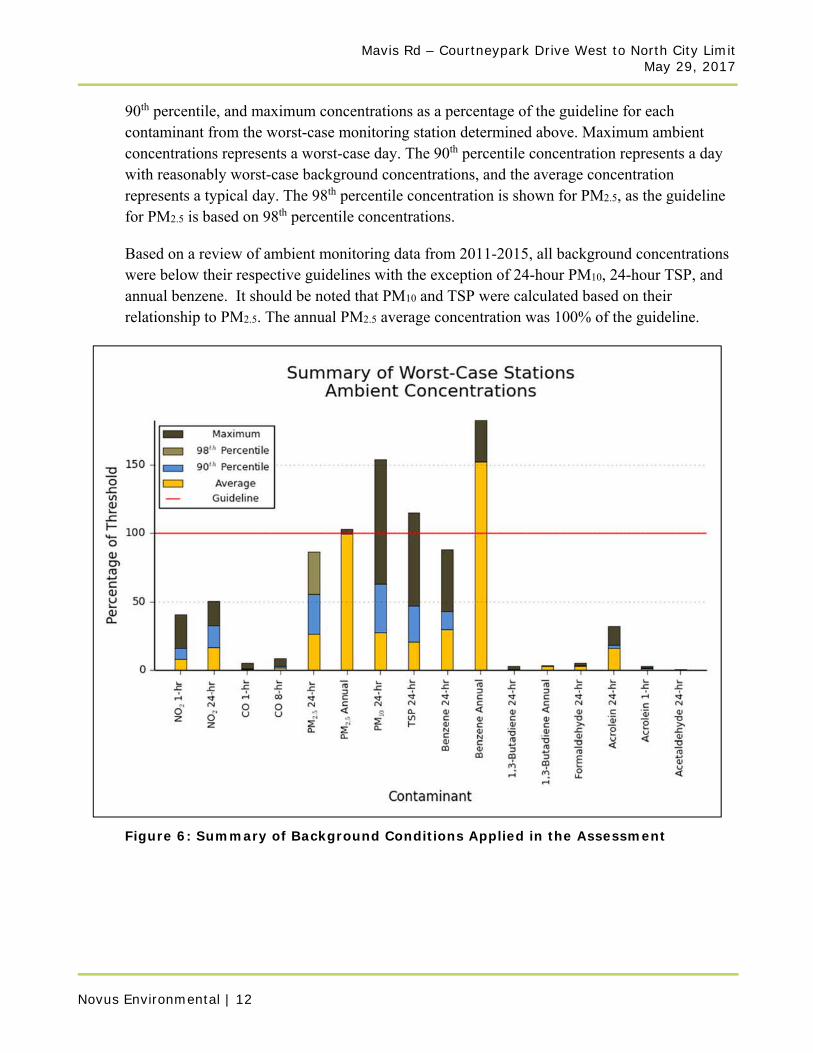
A detailed statistical analysis of the selected worst-case background monitoring station for each of the contaminants was performed and is summarized in Figure 6. Presented is the average,
Mavis Rd – Courtneypark Drive West to North City Limit May 29, 2017
Novus Environmental | 12
90th percentile, and maximum concentrations as a percentage of the guideline for each contaminant from the worst-case monitoring station determined above. Maximum ambient concentrations represents a worst-case day. The 90th percentile concentration represents a day with reasonably worst-case background concentrations, and the average concentration represents a typical day. The 98th percentile concentration is shown for PM2.5, as the guideline for PM2.5 is based on 98th percentile concentrations.
Based on a review of ambient monitoring data from 2011-2015, all background concentrations were below their respective guidelines with the exception of 24-hour PM10, 24-hour TSP, and annual benzene. It should be noted that PM10 and TSP were calculated based on their relationship to PM2.5. The annual PM2.5 average concentration was 100% of the guideline.
Figure 6: Summary of Background Conditions Applied in the Assessment

Mavis Rd – Courtneypark Drive West to North City Limit May 29, 2017
Novus Environmental | 13
Local Air Quality Assessment
3.1 Overview
The worst-case impacts due to roadway vehicle emissions were assessed for two scenarios: 2015 Existing (or No Build/NB) and 2041 Future Build (FB). The two scenarios include the following activities:
2015 Existing (NB): Existing traffic volumes on Mavis Road and arterial roads for the existing
alignment. 2041 Future Build (FB): Projected vehicle volumes on Mavis Road and arterial roads for the proposed
widened alignment.
The assessment was performed using U.S. EPA approved vehicle emission and air dispersion models to predict worst-case impacts at representative sensitive receptor locations. The assessment was conducted in accordance with the MTO Environmental Guide for Assessing and Mitigating the Air Quality Impacts and Greenhouse Gas Emissions of Provincial Transportation Projects. The details of the assessment are discussed below.
3.2 Location of Sensitive Receptors within the Study Area
Land uses which are defined as sensitive receptors for evaluating potential air quality effects are:
Health care facilities;
Senior citizens’ residences or long-term care facilities;
Child care facilities;
Educational facilities;
Places of worship; and
Residential dwellings.
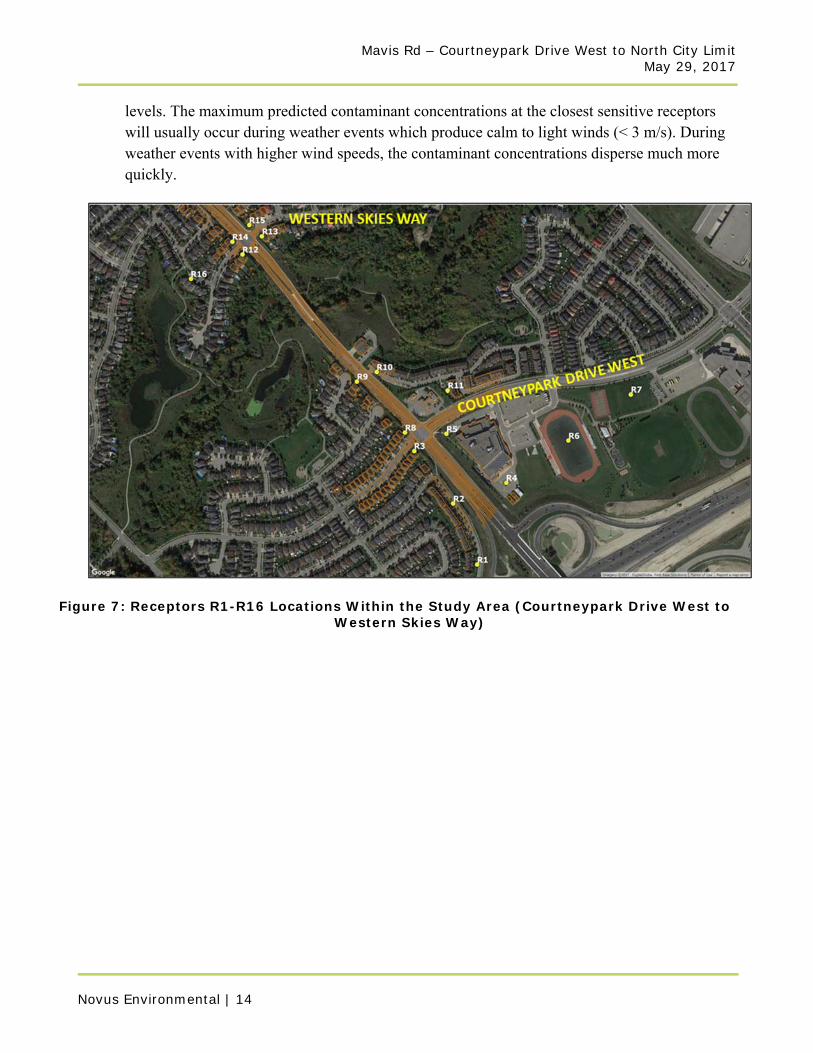
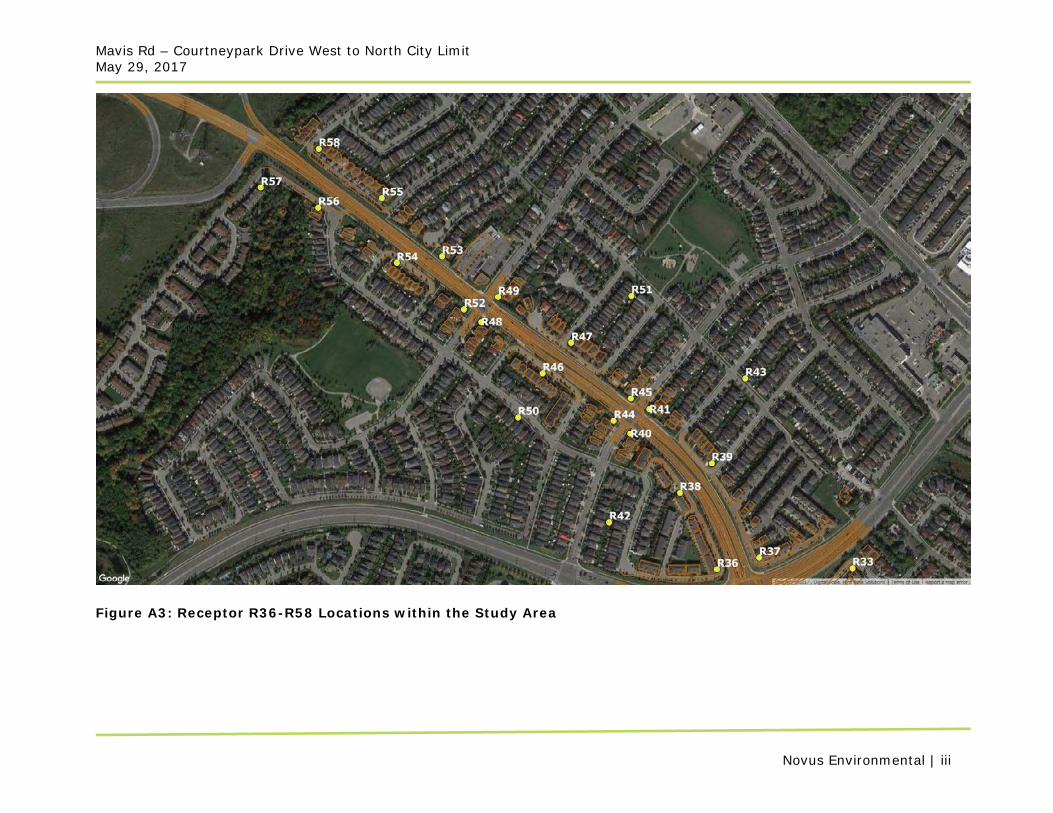
Fifty-eight sensitive receptors were evaluated to represent worst-case impacts surrounding the project area. All receptors represented residential and school locations surrounding the roadway. The receptor locations are identified in Figure 7 through Figure 9.
Representative worst-case impacts were predicted through dispersion modelling at the sensitive receptors closest to the roadway. This is due to the fact that contaminant concentrations disperse significantly with downwind distance from the roadway resulting in reduced contaminant concentrations. At approximately 500 m from the roadway, contaminant concentrations from motor vehicles generally become indistinguishable from background
Mavis Rd – Courtneypark Drive West to North City Limit May 29, 2017
Novus Environmental | 14
levels. The maximum predicted contaminant concentrations at the closest sensitive receptors will usually occur during weather events which produce calm to light winds (< 3 m/s). During weather events with higher wind speeds, the contaminant concentrations disperse much more quickly.
Figure 7: Receptors R1-R16 Locations Within the Study Area (Courtneypark Drive West to Western Skies Way)
Mavis Rd – Courtneypark Drive West to North City Limit May 29, 2017
Novus Environmental | 15
Figure 8: Receptors R12-R15 and R17-R39 Locations Within the Study Area (Western
Skies Way to Derry Road W)
Figure 9: Receptors R36-R58 Locations Within the Study Area (Derry Road W to
Northern City Limit)
Mavis Rd – Courtneypark Drive West to North City Limit May 29, 2017
Novus Environmental | 16
3.3 Road Traffic Data
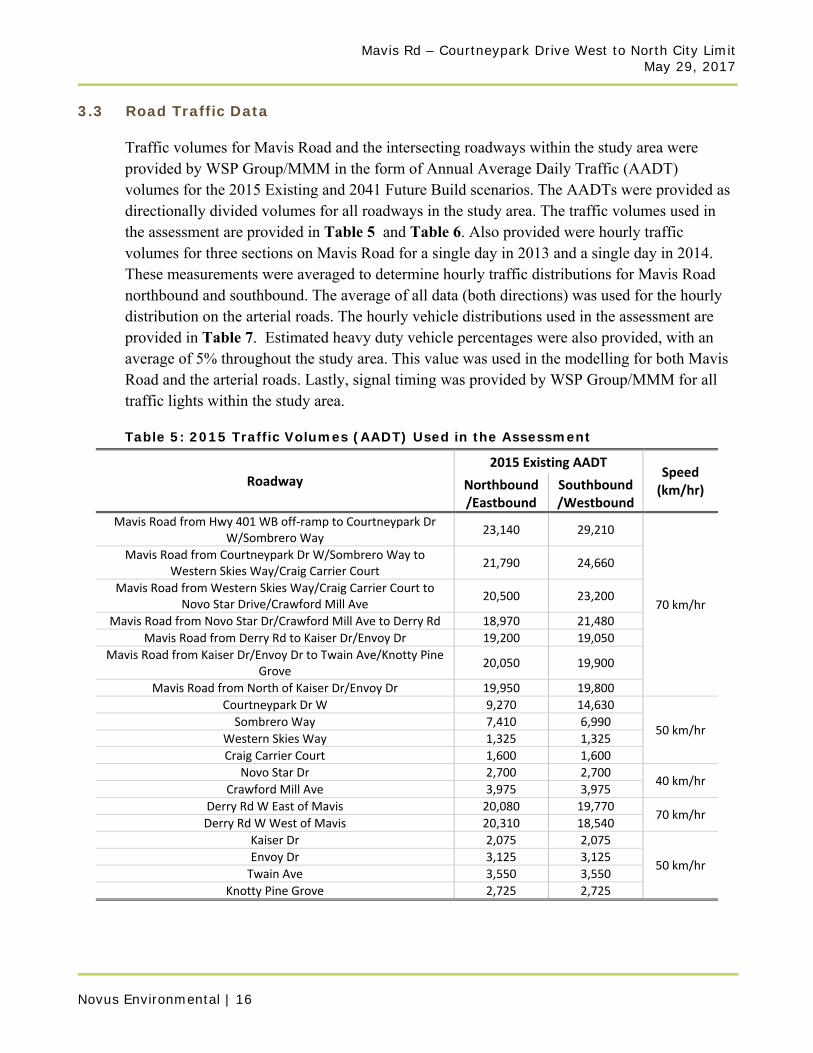
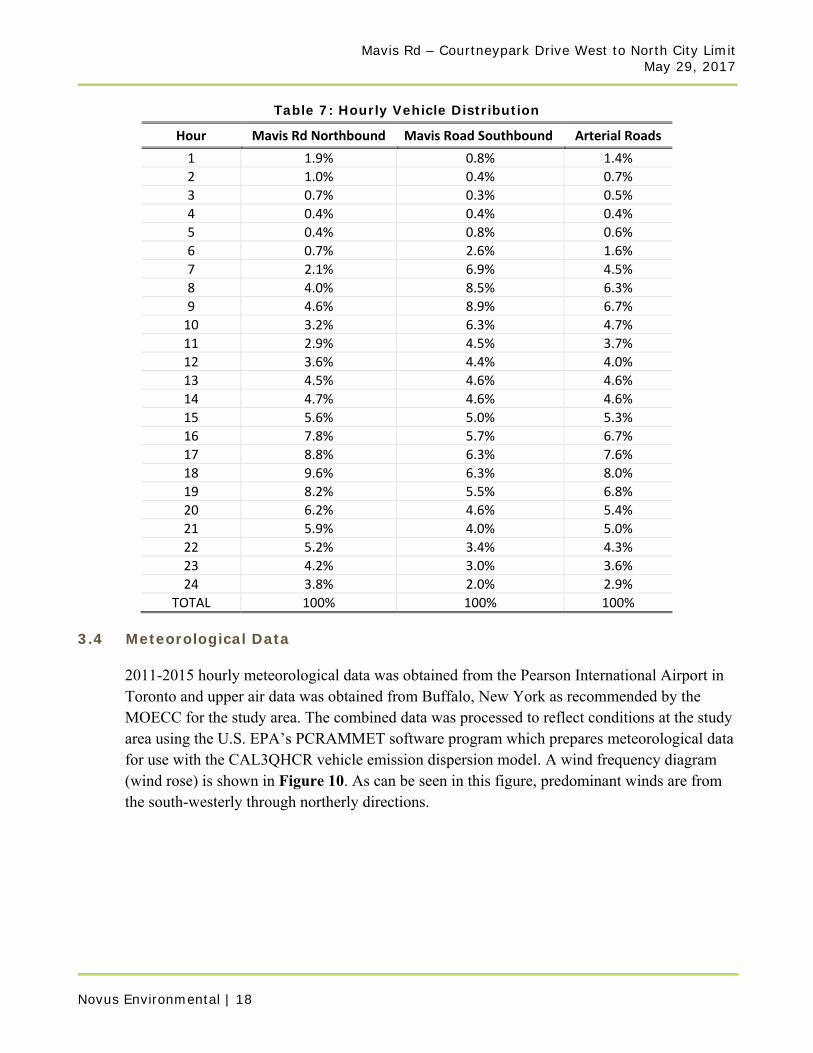
Traffic volumes for Mavis Road and the intersecting roadways within the study area were provided by WSP Group/MMM in the form of Annual Average Daily Traffic (AADT) volumes for the 2015 Existing and 2041 Future Build scenarios. The AADTs were provided as directionally divided volumes for all roadways in the study area. The traffic volumes used in the assessment are provided in Table 5 and Table 6. Also provided were hourly traffic volumes for three sections on Mavis Road for a single day in 2013 and a single day in 2014. These measurements were averaged to determine hourly traffic distributions for Mavis Road northbound and southbound. The average of all data (both directions) was used for the hourly distribution on the arterial roads. The hourly vehicle distributions used in the assessment are provided in Table 7. Estimated heavy duty vehicle percentages were also provided, with an average of 5% throughout the study area. This value was used in the modelling for both Mavis Road and the arterial roads. Lastly, signal timing was provided by WSP Group/MMM for all traffic lights within the study area.
Table 5: 2015 Traffic Volumes (AADT) Used in the Assessment
Roadway
2015 Existing AADT Speed (km/hr) Northbound
/Eastbound Southbound/Westbound
Mavis Road from Hwy 401 WB off‐ramp to Courtneypark Dr W/Sombrero Way
23,140 29,210
70 km/hr
Mavis Road from Courtneypark Dr W/Sombrero Way to Western Skies Way/Craig Carrier Court
21,790 24,660
Mavis Road from Western Skies Way/Craig Carrier Court to Novo Star Drive/Crawford Mill Ave
20,500 23,200
Mavis Road from Novo Star Dr/Crawford Mill Ave to Derry Rd 18,970 21,480
Mavis Road from Derry Rd to Kaiser Dr/Envoy Dr 19,200 19,050
Mavis Road from Kaiser Dr/Envoy Dr to Twain Ave/Knotty Pine Grove
20,050 19,900
Mavis Road from North of Kaiser Dr/Envoy Dr 19,950 19,800
Courtneypark Dr W 9,270 14,630
50 km/hr Sombrero Way 7,410 6,990
Western Skies Way 1,325 1,325
Craig Carrier Court 1,600 1,600
Novo Star Dr 2,700 2,700 40 km/hr
Crawford Mill Ave 3,975 3,975
Derry Rd W East of Mavis 20,080 19,770 70 km/hr
Derry Rd W West of Mavis 20,310 18,540
Kaiser Dr 2,075 2,075
50 km/hr Envoy Dr 3,125 3,125
Twain Ave 3,550 3,550
Knotty Pine Grove 2,725 2,725
Mavis Rd – Courtneypark Drive West to North City Limit May 29, 2017
Novus Environmental | 17
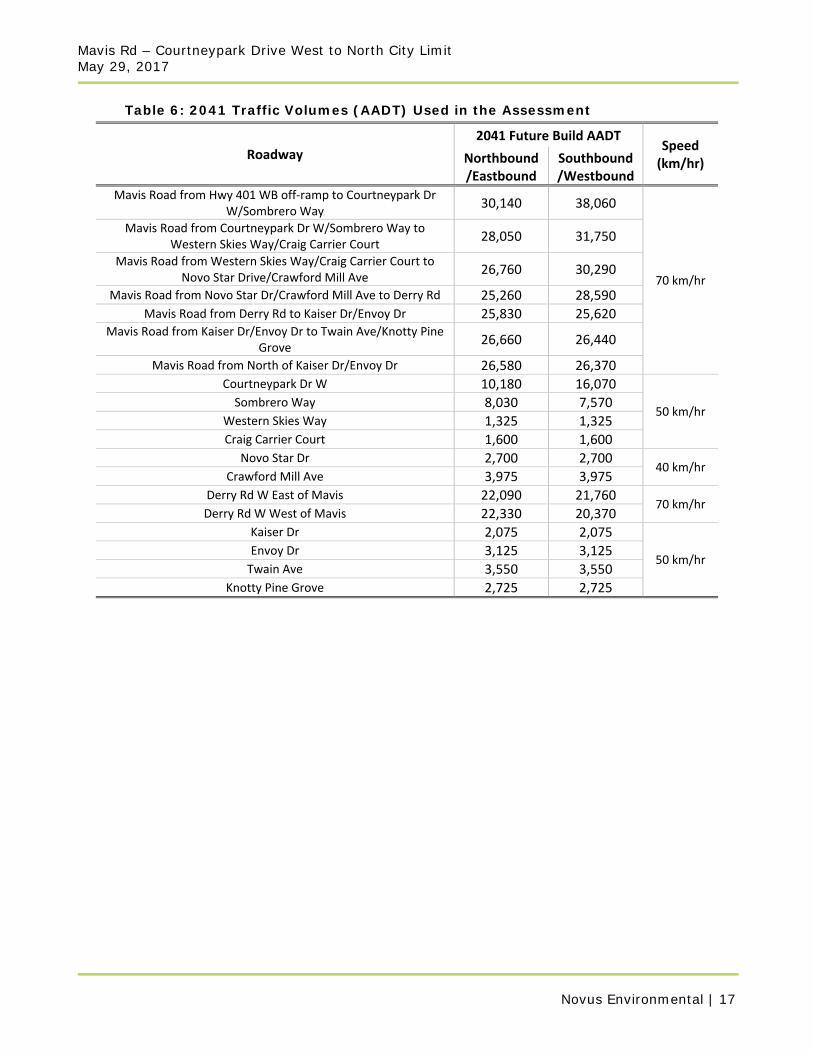
Table 6: 2041 Traffic Volumes (AADT) Used in the Assessment
Roadway
2041 Future Build AADT Speed (km/hr) Northbound
/Eastbound Southbound/Westbound
Mavis Road from Hwy 401 WB off‐ramp to Courtneypark Dr W/Sombrero Way
30,140 38,060
70 km/hr
Mavis Road from Courtneypark Dr W/Sombrero Way to Western Skies Way/Craig Carrier Court
28,050 31,750
Mavis Road from Western Skies Way/Craig Carrier Court to Novo Star Drive/Crawford Mill Ave
26,760 30,290
Mavis Road from Novo Star Dr/Crawford Mill Ave to Derry Rd 25,260 28,590 Mavis Road from Derry Rd to Kaiser Dr/Envoy Dr 25,830 25,620
Mavis Road from Kaiser Dr/Envoy Dr to Twain Ave/Knotty Pine Grove
26,660 26,440
Mavis Road from North of Kaiser Dr/Envoy Dr 26,580 26,370 Courtneypark Dr W 10,180 16,070
50 km/hr Sombrero Way 8,030 7,570
Western Skies Way 1,325 1,325 Craig Carrier Court 1,600 1,600
Novo Star Dr 2,700 2,700 40 km/hr
Crawford Mill Ave 3,975 3,975 Derry Rd W East of Mavis 22,090 21,760
70 km/hr Derry Rd W West of Mavis 22,330 20,370
Kaiser Dr 2,075 2,075
50 km/hr Envoy Dr 3,125 3,125 Twain Ave 3,550 3,550
Knotty Pine Grove 2,725 2,725
Mavis Rd – Courtneypark Drive West to North City Limit May 29, 2017
Novus Environmental | 18
Table 7: Hourly Vehicle Distribution
Hour Mavis Rd Northbound Mavis Road Southbound Arterial Roads
1 1.9% 0.8% 1.4%
2 1.0% 0.4% 0.7%
3 0.7% 0.3% 0.5%
4 0.4% 0.4% 0.4%
5 0.4% 0.8% 0.6%
6 0.7% 2.6% 1.6%
7 2.1% 6.9% 4.5%
8 4.0% 8.5% 6.3%
9 4.6% 8.9% 6.7%
10 3.2% 6.3% 4.7%
11 2.9% 4.5% 3.7%
12 3.6% 4.4% 4.0%
13 4.5% 4.6% 4.6%
14 4.7% 4.6% 4.6%
15 5.6% 5.0% 5.3%
16 7.8% 5.7% 6.7%
17 8.8% 6.3% 7.6%
18 9.6% 6.3% 8.0%
19 8.2% 5.5% 6.8%
20 6.2% 4.6% 5.4%
21 5.9% 4.0% 5.0%
22 5.2% 3.4% 4.3%
23 4.2% 3.0% 3.6%
24 3.8% 2.0% 2.9%
TOTAL 100% 100% 100%
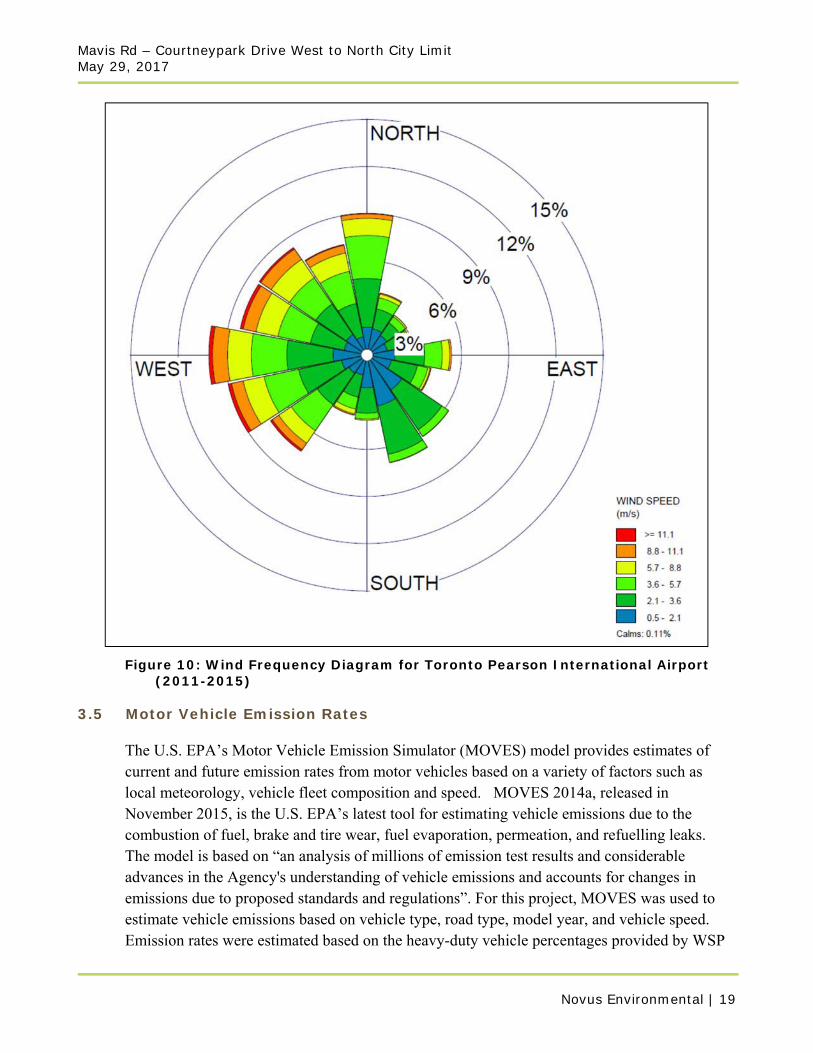
3.4 Meteorological Data
2011-2015 hourly meteorological data was obtained from the Pearson International Airport in Toronto and upper air data was obtained from Buffalo, New York as recommended by the MOECC for the study area. The combined data was processed to reflect conditions at the study area using the U.S. EPA’s PCRAMMET software program which prepares meteorological data for use with the CAL3QHCR vehicle emission dispersion model. A wind frequency diagram (wind rose) is shown in Figure 10. As can be seen in this figure, predominant winds are from the south-westerly through northerly directions.
Mavis Rd – Courtneypark Drive West to North City Limit May 29, 2017
Novus Environmental | 19
Figure 10: Wind Frequency Diagram for Toronto Pearson International Airport
(2011-2015)
3.5 Motor Vehicle Emission Rates
The U.S. EPA’s Motor Vehicle Emission Simulator (MOVES) model provides estimates of current and future emission rates from motor vehicles based on a variety of factors such as local meteorology, vehicle fleet composition and speed. MOVES 2014a, released in November 2015, is the U.S. EPA’s latest tool for estimating vehicle emissions due to the combustion of fuel, brake and tire wear, fuel evaporation, permeation, and refuelling leaks. The model is based on “an analysis of millions of emission test results and considerable advances in the Agency's understanding of vehicle emissions and accounts for changes in emissions due to proposed standards and regulations”. For this project, MOVES was used to estimate vehicle emissions based on vehicle type, road type, model year, and vehicle speed. Emission rates were estimated based on the heavy-duty vehicle percentages provided by WSP
Mavis Rd – Courtneypark Drive West to North City Limit May 29, 2017
Novus Environmental | 20
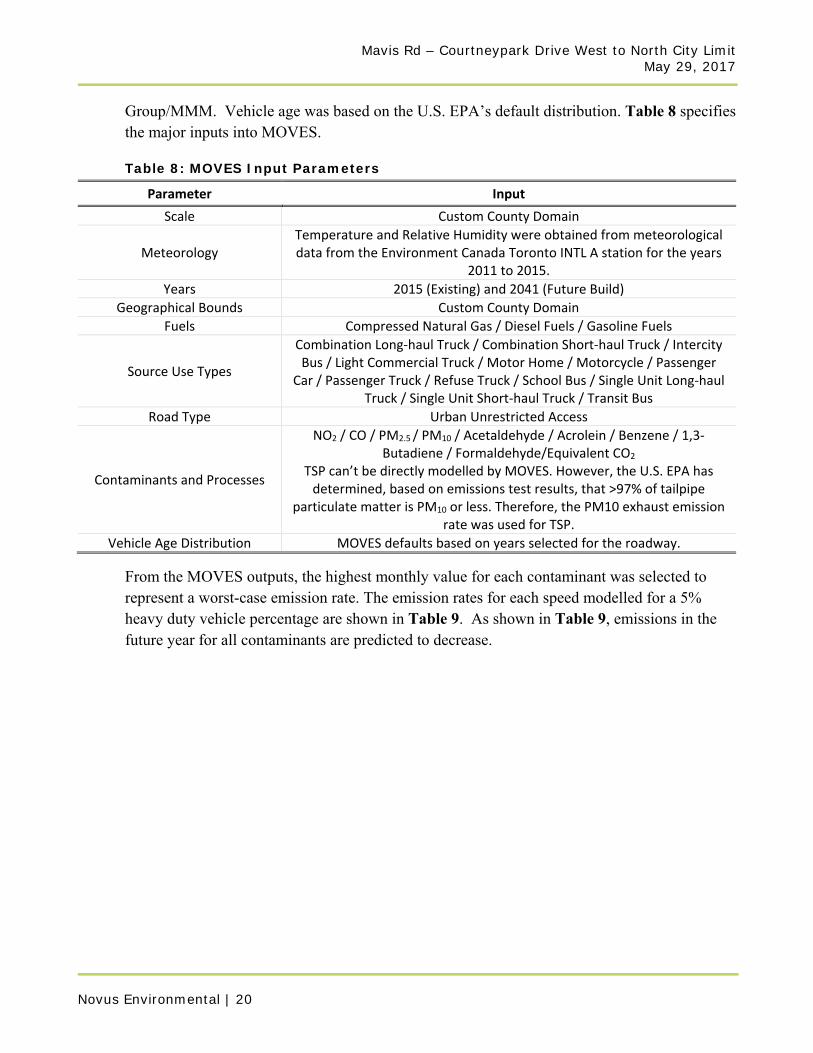
Group/MMM. Vehicle age was based on the U.S. EPA’s default distribution. Table 8 specifies the major inputs into MOVES.
Table 8: MOVES Input Parameters
Parameter Input
Scale Custom County Domain
Meteorology Temperature and Relative Humidity were obtained from meteorological data from the Environment Canada Toronto INTL A station for the years
2011 to 2015.
Years 2015 (Existing) and 2041 (Future Build)
Geographical Bounds Custom County Domain
Fuels Compressed Natural Gas / Diesel Fuels / Gasoline Fuels
Source Use Types
Combination Long‐haul Truck / Combination Short‐haul Truck / Intercity Bus / Light Commercial Truck / Motor Home / Motorcycle / Passenger
Car / Passenger Truck / Refuse Truck / School Bus / Single Unit Long‐haul Truck / Single Unit Short‐haul Truck / Transit Bus
Road Type Urban Unrestricted Access
Contaminants and Processes
NO2 / CO / PM2.5 / PM10 / Acetaldehyde / Acrolein / Benzene / 1,3‐Butadiene / Formaldehyde/Equivalent CO2
TSP can’t be directly modelled by MOVES. However, the U.S. EPA has determined, based on emissions test results, that >97% of tailpipe
particulate matter is PM10 or less. Therefore, the PM10 exhaust emission rate was used for TSP.
Vehicle Age Distribution MOVES defaults based on years selected for the roadway.
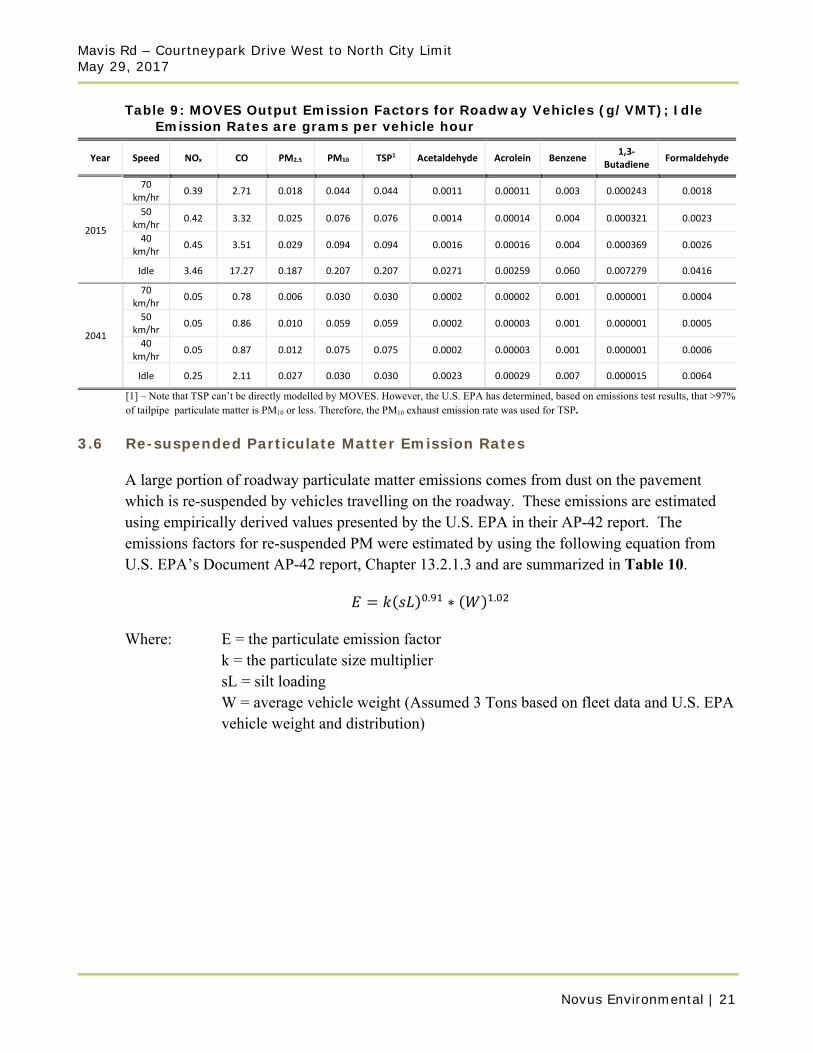
From the MOVES outputs, the highest monthly value for each contaminant was selected to represent a worst-case emission rate. The emission rates for each speed modelled for a 5% heavy duty vehicle percentage are shown in Table 9. As shown in Table 9, emissions in the future year for all contaminants are predicted to decrease.
Mavis Rd – Courtneypark Drive West to North City Limit May 29, 2017
Novus Environmental | 21
Table 9: MOVES Output Emission Factors for Roadway Vehicles (g/VMT); Idle Emission Rates are grams per vehicle hour
Year Speed NOx CO PM2.5 PM10 TSP1 Acetaldehyde Acrolein Benzene 1,3‐
Butadiene Formaldehyde
2015
70 km/hr
0.39 2.71 0.018 0.044 0.044 0.0011 0.00011 0.003 0.000243 0.0018
50 km/hr
0.42 3.32 0.025 0.076 0.076 0.0014 0.00014 0.004 0.000321 0.0023
40 km/hr
0.45 3.51 0.029 0.094 0.094 0.0016 0.00016 0.004 0.000369 0.0026
Idle 3.46 17.27 0.187 0.207 0.207 0.0271 0.00259 0.060 0.007279 0.0416
2041
70 km/hr
0.05 0.78 0.006 0.030 0.030 0.0002 0.00002 0.001 0.000001 0.0004
50 km/hr
0.05 0.86 0.010 0.059 0.059 0.0002 0.00003 0.001 0.000001 0.0005
40 km/hr
0.05 0.87 0.012 0.075 0.075 0.0002 0.00003 0.001 0.000001 0.0006
Idle 0.25 2.11 0.027 0.030 0.030 0.0023 0.00029 0.007 0.000015 0.0064
[1] – Note that TSP can’t be directly modelled by MOVES. However, the U.S. EPA has determined, based on emissions test results, that >97% of tailpipe particulate matter is PM10 or less. Therefore, the PM10 exhaust emission rate was used for TSP.
3.6 Re-suspended Particulate Matter Emission Rates
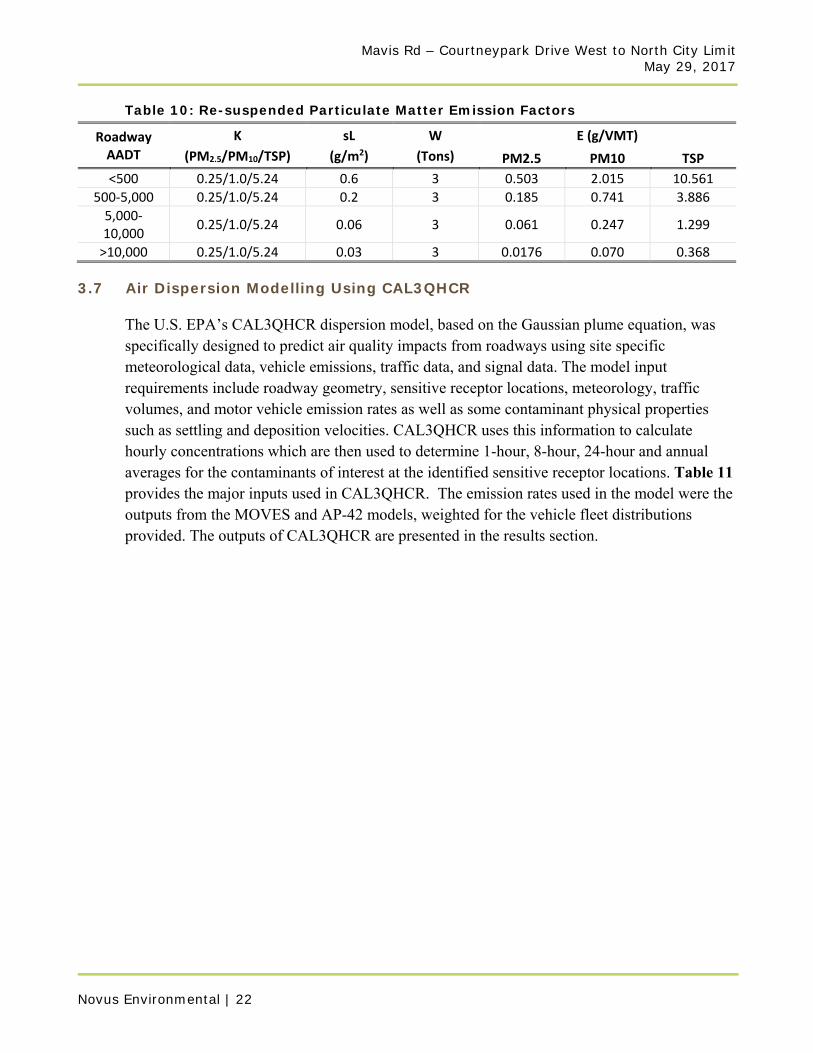
A large portion of roadway particulate matter emissions comes from dust on the pavement which is re-suspended by vehicles travelling on the roadway. These emissions are estimated using empirically derived values presented by the U.S. EPA in their AP-42 report. The emissions factors for re-suspended PM were estimated by using the following equation from U.S. EPA’s Document AP-42 report, Chapter 13.2.1.3 and are summarized in Table 10.
. ∗ .
Where: E = the particulate emission factor k = the particulate size multiplier sL = silt loading
W = average vehicle weight (Assumed 3 Tons based on fleet data and U.S. EPA vehicle weight and distribution)
Mavis Rd – Courtneypark Drive West to North City Limit May 29, 2017
Novus Environmental | 22
Table 10: Re-suspended Particulate Matter Emission Factors
Roadway AADT
K
(PM2.5/PM10/TSP)
sL
(g/m2)
W
(Tons)
E (g/VMT)
PM2.5 PM10 TSP
<500 0.25/1.0/5.24 0.6 3 0.503 2.015 10.561
500‐5,000 0.25/1.0/5.24 0.2 3 0.185 0.741 3.886
5,000‐10,000
0.25/1.0/5.24 0.06 3 0.061 0.247 1.299
>10,000 0.25/1.0/5.24 0.03 3 0.0176 0.070 0.368
3.7 Air Dispersion Modelling Using CAL3QHCR
The U.S. EPA’s CAL3QHCR dispersion model, based on the Gaussian plume equation, was specifically designed to predict air quality impacts from roadways using site specific meteorological data, vehicle emissions, traffic data, and signal data. The model input requirements include roadway geometry, sensitive receptor locations, meteorology, traffic volumes, and motor vehicle emission rates as well as some contaminant physical properties such as settling and deposition velocities. CAL3QHCR uses this information to calculate hourly concentrations which are then used to determine 1-hour, 8-hour, 24-hour and annual averages for the contaminants of interest at the identified sensitive receptor locations. Table 11 provides the major inputs used in CAL3QHCR. The emission rates used in the model were the outputs from the MOVES and AP-42 models, weighted for the vehicle fleet distributions provided. The outputs of CAL3QHCR are presented in the results section.

Mavis Rd – Courtneypark Drive West to North City Limit May 29, 2017
Novus Environmental | 23
Table 11: CAL3QHCR Model Input Parameters
Parameter Input
Free‐Flow and Queue Link Traffic Data
Hourly traffic distributions were applied to the AADT traffic volumes in order to input traffic volumes in vehicles/hour. Emission rates from the MOVES output were input in grams/VMT or grams per vehicle hour. Signal timings for the traffic signal were input in seconds.
Meteorological Data 2011‐2015 data from Pearson International Airport
Deposition Velocity
PM2.5: 0.01 cm/s PM10: 0.5 cm/s TSP: 0.15 cm/s NO2, CO and VOCs: 0 cm/s
Settling Velocity
PM2.5: 0.02 cm/s PM10: 0.3 cm/s TSP: 1.8 cm/s CO, NO2, and VOCs: 0 cm/s
Surface Roughness The land type surrounding the project site is categorized as ‘low intensity residential’. The average surface roughness height for low intensity residential for all seasons of 52 cm was applied in the model.
Vehicle Emission Rate Emission rates calculated in MOVES and AP‐42 were input in g/VMT
3.8 Modelling Results
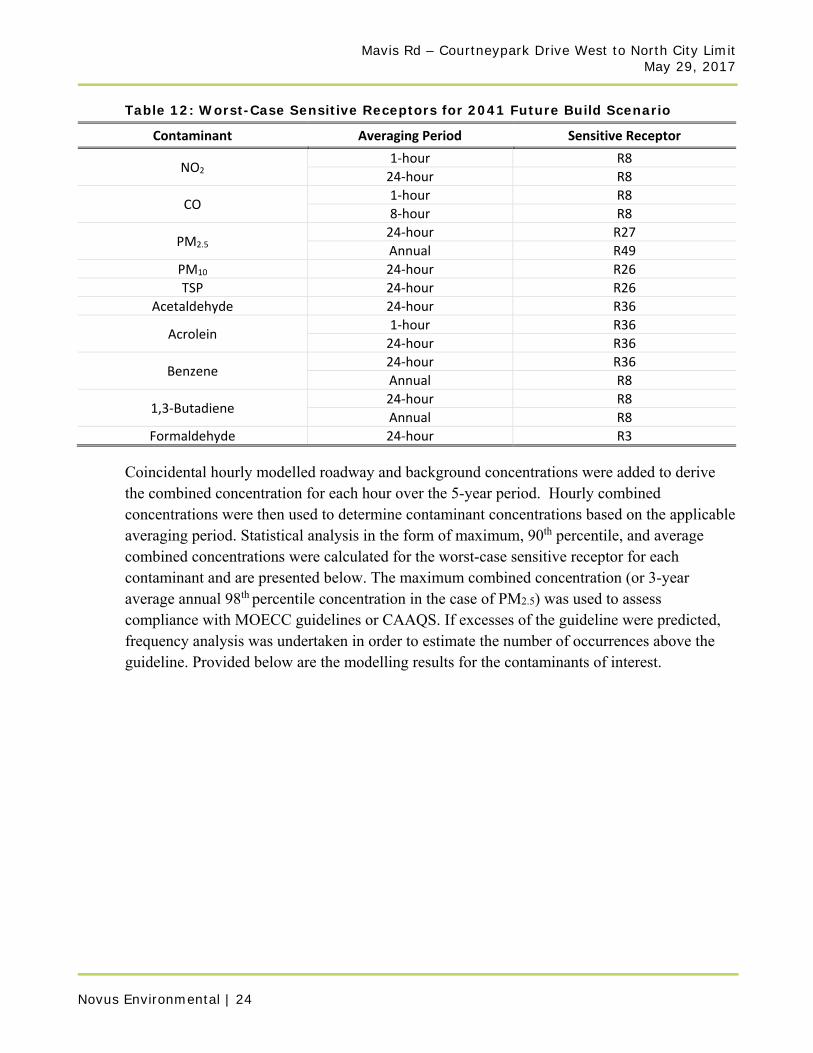
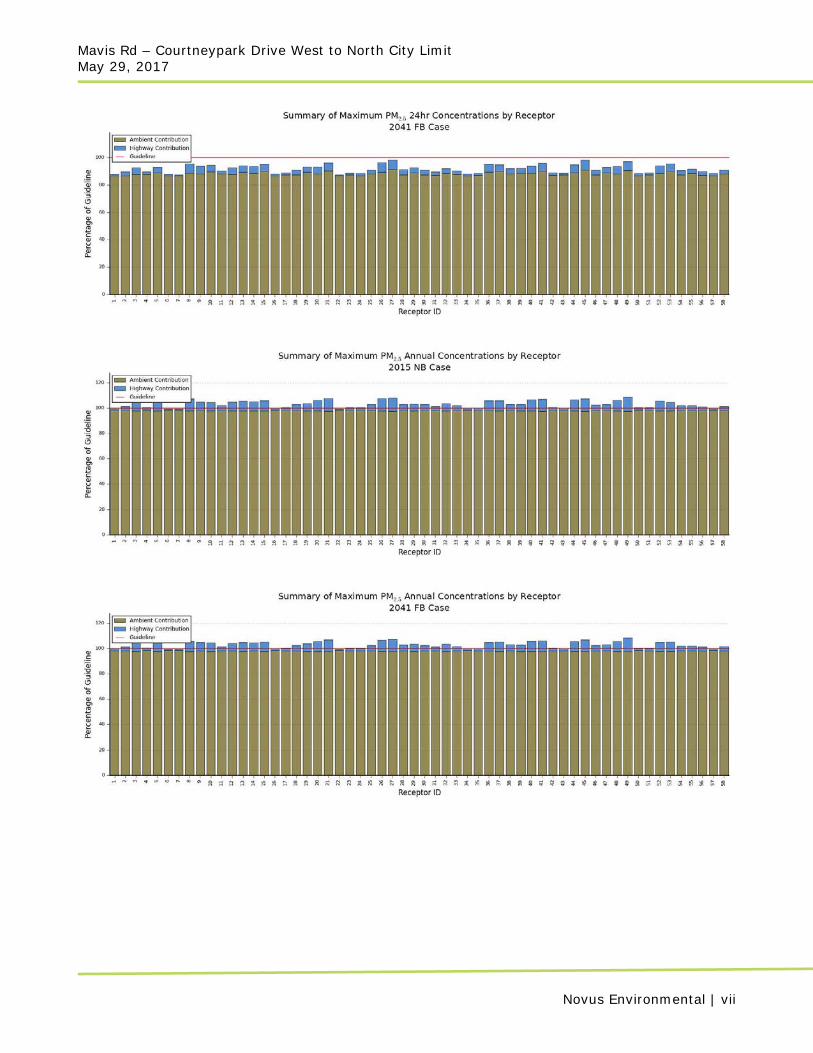
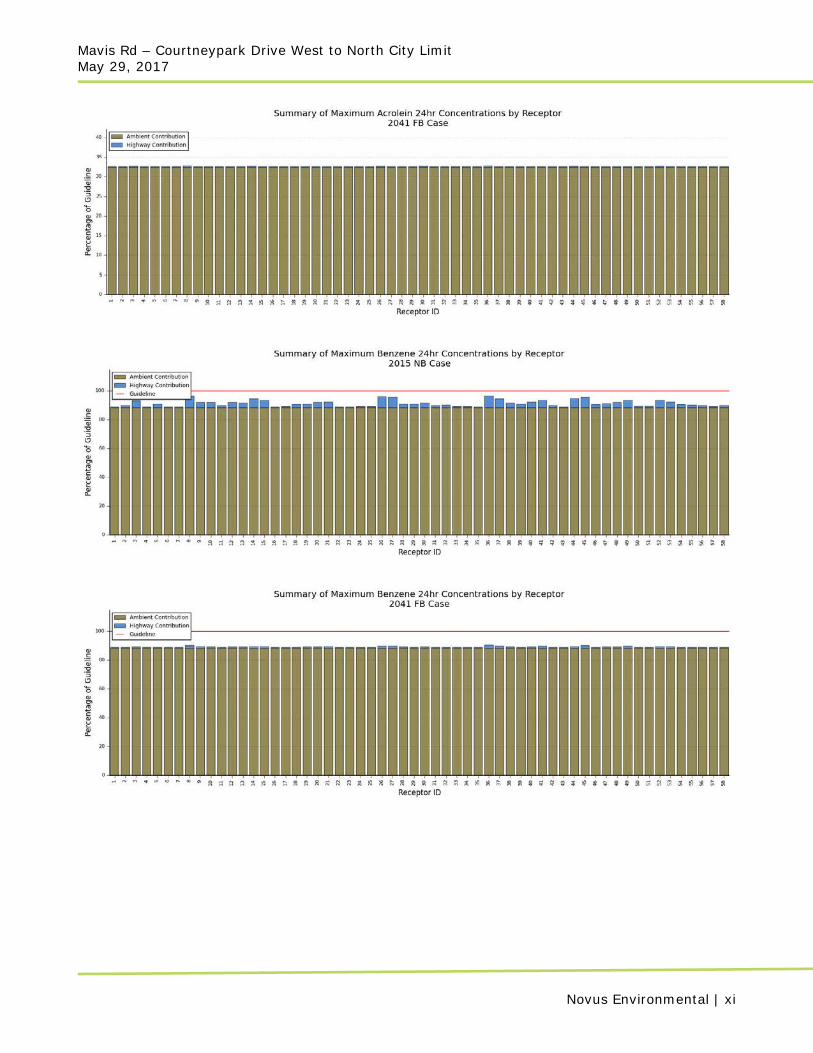
Presented below are the modelling results for the 2015 Existing and 2041 Future Build scenarios based on 5-years of meteorological data. For each contaminant, combined concentrations are presented along with the relevant contribution due to the background and roadway. Results in this section are presented for the worst-case sensitive receptors for each contaminant and averaging period (see Table 12), which were identified as the maximum combined concentration for the 2041 Future Build scenario. Results for all modelled receptors are provided in Appendix A. It should be noted that the maximum combined concentration at any sensitive receptor often occurs infrequently and may only occur for one hour or day over the 5-year period.
Mavis Rd – Courtneypark Drive West to North City Limit May 29, 2017
Novus Environmental | 24
Table 12: Worst-Case Sensitive Receptors for 2041 Future Build Scenario
Contaminant Averaging Period Sensitive Receptor
NO2 1‐hour R8
24‐hour R8
CO 1‐hour R8
8‐hour R8
PM2.5 24‐hour R27
Annual R49
PM10 24‐hour R26
TSP 24‐hour R26
Acetaldehyde 24‐hour R36
Acrolein 1‐hour R36
24‐hour R36
Benzene 24‐hour R36
Annual R8
1,3‐Butadiene 24‐hour R8
Annual R8
Formaldehyde 24‐hour R3
Coincidental hourly modelled roadway and background concentrations were added to derive the combined concentration for each hour over the 5-year period. Hourly combined concentrations were then used to determine contaminant concentrations based on the applicable averaging period. Statistical analysis in the form of maximum, 90th percentile, and average combined concentrations were calculated for the worst-case sensitive receptor for each contaminant and are presented below. The maximum combined concentration (or 3-year average annual 98th percentile concentration in the case of PM2.5) was used to assess compliance with MOECC guidelines or CAAQS. If excesses of the guideline were predicted, frequency analysis was undertaken in order to estimate the number of occurrences above the guideline. Provided below are the modelling results for the contaminants of interest.
Mavis Rd – Courtneypark Drive West to North City Limit May 29, 2017
Novus Environmental | 25
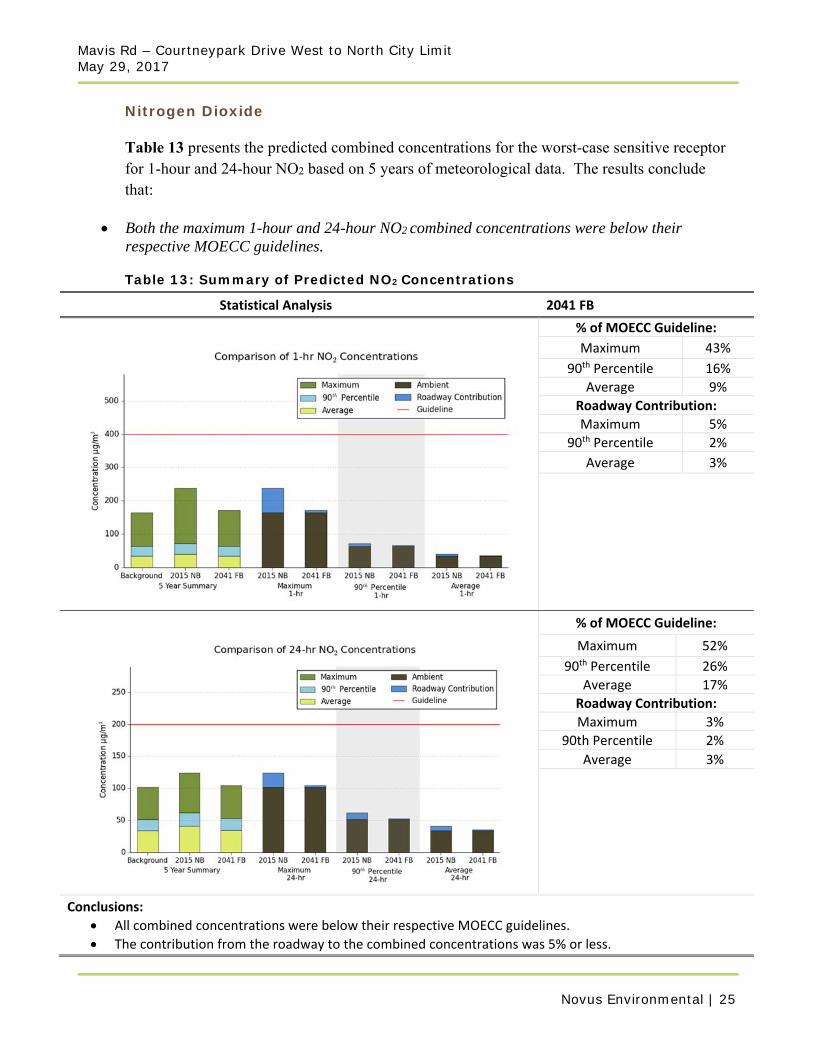
Nitrogen Dioxide
Table 13 presents the predicted combined concentrations for the worst-case sensitive receptor for 1-hour and 24-hour NO2 based on 5 years of meteorological data. The results conclude that:
Both the maximum 1-hour and 24-hour NO2 combined concentrations were below their respective MOECC guidelines.
Table 13: Summary of Predicted NO2 Concentrations
Statistical Analysis5 Year Summary of 2041 FB
% of MOECC Guideline:
Maximum 43%
90th Percentile 16%
Average 9%
Roadway Contribution:
Maximum 5%
90th Percentile 2%
Average 3%
% of MOECC Guideline:
Maximum 52%
90th Percentile 26%
Average 17%
Roadway Contribution:
Maximum 3%
90th Percentile 2%
Average 3%
Conclusions:
All combined concentrations were below their respective MOECC guidelines.
The contribution from the roadway to the combined concentrations was 5% or less.

Mavis Rd – Courtneypark Drive West to North City Limit May 29, 2017
Novus Environmental | 26
Carbon Monoxide
Table 14 presents the predicted combined concentrations for the worst-case sensitive receptor for 1-hour and 8-hour CO based on 5 years of meteorological data. The results conclude that:
Both the maximum 1-hour and 8-hour CO combined concentrations were well below their respective MOECC guidelines.
Table 14: Summary of Predicted CO Concentrations
Statistical Analysis5 Year Summary of 2041 FB
% of MOECC Guideline:
Maximum 6%
90th Percentile 1%
Average 1%
Roadway Contribution:
Maximum 6%
90th Percentile 6%
Average 5%
% of MOECC Guideline:
Maximum 9%
90th Percentile 3%
Average 2%
Roadway Contribution:
Maximum 6%
90th Percentile 5%
Average 4%
Conclusions:
All combined concentrations were below their respective MOECC guidelines.
The contribution from the roadway to the combined concentrations was 6% or less.
Mavis Rd – Courtneypark Drive West to North City Limit May 29, 2017
Novus Environmental | 27
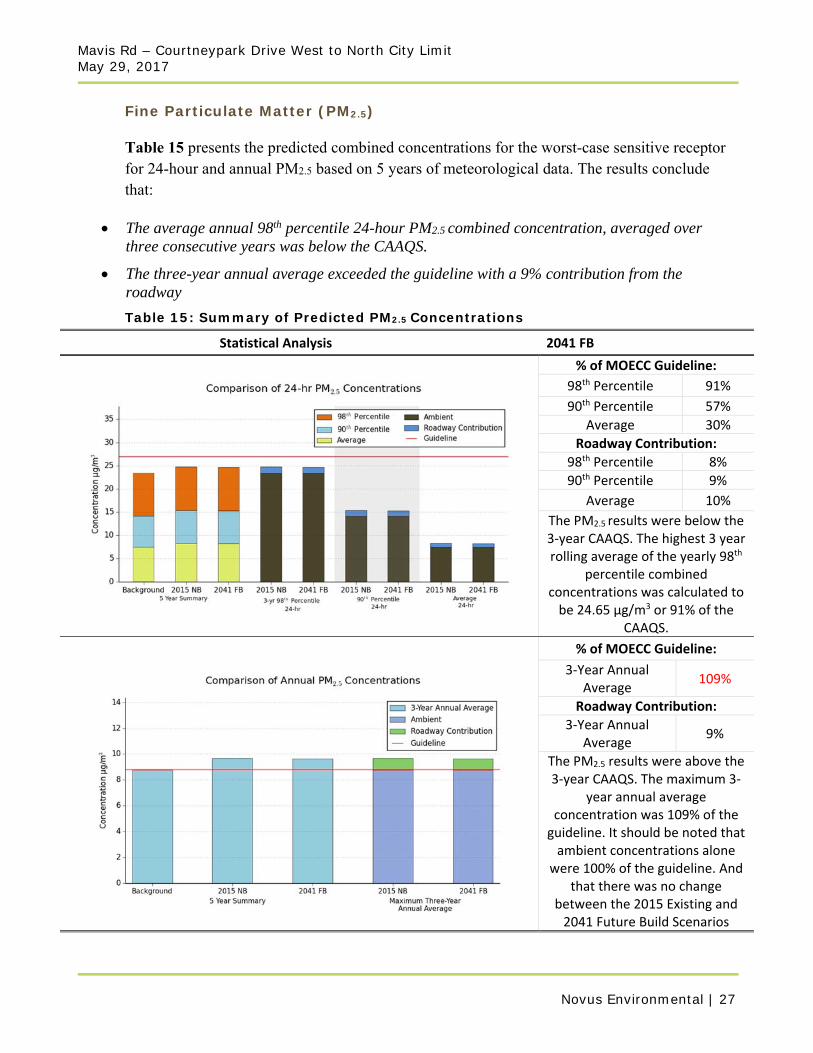
Fine Particulate Matter (PM2.5)
Table 15 presents the predicted combined concentrations for the worst-case sensitive receptor for 24-hour and annual PM2.5 based on 5 years of meteorological data. The results conclude that:
The average annual 98th percentile 24-hour PM2.5 combined concentration, averaged over three consecutive years was below the CAAQS.
The three-year annual average exceeded the guideline with a 9% contribution from the roadway
Table 15: Summary of Predicted PM2.5 Concentrations
Statistical Analysis5 Year Summary of 2041 FB
% of MOECC Guideline:
98th Percentile 91%
90th Percentile 57%
Average 30%
Roadway Contribution:
98th Percentile 8%
90th Percentile 9%
Average 10%
The PM2.5 results were below the 3‐year CAAQS. The highest 3 year rolling average of the yearly 98th
percentile combined concentrations was calculated to be 24.65 µg/m3 or 91% of the
CAAQS.
% of MOECC Guideline:
3‐Year Annual Average
109%
Roadway Contribution:
3‐Year Annual Average
9%
The PM2.5 results were above the 3‐year CAAQS. The maximum 3‐
year annual average concentration was 109% of the guideline. It should be noted that ambient concentrations alone
were 100% of the guideline. And that there was no change
between the 2015 Existing and 2041 Future Build Scenarios
Mavis Rd – Courtneypark Drive West to North City Limit May 29, 2017
Novus Environmental | 28
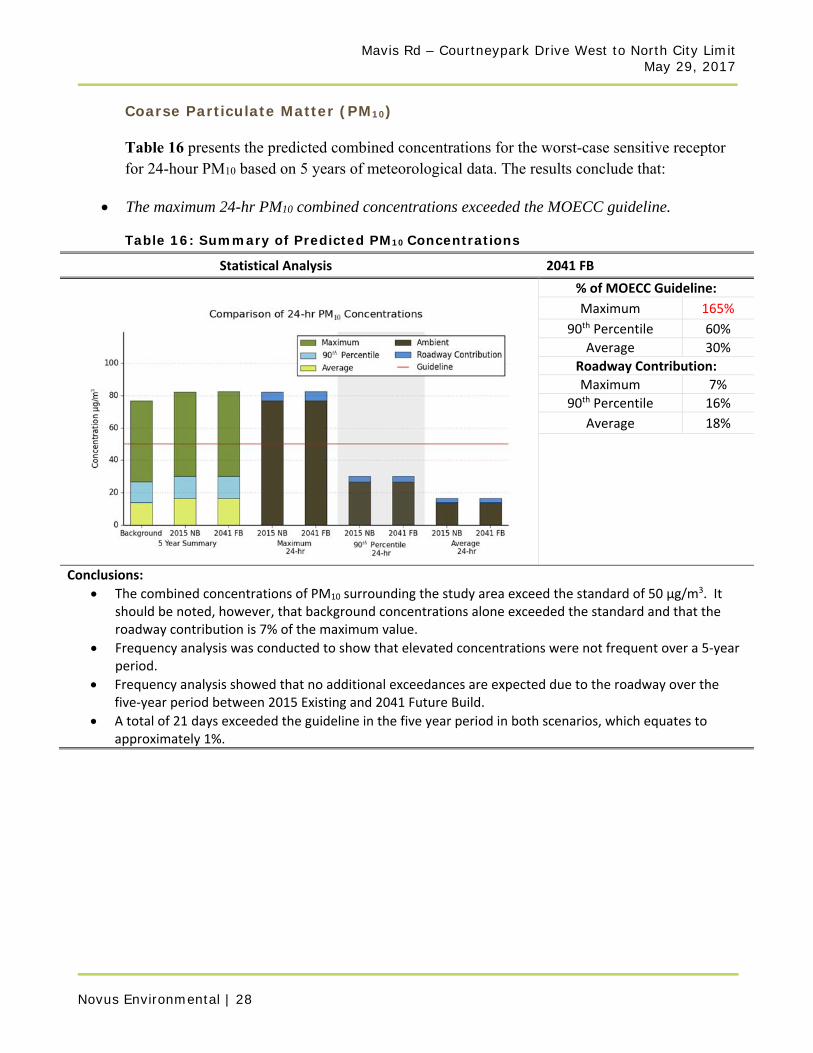
Coarse Particulate Matter (PM10)
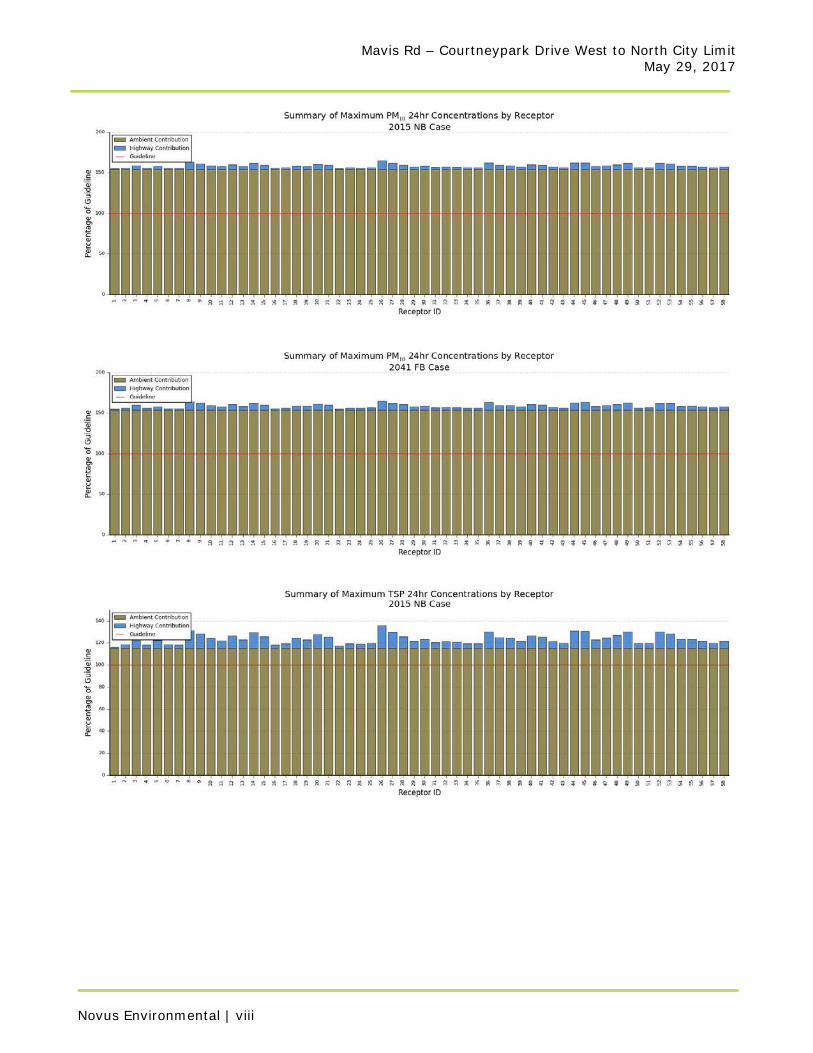
Table 16 presents the predicted combined concentrations for the worst-case sensitive receptor for 24-hour PM10 based on 5 years of meteorological data. The results conclude that:
The maximum 24-hr PM10 combined concentrations exceeded the MOECC guideline.
Table 16: Summary of Predicted PM10 Concentrations
Statistical Analysis5 Year Summary of 2041 FB
% of MOECC Guideline:
Maximum 165%
90th Percentile 60%
Average 30%
Roadway Contribution:
Maximum 7%
90th Percentile 16%
Average 18%
Conclusions:
The combined concentrations of PM10 surrounding the study area exceed the standard of 50 µg/m3. It should be noted, however, that background concentrations alone exceeded the standard and that the roadway contribution is 7% of the maximum value.
Frequency analysis was conducted to show that elevated concentrations were not frequent over a 5‐year period.
Frequency analysis showed that no additional exceedances are expected due to the roadway over the five‐year period between 2015 Existing and 2041 Future Build.
A total of 21 days exceeded the guideline in the five year period in both scenarios, which equates to approximately 1%.

Mavis Rd – Courtneypark Drive West to North City Limit May 29, 2017
Novus Environmental | 29
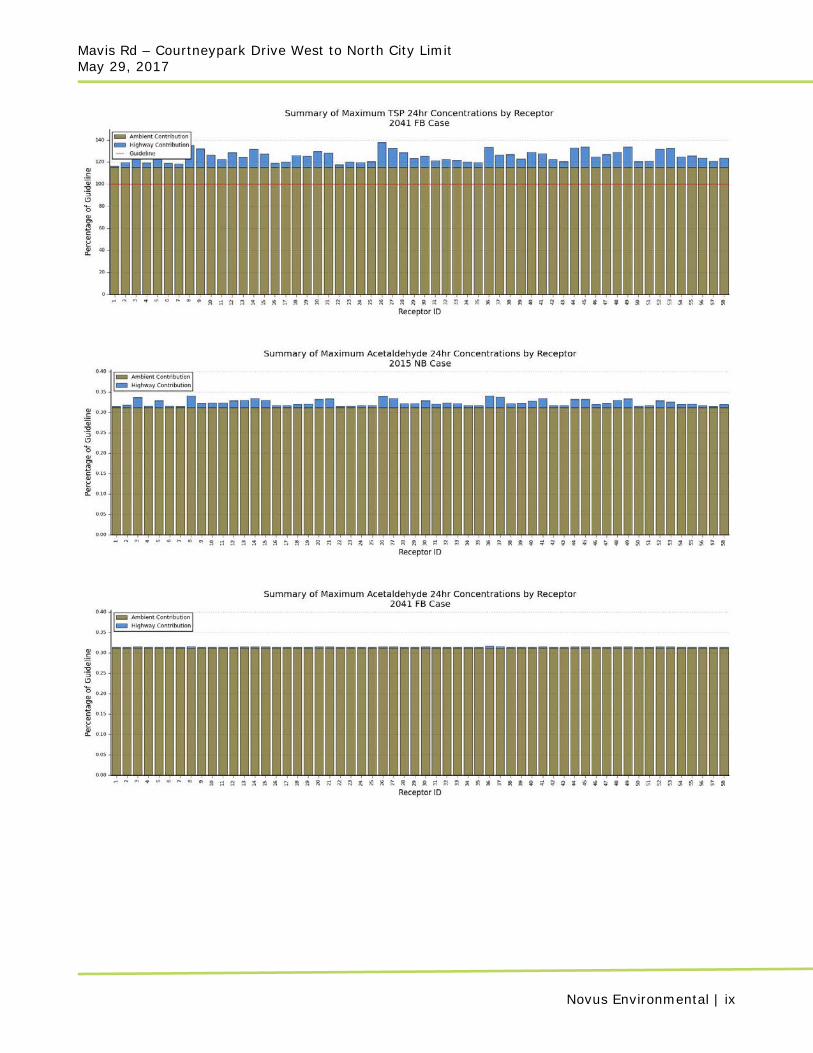
Total Suspended Particulate Matter (TSP)
Table 17 presents the predicted combined concentrations for the worst-case sensitive receptor for 24-hour TSP based on 5 years of meteorological data. The results conclude that:
The maximum 24-hr TSP combined concentrations exceeded the MOECC guideline.
Table 17: Summary of Predicted TSP Concentrations
Statistical Analysis5 Year Summary of 2041 FB
% of MOECC Guideline:
Maximum 138%
90th Percentile 55%
Average 32%
Roadway Contribution:
Maximum 16%
90th Percentile 37%
Average 30%
Conclusions:
The TSP results show that the combined concentrations exceed the guideline. It should be noted, however, that background concentrations alone exceeded the standard and that the roadway contribution is 16% of the maximum value.
Frequency analysis was conducted to show that elevated concentrations were not frequent over a 5‐year period.
Frequency analysis showed that 3 additional exceedances are expected due to the roadway over the five‐year period between 2015 Existing and 2041 Future Build.
A total of 6 days exceeded the guideline in the Existing Scenario and 9 days exceeded in the Future Build Scenario, which equates to less than 1%.

Mavis Rd – Courtneypark Drive West to North City Limit May 29, 2017
Novus Environmental | 30
Ambient VOC concentrations are typically measured every 6 days in Ontario. In order to combine the ambient data to the modelled results, the measured concentrations were applied to the following 6 days when measurements were 6 days apart. When measurements were further than 6 days apart, the 90th percentile annual value was used to represent the missing data. This background data was added to the predicted hourly roadway concentrations at each receptor to obtain results for the VOCs.
Acetaldehyde
Table 18 presents the predicted combined concentrations for the worst-case sensitive receptor for 24-hour acetaldehyde based on 5 years of meteorological data. The results conclude that:
The maximum 24-hour acetaldehyde combined concentration was well below the respective MOECC guideline.
Table 18: Summary of Predicted Acetaldehyde Concentrations
Statistical Analysis5 Year Summary of 2041 FB
% of MOECC Guideline:
Maximum <1%
90th Percentile <1%
Average <1%
Roadway Contribution:
Maximum 2%
90th Percentile <1%
Average <1%
Conclusions:
All combined concentrations were below their respective MOECC guidelines.
The contribution from the roadway to the combined concentrations was 2% or less.
Mavis Rd – Courtneypark Drive West to North City Limit May 29, 2017
Novus Environmental | 31
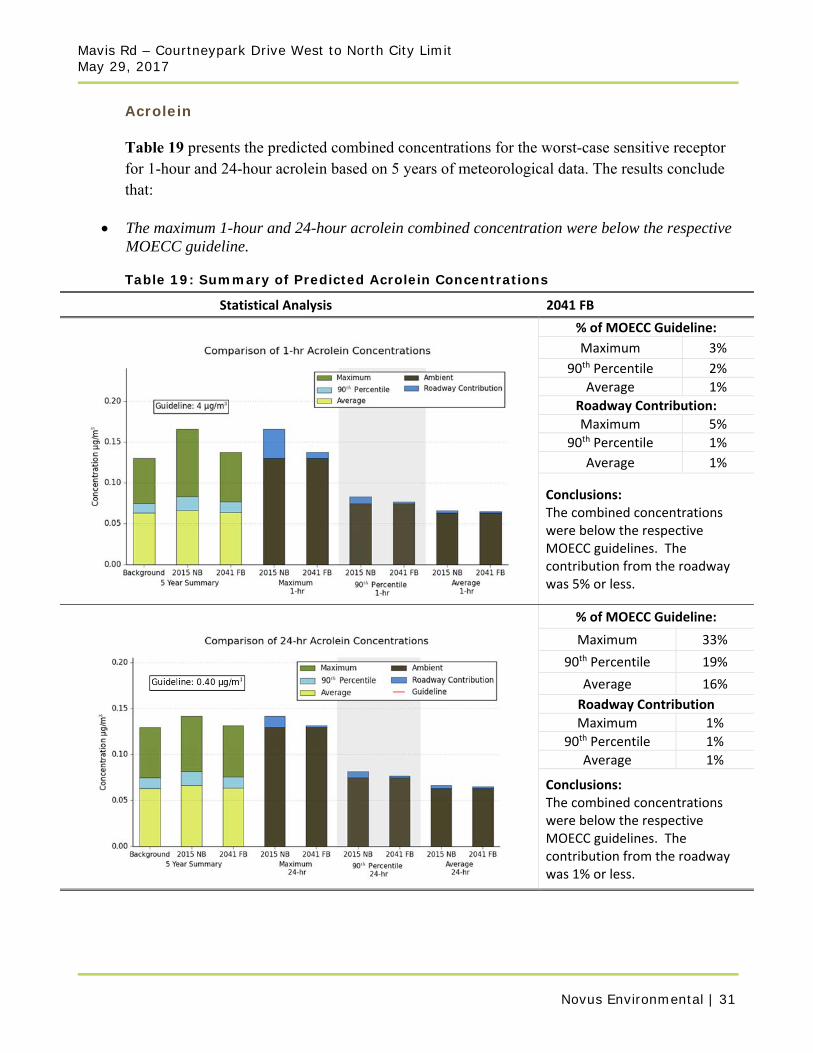
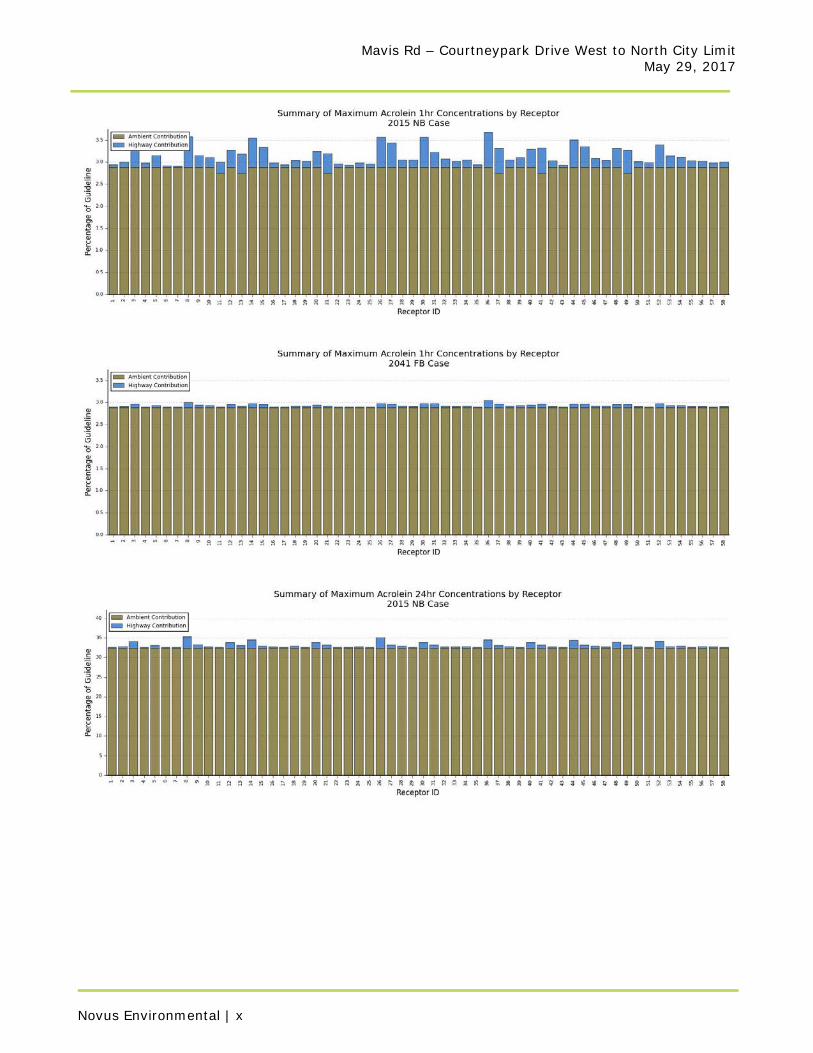
Acrolein
Table 19 presents the predicted combined concentrations for the worst-case sensitive receptor for 1-hour and 24-hour acrolein based on 5 years of meteorological data. The results conclude that:
The maximum 1-hour and 24-hour acrolein combined concentration were below the respective MOECC guideline.
Table 19: Summary of Predicted Acrolein Concentrations
Statistical Analysis5 Year Summary of 2041 FB
% of MOECC Guideline:
Maximum 3%
90th Percentile 2%
Average 1%
Roadway Contribution:
Maximum 5%
90th Percentile 1%
Average 1%
Conclusions: The combined concentrations were below the respective MOECC guidelines. The contribution from the roadway was 5% or less.
% of MOECC Guideline:
Maximum 33%
90th Percentile 19%
Average 16%
Roadway Contribution
Maximum 1%
90th Percentile 1%
Average 1%
Conclusions: The combined concentrations were below the respective MOECC guidelines. The contribution from the roadway was 1% or less.
Mavis Rd – Courtneypark Drive West to North City Limit May 29, 2017
Novus Environmental | 32
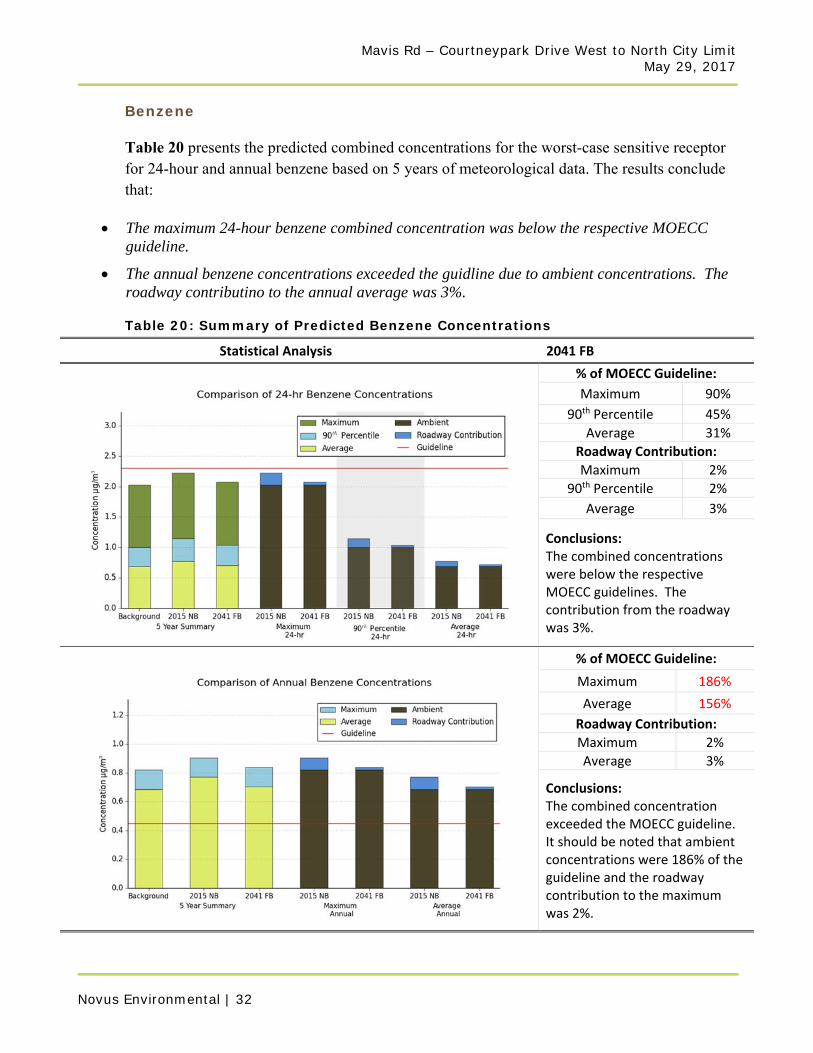
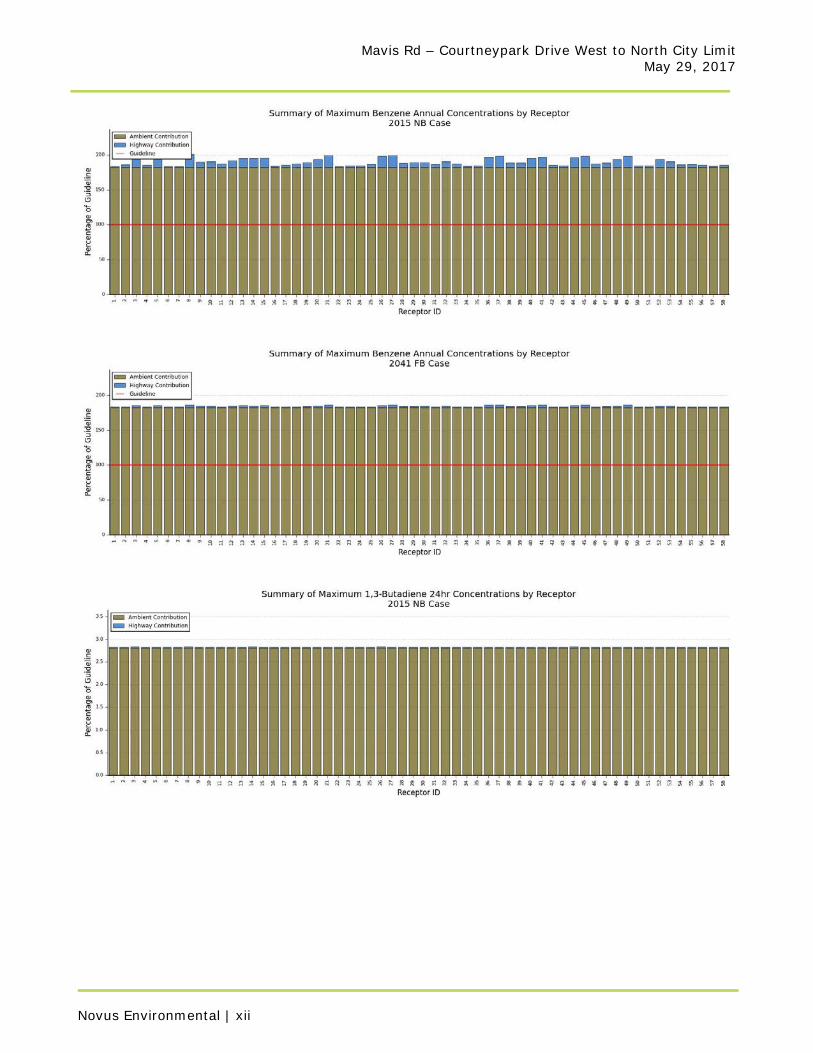
Benzene
Table 20 presents the predicted combined concentrations for the worst-case sensitive receptor for 24-hour and annual benzene based on 5 years of meteorological data. The results conclude that:
The maximum 24-hour benzene combined concentration was below the respective MOECC guideline.
The annual benzene concentrations exceeded the guidline due to ambient concentrations. The roadway contributino to the annual average was 3%.
Table 20: Summary of Predicted Benzene Concentrations
Statistical Analysis5 Year Summary of 2041 FB
% of MOECC Guideline:
Maximum 90%
90th Percentile 45%
Average 31%
Roadway Contribution:
Maximum 2%
90th Percentile 2%
Average 3%
Conclusions: The combined concentrations were below the respective MOECC guidelines. The contribution from the roadway was 3%.
% of MOECC Guideline:
Maximum 186%
Average 156%
Roadway Contribution:
Maximum 2%
Average 3%
Conclusions: The combined concentration exceeded the MOECC guideline. It should be noted that ambient concentrations were 186% of the guideline and the roadway contribution to the maximum was 2%.
Mavis Rd – Courtneypark Drive West to North City Limit May 29, 2017
Novus Environmental | 33
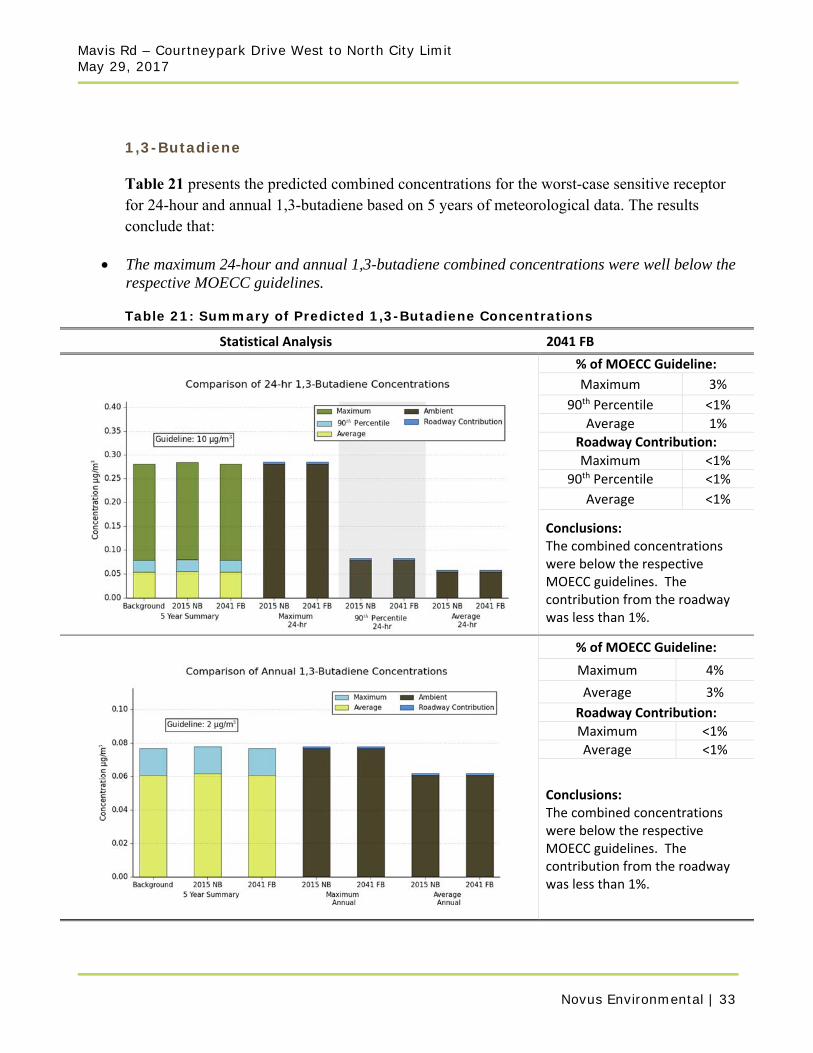
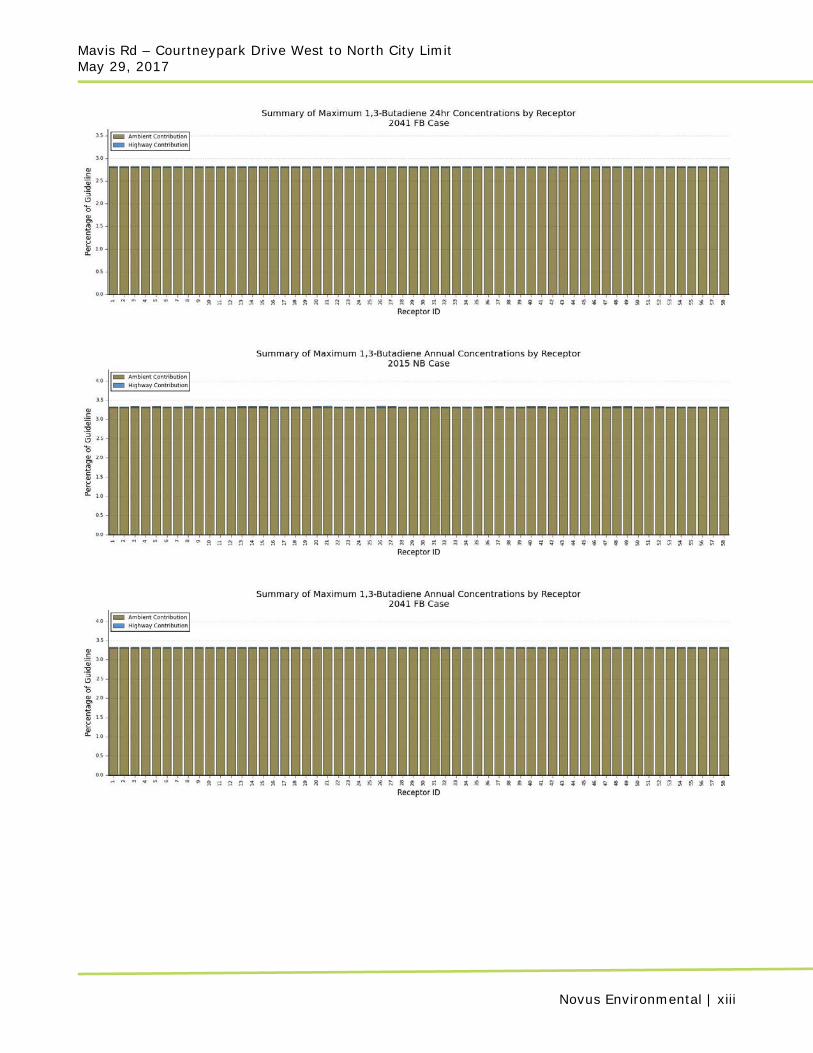
1,3-Butadiene
Table 21 presents the predicted combined concentrations for the worst-case sensitive receptor for 24-hour and annual 1,3-butadiene based on 5 years of meteorological data. The results conclude that:
The maximum 24-hour and annual 1,3-butadiene combined concentrations were well below the respective MOECC guidelines.
Table 21: Summary of Predicted 1,3-Butadiene Concentrations
Statistical Analysis5 Year Summary of 2041 FB
% of MOECC Guideline:
Maximum 3%
90th Percentile <1%
Average 1%
Roadway Contribution:
Maximum <1%
90th Percentile <1%
Average <1%
Conclusions: The combined concentrations were below the respective MOECC guidelines. The contribution from the roadway was less than 1%.
% of MOECC Guideline:
Maximum 4%
Average 3%
Roadway Contribution:
Maximum <1%
Average <1%
Conclusions: The combined concentrations were below the respective MOECC guidelines. The contribution from the roadway was less than 1%.
Mavis Rd – Courtneypark Drive West to North City Limit May 29, 2017
Novus Environmental | 34
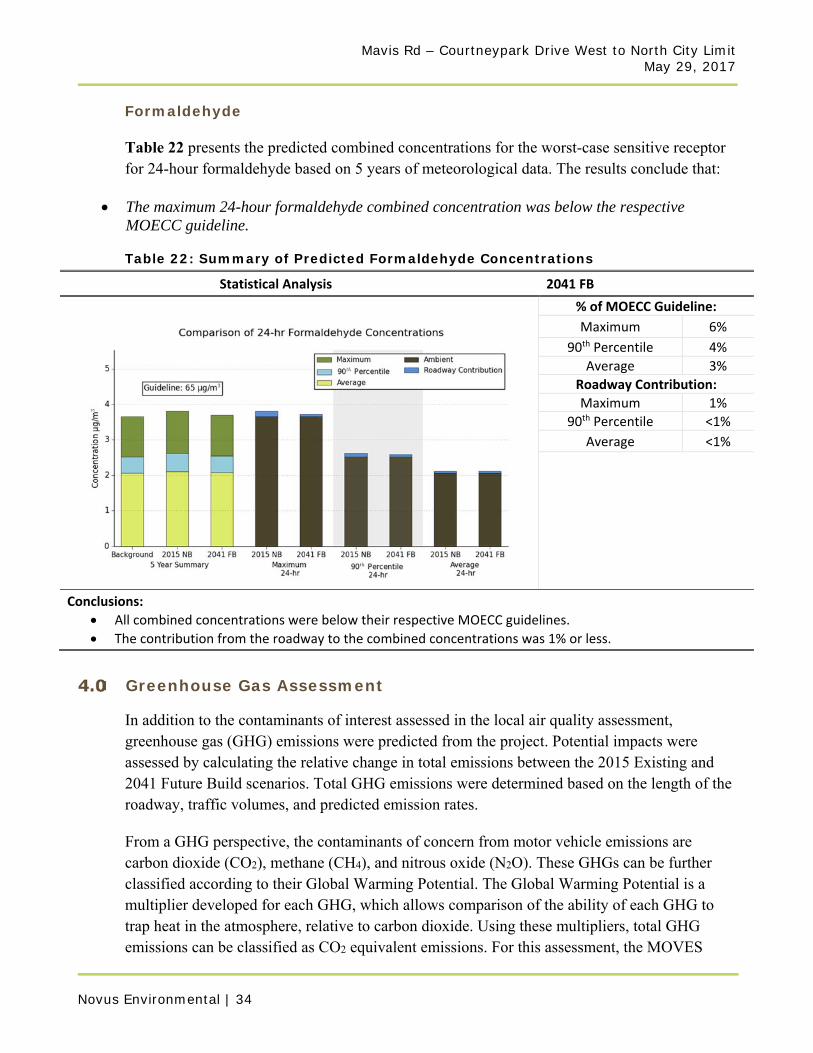
Formaldehyde
Table 22 presents the predicted combined concentrations for the worst-case sensitive receptor for 24-hour formaldehyde based on 5 years of meteorological data. The results conclude that:
The maximum 24-hour formaldehyde combined concentration was below the respective MOECC guideline.
Table 22: Summary of Predicted Formaldehyde Concentrations
Statistical Analysis5 Year Summary of 2041 FB
% of MOECC Guideline:
Maximum 6%
90th Percentile 4%
Average 3%
Roadway Contribution:
Maximum 1%
90th Percentile <1%
Average <1%
Conclusions:
All combined concentrations were below their respective MOECC guidelines.
The contribution from the roadway to the combined concentrations was 1% or less.
Greenhouse Gas Assessment
In addition to the contaminants of interest assessed in the local air quality assessment, greenhouse gas (GHG) emissions were predicted from the project. Potential impacts were assessed by calculating the relative change in total emissions between the 2015 Existing and 2041 Future Build scenarios. Total GHG emissions were determined based on the length of the roadway, traffic volumes, and predicted emission rates.
From a GHG perspective, the contaminants of concern from motor vehicle emissions are carbon dioxide (CO2), methane (CH4), and nitrous oxide (N2O). These GHGs can be further classified according to their Global Warming Potential. The Global Warming Potential is a multiplier developed for each GHG, which allows comparison of the ability of each GHG to trap heat in the atmosphere, relative to carbon dioxide. Using these multipliers, total GHG emissions can be classified as CO2 equivalent emissions. For this assessment, the MOVES
Mavis Rd – Courtneypark Drive West to North City Limit May 29, 2017
Novus Environmental | 35
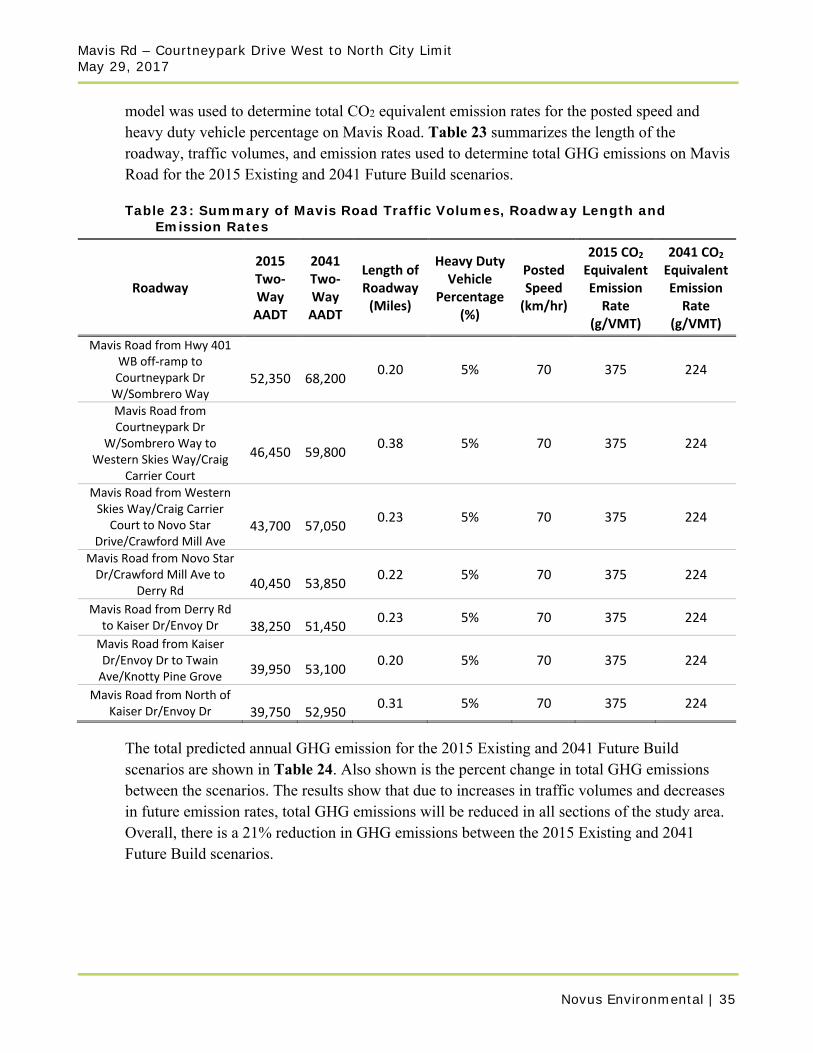
model was used to determine total CO2 equivalent emission rates for the posted speed and heavy duty vehicle percentage on Mavis Road. Table 23 summarizes the length of the roadway, traffic volumes, and emission rates used to determine total GHG emissions on Mavis Road for the 2015 Existing and 2041 Future Build scenarios.
Table 23: Summary of Mavis Road Traffic Volumes, Roadway Length and Emission Rates
Roadway
2015 Two‐Way AADT
2041 Two‐Way AADT
Length of Roadway (Miles)
Heavy Duty Vehicle
Percentage (%)
Posted Speed (km/hr)
2015 CO2 Equivalent Emission Rate
(g/VMT)
2041 CO2 Equivalent Emission Rate
(g/VMT)
Mavis Road from Hwy 401 WB off‐ramp to Courtneypark Dr W/Sombrero Way
52,350
68,200
0.20 5% 70 375 224
Mavis Road from Courtneypark Dr
W/Sombrero Way to Western Skies Way/Craig
Carrier Court
46,450
59,800
0.38 5% 70 375 224
Mavis Road from Western Skies Way/Craig Carrier Court to Novo Star
Drive/Crawford Mill Ave
43,700
57,050
0.23 5% 70 375 224
Mavis Road from Novo Star Dr/Crawford Mill Ave to
Derry Rd
40,450
53,850
0.22 5% 70 375 224
Mavis Road from Derry Rd to Kaiser Dr/Envoy Dr
38,250
51,450
0.23 5% 70 375 224
Mavis Road from Kaiser Dr/Envoy Dr to Twain Ave/Knotty Pine Grove
39,950
53,100
0.20 5% 70 375 224
Mavis Road from North of Kaiser Dr/Envoy Dr
39,750
52,950
0.31 5% 70 375 224
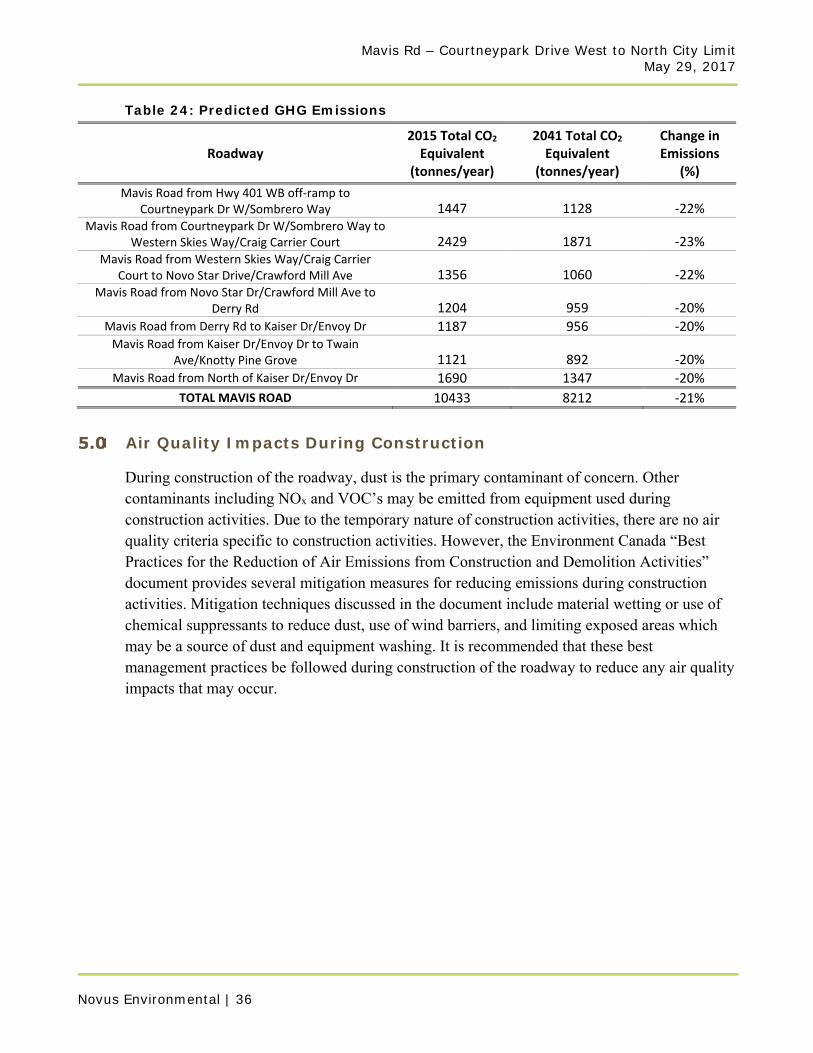
The total predicted annual GHG emission for the 2015 Existing and 2041 Future Build scenarios are shown in Table 24. Also shown is the percent change in total GHG emissions between the scenarios. The results show that due to increases in traffic volumes and decreases in future emission rates, total GHG emissions will be reduced in all sections of the study area. Overall, there is a 21% reduction in GHG emissions between the 2015 Existing and 2041 Future Build scenarios.
Mavis Rd – Courtneypark Drive West to North City Limit May 29, 2017
Novus Environmental | 36
Table 24: Predicted GHG Emissions
Roadway 2015 Total CO2 Equivalent
(tonnes/year)
2041 Total CO2 Equivalent
(tonnes/year)
Change in Emissions
(%)
Mavis Road from Hwy 401 WB off‐ramp to Courtneypark Dr W/Sombrero Way 1447 1128 ‐22%
Mavis Road from Courtneypark Dr W/Sombrero Way to Western Skies Way/Craig Carrier Court 2429 1871 ‐23%
Mavis Road from Western Skies Way/Craig Carrier Court to Novo Star Drive/Crawford Mill Ave 1356 1060 ‐22%
Mavis Road from Novo Star Dr/Crawford Mill Ave to Derry Rd 1204 959 ‐20%
Mavis Road from Derry Rd to Kaiser Dr/Envoy Dr 1187 956 ‐20% Mavis Road from Kaiser Dr/Envoy Dr to Twain
Ave/Knotty Pine Grove 1121 892 ‐20% Mavis Road from North of Kaiser Dr/Envoy Dr 1690 1347 ‐20%
TOTAL MAVIS ROAD 10433 8212 ‐21%
Air Quality Impacts During Construction
During construction of the roadway, dust is the primary contaminant of concern. Other contaminants including NOx and VOC’s may be emitted from equipment used during construction activities. Due to the temporary nature of construction activities, there are no air quality criteria specific to construction activities. However, the Environment Canada “Best Practices for the Reduction of Air Emissions from Construction and Demolition Activities” document provides several mitigation measures for reducing emissions during construction activities. Mitigation techniques discussed in the document include material wetting or use of chemical suppressants to reduce dust, use of wind barriers, and limiting exposed areas which may be a source of dust and equipment washing. It is recommended that these best management practices be followed during construction of the roadway to reduce any air quality impacts that may occur.
Mavis Rd – Courtneypark Drive West to North City Limit May 29, 2017
Novus Environmental | 37
Conclusions and Recommendations
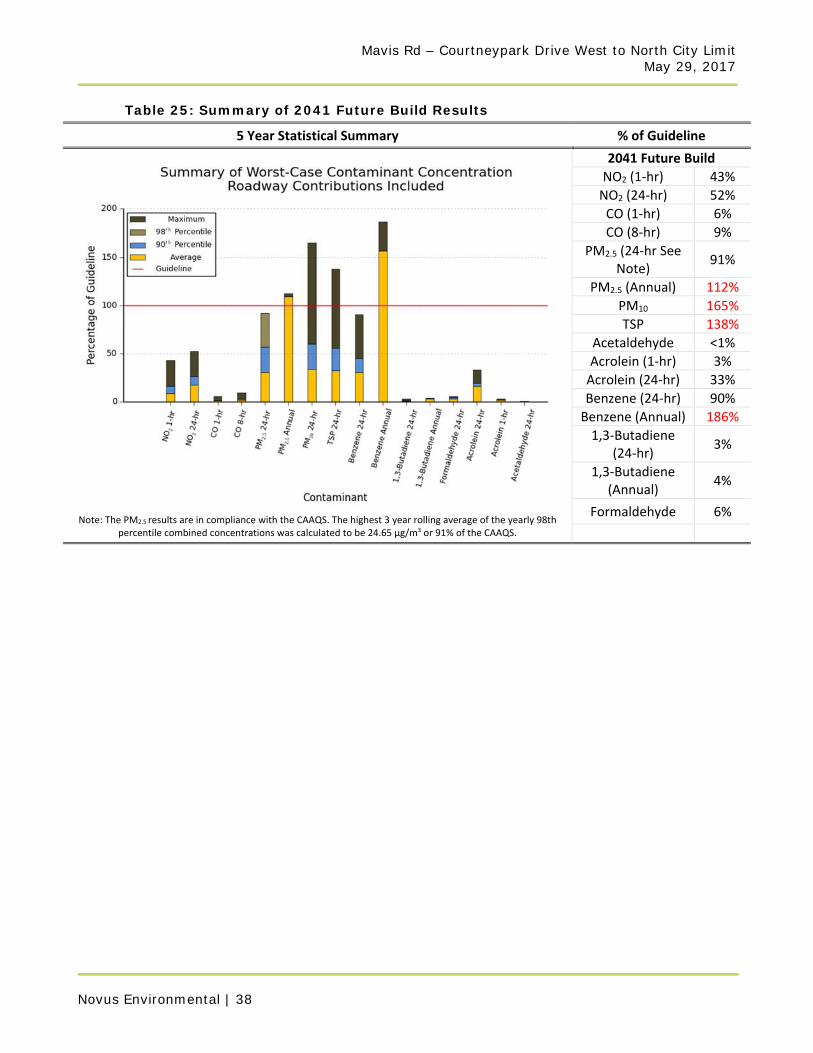
The potential impact of the proposed project infrastructure on local air quality has been assessed and the results are summarized in Table 25. An assessment of GHG emissions was also conducted. The following conclusions and recommendations are a result of this assessment.
The maximum combined concentrations for the future build scenario were all below their respective MOECC guidelines or CAAQS, with the exception of annual PM2.5, PM10, TSP and annual benzene. Note that for each of these contaminants, background concentrations alone were 100% of the guideline or more.
Frequency Analysis determined that there were no additional days on which exceedances of PM10 occurred and only 6 additional days for TSP between the 2015 Existing and 2041 Future Build scenarios, which is less than 1% of the time.
Overall, maximum predicted concentrations are similar between the 2015 Existing and 2041 Future Build scenarios, with little or no increase occurring as a result of the project.
Mitigation measures are not warranted, due to the small number of days which are expected to exceed the guideline.
Total GHG emissions were predicted to decrease in the study area. Overall, there was a 21% decrease in total GHG emissions predicted between the Existing and Future Build scenarios.
Mavis Rd – Courtneypark Drive West to North City Limit May 29, 2017
Novus Environmental | 38
Table 25: Summary of 2041 Future Build Results
5 Year Statistical Summary % of Guideline
Note: The PM2.5 results are in compliance with the CAAQS. The highest 3 year rolling average of the yearly 98th
percentile combined concentrations was calculated to be 24.65 µg/m3 or 91% of the CAAQS.
2041 Future Build
NO2 (1‐hr) 43%
NO2 (24‐hr) 52%
CO (1‐hr) 6%
CO (8‐hr) 9%
PM2.5 (24‐hr See Note)
91%
PM2.5 (Annual) 112%
PM10 165%
TSP 138%
Acetaldehyde <1%
Acrolein (1‐hr) 3%
Acrolein (24‐hr) 33%
Benzene (24‐hr) 90%
Benzene (Annual) 186%
1,3‐Butadiene (24‐hr)
3%
1,3‐Butadiene (Annual)
4%
Formaldehyde 6%
Mavis Rd – Courtneypark Drive West to North City Limit May 29, 2017
Novus Environmental | 39
References
Air & Waste Management Association, 2011. The Role of Vegetation in Mitigating Air Quality Impacts from Traffic Emissions. [online] http://www.epa.gov/nrmrl/appcd/nearroadway/pdfs/baldauf.pdf
CCME, 2000. Canadian Council of Ministers of the Environment. Canada-Wide Standards of Particulate Matter and Ozone. Endorsed by CCME Council of Ministers, Quebec City. [Online]http://www.ccme.ca/assets/pdf/pmozone_standard_e.pdf
Environment Canada. 2000. Priority Substances List Assessment Report: Respirable Particulate Matter Less Than or Equal to 10 Microns. Canadian Environmental Protection Act, 1999. Environment Canada, Health Canada. [Online] http://www.ec.gc.ca/Substances/ese/eng/psap/final/PM-10.cfm.
Health Canada. 1999. National Ambient Air Quality Objectives for Particulate Matter Part 1: Science Assessment Document. Health Canada. A report by the CEPA/FPAC Working Group on Air Quality Objectives and Guidelines.
Lall, R., Kendall, M., Ito, K., Thurston, G., 2004. Estimation of historical annual PM2.5 exposures for health effects assessment. Atmospheric Environment 38(2004) 5217-5226.
Ontario Publication 6570e, 2008. Ontario's Ambient Air Quality Criteria. Standards Development Branch, Ontario Ministry of the Environment.
Ontario Ministry of the Environment, 2005. Transboundary Air Pollution in Ontario. Queens Printer for Ontario.
Randerson, D., 1984. Atmospheric Science and Power Production . United States Department of Energy.
Seinfeld, J.H. and Pandis, S.P.,2006. Atmospheric Chemistry and Physics From Air Pollution to Climate Change. New Jersey: John Wiley & Sons.
United States Environmental Protection Agency, 2008. AERSURFACE User’s Guide. USEPA.
United States Environmental Protection Agency, 1997. Document AP 42, Volume I, Fifth Edition, Chapter 13.2.1. USEPA.
United States Environmental Protection Agency, 2010. Exhaust and Crankcase Emission Factors for Nonroad Engine Modeling – Compression-Ignition. USEPA.
United States Environmental Protection Agency, 2009. MOVES 2010 Highway Vehicles: Population and Activity Data. USEPA.
WHO. 2005. WHO air quality guidelines global update 2005. Report on a Working Group meeting, Boon, Germany, October 18-20, 2005.

Appendix A Receptor Specific Modelling Results
This page intentionally left blank
for 2-sided printing purposes

Mavis Rd – Courtneypark Drive West to North City Limit May 29, 2017
Novus Environmental | i
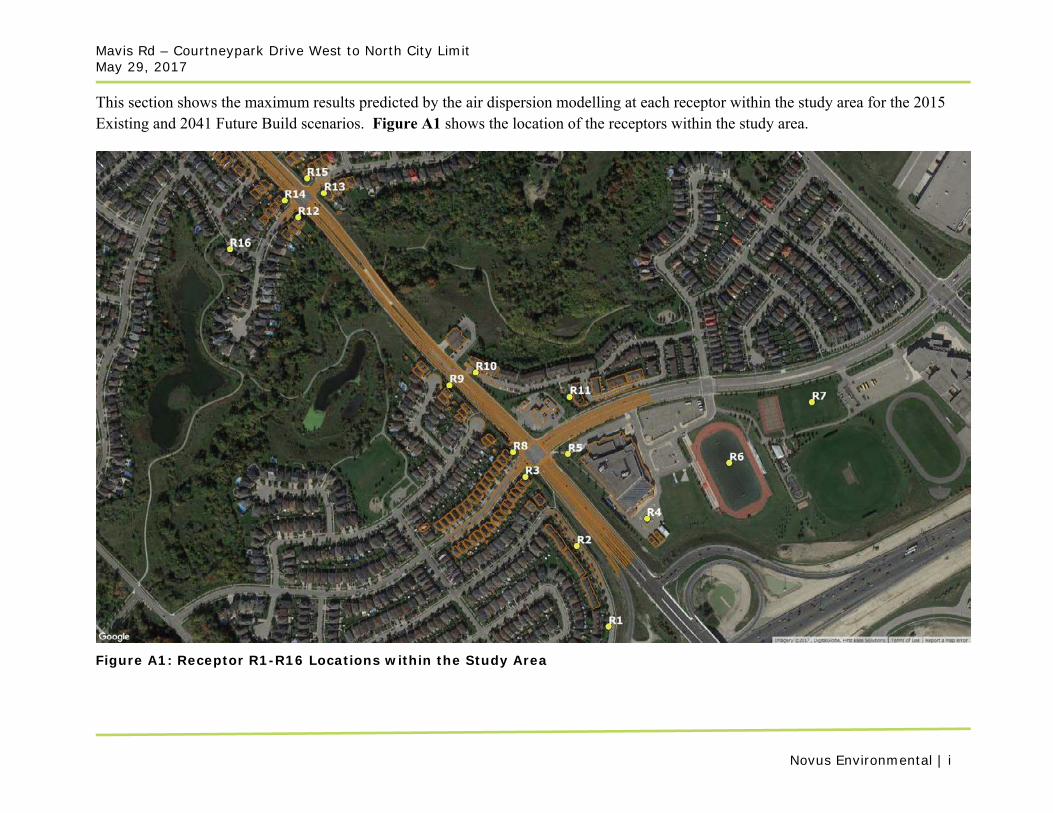
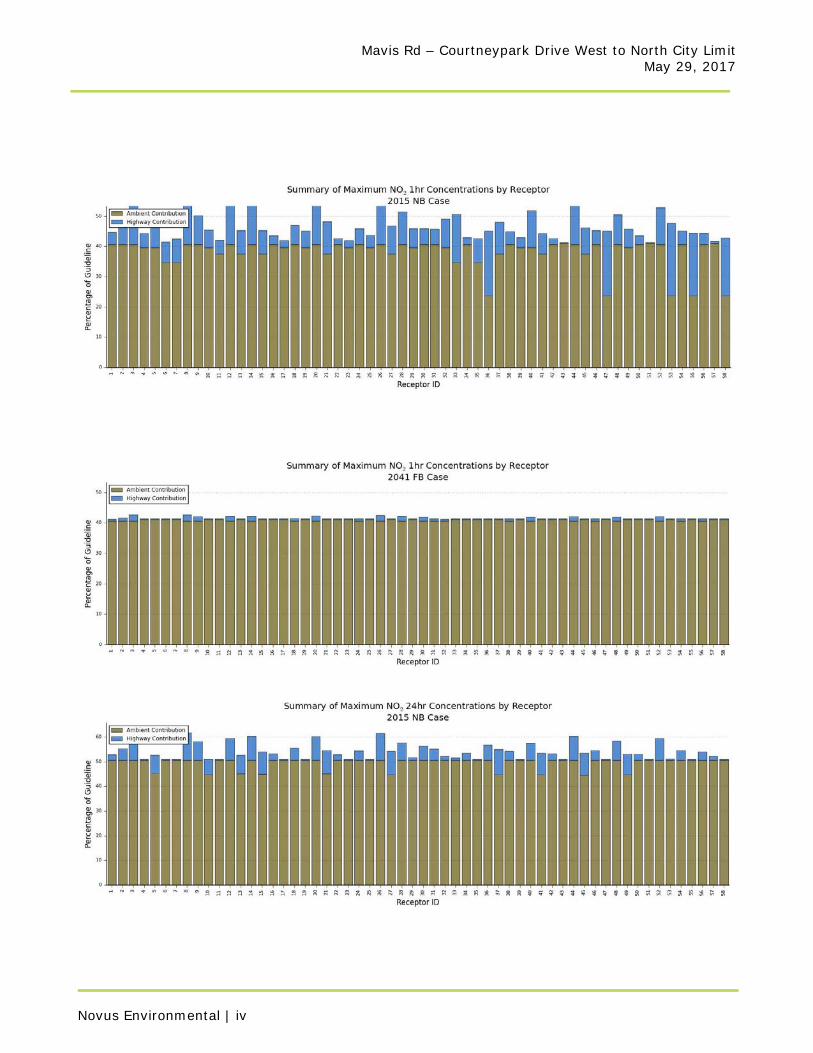
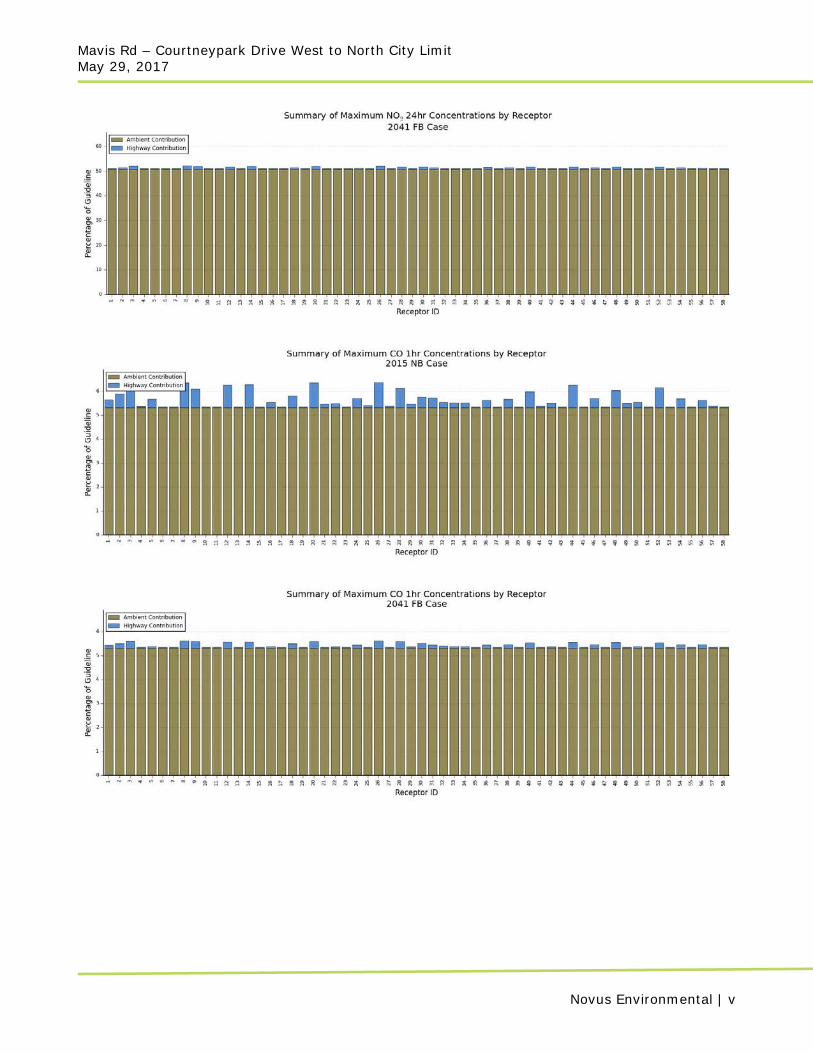
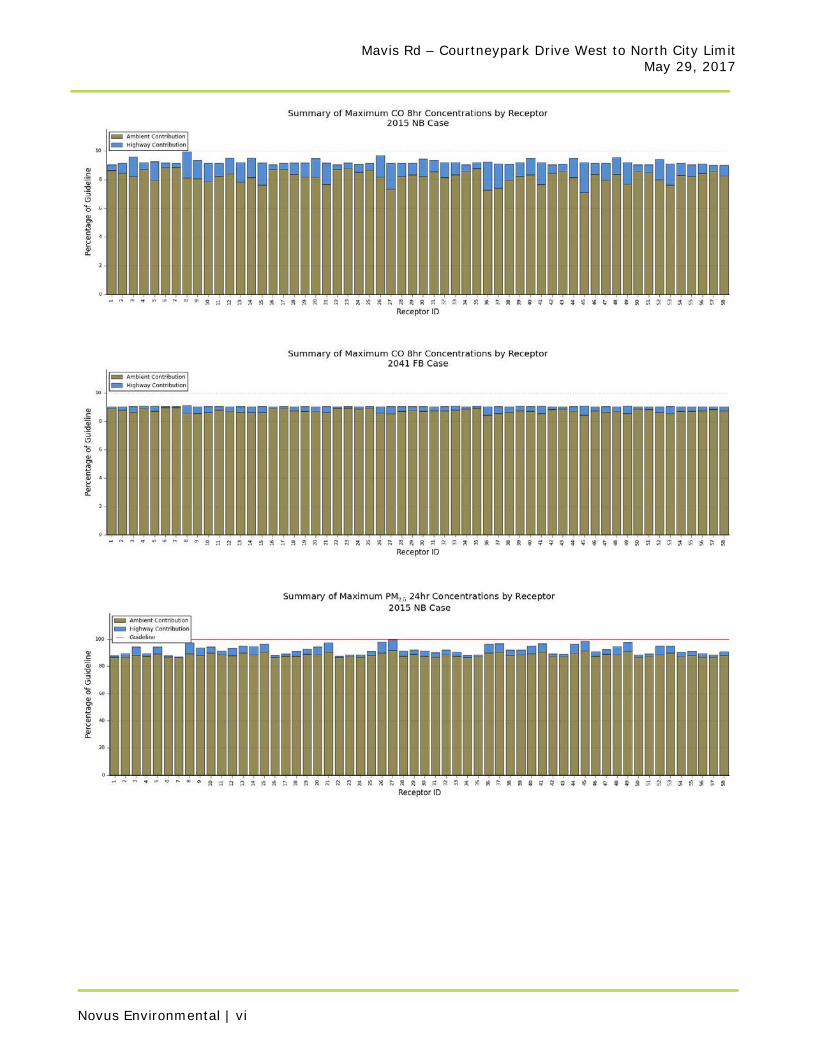
This section shows the maximum results predicted by the air dispersion modelling at each receptor within the study area for the 2015 Existing and 2041 Future Build scenarios. Figure A1 shows the location of the receptors within the study area.
Figure A1: Receptor R1-R16 Locations within the Study Area
Mavis Rd – Courtneypark Drive West to North City Limit May 29, 2017
Novus Environmental | ii
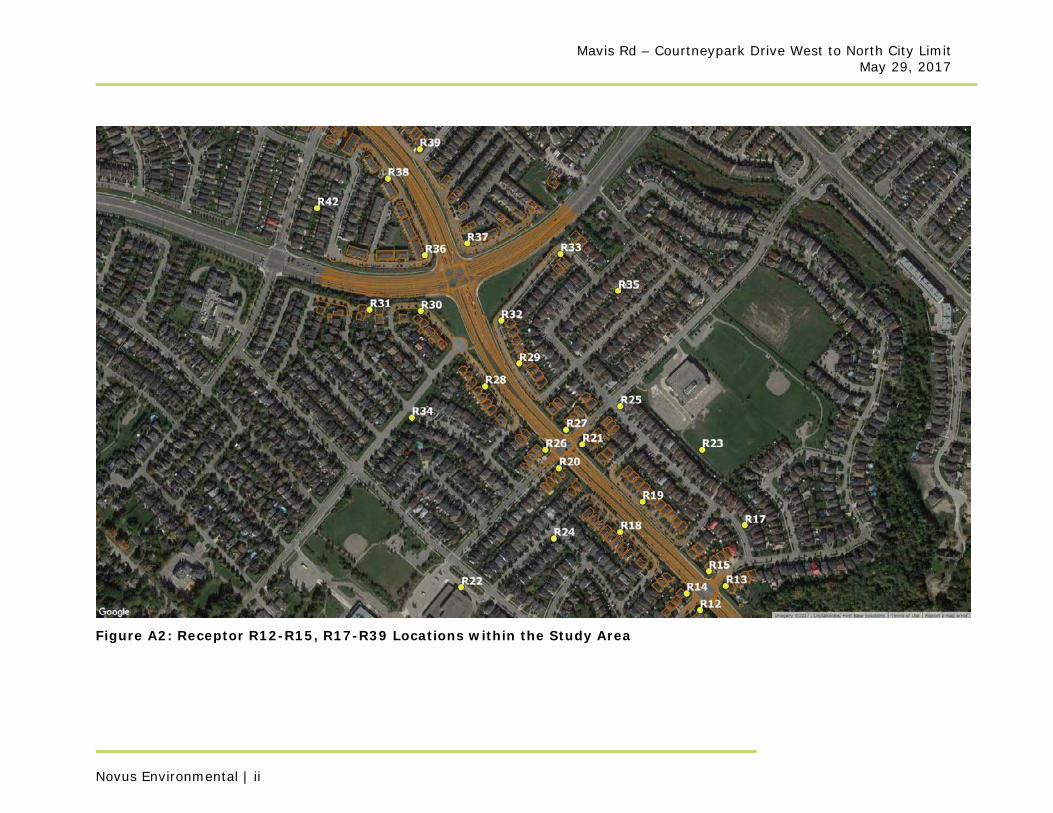
Figure A2: Receptor R12-R15, R17-R39 Locations within the Study Area
Mavis Rd – Courtneypark Drive West to North City Limit May 29, 2017
Novus Environmental | iii
Figure A3: Receptor R36-R58 Locations within the Study Area
Mavis Rd – Courtneypark Drive West to North City Limit May 29, 2017
Novus Environmental | iv
Mavis Rd – Courtneypark Drive West to North City Limit May 29, 2017
Novus Environmental | v
Mavis Rd – Courtneypark Drive West to North City Limit May 29, 2017
Novus Environmental | vi
Mavis Rd – Courtneypark Drive West to North City Limit May 29, 2017
Novus Environmental | vii
Mavis Rd – Courtneypark Drive West to North City Limit May 29, 2017
Novus Environmental | viii
Mavis Rd – Courtneypark Drive West to North City Limit May 29, 2017
Novus Environmental | ix
Mavis Rd – Courtneypark Drive West to North City Limit May 29, 2017
Novus Environmental | x
Mavis Rd – Courtneypark Drive West to North City Limit May 29, 2017
Novus Environmental | xi
Mavis Rd – Courtneypark Drive West to North City Limit May 29, 2017
Novus Environmental | xii
Mavis Rd – Courtneypark Drive West to North City Limit May 29, 2017
Novus Environmental | xiii

Mavis Rd – Courtneypark Drive West to North City Limit May 29, 2017
Novus Environmental | xiv

Air Quality | Sound & Vibration | Sustainable Water | Wind & Climate Novus Environmental Inc. | 150 Research Lane, Suite 105, Guelph, Ontario, Canada N1G 4T2
Novus West Inc. | 906 – 12 Avenue SW, Suite 600, Calgary, Alberta, Canada T2R 1K7
Local Air Quality Assessment Mavis Road North – Class EA From the North City Limit (Mississauga) to Ray Lawson Boulevard Regional Municipality of Peel, Ontario Novus Reference No. 15-0367 Version No. 2 (FINAL) May 29, 2017
NOVUS PROJECT TEAM:
Engineer: Jenny Vesely, P.Eng. Senior Engineer: Jason Slusarczyk, P. Eng. Project Manager/Specialist: Scott Shayko, Hon. B. Comm., B.Sc.

This page intentionally left blank
for 2-sided printing purposes
Mavis Rd – North City Limit to Ray Lawson Boulevard May 29, 2017
Novus Environmental | 1
Table of Contents
Introduction ......................................................................................................................... 3
1.1 Study Objectives ....................................................................................................... 3 1.2 Contaminants of Interest .......................................................................................... 4 1.3 Applicable Guidelines .............................................................................................. 5 1.4 General Assessment Methodology ........................................................................... 6
Background Ambient Data .................................................................................................. 7
2.1 Overview .................................................................................................................. 7 2.2 Selection of Relevant Ambient Monitoring Stations ............................................... 8 2.3 Selection of Worst-Case Monitoring Stations ........................................................ 10 2.4 Detailed Analysis of Selected Worst-case Monitoring Stations ............................ 11
Local Air Quality Assessment .......................................................................................... 13
3.1 Overview ................................................................................................................ 13 3.2 Location of Sensitive Receptors within the Study Area ......................................... 13 3.3 Road Traffic Data ................................................................................................... 14 3.4 Meteorological Data ............................................................................................... 16 3.5 Motor Vehicle Emission Rates ............................................................................... 17 3.6 Re-suspended Particulate Matter Emission Rates .................................................. 19 3.7 Air Dispersion Modelling Using CAL3QHCR ...................................................... 19 3.8 Modelling Results ................................................................................................... 20
Greenhouse Gas Assessment ............................................................................................. 31 Air Quality Impacts During Construction ......................................................................... 32 Conclusions and Recommendations ................................................................................. 33 References ......................................................................................................................... 35
List of Tables
Table 1: Contaminants of Interest ................................................................................................. 5 Table 2: Applicable Contaminant Guidelines ............................................................................... 6 Table 3: Relevant MOECC and NAPS Station Information ........................................................ 9 Table 4: Comparison and Selection of Background Concentrations .......................................... 11 Table 5: 2015 Traffic Volumes (AADT) Used in the Assessment ............................................. 15 Table 6: 2041 Traffic Volumes (AADT) Used in the Assessment ............................................. 15 Table 7: Hourly Vehicle Distribution ......................................................................................... 16 Table 8: MOVES Input Parameters ............................................................................................ 18 Table 9: MOVES Output Emission Factors for Roadway Vehicles (g/VMT); Idle
Emission Rates are grams per vehicle hour .............................................................. 18 Table 10: Re-suspended Particulate Matter Emission Factors ................................................... 19 Table 11: CAL3QHCR Model Input Parameters ........................................................................ 20
Mavis Rd – North City Limit to Ray Lawson Boulevard May 29, 2017
Novus Environmental | 2
Table 12: Worst-Case Sensitive Receptors for 2041 Future Build Scenario .............................. 21 Table 13: Summary of Predicted NO2 Concentrations ............................................................... 22 Table 14: Summary of Predicted CO Concentrations ................................................................. 23 Table 15: Summary of Predicted PM2.5 Concentrations ............................................................. 24 Table 16: Summary of Predicted PM10 Concentrations .............................................................. 25 Table 17: Summary of Predicted TSP Concentrations ............................................................... 26 Table 18: Summary of Predicted Acetaldehyde Concentrations ................................................ 27 Table 19: Summary of Predicted Acrolein Concentrations ........................................................ 28 Table 20: Summary of Predicted Benzene Concentrations ........................................................ 29 Table 21: Summary of Predicted 1,3-Butadiene Concentrations ................................................ 30 Table 22: Summary of Predicted Formaldehyde Concentrations ............................................... 31 Table 23: Summary of Mavis Road Traffic Volumes, Roadway Length and Emission
Rates .......................................................................................................................... 32 Table 24: Predicted GHG Emissions .......................................................................................... 32 Table 25: Summary of 2041 Future Build Results ..................................................................... 34
List of Figures
Figure 1: Study Area Showing the Proposed Roadway Widening (In Orange) ........................... 3 Figure 2: Motor Vehicle Emission Sources .................................................................................. 4 Figure 3: Effect of Trans-Boundary Air Pollution (MOECC, 2005) ............................................ 7 Figure 4: Typical Wind Direction during an Ontario Smog Episode ........................................... 8 Figure 5: Relevant MOECC (shown in red) and NAPS (shown in green) Monitoring
Stations; Windsor NAPS Station Not Shown; Study Area in Orange ........................ 9 Figure 6: Summary of Background Conditions Applied in the Assessment .............................. 12 Figure 7: Receptor Locations Within the Study Area ................................................................. 14 Figure 8: Wind Frequency Diagram for Toronto Pearson International Airport (2011-
2015) ......................................................................................................................... 17

Mavis Rd – North City Limit to Ray Lawson Boulevard May 29, 2017
Novus Environmental | 3
Introduction
Novus Environmental Inc. (Novus) was retained by WSP/MMM Group to conduct an air quality assessment for the Mavis Road Class EA between the Mississauga northern City limit and Ray Lawson Boulevard. Novus previously conducted an air quality assessment for the widening of Mavis Road between Courtneypark Drive West and the northern City limit, which is summarized in our report dated February 8, 2017. This assessment is an extension of the southern Mavis Road project and includes widening the roadway to six lanes between the northern City limit and Ray Lawson Boulevard. This report assesses the impacts of the roadway widening at nearby sensitive receptors. The study area is approximately 1 km in length and is shown in orange in Figure 1.
Figure 1: Study Area Showing the Proposed Roadway Widening (In Orange)
1.1 Study Objectives
The main objective of the study was to assess the local air quality impacts due to the proposed widening of Mavis Road to six lanes between the northern City limit and Ray Lawson Boulevard. The study also included an assessment of total greenhouse (GHG) emissions due to the project, and an overview of construction impacts. To meet these objectives, the following scenarios were considered:
Mavis Rd – North City Limit to Ray Lawson Boulevard May 29, 2017
Novus Environmental | 4
2015 Existing – Assess the existing air quality conditions at representative receptors. Predicted contaminant concentrations from the existing roadway were combined with hourly measured ambient concentrations to determine the combined impact.
2041 Future Build – Assess the future air quality conditions for the proposed roadway improvements. Predicted contaminant concentrations from the proposed roadway improvements were combined with hourly measured ambient concentrations to determine the combined impact.
1.2 Contaminants of Interest
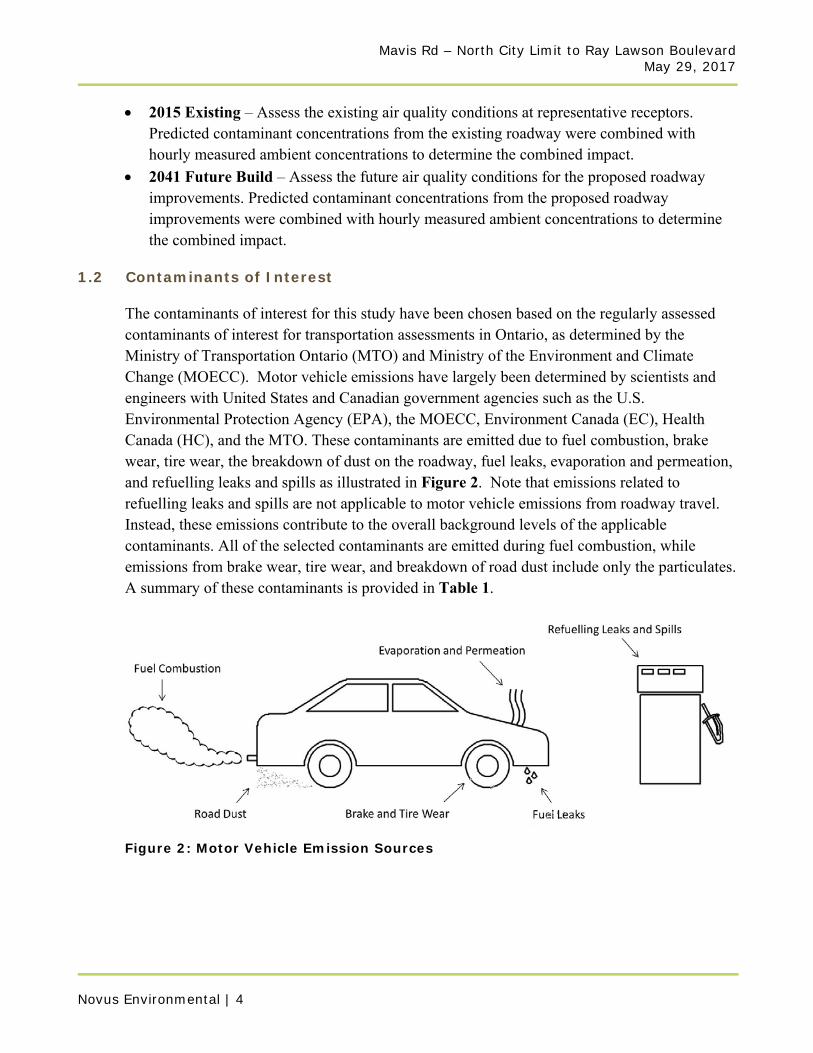
The contaminants of interest for this study have been chosen based on the regularly assessed contaminants of interest for transportation assessments in Ontario, as determined by the Ministry of Transportation Ontario (MTO) and Ministry of the Environment and Climate Change (MOECC). Motor vehicle emissions have largely been determined by scientists and engineers with United States and Canadian government agencies such as the U.S. Environmental Protection Agency (EPA), the MOECC, Environment Canada (EC), Health Canada (HC), and the MTO. These contaminants are emitted due to fuel combustion, brake wear, tire wear, the breakdown of dust on the roadway, fuel leaks, evaporation and permeation, and refuelling leaks and spills as illustrated in Figure 2. Note that emissions related to refuelling leaks and spills are not applicable to motor vehicle emissions from roadway travel. Instead, these emissions contribute to the overall background levels of the applicable contaminants. All of the selected contaminants are emitted during fuel combustion, while emissions from brake wear, tire wear, and breakdown of road dust include only the particulates. A summary of these contaminants is provided in Table 1.
Figure 2: Motor Vehicle Emission Sources
Mavis Rd – North City Limit to Ray Lawson Boulevard May 29, 2017
Novus Environmental | 5
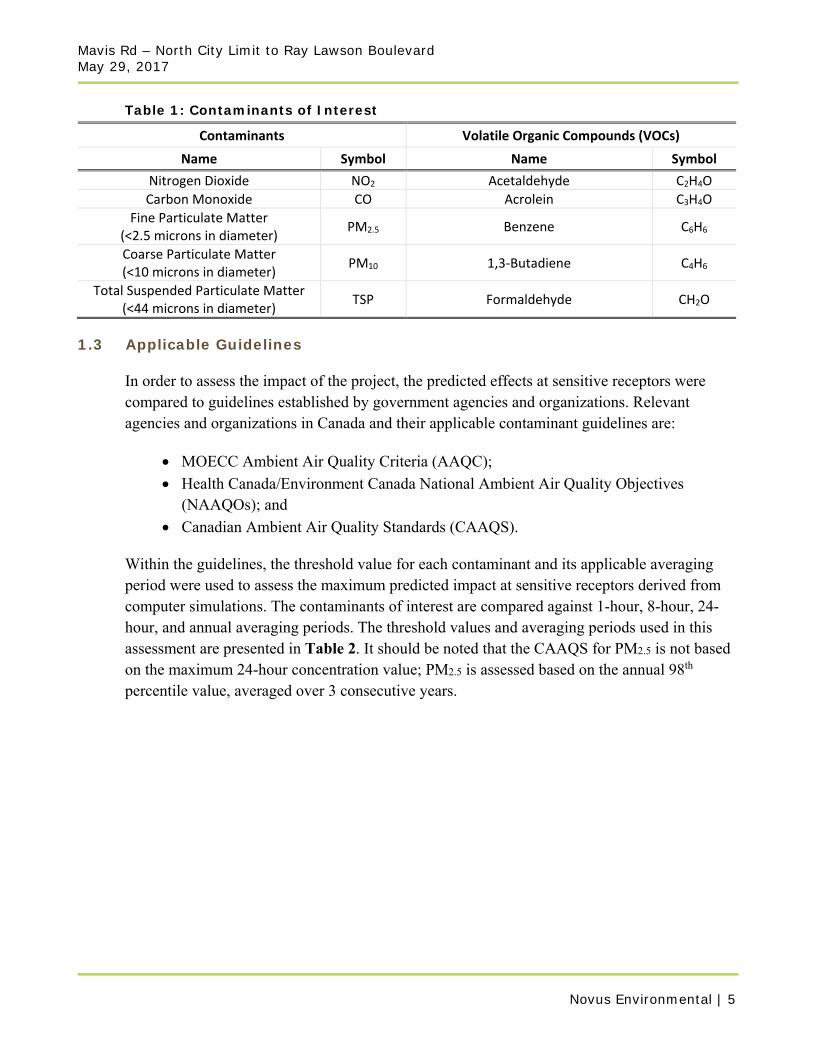
Table 1: Contaminants of Interest
Contaminants Volatile Organic Compounds (VOCs)
Name Symbol Name Symbol
Nitrogen Dioxide NO2 Acetaldehyde C2H4O
Carbon Monoxide CO Acrolein C3H4O
Fine Particulate Matter (<2.5 microns in diameter)
PM2.5 Benzene C6H6
Coarse Particulate Matter (<10 microns in diameter)
PM10 1,3‐Butadiene C4H6
Total Suspended Particulate Matter (<44 microns in diameter)
TSP Formaldehyde CH2O
1.3 Applicable Guidelines
In order to assess the impact of the project, the predicted effects at sensitive receptors were compared to guidelines established by government agencies and organizations. Relevant agencies and organizations in Canada and their applicable contaminant guidelines are:
MOECC Ambient Air Quality Criteria (AAQC);
Health Canada/Environment Canada National Ambient Air Quality Objectives (NAAQOs); and
Canadian Ambient Air Quality Standards (CAAQS).
Within the guidelines, the threshold value for each contaminant and its applicable averaging period were used to assess the maximum predicted impact at sensitive receptors derived from computer simulations. The contaminants of interest are compared against 1-hour, 8-hour, 24-hour, and annual averaging periods. The threshold values and averaging periods used in this assessment are presented in Table 2. It should be noted that the CAAQS for PM2.5 is not based on the maximum 24-hour concentration value; PM2.5 is assessed based on the annual 98th percentile value, averaged over 3 consecutive years.
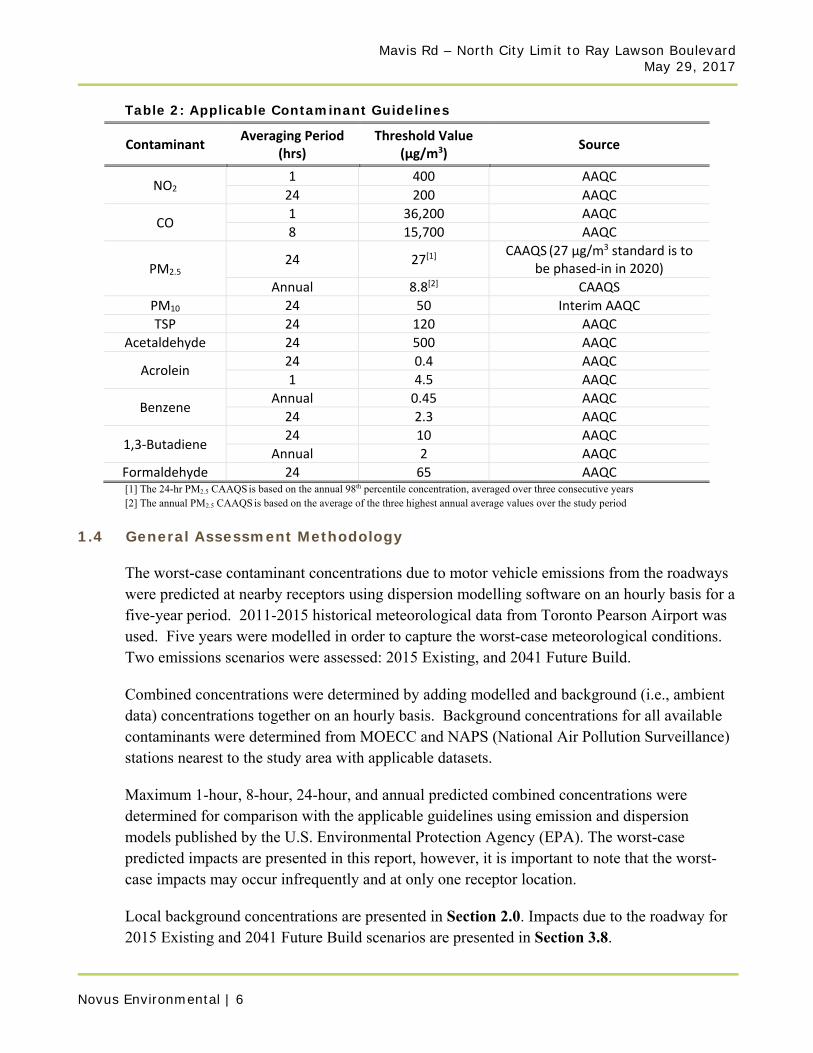
Mavis Rd – North City Limit to Ray Lawson Boulevard May 29, 2017
Novus Environmental | 6
Table 2: Applicable Contaminant Guidelines
Contaminant Averaging Period
(hrs) Threshold Value
(µg/m3) Source
NO2 1 400 AAQC
24 200 AAQC
CO 1 36,200 AAQC
8 15,700 AAQC
PM2.5 24 27[1]
CAAQS (27 µg/m3 standard is to be phased‐in in 2020)
Annual 8.8[2] CAAQS
PM10 24 50 Interim AAQC
TSP 24 120 AAQC
Acetaldehyde 24 500 AAQC
Acrolein 24 0.4 AAQC
1 4.5 AAQC
Benzene Annual 0.45 AAQC
24 2.3 AAQC
1,3‐Butadiene 24 10 AAQC
Annual 2 AAQC
Formaldehyde 24 65 AAQC [1] The 24-hr PM2.5 CAAQS is based on the annual 98th percentile concentration, averaged over three consecutive years [2] The annual PM2.5 CAAQS is based on the average of the three highest annual average values over the study period
1.4 General Assessment Methodology
The worst-case contaminant concentrations due to motor vehicle emissions from the roadways were predicted at nearby receptors using dispersion modelling software on an hourly basis for a five-year period. 2011-2015 historical meteorological data from Toronto Pearson Airport was used. Five years were modelled in order to capture the worst-case meteorological conditions. Two emissions scenarios were assessed: 2015 Existing, and 2041 Future Build.
Combined concentrations were determined by adding modelled and background (i.e., ambient data) concentrations together on an hourly basis. Background concentrations for all available contaminants were determined from MOECC and NAPS (National Air Pollution Surveillance) stations nearest to the study area with applicable datasets.
Maximum 1-hour, 8-hour, 24-hour, and annual predicted combined concentrations were determined for comparison with the applicable guidelines using emission and dispersion models published by the U.S. Environmental Protection Agency (EPA). The worst-case predicted impacts are presented in this report, however, it is important to note that the worst-case impacts may occur infrequently and at only one receptor location.
Local background concentrations are presented in Section 2.0. Impacts due to the roadway for 2015 Existing and 2041 Future Build scenarios are presented in Section 3.8.

Mavis Rd – North City Limit to Ray Lawson Boulevard May 29, 2017
Novus Environmental | 7
Background Ambient Data
2.1 Overview
Background (ambient) conditions are measured contaminant concentrations that are independent of emissions from the proposed project infrastructure. These concentrations consist of trans-boundary (macro-scale), regional (meso-scale), and local (micro-scale) emission sources and result from both primary and secondary formation. Primary contaminants are emitted directly by the source and secondary contaminants are formed by complex chemical reactions in the atmosphere. Secondary pollution is generally formed over great distances in the presence of sunlight and heat and most noticeably results in the formation of fine particulate matter (PM2.5) and ground-level ozone (O3), also considered smog.
In Ontario, a significant amount of smog originates from emission sources in the United States which is the major contributor during smog events which usually occur in the summer season (MOECC, 2005). During smog episodes, the U.S. contribution to PM2.5 can be as much as 90 percent near the southwest Ontario-U.S. border. The effects of U.S. air pollution in Ontario on a high PM2.5 day and on an average PM2.5 spring/summer day are illustrated in Figure 3.
High PM2.5 Days Average PM2.5 of Spring/Summer Season
Figure 3: Effect of Trans-Boundary Air Pollution (MOECC, 2005)
Air pollution is strongly influenced by weather systems (i.e., meteorology) that commonly move out of central Canada into the mid-west of the U.S. then eastward to the Atlantic coast. This weather system generally produces winds blowing from the southwest that can travel over major emission sources in the U.S. and result in the transport of pollution into Ontario. This phenomenon is demonstrated in the following figure and is based on a computer simulation from the Weather Research and Forecasting (WRF) Model.
US + Background Ontario
US + Background Ontario

Mavis Rd – North City Limit to Ray Lawson Boulevard May 29, 2017
Novus Environmental | 8
Figure 4: Typical Wind Direction during an Ontario Smog Episode
As discussed, understanding the composition of background air pollution and its influences are important in determining potential impacts of a project, considering that the majority of the combined concentrations are typically due to existing ambient background levels. In this assessment, background conditions were characterized utilizing existing ambient monitoring data from MOECC and NAPS Network stations and added to the modelled predictions in order to conservatively estimate combined concentrations.
2.2 Selection of Relevant Ambient Monitoring Stations
A review of MOECC and NAPS ambient monitoring stations in Ontario was undertaken to identify the monitoring stations that are in relative proximity to the study area and that would be representative of background contaminant concentrations in the study area. Four MOECC (Brampton, Mississauga, Oakville and Toronto West) and five NAPS (Brampton, Etobicoke North, Etobicoke South, Toronto Downtown and Windsor) stations were selected for the analysis. Note that Windsor is the only station in Ontario at which background Acrolein, Formaldehyde, and Acetaldehyde are measured in recent years. Only these contaminants were considered from the Windsor station; the remaining contaminants from the Windsor station were not considered given the stations’ distance from the study area. The locations of the relevant ambient monitoring stations in relation to the study area are shown in Figure 5. Station information is presented in Table 3.
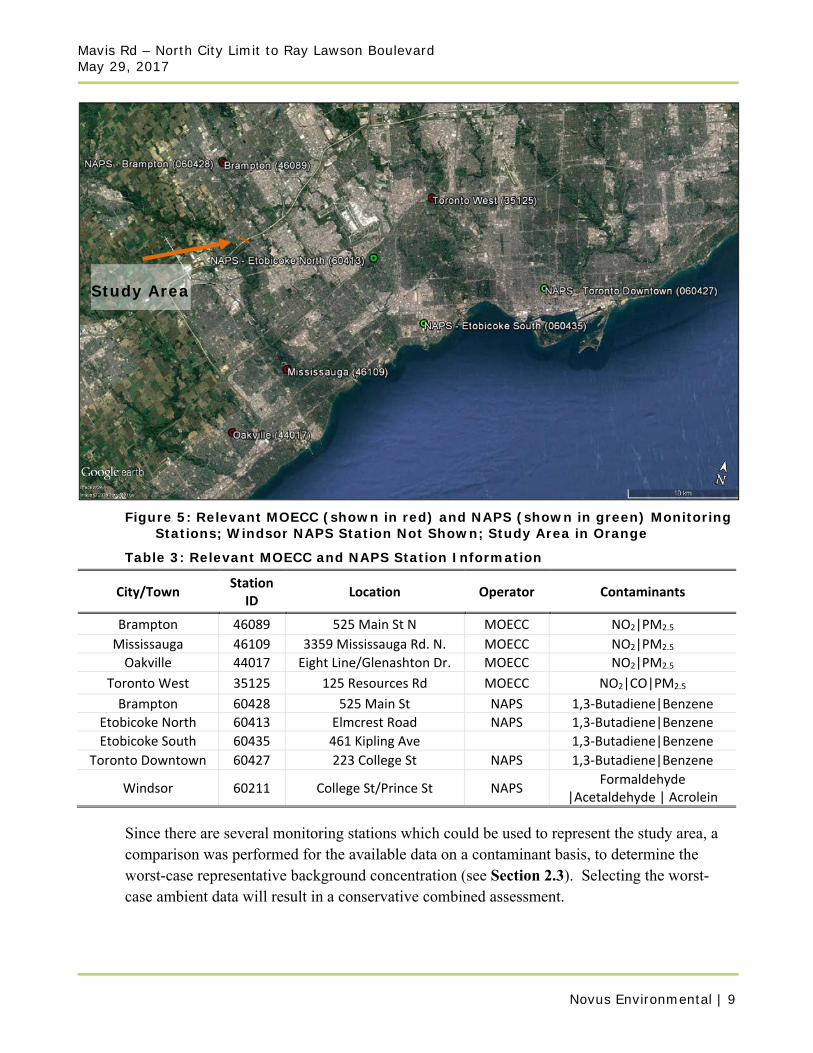
Mavis Rd – North City Limit to Ray Lawson Boulevard May 29, 2017
Novus Environmental | 9
Figure 5: Relevant MOECC (shown in red) and NAPS (shown in green) Monitoring
Stations; Windsor NAPS Station Not Shown; Study Area in Orange
Table 3: Relevant MOECC and NAPS Station Information
City/Town Station
ID Location Operator Contaminants
Brampton 46089 525 Main St N MOECC NO2|PM2.5
Mississauga 46109 3359 Mississauga Rd. N. MOECC NO2|PM2.5
Oakville 44017 Eight Line/Glenashton Dr. MOECC NO2|PM2.5
Toronto West 35125 125 Resources Rd MOECC NO2|CO|PM2.5
Brampton 60428 525 Main St NAPS 1,3‐Butadiene|Benzene
Etobicoke North 60413 Elmcrest Road NAPS 1,3‐Butadiene|Benzene
Etobicoke South 60435 461 Kipling Ave 1,3‐Butadiene|Benzene
Toronto Downtown 60427 223 College St NAPS 1,3‐Butadiene|Benzene
Windsor 60211 College St/Prince St NAPS Formaldehyde
|Acetaldehyde | Acrolein
Since there are several monitoring stations which could be used to represent the study area, a comparison was performed for the available data on a contaminant basis, to determine the worst-case representative background concentration (see Section 2.3). Selecting the worst-case ambient data will result in a conservative combined assessment.
Study Area
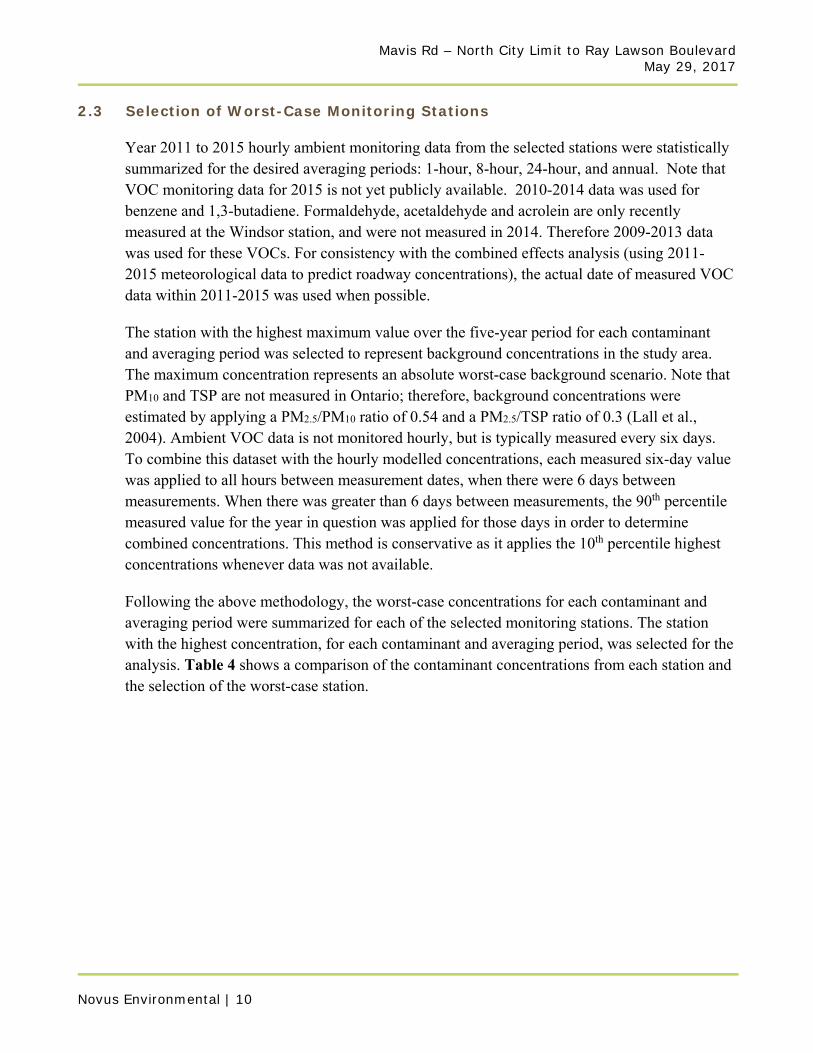
Mavis Rd – North City Limit to Ray Lawson Boulevard May 29, 2017
Novus Environmental | 10
2.3 Selection of Worst-Case Monitoring Stations
Year 2011 to 2015 hourly ambient monitoring data from the selected stations were statistically summarized for the desired averaging periods: 1-hour, 8-hour, 24-hour, and annual. Note that VOC monitoring data for 2015 is not yet publicly available. 2010-2014 data was used for benzene and 1,3-butadiene. Formaldehyde, acetaldehyde and acrolein are only recently measured at the Windsor station, and were not measured in 2014. Therefore 2009-2013 data was used for these VOCs. For consistency with the combined effects analysis (using 2011-2015 meteorological data to predict roadway concentrations), the actual date of measured VOC data within 2011-2015 was used when possible.
The station with the highest maximum value over the five-year period for each contaminant and averaging period was selected to represent background concentrations in the study area. The maximum concentration represents an absolute worst-case background scenario. Note that PM10 and TSP are not measured in Ontario; therefore, background concentrations were estimated by applying a PM2.5/PM10 ratio of 0.54 and a PM2.5/TSP ratio of 0.3 (Lall et al., 2004). Ambient VOC data is not monitored hourly, but is typically measured every six days. To combine this dataset with the hourly modelled concentrations, each measured six-day value was applied to all hours between measurement dates, when there were 6 days between measurements. When there was greater than 6 days between measurements, the 90th percentile measured value for the year in question was applied for those days in order to determine combined concentrations. This method is conservative as it applies the 10th percentile highest concentrations whenever data was not available.
Following the above methodology, the worst-case concentrations for each contaminant and averaging period were summarized for each of the selected monitoring stations. The station with the highest concentration, for each contaminant and averaging period, was selected for the analysis. Table 4 shows a comparison of the contaminant concentrations from each station and the selection of the worst-case station.
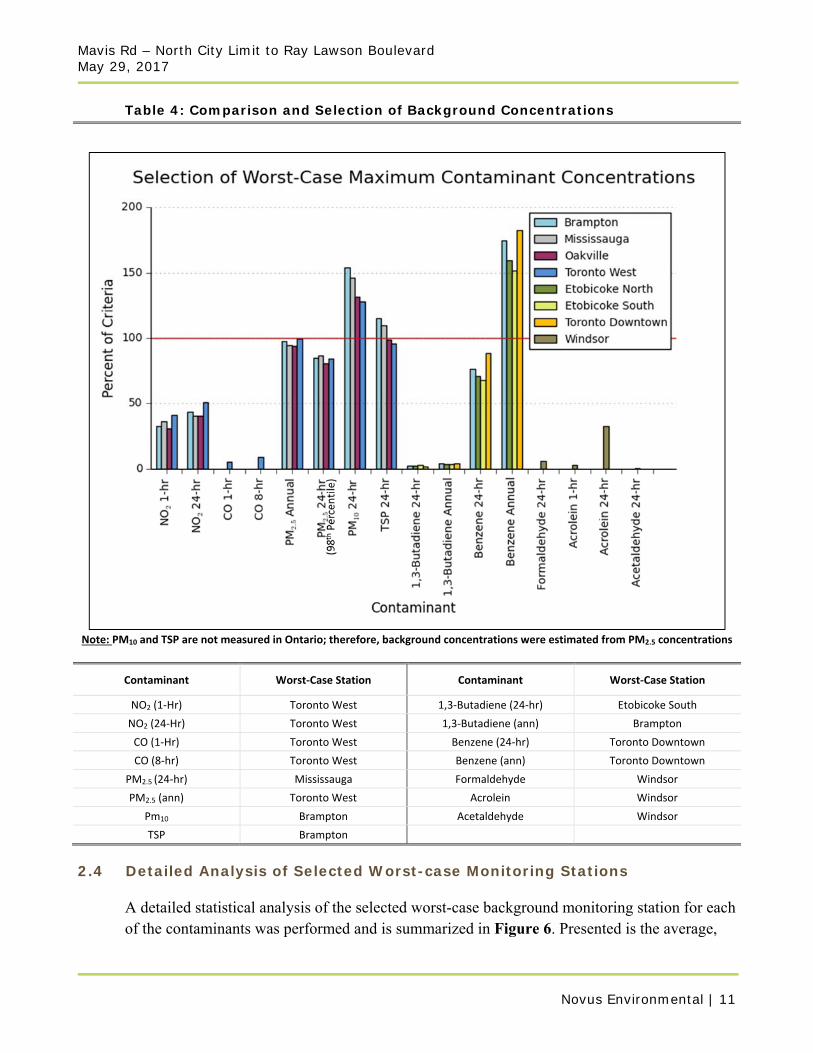
Mavis Rd – North City Limit to Ray Lawson Boulevard May 29, 2017
Novus Environmental | 11
Table 4: Comparison and Selection of Background Concentrations
Note: PM10 and TSP are not measured in Ontario; therefore, background concentrations were estimated from PM2.5 concentrations
Contaminant Worst‐Case Station Contaminant Worst‐Case Station
NO2 (1‐Hr) Toronto West 1,3‐Butadiene (24‐hr) Etobicoke South
NO2 (24‐Hr) Toronto West 1,3‐Butadiene (ann) Brampton
CO (1‐Hr) Toronto West Benzene (24‐hr) Toronto Downtown
CO (8‐hr) Toronto West Benzene (ann) Toronto Downtown
PM2.5 (24‐hr) Mississauga Formaldehyde Windsor
PM2.5 (ann) Toronto West Acrolein Windsor
Pm10 Brampton Acetaldehyde Windsor
TSP Brampton
2.4 Detailed Analysis of Selected Worst-case Monitoring Stations
A detailed statistical analysis of the selected worst-case background monitoring station for each of the contaminants was performed and is summarized in Figure 6. Presented is the average,
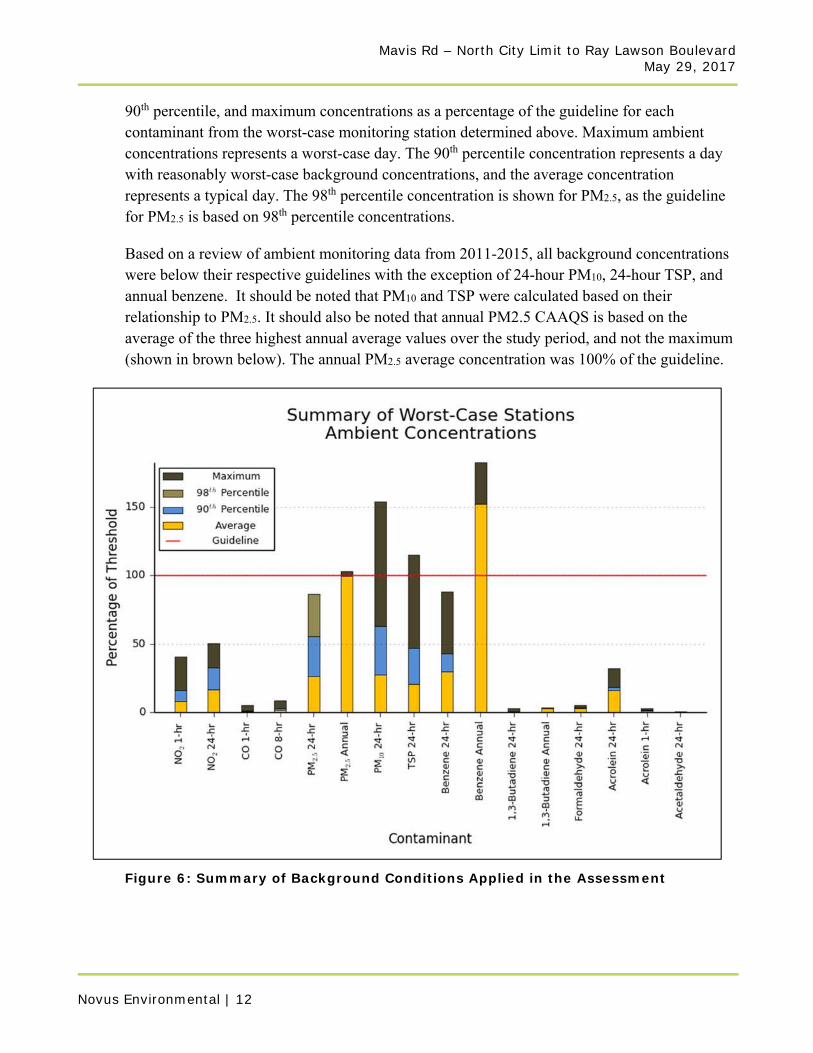
Mavis Rd – North City Limit to Ray Lawson Boulevard May 29, 2017
Novus Environmental | 12
90th percentile, and maximum concentrations as a percentage of the guideline for each contaminant from the worst-case monitoring station determined above. Maximum ambient concentrations represents a worst-case day. The 90th percentile concentration represents a day with reasonably worst-case background concentrations, and the average concentration represents a typical day. The 98th percentile concentration is shown for PM2.5, as the guideline for PM2.5 is based on 98th percentile concentrations.
Based on a review of ambient monitoring data from 2011-2015, all background concentrations were below their respective guidelines with the exception of 24-hour PM10, 24-hour TSP, and annual benzene. It should be noted that PM10 and TSP were calculated based on their relationship to PM2.5. It should also be noted that annual PM2.5 CAAQS is based on the average of the three highest annual average values over the study period, and not the maximum (shown in brown below). The annual PM2.5 average concentration was 100% of the guideline.
Figure 6: Summary of Background Conditions Applied in the Assessment
Mavis Rd – North City Limit to Ray Lawson Boulevard May 29, 2017
Novus Environmental | 13
Local Air Quality Assessment
3.1 Overview
The worst-case impacts due to roadway vehicle emissions were assessed for two scenarios: 2015 Existing (or No Build/NB) and 2041 Future Build (FB). The two scenarios include the following activities:
2015 Existing (NB): Existing traffic volumes on Mavis Road and arterial roads for the existing
alignment. Note that the existing configuration considers the 4-lane alignment of Mavis Road.
2041 Future Build (FB): Projected vehicle volumes on Mavis Road and arterial roads for the proposed
widened alignment to 6-lanes.
The assessment was performed using U.S. EPA approved vehicle emission and air dispersion models to predict worst-case impacts at representative sensitive receptor locations. The assessment was conducted in accordance with the MTO Environmental Guide for Assessing and Mitigating the Air Quality Impacts and Greenhouse Gas Emissions of Provincial Transportation Projects. The details of the assessment are discussed below.
3.2 Location of Sensitive Receptors within the Study Area
Land uses which are defined as sensitive receptors for evaluating potential air quality effects are:
Health care facilities;
Senior citizens’ residences or long-term care facilities;
Child care facilities;
Educational facilities;
Places of worship; and
Residential dwellings.
Seventeen sensitive receptors were evaluated to represent worst-case impacts surrounding the project area. All receptors represented residential locations surrounding the roadway. The receptor locations are identified in Figure 7.
Representative worst-case impacts were predicted through dispersion modelling at the sensitive receptors closest to the roadway. This is due to the fact that contaminant concentrations disperse significantly with downwind distance from the roadway resulting in reduced contaminant concentrations. At approximately 500 m from the roadway, contaminant
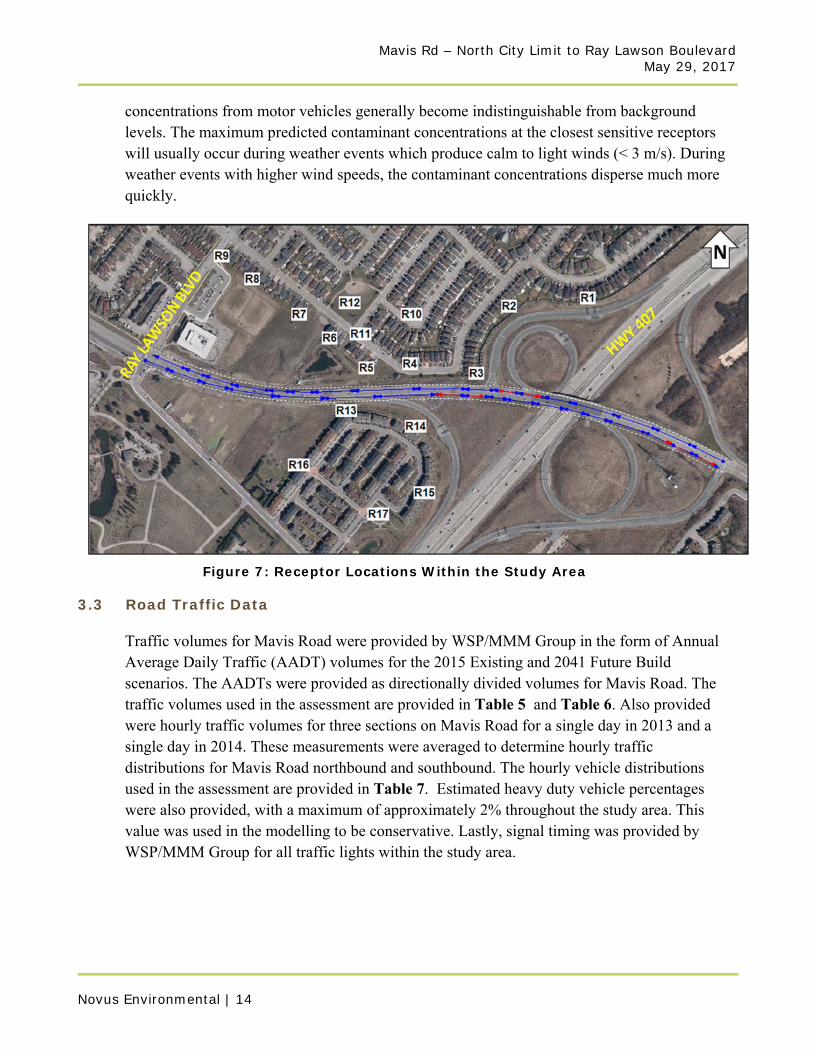
Mavis Rd – North City Limit to Ray Lawson Boulevard May 29, 2017
Novus Environmental | 14
concentrations from motor vehicles generally become indistinguishable from background levels. The maximum predicted contaminant concentrations at the closest sensitive receptors will usually occur during weather events which produce calm to light winds (< 3 m/s). During weather events with higher wind speeds, the contaminant concentrations disperse much more quickly.
Figure 7: Receptor Locations Within the Study Area
3.3 Road Traffic Data
Traffic volumes for Mavis Road were provided by WSP/MMM Group in the form of Annual Average Daily Traffic (AADT) volumes for the 2015 Existing and 2041 Future Build scenarios. The AADTs were provided as directionally divided volumes for Mavis Road. The traffic volumes used in the assessment are provided in Table 5 and Table 6. Also provided were hourly traffic volumes for three sections on Mavis Road for a single day in 2013 and a single day in 2014. These measurements were averaged to determine hourly traffic distributions for Mavis Road northbound and southbound. The hourly vehicle distributions used in the assessment are provided in Table 7. Estimated heavy duty vehicle percentages were also provided, with a maximum of approximately 2% throughout the study area. This value was used in the modelling to be conservative. Lastly, signal timing was provided by WSP/MMM Group for all traffic lights within the study area.
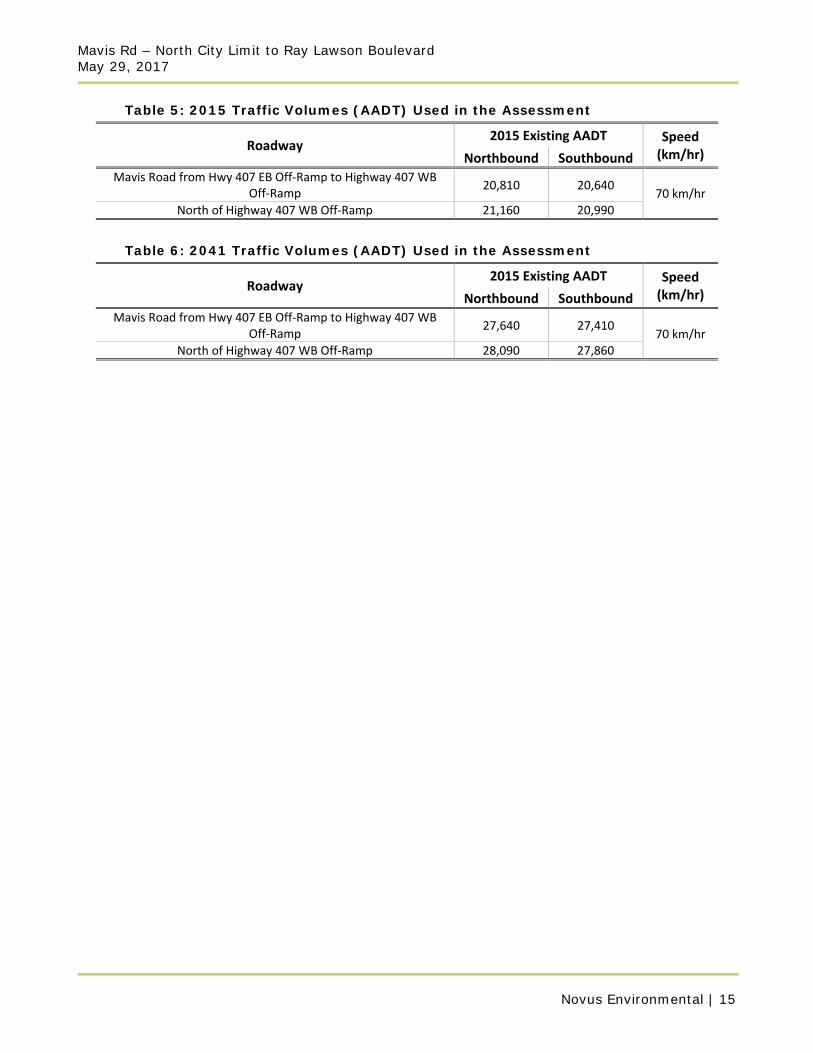
Mavis Rd – North City Limit to Ray Lawson Boulevard May 29, 2017
Novus Environmental | 15
Table 5: 2015 Traffic Volumes (AADT) Used in the Assessment
Roadway 2015 Existing AADT Speed
(km/hr) Northbound Southbound
Mavis Road from Hwy 407 EB Off‐Ramp to Highway 407 WB Off‐Ramp
20,810 20,640 70 km/hr
North of Highway 407 WB Off‐Ramp 21,160 20,990
Table 6: 2041 Traffic Volumes (AADT) Used in the Assessment
Roadway 2015 Existing AADT Speed
(km/hr) Northbound Southbound
Mavis Road from Hwy 407 EB Off‐Ramp to Highway 407 WB Off‐Ramp
27,640 27,410 70 km/hr
North of Highway 407 WB Off‐Ramp 28,090 27,860
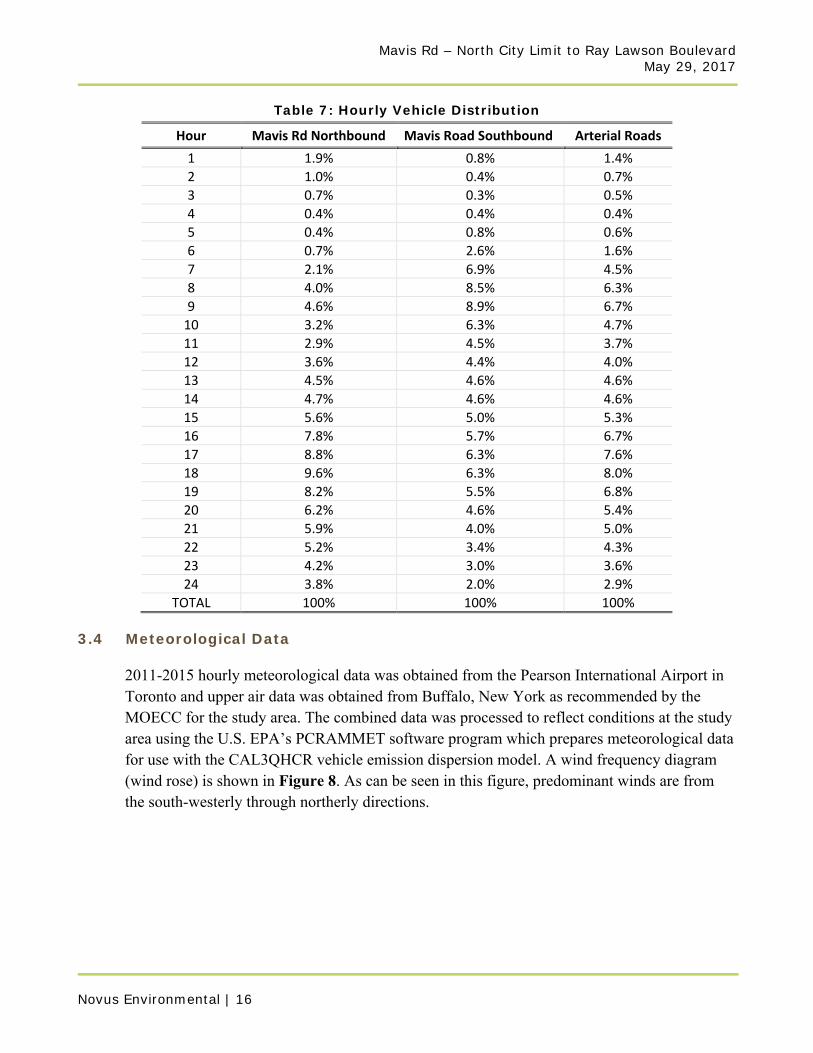
Mavis Rd – North City Limit to Ray Lawson Boulevard May 29, 2017
Novus Environmental | 16
Table 7: Hourly Vehicle Distribution
Hour Mavis Rd Northbound Mavis Road Southbound Arterial Roads
1 1.9% 0.8% 1.4%
2 1.0% 0.4% 0.7%
3 0.7% 0.3% 0.5%
4 0.4% 0.4% 0.4%
5 0.4% 0.8% 0.6%
6 0.7% 2.6% 1.6%
7 2.1% 6.9% 4.5%
8 4.0% 8.5% 6.3%
9 4.6% 8.9% 6.7%
10 3.2% 6.3% 4.7%
11 2.9% 4.5% 3.7%
12 3.6% 4.4% 4.0%
13 4.5% 4.6% 4.6%
14 4.7% 4.6% 4.6%
15 5.6% 5.0% 5.3%
16 7.8% 5.7% 6.7%
17 8.8% 6.3% 7.6%
18 9.6% 6.3% 8.0%
19 8.2% 5.5% 6.8%
20 6.2% 4.6% 5.4%
21 5.9% 4.0% 5.0%
22 5.2% 3.4% 4.3%
23 4.2% 3.0% 3.6%
24 3.8% 2.0% 2.9%
TOTAL 100% 100% 100%
3.4 Meteorological Data
2011-2015 hourly meteorological data was obtained from the Pearson International Airport in Toronto and upper air data was obtained from Buffalo, New York as recommended by the MOECC for the study area. The combined data was processed to reflect conditions at the study area using the U.S. EPA’s PCRAMMET software program which prepares meteorological data for use with the CAL3QHCR vehicle emission dispersion model. A wind frequency diagram (wind rose) is shown in Figure 8. As can be seen in this figure, predominant winds are from the south-westerly through northerly directions.

Mavis Rd – North City Limit to Ray Lawson Boulevard May 29, 2017
Novus Environmental | 17
Figure 8: Wind Frequency Diagram for Toronto Pearson International Airport
(2011-2015)
3.5 Motor Vehicle Emission Rates
The U.S. EPA’s Motor Vehicle Emission Simulator (MOVES) model provides estimates of current and future emission rates from motor vehicles based on a variety of factors such as local meteorology, vehicle fleet composition and speed. MOVES 2014a, released in November 2015, is the U.S. EPA’s latest tool for estimating vehicle emissions due to the combustion of fuel, brake and tire wear, fuel evaporation, permeation, and refuelling leaks. The model is based on “an analysis of millions of emission test results and considerable advances in the Agency's understanding of vehicle emissions and accounts for changes in emissions due to proposed standards and regulations”. For this project, MOVES was used to estimate vehicle emissions based on vehicle type, road type, model year, and vehicle speed. Emission rates were estimated based on the heavy-duty vehicle percentages provided by
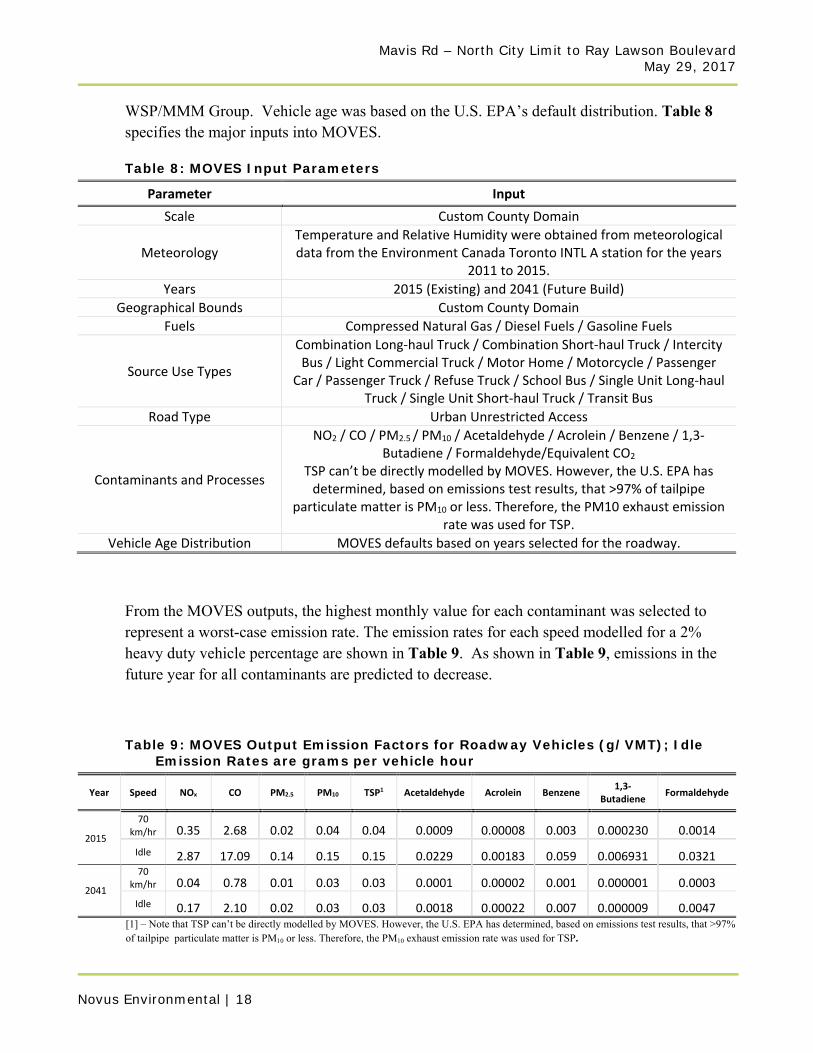
Mavis Rd – North City Limit to Ray Lawson Boulevard May 29, 2017
Novus Environmental | 18
WSP/MMM Group. Vehicle age was based on the U.S. EPA’s default distribution. Table 8 specifies the major inputs into MOVES.
Table 8: MOVES Input Parameters
Parameter Input
Scale Custom County Domain
Meteorology Temperature and Relative Humidity were obtained from meteorological data from the Environment Canada Toronto INTL A station for the years
2011 to 2015.
Years 2015 (Existing) and 2041 (Future Build)
Geographical Bounds Custom County Domain
Fuels Compressed Natural Gas / Diesel Fuels / Gasoline Fuels
Source Use Types
Combination Long‐haul Truck / Combination Short‐haul Truck / Intercity Bus / Light Commercial Truck / Motor Home / Motorcycle / Passenger
Car / Passenger Truck / Refuse Truck / School Bus / Single Unit Long‐haul Truck / Single Unit Short‐haul Truck / Transit Bus
Road Type Urban Unrestricted Access
Contaminants and Processes
NO2 / CO / PM2.5 / PM10 / Acetaldehyde / Acrolein / Benzene / 1,3‐Butadiene / Formaldehyde/Equivalent CO2
TSP can’t be directly modelled by MOVES. However, the U.S. EPA has determined, based on emissions test results, that >97% of tailpipe
particulate matter is PM10 or less. Therefore, the PM10 exhaust emission rate was used for TSP.
Vehicle Age Distribution MOVES defaults based on years selected for the roadway.
From the MOVES outputs, the highest monthly value for each contaminant was selected to represent a worst-case emission rate. The emission rates for each speed modelled for a 2% heavy duty vehicle percentage are shown in Table 9. As shown in Table 9, emissions in the future year for all contaminants are predicted to decrease.
Table 9: MOVES Output Emission Factors for Roadway Vehicles (g/VMT); Idle Emission Rates are grams per vehicle hour
Year Speed NOx CO PM2.5 PM10 TSP1 Acetaldehyde Acrolein Benzene 1,3‐
Butadiene Formaldehyde
2015
70 km/hr 0.35 2.68 0.02 0.04 0.04 0.0009 0.00008 0.003 0.000230 0.0014
Idle 2.87 17.09 0.14 0.15 0.15 0.0229 0.00183 0.059 0.006931 0.0321
2041
70 km/hr 0.04 0.78 0.01 0.03 0.03 0.0001 0.00002 0.001 0.000001 0.0003
Idle 0.17 2.10 0.02 0.03 0.03 0.0018 0.00022 0.007 0.000009 0.0047 [1] – Note that TSP can’t be directly modelled by MOVES. However, the U.S. EPA has determined, based on emissions test results, that >97% of tailpipe particulate matter is PM10 or less. Therefore, the PM10 exhaust emission rate was used for TSP.

Mavis Rd – North City Limit to Ray Lawson Boulevard May 29, 2017
Novus Environmental | 19
3.6 Re-suspended Particulate Matter Emission Rates
A large portion of roadway particulate matter emissions comes from dust on the pavement which is re-suspended by vehicles travelling on the roadway. These emissions are estimated using empirically derived values presented by the U.S. EPA in their AP-42 report. The emissions factors for re-suspended PM were estimated by using the following equation from U.S. EPA’s Document AP-42 report, Chapter 13.2.1.3 and are summarized in Table 10.
. ∗ .
Where: E = the particulate emission factor k = the particulate size multiplier sL = silt loading
W = average vehicle weight (Assumed 3 Tons based on fleet data and U.S. EPA vehicle weight and distribution)
Table 10: Re-suspended Particulate Matter Emission Factors
Roadway AADT
K
(PM2.5/PM10/TSP)
sL
(g/m2)
W
(Tons)
E (g/VMT)
PM2.5 PM10 TSP
<500 0.25/1.0/5.24 0.6 3 0.503 2.015 10.561
500‐5,000 0.25/1.0/5.24 0.2 3 0.185 0.741 3.886
5,000‐10,000
0.25/1.0/5.24 0.06 3 0.061 0.247 1.299
>10,000 0.25/1.0/5.24 0.03 3 0.0176 0.070 0.368
3.7 Air Dispersion Modelling Using CAL3QHCR
The U.S. EPA’s CAL3QHCR dispersion model, based on the Gaussian plume equation, was specifically designed to predict air quality impacts from roadways using site specific meteorological data, vehicle emissions, traffic data, and signal data. The model input requirements include roadway geometry, sensitive receptor locations, meteorology, traffic volumes, and motor vehicle emission rates as well as some contaminant physical properties such as settling and deposition velocities. CAL3QHCR uses this information to calculate hourly concentrations which are then used to determine 1-hour, 8-hour, 24-hour and annual averages for the contaminants of interest at the identified sensitive receptor locations. Table 11 provides the major inputs used in CAL3QHCR. The emission rates used in the model were the outputs from the MOVES and AP-42 models, weighted for the vehicle fleet distributions provided. The outputs of CAL3QHCR are presented in the results section.
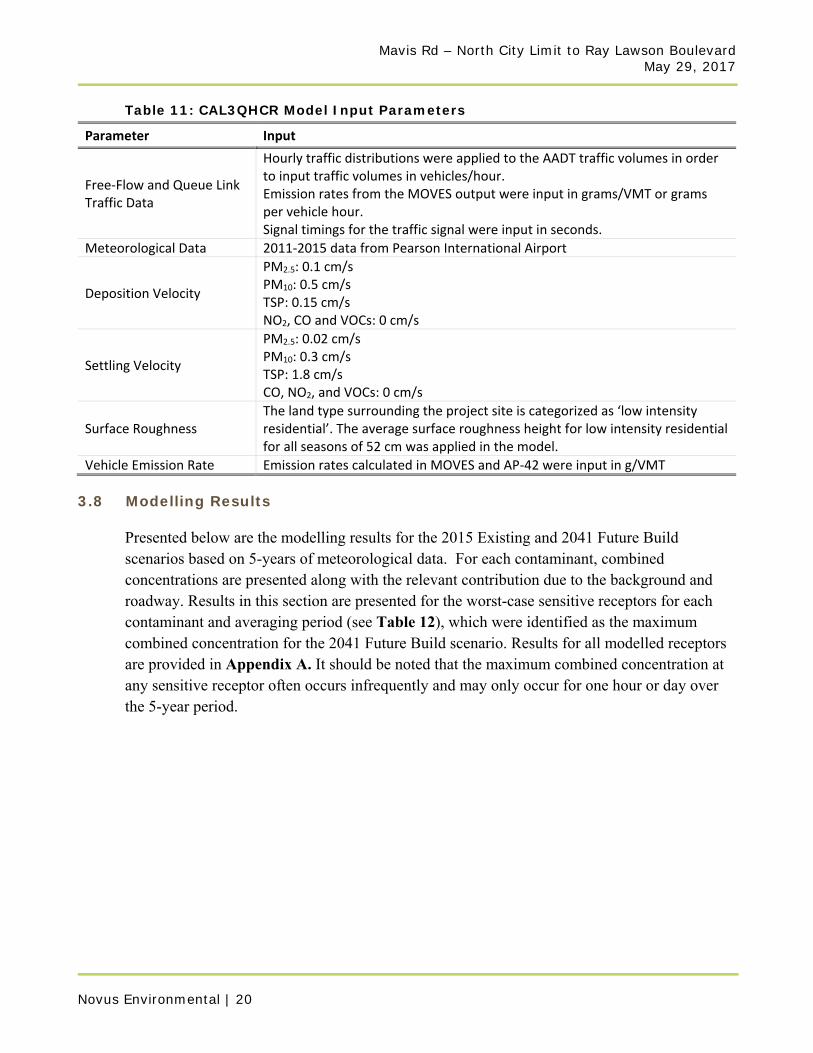
Mavis Rd – North City Limit to Ray Lawson Boulevard May 29, 2017
Novus Environmental | 20
Table 11: CAL3QHCR Model Input Parameters
Parameter Input
Free‐Flow and Queue Link Traffic Data
Hourly traffic distributions were applied to the AADT traffic volumes in order to input traffic volumes in vehicles/hour. Emission rates from the MOVES output were input in grams/VMT or grams per vehicle hour. Signal timings for the traffic signal were input in seconds.
Meteorological Data 2011‐2015 data from Pearson International Airport
Deposition Velocity
PM2.5: 0.1 cm/s PM10: 0.5 cm/s TSP: 0.15 cm/s NO2, CO and VOCs: 0 cm/s
Settling Velocity
PM2.5: 0.02 cm/s PM10: 0.3 cm/s TSP: 1.8 cm/s CO, NO2, and VOCs: 0 cm/s
Surface Roughness The land type surrounding the project site is categorized as ‘low intensity residential’. The average surface roughness height for low intensity residential for all seasons of 52 cm was applied in the model.
Vehicle Emission Rate Emission rates calculated in MOVES and AP‐42 were input in g/VMT
3.8 Modelling Results
Presented below are the modelling results for the 2015 Existing and 2041 Future Build scenarios based on 5-years of meteorological data. For each contaminant, combined concentrations are presented along with the relevant contribution due to the background and roadway. Results in this section are presented for the worst-case sensitive receptors for each contaminant and averaging period (see Table 12), which were identified as the maximum combined concentration for the 2041 Future Build scenario. Results for all modelled receptors are provided in Appendix A. It should be noted that the maximum combined concentration at any sensitive receptor often occurs infrequently and may only occur for one hour or day over the 5-year period.
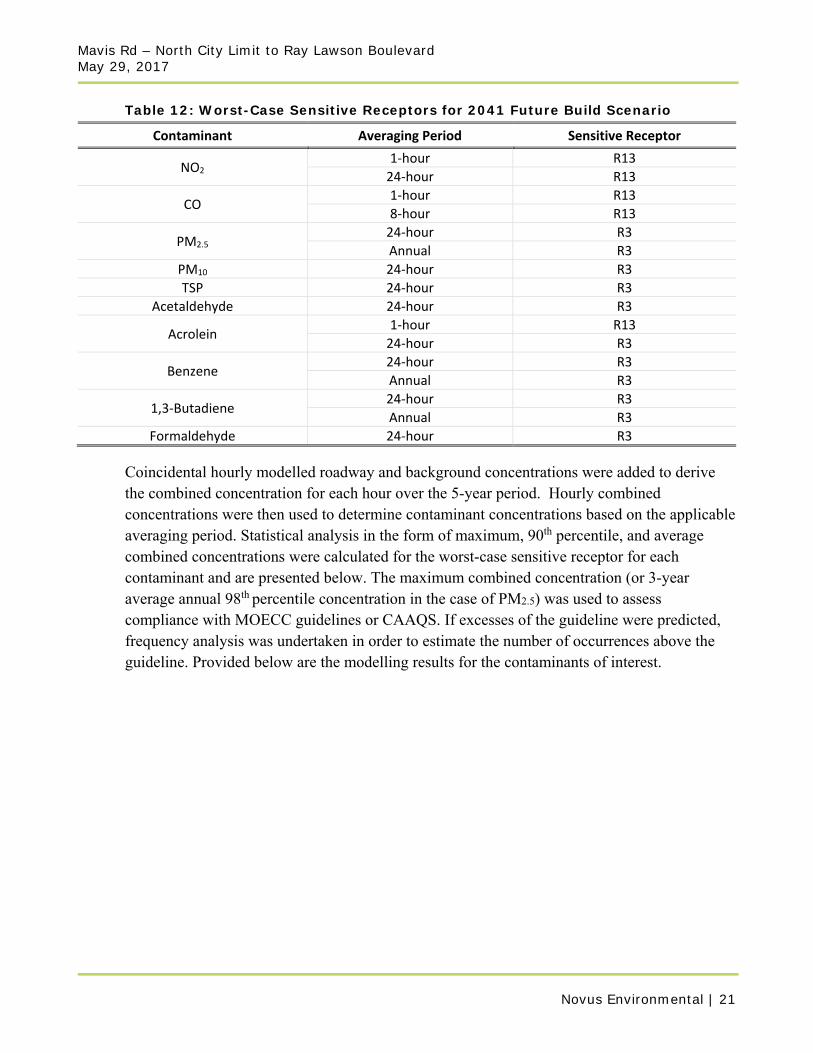
Mavis Rd – North City Limit to Ray Lawson Boulevard May 29, 2017
Novus Environmental | 21
Table 12: Worst-Case Sensitive Receptors for 2041 Future Build Scenario
Contaminant Averaging Period Sensitive Receptor
NO2 1‐hour R13
24‐hour R13
CO 1‐hour R13
8‐hour R13
PM2.5 24‐hour R3
Annual R3
PM10 24‐hour R3
TSP 24‐hour R3
Acetaldehyde 24‐hour R3
Acrolein 1‐hour R13
24‐hour R3
Benzene 24‐hour R3
Annual R3
1,3‐Butadiene 24‐hour R3
Annual R3
Formaldehyde 24‐hour R3
Coincidental hourly modelled roadway and background concentrations were added to derive the combined concentration for each hour over the 5-year period. Hourly combined concentrations were then used to determine contaminant concentrations based on the applicable averaging period. Statistical analysis in the form of maximum, 90th percentile, and average combined concentrations were calculated for the worst-case sensitive receptor for each contaminant and are presented below. The maximum combined concentration (or 3-year average annual 98th percentile concentration in the case of PM2.5) was used to assess compliance with MOECC guidelines or CAAQS. If excesses of the guideline were predicted, frequency analysis was undertaken in order to estimate the number of occurrences above the guideline. Provided below are the modelling results for the contaminants of interest.
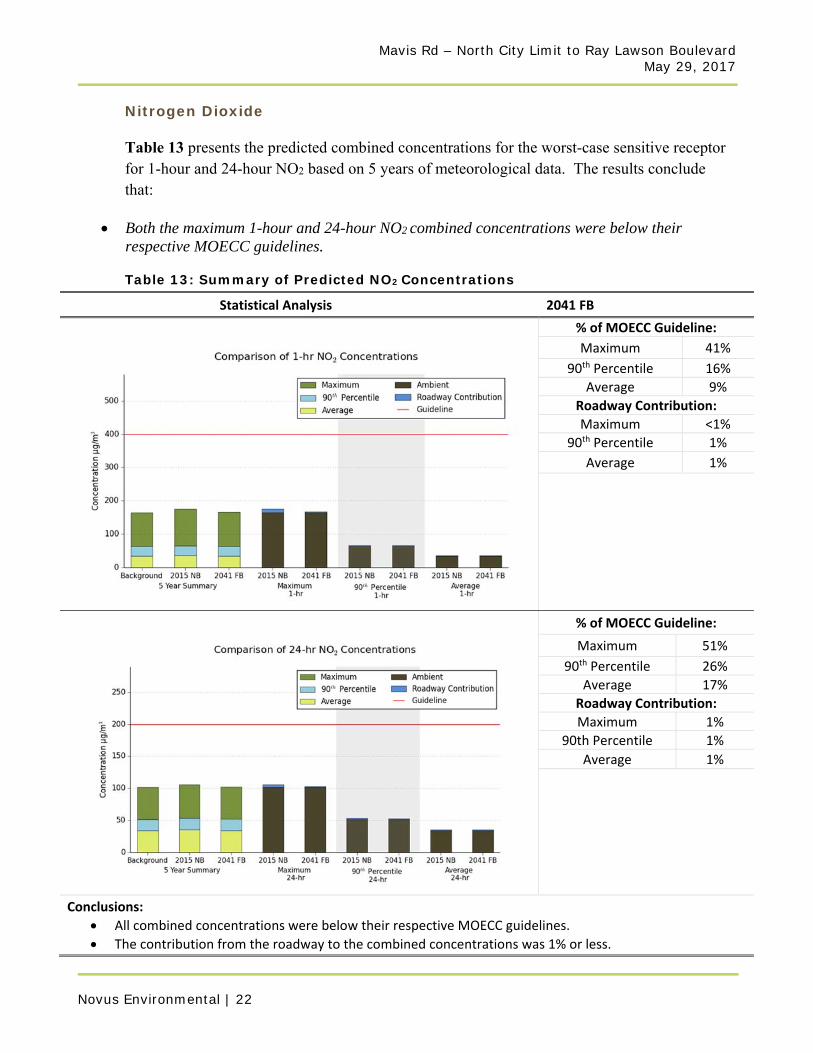
Mavis Rd – North City Limit to Ray Lawson Boulevard May 29, 2017
Novus Environmental | 22
Nitrogen Dioxide
Table 13 presents the predicted combined concentrations for the worst-case sensitive receptor for 1-hour and 24-hour NO2 based on 5 years of meteorological data. The results conclude that:
Both the maximum 1-hour and 24-hour NO2 combined concentrations were below their respective MOECC guidelines.
Table 13: Summary of Predicted NO2 Concentrations
Statistical Analysis5 Year Summary of 2041 FB
% of MOECC Guideline:
Maximum 41%
90th Percentile 16%
Average 9%
Roadway Contribution:
Maximum <1%
90th Percentile 1%
Average 1%
% of MOECC Guideline:
Maximum 51%
90th Percentile 26%
Average 17%
Roadway Contribution:
Maximum 1%
90th Percentile 1%
Average 1%
Conclusions:
All combined concentrations were below their respective MOECC guidelines.
The contribution from the roadway to the combined concentrations was 1% or less.
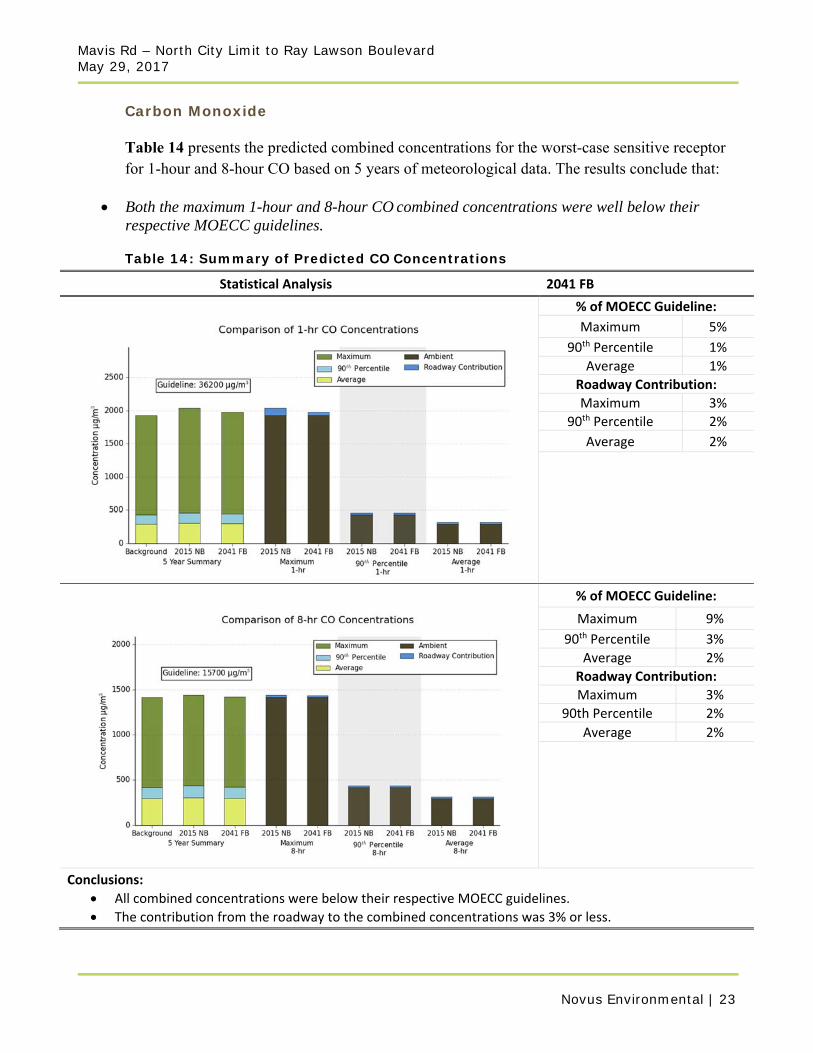
Mavis Rd – North City Limit to Ray Lawson Boulevard May 29, 2017
Novus Environmental | 23
Carbon Monoxide
Table 14 presents the predicted combined concentrations for the worst-case sensitive receptor for 1-hour and 8-hour CO based on 5 years of meteorological data. The results conclude that:
Both the maximum 1-hour and 8-hour CO combined concentrations were well below their respective MOECC guidelines.
Table 14: Summary of Predicted CO Concentrations
Statistical Analysis5 Year Summary of 2041 FB
% of MOECC Guideline:
Maximum 5%
90th Percentile 1%
Average 1%
Roadway Contribution:
Maximum 3%
90th Percentile 2%
Average 2%
% of MOECC Guideline:
Maximum 9%
90th Percentile 3%
Average 2%
Roadway Contribution:
Maximum 3%
90th Percentile 2%
Average 2%
Conclusions:
All combined concentrations were below their respective MOECC guidelines.
The contribution from the roadway to the combined concentrations was 3% or less.

Mavis Rd – North City Limit to Ray Lawson Boulevard May 29, 2017
Novus Environmental | 24
Fine Particulate Matter (PM2.5)
Table 15 presents the predicted combined concentrations for the worst-case sensitive receptor for 24-hour and annual PM2.5 based on 5 years of meteorological data. The results conclude that:
The average annual 98th percentile 24-hour PM2.5 combined concentration, averaged over three consecutive years was below the CAAQS.
The three-year annual average exceeded the guideline with a 4% contribution from the roadway
Table 15: Summary of Predicted PM2.5 Concentrations
Statistical Analysis5 Year Summary of 2041 FB
% of MOECC Guideline:
98th Percentile 89%
90th Percentile 54%
Average 29%
Roadway Contribution:
98th Percentile 4%
90th Percentile 3%
Average 5%
The PM2.5 results were below the 3‐year CAAQS. The highest 3 year rolling average of the yearly 98th
percentile combined concentrations was calculated to be 23.92 µg/m3 or 89% of the
CAAQS.
% of MOECC Guideline:
3‐Year Annual Average
103%
Roadway Contribution:
3‐Year Annual Average
4%
The PM2.5 results were above the 3‐year CAAQS. The maximum 3‐
year annual average concentration was 103% of the guideline. It should be noted that ambient concentrations alone were 100% of the guideline and
that there was no change between the 2015 Existing and 2041 Future Build Scenarios
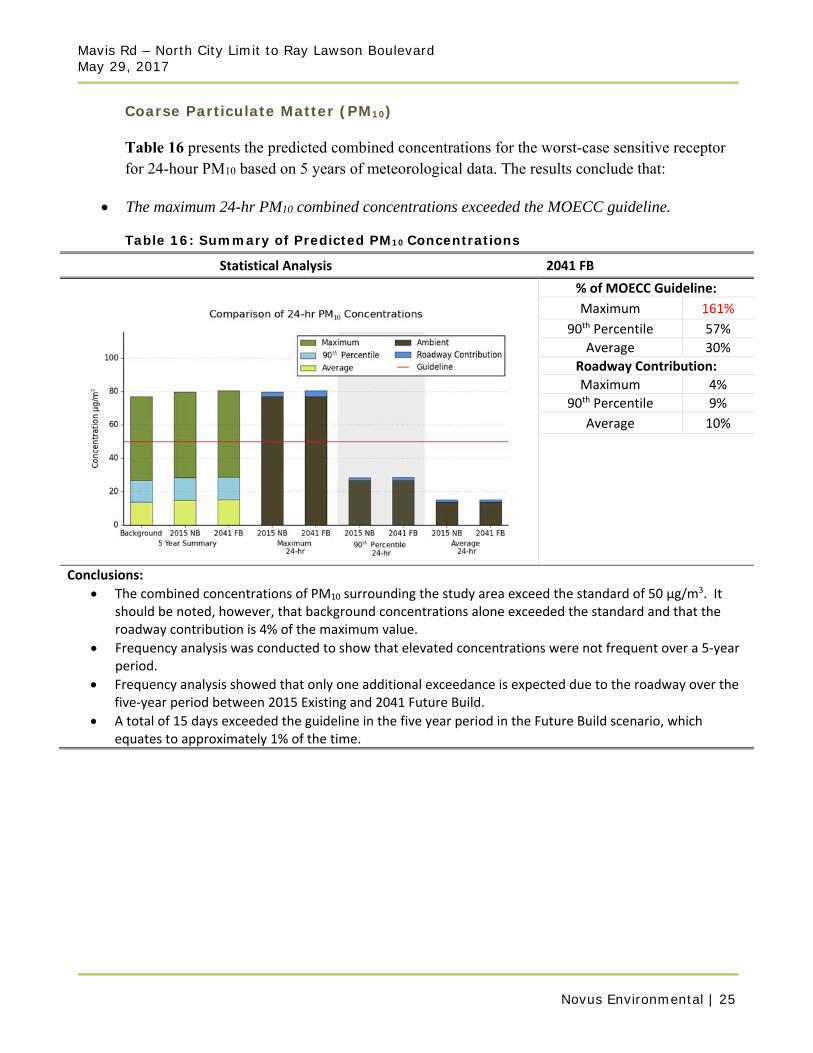
Mavis Rd – North City Limit to Ray Lawson Boulevard May 29, 2017
Novus Environmental | 25
Coarse Particulate Matter (PM10)
Table 16 presents the predicted combined concentrations for the worst-case sensitive receptor for 24-hour PM10 based on 5 years of meteorological data. The results conclude that:
The maximum 24-hr PM10 combined concentrations exceeded the MOECC guideline.
Table 16: Summary of Predicted PM10 Concentrations
Statistical Analysis5 Year Summary of 2041 FB
% of MOECC Guideline:
Maximum 161%
90th Percentile 57%
Average 30%
Roadway Contribution:
Maximum 4%
90th Percentile 9%
Average 10%
Conclusions:
The combined concentrations of PM10 surrounding the study area exceed the standard of 50 µg/m3. It should be noted, however, that background concentrations alone exceeded the standard and that the roadway contribution is 4% of the maximum value.
Frequency analysis was conducted to show that elevated concentrations were not frequent over a 5‐year period.
Frequency analysis showed that only one additional exceedance is expected due to the roadway over the five‐year period between 2015 Existing and 2041 Future Build.
A total of 15 days exceeded the guideline in the five year period in the Future Build scenario, which equates to approximately 1% of the time.
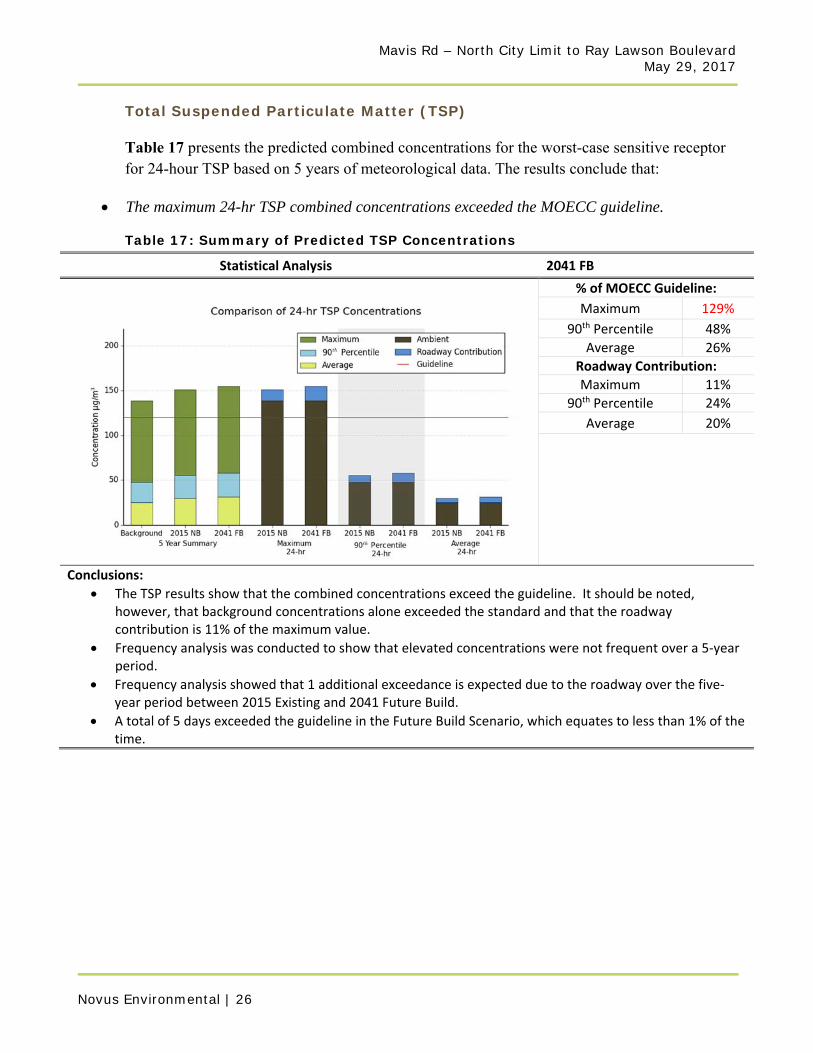
Mavis Rd – North City Limit to Ray Lawson Boulevard May 29, 2017
Novus Environmental | 26
Total Suspended Particulate Matter (TSP)
Table 17 presents the predicted combined concentrations for the worst-case sensitive receptor for 24-hour TSP based on 5 years of meteorological data. The results conclude that:
The maximum 24-hr TSP combined concentrations exceeded the MOECC guideline.
Table 17: Summary of Predicted TSP Concentrations
Statistical Analysis5 Year Summary of 2041 FB
% of MOECC Guideline:
Maximum 129%
90th Percentile 48%
Average 26%
Roadway Contribution:
Maximum 11%
90th Percentile 24%
Average 20%
Conclusions:
The TSP results show that the combined concentrations exceed the guideline. It should be noted, however, that background concentrations alone exceeded the standard and that the roadway contribution is 11% of the maximum value.
Frequency analysis was conducted to show that elevated concentrations were not frequent over a 5‐year period.
Frequency analysis showed that 1 additional exceedance is expected due to the roadway over the five‐year period between 2015 Existing and 2041 Future Build.
A total of 5 days exceeded the guideline in the Future Build Scenario, which equates to less than 1% of the time.
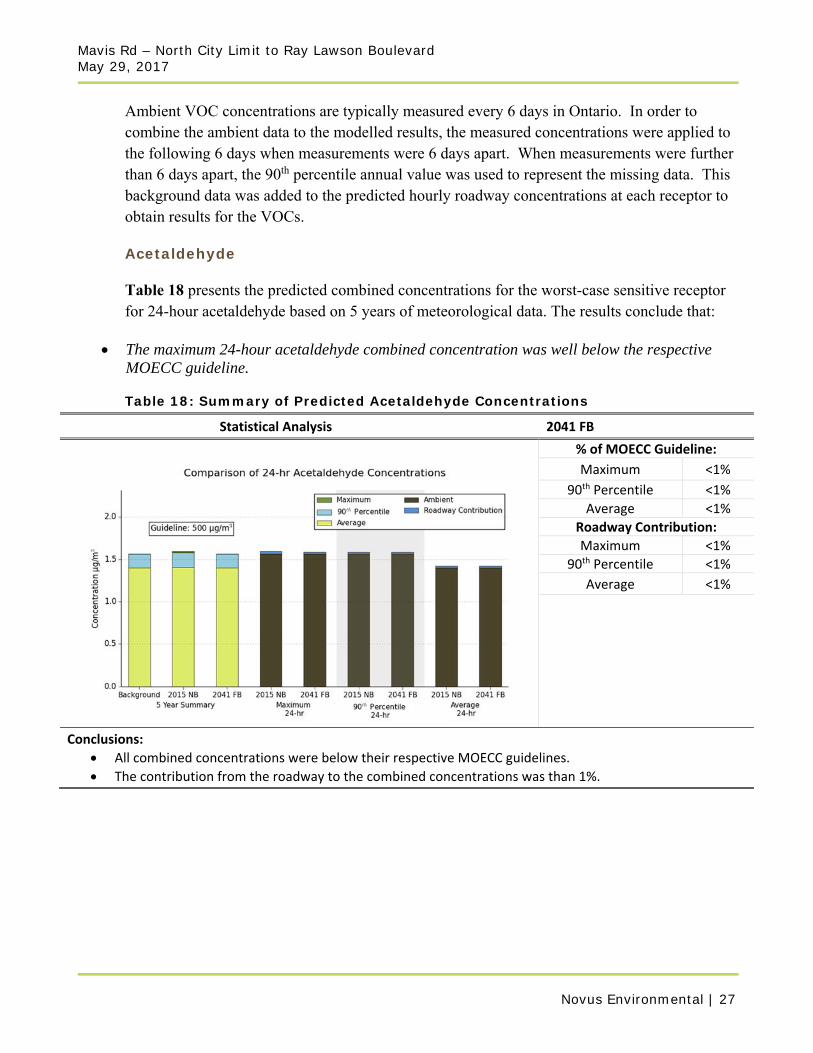
Mavis Rd – North City Limit to Ray Lawson Boulevard May 29, 2017
Novus Environmental | 27
Ambient VOC concentrations are typically measured every 6 days in Ontario. In order to combine the ambient data to the modelled results, the measured concentrations were applied to the following 6 days when measurements were 6 days apart. When measurements were further than 6 days apart, the 90th percentile annual value was used to represent the missing data. This background data was added to the predicted hourly roadway concentrations at each receptor to obtain results for the VOCs.
Acetaldehyde
Table 18 presents the predicted combined concentrations for the worst-case sensitive receptor for 24-hour acetaldehyde based on 5 years of meteorological data. The results conclude that:
The maximum 24-hour acetaldehyde combined concentration was well below the respective MOECC guideline.
Table 18: Summary of Predicted Acetaldehyde Concentrations
Statistical Analysis5 Year Summary of 2041 FB
% of MOECC Guideline:
Maximum <1%
90th Percentile <1%
Average <1%
Roadway Contribution:
Maximum <1%
90th Percentile <1%
Average <1%
Conclusions:
All combined concentrations were below their respective MOECC guidelines.
The contribution from the roadway to the combined concentrations was than 1%.

Mavis Rd – North City Limit to Ray Lawson Boulevard May 29, 2017
Novus Environmental | 28
Acrolein
Table 19 presents the predicted combined concentrations for the worst-case sensitive receptor for 1-hour and 24-hour acrolein based on 5 years of meteorological data. The results conclude that:
The maximum 1-hour and 24-hour acrolein combined concentration were below the respective MOECC guideline.
Table 19: Summary of Predicted Acrolein Concentrations
Statistical Analysis5 Year Summary of 2041 FB
% of MOECC Guideline:
Maximum 3%
90th Percentile 2%
Average 1%
Roadway Contribution:
Maximum 1%
90th Percentile <1%
Average <1%
Conclusions: The combined concentrations were below the respective MOECC guidelines. The contribution from the roadway was 1% or less.
% of MOECC Guideline:
Maximum 33%
90th Percentile 19%
Average 16%
Roadway Contribution
Maximum <1%
90th Percentile <1%
Average <1%
Conclusions: The combined concentrations were below the respective MOECC guidelines. The contribution from the roadway was less than 1%.

Mavis Rd – North City Limit to Ray Lawson Boulevard May 29, 2017
Novus Environmental | 29
Benzene
Table 20 presents the predicted combined concentrations for the worst-case sensitive receptor for 24-hour and annual benzene based on 5 years of meteorological data. The results conclude that:
The maximum 24-hour benzene combined concentration was below the respective MOECC guideline.
The annual benzene concentrations exceeded the guidline due to ambient concentrations. The roadway contributino to the annual average was 1%.
Table 20: Summary of Predicted Benzene Concentrations
Statistical Analysis5 Year Summary of 2041 FB
% of MOECC Guideline:
Maximum 89%
90th Percentile 44%
Average 30%
Roadway Contribution:
Maximum 1%
90th Percentile 1%
Average 1%
Conclusions: The combined concentrations were below the respective MOECC guidelines. The contribution from the roadway was 1%.
% of MOECC Guideline:
Maximum 184%
Average 154%
Roadway Contribution:
Maximum 1%
Average 1%
Conclusions: The combined concentration exceeded the MOECC guideline. It should be noted that ambient concentrations were 182% of the guideline and the roadway contribution to the maximum was just over 1%.
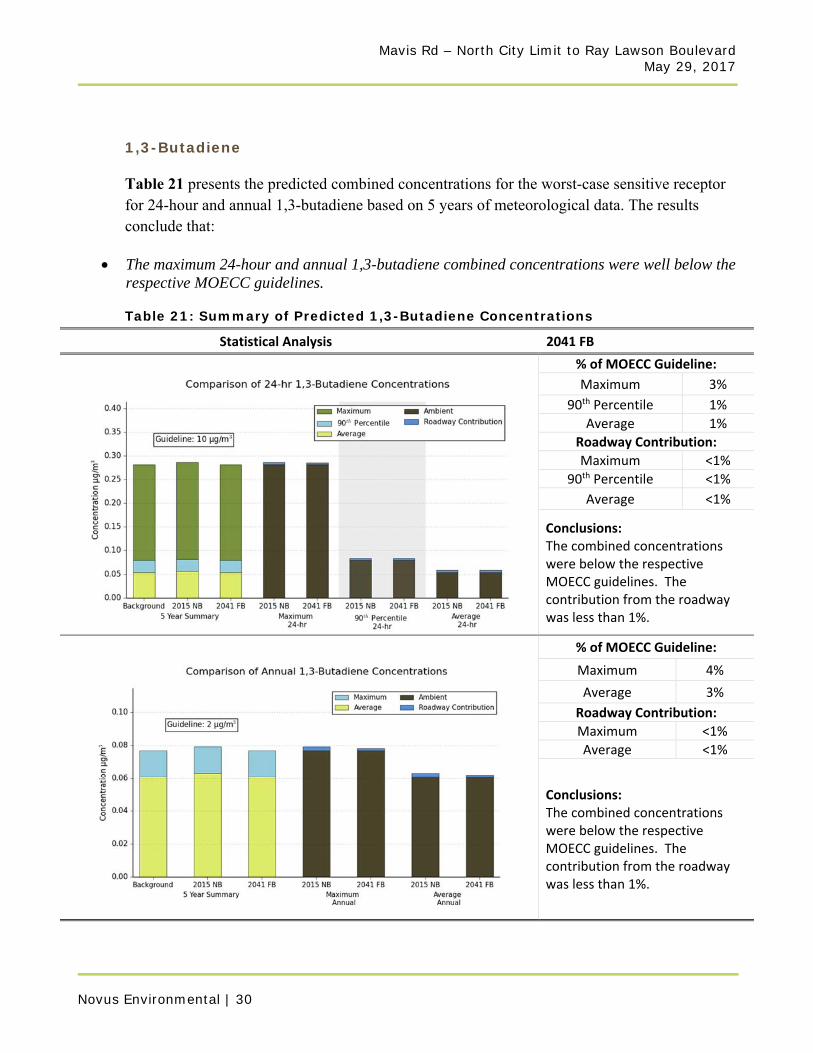
Mavis Rd – North City Limit to Ray Lawson Boulevard May 29, 2017
Novus Environmental | 30
1,3-Butadiene
Table 21 presents the predicted combined concentrations for the worst-case sensitive receptor for 24-hour and annual 1,3-butadiene based on 5 years of meteorological data. The results conclude that:
The maximum 24-hour and annual 1,3-butadiene combined concentrations were well below the respective MOECC guidelines.
Table 21: Summary of Predicted 1,3-Butadiene Concentrations
Statistical Analysis5 Year Summary of 2041 FB
% of MOECC Guideline:
Maximum 3%
90th Percentile 1%
Average 1%
Roadway Contribution:
Maximum <1%
90th Percentile <1%
Average <1%
Conclusions: The combined concentrations were below the respective MOECC guidelines. The contribution from the roadway was less than 1%.
% of MOECC Guideline:
Maximum 4%
Average 3%
Roadway Contribution:
Maximum <1%
Average <1%
Conclusions: The combined concentrations were below the respective MOECC guidelines. The contribution from the roadway was less than 1%.
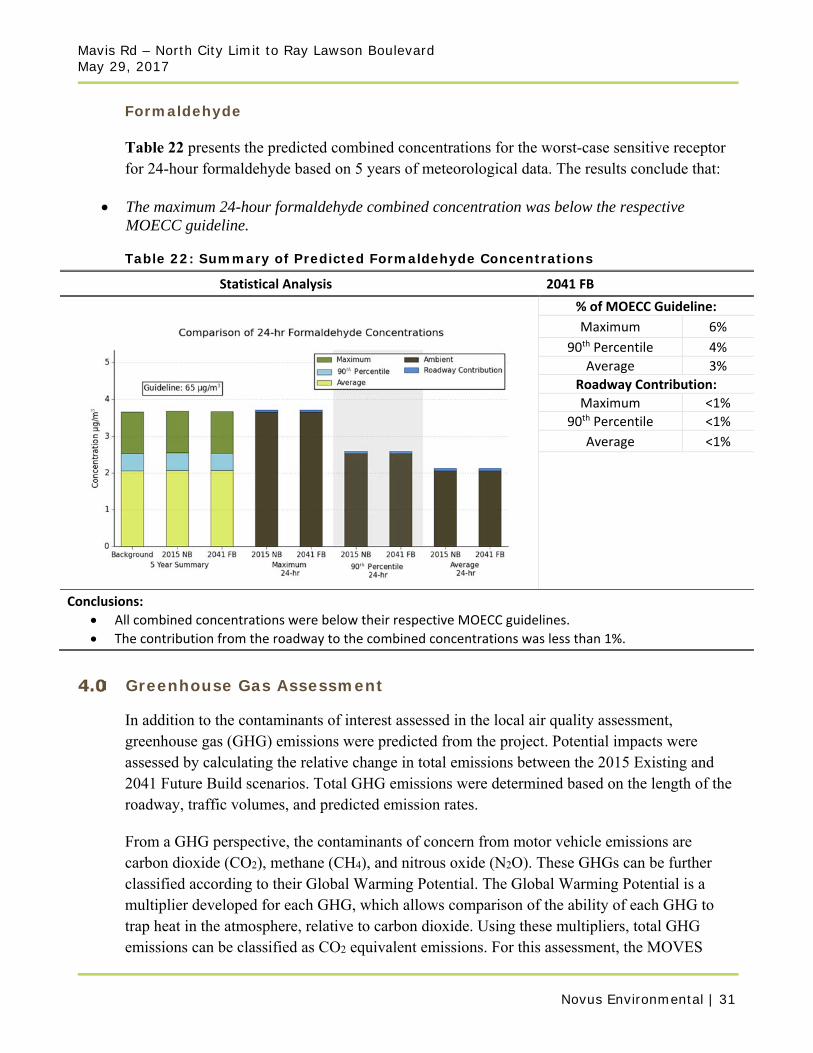
Mavis Rd – North City Limit to Ray Lawson Boulevard May 29, 2017
Novus Environmental | 31
Formaldehyde
Table 22 presents the predicted combined concentrations for the worst-case sensitive receptor for 24-hour formaldehyde based on 5 years of meteorological data. The results conclude that:
The maximum 24-hour formaldehyde combined concentration was below the respective MOECC guideline.
Table 22: Summary of Predicted Formaldehyde Concentrations
Statistical Analysis5 Year Summary of 2041 FB
% of MOECC Guideline:
Maximum 6%
90th Percentile 4%
Average 3%
Roadway Contribution:
Maximum <1%
90th Percentile <1%
Average <1%
Conclusions:
All combined concentrations were below their respective MOECC guidelines.
The contribution from the roadway to the combined concentrations was less than 1%.
Greenhouse Gas Assessment
In addition to the contaminants of interest assessed in the local air quality assessment, greenhouse gas (GHG) emissions were predicted from the project. Potential impacts were assessed by calculating the relative change in total emissions between the 2015 Existing and 2041 Future Build scenarios. Total GHG emissions were determined based on the length of the roadway, traffic volumes, and predicted emission rates.
From a GHG perspective, the contaminants of concern from motor vehicle emissions are carbon dioxide (CO2), methane (CH4), and nitrous oxide (N2O). These GHGs can be further classified according to their Global Warming Potential. The Global Warming Potential is a multiplier developed for each GHG, which allows comparison of the ability of each GHG to trap heat in the atmosphere, relative to carbon dioxide. Using these multipliers, total GHG emissions can be classified as CO2 equivalent emissions. For this assessment, the MOVES
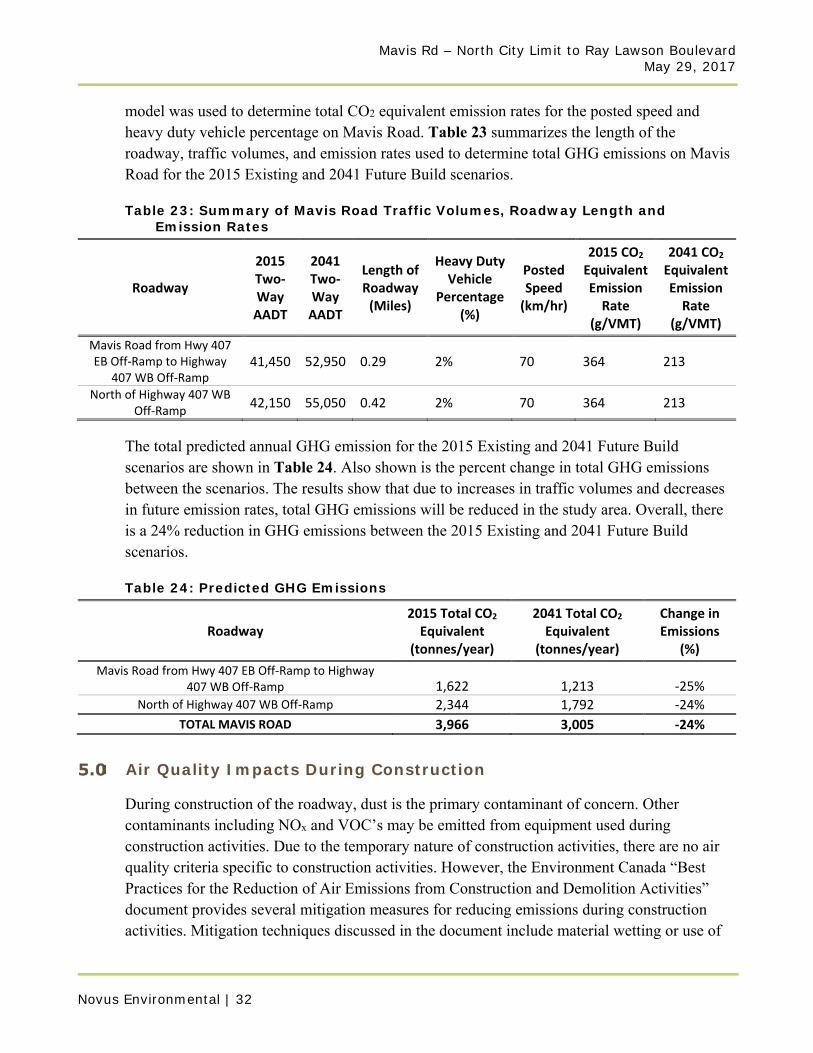
Mavis Rd – North City Limit to Ray Lawson Boulevard May 29, 2017
Novus Environmental | 32
model was used to determine total CO2 equivalent emission rates for the posted speed and heavy duty vehicle percentage on Mavis Road. Table 23 summarizes the length of the roadway, traffic volumes, and emission rates used to determine total GHG emissions on Mavis Road for the 2015 Existing and 2041 Future Build scenarios.
Table 23: Summary of Mavis Road Traffic Volumes, Roadway Length and Emission Rates
Roadway
2015 Two‐Way AADT
2041 Two‐Way AADT
Length of Roadway (Miles)
Heavy Duty Vehicle
Percentage (%)
Posted Speed (km/hr)
2015 CO2 Equivalent Emission Rate
(g/VMT)
2041 CO2 Equivalent Emission Rate
(g/VMT)
Mavis Road from Hwy 407 EB Off‐Ramp to Highway
407 WB Off‐Ramp 41,450 52,950 0.29 2% 70 364 213
North of Highway 407 WB Off‐Ramp
42,150 55,050 0.42 2% 70 364 213
The total predicted annual GHG emission for the 2015 Existing and 2041 Future Build scenarios are shown in Table 24. Also shown is the percent change in total GHG emissions between the scenarios. The results show that due to increases in traffic volumes and decreases in future emission rates, total GHG emissions will be reduced in the study area. Overall, there is a 24% reduction in GHG emissions between the 2015 Existing and 2041 Future Build scenarios.
Table 24: Predicted GHG Emissions
Roadway 2015 Total CO2 Equivalent
(tonnes/year)
2041 Total CO2 Equivalent
(tonnes/year)
Change in Emissions
(%)
Mavis Road from Hwy 407 EB Off‐Ramp to Highway 407 WB Off‐Ramp 1,622 1,213 ‐25%
North of Highway 407 WB Off‐Ramp 2,344 1,792 ‐24%
TOTAL MAVIS ROAD 3,966 3,005 ‐24%
Air Quality Impacts During Construction
During construction of the roadway, dust is the primary contaminant of concern. Other contaminants including NOx and VOC’s may be emitted from equipment used during construction activities. Due to the temporary nature of construction activities, there are no air quality criteria specific to construction activities. However, the Environment Canada “Best Practices for the Reduction of Air Emissions from Construction and Demolition Activities” document provides several mitigation measures for reducing emissions during construction activities. Mitigation techniques discussed in the document include material wetting or use of
Mavis Rd – North City Limit to Ray Lawson Boulevard May 29, 2017
Novus Environmental | 33
chemical suppressants to reduce dust, use of wind barriers, and limiting exposed areas which may be a source of dust and equipment washing. It is recommended that these best management practices be followed during construction of the roadway to reduce any air quality impacts that may occur.
Conclusions and Recommendations
The potential impact of the proposed project infrastructure on local air quality has been assessed and the results are summarized in Table 25. An assessment of GHG emissions was also conducted. The following conclusions and recommendations are a result of this assessment.
The maximum combined concentrations for the future build scenario were all below their respective MOECC guidelines or CAAQS, with the exception of annual PM2.5, PM10, TSP and annual benzene. Note that for each of these contaminants, background concentrations alone were 100% of the guideline or more.
Frequency Analysis determined that there was only 1 additional day on which exceedances of PM10 and TSP occurred between the 2015 Existing and 2041 Future Build scenarios, which is less than 1% of the time.
Overall, maximum predicted concentrations are similar between the 2015 Existing and 2041 Future Build scenarios, with little or no increase occurring as a result of the project.
Mitigation measures are not warranted, due to the small number of days which are expected to exceed the guideline.
Total GHG emissions were predicted to decrease in the study area. Overall, there was a 24% decrease in total GHG emissions predicted between the Existing and Future Build scenarios.

Mavis Rd – North City Limit to Ray Lawson Boulevard May 29, 2017
Novus Environmental | 34
Table 25: Summary of 2041 Future Build Results
5 Year Statistical Summary % of Guideline
Note: The PM2.5 results are in compliance with the CAAQS. The highest 3 year rolling average of the yearly 98th
percentile combined concentrations was calculated to be 23.9 µg/m3 or 88% of the CAAQS.
2041 Future Build
NO2 (1‐hr) 41%
NO2 (24‐hr) 51%
CO (1‐hr) 5%
CO (8‐hr) 9%
PM2.5 (24‐hr See Note)
89%
PM2.5 (Annual) 103%
PM10 161%
TSP 129%
Acetaldehyde <1%
Acrolein (1‐hr) 3%
Acrolein (24‐hr) 33%
Benzene (24‐hr) 89%
Benzene (Annual) 184%
1,3‐Butadiene (24‐hr)
3%
1,3‐Butadiene (Annual)
4%
Formaldehyde 6%
Mavis Rd – North City Limit to Ray Lawson Boulevard May 29, 2017
Novus Environmental | 35
References
Air & Waste Management Association, 2011. The Role of Vegetation in Mitigating Air Quality Impacts from Traffic Emissions. [online] http://www.epa.gov/nrmrl/appcd/nearroadway/pdfs/baldauf.pdf
CCME, 2000. Canadian Council of Ministers of the Environment. Canada-Wide Standards of Particulate Matter and Ozone. Endorsed by CCME Council of Ministers, Quebec City. [Online]http://www.ccme.ca/assets/pdf/pmozone_standard_e.pdf
Environment Canada. 2000. Priority Substances List Assessment Report: Respirable Particulate Matter Less Than or Equal to 10 Microns. Canadian Environmental Protection Act, 1999. Environment Canada, Health Canada. [Online] http://www.ec.gc.ca/Substances/ese/eng/psap/final/PM-10.cfm.
Health Canada. 1999. National Ambient Air Quality Objectives for Particulate Matter Part 1: Science Assessment Document. Health Canada. A report by the CEPA/FPAC Working Group on Air Quality Objectives and Guidelines.
Lall, R., Kendall, M., Ito, K., Thurston, G., 2004. Estimation of historical annual PM2.5 exposures for health effects assessment. Atmospheric Environment 38(2004) 5217-5226.
Ontario Publication 6570e, 2008. Ontario's Ambient Air Quality Criteria. Standards Development Branch, Ontario Ministry of the Environment.
Ontario Ministry of the Environment, 2005. Transboundary Air Pollution in Ontario. Queens Printer for Ontario.
Randerson, D., 1984. Atmospheric Science and Power Production . United States Department of Energy.
Seinfeld, J.H. and Pandis, S.P.,2006. Atmospheric Chemistry and Physics From Air Pollution to Climate Change. New Jersey: John Wiley & Sons.
United States Environmental Protection Agency, 2008. AERSURFACE User’s Guide. USEPA.
United States Environmental Protection Agency, 1997. Document AP 42, Volume I, Fifth Edition, Chapter 13.2.1. USEPA.
United States Environmental Protection Agency, 2010. Exhaust and Crankcase Emission Factors for Nonroad Engine Modeling – Compression-Ignition. USEPA.
United States Environmental Protection Agency, 2009. MOVES 2010 Highway Vehicles: Population and Activity Data. USEPA.
WHO. 2005. WHO air quality guidelines global update 2005. Report on a Working Group meeting, Boon, Germany, October 18-20, 2005.

Appendix A Receptor Specific Modelling Results

This page intentionally left blank
for 2-sided printing purposes

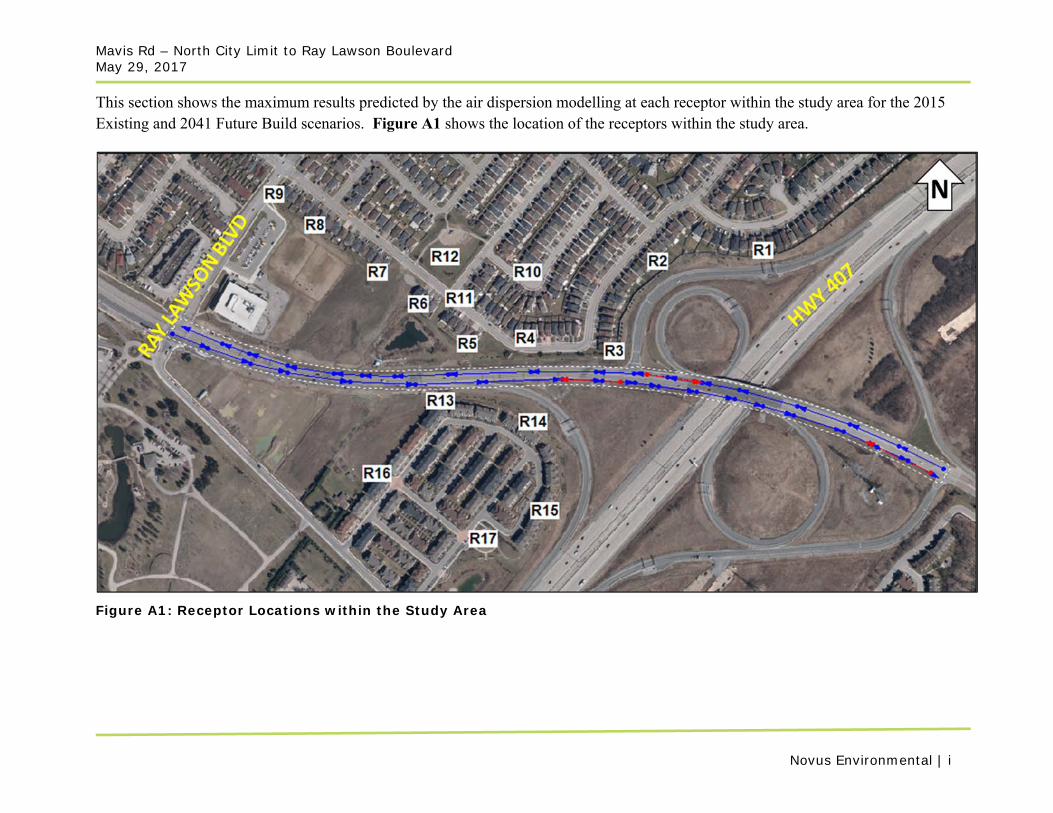
Mavis Rd – North City Limit to Ray Lawson Boulevard May 29, 2017
Novus Environmental | i
This section shows the maximum results predicted by the air dispersion modelling at each receptor within the study area for the 2015 Existing and 2041 Future Build scenarios. Figure A1 shows the location of the receptors within the study area.
Figure A1: Receptor Locations within the Study Area

This page intentionally left blank for 2-sided printing purposes

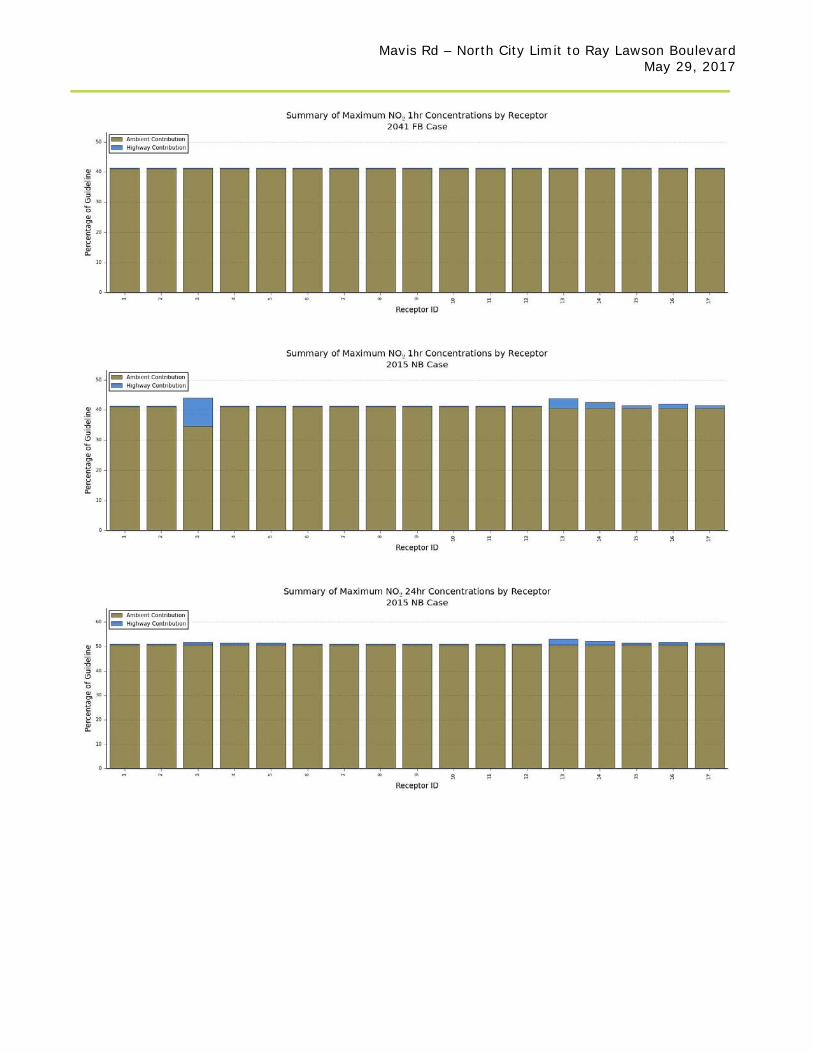
Mavis Rd – North City Limit to Ray Lawson Boulevard May 29, 2017
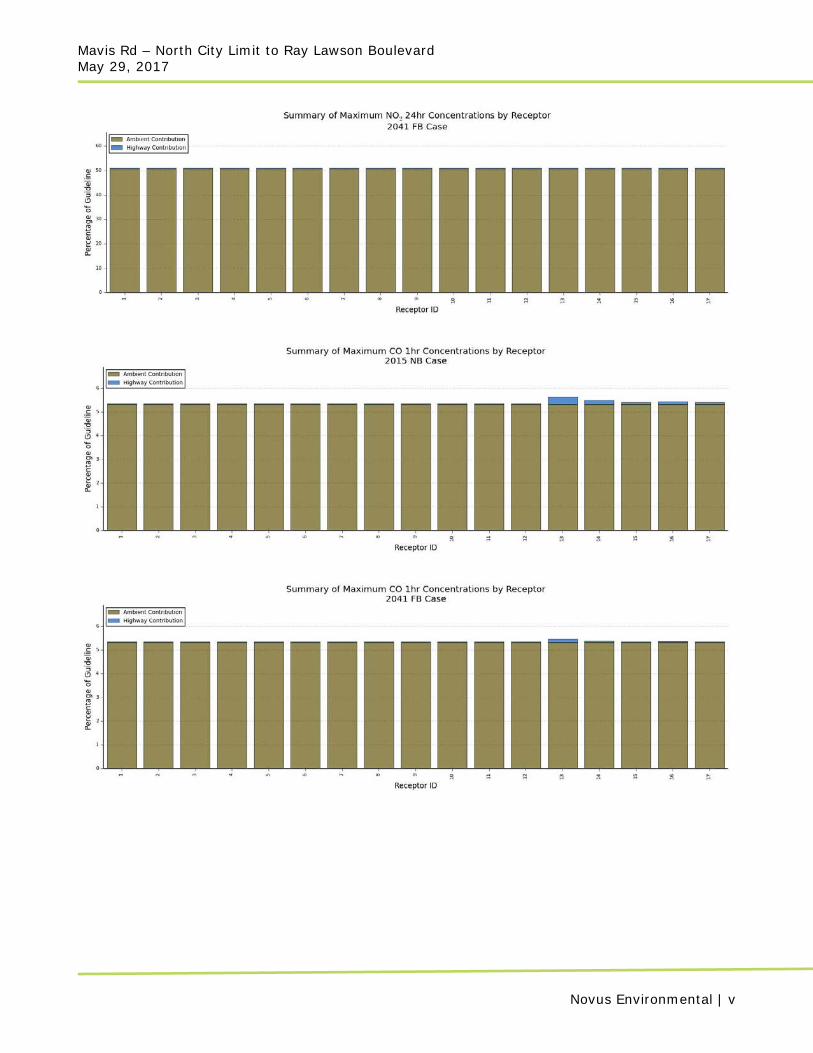
Mavis Rd – North City Limit to Ray Lawson Boulevard May 29, 2017
Novus Environmental | v
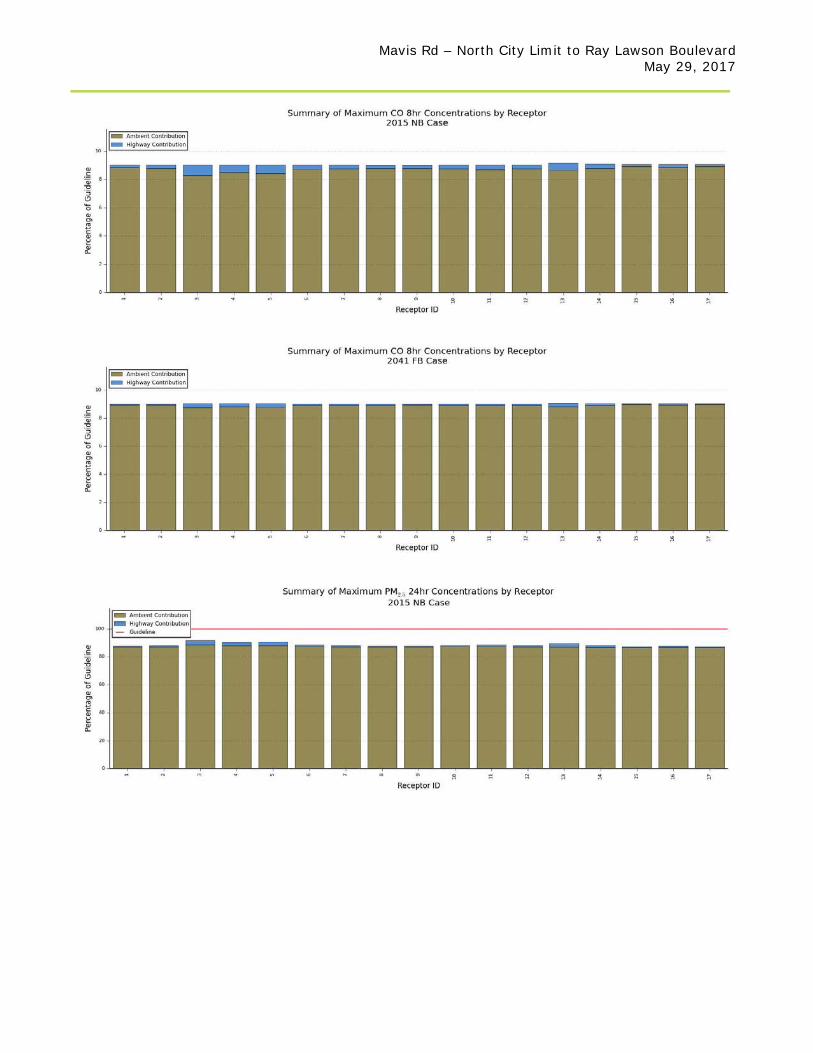
Mavis Rd – North City Limit to Ray Lawson Boulevard May 29, 2017
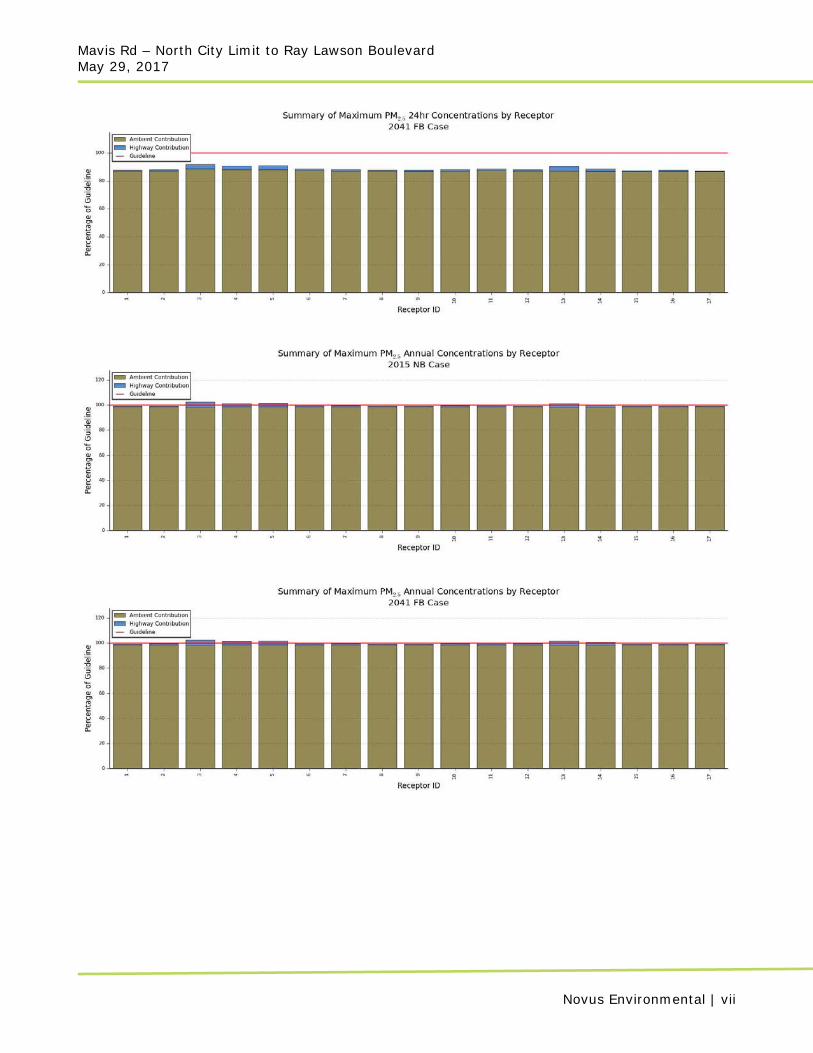
Mavis Rd – North City Limit to Ray Lawson Boulevard May 29, 2017
Novus Environmental | vii
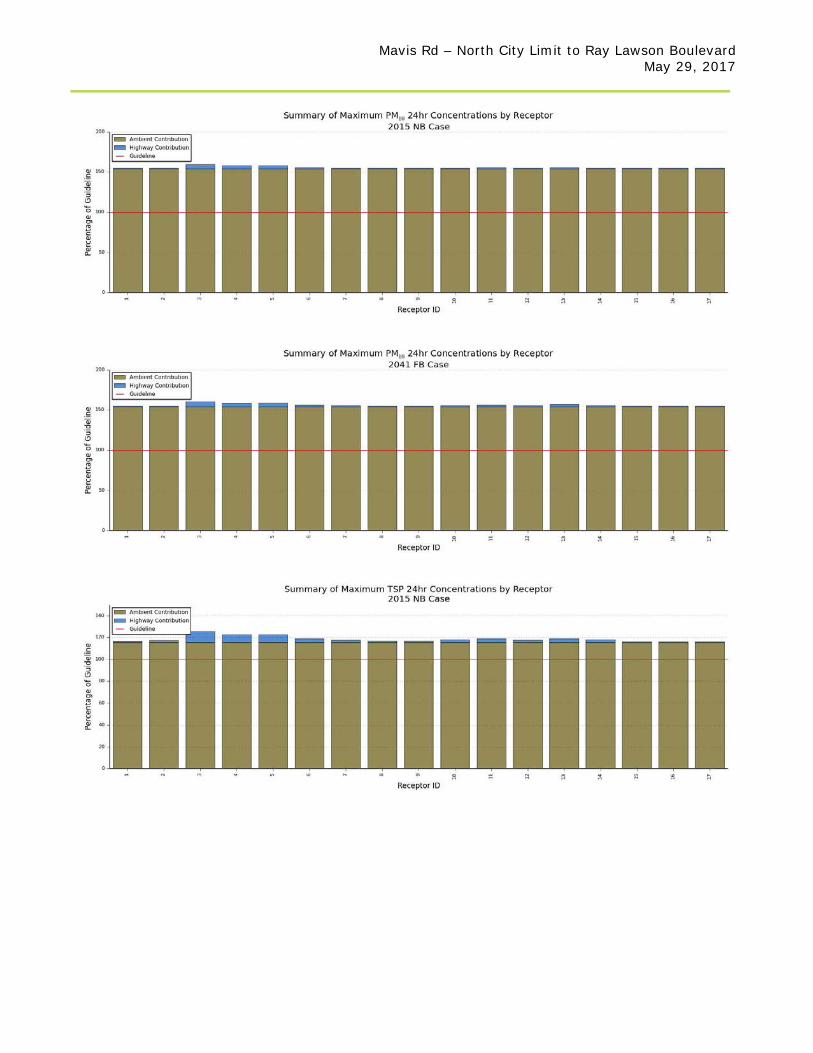
Mavis Rd – North City Limit to Ray Lawson Boulevard May 29, 2017
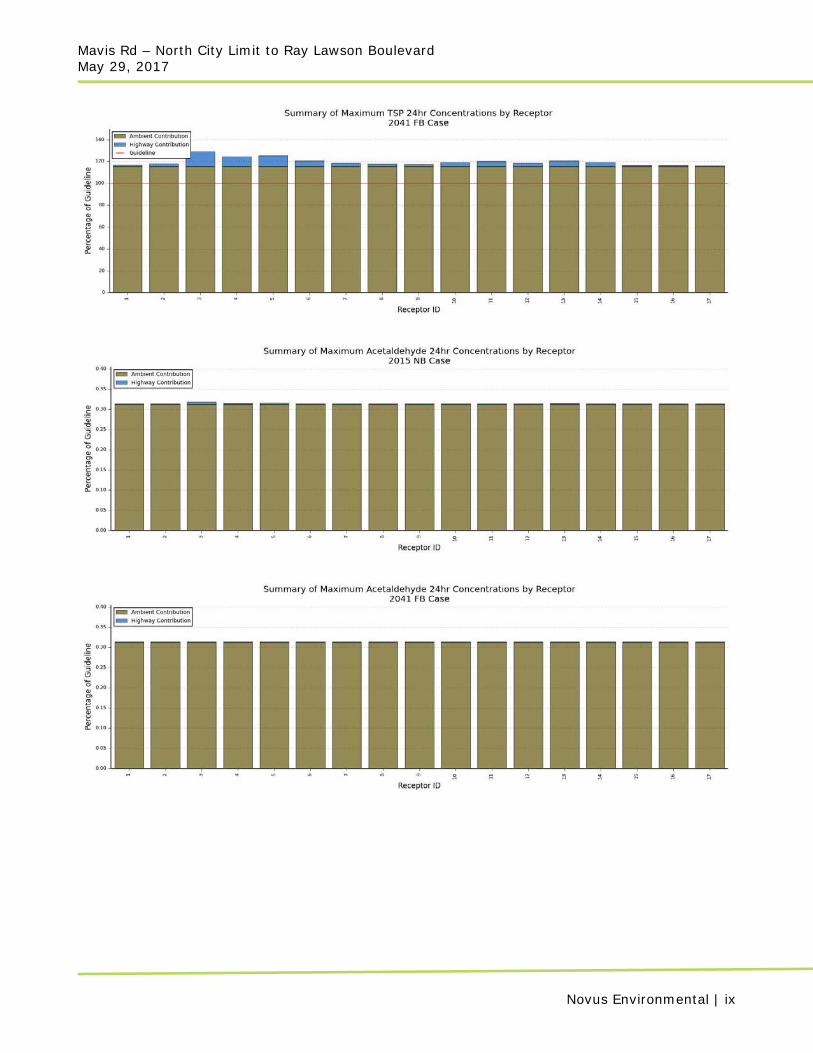
Mavis Rd – North City Limit to Ray Lawson Boulevard May 29, 2017
Novus Environmental | ix
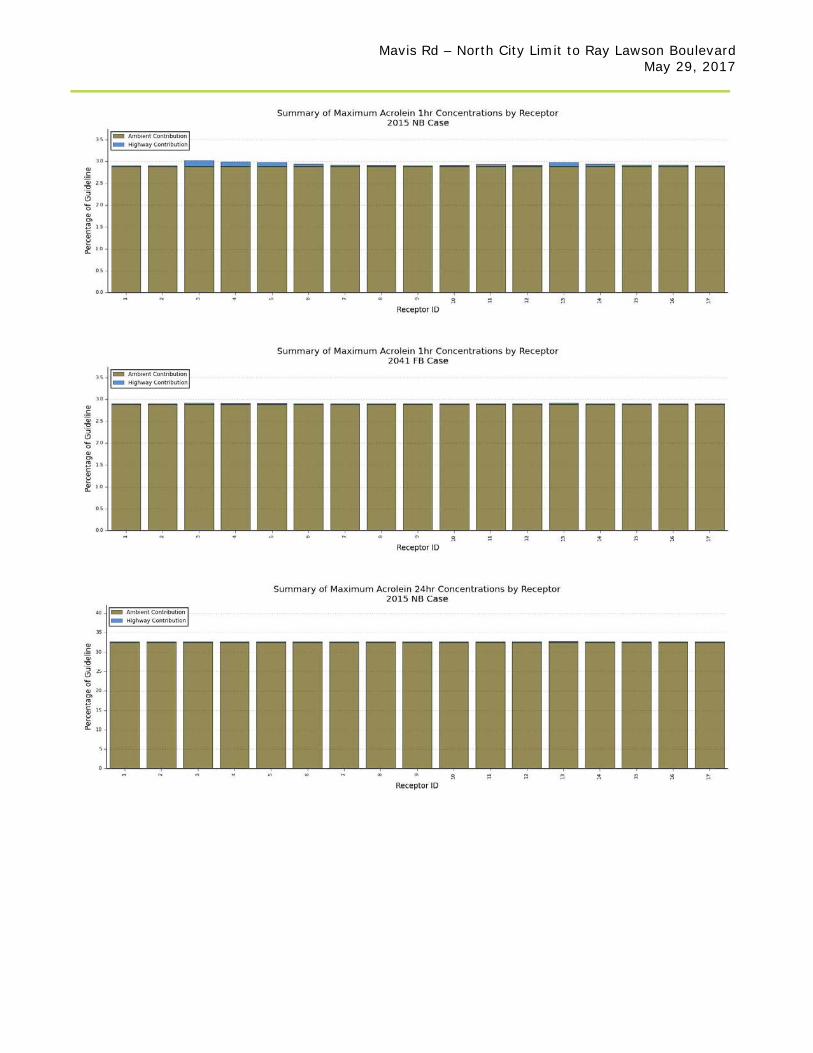
Mavis Rd – North City Limit to Ray Lawson Boulevard May 29, 2017
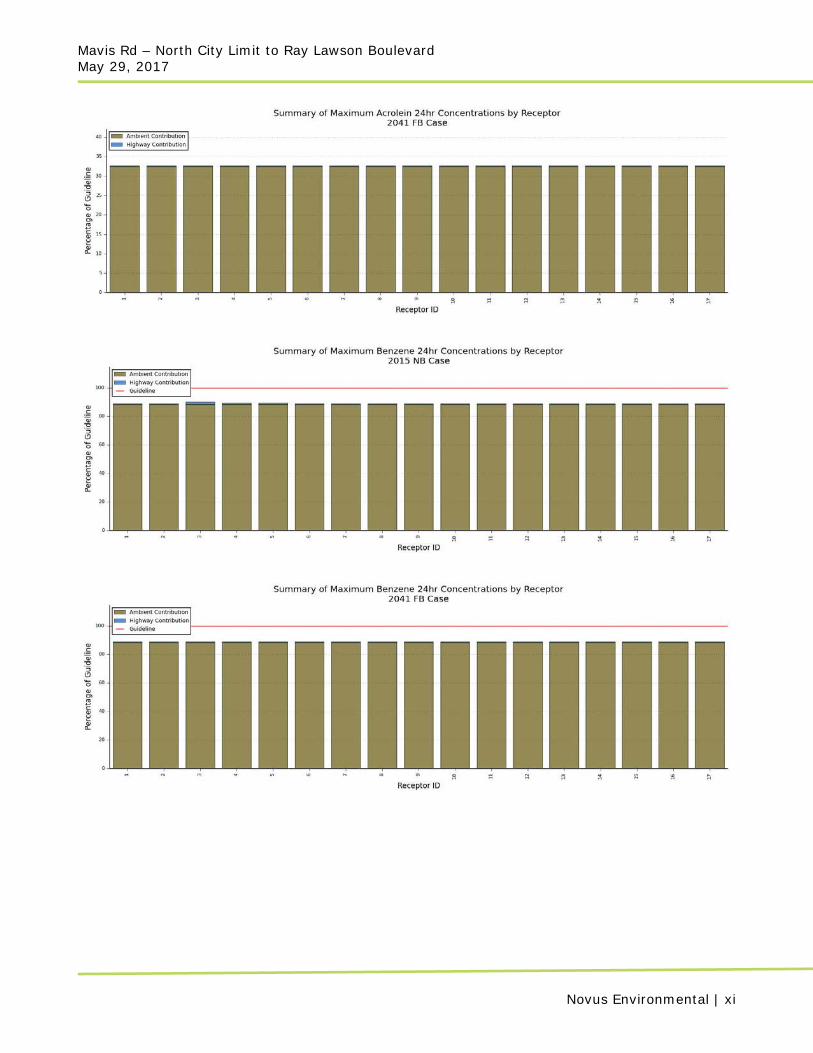
Mavis Rd – North City Limit to Ray Lawson Boulevard May 29, 2017
Novus Environmental | xi
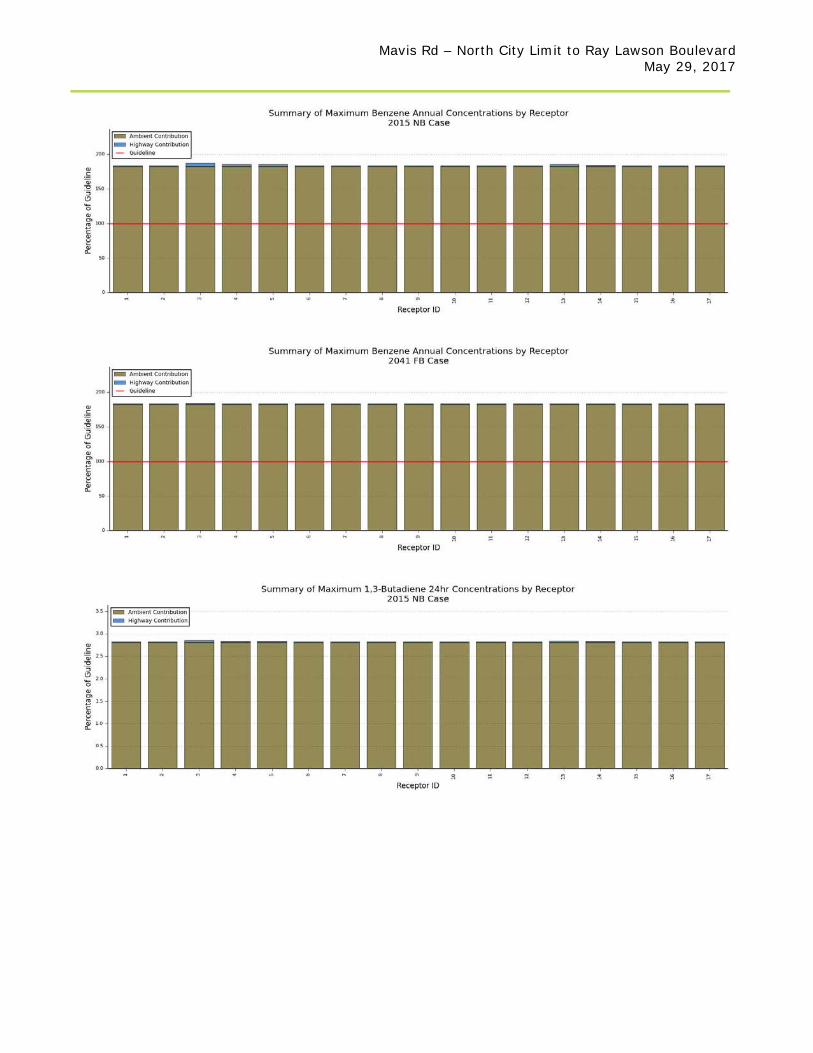
Mavis Rd – North City Limit to Ray Lawson Boulevard May 29, 2017
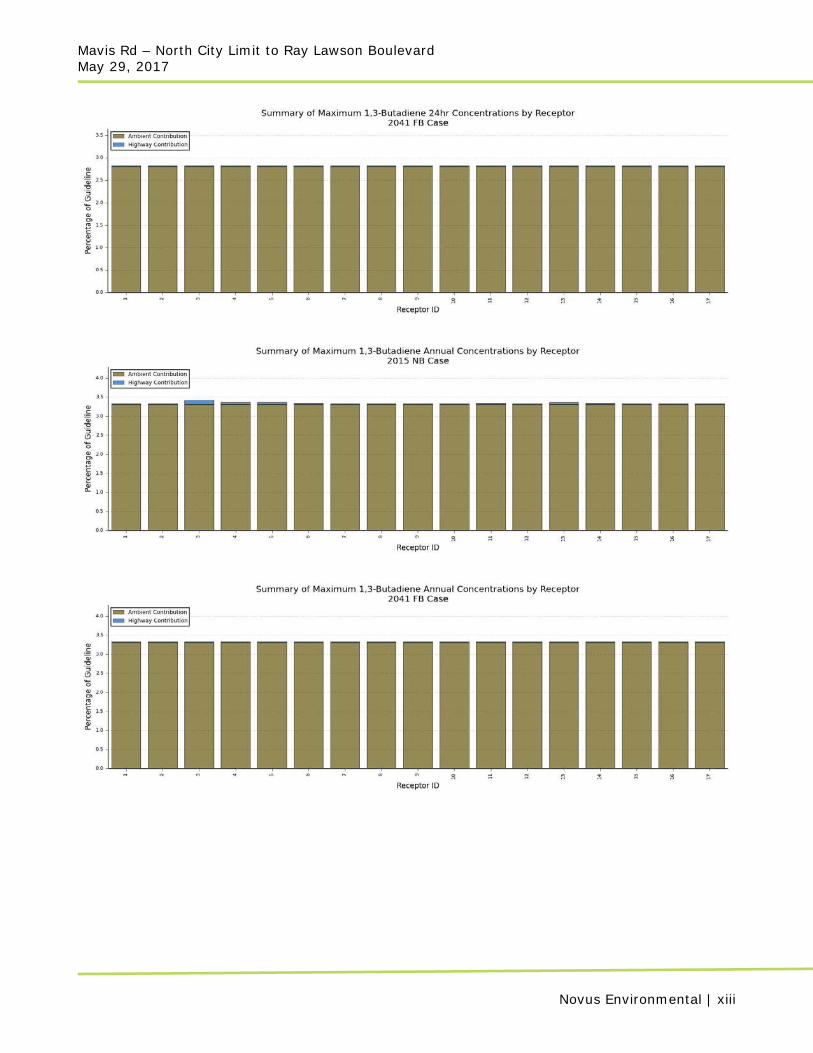
Mavis Rd – North City Limit to Ray Lawson Boulevard May 29, 2017
Novus Environmental | xiii
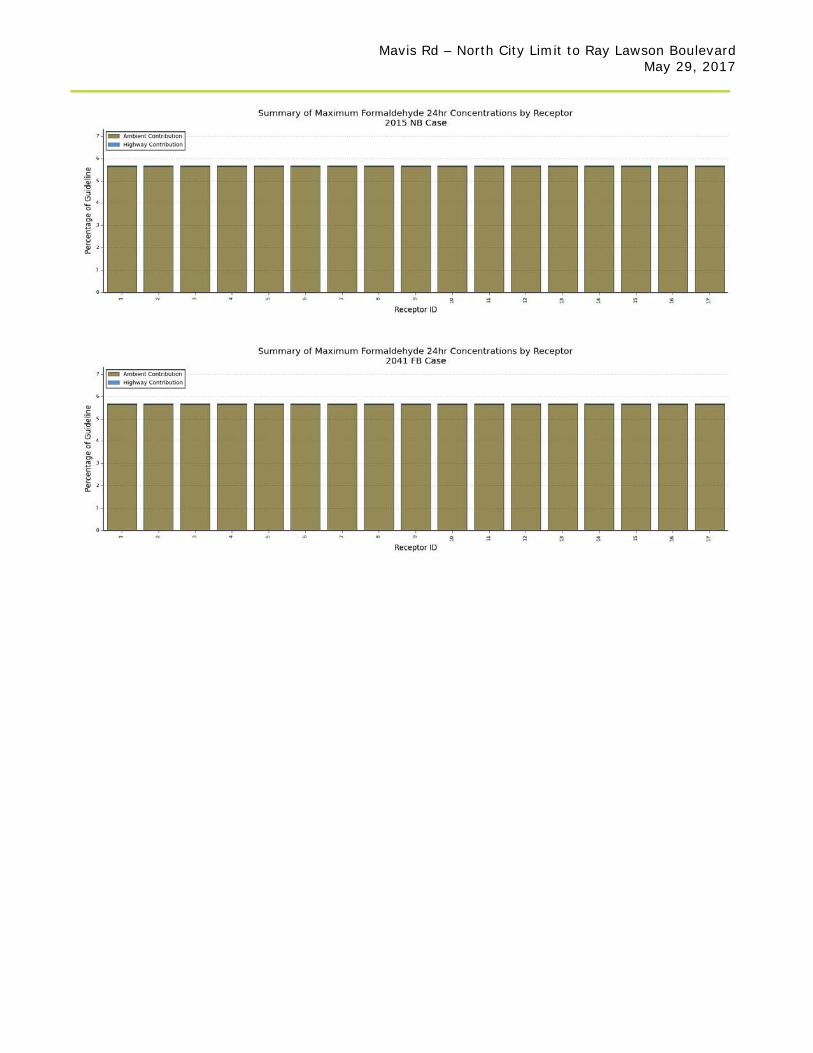
Mavis Rd – North City Limit to Ray Lawson Boulevard May 29, 2017