appendix p woleebee creek bore gw1 gubberamunda core analysis · appendix p woleebee creek bore gw1...
TRANSCRIPT

Appendix P Woleebee Creek bore GW1 Gubberamunda core analysis

Characterisation of the Gubberamunda Sandstone

Characterisation of the Gubberamunda Sandstone
March 2012
Woleebee Creek GW1
1. Regional Gubberamunda Geology. The Late Jurassic Gubberamunda sandstone unconformably
overlies the Westbourne Formation, and represents a high energy mixed continental to shallow
marine environment with fluvial inputs (Green et al., 1997). It consists of medium to coarse-grained,
poorly sorted, quartz-rich sandstones interbedded with fine-grained sandstone, siltstone and shale.
Numerous high permeability lenses and bands within the formation are exploited for their water
resources by agriculture and industry. Regionally, the thickness of the Gubberamunda Sandstone
increases towards the south and south-east, and is up to 300m thick along the axial trend of the
Mimosa Syncline (Figure 1.2). It thins and outcrops towards the basin edges to the east and to the
north-east, north of Roma. On wireline logs, it can be readily identified by a low gamma signal and
high resistivity response. Resistivity typically shows a bell-shaped distribution (values tend to
decrease in the upper Gubberamunda sections) or blocky pattern, reflecting the porous, quartzose
nature of the sandstones. The top of the Gubberamunda is taken where the quartzose sandstones
are conformably overlain by the sandstone and interbedded carbonaceous siltstone, silty mudstone,
tuffs and coals of the Orallo Formation, which caps the Jurassic aged sequences of the Surat Basin,
and can be generally recognised by an overall decrease in the resistivity baseline on wireline logs
(Figure 1.1)
Figure 1.1. Gubberamunda Sandstone wireline log section through Woleebee Creek GW1, Woleebee Creek 7 and Woleebee
Creek GW2 wells (Gamma Ray; Sonic; Density; Resistivity; PHIE; Neutron-Density; Vshale). The top of the Gubberamunda is
taken where the quartzose sandstones are conformably overlain by the sandstone and interbedded carbonaceous siltstone, silty
mudstone, tuffs and coals of the Orallo Formation, which caps the Jurassic aged sequences of the Surat Basin. The base of the
Gubberamunda Sandstone unconformably overlies the Westbourne Formation. On wireline logs the Gubberamunda Sandstone
can be readily identified by a low gamma signal and high resistivity response.
GUBB
WSTBNE
SPBK

Figure 1.2. Gubberamunda Sandstone depth structure map (left); Gubberamunda Sandstone isopach map (right) (surfaces exported from Petrel, Surat Basin Stratigraphic
Framework Final Report, QGC Report 2011). Gubberamunda Sandstone outcrops towards the basin edges to the north and east. Regionally, the thickness of the Gubberamunda
Sandstone increases towards the south and south-east, and is up to 300m thick along the axial trend of the Mimosa Syncline. Average thickness of the Gubberamunda Sandstone
is approximately 100m.
Woleebee Creek GW1 Woleebee Creek GW1

Characterisation of the Gubberamunda Sandstone
March 2012
Figure 2.1. Petrophysical interpretation of the Gubberamunda Sandstone. Logger’s TD recorded at 210.49m. One logging
run was completed. Cored interval is from 150m to 199m. Core to wireline depth shift performed by correlating core
porosity to calculated porosity.

Characterisation of the Gubberamunda Sandstone
March 2012
Figure 2.2. Sedimentary log of Woleebee Creek GW1 – logged interval 150m to 199m. Blue boxes show wash out zones;
approximately 72% of the core was recovered.

Characterisation of the Gubberamunda Sandstone
March 2012
2. Summary of Core Analysis.
Wireline: Weatherford logged the Woleebee Creek GW1 well on September 26, 2011. Logger’s total
depth was 210.49m. One logging run was completed that included gamma ray, resistivity, neutron,
density and sonic. Resulting log data were of good quality (Figure 2.1.).
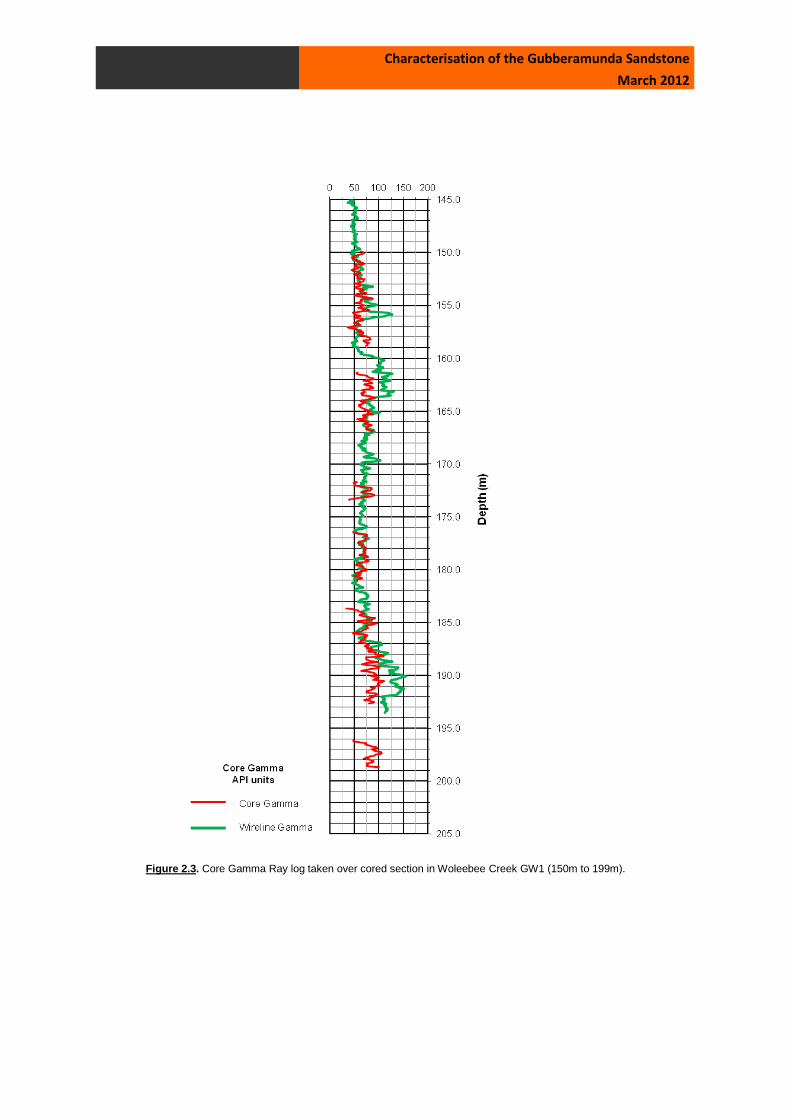
Core: The well was continuously cored from ~150m – 199m. Coring operations resulted in partial
recovery with a reported recovery of 72% (Figure 2.2). The core was transported to Weatherford Labs
in Brisbane for core analysis. Piecing together the cored intervals and determining which intervals
were missing was difficult due to the relatively poor core recovery. A core gamma ray was acquired to
aid in correlation to the wireline gamma ray. The core gamma ray did not provide definitive
information on the depth shift required to match the wireline logs (Figure 2.3). Therefore, depth shifting
of core to log was based on correlation of core porosity to calculated porosity. The core was quite
friable so the majority of the core plugs were placed in a lead sleeve in order to maintain competency.
Several of the plugs failed during extraction and several others were identified as fractured. The
outcome was porosity and permeability data on 45 horizontal plugs and 5 vertical plugs.
Characterisation of the Gubberamunda Sandstone
March 2012
Figure 2.3. Core Gamma Ray log taken over cored section in Woleebee Creek GW1 (150m to 199m).

Characterisation of the Gubberamunda Sandstone
March 2012
3. Results.
a. Thin-sections point counts. Compositional thin section analysis classifies the Gubberamunda
Sandstone as a litharenite composed dominantly of monocrystalline quartz and lithic fragments
(volcanic and chert grains) (Figure 3.1). Texturally, it is a moderate to well-sorted, clean sandstone
with little primary matrix. Intergranular porosity is moderate to high through these sections with
sample values (WC-3 and WC-5) ranging from 22.0% to 33.3% (minor intragranular/moldic porosity
is developed where grain dissolution has occurred). Well developed pervasive authigenic calcite
cement is present in samples WC-1 and WC-4, and correspondingly intergranular porosity is
considerably reduced to just 1.0-1.5%. Clays (kaolinite and illite-smectite) and feldspar “ghost”
grains are present in some samples, formed by feldspar dissolution and grain breakdown to clay
minerals, sample WC-6 being the most representative. Proportionally, quartz grains are replaced by
an increased occurrence of feldspars (15.8% compared to <6.3% in cleaner sections) and
correspondingly, there is an increased presence of detrital clay-matrix and clay-replacement is more
pervasively developed (up to 5.3% of sample). As a result, intergranular porosity is reduced to
16.3%. Modal analysis was not performed on sample WC-2 (siltstone).
Figure 3.1. Quartz-Feldspar-Lithics plot of sandstone composition for the Gubberamunda Sandstone Formation, Surat
Basin in Woleebee Creek GW1 well (classification after Folk, 1980).
Q
L
Quartzarenite
Subarkose
Arkose Lithic
Arkose
Feldspathic
Litharenite
Litharenite
95 95
75 75
25 50 25 F
Sublitharenite

Characterisation of the Gubberamunda Sandstone
March 2012
b. Porosity/Permeability (RCA). In total, 86 horizontal core plugs and 27 vertical core plugs were
sampled, out of which 45 horizontal plugs and 5 vertical plugs were suitable for porosity and
permeability data collection. Analysis indicates high porosity and permeability values in two thin
section samples – WC-3 and WC-5 – which corresponds to clean, stacked channel sands. Two thin
section samples – WC-1 and WC-4 - are tight with very low porosities/permeabilities caused by
pervasive calcite cementation. Interbedded shale, siltstone and sandstone intervals, characterised
by higher Vshale and gamma wireline log readings, display heterogeneous porosity and permeability
readings – beds with high clay contents generally have low to no intergranular porosity and low
permeabilities, while thin quartz-rich bands and lenses between 0.5mm to 2mm thick preserve
intergranular porosity and as such, act as high porosity, high permeability streaks (Figure 3.2).
c. XRD. XRD analysis was run on 6 thin section samples (Figure 3.3). Overall, results show that quartz-
grains are the dominant mineralogy in this cored interval (average 48 wt%, range of 34-70 wt%
quartz grains) with feldspars, alkali and plagioclase feldspar, forming only a minor proportion of the
overall mineralogy (12 wt% and 15 wt% respectively). Clays are present in the greatest abundance
in sample WC-2, dominantly as kaolinite and randomly inter-stratified mixed illite-smectite, but are
rarely present in large concentrations in channel sand sequences. Calcite is present in sample WC-
1 and WC-4, contributing 23 wt% and 32 wt% respectively, present as pervasive, pore-filling calcite
cement.
Figure 3.2. Gubberamunda Sandstone reservoir quality using good horizontal plugs (QGC). A total of 86
horizontal plugs and 27 vertical plugs were attempted, of these 45 horizontal plugs and 5 vertical plugs were
suitable for analysis. The two outlier points relate to porosity-permeability data within the cemented channel lags.
y = 0.0177e0.394x R² = 0.8672
0.01
0.10
1.00
10.0
100
1000
10000
100000
0 5 10 15 20 25 30 35 40
Pe
rme
abili
ty (
mD
)
Porosity (percent)
Woleebee Creek GW1 Gubberamunda Sst
GW1 Poro-Perm
Expon. (GW1 Poro-Perm)

Figure 3.3. X-Ray Diffraction (XRD) analysis was done on six thin sections taken from the Woleebee Creek GW1 cored interval.
Sample Type: Conventional Core
Sample Sample CLAYS CARBONATES OTHER MINERALS TOTALS
Number Depth (m) Chlorite Kaolinite Illite Mx I/S* Mx I/S** Calcite Fe-Dol 1 Siderite Quartz K-spar Plag. Pyrite Barite Clays Carb. Other
wc-1 150.50 1 1 Tr 0 7 23 Tr Tr 38 12 18 0 0 9 23 68
wc-2 162.50 5 18 3 17 0 Tr Tr 2 34 9 12 Tr 0 43 2 55
wc-3 166.20 2 5 2 2 0 Tr 1 Tr 56 16 16 0 0 11 1 88
wc-4 178.50 2 3 Tr 1 0 32 1 Tr 42 8 11 0 0 6 33 61
wc-5 180.85 Tr 1 Tr 0 3 0 Tr Tr 70 12 14 0 0 4 Tr 96
wc-6 189.50 2 3 Tr 0 14 Tr 1 Tr 45 14 21 Tr 0 19 1 80
AVERAGE 2 5 1 3 4 9 1 Tr 48 12 15 Tr 0 15 10 75
* Randomly interstratified mixed-layer illite/smectite; with approximately 95-100% expandable layers
** 100% Expandable - Montmorillonite1
Dolomite species interpretation based on the d-spacing of the highest intensity peak of dolomite group minerals (dolomite-ankerite-kutnohorite)
Woleebee Creek GW1 X-Ray Diffraction (weight %) results

Characterisation of the Gubberamunda Sandstone
March 2012
d. Thin section photos. Figures 3.4 a. - f.
WC-1 (150.5m) (Figure 3.4a; Figure 3.5e.). Cemented, base of channel, sands. Homogeneous,
dominantly quartz grains and lithic fragments (XRD, modal point counts and thin sections support a
volcanic source region) with pervasive pore-filling calcite cement. Grains are angular to sub-angular
indicative of immature sandstone close to source region. No intergranular porosity is preserved
(tight, supported by RCA results). Moderate to well-sorted. Early calcite cementation of grains at
shallow burial depths by flushing of meteoric groundwater is inferred. No obvious calcite
overgrowths are apparent on grains.
WC-2 (162.5m) (Figure 3.4b; Figure 3.5a-c.). Overbank. Heterogeneous, faintly-laminated; dark fine-
grained siltstone bands (>6mm thick) interbedded with thin (0.5mm-2mm), medium to coarse
grained, light-coloured sandstone lenses that exhibit a greater preserved intergranular porosity.
Fine-grained layers exhibit low to no intergranular porosity. Thin beds on sedimentary log may also
be top of sequence channel winnowing (log: 154.5m). High proportion of clays present and minor
organic matter (Figure 3.5b.).
WC-3 (166.2m) (Figure 3.4c.; Figure 3.5d. and f.). Channel sands. Homogeneous, dominantly sub-
angular to angular quartz grains and lithic fragments indicative of immature sandstone close to
source region. High intergranular porosity, no calcite cementation. Moderate to well-sorted. Grain
“ghosting” caused by feldspar breakdown and dissolution is present and feldspar alteration to clay
minerals observed. Quartz grain fracturing and grain-to-grain contact dissolution present (Figure
3.4d; Figure 3.5d.).
WC-4 (178.5m) (Figure 3.4d.; Figure 3.5 e.). as in sample WC-1.
WC-5 (180.85m) (Figure 3.4e.). as in sample WC-3.
WC-6 (189.5m) (Figure 3.4f.).Cross-laminated sandstone. Heterogeneous. Cross-laminated.
Intergranular porosity present but clay alteration occurring to a greater degree than in sample WC-3
& WC-5 and greater degree of “ghosting” caused by feldspar mineral breakdown (Figure 3.5f.). Clay
minerals present as streaks, acting as isolated low porosity/permeability bands; between clay-rich
bands higher intergranular porosity is preserved.

Figure 3.4. (a.) (150.5m, 50x mag). Cemented, base of channel sand (sample WC-1). (b.) (162.5m, 50x mag). Overbank, heterogeneous, interbedded siltstone with sandstone lenses (sample WC-2).
(c.) (166.2m, 50x mag). Clean, channel sand (sample WC-3). (d.) (178.5m, 50x mag). Cemented, base of channel sand (sample WC-4). (e.) (180.85m, 50x mag). Clean, channel sand (sample WC-5).
(f.) (189.5m, 50x mag). Cross-laminated sandstone (sample WC-6).
a. b. c.
d. e. f.

a. b. c.
d. e. f.
Figure 3.5. (a.) (162.5m, 50x mag). Heterogeneity and lamination of clay-rich siltstones interbedded with more quartz-rich sands, impacting the Kv and Kh and intergranular porosity. (b.) (162.5m, 200x
mag). Organic material preserved within clay rich laminations. (c.) (162.5m, 16x mag). Heterogeneity observed at larger millimetre scale; Kv/Kh unlikely to be impacted at grain/millimetre scale but these
overbank sections will act as baffles over metre scales. (d.) (166.2m, 50x mag). Fractured quartz grains and grain-to-grain contacts; quartz grains are sub-angular to angular, close to source (e.) (178.5m,
200x mag). Pervasive, authigenic, pore-filling calcite cement. (f.) (166.2m, 50x mag). “Ghosting”, feldspar dissolution and breakdown and replacement by clays (kaolinite and illite-smectite).

Characterisation of the Gubberamunda Sandstone
March 2012
4. Interpretation.
a. Porosity-Permeability Distribution and Controls.
Kh/Kv channel sands (Figure 4.1).
Sedimentary logging of the Woleebee Creek GW1 core records thick (up to 3.5-4m) stacked channel
sequences, identified by homogeneous, medium to coarse-grained clean sands with dominantly
aggradational, and occasional fining-upward cycles of deposition. Siderite concretions and sideritised
clasts are commonly recorded and are interpreted as forming at shallow burial depths by meteoric
pore waters in an overall non-marine, continental alluvial plain environment. Channel sands form the
majority of the cored interval making up approximately 75% of the total section (estimate based on
wireline interpreted Vshale curve). Observations from core and thin section photographs show
channel sands are moderate to well-sorted, with angular to sub-angular grains and there is little to no
primary matrix, clay material or calcite cementation present (wash out zones are recorded at a
number of intervals on the sedimentary log (Figure 2.2). Using good core plug data only, moderate to
high intergranular porosities range from 24.3% to 35.8%. Horizontal permeability (Kh) values range
from 500mD to 7885mD, with an average of 2598mD. Vertical permeability (Kv) values range from
0.1mD to 5525mD (based on five good vertical core plugs). WC-3 and WC-5 samples taken at
166.20m and 180.85m respectively are typical of these high porosity and high permeability channel
sands.
Kh/Kv channel bases.
Basal pebbly channel lags, where present, are 10-25cm thick, and are typically composed of lithified
sandstone, re-crystallised quartz, coal, carbonate and mudstone clasts. Sedimentary logging and
wireline signatures suggest porosity and permeability to be more variable through these intervals, with
a reduction of both relative to channel sands. Using good core plug data only, intergranular porosities
range between 21% to 28.9%. Kh values range from 117mD to 820mD, with an average of 533mD.
Kv is difficult to determine due to the limited number of good vertical core plugs available, but can be
predicted to be relatively lower than the Kv of channel sands. These intervals are likely to act as
vertical baffles to fluid flow. Their lateral extent should be determined.
Kh/Kv cemented sands (Figure 4.2).
Two high density intervals (fast sonic, increased resistivity) are observed in the core caused by
pervasive calcite cementation reducing intergranular porosities to less than 7%, and corresponding
Kh and Kv permeabilities to less than 0.1mD. These intervals make up about 5% of the cored section
and are up to 2m thick, typified by samples WC-1 and WC-4 taken at 150.50m and 178.50m
respectively. These heavily cemented intervals occur within stacked channel sequences which appear
to follow originally high permeability zones. These intervals are tight in terms of Kh/Kv, acting as
vertical baffles to fluid flow. It will again be important to ascertain the lateral extent of these zones.
Characterisation of the Gubberamunda Sandstone
March 2012
Kh/Kv interbedded siltstones/sandstone (Figure 4.3).
Baffles to fluid flow are recognised in top of channel and overbank sequences. These are typically
2.5-3m thick or occur as thinner beds approximately 50cm thick. These zones account for
approximately 20% of the cored interval overall, and have a greater proportion of silt and mud
present. Vertically these are likely to impede fluid flow. Petrophysical analysis shows an effective
porosity of almost zero though RCA gives higher porosity readings of 21-26%. Kh and Kv appear
highly variable over short 2-3m intervals (interpreted from all RCA porosity-permeability data
available). Using good sample plugs only, average Kh is approximately 0.3mD; Kv has limited good
vertical core plug data from which to take a reading. Core photos and thin section photos support this
heterogeneity showing very fine grained laminated sediments (individual laminations range from 2mm
to >5mm thick). Thin, less silty lenses are likely to act as small higher permeability conduits for fluids,
but the scale of these lenses is of the order of 2mm-4mm thick and therefore is unlikely to greatly
affect the horizontal permeability on a regional scale.
b. Porosity-Permeability Log Calibration to Core – Issues.
Comparison of porosity calculated from wireline logs versus core porosity shows that the log
calculated porosity is lower than the core porosity. The fact that the core porosity tends to be higher
than the calculated porosity can be attributed to the friable nature of the core. During the core
acquisition and core analysis procedures the sand has become less consolidated than when in-situ
resulting in optimistic porosity estimates. These circumstances also impact the permeability
measurements resulting in a core-derived porosity versus permeability relationship that is also
optimistic.

Figure 4.1. Stacked channel sands. Petrophysical interpretation with RCA and interpreted porosity and permeability values included; sedimentary log and core photo of representative interval and thin
section photos.
WC-3
WC-5

Figure 4.2. Petrophysical interpretation with RCA and interpreted porosity and permeability values included; core photo of representative interval and thin section photo of calcite cemented sand channels (purple
staining).
WC-1
WC-4

Figure 4.3. Petrophysical interpretation with RCA and interpreted porosity and permeability values included; sedimentary log and core photo of representative interval and thin section photos of siltstone
overbank sequences.
WC-2

Figure 4.4. Petrophysical interpretation with RCA and interpreted porosity and permeability values included; sedimentary log and core photo of representative interval and thin section photos of cross-
laminated sandstone sequences.
WC-6

Characterisation of the Gubberamunda Sandstone
March 2012
5. Discussion
Overall, the reservoir quality of the Gubberamunda Sandstone, taking into account log to core
calibration discrepancies, indicates very good quality sands with moderate to high intergranular
porosities preserved with individual stacked sections up to 10m thick. Permeability is similarly good,
with multi-Darcy flow indicated. Baffles, present as calcite-cemented channel sands, pebbly channel
lags and overbank clay-rich siltstones, are present over discrete intervals of up to 2m thick, and
display reduced porosity and permeability values that are likely to impede vertical fluid flow. Overall
net reservoir of good quality channel sands approximates 75-80%.
It can be predicted therefore that Kv and Kh will generally be high throughout the sequence as a
whole, but Kv will be relatively lower compared to Kh due to the presence of low permeability siltstone
bands and cementation intervals (Figure 5.1).
In terms of predicting whether or not the Westbourne Formation is an aquifer or aquitard (by
correlating petrophysical log signatures and trends across adjacent wells), it is possible to ascertain
from the petrophysical interpretation that proportionally the number and thickness of low permeability
siltstone/clay-rich intervals increases compared to the overlying Gubberamunda Sandstone, thereby
lowering the overall vertical permeability. Therefore, it is possible to suggest that compared to the
relatively higher Kv in the Gubberamunda, the Westbourne is significantly different and will most likely
act as an aquitard. RCA indicates that porosity is similar to siltstone intervals in the Gubberamunda
and permeability is similarly low, although more extensive analysis would need to be carried out over
the Westbourne interval to corroborate this interpretation. Petrophysical work and water model inputs
should further ascertain the nature of the Westbourne Formation as an aquitard.
0.01
0.10
1.00
10.0
100
1000
10000
0.01 0.10 1.00 10.0 100 1000 10000
Kv
(mD
)
Kh (mD)
Kv vs. Kh Gubberamunda Sandstone
Figure 5.1. Gubberamunda Sandstone reservoir quality using good horizontal plugs only (QGC).