appendix r live load testing - general protocol
TRANSCRIPT

APPENDIX R
LIVE LOAD TESTING - GENERAL PROTOCOL

Protocol LL001 LIVE-LOAD TESTING – GENERAL
Data Collected: • Structural performance characterization
References: IP001 Instrumentation Plan – General LL002 Truck and Load Path Information LL003 Sensor Calibration LL004 Strain Measurement LL005 Bearing Rotation LL006 Deflection Measurements LL007 Temperature Monitoring LL008 Quality Assurance LL010 Test Report
Process Description/Data Collection Principle: Live-Load Testing is performed to obtain important bridge behavioral characteristics such as service strains, service displacements, and bearing rotations. These data will be used to determine important trends in bridge deterioration.
Figure 56. Photo. Example dump truck used in live load testing.
On-site Equipment:
Data Collection Method: Bridges shall be instrumented prior to controlled live loading per an approved instrumentation plan (see protocol IP001). Loads are applied by driving a loaded truck or trucks over the bridge in pre-determined orientations. When possible and in accordance with PennDOT approval, there shall be no traffic on the bridge during load testing.
Load Cases (protocol LL002) are determined based on pre-test analytical models used to determine vehicle location or locations to produce the maximum effects for, at a minimum, typical interior and exterior girders. Loading vehicles are loaded up to the maximum legal load such that the vehicle used will produce the maximum measurable response such that both strain and deflection signal to noise ratios are improved. Loads
Protocol

are verified on certified scales (see Load Truck Protocol LL002).
The data acquisition system(s) employed must accommodate all active sensors for the live-load testing plan, while maintaining required sampling rates. The minimum sample rate for all live-load testing shall be 100 samples per second. There are three acceptable types of live-load test in this program:
(1) Static tests place trucks at the points of maximum response for a certain bridge component and data are sampled for 5 seconds before another static load orientation is established.
(2) Pseudo-static tests place a truck in a specific path and the truck proceeds longitudinally across the bridge at a constant speed between 2 and 5 mph.
(3) High speed tests shall place a truck in the travel lanes while traveling as close to maximum highway speed as possible. High speed testing is always accompanied by a static or pseudo-static test, and shall use the same test truck.
During testing, the attached field testing worksheet shall be filled out and submitted with the report (see Protocol LL007).
Table 39. Worksheet for live load testing.
DATE: 4-27-12 Load Case (as defined
in testing plan) Repetition Approximate Start Time Type of Test File Name Notes
1 1 8:30 AM Quasi-Static Test1-1.dat Rainy 1 2 8:50 AM Quasi-Static Test1-2.dat Overcast, windy 1 3 9:10 AM Quasi-Static Test1-3.dat Partly Cloudy, windy
1D 1 9:50 AM Dynamic Test1-1D.dat Partly Cloudy 1D 2 10:10 AM Dynamic Test1-2D.dat Partly Cloudy 1D 3 10:30 AM Dynamic Test1-3D.dat Sunny 2 1 11:10 AM Static Test2-1.dat Partly Cloudy … … … … … … N Reps Time Type Name Note
Criteria for Data Validation: N/A
Table 40. Data Collection Table for Protocol LL001
# Description Units/format Values/Accuracy 1 State Text Text 2 NBI Structure # Text Text 3 Structure name Text Text 4 Personnel
performing inspection activities
List Name(s)
5 Date of test mm/dd/yyyy Exact date
Data

Next Process: LL008 Quality Assurance LL0010 Test Report
6 Temperature Degrees F 1 degree F 7 Weather Text Text 8 Load case List Text 9 Repetition List Text 10 Type of test Text Text 11 File name Text Text 12 Weather Text Text 13 Comments Text Text

Protocol LL002 LOAD TRUCK AND LOAD PATH INFORMATION
Data Collected: Truck and Load Path Documentation. References: LL001 Live Load Testing – General
Process Description/Data Collection Principle: The information required to document a truck and provide the information to understand load paths is explained.
Information needed includes: • Truck Axle Weights and Dimensions• Load Case Descriptions• Transverse Truck Location (Load Path)
On-site Equipment:
Data Collection Method: Truck Information: Weights and dimensions of the truck are required. Field personnel shall create a figure similar to the example template provided for each load truck. The figure shall include actual axle gauges, spacing and weights. Note that for an n-Axle truck, there are n number of Gauges (G1, G2, G3, ..., Gn) and n-1 number of Spacings (S1, S2, S3, ...,n-1). The Weight (W1, W2, W3, ..., Wn). See protocol LL001 for information on truck sizes. All of this information shall be tabulated as shown in the following example.
Figure 57. Graphic. Example truck axle schematic.
Protocol

Table 41. Example truck configuration table.
Truck A Spacing Gauge Weight
S1 G1 W1 S2 G2 W2 S3 G3 W3 ... ... ...
Sn-1 ... ... - Gn Wn
Transverse Truck Location (Load Path): A Load Path is the transverse location of the truck referenced from the origin of the bridge coordinate system to the driver side front wheel. To document load path, a figure and table, similar to the examples shown below shall be provided. For each load path, dimensions shall be documented as the distance measured in feet and inches from the y-axis origin to the center of the front wheel (closest to the Y-axis) on the driver side of the vehicle.
Load Case: A load case consists of driving one or more loaded trucks across the bridge on one or more pre-determined load paths. Every load case shall be repeated a minimum of three times, if possible. The only exception shall be PennDOT constraints on access to the bridge that restrict the time available for completing the load cases. Each load case shall be indicated on a separate cross-sectional drawing which will be included along with all field-acquired data for each load case. Indicate the type of loading, the load path(s) used, as well as the intent of the load case. For example:
• Load Case 1: Pseudo Static, Load Path 1, Used to maximize Girder 1 (Exterior Girder) response, seeFigure .
• Load Case 3: Pseudo Static, Load Path 2 & 3, Used to mimic multiple presence in driving lanes, seeFigure .
The total number and exact location of each load path will be determined based on the bridge tested. Exact locations shall be selected based on the goals outlined in the Protocols for Live-Load General (LL001). At a minimum, on each bridge, the following load paths should be run:
• Maximize (both) Exterior Girder Response• Maximum Interior Girder (1 Truck)• Maximum Interior Girder (2 Trucks)• Travel Lanes• High Speed in Travel lanes

Figure 58. Illustration. Example of Load Case 1 – Truck A on Shoulder.
Figure 59. Illustration. Example of Load Case 3 – Truck A in Fast Lane and Truck B in Slow Lane.

Table 42. Example load case summary table.
Load Case(LC) # LC Description LP Truck A LP Truck B Repetitions File Name(s)
1 Maximum Exterior Girder 1 1 -- 3 FileName1 FileName2 FileName3
2 Description ## ## 3 FileName4 FileName5 FileName6
3 Multi-presence of driving lanes. 2 3 3 FileName7 FileName8 FileName9
... ... ... ... ... ... n Description ## ## 3 FileName##
Criteria for Data Validation: Minimum of three repetitions.
Proposed Frequency and Spacing: See Protocol Live Load Testing – General (LL001)
Next Process: See Protocol Live Load Testing – General (LL001)
Table 43. Data Collection Table for Protocol LL002
# Description Units/format Values/Accuracy 1 State Text Text 2 NBI Structure # Text Text 3 Structure name Text Text 4 Personnel
performing inspection activities
List Name(s)
5 Date of test mm/dd/yyyy Exact date 6 Load case # Text Text 7 Load case
description Text Text
8 Load case drawing Drawing Drawing 9 LP Truck Text Text 10 Repetitions Integer 11 File name Text Text 12 Comments Text Unlimited
Data

Protocol LL003 SENSOR CALIBRATION
Data Collected: • Sensor Calibration
References: IP001 Instrumentation Plan - General IP002 Sensor Symbols and Nomenclature LL001 Live Load Testing – General LL002 Truck and Load Path Information LL003 Sensor Calibration LL004 Strain Measurement LL005 Deflection Measurements LL007 Temperature Monitoring LL008 Quality Assurance LL010 Test Report
Process Description/Data Collection Principle: Each sensor to monitor bridge performance must be calibrated. Offeror shall provide sufficient proof of calibration.
On-site Equipment: N/A
Data Collection Method:
Commercial, reusable sensors and data acquisition systems shall be calibrated once per year by the manufacturer provided they are not visibly damaged. Damaged sensors shall be refurbished and recalibrated or replaced prior to testing. Offeror constructed sensors shall be calibrated to the expected sensor range, on a per bridge basis, prior to testing plan submission. Documentation of sensor calibration must include sensor excitation magnitude, applied strain, rotation or displacement and the corresponding sensor output.
Copies of all sensor calibration information shall be provided with the live-load testing plan (see Protocols IP001 and LL001) prior to approval and the final bridge test report (see Protocol LL010). All calibration information must be referenced to a specific instrument using appropriate nomenclature (see Protocol IP002)
Criteria for Data Validation: N/A
Protocol

Proposed Frequency and Spacing: See Protocol Live Load Testing – General (LL001)
Next Process: See Protocol Live Load Testing – General (LL001)
Data

Protocol LL004 STRAIN MEASUREMENT
Data Collected: • Service Strains
References:
LL001 Live Load Testing – General LL002 Truck and Load Path Information LL008 Quality Assurance
Process Description/Data Collection Principle: Service strains are important in understanding bridge superstructure and deck behavior. Strain measurements during individual live load tests shall be in accordance with Protocol LL001 "Live-Load Testing-General" and Protocol LL002 "Load Truck and Load Path Information". Data taken during the baseline tests shall be compared with values from simplified beam analysis to evaluate if data are reasonable. Data from the baseline tests shall also be used to calibrate a finite element model for the bridge. Data from subsequent tests shall be compared with values from either a calibrated finite element model or from a combination of a calibrated finite element model and a value calculated using AASHTO LRFD Bridge Design Specifications' material and geometric properties.
Wheel load distributions can be calculated from the strain values measured during testing. This is used to characterize the bridge deck stiffness. Strain values are measured on the bottom of girders and 1/3 of the girder depth up on the web as shown in the figure. Comparing strain values at different girder depths gives insight into the level of composite action between the bridge deck and girders.
Figure 60. Illustration. Typical strain gauge
On-site Equipment:
Data Collection Method: For live-load testing, the strain sample rate must be set according to Protocol LL001. Additionally, strain sensors must have resolution and accuracy better than +/- 5 microstrain.
Installation Location – Cross-Section: Strain sensors are attached per instrumentation plan where maximum positive moment (tension strains) and negative moment (compression strains) takes place. In negative moment regions, near a pier, strain sensors must be placed one girder depth, plus deck thickness, from the face of the bearing. This is to ensure data is not affected by the local effects created
by the large bearing force.
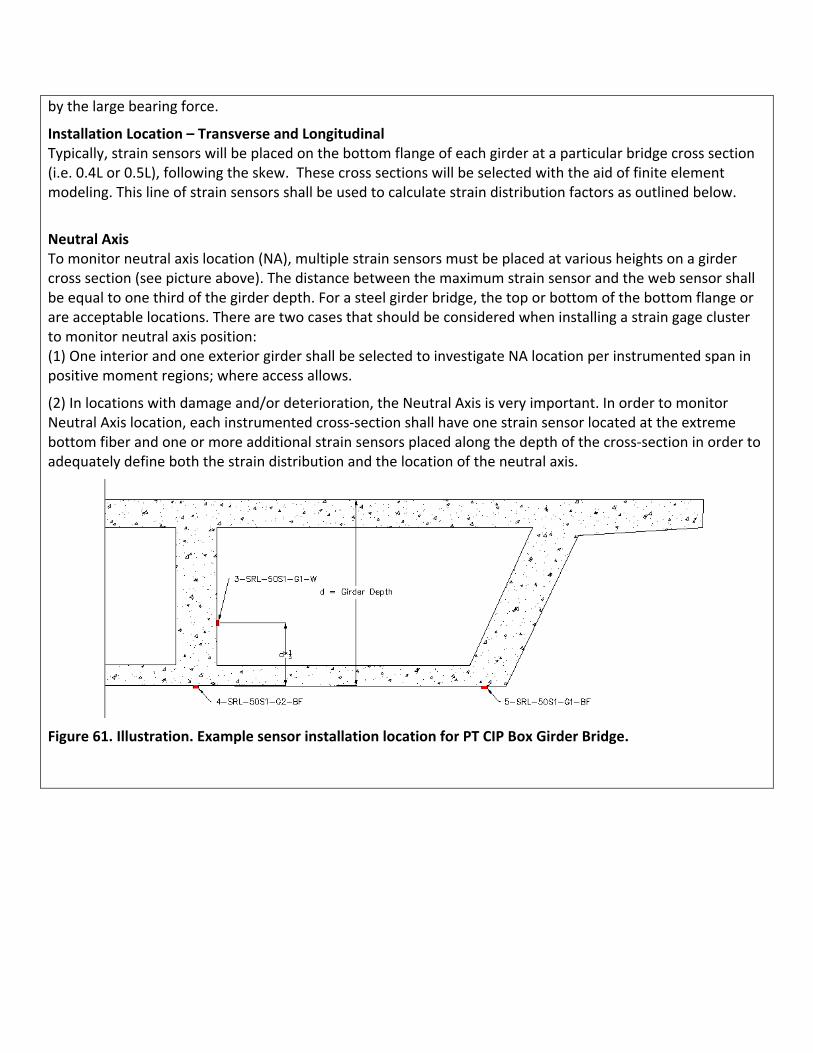
Installation Location – Transverse and Longitudinal Typically, strain sensors will be placed on the bottom flange of each girder at a particular bridge cross section (i.e. 0.4L or 0.5L), following the skew. These cross sections will be selected with the aid of finite element modeling. This line of strain sensors shall be used to calculate strain distribution factors as outlined below.
Neutral Axis To monitor neutral axis location (NA), multiple strain sensors must be placed at various heights on a girder cross section (see picture above). The distance between the maximum strain sensor and the web sensor shall be equal to one third of the girder depth. For a steel girder bridge, the top or bottom of the bottom flange or are acceptable locations. There are two cases that should be considered when installing a strain gage cluster to monitor neutral axis position: (1) One interior and one exterior girder shall be selected to investigate NA location per instrumented span in positive moment regions; where access allows.
(2) In locations with damage and/or deterioration, the Neutral Axis is very important. In order to monitor Neutral Axis location, each instrumented cross-section shall have one strain sensor located at the extreme bottom fiber and one or more additional strain sensors placed along the depth of the cross-section in order to adequately define both the strain distribution and the location of the neutral axis.
Figure 61. Illustration. Example sensor installation location for PT CIP Box Girder Bridge.

Figure 62. Illustration. Example of sensor installation location for Adjacent Box Girder Bridge.
Figure 63. Illustration. Example of sensor installation for PS Concrete Girder Bridge.
Figure 64. Illustration. Example of sensor installation for Steel Girder Bridge.

Data Processing: The following information will be reported for live-load test strains:
• Maximum tension and compression strains for each strain sensor
o For each truck lane location the maximum observed girder strain and the other girder strainscorresponding to this strain are to be recorded. The average and standard deviation of eachrepetition will be presented in a clear tabular format. An example for this format can be foundbelow.
Table 44. Example of data reporting format.
Bridge Cross Section A – 0.5L GDFmax Web Number – Strains (microstrain)
1 2 3 4 5 6
Lane #1 Average 88 69 40 19 8 2 0.38 Std. Dev. 2 2 1 1 1 1
Lane #2 Average 36 50 61 41 25 12 0.27 Std. Dev. 1 1 2 2 1 1
Lane #3 Average 122 117 100 61 34 12 0.55 Std. Dev. 1 1 0 1 1 1
GDFmax = maximum distribution factor
• Distribution Factors from Strain Data
o For each truck lane location, the following formula shall be used to calculate the simple girderdistribution factor:
Figure 65. Equation. Girder distribution factor.
Where: • GDFmax is the maximum distribution factor,• N is the number of trucks loading the bridge,• Rmax is the maximum tension or compression strain response from the line of strain
sensors representing location of maximum response in each girder,

• n is the number of girders,• Rj is the strain in girder j, when Rmax is achieved, from the location of maximum response
• Neutral Axis (NA) Location
o At each girder cross section where there are more than two strain gages, at various depths (e.g.see Figure), a line shall be fit to the strain readings to estimate the position of zero strain for thecross section to report a NA location. The strains used to determine NA location will correspondto the point of maximum strain for the strain sensors.
o A predicted neutral axis location, using transformed section properties and AASHTO effectivewidth, not including barrier rails or reinforcement shall also be reported for each sensor clusterposition. The neutral axis location (measured and calculated values) shall be reported as thedistance from the bottom of the girder cross section for each truck lane location and reportedin a similar fashion as outlined above.
• Strain Impact Factors
o To determine the dynamic effect on any sensor measurement the following equation is used:
dynamic
static
RIM
R=
Figure 66. Equation. Dynamic amplification factor.
Where: • IM is the dynamic amplification factor for the sensor for a single repetition of a
particular truck path,• Rdynamic is maximum dynamic response from the strain or deflection sensor, for a
particular truck path and repetition,• Rstatic is the average of the maximum static responses for the sensor for the same truck
path as used for Rdynamic,
o For each high-speed load case, the bottom flange strain and deflection measurements shall have thebasic dynamic amplification factor reported along with the truck weight and speed during each crossing.Examples of this are presented below.
Table 45. Example data reporting for high-speed load case.
Repetition # Truck Weight(kips)
Truck Speed (mph)

Lane #1
1 76.7 55 2 73.1 40 3 76.7 55 4 73.1 45
Lane #2
1 76.7 60 2 73.1 46 3 76.7 55 4 73.1 46
Table 46. Example data reporting for high-speed load case.
IM
Repetition # 4-SRL-50S1-G1-BF 4-SRL-50S1-G2-BF 4-SRL-50S1-G3-BF
Lane #1
1 0.04 0.10 0.07 2 0.05 0.03 0.04 3 0.01 0.11 0.01 4 0.02 0.04 0.03
Lane #2
1 0.16 0.20 0.11 2 0.35 0.36 0.35 3 0.06 0.10 0.11 4 0.13 0.0.9 0.07
Criteria for Data Validation: Data taken during the baseline tests is validated by comparing the data with values from simplified beam analysis to evaluate if it is reasonable. Data from the baseline tests shall also be used to calibrate a finite element model for the bridge. Data from subsequent tests shall be compared with values from either a calibrated finite element model or from a combination of a calibrated finite element model and values calculated using AASHTO LRFD Bridge Design Specifications' material and geometric properties.
Data

Proposed Frequency and Spacing: See Protocol Live Load Testing – General (LL001)
Next Process: See Protocol Live Load Testing – General (LL001)

Protocol LL005 BEARING ROTATION
Data Collected: • Assessment of steel bridge bearing rotations
References: LL001 Live Load Testing – General LL002 Truck and Load Path Information LL008 Quality Assurance
Process Description/Data Collection Principle: End Condition Details (fixed, roller, pinned, etc.) are important in understanding bridge superstructure behavior. Bearings that are not performing as designed can cause unanticipated stresses in other elements. Pre-test analytical models will be used to determine vehicle location or locations to produce the maximum effects for bearings. Data are validated using either a calibrated finite element model, or a combination of a calibrated finite element model and values calculated using AASHTO LRFD Bridge Design Specifications' material and geometric properties.
On-site Equipment:
Data Collection Method: The term inclinometer in this protocol refers to any device which directly measures rotation. Bearing rotations are typically very small therefore sensors shall have a resolution and accuracy within +/-0.001 degrees.
The sensor shall be attached as close as possible to the centerline of bearing and bottom flange. Any longitudinal deviation from the bearing centerline shall be measured and reported within 1 inch.
Figure 67. Photo. Example installation of rotation sensor on Steel Girder Bridge.
Protocol

Figure 68. Photo. Example installation of rotation sensor on PS Concrete Girder Bridge.
Figure 69. Photo. Example installation of rotation sensor on PI CIP Concrete Box Girder Bridge.
Criteria for Data Processing: For each load case (Protocol LL002) the average of the maximum bearing rotations from each repetition shall be reported. These data shall be presented in a clear tabular format. An example presentation format can be found below. These values will be used as a baseline for future comparison.
Table 47. Example data format for bearing rotations.

Bearing Rotations (deg. × 10-2) 23-RML-
0S1-G1-BF 24-RML-
100S1-G1-BF 25-RML-
0S1-G3-BF 26-RML-
100S1-G3-BF
Lane #1 Average 2.6 3.8 3.0 4.8 Std. Dev. 0.1 0.2 0.3 0.2
Lane #2 Average 2.4 1.9 3.1 5.9 Std. Dev. 0.1 0.2 0.1 0.2
Lane #3 Average 5.1 5.8 6.6 10.3 Std. Dev. 0.1 0.2 0.2 0.5
Criteria for Data Validation: Data taken during the baseline tests is validated by comparing the data with values from simplified beam analysis to evaluate if it is reasonable. Data from the baseline tests shall also be used to calibrate a finite element model for the bridge. Data from subsequent tests shall be compared with values from either a calibrated finite element model or from a combination of a calibrated finite element model and values calculated using AASHTO LRFD Bridge Design Specifications' material and geometric properties.
Proposed Frequency and Spacing: See Protocol Live Load Testing – General (LL001)
Next Process: See Protocol Live Load Testing – General (LL001)
Data

Protocol LL006 DEFLECTION MEASUREMENTS
Data Collected: • Steel Girder Bridge Displacements
References: LL001 Live Load Testing – General LL002 Truck and Load Path Information LL003 Strain Measurement LL008 Quality Assurance
Process Description/Data Collection Principle: Vertical service displacements are important in understanding bridge superstructure and deck behavior. Vertical girder displacements are measured during live-load testing. Expected values for displacements are determined from a finite element model.
Out of plane displacements at service levels are important to determine the behavior of the bridge, driving mechanism causing out of plane distortion. The measurement of out of plane distortion shall capture and movements due to live loads as well as ambient movements.
Figure 70. Photo. Example of installing a displacement sensor on a Steel Girder Bridge.
On-site Equipment: Encase sensors in stainless steel housing suitable for use in harsh environments.
Data Collection Method: For the purposes of this protocol, deflectometer is defined as any vertical displacement and LVDT is defined for out of plane displacements measuring device. The deflectometers and LVDT employed must be capable of accuracy and resolution of at least 0.001 inch. Selection of the type of deflectometer to be used is a function of bridge height, magnitude of response expected. LVDTs must be capable of capturing a displacmeent range of +/- 1/4 inch. Deflectometers and LVDTs should be attached to ensure fixity throughout the test and conform to manufacturers’ recommendation and DOT requirements.
At a minimum, deflectometers are attached where maximum deflections or displacements take place, determined by finite element modeling, typically at the same locations as maximum strains (see Protocol LL003). This line of deflectometers shall be used to calculate distribution factors as outlined below.
Protocol

Figure 71. Photo. Example of installing a displacement sensor on a PS CIP Concrete Girder Bridge.
Figure 72. Photo. Example of installing a displacement sensor on a PS Concrete girder bridge.

Figure 73. Photo. Example of installing a displacement sensor for out of plane displacements using Spring-loaded linear variable differential transformers (LVDT)Data Processing: The following information will be reported for live-load test deflections:
• Maximum deflection for each deflection sensor
o For each load case and repetition (see Truck and Load Path Information Protocol LL002) identifythe truck position resulting in maximum girder displacement. Record the maximum observedgirder displacement and the remaining girder displacements at the same truck position shall berecorded. For each load case, report the average and standard deviation of the girderdisplacements from this truck location. These values shall be presented in a clear tabularformat. An example for this format can be found below.
Table 48. Example deflection data reporting format.
Span 1 – 85 ft GDFmax Girder Number – Deflections (in.)
1 2 3 4 5 6
Lane #1 Average 0.25 0.19 0.13 0.07 0.04 0.01
0.36 Std. Dev. 0.01 0.01 0.00 0.00 0.00 0.00
Lane #2 Average 0.13 0.15 0.17 0.14 0.10 0.05
0.23 Std. Dev. 0.00 0.00 0.00 0.01 0.00 0.00
Lane #3 Average 0.37 0.32 0.30 0.21 0.13 0.05
0.54 Std. Dev. 0.00 0.00 0.00 0.00 0.00 0.00
• Distribution Factors from Deflection Data
o For each truck lane location, the following formula shall be used to calculate the girderdistribution factor:

Figure 74. Equation. Girder distribution factor.
Where: • GDFmax is the maximum distribution factor,• N is the number of trucks loading the bridge,• Rmax is the maximum deflection response from the line of strain sensors representing
location of maximum response in each girder,• n is the number of girders,• Rj is the strain in girder j, when Rmax is occurs, from the location of maximum response
• Impact Factors from Deflection Data
o To determine the dynamic effect on any sensor measurement the following equation is used:
dynamic
static
RIM
R=
Figure 75. Equation. Dynamic amplification factor.
Where: • IM is the dynamic amplification factor for the sensor for a single repetition of a
particular truck path,• Rdynamic is maximum dynamic response from the strain or deflection sensor, for a
particular truck path and repetition,• Rstatic is the average of the maximum static responses for the sensor for the same truck
path as used for Rdynamic,
o For each high-speed load case, the deflection measurements shall have the dynamic amplification factorreported along with the truck weight and speed during each crossing. Examples of this are presentedbelow.
Table 49. Example data reporting for high-speed load case.
LVDTs - The measurement of out of plane displacements shall be compared to load test results, normal ambient traffic, passage of heavy trucks and temperature variation.

Repetition # Truck Weight(kips)
Truck Speed (mph)
Lane #1
1 76.7 55 2 73.1 40 3 76.7 55 4 73.1 45
Lane #2
1 76.7 60 2 73.1 46 3 76.7 55 4 73.1 46
Table 50. Example data reporting for high-speed load case.
IM Repetition # D23-LV-50S5-17.3-BF D24-LV-50S5-17.3-BF D25-LV-50S5-17.3-BF
Lane #1
1 0.04 0.10 0.07 2 0.05 0.03 0.04 3 0.01 0.11 0.01 4 0.02 0.04 0.03
Lane #2
1 0.16 0.20 0.11 2 0.35 0.36 0.35 3 0.06 0.10 0.11 4 0.13 0.0.9 0.07
Criteria for Data Validation: Data shall be evaluated during the live-load tests to determine its consistency and repeatability, as well as if it is reasonabale. Data taken during the baseline tests shall be compared with values from simplified beam analysis to evaluate if it is reasonable. Data from the baseline tests shall also be used to calibrate a finite element model for the bridge. Data from subsequent tests shall be compared with values from either a calibrated finite element model or from a combination of a calibrated finite element model and a value calculated using AASHTO LRFD Bridge Design Specifications' material and geometric properties.
Proposed Frequency and Spacing: See Protocol Live Load Testing – General (LL001)
Data

Next Process: See Protocol Live Load Testing – General (LL001)

Protocol LL007 TEMPERATURE MONITORING
Data Collected: • Bridge Temperature
References: LL001 Live Load Testing – General
Process Description/Data Collection Principle: A bridge experiences temperature variations through the seasons and throughout the day. The expansion and contraction of the bridge joint and bearings plays a role in service behavior and can affect bridge response during live-load testing. For this reason it is important to monitor changes in temperature during the test. These temperatures may help explain differences in bridge behavior during a test and between tests.
Figure 76. Illustration. Thermometers.
On-site Equipment: A hand held non-contact temperature sensor with a resolution and accuracy better than +/- 3oF.
Data Collection Method: Surface temperatures shall be recorded at the top of the bridge deck and on the bottom flange of a single interior girder for a single span of the bridge. Temperature shall be recorded and reported at minimum intervals of 30 minutes throughout testing. Sensors employed can be a hand held non-contact temperature sensor, and any temperature sensor with a resolution and accuracy better than +/- 3oF.
Data Processing: The following information shall be reported for live-load test strains:
• Temperature and timestamp information
o Average temperature and timestamp data, at 30 minute intervals throughout live-load test.Temperature timestamp shall be synched with timestamp on data acquisition of strain,displacement and rotation information to within ±5 minutes. Data shall be reported in a tabularformat as presented below.
Table 51. Example temperature data reporting format.
Time Stamp (24 Hour Time)
53-RML-50S1-G3-TD (oF)
54-RML-50S1-G3-BF (oF)
8:00 70 65 8:30 72 65 … … …
13:30 90 75

Criteria for Data Validation:
Proposed Frequency and Spacing: See Protocol Live Load Testing – General (LL001)
Next Process: See Protocol Live Load Testing – General (LL001)
Data

Protocol LL008 QUALITY ASSURANCE
Data Collected: • Quality Assurance
References: LL001 Live Load Testing – General LL002 Truck and Load Path Information LL003 Sensor Calibration LL004 Strain Measurement LL005 Bearing Rotation LL006 Deflection Measurements LL007 Temperature Monitoring
Process description: Live-load testing requires significant planning, preparation, time to conduct, and investment to bring to fruition. For this reason, it is important to ensure high data quality prior to processing and archiving. In order to assure that testing results are acceptable, certain benchmarks must be met.
On-site Equipment: N/A
Data Collection Method: Data shall be evaluated during the live-load tests to determine its consistency and repeatability, as well as if it is reasonabale. Data taken during the baseline tests shall be compared with values from simplified beam analysis to evaluate if it is reasonable. Data from the baseline tests shall also be used to calibrate a finite element model for the bridge. Data from subsequent tests shall be compared with values from either a calibrated finite element model or from a combination of a calibrated finite element model and a value calculated using AASHTO LRFD Bridge Design Specifications' material and geometric properties.
Criteria for Data Validation: N/A
Protocol

Proposed Frequency and Spacing: See Protocol Live Load Testing – General (LL001)
Next Process: See Protocol Live Load Testing – General (LL001)
Data

Protocol LL010 TEST REPORT
Data Collected: • Live-Load Test Report
References: IP001 Instrumentation Plan - General IP002 Sensor Symbols and Nomenclature LL001 Live Load Testing – General LL002 Truck and Load Path Information LL003 Sensor Calibration LL004 Strain Measurement LL005 Bearing Rotation LL006 Deflection Measurements LL007 Temperature MonitoringLL008 Quality Assurance
Process description: Following live-load testing, results shall be summarized in a concise document. Details of test setup and procedure shall be outlined such that the test can be reproduced and the same results recorded by another research team. Results must be processed as outlined in the instrument protocols (see Protocols LL004, LL005, and LL006 for strain, bearing rotation, and displacement, respectively) and any unexpected results shall be thoroughly explained.
Figure 77. Graphic. Report.
On-site Equipment: N/A
Data Collection Method: The following outline is suggested for the live-load testing report:
• Executive Summary• Bridge and Site Description• Pretest Finite Element Creation and Results
o Present Maxima for strain, displacement, and rotation.• Test Setup and Procedures
o Instrumentation Plan (see Protocol IP001)o Truck and Load Case Information (see Protocol LL002)
• Data Results and Analysis
Protocol

o Present information required by sensor protocols (Protocols LL004, LL005, and LL006 (includesdynamic amplification))
o Explain excessive differences between pretest finite element results and measured results (seeProtocol LL008)
o Present information on any area of considerable deterioration monitored.o Provide sample plots of each sensor type vs. truck position from each load case.o Provide explanation and plot of response vs. truck position for all sensors that are behaving
unexpectedly.• Conclusions• References• Appendices
o Field Notes (see Protocol LL001)o Calibration information (see Protocol LL003)
The report shall be submitted and accepted before the raw data is submitted.
Criteria for Data Validation: N/A
Proposed Frequency and Spacing: See Protocol Live Load Testing – General (LL001)
Next Process: N/A
Table 52. Data Collection for Protocol LL010
# Description Units/format Values/Accuracy 1 State Text Text 2 NBI Structure # Text Text 3 Structure name Text Text 4 Personnel preparing
report List Name(s)
5 Date of report Mm/dd/yyyy Exact date 6 Comments Text Unlimited
Data