appendix to systemperspective 2035 … power consumption ... 3.3.8 atr - catalytic reformer..... 14...
TRANSCRIPT

Dok. 17/01970-19
APPENDIX TO SYSTEMPERSPECTIVE 2035
MODELLING OF ENERGY PLANTS

Dok. 17/01970-19
Indhold
1. Introduction ..................................................................................... 6
2. Heat Areas ....................................................................................... 7
3. Production units .............................................................................. 9
3.1 Dryer Unit ............................................................................................................. 9
3.1.1 Assumptions ............................................................................................. 9
3.1.2 Mass and energy balance: ........................................................................ 9
3.1.3 Power consumption ................................................................................. 9
3.2 Gasification and methanol production ............................................................... 10
3.3 Thermal Gasification and Gas Cleaning Unit ....................................................... 11
3.3.1 Description of processes ........................................................................ 11
3.3.2 Biomass Infeeder .................................................................................... 12
3.3.3 Thermal gasification reactor ................................................................... 12
3.3.4 The Product gas cleaning processes ....................................................... 13
3.3.5 Tar reformer ........................................................................................... 13
3.3.6 Dust filter ................................................................................................ 14
3.3.7 Guard bed (H2S cleaning) ........................................................................ 14
3.3.8 ATR - catalytic reformer.......................................................................... 14
3.3.9 Rectisol CO2 removal .............................................................................. 14
3.4 Methanol Synthesis and Purification .................................................................. 16
3.4.1 Technical description .............................................................................. 16
3.4.2 Recirculation and purge gas ................................................................... 16
3.4.3 Syn gas composition ............................................................................... 16
3.5 Water Shift Reactor Unit ..................................................................................... 18
3.6 Electrolysis Unit .................................................................................................. 19
3.6.1 SOEC ....................................................................................................... 19
3.6.2 Alkaline Electrolysis ................................................................................ 20

Dok. 17/01970-19
3.7 EC gas Splitter Unit ............................................................................................. 21
3.8 GT SC Unit ........................................................................................................... 21
3.9 Steam Turbine Unit ............................................................................................. 22
3.9.1 Cost of Steam Turbine ............................................................................ 23
3.10 Air Separation Unit ............................................................................................. 23
3.11 Gas Boiler Unit .................................................................................................... 24
4. Storages ......................................................................................... 26
4.1 District Heating Storage ...................................................................................... 26
4.2 Oxygen storage ................................................................................................... 26
4.3 SynGas storage ................................................................................................... 28
5. Market Prices ................................................................................ 29
5.1 Oxygen Market ................................................................................................... 29
5.2 Natural gas .......................................................................................................... 29
5.3 Wood Chips ......................................................................................................... 29
5.4 Bio Methanol ...................................................................................................... 29
5.5 Electricity ............................................................................................................ 29
6. Heat demands ............................................................................... 30
6.1 District heating .................................................................................................... 30
6.2 Process Heat ....................................................................................................... 30
6.3 District Heat Sink................................................................................................. 30
7. Simulation Results without ADAPT optimisation .......................... 31
7.1 Energy flows ........................................................................................................ 31
7.2 Power price profile and heat demand per hour ................................................. 32
7.3 Operation profile for the production units ......................................................... 32
7.4 Storage levels ...................................................................................................... 34
8. 34
9. Simulation Results with ADAPT optimisation ............................... 34

Dok. 17/01970-19
9.1 Energy flows ........................................................................................................ 34
9.2 36
9.3 Power price profile and heat demand per hour ................................................. 36
9.4 Operation profile for the production units ......................................................... 36
9.5 Storage levels ...................................................................................................... 38
10. Sensitivity analysis ......................................................................... 39
10.1 Baseline model.................................................................................................... 39
10.1.1 General issues ......................................................................................... 39
10.1.2 Prices ...................................................................................................... 39
10.1.3 CAPEX ..................................................................................................... 39
10.1.4 OPEX ....................................................................................................... 39
10.1.5 Key economic figures.............................................................................. 40
10.1.6 Baseline model Energy Flows ................................................................. 41
10.1.7 41
10.1.8 Baseline model Key Figures .................................................................... 41
10.1.9 42
10.1.10 Baseline model Electrolysis Unit operation ............................................ 42
10.2 43
10.3 43
10.4 Internal Rate of Return (IRR) at different MeOH prices ..................................... 43
10.5 47
10.6 Variation in electricity price and profile ............................................................. 47
10.6.1 More oscillating electricity prices ........................................................... 47
10.6.2 50
10.6.3 Lower electricity prices ........................................................................... 50
10.7 Higher biomass cost ............................................................................................ 54
10.7.1 Biomass price + 20% scenario ................................................................ 54
10.7.2 56

Dok. 17/01970-19
10.7.3 Biomass price + 40% scenario ................................................................ 56
10.8 Forced ASU operation – cost of flexibility ........................................................... 58
10.9 Green Syn Fuel composition on syngas versus baseline composition ................ 61
10.10 Investment cost variations ..................................................................... 64
10.10.1 Investment costs reduced with 30% ...................................................... 64
10.10.2 Investment costs increased with 30% .................................................... 66
10.11 Gas turbine investment halved .............................................................. 68
10.12 ............................................................................................................................ 70
10.13 SOEC versus Alkaline .............................................................................. 70
11. References ..................................................................................... 72
12. Appendix 1 ..................................................................................... 73
12.1.1 Baseline model Energy Flows ................................................................. 73
12.1.2 73
12.1.3 Baseline model Key Figures .................................................................... 73
12.1.4 74
12.1.5 Baseline model Electrolysis Unit operation ............................................ 74
12.1.6 Baseline model Energy Flows new Sifre version ..................................... 75
12.1.7 75
12.1.8 Baseline model Key Figures new Sifre version ........................................ 75
12.1.9 76
12.1.10 Baseline model Electrolysis Unit operation new Sifre version ................ 76

Dok. 17/01970-19
1. Introduction
This document describes modeling of a combined energy plant in 2030/2035.. This type of
energy plant is a part of Energinet’s “System Perspective 2035” analysis. In this analysis two
integrated “Energy Plants” is analysed.
Centralized energy plant (type 3) and Decentralized energy plant (type 2) as shown below.
Figure 1: Integration of power, gas and heat. In this appendix the type 3 plant (upper left) is
documented in more details.
The energy plant is seen as a potential rebuilding/replacement of a central power plant. One of
the constraining parameters for the plant is therefore to supply district heating to the city
where the power plant is located.
The combined energy plant produces: District heating/process heat, methanol for transporta-
tion use and potential peak electricity. Furthermore the energy plant should be able to fit into
an electricity market with large amount of wind energy.
The energy plant will be modeled in Energinet's modeling tool, Sifre. This enable hour to hour
operational optimization based on forecasted hour-to-hour electricity prices.
Sifre’s ADAPT module for investment optimization is used in second step to optimize the sizes
of the individual process units based on one year of operation.
Energy plant type III model:

Dok. 17/01970-19
Figure 2: Sifre detailed model of Energy Plant Type III
This model is partly based on technologies under development. It is assumed, that especially
the Thermal Gasification and Gas Cleaning will be developed to a commercial level with the
today expected investment costs. EA Energianalyse summarise in the report: Grøn Roadmap
2030. Scenarier og virkemidler til omstilling af transportsektorens energiforbrug, November
2015.
”De tekniske udfordringer ved forgasningsteknologierne har vist sig at være betydelige, når
biomasse er råvaren. Et egentligt kommercielt gennembrud kræver derfor en målrettet og lang-
sigtet udviklingsindsats som bedst løftes i internationalt samarbejde. Det synes særdeles usik-
kert, om der kan opnås en betydelig kommerciel produktion inden 2030.” [15]
2. Heat Areas
As Sifre doesn’t work with mass flows and temperature and pressure levels but only energy
flows it has been chosen to operate with three different heat areas:
District Heating area for energy streams at 50-110°C (DH)
Low Temperature Process Heat for energy streams at 110-300°C (LTPH)
High temperature Process Heat for energy streams at 300-1000°C (HTPH)
The general idea of the splitting in three heat areas is, that the HTPH is capable of generating
steam for at steam turbine and supplying HT heat for a SOEC electrolysis. The LTPH is used for
drying and purification processes and can be sold as process heat for industrial use. The DH will
Black numbers are Energy flows in MWh over 24 hours 0
Red numbers are prices in DKK/MWh
0,0
191 0,020
411 0 0
411 To Gas Boiler 0 0
215 To HT Proces Heat
0
5313
4594 5017
0,2866 0,3064 4594 395
0 395
0,0
0
548 To DH
4594
From HTPH 610
0
0,0 503 Ngas 9085
470 0 LTPH 411
12000 12000 9085 4090 10390 10390
0 713
207 207 2903 952 2839 713
2111
2903 988 2839
2338,4 1851
565 1851
1593
From EC
0 539 0,0
380 To Water Shift 258
614,3
1094
230 0
From ST 0,0 From CHP
2596 514,2 519,2 From Water Shift 1372
0
514,16 540
To DH
539 247
610
1081710817 Wood-
Chips
Thermal
Gasification
SynGas
Storage
EC EL
SynGas
LT Proces
Heat
Proces-
heat
El
DK1
Gas-Boiler
GT SC
Methanol
Synthesis
District
HeatingDH
storage
DH Sink
Methanol
Market
Methan
ol
O2 EC gasEC gas
splitter
H2
O2
Market
Water shift
Dryer
DH
Demand
NGas
Dried
Wood
Wood-
Chips
Market
NGas
market
HT Proces
Heat
HM1
H Splitter 1
HM2
H Splitter 2 HM3
H Splitter 3
Steam
Turbine
ASU
O2Storage

Dok. 17/01970-19
be supplying District Heating for the DH network or can be cooled away if in excess. Energy can
freely flow from high temperature areas to lower temperature areas. Thereby the process is
limited by the production of Process Heat, but surplus process heat can be led to the DH sink.
In the following description the DH, LTPH and HTPH will be used for heat streams and Areas.

Dok. 17/01970-19
3. Production units
3.1 Dryer Unit
In the dryer unit, the incoming wood chips, with 50% water content, is dried down to 15% and
grinded. This is necessary to be able to feed the wood into a pressurized gasifier.
Dryer data is found in in the “Polygeneration” report [1], where supplier data for a Metso belt-
drier is chosen.
3.1.1 Assumptions
Wood Chips is supplied at 50% water content and a LHV at: 8.4 MJ/kg
Wood chips are dried down to 15% water content and a LHV at: 15.9 MJ/kg [1]
The process is driven by 2 bar steam, witch in the Sifre model correspond to LTPH (Low Tem-
perature Process Heat). The air and condensate outlet is not implemented in the Sifre simula-
tion.
3.1.2 Mass and energy balance:
Mass Balance:
100 wet wood chips becomes 58.8 dried wood fuel
Energy balance:
100 wet wood chips becomes 111 dried wood fuel
Energy consumption:
Metso bet drier: 3.975 MJ/kg water evaporated [1]
1 MWh wet wood chips = 429 kg wet wood chips. Water to be evaporated is 429*0.412 = 177
kg
Process heat demand: 177*3.975/3600 = 0.195 MWh
3.1.3 Power consumption
In the Polygeneration report [1] a power consumption of 0.01 MWh per 1 MWh wet wood
chips input is used. Same number is used here. NOTE: There are no data on the power con-
sumption for grinding of the dried wood chips. Has to be found when we know the level of
grinding necessary.
The total energy balance of the drying unit will then be:

Dok. 17/01970-19
Figure 3: Energy balance for Dryer Unit
And in Sifre, the fuel input and efficiency will be like shown in figure 4.
Figure 4: Sifre energy balance for Dryer Unit
Sifre input:
Type: Condensation
Production efficiency: B: 3.91
Fuel Consumption: Dried wood: 83%, LTPH: 16.2%, El: 0.83%
ADAPT: Investment cost: 0.36 MDKK/MW [2]
ADAPT: O&M cost: 14,400 DKK/MW/y [6]
ADAPT: Life time: 20 y [G]
Maintenance: 2 Weeks/y [G]
Outage Probability: 2% [G]
Operating Cost:
Ramping up/down: 20%/min [G]
Min production: 15% [G]
3.2 Gasification and methanol production
The gasification and methanol production process includes many different production pro-
cesses. In this Sifre model, the processes are grouped in three Production Units:
Thermal Gasification and Gas Cleaning
Water Shift Reactor
Methanol Synthesis and purification
Each unit includes several processes and the input- and output streams for each unit is calcu-
lated as the net input/output for all the processes in the unit. Figure 5 shows the full process
diagram for the biomass to methanol conversion and how the split-up in production units is
chosen.
Dryer Unit
Wet wood: 100
LT Process Heat: 19,5
Electricity: 1
Dried wood: 111
Dryer Unit
Efficiency: 92.1 %
Wet wood: 83.0%
LT Process Heat: 16.2%
Electricity: 0.83%
Dried wood: 92.1%

Dok. 17/01970-19
Figure 5: Process diagram for biomass to methanol process, Methanol via biomass gasification
[3].
3.3 Thermal Gasification and Gas Cleaning Unit
As shown in Figure 5, the Thermal Gasification and Gas Cleaning Unit includes following pro-
cesses:
Biomass infeeder
Thermal gasification reactor
Tar Reformer
Dust filter
Guard bed (H2S cleaning)
ATR - catalytic autothermal reformer
Rectisol CO2 removal
The Water Shift reactor is excluded in this unit because it doesn’t operate with the same load
variations as the rest of the processes. This is due to the Electrolyser Units production of hy-
drogen. This hydrogen makes it possible to partly or fully bypass the Water Shift Reactor espe-
cially at low power prices.
3.3.1 Description of processes
In the following description, the energy in- and outputs are set based on an Aspen+ simulation
model of the process shown. Figures are related to a biomass feed in to the gasification at 100
MW LHV.
Thermal Gasification and Gas Cleaning
Water Shift Reactor
Methanol Synthesis and purification

Dok. 17/01970-19
3.3.2 Biomass Infeeder
Type: Piston infeeder.
Key figures [1]
P: 440 kW
3.3.3 Thermal gasification reactor
Type: The biomass is gasified in pressurized conditions (at 25 bar) and in presence of oxygen
and steam. Pressurization of the whole gas production process through a pressurized biomass
feeding system introduces significant savings in the subsequent gas compression required to
achieve the optimal synthesis pressures both in terms of capital and operating costs. However,
since combustion and gasification occur in the same reactor, to avoid large amount of inert
nitrogen the direct gasification concepts necessitates a pure oxygen stream. Gasification oc-
curs also in presence of steam which is required as a reforming agent. These latter endother-
mic reactions require energy to be provided by combustion and therefore the consumption of
oxygen increases with the steam input. The optimal ratio between oxygen and steam for a
temperature around 886°C and for a pressure of around 25 bar is around 1:1 [4].
Mass balance of the TG process:
Both Process Steam and oxygen is supplied at 25 bar pressure and around 230°C. In this tem-
perature area LTPH can be utilized.
3.3.3.1 Energy Balance
The energy balance is the one that controls the simulations in Sifre. Therefore every significant
stream must be assigned with energy. O2 does have a LHV at 0 MJ/kg. If this is used it will not
be possible to track the O2 production and consumption. The O2 stream from Electrolyser to
Gasification is vital and to be able to track the O2 production and consumption, it is necessary
to assign the O2 an LHV. It is chosen to set an arbitrary LHV value for O2 to: 0.001 MJ/kg. Low
enough not to corrupt the general energy balance but high enough to be calculated correctly.
In Sifre it has to be assigned as a percentage of energy input. 1 MJ of wood (0.063 kg) will re-
quire 0.0184 kg of O2. As the LHV of O2, is set to 0.001 MJ/kg, 1 MJ of wood will require
0.0000184 MJ of O2 in Sifre.
Now the energy balance for Sifre can be concluded, taking into account 0.33 MW LTPH for
Oxygen preheating (Not with SOEC):
Thermal
Gasification
Dried wood: 22.27
LT Process Steam: 6,57
Oxygen: 6,57
Product gas: 35.40
Figure 6: Mass balance for Thermal Gasification [3]

Dok. 17/01970-19
Figure 7: Energy balance for Thermal Gasification
The estimated composition of the product gas is shown in Figure 8:
Figure 8: Estimated composition of product gas [3]
3.3.4 The Product gas cleaning processes
The mass and energy balances for the individual steps of the product gas cleaning process will
not be outlined fully here. Only the sum-up of the processes will be presented. But as the
technology choices for these steps are important for the energy balance the, the technology is
briefly described and key figures presented.
3.3.5 Tar reformer
The Tar reformer is an isothermal (890°C) catalytic bubbling fluidized bed in which the tar
compounds are reformed in presence of the abundant steam content of the product gas. Data
about such a reformer were obtained from publications by the US NREL (Spath, Aden et al.
2005) [5]. Tar compounds such as Naphthalene, light hydrocarbons such as propane and
ethane as well as ethylene and acetylene are found in the product gas from the gasifier and are
largely reformed into H2 and CO by catalytic cracking. Methane is also partially cracked alt-
Thermal
Gasification
Dried wood: 100
LT Process Heat: 5.45
Oxygen: 0.00184
Product gas: 105

Dok. 17/01970-19
hough about half of that still remains in the gas at the reformer outlet. The heat for reforming
is provided by circulating the bed and the catalyst from a side combustor which is fuelled by a
certain quantity of product gas (about 10% of the total product gas) that is by-passed prior the
reformer and therefore does not contribute to methanol production [3].
Key figures [3]:
Energy efficiency (product gas to syngas): 90%
Heat recovery: 4.6 MW HTPH
Power consumption: 1.74 MW (for air compressor)
3.3.6 Dust filter
At the outlet of the tar reformer, particulate matter, alkali materials, and sulphur compounds
are still present in the gas and must be removed prior to the gas upgrading and synthesis reac-
tions. This is done by hot gas cleaning technologies and in particular by candle filters. The syn
gas has to be cooled prior to the filter
Key figures [3]:
Energy efficiency: 100%
Heat recovery: 9.92 MW HTPH (cooling prior to filter)
3.3.7 Guard bed (H2S cleaning)
The sulphur, assumed here completely in the form of H2S, is removed through a guard bed
based on metal oxides.
3.3.8 ATR - catalytic reformer
In order to finally convert the remaining hydrocarbons that would otherwise remain as inert in
the methanol synthesis process, a catalytic reformer is used. Steam injection is not required as
the steam to carbon ratio is already higher than 1. Oxygen is added for the cracking. The re-
former operates at temperatures higher than the dust filter, so syn gas heating is required.
After the reforming the temperature has to be lowered before the Water Shift Reactor.
Key figures [3]:
Oxygen addition: 1.98 t/h
Oxygen heating (not with SOEC electrolysis): 0.09 MW LTPH
Syn gas heating: 6.62 MW HTPH
Syn gas cooling: 11.56 MW HTPH
3.3.9 Rectisol CO2 removal
The gas is cooled to ambient temperature and most of the CO2 is removed by a Rectisol pro-
cess where methanol is used as a physical absorbent. A final CO2 concentration of 3% in the
dry syngas is obtained as it is the optimal concentration for subsequent methanol synthesis [3].

Dok. 17/01970-19
Key figures [3]:
Syn gas cooling: 10.12 MW LTPH
Heat added to process: 0.2 MW LTPH
Power: 0.76 MW
This cooling is correct if no gas passes the Water Shift Reactor. The extra cooling needed, if
some gas passes the Water Shift Reactor is allocated to the Water Shift Reactor Unit.
Adding all the gas cleaning process steps up results in this energy balance:
Figure 9: Sum-up energy balance for gas cleaning
In total the Thermal Gasification and Gas Cleaning Unit looks like this:
Figure 10: Total energy balance for Thermal Gasification and gas Cleaning.
As Sifre only can handle two output streams from a Production Unit, is has been necessary to
group the heat outputs in HeatMix1 and split them in a subsequent Heat Splitter1.
Sifre input (Thermal Gasification and Gas Cleaning Unit):
Type: Backpressure (Syn gas and HeatMix1)
Cb: 3.129
Production efficiency: B: 4.895
Fuel Consumption: Dried wood: 97.14168%, Oxygen: 0.00232%, El: 2.856%
ADAPT: Investment cost: 4.70 MDKK/MW [2]
ADAPT: O&M cost: 188,000 DKK/MW/y [6]
ADAPT: Life time: 20 y [2]
Maintenance: 2 Weeks/y [G]
Outage Probability: 2% [G]
Operating Cost: 17.9 DKK/MWh [8] (only for gasification unit)(modeled in Sifre as a
tax)
Ramping up/down: 50%/min [6]
Min production: 15% [6][G]
Emissions: Has to be estimated
Product gas
cleaning
Product gas: 105
Power: 2.5 HTPH: 19.48
Product gas: 75.7
LTPH: 9.83
Thermal Gasi-
fication and
Gas Cleaning
Dried wood: 100
Power: 2.94 HTPH: 19.48
Product gas: 75.7
LTPH: 4.71 Oxygen: 0.00239
Oxygen: 0.00055
Dok. 17/01970-19
Sifre input (HeatSplitter1):
Type: Backpressure (HTPH and LTPH)
Cb: 4.136
Production efficiency: B: 4.47
Fuel Consumption: HeatMix1: 100%
All other inputs are 0, as this component isn’t a physical component
3.4 Methanol Synthesis and Purification
The total process of methanol synthesis and purification is shown in Figure 5. All processes
included will be handled as one Production Unit in Sifre. This is a fair simplification as all the
processes energy consumptions and performances are directly related to the inflow of syngas
and its composition. The composition is kept fixed by adjusting the Hydrogen inflow to an op-
timal mixture in all operation points.
3.4.1 Technical description
Methanol synthesis occurs in a fixed bed reactor at 90 bar [3] where steam is produced by
reactor cooling. The reaction products are subsequently cooled leaving a two-phase stream.
The crude methanol is obtained at the bottom of the flash drum and is then sent to distillation
after the pressure has been released to atmospheric values. A stripper is used to evaporate the
remaining gases entrained in the raw methanol. The methanol rich liquid still present a large
quantity of water which is removed in a two column system.
3.4.2 Recirculation and purge gas
A certain amount of hydrogen is recovered from a purge stream after the methanol synthesis
which is mixed to the fresh syngas feed to reach the final synthesis ratio of around 2.05 with a
3% CO2 molar fraction [3]. The syngas is then mixed with the synthesis loop gas obtained at the
top of the flash drum right after the reactor. Here the synthesis loop is assumed to be 3:1 in
volume with respect to the fresh syngas. The purge gases are burnt thus producing additional
heat that can be used for steam production.
3.4.3 Syn gas composition
The methanol synthesis operates with highest efficiency, if the M ratio is 2.05 [3]. Further-
more, the CO2/CO ratio should be low [2]. The M ratio is calculated as shown in Figure 11:
Figure 11: M-ratio calculation by mole fraction
The H2/CO ratio of the raw syngas is: 20.1/15.8 = 1.27
Though the H2 level has to be raised. As described some hydrogen is recirculated from the
purge gas. This recirculation raises the M-ratio 0.13. So the M- ratio before the hydrogen is
added has to be: 1.92.
As the CO2 content is 3% after the CO2 scrubber, the H2 content can be calculated:

Dok. 17/01970-19
1.92 = (x-3)/(97-x+3)
x = 66.8
The mole fraction of hydrogen has to be 66.8% at the inlet to the methanol synthesis and puri-
fication unit. Without Water Shift Reaction the mole fraction of H2 is: 51.2% and the mole frac-
tion of CO is: 45.9%. To raise the level to 66.8% further 45.6 mole of H2 has to be added per
100 mole raw syn gas.
Approximately one Mole of H2 has to be added for each mole CO in the syngas.
This has to be converted to energy terms to be used in Sifre. As CO represents approximately
46% of the syngas after CO2 and H2O removal, approximately 0.46 Mole of H2 has to be added
to 1 Mole of cleaned syngas.
LHV:
CO: 283 kJ/Mole, H2: 244 kJ/Mole
1 Mole of cleaned syn gas has a LHV at: 255 kJ/Mole
0.46 Mole of H2 has a LHV at: 112 KJ
Thus the energy input to Methanol synthesis unit has to be: 69% cleaned syn gas and 31 % H2.
By fixing this ratio in the Production Unit for Methanol Synthesis in Sifre, the simulation forces
to model to produce the needed H2 either by Electrolysis or by Water Shift Reaction.
The power consumption is quit high due to syn gas compression (90 bar) prior to methanol
synthesis.
Added up power consumption: 2.17 MW [3]
There are a lot of processes where heat either has to be added or removed from the stream.
Summed up following heat demand/production is achieved:
Net heat output [3]:
HTPH: 1.48 MW
LTPH: 9.16 MW
DH: 5.68 MW
This gives a net energy balance for the Methanol Synthesis and Purification. The Energy bal-
ance in Figure 12 is based on a set up with no electrolysis hydrogen.
Figure 12: Net energy balance for Methanol Synthesis and Purification (no H2 from Electrolysis).
Methanol
Synthesis and
Purification
Raw Syn Gas: 52.2
H2 from WSH: 23.5 HTPH: 1.48
Methanol: 59.7
LTPH: 9.16 Power: 2.17
DH: 5.68

Dok. 17/01970-19
As Sifre only can handle two output streams from a Production Unit, is has been necessary to
group the heat outputs (HeatMix2 and 3) and split them in two subsequent Heat Splitters (2
and 3).
Sifre input (Methanol Synthesis and Purification Unit):
Type: Backpressure (Methanol and HeatMix2)
Cb: 3.66
Production efficiency: B: 4.696
Fuel Consumption: Syn gas: 67%, H2: 30.18%, El: 2.787%
ADAPT: Investment cost: 1.32 MDKK/MW [2]
ADAPT: O&M cost: 39,600 DKK/MW/y [6]
ADAPT: Life time: 20 y [2]
Maintenance: 2 Weeks/y [G]
Outage Probability: 2% [G]
Operating Cost:
Ramping up/down: 25%/min [G]
Min production: 15% [G]
Sifre input (HeatSplitter2):
Type: Backpressure (HeatMix3 and DH)
Cb: 1.873
Production efficiency: B: 5.522
Fuel Consumption: HeatMix2: 100%
All other inputs are 0, as this component isn’t a physical component
Sifre input (HeatSplitter3):
Type: Backpressure (HTPH and LTPH)
Cb: 0.162
Production efficiency: B: 325.82
Fuel Consumption: HeatMix3: 100%
All other inputs are 0, as this component isn’t a physical component
3.5 Water Shift Reactor Unit
As mentioned under the Methanol Synthesis and Purification description the methanol produc-
tion needs more H2 the available in the raw syn gas. The H2 can come from electrolysis but in
periods with high power prices is could be more feasible to produce the extra H2 from conver-
sion of CO in the raw syn gas to H2. This can be done in a Water Shift Reaction where the fol-
lowing process occurs:
CO + H2O -> H2 + CO2
The H2O is added as high pressure high temperature steam (HTPH). The process is exothermic
so cooling down of the produced gas brings energy to the LTPH area. Based on data from [3]
the energy balance of the water shift reaction becomes:

Dok. 17/01970-19
Figure 13: Energy balance Water Shift Reactor Unit
Sifre input:
Type: Backpressure (Hydrogen and LTPH)
Cb: 2.745
Production efficiency: B: 5.96
Fuel Consumption: SynGas: 82.37%, HTPH: 17.63%
ADAPT: Investment cost: 0.54 MDKK/MW [2]
ADAPT: O&M cost: 26,200 DKK/MW/y [6]
ADAPT: Life time: 20 y [2]
Maintenance: 2 Weeks/y [G]
Outage Probability: 2% [G]
Operating Cost:
Ramping up/down: 25%/min [G]
Min production: 15% [G]
3.6 Electrolysis Unit
The electrolysis unit converts electricity (and process heat) to Hydrogen and Oxygen (and pro-
cess heat).
Two electrolysis technologies will be simulated:
3.6.1 SOEC
A high temperature concept that have high electricity to Hydrogen ratio. The technology is
under development. The energy balance for the SOEC technology is taken from The Technolo-
gy Data Catalogue for Energy Plants-aug. 2016 [7]:
Figure 14: Energy balance for SOEC electrolysis
The temperature of the heat source should be the same as the working tempera-
ture, i.e. 800 – 1000°C [7].
Water Shift
Reactor
Syn gas: 100
HTPH: 21.4
H2 rich gas: 73.3
LTPH: 26.7

Dok. 17/01970-19
3.6.2 Alkaline Electrolysis
This is the market standard today and has been commercial available for almost hundred year.
The energy balance for the SOEC technology is:
Figure 15: Energy balance for Alkaline Electrolysis [7]
Sifre can only handle two output streams. Therefore the Electrolysis is modeled with two Pro-
duction Units. One unit producing heat and EC gas (mixture of H2 and O2) and an EC gas Splitter
converting the EC gas to H2 and O2.
Sifre input (SOEC):
Type: Condensation (EC gas)
Production efficiency: B: 4.41
Fuel Consumption: El (max): 100 %, HTPH (max): 16.67% [7]
ADAPT: Investment cost: 4.4 MDKK/MW [7]
ADAPT: O&M cost: 109,888 DKK/MW/y [7]
ADAPT: Life time: 20 y [7]
Maintenance: 2 Weeks/y [G]
Outage Probability: 2% [G]
Operating Cost:
Ramping up/down: 100%/min [G]
Min production: 15% [G]
Sifre input (Alkaline):
Type: Backpressure (ECGas and DH)
Cb: 3.87 [7]
Production efficiency: B: 6.207 [7]
Fuel Consumption: el: 100%
ADAPT: Investment cost: 7.4 MDKK/MW [7]
ADAPT: O&M cost: 296,000 DKK/MW/y [7]
ADAPT: Life time: 30 y [7]
Maintenance: 2 Weeks/y [G]
Outage Probability: 2% [G]
Operating Cost:
Ramping up/down: 100%/min [G]
Min production: 15% [G]
Dok. 17/01970-19
3.7 EC gas Splitter Unit
The EC gas Splitter is set to Back pressure Plant to fix the relation between H2 and O2.
H2 set to primary production.
Cb is difficult to set. It ought to be infinity as all the energy follows the H2 stream. But to be
able to track the O2 production and consumption, it is necessary to assign the O2 an LHV. It is
chosen to set an arbitrary LHV value for O2 to: 0.001 MJ/kg. Low enough not to corrupt the
general energy balance but high enough to be calculated correctly (I hope)
Mass balance for EC gas:
1000 EC gas = 111 H2 + 889 O2.
LHV for H2 is 120 MJ/kg. LHV for O2 is chosen to: 0,001 MJ/kg.
Energy balance:
1000 EC gas = 999.933 H2 + 0.0667 O2
That results in a cb-value of: 999.933/0.0667 = 14991
The efficiency is set to 99.9933%
Sifre input:
Type: Backpressure (Hydrogen and Oxygen)
Cb: 14991
Production efficiency: B: 3.60024
Fuel Consumption: EC gas: 100%
All other inputs are 0, as this component isn’t a physical component
3.8 GT SC Unit
It is chosen to use a simple cycle GT unit for peak load power production. The advances of the
simple cycle GT is fast regulation (0-100% in 15 min. typically) [8] and low investment cost per
MWe.
The electric efficiency of a large (40-125 MWe) single cycle GT is in the Technology Data Cata-
logue for Energy Plants- UPDATE 2016 [8] estimated to 41% in 2030 on an annual average and
Cb = 1. The exhaust flue gas can be directed to the HTPH area for use in the Methanol process
or in the Steam Turbine if capacity is available. Utilizing the flue gas heat only in the HTPH area
expects to raise the Cb to 1.5. The link from the HTPH to DH and heat sink makes it possible to
ramp up the GT faster than the Steam Turbine and thereby keep the regulation capacity.
Sifre input [8]:
Type: Backpressure (El and HTPH)
Cb: 1.5 [G]
Production efficiency: B: 8.78
Fuel Consumption: Syn Gas: 100%, NGas: 100%
ADAPT: Investment cost: 4.17 MDKK/MW
Dok. 17/01970-19
ADAPT: O&M cost: 138,570 DKK/MW/y
ADAPT: Life time: 25 y
Maintenance: 2.5 Weeks/y
Outage Probability: 2%
Operating Cost: 31.3 DKK/MWh (modeled in Sifre as a tax)
Ramping up/down: 20%/min
Min production: 15%
Emissions: NOx: 10g/GJ, CH4: 1.5 g/GJ, N2O: 1 g/GJ
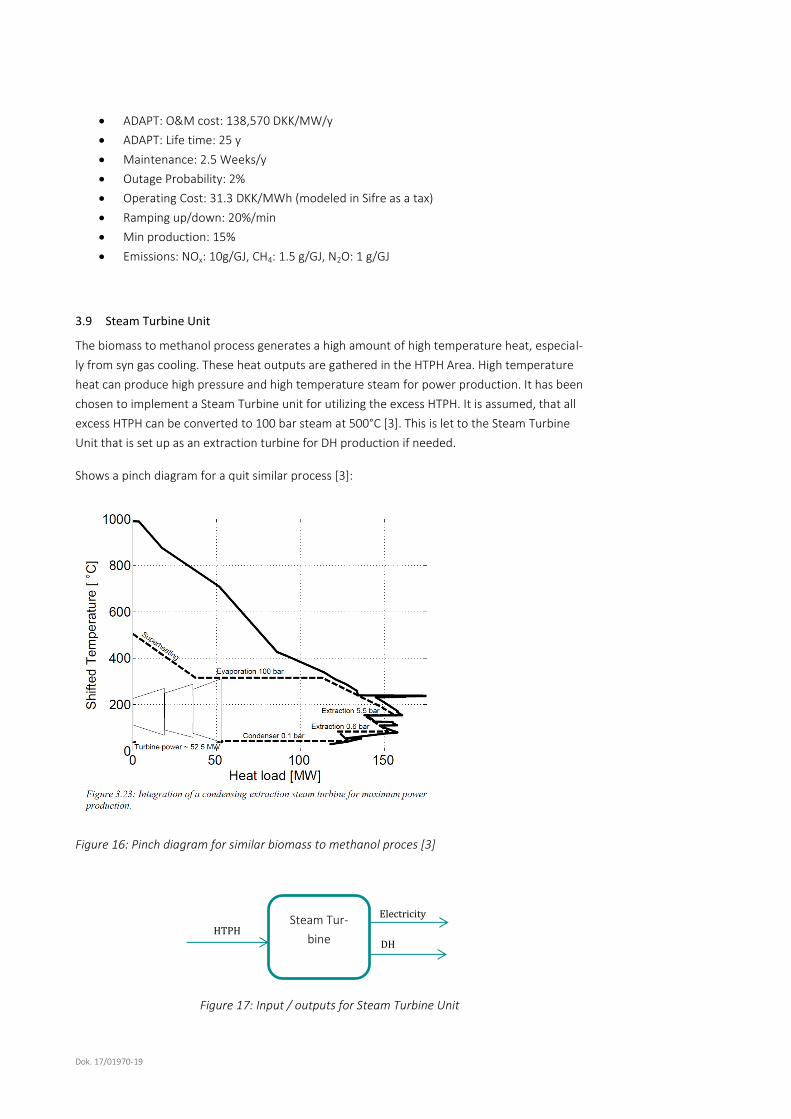
3.9 Steam Turbine Unit
The biomass to methanol process generates a high amount of high temperature heat, especial-
ly from syn gas cooling. These heat outputs are gathered in the HTPH Area. High temperature
heat can produce high pressure and high temperature steam for power production. It has been
chosen to implement a Steam Turbine unit for utilizing the excess HTPH. It is assumed, that all
excess HTPH can be converted to 100 bar steam at 500°C [3]. This is let to the Steam Turbine
Unit that is set up as an extraction turbine for DH production if needed.
Shows a pinch diagram for a quit similar process [3]:
Figure 16: Pinch diagram for similar biomass to methanol proces [3]
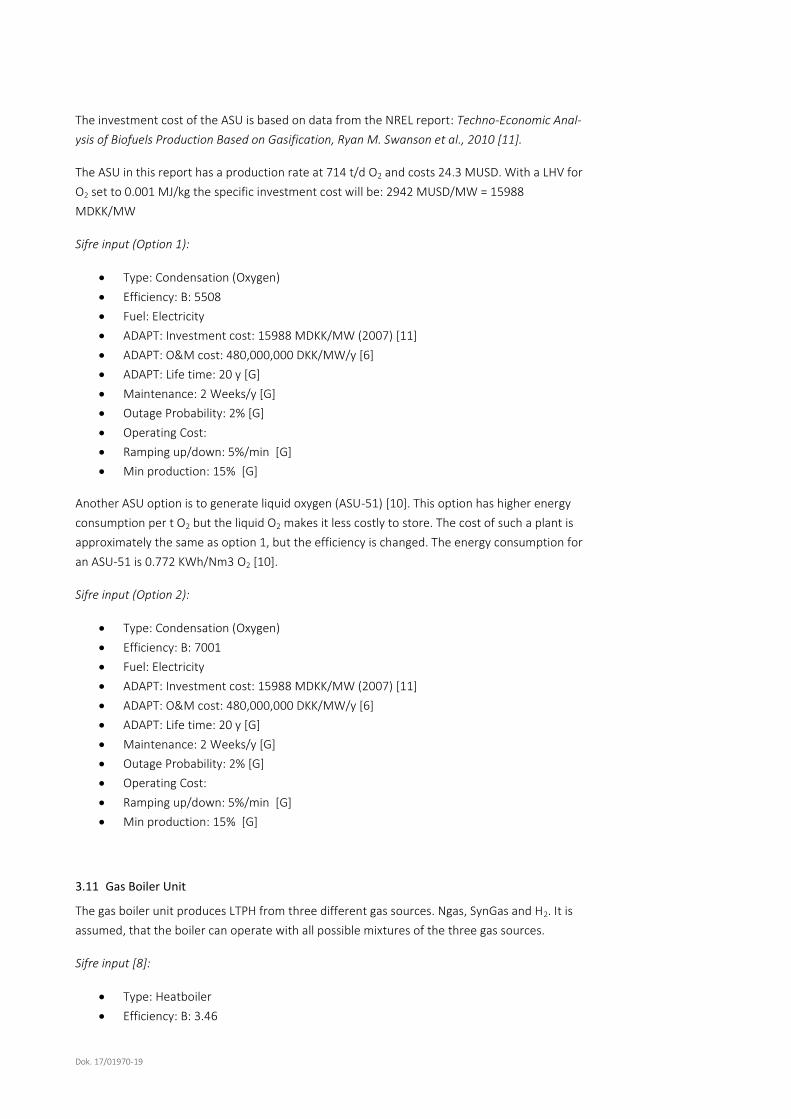
Figure 17: Input / outputs for Steam Turbine Unit
Steam Tur-
bine HTPH
Electricity
DH

Dok. 17/01970-19
The split between electricity and DH is flexible. The Unit is modeled with a max electricity effi-
ciency at 45% and Cv = 0.15 and Cb = 1 [8].
3.9.1 Cost of Steam Turbine
The investment cost of steam generation and steam turbine is taken from the NREL report:
Gasoline from Wood via Integrated Gasification, Synthesis, and Methanol-to- Gasoline Technol-
ogies, Steven D. Phillips et al., 2011. [9]
In this study the total installed cost of steam generation and extraction type steam turbine is
M23.1 USD.
From the mass- and energy balance is the power generation found to 35 MWe at a steam
pressure at 33 bar and a steam temperature at 482°C. In this Sifre model the steam turbine
produce approximately 50 MW and the steam conditions are: 500°C and 50 bar. These sizes
and conditions are in the same range and therefore, is it assumed, that the specific prices of
investment in the US study can be used. The investment cost is in 2007 USD. In 2007 the price
in EUR is M16.9 EUR1. The specific price then becomes: 0.48 MEUR/MWe
Sifre input:
Type: Extraction (El and DH)
Cb: 1, Cv: 0.15 [8]
Production efficiency: B: 8 [8]
Fuel Consumption: HTPH: 100%
ADAPT: Investment cost: 3.59 MDKK/MWe (2007) [9]
ADAPT: O&M cost: 107,700 DKK/MW/y [6]
ADAPT: Life time: 30 y [G]
Maintenance: 2 Weeks/y [G]
Outage Probability: 2% [G]
Operating Cost:
Ramping up/down: 5%/min [G]
Min production: 15% [G]
3.10 Air Separation Unit
The air separation unit is producing high pressure oxygen from air. The only input to the pro-
cess is electricity. Based on the paper: Oxygen Specific Power Consumption Comparison for Air
Separation Units by Yas A. Alsultanny and Nayef N. Al-Shammari [10] the specific power con-
sumption for an ASU type 31 is 0.608 KWh/Nm3 O2. This has to be recalculated to energy
streams, and with an arbitrary LHV for O2 set to 0.001 MJ/kg and a weight of O2 at 1.429
kg/Nm3, the results becomes: 5508 GJ/MWh O2. This is a very low “energy efficiency” but it
does not give any sense to talk about efficiencies as the LHV of O2 is set arbitrary.
1 http://www.x-rates.com/average/?from=EUR&to=USD&amount=1&year=2007: 1.37
USD/EUR
Dok. 17/01970-19
The investment cost of the ASU is based on data from the NREL report: Techno-Economic Anal-
ysis of Biofuels Production Based on Gasification, Ryan M. Swanson et al., 2010 [11].
The ASU in this report has a production rate at 714 t/d O2 and costs 24.3 MUSD. With a LHV for
O2 set to 0.001 MJ/kg the specific investment cost will be: 2942 MUSD/MW = 15988
MDKK/MW
Sifre input (Option 1):
Type: Condensation (Oxygen)
Efficiency: B: 5508
Fuel: Electricity
ADAPT: Investment cost: 15988 MDKK/MW (2007) [11]
ADAPT: O&M cost: 480,000,000 DKK/MW/y [6]
ADAPT: Life time: 20 y [G]
Maintenance: 2 Weeks/y [G]
Outage Probability: 2% [G]
Operating Cost:
Ramping up/down: 5%/min [G]
Min production: 15% [G]
Another ASU option is to generate liquid oxygen (ASU-51) [10]. This option has higher energy
consumption per t O2 but the liquid O2 makes it less costly to store. The cost of such a plant is
approximately the same as option 1, but the efficiency is changed. The energy consumption for
an ASU-51 is 0.772 KWh/Nm3 O2 [10].
Sifre input (Option 2):
Type: Condensation (Oxygen)
Efficiency: B: 7001
Fuel: Electricity
ADAPT: Investment cost: 15988 MDKK/MW (2007) [11]
ADAPT: O&M cost: 480,000,000 DKK/MW/y [6]
ADAPT: Life time: 20 y [G]
Maintenance: 2 Weeks/y [G]
Outage Probability: 2% [G]
Operating Cost:
Ramping up/down: 5%/min [G]
Min production: 15% [G]
3.11 Gas Boiler Unit
The gas boiler unit produces LTPH from three different gas sources. Ngas, SynGas and H2. It is
assumed, that the boiler can operate with all possible mixtures of the three gas sources.
Sifre input [8]:
Type: Heatboiler
Efficiency: B: 3.46

Dok. 17/01970-19
Fuel: Ngas, SynGas, H2
ADAPT: Investment cost: 0.37 MDKK/MW
ADAPT: O&M cost: 14,155 DKK/MW/y
ADAPT: Life time: 25 y
Maintenance: 0.4 Weeks/y
Outage Probability: 1%
Operating Cost: 7.45 DKK/MWh (modeled in Sifre as a tax)
Ramping up/down: 15%/min
Min production: 15%
Dok. 17/01970-19
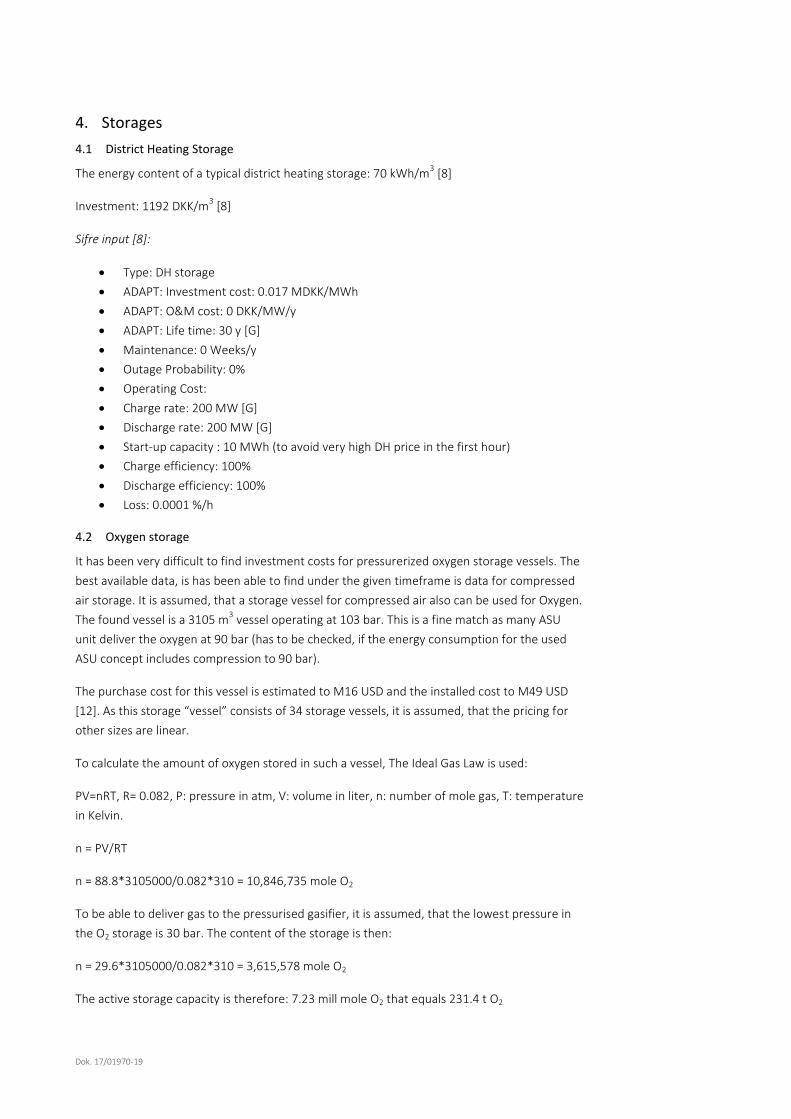
4. Storages
4.1 District Heating Storage
The energy content of a typical district heating storage: 70 kWh/m3 [8]
Investment: 1192 DKK/m3 [8]
Sifre input [8]:
Type: DH storage
ADAPT: Investment cost: 0.017 MDKK/MWh
ADAPT: O&M cost: 0 DKK/MW/y
ADAPT: Life time: 30 y [G]
Maintenance: 0 Weeks/y
Outage Probability: 0%
Operating Cost:
Charge rate: 200 MW [G]
Discharge rate: 200 MW [G]
Start-up capacity : 10 MWh (to avoid very high DH price in the first hour)
Charge efficiency: 100%
Discharge efficiency: 100%
Loss: 0.0001 %/h
4.2 Oxygen storage
It has been very difficult to find investment costs for pressurerized oxygen storage vessels. The
best available data, is has been able to find under the given timeframe is data for compressed
air storage. It is assumed, that a storage vessel for compressed air also can be used for Oxygen.
The found vessel is a 3105 m3 vessel operating at 103 bar. This is a fine match as many ASU
unit deliver the oxygen at 90 bar (has to be checked, if the energy consumption for the used
ASU concept includes compression to 90 bar).
The purchase cost for this vessel is estimated to M16 USD and the installed cost to M49 USD
[12]. As this storage “vessel” consists of 34 storage vessels, it is assumed, that the pricing for
other sizes are linear.
To calculate the amount of oxygen stored in such a vessel, The Ideal Gas Law is used:
PV=nRT, R= 0.082, P: pressure in atm, V: volume in liter, n: number of mole gas, T: temperature
in Kelvin.
n = PV/RT
n = 88.8*3105000/0.082*310 = 10,846,735 mole O2
To be able to deliver gas to the pressurised gasifier, it is assumed, that the lowest pressure in
the O2 storage is 30 bar. The content of the storage is then:
n = 29.6*3105000/0.082*310 = 3,615,578 mole O2
The active storage capacity is therefore: 7.23 mill mole O2 that equals 231.4 t O2

Dok. 17/01970-19
With the arbitrary LHV on O2 set to 0.001 MJ/kg, the “energy” content of the storage is: 0.0643
MWh
The specific cost of the storage then becomes: 274 MDKK/0.0643 MWh = 4261 MDKK/MWh
Sifre input (option 1):
Type: O2 storage
ADAPT: Investment cost: 4261 MDKK/MWh [12]
ADAPT: O&M cost: 0 DKK/MW/y [G]
ADAPT: Life time: 30 y [G]
Maintenance: 0 Weeks/y
Outage Probability: 0%
Operating Cost:
Charge rate: 1 MW
Discharge rate: 1 MW
Charge efficiency: 100%
Discharge efficiency: 100%
Loss: 0 %/h
If liquid oxygen is produced for storage (ASU-51) the storage is a totally different kind. The
storage then should not be able to manage high pressure but instead very low temperature, as
Oxygen is liquid below -183°C. The density is much higher than compressed Oxygen. The stor-
age tank in option 1 can contain 231 t O2 while the same storage volume can contain 3,543 ton
liquid oxygen. It has not been possible to find investment cost for liquid O2 storage in this pro-
jects timeframe, but it is recommended to get such budget data from tank suppliers. For now
the tank cost for compressed oxygen/air storage is used. But as the density is 15 times higher
the cost per MWH is estimated to be 15 times lower. Normally there is a need for heat supply
for evaporation before use in gasification but it is assumed that mixing with the main stream
oxygen from Electrolysis at 850-1000°C will supply enough heat.
Sifre input (option 2):
Type: O2 storage
ADAPT: Investment cost: 284 MDKK/MWh [12]
ADAPT: O&M cost: 0 DKK/MW/y [G]
ADAPT: Life time: 30 y [G]
Maintenance: 0 Weeks/y
Outage Probability: 0%
Operating Cost:
Charge rate: 1 MW
Discharge rate: 1 MW
Charge efficiency: 100%
Discharge efficiency: 100%
Loss: 0 %/h

Dok. 17/01970-19
4.3 SynGas storage
It has been very difficult to find investment costs for pressurerized gas storage vessels. The
best available data, is has been able to find under the given timeframe is data for compressed
air storage. It is assumed, that a storage vessel for compressed air also can be used for com-
pressed SynGas. The found vessel is a 3105 m3 vessel operating at 103 bar. The SynGas is pro-
duced at 25 bar. In the Methanol Synthesis the syngas is compressed up to 90 bar. It is as-
sumed, that the storage at this point in the process and therefore a storage at 90 bar will re-
quire no extra compression of the syngas at inlet to storage. A minor compression at the outlet
of the storage is necessary to 90 bar again, if the storage level is low. The energy consumption
for this compression is not jet included in the simulation. The temperature just before the
Methanol Synthesis is approximately 60°C [3]
The purchase cost for this vessel is estimated to M16 USD and the installed cost to M49 USD
[12]. As this storage “vessel” consists of 34 storage vessels, it is assumed, that the pricing for
other sizes are linear.
To calculate the amount of SynGas stored in such a vessel, The Ideal Gas Law is used:
P*V=n*R*T, R= 0.082, P: pressure in atm, V: volume in liter, n: number of mole gas, T: temper-
ature in Kelvin.
n = P*V/R*T
n = 88.8*3105000/0.082*333 = 10,097,561 mole SynGas
To reduce the power consumption for compression at the outlet it is assumed, that the storage
operates between 90 bar and 30 bar. The content of the storage is then:
n = 29.6*3105000/0.082*333 = 3,365,854 mole SynGas
The active storage capacity is therefore: 6.73 mill mole SynGas that equals 75.7 t SynGas (11.25
g/Mole [3])
With LHV on Syngas just before Methanol Synthesis at MJ/mole, the energy content of the
storage is: 457.7 MWh.
The specific cost of the storage then becomes: 274 MDKK/457.7 MWh = 0.60 MDKK/MWh
Sifre input:
Type: SynGas storage
ADAPT: Investment cost: 0.6 MDKK/MWh [12]
ADAPT: O&M cost: 0 DKK/MW/y [G]
ADAPT: Life time: 30 y [G]
Maintenance: 0 Weeks/y
Outage Probability: 0%
Operating Cost:
Charge rate: 100 MW
Discharge rate: 100 MW
Charge efficiency: 100%
Discharge efficiency: 100%
Loss: 0 %/h
Dok. 17/01970-19
5. Market Prices
5.1 Oxygen Market
An Oxygen Market has been added to receive excess O2. The oxygen market could be just flar-
ing the oxygen or it could be selling it. Price is set to 0 DKK/MWh
5.2 Natural gas
Ngas prices are assumed to be constant over the evaluated period.
Ngas: 59.7 DKK/GJ in 2030 in 2016 prices [14]
5.3 Wood Chips
WoodChip prices are assumed to be constant over the evaluated period.
Wood Chips: 57.5 DKK/GJ in 2030 in 2016 prices [14]
5.4 Bio Methanol
Bio Methanol prices are assumed to be constant over the evaluated period.
EA-analyse has estimated the future production cost of 2. Generation bioethanol to be 230
DKK/GJ (828 DKK/MWh) [14]. This price is assumed to be the upper limit. The lower limit is the
expected gasoline price. ENS estimates this price to be 129.1 DKK/GJ in 2030 and the associat-
ed CO2 cost to be 37 DKK/GJ gasoline. The lower limit is therefore set to: 166.1 DKK/GJ (598
DKK/MWh)
In this study average of the two limits has been chosen as the basic price: 198.1 DKK/GJ (713
DKK/MWh)
5.5 Electricity
The electricity price is assumed to follow the price profile in Energinet's Analyseforudsætninger
2016: AF2016 + 50 DKK/MWh as a tax. The tax is put on the electricity price because the total
plant is a net consumer of electricity.

Dok. 17/01970-19
6. Heat demands
6.1 District heating
Profile: Varmeprofil
Type: non Flexible
Amount: 500,000 MWh/year
6.2 Process Heat
Profile: Varmeprofil
Type: non Flexible
Amount: 100,000 MWh/year
6.3 District Heat Sink
The district heat sink is put in the model to be able to operate the biomass to methanol pro-
cess also when there is very low heat demand. The heat sink could be seen as a “summer cool-
er”. The demand is set very high and the type is set to price cutting to make the District Heat
Sink taking excess heat, when the price comes near zero.
Profile: Varmeprofil
Type: Price cutting (0.1 DKK/MWh)
Amount: 10,000,000 MWh/year
NB: Sifre calculated in general very high costs of the heat streams and in some hours extremely
high prices. It has not been possible in this project to figure out why. Because of that the prices
for the heat streams are fixed in the economy calculation. The high prices in the internal heat
streams do not affect the optimization of the operation or equipment sizes [Thomas Sejr Jen-
sen]

Dok. 17/01970-19
7. Simulation Results without ADAPT optimisation
The described energy system is simulated in Sifre. To show how Sifre optimize the operation
with regard to the electricity price, the operation of all major Production Units and energy
storages are shown for one day. The day chosen is the 4.th of January 2030.
7.1 Energy flows
In Figure 18 the total amount of energy transported between the different Production Units
and Areas is shown.
Figure 18: Simulated process without ADAPT optimization
In the following graphs the Production Units and Energy Storages operation variations is
shown.
Black numbers are Energy flows in MWh over 24 hours 0
Red numbers are prices in DKK/MWh
0,0
191 0,020
411 0 0
411 To Gas Boiler 0 0
215 To HT Proces Heat
0
5313
4594 5017
0,2866 0,3064 4594 395
0 395
0,0
0
548 To DH
4594
From HTPH 610
0
0,0 503 Ngas 9085
470 0 LTPH 411
12000 12000 9085 4090 10390 10390
0 713
207 207 2903 952 2839 713
2111
2903 988 2839
2338,4 1851
565 1851
1593
From EC
0 539 0,0
380 To Water Shift 258
614,3
1094
230 0
From ST 0,0 From CHP
2596 514,2 519,2 From Water Shift 1372
0
514,16 540
To DH
539 247
610
1081710817 Wood-
Chips
Thermal
Gasification
SynGas
Storage
EC EL
SynGas
LT Proces
Heat
Proces-
heat
El
DK1
Gas-Boiler
GT SC
Methanol
Synthesis
District
HeatingDH
storage
DH Sink
Methanol
Market
Methan
ol
O2 EC gasEC gas
splitter
H2
O2
Market
Water shift
Dryer
DH
Demand
NGas
Dried
Wood
Wood-
Chips
Market
NGas
market
HT Proces
Heat
HM1
H Splitter 1
HM2
H Splitter 2 HM3
H Splitter 3
Steam
Turbine
ASU
O2Storage

Dok. 17/01970-19
7.2 Power price profile and heat demand per hour
Figure 19: Electricity price 4th Jan. 2030
Figure 20: Heat Demand 4th of Jan. 2030
7.3 Operation profile for the production units
Figure 21: GT operation 4th of Jan. 2030
Figure 22: Electrolysis operation 4th of Jan
2030
Figure 23: Gasification operation 4th of Jan
2030
Figure 24: Methanol Synthesis operation 4th
of Jan 2030

Dok. 17/01970-19
Figure 25: ST operation 4th of Jan 2030
Figure 26: Gasboiler operation 4th of Jan 2030
Figure 27: WSR operation 4th of Jan 2030
Figure 28: ASU operation 4th of Jan 2030
Dok. 17/01970-19
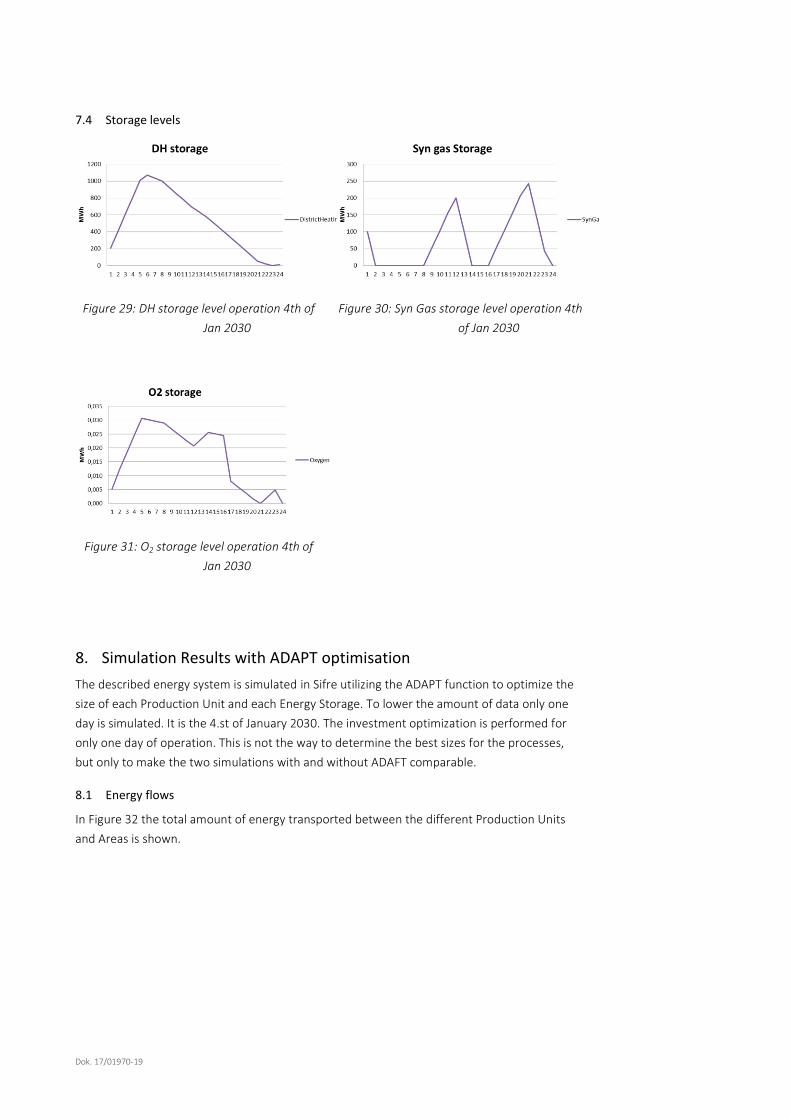
7.4 Storage levels
Figure 29: DH storage level operation 4th of
Jan 2030
Figure 30: Syn Gas storage level operation 4th
of Jan 2030
Figure 31: O2 storage level operation 4th of
Jan 2030
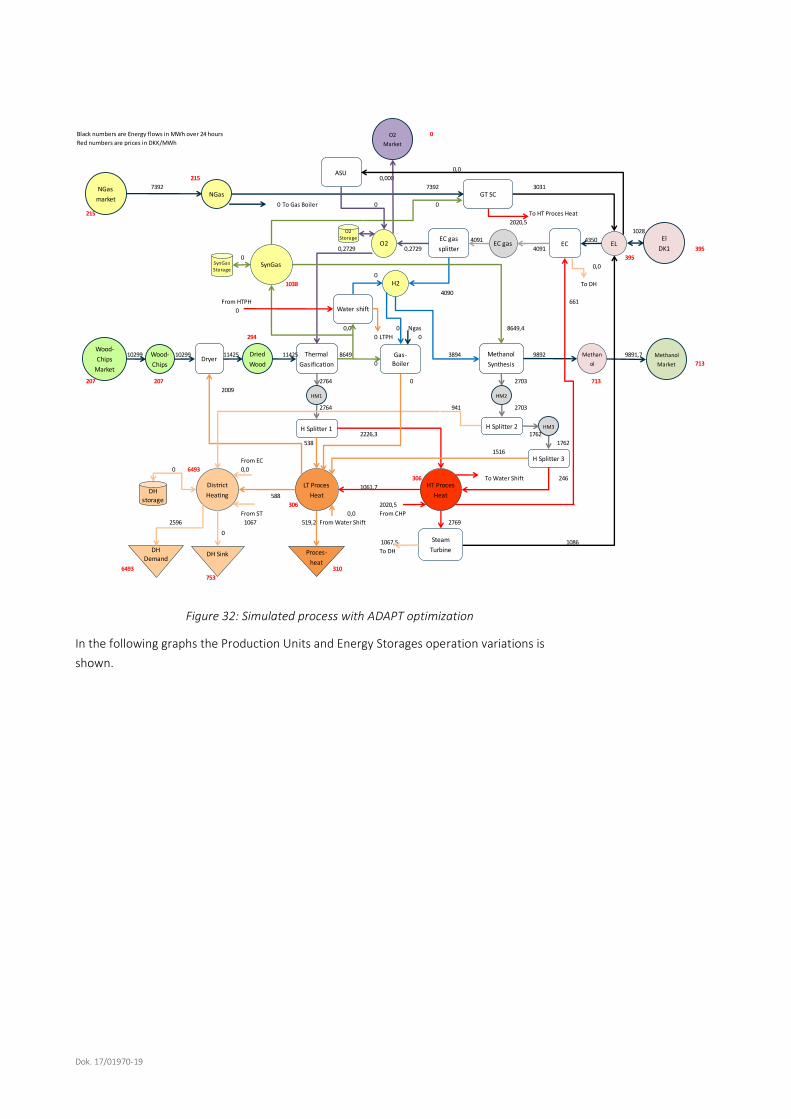
8. Simulation Results with ADAPT optimisation
The described energy system is simulated in Sifre utilizing the ADAPT function to optimize the
size of each Production Unit and each Energy Storage. To lower the amount of data only one
day is simulated. It is the 4.st of January 2030. The investment optimization is performed for
only one day of operation. This is not the way to determine the best sizes for the processes,
but only to make the two simulations with and without ADAFT comparable.
8.1 Energy flows
In Figure 32 the total amount of energy transported between the different Production Units
and Areas is shown.
Dok. 17/01970-19
Figure 32: Simulated process with ADAPT optimization
In the following graphs the Production Units and Energy Storages operation variations is
shown.
Black numbers are Energy flows in MWh over 24 hours 0
Red numbers are prices in DKK/MWh
0,0
215 0,000
7392 7392 3031
0 To Gas Boiler 0 0
215 To HT Proces Heat
2020,5
1028
4091 4350
0,2729 0,2729 4091 395
0 395
0,0
0
1038 To DH
4090
From HTPH 661
0
0,0 0 Ngas 8649,4
294 0 LTPH 0
11425 11425 8649 3894 9892 9891,7
0 713
207 207 2764 0 2703 713
2009
2764 941 2703
2226,3 1762
538 1762
1516
From EC
0 6493 0,0
306 To Water Shift 246
1061,7
588
306 2020,5
From ST 0,0 From CHP
2596 1067 519,2 From Water Shift 2769
0
1067,5 1086
To DH
6493 310
753
1029910299 Wood-
Chips
Thermal
Gasification
SynGas
Storage
EC EL
SynGas
LT Proces
Heat
Proces-
heat
El
DK1
Gas-
Boiler
GT SC
Methanol
Synthesis
District
HeatingDH
storage
DH Sink
Methanol
Market
Methan
ol
O2 EC gasEC gas
splitter
H2
O2
Market
Water shift
Dryer
DH
Demand
NGas
Dried
Wood
Wood-
Chips
Market
NGas
market
HT Proces
Heat
HM1
H Splitter 1
HM2
H Splitter 2 HM3
H Splitter 3
Steam
Turbine
ASU
O2Storage

Dok. 17/01970-19
8.2 Power price profile and heat demand per hour
Figure 33: Electricity price 4th Jan. 2030
Figure 34: Heat Demand 4th of Jan. 2030
8.3 Operation profile for the production units
Figure 35: GT operation 4th of Jan. 2030
Figure 36: Electrolysis operation 4th of Jan
2030
Figure 37: Gasification operation 4th of Jan
2030
Figure 38: Methanol Synthesis operation 4th
of Jan 2030

Dok. 17/01970-19
Figure 39: ST operation 4th of Jan 2030
Figure 40: Gasboiler operation 4th of Jan
2030
Figure 41: WSR operation 4th of Jan 2030
Figure 42: ASU operation 4th of Jan 2030

Dok. 17/01970-19
8.4 Storage levels
Figure 43: DH storage level operation 4th of
Jan 2030
Figure 44: Syn Gas storage level operation 4th
of Jan 2030
Figure 45: O2 storage level operation 4th of
Jan 2030

Dok. 17/01970-19
9. Sensitivity analysis
9.1 Baseline model
The baseline model for the Energy Plant Type III simulation is briefly described and the energy
flows and standard output data are presented.
9.1.1 General issues
The baseline model includes all processes described in this document. For the ASU, option 2 is
chosen with production of liquid oxygen and therefore also option 2 for oxygen storage. For
the Electrolysis Unit the SOEC technology is used in the baseline scenario. All production units
and energy storages are variables in the model and the ADAPT module in Sifre optimize the
production based on the economy of operation. This means the some production units can be
optimized out of the system, because they don’t generate enough value to pay for the invest-
ment cost. Sifre + ADAPT choses the most profitable sizes for all production units and for all
energy storages. The production is limited in two places. The dry wood inlet is limited to 500
MW and the Gas Turbine electricity production is limited to 200 MW.
The plant operation is optimized for one year (2030) using time steps at one hour.
9.1.2 Prices
The prices, described under the “Market Prices” section, is used in the baseline model. Sifre
calculate internally prices for the heat outputs from the plant. The prices are sometimes very
high compared to the fuel used. In calculation the total plant economy it has therefore been
chosen to operate with fixed prices for sale of District Heating, LT Process Heat and for the
District Heating Sink in all scenarios. This is done to be able to compare the plant operational
economy in different sensitivity scenarios. These prices are set to:
District Heating sale: 85 DKK/GJ
LT Process Heat sale: 120 DKK/GJ
District Heating Sink: 0 DKK/GJ
9.1.3 CAPEX
The total plant CAPEX is calculated by adding up the CAPEX of all the processes and adding a
30% contingency for plant cost not coupled directly to one production unit and for general
major uncertainties in the CAPEX data input. This is a very rough estimate like the CAPEX cost
for the processes, and it is strongly recommended to set up a more thorough study of all as-
pects of the plant cost.
NB: The ADAPT/SIfre simulation sets the size of the Water Shift Reactor Unit to 106 MW output
even though the unit has zero operation hours. It has not been possible to find the reason to
this in this project.
9.1.4 OPEX
The expenses and income related to product flows are calculated based on the Sifre energy
balance and the market prices set.
Fixed O&M are calculated from the size of the individual process steps and their specific fixed
O&M costs. Specific O&M cost are for some production units found in the Technology Data
Catalogues [6,7,8]. But for the main production units in the biomass-to-methanol process no

Dok. 17/01970-19
data are available in the Technology Data Catalogues. But for a Biomass-to-Methanol black box
process a 3% of CAPEX per year level is set in [8]. This value is used for all processes not listed
specific in the Technology Data Catalogues.
Variable O&M are found for the process steps available in the Technology Data Catalogues and
put in the Sifre model as taxes. For process steps not found in the Technology Data Catalogues
no variable O&M has been set. It is recommended to look more into this area.
9.1.5 Key economic figures
CAPEX expense per year is used to calculate the yearly revenue for the plant. The CAPEX ex-
pense is calculated by adding up the yearly payment based on lifetime and an interest at 4%
for each process step and adding the payment for the contingency over 30 years.
Yearly Revenue for the plant is calculated as the operational revenue (based on the energy
flows) subtracted the fixed and variable O&M and the yearly CAPEX expense. No taxes, credits,
grants or other posts are in-calculated at this level.
The IRR is estimated by finding the internal rate of return for a cash flow, where the invest-
ment (CAPEX) is split up over two years and the Yearly Revenue (without the CAPEX expense
per year) is put in as yearly income streams for 20 years after the two years of investment. This
is a very rough model, not taking reinvestment of equipment with shorter lifetime than 20
years or scrap values of equipment with longer lifetime into consideration. But as most equip-
ment groups have a lifetime at 20 years is assumed to be a fair simplification at this level.
Methanol Shadow Price is defined as the methanol selling price at which the Yearly Revenue is
zero.

Dok. 17/01970-19
9.1.6 Baseline model Energy Flows
Figure 46: Energy flows for baseline model in 20130
9.1.7 Baseline model Key Figures
Black numbers are Energy flows in GWh for 2030 0
Red numbers are prices in DKK/MWh
0,0
0,000
1121 1098 450
23 To Gas Boiler 0 0
215 215 To HT Proces Heat
300
947
1419 1457
0,0946 0,0946 1419 470
0 470
0,0
0
704 To DH
1418
From HTPH 280
0
0,0 67 Ngas 2999,5
256 0 LTPH 23
3962 3962 3000 1350 3430 3430
0 713
207 207 959 94 937 713
697,1
959 326 937
772,04 611
187 611
526
From EC
0,0 3465 0,0
256 To Water Shift 85
82,223
91
216 300,16
From ST 0,0 From CHP
502 142,7 From Water Shift 795
58 100,4
142,7 336
To DH
3465 450 331
35713571 Wood-
Chips
Thermal
Gasification
SynGas Storage
EC EL
SynGas
LT Proces
Heat
Proces-
heat
El
DK1
Gas-
Boiler
GT SC
Methanol
Synthesis
District
HeatingDH
storage
DH Sink
Methanol
Market
Methan
ol
O2 EC gasEC gas
splitter
H2
O2
Market
Water shift
Dryer
DH
Demand
NGas
Dried
Wood
Wood-
Chips
Market
NGas
market
HT Proces
Heat
HM1
H Splitter 1
HM2
H Splitter 2 HM3
H Splitter 3
Steam
Turbine
ASU
O2Storage
Dok. 17/01970-19
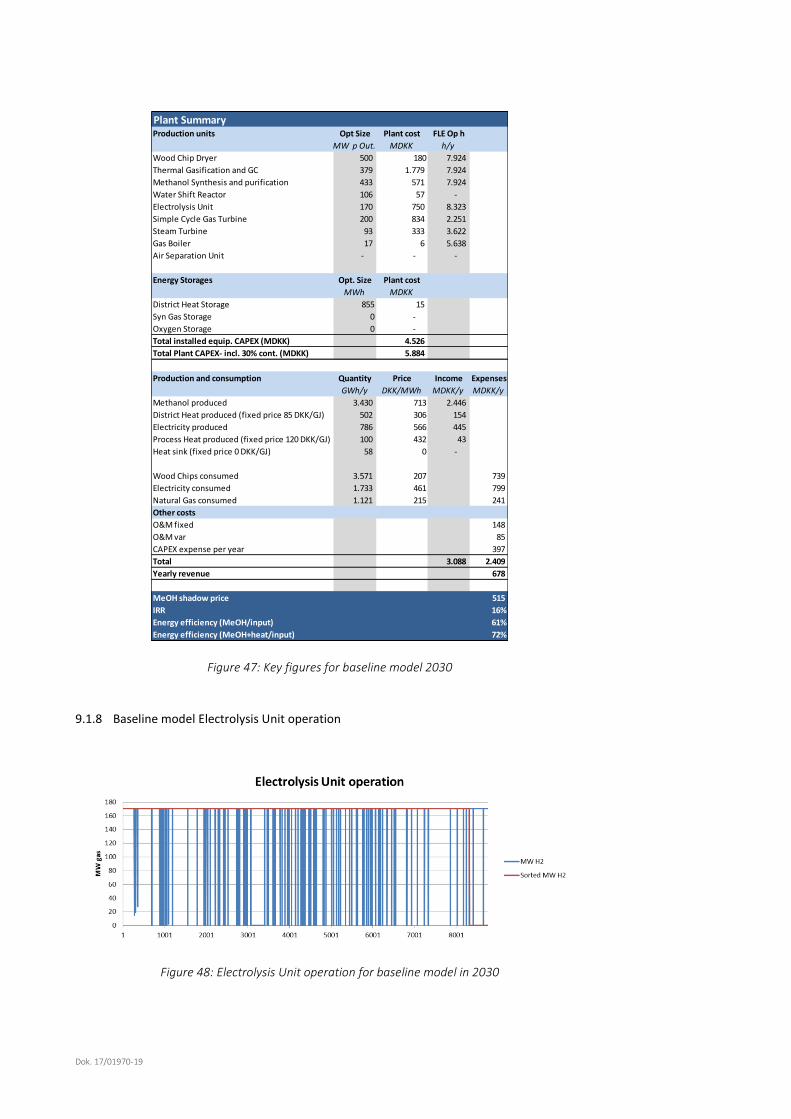
Figure 47: Key figures for baseline model 2030
9.1.8 Baseline model Electrolysis Unit operation
Figure 48: Electrolysis Unit operation for baseline model in 2030
Plant SummaryProduction units Opt Size Plant cost FLE Op h
MW p Out. MDKK h/y
Wood Chip Dryer 500 180 7.924
Thermal Gasification and GC 379 1.779 7.924
Methanol Synthesis and purification 433 571 7.924
Water Shift Reactor 106 57 -
Electrolysis Unit 170 750 8.323
Simple Cycle Gas Turbine 200 834 2.251
Steam Turbine 93 333 3.622
Gas Boiler 17 6 5.638
Air Separation Unit - - -
Energy Storages Opt. Size Plant cost
MWh MDKK
District Heat Storage 855 15
Syn Gas Storage 0 -
Oxygen Storage 0 -
Total installed equip. CAPEX (MDKK) 4.526
Total Plant CAPEX- incl. 30% cont. (MDKK) 5.884
Production and consumption Quantity Price Income Expenses
GWh/y DKK/MWh MDKK/y MDKK/y
Methanol produced 3.430 713 2.446
District Heat produced (fixed price 85 DKK/GJ) 502 306 154
Electricity produced 786 566 445
Process Heat produced (fixed price 120 DKK/GJ) 100 432 43
Heat sink (fixed price 0 DKK/GJ) 58 0 -
Wood Chips consumed 3.571 207 739
Electricity consumed 1.733 461 799
Natural Gas consumed 1.121 215 241
Other costs
O&M fixed 148
O&M var 85
CAPEX expense per year 397
Total 3.088 2.409
Yearly revenue 678
MeOH shadow price 515
IRR 16%
Energy efficiency (MeOH/input) 61%
Energy efficiency (MeOH+heat/input) 72%

Dok. 17/01970-19
9.2 Internal Rate of Return (IRR) at different MeOH prices
In this simulation the plant is optimized at different methanol price levels. The upper level is
the estimated future production cost of 2. Generation bioethanol at 828 DKK/MWh [14] and
the lower level is the estimated cost of gasoline plus CO2 at 598 DKK/MWh.
High MeOH price:
Figure 49: Energy flows for a high MeOH price scenario
Black numbers are Energy flows in GWh for 2030 0
Red numbers are prices in DKK/MWh
0,0
0,000
1116 1092 448
23 To Gas Boiler 0 0
215 215 To HT Proces Heat
299
961
1435 1473
0,0957 0,0957 1435 470
0 470
0,0
0
841 To DH
1435
From HTPH 285
0
0,0 68 Ngas 3034,2
255 0 LTPH 23
4008 4008 3034 1366 3470 3470
0 828
207 207 970 95 948 828
705,1
970 330 948
780,96 618
189 618
532
From EC
0,0 4600 0,0
252 To Water Shift 86
66,96
77
168 298,59
From ST 0,0 From CHP
502 152,9 From Water Shift 814
58 100,4
152,9 343
To DH
4600 10584 216
36133613 Wood-
Chips
Thermal
Gasification
SynGas Storage
EC EL
SynGas
LT Proces
Heat
Proces-
heat
El
DK1
Gas-
Boiler
GT SC
Methanol
Synthesis
District
HeatingDH
storage
DH Sink
Methanol
Market
Methan
ol
O2 EC gasEC gas
splitter
H2
O2
Market
Water shift
Dryer
DH
Demand
NGas
Dried
Wood
Wood-
Chips
Market
NGas
market
HT Proces
Heat
HM1
H Splitter 1
HM2
H Splitter 2 HM3
H Splitter 3
Steam
Turbine
ASU
O2Storage

Dok. 17/01970-19
Figure 50: Key figures for high MeOH price scenario
Figure 51: Electrolysis Unit operation at high MeOH price
Low MeOH price:
Plant SummaryProduction units Opt Size Plant cost FLE Op h
MW p Out. MDKK h/y
Wood Chip Dryer 500 180 8.015
Thermal Gasification and GC 379 1.779 8.015
Methanol Synthesis and purification 433 571 8.015
Water Shift Reactor - - -
Electrolysis Unit 170 750 8.419
Simple Cycle Gas Turbine 200 834 2.239
Steam Turbine 91 326 3.780
Gas Boiler 18 7 5.269
Air Separation Unit - - -
Energy Storages Opt. Size Plant cost
MWh MDKK
District Heat Storage 847 14
Syn Gas Storage 0 0
Oxygen Storage 0 -
Total installed equip. CAPEX (MDKK) 4.462
Total Plant CAPEX- incl. 30% cont. (MDKK) 5.801
Production and consumption Quantity Price Income Expenses
GWh/y DKK/MWh MDKK/y MDKK/y
Methanol produced 3.470 828 2.873
District Heat produced (fixed price 85 DKK/GJ) 502 306 154
Electricity produced 791 564 446
Process Heat produced (fixed price 120 DKK/GJ) 100 432 43
Heat sink (fixed price 0 DKK/GJ) 58 0 -
Wood Chips consumed 3.613 207 748
Electricity consumed 1.752 466 817
Natural Gas consumed 1.116 215 240
Other costs
O&M fixed 145
O&M var 86
CAPEX expense per year 391
Total 3.516 2.427
Yearly revenue 1.089
MeOH shadow price 514
IRR 23%
Energy efficiency (MeOH/input) 61%
Energy efficiency (MeOH+heat/input) 72%

Dok. 17/01970-19
Figure 52: Energy flows for a low MeOH price scenario
Black numbers are Energy flows in GWh for 2030 0
Red numbers are prices in DKK/MWh
0,0
0,000
1863 1435 589
427 To Gas Boiler 0 0
215 215 To HT Proces Heat
392
-739
0 0
0,0000 0 0 470
0 470
0,0
0
216 To DH
0
From HTPH 0
0
0,0 0 Ngas 0
0 0 LTPH 427
0 0 0 0 0 0
0 598
203 203 0 445 0 598
0
0 0 0
0,0845 0
0 0
0
From EC
0,0 295 0,0
638 To Water Shift 0
7,677
352
300 392,38
From ST 0,0 From CHP
502 150 From Water Shift 385
0 100,4
150,0 151
To DH
295 440 327
00 Wood-
Chips
Thermal
Gasification
SynGas Storage
EC EL
SynGas
LT Proces
Heat
Proces-
heat
El
DK1
Gas-
Boiler
GT SC
Methanol
Synthesis
District
HeatingDH
storage
DH Sink
Methanol
Market
Methan
ol
O2 EC gasEC gas
splitter
H2
O2
Market
Water shift
Dryer
DH
Demand
NGas
Dried
Wood
Wood-
Chips
Market
NGas
market
HT Proces
Heat
HM1
H Splitter 1
HM2
H Splitter 2 HM3
H Splitter 3
Steam
Turbine
ASU
O2Storage
Dok. 17/01970-19
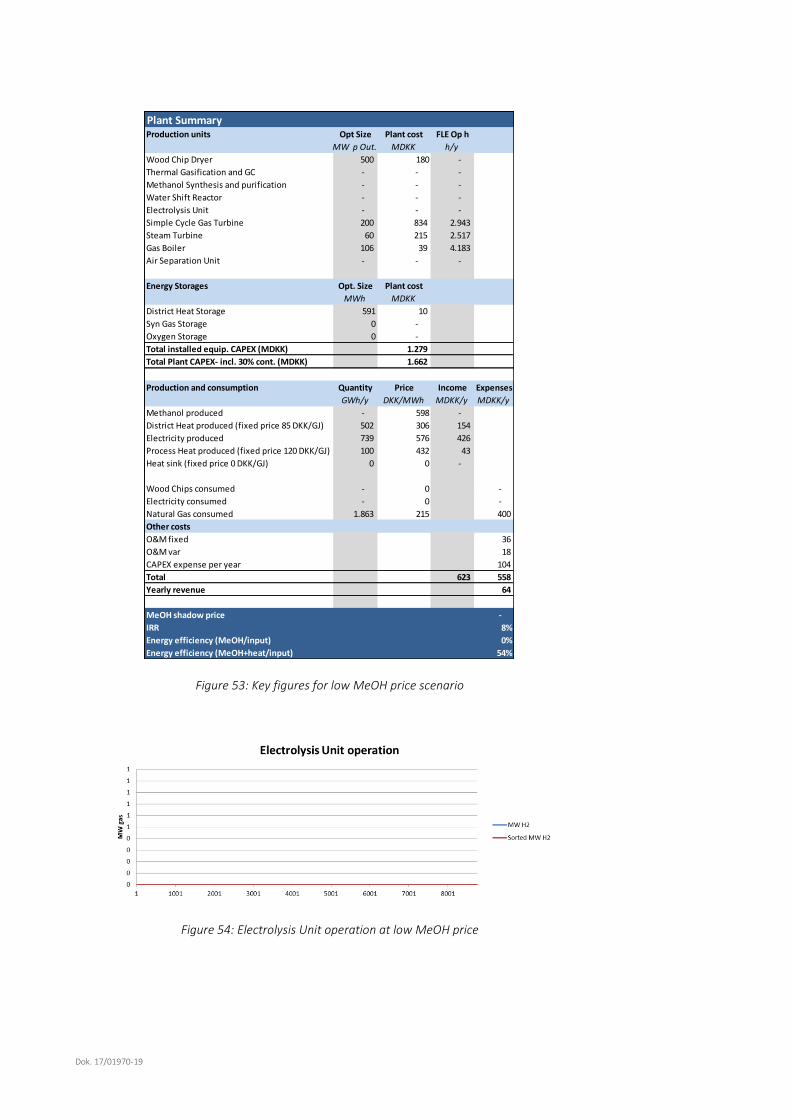
Figure 53: Key figures for low MeOH price scenario
Figure 54: Electrolysis Unit operation at low MeOH price
Plant SummaryProduction units Opt Size Plant cost FLE Op h
MW p Out. MDKK h/y
Wood Chip Dryer 500 180 -
Thermal Gasification and GC - - -
Methanol Synthesis and purification - - -
Water Shift Reactor - - -
Electrolysis Unit - - -
Simple Cycle Gas Turbine 200 834 2.943
Steam Turbine 60 215 2.517
Gas Boiler 106 39 4.183
Air Separation Unit - - -
Energy Storages Opt. Size Plant cost
MWh MDKK
District Heat Storage 591 10
Syn Gas Storage 0 -
Oxygen Storage 0 -
Total installed equip. CAPEX (MDKK) 1.279
Total Plant CAPEX- incl. 30% cont. (MDKK) 1.662
Production and consumption Quantity Price Income Expenses
GWh/y DKK/MWh MDKK/y MDKK/y
Methanol produced - 598 -
District Heat produced (fixed price 85 DKK/GJ) 502 306 154
Electricity produced 739 576 426
Process Heat produced (fixed price 120 DKK/GJ) 100 432 43
Heat sink (fixed price 0 DKK/GJ) 0 0 -
Wood Chips consumed - 0 -
Electricity consumed - 0 -
Natural Gas consumed 1.863 215 400
Other costs
O&M fixed 36
O&M var 18
CAPEX expense per year 104
Total 623 558
Yearly revenue 64
MeOH shadow price -
IRR 8%
Energy efficiency (MeOH/input) 0%
Energy efficiency (MeOH+heat/input) 54%

Dok. 17/01970-19
Figure 55: Variations in MeOH selling price. Green dots are baseline scenario
9.3 Variation in electricity price and profile
9.3.1 More oscillating electricity prices
In the 2030 electricity price estimate over a year, the oscillations in the price are not that high.
With a much higher penetration of wind and PV, and a reluctance to invest in back-up capaci-
ties the oscillations could increase further. In the first sensitivity simulation, the average cost of
the electricity in the 2030 forecast is found and for each hour the price distance to the average
price is doubled. For negative prices, the price is set to 0 DKK/MWh as Sifre can’t operate with
negative prices. Figure 56 shows how the new price forecast looks like for the fourth of January
2030.
Figure 56: New electricity price forecast for 4.th Jan. 2030

Dok. 17/01970-19
9.3.1.1 Results
Figure 57: Energy flows for a 2x oscillating electricity price scenario
Black numbers are Energy flows in GWh for 2030 0
Red numbers are prices in DKK/MWh
0,0
0,000
1451 1441 591
10 To Gas Boiler 0 0
215 215 To HT Proces Heat
394
760
1391 1442
0,0930 0,0928 1391 483
0 483
0,0
1,6895
695 To DH
1390
From HTPH 261
0,493
2,3 65 Ngas 2946,7
258 1 LTPH 10
3895 3895 2949 1327 3370 3370
0 713
207 207 942 79 921 713
685,3
943 320 921
759,1 600
184 600
517
From EC
0,0 3251 0,0
255 To Water Shift 84
123,52
117
290 393,79
From ST 0,6 From CHP
502 136,8 From Water Shift 852
73 100,4
136,8 363
To DH
3251 450 377
35113511 Wood-
Chips
Thermal
Gasification
SynGas
Storage
EC EL
SynGas
LT Proces
Heat
Proces-
heat
El
DK1
Gas-Boiler
GT SC
Methanol
Synthesis
District
HeatingDH
storage
DH Sink
Methanol
Market
Methan
ol
O2 EC gasEC gas
splitter
H2
O2
Market
Water shift
Dryer
DH Demand
NGas
Dried
Wood
Wood-
Chips
Market
NGas
market
HT Proces
Heat
HM1
H Splitter 1
HM2
H Splitter 2 HM3
H Splitter 3
Steam
Turbine
ASU
O2Storage

Dok. 17/01970-19
Figure 58: Key figures for 2x oscillating electricity price scenario
Figure 59: Electrolysis Unit operation at 2x oscillating electricity price scenario
Plant SummaryProduction units Opt Size Plant cost FLE Op h
MW p Out. MDKK h/y
Wood Chip Dryer 500 180 7.790
Thermal Gasification and GC 379 1.779 7.790
Methanol Synthesis and purification 433 571 7.784
Water Shift Reactor 106 57 16
Electrolysis Unit 170 750 8.158
Simple Cycle Gas Turbine 200 834 2.953
Steam Turbine 93 333 3.908
Gas Boiler 11 4 7.166
Air Separation Unit - - -
Energy Storages Opt. Size Plant cost
MWh MDKK
District Heat Storage 1062 18
Syn Gas Storage 0 -
Oxygen Storage 0 -
Total installed equip. CAPEX (MDKK) 4.527
Total Plant CAPEX- incl. 30% cont. (MDKK) 5.885
Production and consumption Quantity Price Income Expenses
GWh/y DKK/MWh MDKK/y MDKK/y
Methanol produced 3.370 713 2.403
District Heat produced (fixed price 85 DKK/GJ) 502 306 154
Electricity produced 953 642 612
Process Heat produced (fixed price 120 DKK/GJ) 100 432 43
Heat sink (fixed price 0 DKK/GJ) 73 0 -
Wood Chips consumed 3.511 207 727
Electricity consumed 1.713 455 779
Natural Gas consumed 1.451 215 312
Other costs
O&M fixed 148
O&M var 88
CAPEX expense per year 397
Total 3.212 2.451
Yearly revenue 761
MeOH shadow price 487
IRR 17%
Energy efficiency (MeOH/input) 59%
Energy efficiency (MeOH+heat/input) 69%

Dok. 17/01970-19
Figure 60: Yearly revenue and MeOH shadow prices at double oscillating power prices
9.3.2 Lower electricity prices
In the second sensitivity calculation the electricity price in the baseline scenario is lowered by
100 DKK/MWh and 200 DKK/MWh. These simulations shows scenarios where the electricity
price still only reflects the marginal costs of power production and the VE penetration is very
high. Again the lower limit for the price is 0 due to Sifre.
9.3.2.1 Low electricity price
Figure 61: Energy flows for a baseline electricity price minus 100 DKK/MWh scenario
Black numbers are Energy flows in GWh for 2030 0
Red numbers are prices in DKK/MWh
0,0
0,000
161 161 66
0 To Gas Boiler 0 0
215 215 To HT Proces Heat
44
1520
1419 1475
0,0947 0,0947 1419 372
0 372
0,0
0
978 To DH
1419
From HTPH 264
0
0,0 3 Ngas 3000,4
266 0 LTPH 0
3963 3963 3000 1351 3431 3431
0 713
207 207 959 3 938 713
697,2
959 326 938
772,28 611
187 611
526
From EC
0,0 5663 0,0
213 To Water Shift 85
254,95
173
890 44,024
From ST 0,0 From CHP
502 55,16 From Water Shift 383
52 100,4
55,2 164
To DH
5663 442 578
35733573 Wood-
Chips
Thermal
Gasification
SynGas
Storage
EC EL
SynGas
LT Proces
Heat
Proces-
heat
El
DK1
Gas-Boiler
GT SC
Methanol
Synthesis
District
HeatingDH
storage
DH Sink
Methanol
Market
Methan
ol
O2 EC gasEC gas
splitter
H2
O2
Market
Water shift
Dryer
DH Demand
NGas
Dried
Wood
Wood-
Chips
Market
NGas
market
HT Proces
Heat
HM1
H Splitter 1
HM2
H Splitter 2 HM3
H Splitter 3
Steam
Turbine
ASU
O2Storage

Dok. 17/01970-19
Figure 62: Key figures for a baseline electricity price minus 100 DKK/MWh scenario
Figure 63: Electrolysis Unit operation at a baseline electricity price minus 100 DKK/MWh scenar-
io
Plant SummaryProduction units Opt Size Plant cost FLE Op h
MW p Out. MDKK h/y
Wood Chip Dryer 500 180 7.926
Thermal Gasification and GC 379 1.779 7.926
Methanol Synthesis and purification 433 571 7.926
Water Shift Reactor - - -
Electrolysis Unit 170 750 8.325
Simple Cycle Gas Turbine 200 834 330
Steam Turbine 32 115 5.112
Gas Boiler 0 0 8.371
Air Separation Unit - - -
Energy Storages Opt. Size Plant cost
MWh MDKK
District Heat Storage 1074 18
Syn Gas Storage 0 0
Oxygen Storage 0 -
Total installed equip. CAPEX (MDKK) 4.249
Total Plant CAPEX- incl. 30% cont. (MDKK) 5.523
Production and consumption Quantity Price Income Expenses
GWh/y DKK/MWh MDKK/y MDKK/y
Methanol produced 3.431 713 2.447
District Heat produced (fixed price 85 DKK/GJ) 502 306 154
Electricity produced 230 465 107
Process Heat produced (fixed price 120 DKK/GJ) 100 432 43
Heat sink (fixed price 0 DKK/GJ) 52 0 -
Wood Chips consumed 3.573 207 740
Electricity consumed 1.751 361 632
Natural Gas consumed 161 215 35
Other costs
O&M fixed 138
O&M var 73
CAPEX expense per year 375
Total 2.751 1.993
Yearly revenue 758
MeOH shadow price 492
IRR 18%
Energy efficiency (MeOH/input) 65%
Energy efficiency (MeOH+heat/input) 77%

Dok. 17/01970-19
9.3.2.2 Very low electricity price
Figure 64: Energy flows for a baseline electricity price minus 200 DKK/MWh scenario
Black numbers are Energy flows in GWh for 2030 0
Red numbers are prices in DKK/MWh
0,0
0,000
71 71 29
0 To Gas Boiler 0 0
215 215 To HT Proces Heat
19
1579
1423 1486
0,0949 0,0949 1423 275
0 275
0,0
0
958 To DH
1423
From HTPH 257
0
0,0 0 Ngas 3008,6
257 0 LTPH 0
3974 3974 3009 1355 3441 3441
0 713
207 207 962 0 940 713
699,1
962 327 940
774,37 613
187 613
527
From EC
0,0 5578 0,0
166 To Water Shift 85
262,02
177
166 19,408
From ST 0,0 From CHP
502 44,96 From Water Shift 361
47 100,4
45,0 156
To DH
5578 442 187
35823582 Wood-
Chips
Thermal
Gasification
SynGas Storage
EC EL
SynGas
LT Proces
Heat
Proces-
heat
El
DK1
Gas-
Boiler
GT SC
Methanol
Synthesis
District
HeatingDH
storage
DH Sink
Methanol
Market
Methan
ol
O2 EC gasEC gas
splitter
H2
O2
Market
Water shift
Dryer
DH
Demand
NGas
Dried
Wood
Wood-
Chips
Market
NGas
market
HT Proces
Heat
HM1
H Splitter 1
HM2
H Splitter 2 HM3
H Splitter 3
Steam
Turbine
ASU
O2Storage

Dok. 17/01970-19
Figure 65: Key figures for a baseline electricity price minus 200 DKK/MWh scenario
Figure 66: Electrolysis Unit operation at a baseline electricity price minus 200 DKK/MWh scenar-
io
Plant SummaryProduction units Opt Size Plant cost FLE Op h
MW p Out. MDKK h/y
Wood Chip Dryer 500 180 7.948
Thermal Gasification and GC 379 1.779 7.948
Methanol Synthesis and purification 433 571 7.948
Water Shift Reactor - - -
Electrolysis Unit 170 750 8.348
Simple Cycle Gas Turbine 200 834 146
Steam Turbine 32 115 4.876
Gas Boiler - - -
Air Separation Unit - - -
Energy Storages Opt. Size Plant cost
MWh MDKK
District Heat Storage 1043 18
Syn Gas Storage 0 -
Oxygen Storage 0 -
Total installed equip. CAPEX (MDKK) 4.247
Total Plant CAPEX- incl. 30% cont. (MDKK) 5.521
Production and consumption Quantity Price Income Expenses
GWh/y DKK/MWh MDKK/y MDKK/y
Methanol produced 3.441 713 2.453
District Heat produced (fixed price 85 DKK/GJ) 502 306 154
Electricity produced 185 348 64
Process Heat produced (fixed price 120 DKK/GJ) 100 432 43
Heat sink (fixed price 0 DKK/GJ) 47 0 -
Wood Chips consumed 3.582 207 741
Electricity consumed 1.763 267 471
Natural Gas consumed 71 215 15
Other costs
O&M fixed 138
O&M var 72
CAPEX expense per year 375
Total 2.714 1.813
Yearly revenue 901
MeOH shadow price 451
IRR 21%
Energy efficiency (MeOH/input) 66%
Energy efficiency (MeOH+heat/input) 77%

Dok. 17/01970-19
Figure 67: Changes in MeOH and IRR at lower electricity price
9.4 Higher biomass cost
In this scenario the biomass cost is higher than expected due to high demand and limited pro-
duction. The biomass cost is raised by 20% and 40% compared to the baseline scenario.
9.4.1 Biomass price + 20% scenario
Figure 68: Energy flows for a high biomass price scenario
Black numbers are Energy flows in GWh for 2030 0
Red numbers are prices in DKK/MWh
0,0
0,000
1119 1097 450
22 To Gas Boiler 0 0
215 215 To HT Proces Heat
300
941
1413 1451
0,0942 0,0942 1413 470
0 470
0,0
0
703 To DH
1412
From HTPH 279
0
0,0 67 Ngas 2986,8
292 0 LTPH 22
3945 3945 2987 1345 3416 3416
0 713
248 248 955 93 933 713
694,1
955 325 933
768,77 608
186 608
524
From EC
0,0 3040 0,0
255 To Water Shift 85
81,282
89
246 299,92
From ST 0,0 From CHP
502 143,9 From Water Shift 793
56 100,4
143,9 335
To DH
3040 450 398
35563556 Wood-
Chips
Thermal
Gasification
SynGas Storage
EC EL
SynGas
LT Proces
Heat
Proces-
heat
El
DK1
Gas-
Boiler
GT SC
Methanol
Synthesis
District
HeatingDH
storage
DH Sink
Methanol
Market
Methan
ol
O2 EC gasEC gas
splitter
H2
O2
Market
Water shift
Dryer
DH
Demand
NGas
Dried
Wood
Wood-
Chips
Market
NGas
market
HT Proces
Heat
HM1
H Splitter 1
HM2
H Splitter 2 HM3
H Splitter 3
Steam
Turbine
ASU
O2
Storage

Dok. 17/01970-19
Figure 69: Key figures for high Biomass price scenario
Figure 70: Electrolysis Unit operation at high biomass price
Plant SummaryProduction units Opt Size Plant cost FLE Op h
MW p Out. MDKK h/y
Wood Chip Dryer 500 180 7.890
Thermal Gasification and GC 379 1.779 7.890
Methanol Synthesis and purification 433 571 7.890
Water Shift Reactor 106 57 -
Electrolysis Unit 170 750 8.288
Simple Cycle Gas Turbine 200 834 2.249
Steam Turbine 93 333 3.612
Gas Boiler 17 6 5.547
Air Separation Unit - - -
Energy Storages Opt. Size Plant cost
MWh MDKK
District Heat Storage 855 15
Syn Gas Storage 0 -
Oxygen Storage 0 -
Total installed equip. CAPEX (MDKK) 4.526
Total Plant CAPEX- incl. 30% cont. (MDKK) 5.884
Production and consumption Quantity Price Income Expenses
GWh/y DKK/MWh MDKK/y MDKK/y
Methanol produced 3.416 713 2.435
District Heat produced (fixed price 85 DKK/GJ) 502 306 154
Electricity produced 785 565 444
Process Heat produced (fixed price 120 DKK/GJ) 100 432 43
Heat sink (fixed price 0 DKK/GJ) 56 0 -
Wood Chips consumed 3.556 248 883
Electricity consumed 1.726 460 793
Natural Gas consumed 1.119 215 240
Other costs
O&M fixed 148
O&M var 85
CAPEX expense per year 397
Total 3.076 2.547
Yearly revenue 530
MeOH shadow price 558
IRR 14%
Energy efficiency (MeOH/input) 61%
Energy efficiency (MeOH+heat/input) 72%

Dok. 17/01970-19
9.4.2 Biomass price + 40% scenario
Figure 71: Energy flows for a very high biomass price scenario
Black numbers are Energy flows in GWh for 2030 0
Red numbers are prices in DKK/MWh
0,0
0,000
1863 1435 588
428 To Gas Boiler 0 0
215 215 To HT Proces Heat
392
-739
0 0
0,0000 0 0 470
0 470
0,0
0
215 To DH
0
From HTPH 0
0
0,0 0 Ngas 0
0 0 LTPH 428
0 0 0 0 0 0
0 713
285 285 0 445 0 713
0
0 0 0
0,0845 0
0 0
0
From EC
0,0 295 0,0
642 To Water Shift 0
6,7452
352
300 392,27
From ST 0,0 From CHP
502 150,3 From Water Shift 386
0 100,4
150,3 151
To DH
295 450 326
00 Wood-
Chips
Thermal
Gasification
SynGas
Storage
EC EL
SynGas
LT Proces
Heat
Proces-
heat
El
DK1
Gas-Boiler
GT SC
Methanol
Synthesis
District
HeatingDH
storage
DH Sink
Methanol
Market
Methan
ol
O2 EC gasEC gas
splitter
H2
O2
Market
Water shift
Dryer
DH Demand
NGas
Dried
Wood
Wood-
Chips
Market
NGas
market
HT Proces
Heat
HM1
H Splitter 1
HM2
H Splitter 2 HM3
H Splitter 3
Steam
Turbine
ASU
O2Storage

Dok. 17/01970-19
Figure 72: Key figures for very high Biomass price scenario
Figure 73: Electrolysis Unit operation at very high biomass price
Plant SummaryProduction units Opt Size Plant cost FLE Op h
MW p Out. MDKK h/y
Wood Chip Dryer 500 180 -
Thermal Gasification and GC - - -
Methanol Synthesis and purification - - -
Water Shift Reactor - - -
Electrolysis Unit - - -
Simple Cycle Gas Turbine 200 834 2.942
Steam Turbine 60 215 2.523
Gas Boiler 106 39 4.189
Air Separation Unit - - -
Energy Storages Opt. Size Plant cost
MWh MDKK
District Heat Storage 591 10
Syn Gas Storage 0 -
Oxygen Storage 0 -
Total installed equip. CAPEX (MDKK) 1.279
Total Plant CAPEX- incl. 30% cont. (MDKK) 1.662
Production and consumption Quantity Price Income Expenses
GWh/y DKK/MWh MDKK/y MDKK/y
Methanol produced - 713 -
District Heat produced (fixed price 85 DKK/GJ) 502 306 154
Electricity produced 739 576 426
Process Heat produced (fixed price 120 DKK/GJ) 100 432 43
Heat sink (fixed price 0 DKK/GJ) 0 0 -
Wood Chips consumed - 0 -
Electricity consumed - 0 -
Natural Gas consumed 1.863 215 400
Other costs
O&M fixed 36
O&M var 18
CAPEX expense per year 104
Total 623 558
Yearly revenue 65
MeOH shadow price -
IRR 8%
Energy efficiency (MeOH/input) 0%
Energy efficiency (MeOH+heat/input) 54%
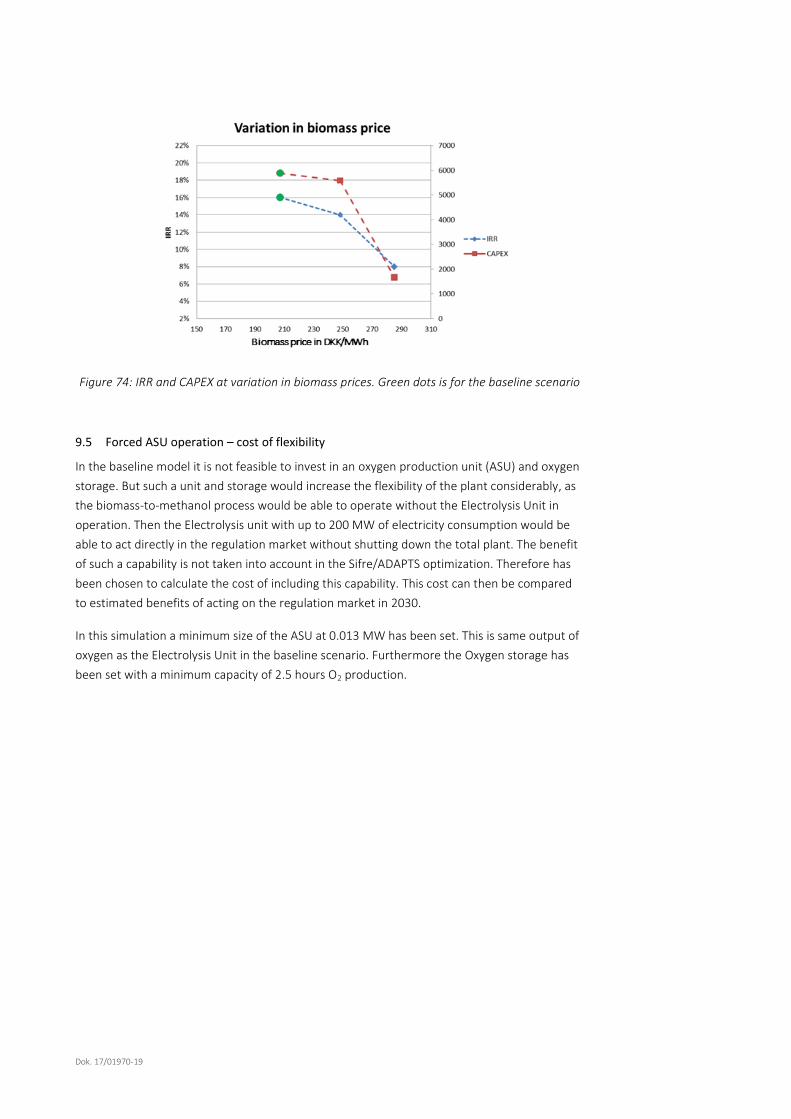
Dok. 17/01970-19
Figure 74: IRR and CAPEX at variation in biomass prices. Green dots is for the baseline scenario
9.5 Forced ASU operation – cost of flexibility
In the baseline model it is not feasible to invest in an oxygen production unit (ASU) and oxygen
storage. But such a unit and storage would increase the flexibility of the plant considerably, as
the biomass-to-methanol process would be able to operate without the Electrolysis Unit in
operation. Then the Electrolysis unit with up to 200 MW of electricity consumption would be
able to act directly in the regulation market without shutting down the total plant. The benefit
of such a capability is not taken into account in the Sifre/ADAPTS optimization. Therefore has
been chosen to calculate the cost of including this capability. This cost can then be compared
to estimated benefits of acting on the regulation market in 2030.
In this simulation a minimum size of the ASU at 0.013 MW has been set. This is same output of
oxygen as the Electrolysis Unit in the baseline scenario. Furthermore the Oxygen storage has
been set with a minimum capacity of 2.5 hours O2 production.

Dok. 17/01970-19
Figure 75: Energy flows for a forced ASU investment scenario
Black numbers are Energy flows in GWh for 2030 0
Red numbers are prices in DKK/MWh
14,4
0,000
1141 1100 451
41 To Gas Boiler 0,0074 0
215 215 To HT Proces Heat
301
940
1397 1434
0,1006 0,0932 1397 470
0 470
0,0
23,743
493 To DH
1397
From HTPH 278
6,93
32,4 0 Ngas 3156,5
371 9 LTPH 41
4212 4212 3189 1421 3610 3610
0 713
207 207 1019 42 986 713
741,1
1019 343 986
820,77 643
198 643
553
From EC
0,0 127 0,0
247 To Water Shift 90
101,71
63
230 300,66
From ST 8,6 From CHP
502 147,6 From Water Shift 825
52 100,4
147,6 349
To DH
127 30 246
37973797 Wood-
Chips
Thermal
Gasification
SynGas
Storage
EC EL
SynGas
LT Proces
Heat
Proces-
heat
El
DK1
Gas-Boiler
GT SC
Methanol
Synthesis
District
HeatingDH
storage
DH Sink
Methanol
Market
Methan
ol
O2 EC gasEC gas
splitter
H2
O2
Market
Water shift
Dryer
DH Demand
NGas
Dried
Wood
Wood-
Chips
Market
NGas
market
HT Proces
Heat
HM1
H Splitter 1
HM2
H Splitter 2 HM3
H Splitter 3
Steam
Turbine
ASU
O2Storage

Dok. 17/01970-19
Figure 76: Key figures a forced ASU investment scenario
Figure 77: Electrolysis Unit operation at a forced ASU investment price
Plant SummaryProduction units Opt Size Plant cost FLE Op h
MW p Out. MDKK h/y
Wood Chip Dryer 500 180 8.424
Thermal Gasification and GC 379 1.779 8.424
Methanol Synthesis and purification 433 571 8.338
Water Shift Reactor 106 57 225
Electrolysis Unit 170 750 8.199
Simple Cycle Gas Turbine 200 834 2.255
Steam Turbine 93 333 3.761
Gas Boiler 17 6 2.543
Air Separation Unit 0,0114 182 647
Energy Storages Opt. Size Plant cost
MWh MDKK
District Heat Storage 855 15
Syn Gas Storage 0 0
Oxygen Storage 0,030 9
Total installed equip. CAPEX (MDKK) 4.717
Total Plant CAPEX- incl. 30% cont. (MDKK) 6.132
Production and consumption Quantity Price Income Expenses
GWh/y DKK/MWh MDKK/y MDKK/y
Methanol produced 3.610 713 2.574
District Heat produced (fixed price 85 DKK/GJ) 502 306 154
Electricity produced 800 564 451
Process Heat produced (fixed price 120 DKK/GJ) 100 432 43
Heat sink (fixed price 0 DKK/GJ) 52 0 -
Wood Chips consumed 3.797 207 786
Electricity consumed 1.741 458 797
Natural Gas consumed 1.141 215 245
Other costs
O&M fixed 153
O&M var 90
CAPEX expense per year 414
Total 3.222 2.485
Yearly revenue 737
MeOH shadow price 509
IRR 17%
Energy efficiency (MeOH/input) 61%
Energy efficiency (MeOH+heat/input) 72%

Dok. 17/01970-19
Figure 78: Key Figures at forced ASU investment
The results for the forced ASU investment scenario are quite surprising. In no single modeled
scenario Sifre/ADAPT find a solution with ASU investment feasible. But in this scenario, where
the ASU investment is forced into the baseline model, the feasibility of the plant actually in-
creases despite of the higher investment cost.
It looks like the investment in extra flexibility is feasible without even taking the possible in-
come from acting on the regulation market into account.
9.6 Green Syn Fuel composition on syngas versus baseline composition
The H2/CO ratio of the raw syngas in the base case is: 20.1/15.8 = 1.27 [3]. This data is based
on a 25 bar gasification process. I the Green Sun Fuel report [2] the gasification pressure is
chosen to 10 bar. In this report, the H2/CO ratio is lower (28.6/26.7 = 1.07) [2]. The lower ratio
demands more H2 supply, and thereby more electrolysis operation. This is interesting because
it will change the H2/O2 consumption and result in an O2 surplus instead of a H2 surplus. An O2
surplus will open the operation of the electrolysis for more flexible operation due to electricity
market price changes.
A new H2/CO ratio from the gasifier demands a new SynGas/H2 ration to the Methanol Syn-
thesis.
The M-ratio still needs to be 2.05 at the Methanol Synthesis inlet
As described some hydrogen is recirculated from the purge gas. This recirculation raises the M-
ratio 0.13. So the M- ratio before the hydrogen is added has to be: 1.92.
As the CO2 content is 3% after the CO2 scrubber, the H2 content can be calculated:
1.92 = (x-3)/(97-x+3)
x = 66.8

Dok. 17/01970-19
The mole fraction of hydrogen has to be 66.8% at the inlet to the methanol synthesis and puri-
fication unit. To raise the level to 66.8% further 58.7 mole of H2 has to be added per 100 mole
raw syn gas.
This has to be converted to energy terms to be used in Sifre.
As CO represents approximately 46% of the syngas after CO2 and H2O removal, approximately
0.46 Mole of H2 has to be added to 1 Mole of cleaned syngas.
LHV:
CO: 283 kJ/Mole, H2: 244 kJ/Mole
1 Mole of cleaned syn gas has a LHV at: 255 kJ/Mole
0.587 Mole of H2 has a LHV at: 143 KJ
Thus the energy input to Methanol synthesis unit has to be: 64% cleaned syn gas and 36% H2.
By fixing this ratio in the Production Unit for Methanol Synthesis in Sifre, the simulation forces
to model to produce the needed H2 either by Electrolysis or by Water Shift Reaction.
Black numbers are Energy flows in GWh for 2030 0
Red numbers are prices in DKK/MWh
0,0
0,016
1096 1070 439
27 To Gas Boiler 0 0
215 215 To HT Proces Heat
292
1303
1726 1772
0,0993 0,1151 1726 470
0 470
0,0
25,39
462 To DH
1726
From HTPH 343
7,411
34,6 0 Ngas 3113,2
337 9 LTPH 27
4158 4158 3148 1751 3836 3836
0 713
207 207 1006 28 1048 713
731,6
1006 365 1048
810,22 683
196 683
588
From EC
0,0 105 0,0
251 To Water Shift 95
72,601
61
159 292,39
From ST 9,2 From CHP
502 137,6 From Water Shift 775
62 100,4
137,6 328
To DH
105 0 214
37483748 Wood-
Chips
Thermal
Gasification
SynGas Storage
EC EL
SynGas
LT Proces
Heat
Proces-
heat
El
DK1
Gas-
Boiler
GT SC
Methanol
Synthesis
District
HeatingDH
storage
DH Sink
Methanol
Market
Methan
ol
O2 EC gasEC gas
splitter
H2
O2
Market
Water shift
Dryer
DH
Demand
NGas
Dried
Wood
Wood-
Chips
Market
NGas
market
HT Proces
Heat
HM1
H Splitter 1
HM2
H Splitter 2 HM3
H Splitter 3
Steam
Turbine
ASU
O2Storage

Dok. 17/01970-19
Figure 79: Energy flows for a GSF SynGas composition scenario
Figure 80: Key figures for GSF SynGas composition scenario
Figure 81: Electrolysis Unit operation at GSF SynGas composition
Plant SummaryProduction units Opt Size Plant cost FLE Op h
MW p Out. MDKK h/y
Wood Chip Dryer 500 180 8.316
Thermal Gasification and GC 379 1.779 8.316
Methanol Synthesis and purification 466 616 8.224
Water Shift Reactor 120 65 211
Electrolysis Unit 213 937 8.105
Simple Cycle Gas Turbine 200 417 2.193
Steam Turbine 91 326 3.614
Gas Boiler 12 4 2.351
Air Separation Unit - - -
Energy Storages Opt. Size Plant cost
MWh MDKK
District Heat Storage 843 14
Syn Gas Storage 0 0
Oxygen Storage 0 -
Total installed equip. CAPEX (MDKK) 4.339
Total Plant CAPEX- incl. 30% cont. (MDKK) 5.640
Production and consumption Quantity Price Income Expenses
GWh/y DKK/MWh MDKK/y MDKK/y
Methanol produced 3.836 713 2.735
District Heat produced (fixed price 85 DKK/GJ) 502 306 154
Electricity produced 767 565 433
Process Heat produced (fixed price 120 DKK/GJ) 100 432 43
Heat sink (fixed price 0 DKK/GJ) 62 0 -
Wood Chips consumed 3.748 207 776
Electricity consumed 2.069 457 946
Natural Gas consumed 1.096 215 236
Other costs
O&M fixed 154
O&M var 88
CAPEX expense per year 384
Total 3.366 2.584
Yearly revenue 782
MeOH shadow price 509
IRR 18%
Energy efficiency (MeOH/input) 62%
Energy efficiency (MeOH+heat/input) 72%
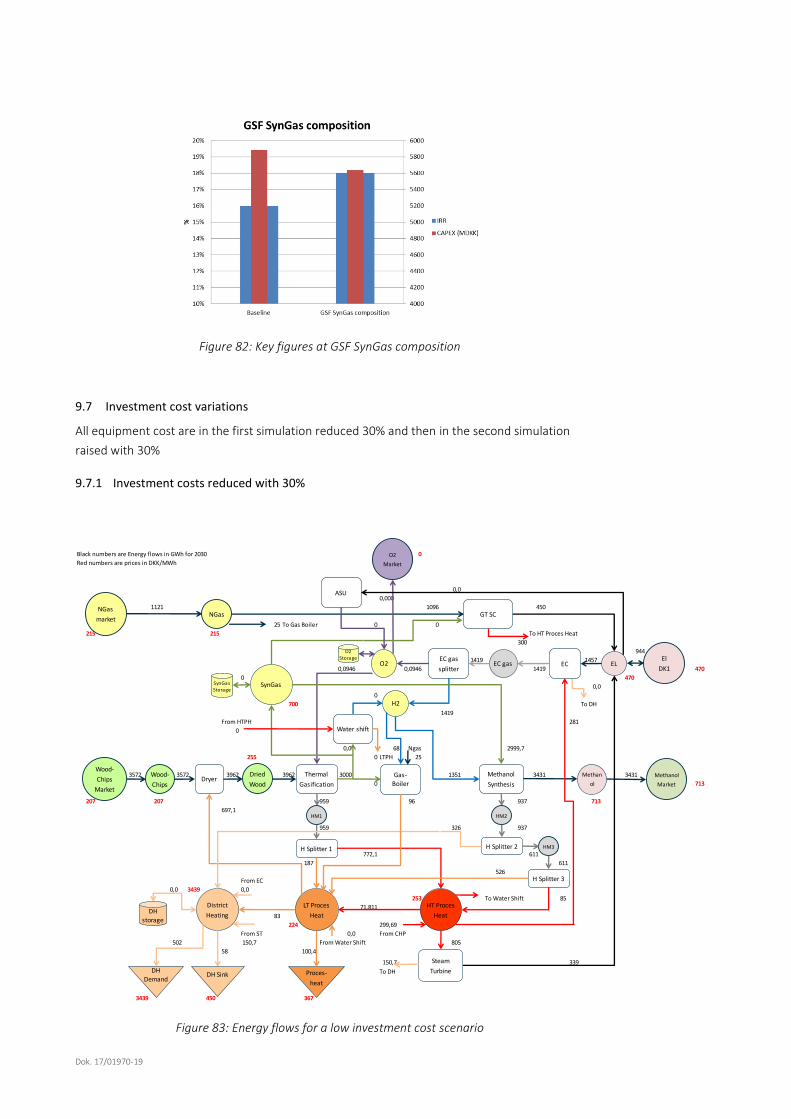
Dok. 17/01970-19
Figure 82: Key figures at GSF SynGas composition
9.7 Investment cost variations
All equipment cost are in the first simulation reduced 30% and then in the second simulation
raised with 30%
9.7.1 Investment costs reduced with 30%
Figure 83: Energy flows for a low investment cost scenario
Black numbers are Energy flows in GWh for 2030 0
Red numbers are prices in DKK/MWh
0,0
0,000
1121 1096 450
25 To Gas Boiler 0 0
215 215 To HT Proces Heat
300
944
1419 1457
0,0946 0,0946 1419 470
0 470
0,0
0
700 To DH
1419
From HTPH 281
0
0,0 68 Ngas 2999,7
255 0 LTPH 25
3962 3962 3000 1351 3431 3431
0 713
207 207 959 96 937 713
697,1
959 326 937
772,1 611
187 611
526
From EC
0,0 3439 0,0
253 To Water Shift 85
71,811
83
224 299,69
From ST 0,0 From CHP
502 150,7 From Water Shift 805
58 100,4
150,7 339
To DH
3439 450 367
35723572 Wood-
Chips
Thermal
Gasification
SynGas
Storage
EC EL
SynGas
LT Proces
Heat
Proces-
heat
El
DK1
Gas-Boiler
GT SC
Methanol
Synthesis
District
HeatingDH
storage
DH Sink
Methanol
Market
Methan
ol
O2 EC gasEC gas
splitter
H2
O2
Market
Water shift
Dryer
DH Demand
NGas
Dried
Wood
Wood-
Chips
Market
NGas
market
HT Proces
Heat
HM1
H Splitter 1
HM2
H Splitter 2 HM3
H Splitter 3
Steam
Turbine
ASU
O2Storage

Dok. 17/01970-19
Figure 84: Key figures for low investment cost scenario
Figure 85: Electrolysis Unit operation at low investment cost
Plant SummaryProduction units Opt Size Plant cost FLE Op h
MW p Out. MDKK h/y
Wood Chip Dryer 500 126 7.924
Thermal Gasification and GC 379 1.245 7.924
Methanol Synthesis and purification 433 218 7.924
Water Shift Reactor 106 40 -
Electrolysis Unit 170 525 8.324
Simple Cycle Gas Turbine 200 584 2.248
Steam Turbine 93 233 3.657
Gas Boiler 18 5 5.373
Air Separation Unit - - -
Energy Storages Opt. Size Plant cost
MWh MDKK
District Heat Storage 999 12
Syn Gas Storage 0 -
Oxygen Storage 0,000 -
Total installed equip. CAPEX (MDKK) 2.988
Total Plant CAPEX- incl. 30% cont. (MDKK) 3.885
Production and consumption Quantity Price Income Expenses
GWh/y DKK/MWh MDKK/y MDKK/y
Methanol produced 3.431 713 2.446
District Heat produced (fixed price 85 DKK/GJ) 502 306 154
Electricity produced 789 564 445
Process Heat produced (fixed price 120 DKK/GJ) 100 432 43
Heat sink (fixed price 0 DKK/GJ) 58 0 -
Wood Chips consumed 3.572 207 739
Electricity consumed 1.733 461 799
Natural Gas consumed 1.121 215 241
Other costs
O&M fixed 148
O&M var 85
CAPEX expense per year 262
Total 3.088 2.273
Yearly revenue 814
MeOH shadow price 476
IRR 24%
Energy efficiency (MeOH/input) 61%
Energy efficiency (MeOH+heat/input) 72%
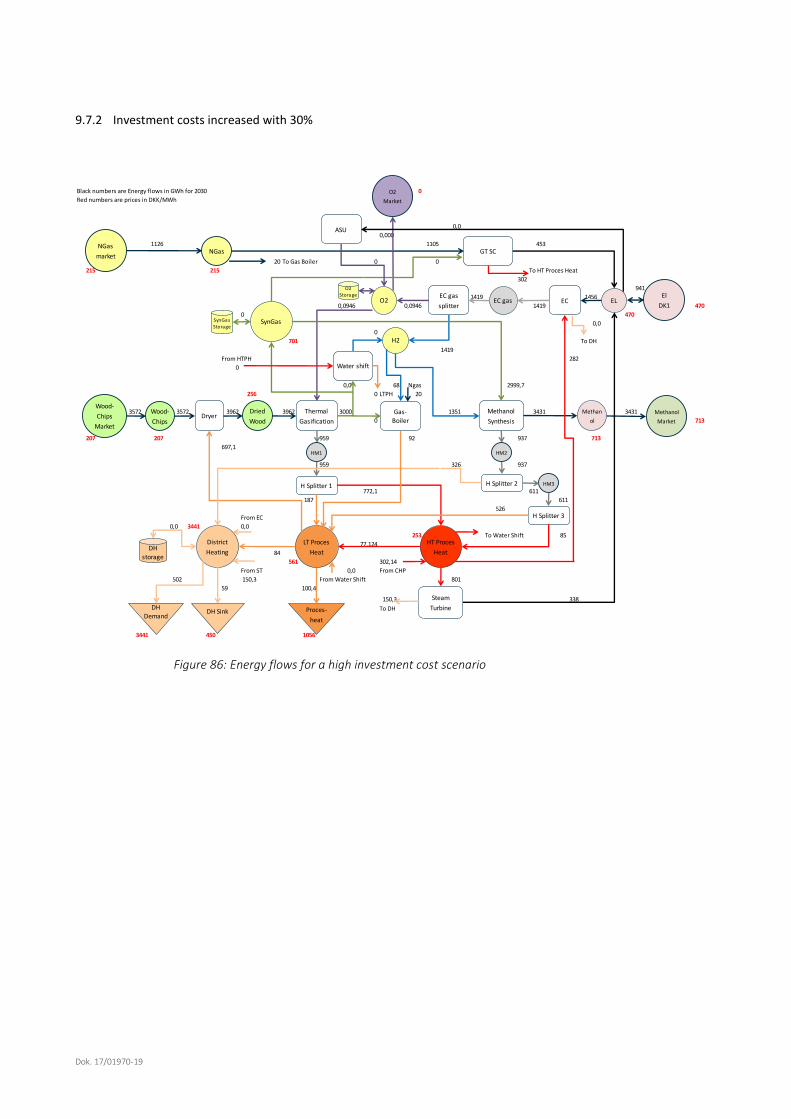
Dok. 17/01970-19
9.7.2 Investment costs increased with 30%
Figure 86: Energy flows for a high investment cost scenario
Black numbers are Energy flows in GWh for 2030 0
Red numbers are prices in DKK/MWh
0,0
0,000
1126 1105 453
20 To Gas Boiler 0 0
215 215 To HT Proces Heat
302
941
1419 1456
0,0946 0,0946 1419 470
0 470
0,0
0
701 To DH
1419
From HTPH 282
0
0,0 68 Ngas 2999,7
256 0 LTPH 20
3962 3962 3000 1351 3431 3431
0 713
207 207 959 92 937 713
697,1
959 326 937
772,1 611
187 611
526
From EC
0,0 3441 0,0
253 To Water Shift 85
77,124
84
561 302,14
From ST 0,0 From CHP
502 150,3 From Water Shift 801
59 100,4
150,3 338
To DH
3441 450 1056
35723572 Wood-
Chips
Thermal
Gasification
SynGas
Storage
EC EL
SynGas
LT Proces
Heat
Proces-
heat
El
DK1
Gas-Boiler
GT SC
Methanol
Synthesis
District
HeatingDH
storage
DH Sink
Methanol
Market
Methan
ol
O2 EC gasEC gas
splitter
H2
O2
Market
Water shift
Dryer
DH Demand
NGas
Dried
Wood
Wood-
Chips
Market
NGas
market
HT Proces
Heat
HM1
H Splitter 1
HM2
H Splitter 2 HM3
H Splitter 3
Steam
Turbine
ASU
O2Storage
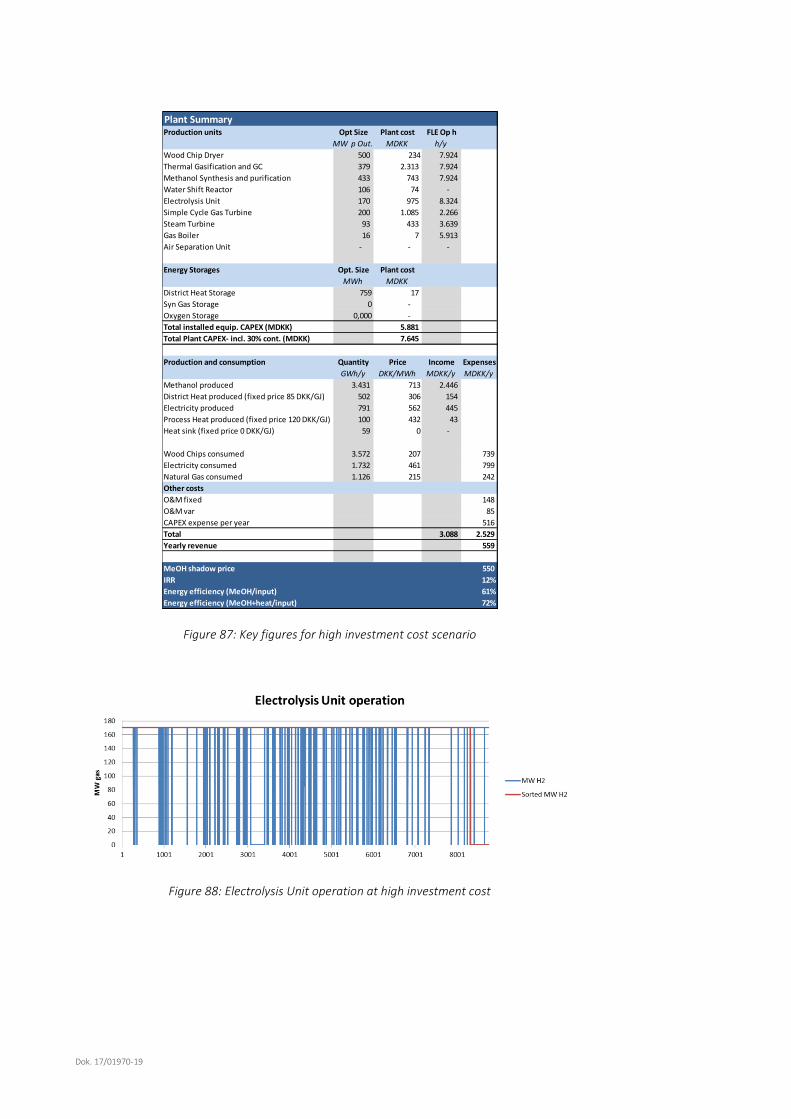
Dok. 17/01970-19
Figure 87: Key figures for high investment cost scenario
Figure 88: Electrolysis Unit operation at high investment cost
Plant SummaryProduction units Opt Size Plant cost FLE Op h
MW p Out. MDKK h/y
Wood Chip Dryer 500 234 7.924
Thermal Gasification and GC 379 2.313 7.924
Methanol Synthesis and purification 433 743 7.924
Water Shift Reactor 106 74 -
Electrolysis Unit 170 975 8.324
Simple Cycle Gas Turbine 200 1.085 2.266
Steam Turbine 93 433 3.639
Gas Boiler 16 7 5.913
Air Separation Unit - - -
Energy Storages Opt. Size Plant cost
MWh MDKK
District Heat Storage 759 17
Syn Gas Storage 0 -
Oxygen Storage 0,000 -
Total installed equip. CAPEX (MDKK) 5.881
Total Plant CAPEX- incl. 30% cont. (MDKK) 7.645
Production and consumption Quantity Price Income Expenses
GWh/y DKK/MWh MDKK/y MDKK/y
Methanol produced 3.431 713 2.446
District Heat produced (fixed price 85 DKK/GJ) 502 306 154
Electricity produced 791 562 445
Process Heat produced (fixed price 120 DKK/GJ) 100 432 43
Heat sink (fixed price 0 DKK/GJ) 59 0 -
Wood Chips consumed 3.572 207 739
Electricity consumed 1.732 461 799
Natural Gas consumed 1.126 215 242
Other costs
O&M fixed 148
O&M var 85
CAPEX expense per year 516
Total 3.088 2.529
Yearly revenue 559
MeOH shadow price 550
IRR 12%
Energy efficiency (MeOH/input) 61%
Energy efficiency (MeOH+heat/input) 72%

Dok. 17/01970-19
Figure 89: Investment cost +/- 30%
9.8 Gas turbine investment halved
The CAPEX of the Gas Turbine unit is taken from the Technology Catalogue Data [7]. This cost is
for a standalone GT power plant including all necessary facilities. In this study a lot of these
common facilities is covered in the contingency on the overall CAPEX. It is therefore assumed,
that the CAPEX for the gas turbine is set to high in this study. This simulations shows the im-
pact of a 50% reduced GT CAPEX.
Figure 90: Energy flows for a low GT investment scenario
Black numbers are Energy flows in GWh for 2030 0
Red numbers are prices in DKK/MWh
0,0
0,000
1119 1097 450
22 To Gas Boiler 0 0
215 215 To HT Proces Heat
300
945
1419 1457
0,0946 0,0946 1419 470
0 470
0,0
0
726 To DH
1419
From HTPH 281
0
0,0 68 Ngas 2999,7
255 0 LTPH 22
3962 3962 3000 1351 3431 3431
0 713
207 207 959 94 937 713
697,1
959 326 937
772,1 611
187 611
526
From EC
0,0 3439 0,0
252 To Water Shift 85
74,468
84
532 299,75
From ST 0,0 From CHP
502 150,7 From Water Shift 802
59 100,4
150,7 338
To DH
3439 450 900
35723572 Wood-
Chips
Thermal
Gasification
SynGas
Storage
EC EL
SynGas
LT Proces
Heat
Proces-
heat
El
DK1
Gas-Boiler
GT SC
Methanol
Synthesis
District
HeatingDH
storage
DH Sink
Methanol
Market
Methan
ol
O2 EC gasEC gas
splitter
H2
O2
Market
Water shift
Dryer
DH Demand
NGas
Dried
Wood
Wood-
Chips
Market
NGas
market
HT Proces
Heat
HM1
H Splitter 1
HM2
H Splitter 2 HM3
H Splitter 3
Steam
Turbine
ASU
O2Storage

Dok. 17/01970-19
Figure 91: Key figures for low GT investment cost scenario
Figure 92: Electrolysis Unit operation at low GT investment cost
Plant SummaryProduction units Opt Size Plant cost FLE Op h
MW p Out. MDKK h/y
Wood Chip Dryer 500 180 7.924
Thermal Gasification and GC 379 1.779 7.924
Methanol Synthesis and purification 433 571 7.924
Water Shift Reactor 106 57 -
Electrolysis Unit 170 750 8.324
Simple Cycle Gas Turbine 200 417 2.248
Steam Turbine 93 333 3.642
Gas Boiler 17 6 5.637
Air Separation Unit - - -
Energy Storages Opt. Size Plant cost
MWh MDKK
District Heat Storage 855 15
Syn Gas Storage 0 0
Oxygen Storage 0 -
Total installed equip. CAPEX (MDKK) 4.109
Total Plant CAPEX- incl. 30% cont. (MDKK) 5.341
Production and consumption Quantity Price Income Expenses
GWh/y DKK/MWh MDKK/y MDKK/y
Methanol produced 3.431 713 2.446
District Heat produced (fixed price 85 DKK/GJ) 502 306 154
Electricity produced 788 562 443
Process Heat produced (fixed price 120 DKK/GJ) 100 432 43
Heat sink (fixed price 0 DKK/GJ) 59 0 -
Wood Chips consumed 3.572 207 739
Electricity consumed 1.733 461 799
Natural Gas consumed 1.119 215 240
Other costs
O&M fixed 148
O&M var 85
CAPEX expense per year 363
Total 3.086 2.375
Yearly revenue 711
MeOH shadow price 506
IRR 18%
Energy efficiency (MeOH/input) 61%
Energy efficiency (MeOH+heat/input) 72%

Dok. 17/01970-19
Figure 93: GT investment 50% down
9.9 SOEC versus Alkaline
In this simulation the SOEC electrolysis unit is replaced with an alkaline electrolysis unit. The
SOEC technology is under development and the cost estimation is very rough. The Alkaline
electrolysis is commercially available and the cost estimates therefore more precise. So a
switch to alkaline will reduce the technology risk of the total plant. The performance and eco-
nomic data for the alkaline electrolysis is found under the description of the Production Units.
Shifting from SOEC to Alkaline electrolysis changes the heat flow to the Electrolysis Unit. With
the SOEC technology HT process heat was supplied to the process while the alkaline technolo-
gy has a district heat output.
Figure 94: Energy flows for an alkaline electrolysis scenario
Black numbers are Energy flows in GWh for 2030 0
Red numbers are prices in DKK/MWh
0,0
0,000
181 0 0
181 To Gas Boiler 0,0000 0
215 215 To HT Proces Heat
0
26
0 0
0,0676 0 0 470
0 470
0,0
598,1
555 To DH
0
From HTPH 0
174,6
815,6 0 Ngas 1328,4
270 218 LTPH 181
2832 2832 2144 598 1519 1519
0 713
206 206 685 188 415 713
498,3
685 144 415
551,86 271
133 271
233
From EC
0,0 224 0,0
261 To Water Shift 38
71,947
246
224 0
From ST 217,9 From CHP
500 113,3 From Water Shift 343
4 99,9
113,3 137
To DH
224 0 237
25532553 Wood-
Chips
Thermal
Gasification
SynGas
Storage
EC EL
SynGas
LT Proces
Heat
Proces-
heat
El
DK1
Gas-Boiler
GT SC
Methanol
Synthesis
District
HeatingDH
storage
DH Sink
Methanol
Market
Methan
ol
O2 EC gasEC gas
splitter
H2
O2
Market
Water shift
Dryer
DH Demand
NGas
Dried
Wood
Wood-
Chips
Market
NGas
market
HT Proces
Heat
HM1
H Splitter 1
HM2
H Splitter 2 HM3
H Splitter 3
Steam
Turbine
ASU
O2Storage

Dok. 17/01970-19
Figure 95: Key figures for an alkaline electrolysis scenario
Shifting to alkaline electrolysis simply makes ADAPT/Sifre not invest in an electrolysis at the
given price.
Plant SummaryProduction units Opt Size Plant cost FLE Op h
MW p Out. MDKK h/y
Wood Chip Dryer 500 180 5.664
Thermal Gasification and GC 379 1.779 5.664
Methanol Synthesis and purification 268 354 5.664
Water Shift Reactor 106 57 5.664
Electrolysis Unit - - -
Simple Cycle Gas Turbine - - -
Steam Turbine 33 118 4.167
Gas Boiler 41 15 4.609
Air Separation Unit - - -
Energy Storages Opt. Size Plant cost
MWh MDKK
District Heat Storage 720 12
Syn Gas Storage 0 0
Oxygen Storage 0 -
Total installed equip. CAPEX (MDKK) 2.516
Total Plant CAPEX- incl. 30% cont. (MDKK) 3.271
Production and consumption Quantity Price Income Expenses
GWh/y DKK/MWh MDKK/y MDKK/y
Methanol produced 1.519 713 1.083
District Heat produced (fixed price 85 DKK/GJ) 500 306 153
Electricity produced 137 500 69
Process Heat produced (fixed price 120 DKK/GJ) 100 432 43
Heat sink (fixed price 0 DKK/GJ) 4 0 -
Wood Chips consumed 2.553 207 528
Electricity consumed 163 463 76
Natural Gas consumed 181 215 39
Other costs
O&M fixed 89
O&M var 51
CAPEX expense per year 226
Total 1.348 1.008
Yearly revenue 340
MeOH shadow price 489
IRR 15%
Energy efficiency (MeOH/input) 55%
Energy efficiency (MeOH+heat/input) 77%

Dok. 17/01970-19
10. References
[1] Martin Møller et al. Polygeneration, DONG Energy, PSO Report, 2011
[2] Danish Technological Institute, GreenSynFuel, final project report, EUDP 64011-0011, 2011
[3] Matteo Morandin et al. Methanol via biomass Gasification, Chalmers University og Tech-
nology, 2015
[4] Hannula and Kurkela, Liquid transportation fuels via large-scale fluidised-bed gasification of
lignocellulosic biomass, VTT, 2012
[5] Spath, Aden et al., Biomass to Hydrogen Production Detailed Design and Economics Utiliz-
ing the Battelle Columbus Laboratory Indirectly-Heated Gasifier, NREL 2005
[6] Anders Evald et al. Technology data for advanced bioenergy fuels, FORCE Technology, 2013
[7] Technology Data Catalogue for Energy Plants, aug. 2016
[8] Technology Data Catalogue for Energy Plants- UPDATE 2016
[9] Steven D. Phillips et al., Gasoline from Wood via Integrated Gasification, Synthesis, and
Methanol-to- Gasoline Technologies, NREL, 2011. [9]
[10] Yas A. Alsultanny et al. Oxygen Specific Power Consumption Comparison for Air Separation
Units, Engineering Journal, 2014
[11] Ryan M. Swanson et al., Techno-Economic Analysis of Biofuels Production Based on Gasifi-
cation, NREL, 2010
[12] Jonathan Chou et. al. Compressed Air Energy Storage, University of Pennsylvania, 2014
[13] Analyseforudsætninger, Energinet, 2016
[14] EA Energianalyse, Samfundsøkonomiske aspekter ved produktion af 2. generations
bioethanol, 2009
[15] GRØN ROADMAP 2030. SCENARIER OG VIRKEMIDLER TIL OMSTILLING AF
TRANSPORTSEKTORENS ENERGIFORBRUG, November 2015:
[G] Internal estimated value.

Dok. 17/01970-19
11. Appendix 1
During the sensitivity simulations the ADAPT/Sifre tool was updated. All simulations up to and
including: Forced ASU operation – cost of flexibility was performed with the Sifre Frontend
300.1.1 version and all simulations descriped after Forced ASU operation – cost of flexibility has
been performed with the Sifre Frontend 300.2.0 version.
The simulation of the Energy Plant Type III baseline model in the old version and in the new
version is compared hereunder. The output data shows minor differences but not really chang-
ing the optimization results.
11.1.1 Baseline model Energy Flows
Figure 96: Energy flows for baseline model in 2030
11.1.2 Baseline model Key Figures
Black numbers are Energy flows in GWh for 2030 0
Red numbers are prices in DKK/MWh
0,0
0,000
1121 1098 450
23 To Gas Boiler 0 0
215 215 To HT Proces Heat
300
947
1419 1457
0,0946 0,0946 1419 470
0 470
0,0
0
704 To DH
1418
From HTPH 280
0
0,0 67 Ngas 2999,5
256 0 LTPH 23
3962 3962 3000 1350 3430 3430
0 713
207 207 959 94 937 713
697,1
959 326 937
772,04 611
187 611
526
From EC
0,0 3465 0,0
256 To Water Shift 85
82,223
91
216 300,16
From ST 0,0 From CHP
502 142,7 From Water Shift 795
58 100,4
142,7 336
To DH
3465 450 331
35713571 Wood-
Chips
Thermal
Gasification
SynGas Storage
EC EL
SynGas
LT Proces
Heat
Proces-
heat
El
DK1
Gas-
Boiler
GT SC
Methanol
Synthesis
District
HeatingDH
storage
DH Sink
Methanol
Market
Methan
ol
O2 EC gasEC gas
splitter
H2
O2
Market
Water shift
Dryer
DH
Demand
NGas
Dried
Wood
Wood-
Chips
Market
NGas
market
HT Proces
Heat
HM1
H Splitter 1
HM2
H Splitter 2 HM3
H Splitter 3
Steam
Turbine
ASU
O2Storage

Dok. 17/01970-19
Figure 97: Key figures for baseline model 2030
11.1.3 Baseline model Electrolysis Unit operation
Figure 98: Electrolysis Unit operation for baseline model in 2030
Plant SummaryProduction units Opt Size Plant cost FLE Op h
MW p Out. MDKK h/y
Wood Chip Dryer 500 180 7.924
Thermal Gasification and GC 379 1.779 7.924
Methanol Synthesis and purification 433 571 7.924
Water Shift Reactor 106 57 -
Electrolysis Unit 170 750 8.323
Simple Cycle Gas Turbine 200 834 2.251
Steam Turbine 93 333 3.622
Gas Boiler 17 6 5.638
Air Separation Unit - - -
Energy Storages Opt. Size Plant cost
MWh MDKK
District Heat Storage 855 15
Syn Gas Storage 0 -
Oxygen Storage 0 -
Total installed equip. CAPEX (MDKK) 4.526
Total Plant CAPEX- incl. 30% cont. (MDKK) 5.884
Production and consumption Quantity Price Income Expenses
GWh/y DKK/MWh MDKK/y MDKK/y
Methanol produced 3.430 713 2.446
District Heat produced (fixed price 85 DKK/GJ) 502 306 154
Electricity produced 786 566 445
Process Heat produced (fixed price 120 DKK/GJ) 100 432 43
Heat sink (fixed price 0 DKK/GJ) 58 0 -
Wood Chips consumed 3.571 207 739
Electricity consumed 1.733 461 799
Natural Gas consumed 1.121 215 241
Other costs
O&M fixed 148
O&M var 85
CAPEX expense per year 397
Total 3.088 2.409
Yearly revenue 678
MeOH shadow price 515
IRR 16%
Energy efficiency (MeOH/input) 61%
Energy efficiency (MeOH+heat/input) 72%
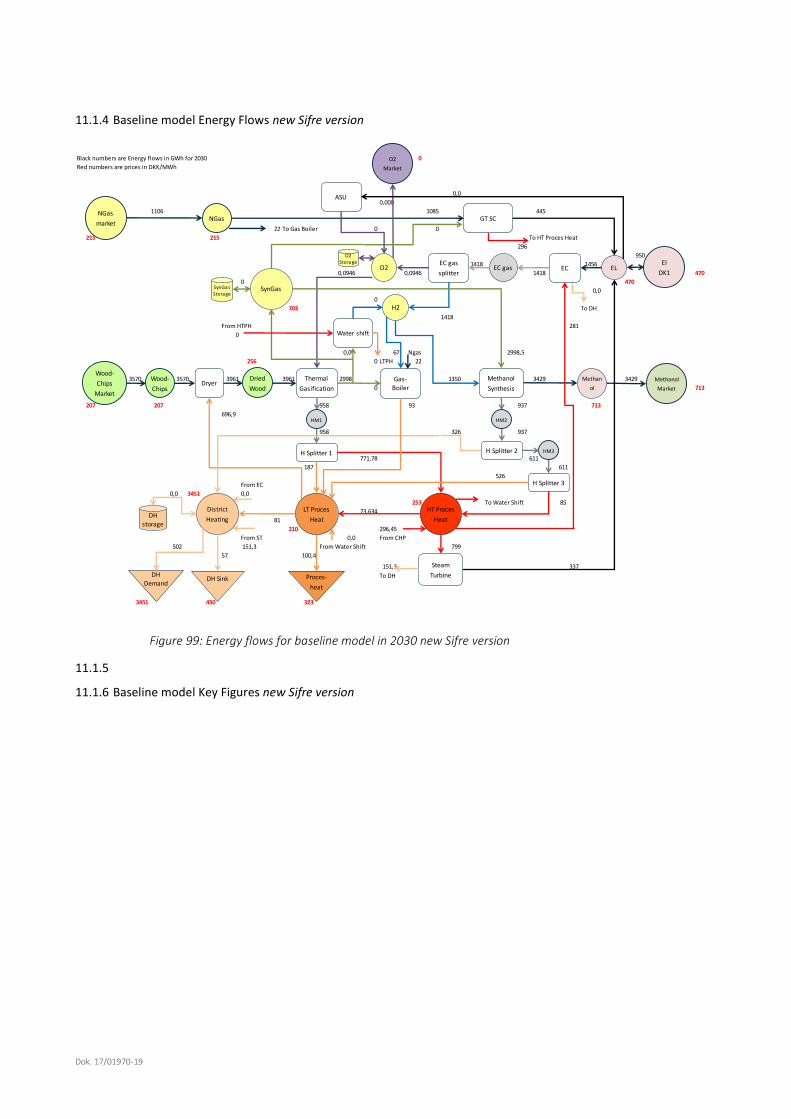
Dok. 17/01970-19
11.1.4 Baseline model Energy Flows new Sifre version
Figure 99: Energy flows for baseline model in 2030 new Sifre version
11.1.5
11.1.6 Baseline model Key Figures new Sifre version
Black numbers are Energy flows in GWh for 2030 0
Red numbers are prices in DKK/MWh
0,0
0,000
1106 1085 445
22 To Gas Boiler 0 0
215 215 To HT Proces Heat
296
950
1418 1456
0,0946 0,0946 1418 470
0 470
0,0
0
703 To DH
1418
From HTPH 281
0
0,0 67 Ngas 2998,5
256 0 LTPH 22
3961 3961 2998 1350 3429 3429
0 713
207 207 958 93 937 713
696,9
958 326 937
771,78 611
187 611
526
From EC
0,0 3451 0,0
253 To Water Shift 85
73,634
81
210 296,45
From ST 0,0 From CHP
502 151,3 From Water Shift 799
57 100,4
151,3 337
To DH
3451 450 323
35703570 Wood-
Chips
Thermal
Gasification
SynGas Storage
EC EL
SynGas
LT Proces
Heat
Proces-
heat
El
DK1
Gas-
Boiler
GT SC
Methanol
Synthesis
District
HeatingDH
storage
DH Sink
Methanol
Market
Methan
ol
O2 EC gasEC gas
splitter
H2
O2
Market
Water shift
Dryer
DH
Demand
NGas
Dried
Wood
Wood-
Chips
Market
NGas
market
HT Proces
Heat
HM1
H Splitter 1
HM2
H Splitter 2 HM3
H Splitter 3
Steam
Turbine
ASU
O2Storage

Dok. 17/01970-19
Figure 100: Key figures for baseline model 2030 new Sifre version
11.1.7 Baseline model Electrolysis Unit operation new Sifre version
Figure 101: Electrolysis Unit operation for baseline model in 2030 new Sifre version
Plant SummaryProduction units Opt Size Plant cost FLE Op h
MW p Out. MDKK h/y
Wood Chip Dryer 500 180 7.921
Thermal Gasification and GC 379 1.779 7.921
Methanol Synthesis and purification 433 571 7.921
Water Shift Reactor 106 57 -
Electrolysis Unit 170 750 8.320
Simple Cycle Gas Turbine 200 834 2.223
Steam Turbine 93 333 3.628
Gas Boiler 17 6 5.548
Air Separation Unit - - -
Energy Storages Opt. Size Plant cost
MWh MDKK
District Heat Storage 855 15
Syn Gas Storage 0 -
Oxygen Storage 0 -
Total installed equip. CAPEX (MDKK) 4.526
Total Plant CAPEX- incl. 30% cont. (MDKK) 5.884
Production and consumption Quantity Price Income Expenses
GWh/y DKK/MWh MDKK/y MDKK/y
Methanol produced 3.429 713 2.445
District Heat produced (fixed price 85 DKK/GJ) 502 306 154
Electricity produced 781 563 440
Process Heat produced (fixed price 120 DKK/GJ) 100 432 43
Heat sink (fixed price 0 DKK/GJ) 57 0 -
Wood Chips consumed 3.570 207 739
Electricity consumed 1.732 461 798
Natural Gas consumed 1.106 215 238
Other costs
O&M fixed 148
O&M var 85
CAPEX expense per year 397
Total 3.082 2.404
Yearly revenue 678
MeOH shadow price 515
IRR 16%
Energy efficiency (MeOH/input) 61%
Energy efficiency (MeOH+heat/input) 72%

Dok. 17/01970-19

Dok. 17/01970-19