apple juice - usitc | united states international trade ... · pdf fileentry into and exit...
TRANSCRIPT
APPLE JUICE
Report to the President on Investigation No. TA-201-59 Under Section 201 of the Trade Act of 1974
USITC PUBLICATION 1881
JUNE 1988
United States International Trade Commission I Washington, DC 20436

UNITED STATES INTERNATIONAL TRADE COMMISSION
COMMISSIONERS
Susan W. Liebeler, Chairman
Anne E. Brunsdale, Vice Chairman
Paula Stem
Alfred E. Eckes
Seeley G. Lodwick
David B. Rohr
STAFF ASSIGNED
Office of Investigations:
Office of Economics: Office of Industries:
Office of the General Counsel:
Supervisory Investigator:
Stephen Vastagh Jerald Tepper Laurie Cameron Alvin Macomber Antoinette James Catherine Field William Gearhart Robert Eninger
Address all communications to
Kenneth R. Mason, Secretary to the Commission
United States International Trade Commission
Washington, DC 20436

C 0 N T E N T S
Determination------------------------------------------------------------Views of Chairwoman Paula Stern and Commissioners Alfred Eckes,
Seeley G. Lodwick, and Anne E. Brunsdale------------------------------Views of Vice Chairman Susan W. Liebeler--------------------------------Dissenting views of Commissioner David B. Rohr--------------------------Information obtained· in the investigation:
Introduction---------------------------------------------------------The products:
Juice apples------------------------------------~·c--------------Single-strength apple juice- - - - - - -- - - -- -- - - ,- -- - - c·_ - -- - - - - - --- --
Fresh single-strength juice- - -- ~ -- - - -~·- - •--- - -- - -- - -- - - - -- --Pasteurized single.strength juic.e- -'-- -.- - -·- - - - - - -- - -- -- -- - - - - -
Concentrated apple juice-- - - - - - - - - -·--- o.-"- - -- -- - -- - -- - -- -- -- -- ---Frozen concentrated apple juice-----------------------------Concentrated apple juice--·- - - -- - --- - -- - -- -- - -- - - - - -- -- -- - - - -
Reconstituted and blended apple juice---------------------------U.S. tariff treatment----~-------------------------------------------The U.S. market------------------------------------------------------
Growers----------------------------------------------------------Growing operations-------------------------------------------cost of growing----------------------------------------------Jtiice production of growers---------------------------------Entry into and exit from the industry------------------------
Packers----------------------------------------------------------Processors of U.S. apples---------------------------------------Producers of domestic juice-------------------------------------Concentrators of domestic juice----------------------------------Reconstitutors--------------------------------------------------Bottlers--------------------------------------------------------U .S. importers---------------------------------------------------Channels of distribution----------------------------------------Transportation factors affecting demand--------------------------
Apple industry trade associations: International Apple Institute-----------------------------------Processed Apple Institute---------------------------------------Grower associations----------------------------------------------
Apparent U.S. consumption-------------------------------------------The question of increased imports:
U.S. imports----------------------------------------------------Crop-year data-----------------------------------------------Quarterly data----------------------------------------------Customs district data----------------------------------------
U. S. exports-----------------------------------------------------The question of serious injury:
U.S. plant closings----------------------------------------------U.S. production, capacity, and shipments:
U.S. production and utilization of apples-------------------U.S. production capacity for apple juice and CAJ------------
Single-strength domestic apple juice---------------------CAJ------------------------------------------------------
1
3 21 52
A-1
A-1 A-4 A-4 A-4 A-5 A-5 A-5 A-6 A-7 A-8 A-9 A-9
A-10 A-11 A-11 A-12 A-12 A-12 A-15 A-16 A-16 A-16 A-17 A-20
A-21 A-21 A-21 A-22
A-24 A-25 A-25 A-25 A-29
A-30
A-31 A-34 A-38 A-39

ii
CONTENTS
Information obtained in the investigat ·.on--continued The question of serious injury--continued
U.S. production, capacity, and shipments--continued Production and movements of CAJ and single-strength apple
juice made entirely of U.S.-grown apples------------------Imports and purchases of juice apples and CAJ by producers
of domestic juice------------------------------------------Imports and purchases of CAJ by reconstitutors--------------
Inventories of juice apples and domestic apple juice and CAJ-----Employment-------------------------------------------------------Financial experience of U.S. growers and producers of domestic
apple juice: U.S. growers------------------------------------------------
Large growers-------------------------------------------Small growers--------------------------------------------Capital expenditures------------------------------------Financial position of U.S. growers-----------------------
Operations of producers of domestic apple juice-------------Capital expenditures------------------------------------Research and development expenditures-------------------Financial condition of U.S. producers--------------------
The question of threat of serious injury: U.S. importers' inventories-------------------------------------Foreign industries----------------------------------------------
The question of imports as a substant.ial cause of serious injury: Market penetration-----------------------------------------------Prices----------------------------------------------------------
Apple juice-------------------------------------------------Juice apples-------------------------------------------------Concentrated apple juice-------------------------------------
Exchange rates---------------------------------------------------Factors other than imports affecting the domestic industry-------
Competitive efforts against imports----------------------------------Small growers---------------------------------------------------Large growers----------------------------------------------------Producers of domestic apple juice--------------------------------
Adjustment if relief were to be granted------------------------------Small growers---------------------------------------------------Large growers----------------------------------------------------Producers of domestic apple juice-------------------------------
Other comments of producers: Producers of domestic juice and/or CAJ---------------------------Growers----------------------------------------------------------
Appendix A. Notice in the Federal Register of institution of investigation No. TA-201-59, letter from the United States Trade Representative, and list of witnesses appearing at the hearing--------
Appendix B. Excerpts from the Tariff Schedules of the United States Annotated (1986), schedule l, part 12, subpart A----------------------
Appendix C. Certain apple growers' comments on their operations that were supplied voluntarily with the return of the Commission questionnaire----------------------------------------------------------
Appendix D. Statistical tables------------------------------------------
•
A-41
A-45 A-45 A-45 A-48
A-50 A-52 A-55 A-57 A-59 A-59 A-61 A-61 A-61
A-62 A-63
A-68 A-68 A-68 A-70 A-72 A-76 A-79 A-79 A-80 A-80 A-81 A-81 A-81 A-82 A-82
A-82 A-83
A-85
A-93
A-97 A-99
ii

iii
CONTENTS
Figure
Packer's tally to grower for season's pack of fresh market apples and culls (juice apples) of one variety, Washington State, 1984 crop------- A-13
1.
2.
3.
4.
s.
6. 7.
8.
9.
10.
11.
12.
13.
14.
15.
16.
17. 18.
Tables
Concentrated apple juice (CAJ): Distribution of purchases from U.S. importers and directly from foreign sources, crop years 1980/81 to 1984/85-----------------------------------------------
Concentrated apple juice (CAJ): Importers• sales of imports, by types of users, 1981 and 1985---------------------------------
Single-strength apple juice: Distribution of sales by producers of domestic juice, by types of purchasers, 1981 and 1985---------
Single-strength apple juice: Distribution of sales by reconstitutors, by types of purchasers, 1981 and 1985------------
Apples and apple juice: Transportation costs as a share of the price, by distances------------------------------------------
U.S. per capita consumption of apples and apple products, 1975-84--Apple juice: Apparent U.S. consumption on a single-strength
basis, crop years 1980/81 to 1984/85 and July-January of crop years 1984/85 and 1985/86----------------------------------------
Apple juice: U.S. production, imports, apparent U.S. consumption, and Producers' Price Index, crop years 1975/76 to 1984/85--------
Apple or pear juice: U.S. imports for consumption, by principal sources, crop years 1980/81 to 1984/85---------------------------
Apple or pear juice: U.S. imports for consumption, by principal sources, July-September, October-January, and crop year to date, 1984/85 and 1985/86-----------------------------------------------
Concentrated apple juice (CAJ): U.S. imports for consumption from specified major suppliers, annually and by quarters, crop years 1980/81 to 1984/85, July 1984-January 1985, and July 1985-January 1986-------------------------------------------
Apple or pear juice: U.S. imports for consumption, by principal U.S. Customs districts, 1980-85----------------------------------
Apples: U.S. production and utilization, crop years 1980/81 to 1984/85-----------------------------------------------------------
Juice apples: U.S. production, by principal States and by crop years, 5-year averages 1970/71 to 1974/75, 1975/76 to 1979/80, 1980/81 to 1984/85, and annually 1980/81 to 1985/86--------------
Apples: Smaller U.S. growers• production and sales, crop years 1980/81 to 1984/85 and July-December 1985------------------------
Apples: Larger U.S. growers• production and sales, crop years 1980/81 to 1984/85 and July-December 1985------------------------
Apples: Age of trees in 1985 on large and small apple farms-------Apples: Expected production and share of juice apples in expected
production, by farm sizes, 1986-90--------------------------------
Ill
A-17
A-18
A-19
A-19
A-20 A-22
A-23
A-24
A-26
A-27
A-28
A-29
A-32
A-33
A-35
A-36 A-37
A-37

19.
20.
21.
22.
23.
24.
25.
26.
27.
28.
29.
30.
31.
32.
33.
34.
35.
36.
37.
38. 39.
iv
CONTENTS
Apple juice and CAJ: Production, shipments, and inventories of domestic apple juice and CAJ made entirely from U.S. apples, crop years 1980/81 to 1984/85, July-December 1984, and July-December 1985-----------------------------------------------------
Apple juice, single-strength equivalent: Estimated U.S. production based on the production of juice apples, by principal States, crop years 1980/81 to 1985/86----------------------------
Apples and apple juice: Purchases and imports by producers of domestic apple juice, crop years 1980/81 to 1984/85, JulyDecember 1984, and July-December 1985----------------------------
Apple juice: Reconstitutors• purchases and imports, crop years 1980/81 to 1984/85, July-December 1984, and July-December 1985---
Apples: U.S. growers• inventories as of Dec. 31 and Mar. 31, crop years 1981/82 to 1985/86------------------------------------
Apples: Full-time and part-time employment and unpaid employment on U.S. apple farms, crop years 1980/81 to 1984/85----------------
Average number of U.S. production and related workers engaged in the production of apple juice, and hours worked and wages and total compensation paid to such employees, fiscal years 1981-85 and interim periods ended Dec. 31, 1984, and Dec. 31, 1985--------
Income-and-loss experience of large apple growers on the overall operations of their farms on which apples are grown, 1981-85-----
Income-and-loss experience of large apple growers on their total apple operations, 1981-85----------------------------------------
Income-and-loss experience of small apple growers on the overall operations of their farms on which apples are grown, 1981-85-----
Income-and-loss experience of small apple growers on their total apple operations, 1981-85----------------------------------------
Selected balance sheet items for U.S. apple growers, as of the end of accounting years 1981-85----------------------------------
Income-and-loss experience of 10 producers on their operations producing domestic apple juice, accounting years 1982-85---------
Selected balance sheet and financial ratios for producers of domestic apple juice on their overall operations, as of the end of accounting years 1982-85--------------------------------------
Apples: World production for all uses in selected regions and countries, by crop years, 5-year averages 1970/71 to 1984/85 and annually 1981/82 to 1985/86----------------------------------
Apples: Supply, utilization, and share of production processed, by countries and crop year----------------------------------------
Concentrated apple juice (CAJ) (69-72 degree Brix): All apples produced, apples used for CAJ, capacity to produce CAJ, production of CAJ, and exports of CAJ to the United States, by sources, 1981-85----------------------------------------------
Index of prices of apple juice produced from domestically grown apples and imported concentrate, 1975-84-------------------------
Index of weighted-average prices of apple juice reported by producers---------------------------------------------------------
Prices of apples, by uses, crop years 1975/76 to 1984/85-----------Selling and purchase prices of juice apples, crop years 1981/82
to 1984/85 and July-December 1985---------------------------------
A-42
A-44
A-46
A-47
A-48
A-49
A-51
A-53
A-55
A-56
A-58
A-59
A-60
A-62
A-64
A-66
A-67
A-69
A-70 A-71
A-72 IV

v
CONTENTS
40. Quarterly purchase and selling prices of juice apples, July 1981-December 1985----------------------------------------------------- A-73
41. Estimated unit values of imported concentrated apple juice from all sources, crop years 1975/76 to 1984/85 and July-December 1985-------------------------------------------------------------- A-73
42. Estimated unit values of imported concentrated apple juice from largest suppliers, crop years 1982/83 to 1984/85 and July-December 1985----------------------------------------------------- A-74
43. Purchase prices of domestic and imported concentrated apple juice, crop years 1981/82 to 1984/85 and July-December 1985------- A-74
44. Quarterly purchase prices of domestic and imported concentrated apple juice, July 1981-December 1985------------------------------ A-75
45. Quarterly purchase prices of imported concentrated apple juice, by sources, July 1981-December 1985------------------------------- A-76
46. Exchange rates: Nominal-exchange-rate equivalents of selected currencies in U.S. dollars, real-exchange-rate equivalents, and producer price indicators in specified countries, indexed by quarters, January 1981-December 1985------------------------------ A-77
Note.--Information that would reveal the confidential operations of individual concerns may not be published and therefore has been deleted from this report. Such deletions are indicated by asterisks.
v

vi
Determination
REPORT TO THE PRESIDENT ON INVESTIGATION NO. TA-201-59
APPLE JUICE
UNITED STATES INTERNATIONAL TRADE COMMISSION June 13, 1986
On the basis of the information developed in the subject investigation,
the Commission has determined !J that apple juice, not mixed and not
containing over 1.0 percent of ethyl alcohol by volume, provided for in item
165.15 of the Tariff Schedules of the United States, is not being imported
into the United States in such increased quantities as to be a substantial
cause of serious injury, or the threat thereof, to the domestic industry
producing an article like or directly competitive with the imported article.
Background
The United States International Trade Commission instituted investigation
No. TA-201-59, under section 20l(b)(l) of"the Trade Act of 1974 (19 U.S.C.
225l(b)(l)), in order to determine whether the above described apple juice is
being imported into the United States in such increased quantities as to be a
substantial cause of serious injury, or the threat thereof, to the domestic
industry producing an article like or directly competitive with the imported
article. The investigation resulted from a request received by the Commission
on December 27, 1985, from the United States Trade Representative.
Notice of the institution of the Commission's investigation and of a
public hearing to be held in connection therewith was given by posting copies
of the notice in the Office of the Secretary, U.S. International Trade
Commission, Washington, DC, and by publishing the notice in the Federal
Register of January 24, 1986 (51 F.R. 3266). The hearing was held in
!J Commissioner Rohr dissenting.

2
Washington, DC, on April 17, 1986, and all persons who requested the
opportunity were permitted to appear in person or by counsel.
This report is being furnished to the President in accordance with
section 20l(d)(l) of the Trade Act of 1974. The information in the report was
obtained from responses to Commission questionnaires, fieldwork and interviews
by members of the Commission's staff, other agencies, information presented at
the public hearing, briefs submitted by interested parties, the Commission's
files, and other sources.
2

VICWS or CllAIRWOMAN PAULA STCflN AND COM'IISSIONERS ALFRi:D ECKES' SEEL [Y G. LODWICI(, AND ANNE L. DRUNSDALC
We have determined that apple juice .!/ is not being imported into the
United States in such increased quantities as to be a substantial cause of
serious injury, or the thre,1t thereof, to the domestic industry producing an
article like or directly competitive with the imported article. flaving made a
negative injury detennination, we do not reach the question of r"inedy.
Section 201 requires that we find each of threo criteria to L>a satisfied
in order to make an affirmative detannination·· ··
( 1) imports are in increased quantities;
(2) the domestic industry producing an ar·ticle like or directly competitive with the imported articl<l is seriously injured or threC\tened with serious injury; and
(3) the increased imports are a substantial cause of' the serious injury or threat to the domestic industry.
In the present case, we find that imports increased and that the domestic
industry producing apple juice experienced economic difficulties. llowever, we
find that the domestic industry is riot seriously injured or threatened with
serious injury.
Domestic industry
The first issue I.hat we must address is that. of I.he domestic industry.
Section 201 defines the domestic industry in terms of the domestic producers
.!/ Apple juice, not mixed and not containing over 1 percent ethyl alcohol by volume, provided for in ii.em 165.15 of I.he lariff Schodules of I.he United States.
3

4
of "an article like or directly competitive with the imported article"; and
t.he t.erms "like" and "direct.ly competitive" are defined in the legislative
history. "Like" olrticles are "those which c1re substantially identical in
inherent or iritrinsic characteristics (i.e., materials fron1 which made,
appearance, quality, toxture, etc.)." "Dirac tly competitive" articles are
t.hose "which, although riot substantially identical in their inherent or
intrinsic charactoris tics, are substantially equivalent for commercic1.l
purposes, t.hat is, are adapted t.o the same uses and are essentially
interchangeable therefor."
The term "directly competitive" is furl.her defined ir1 section 601(5) of
the Trade Act to mean directly competitive at an <>arlior or lat<>r stage of
processing-·-
An imported article is "directly compet.it.ive wit.h" a domestic article at an earlier or lc1tor stage of processing, and a domestic article is "directly competitive wit.h" an imported article at. an earlier or later stage of processing, if the importc1tion of the article has an economic effect. on producers of t.he domestic article comparable to the eff<>ct of importation ol' articles in the same stage of processing as t.he domestic article. For purposes oft.his pc1ragraph, the unprocessed article is c1t an ear.Liar stage of processing.
In order for articles to be directly competitive at. an earlier or lat.er st.age
of processing, they must remain "substantially the same" during the stages of
processing and must. "not [be] wholly transformed" into a different. article. '!,_/
'!,_/See ll.R. Rep. No. 1810, 87th Cong., 2d Sess., at 85 (1962). This provision, known as the Morse cherry am<!ndment after Sen. Wayne Morse of Oregon, was fir-st included in the Trade lxpansion Act of 1962 (76 Stat. 872). The legislative history of the 1962 act gave three examples of processing as meeting the test-zinc oxide would be zinc ore in a lat.er st.age of processing; and a raw cherry would be a glace cherry in an earlier stage of processing, as would live lamb and dressed lamb. Id.
4

5
1 he Commission generally includes in the domestic industry all the
domestic productive resources used to produce the domestic article, i.e,
employees, physical facilities, and capital. y If the product has several
~tages of production, the industry would include the resources employed at
each level. Oecause the productive resources in most industries are
concentrated at the finc1l stage of production, the Commission generally
focuses its data-gathering efforts and analysis Im that stage. if It is
important that the Commission's injury determination of serious injury embrace
the industry as a whole, not just the facilities at one stage of production.
In determining what constitutes the appropriate industry, including
whether there are two or more industries, the Commission has traditionally
considered, among other factors, (1) the nc\ture of the domestic and imported
products invollled, including the customs treatment thereof; (2) the domestic
facilities used to make the like or direc;tly competitive domestic article,
including the ownership and location of' plant and equipment (e.g., what
articles do domestic producers make, are they made in the·same or separate
facilities?), the labor skills required, and the marketirig involved in selling
the product (e.g., are the marketing channels the same or substantially
different?); arid (3) the requests of domestic producers (e.g., what facilities
are alleged to be injured?):
The industry question in this investigation raises several issues that do
not generally arise in section 201 investigations. The American Farin Bureau
Federation, representing certain apple growers, procc s so rs, and concentrators,
'J_/ Report of the Mouse Commit tee oii Ways and Means on the l rade Reform Act of 1973, II. R. Rop. No. 571, 93d Cong., 1st Sess. '16 (1973).
1_/ Commissioner llrunsdale finds it unnecessary to characteri7e the relative importance of earlier and later stages of production.
5

6
asserted that the Commission should find three domestic industries~
(1) six-strength concentrated apple juice (CAJ) (or· non-retail three- and
four-strength CAJ), (2) retail processed apple juice products, and (3) juice
. apples. §/ The Association of rood Industr-ies, representing certair1 importer
interests, argued that there is one domestic apple juice processing industry
and that there is no separate juice apple industry. ~/
ror reasons set forth below, we find that there is one domestic industry
producing an article like or directly competitive with the imported article,
the d0111estic apple juice processing industry. All domestic apple growers are
part of this industry since they produce apples utilized in the production of
juice. As is indicated by our discussion below concerning the condition of
U1e apple grower segnient of the industry, even if we had found il appropriate
to consider finding a separate juice apple grower or apple grower industry
under section 601(5) of the Trade Act (19 U.$.C. 2491(5)) and had then fourid
such an industry, we would not have found that any such industry was seriously
injured or threatened with serious injury.
The imported article that is the subject of this investigation is apple
juice. l'lost of it enters in the fonn of six-strength concentrate. largely
because it is easier and cheaper to transport in that form. ZI
DOMstic apple juice is made from juice apples. There are three major
categories of domestic apples based on end use~fresh market, canning, and
juice. !/ Domestic apples that have good color and shape and that are free of
§.I ram Bureau posthearing br'ief at 33. Zee also appendix II to the prehearing brief of the Fann Bureau. ~I Posthearing brief of the Apple Juice Group of the Association of Food
Industries, Inc. at 2. 71 Report of the Commission (Report) at ~24. j°I Id. at A-1-A-l.
6

7
surface blemishes are sold as fresh market fruit. 21 Typically, the larger
the size of the apple, the higher its price. 101 Essentially all domestic
growers grow apples for the fresh market, where prices are highest. About 55
percent of domestic apples in terms of quantity and an esl.imaled 75 percent in
terms of value have been sold in the fresh market in rece11t years. !.!I
Canning apples must be rou11d a11d over 2-1/2 inches in diameter, but may have
surface blemishes since they will be peeled. 121 Thus, they commalld a lower
price. Juice apples, the third category, tradi tiornd ly are sort-outs,
tree-run fruit, weather-damaged fruit, drops, alld leftovers from other
grades. Pl
Very few growers produce juice apples exclusively. 141 Juice apples
generally are less costly to grow than apples destined for the other markets
because the trees involved require less mainte11a11ce and, the apples are less
likely to be adversely affected by weather. 151 Growers generally do not keep
separate records for fresh apples alld juice apples. 16/ Juice apples have
accounted for about 22 percent of apple production in terms of quantity and
about 10 percent in terms of value in recent years. 17/
The most basic apple juice product is fresh single-strength apple juice,
which is the product of pressing fresh apples. !!I This product may be sold
'jj Id. 101 Id. !.!/ Id. at A-32. Prices for fresh apples have increased over ihe past iwo
years and have fluctuated within a stable range since 1979. Id., at A-71. 12/ Report at A-1 . .ill J_Q. 14/ Id. at A-10. 151 Id. 16/ Id.. at A-50. _17 I Id. at A-32, A-54. 101 Id. at A-4.
7

8
to consumers as fresh apple juice or as fresh cider, and preservatives may be
added. 19/ It may be further processed through pasteurization (heat. treating)
to prnvent spoilage before being packaged in retail-sized containers; 20/ and
it may also be processed into concentrate, which involves removing water. 21/
In commercial practice generally only two levels of concentrate are
produced, three-·strength, which is often referred to as frozero concentrate,
and six-strength, which is widely referred to as "concentrate" or concentrated
apple juice (CAJ). 22/ Six-strength CAJ is a commercial rather than a retail
product. 23/ Because of its high level of concentration, it does not need to
be frozen to retard spoilage. 24/ It is used to produce t.hree-st.rength frozen
CAJ, reconstituted single-strength apple juice, blended s.ingle-strength apple.
juice made by mixing juice from concentrate with sirogle-strength juice that
has never been concentrated, and various mixed juices and other products t11 .. t
use apple juice as aro ingredient. 25/ Three-strength frozen CAJ is generally
produced from single-strength juice or from six-strength CAJ and packed in
retail containers for sale to consumers in the freezer compartmerots of grocery
stores. 26/
Producers of domestic apple juice include cider mills and other producers
of fresh single-strength (not pasteurizea) apple juice and producers of
pasteurized apple juice. 27/ The production of pasteurized apple juice from
19/ Id. 20/ Id. 21/ Id. at A--5. 22/ Id. 23/ Id. at A--5-6. 24/ Id. 25/ Id. 26/ Id. 27/ Id. at A--12.
8

9
domestic fresh apples requires extensive Facilities and processing equipment,
which represents a large capital investment. 28/ CAJ is produced by
dehydrating and concentrating single-strength juice in evaporators. 29/ Such
operations require investment in evaporators and other equipment lo yield the
concentrate. 30/ Most large domestic producers of retail apple juice own
concentrating equipment, as do independent smaller producers. 31/
Reconstitutors are firms that purchase CAJ, dilute it by adding water, and
package single-strength juice into retai 1 size cor1tainers. 32/ Ret:onsti tutors
generally use only imported CAJ; they do not press apples or buy domestic
apple juice in bulk. 33/ [)ottlers are fin11s that iilso package single-strength
apple juice in retail size containers. 34/ Like reconstHutors, they do riot
press fresh apples, but they may purchase domestic juice in bulk containers,
may reconstitute CAJ themselves and retail package some, or may blend
purchased domestic single-strength juice with imported CAJ. 35/
In view of the above, we find that the appropriate domestic industry is
the industry producing apple juice, including single-strength apple juice,
three-strength frozen apple juice concentrate, apple juice concentrate, and
various processed apple juice retail products. This industry includes all
domestic growers of apples since they produce juice apples. We find that
28/ Id. 29/ Id. at ~15 . . 30/ Id. 31/ Id. at A-15. 32/ Id. at A-16. 33/ Id. 34/ Id. 35/ Id.
9
'
10
this industry is producing an article "like" (i.e., substantially identical
to) the imported article or, at the very least, directly competitive (i.e.,
substantially identical or substantially equivalent for commercial purposes).
We do not find it appropriate to subdivide the processing industry into
separate concentrator and retail processor industries as recommended by the
Farm Bureau. All large capacity, CAJ-producirig plants are owned by producers
of domestic apple juice and the act of concentr .. ting is done primarily to
facilitate storage and transportation prior to reconstituting or blending.
We disagree with the position of the Farm Bureau that there is a sep<m•te
juic;e apple growing industry producing an article directly competitive with
imported ,.pple juice at an earlier stage of processing. There is no sep;;u·dte
juice apple industry. As discussed above, grower operations are oriented to
the fresh market where growers sell over half their apples and from which they
derive most of their revenues. For the most part, apples converted into juice
are sort-outs, drops, and leftovers, and are the le .. st significant joint
product of apple production. The producers of juice apples are the producers
of all apples.
Increased imports
Imports of apple juice increased in both actual and relative terms during
the period of investigation. Imports more than doubled, rising from 70
million gallons (single-strength equivalent) in crop year 1900/81 to 196
million gallons (single-strength equivalent) in crop year 1984/85. 36/ The
I§/ Report at A-24.
10

11
ratio of imports to production also rose sharply, from 38 percent in crop year
1900/01 to 124 percent in crop year 1904/05. 37/ Thus, lhe first of the three
statutory criteria is clearly satisfied. 38/
No serious injury or threat to the domestic appl'!..Juice producing industry
The Trade Act does not define the term "serious injury or threat
thereof," but instead directs the Commission's attention to certain economic
factors. Gpeci fically, section 20l(b)(2) requires that the Commission, in
addressing the question of serious injury or lhreal, lake into account all
economic factors that it considers relevant, including (but not limited to)·-
(A) with respect to serious injury, the significant idling of production facilities in the industry, the inability of a significant number of firms lo operate al a reasonable level of profit, and significant unemployment or underemployment within the industry;
(B) with respect to threat of serious injury, a decline in sales, a higher and growing inventory (whether maintained by domestic producer-s, impor·ters, wholesalers, or retailers) and a downward trend in production, profits, wages, or employment (or increasing underemployment) in the domestic industry concerned . . . .
Section 201(b)(2)(D) states that the presence or absence of any of these
factors is not necessarily dispositive of the injury question.
In determining whether the domestic apple juice processing industry is
seriously injured or threatened with serious injury, we examined the condition
of the' entire industry. The industry is comprised of several segments.
Because it was not feasible to aggregate data for the different segments, we
were obliged to discuss such data separately.
37_1 Id. 38/ Inasmuch as the.actual volume of imports increased, Commissioner
Brunsdale finds it unnecessary to decide whether an increase in impor·ts relative to domestic productior1 is sufficient alone to meet the first of the statutory c.ri teria.
11

12
We fo<:•Jsed primarily on data supplied by, or involving, two segments of
the apple juice industry-··apple juice processors and all apple growers. While
concentrators, reconstitutors, bottlers, and other facilities are also
involved in the production of apple juice and are part of the industry,
processors and growers together account for an estimated 85 percent of
domestic industry resources, as measured in terms of value added to the
product. Where appropriate we have cited data on these other segments of the
industry. As the discussion below makes clear, data for apple growers largely
paralleled the data for domestic apple juice processors.
Apple juice processor~. Domestic apple juice processors account for
about two thirds of productive resources in .the domestic apple juice
industry. The processors are facing economic difficulties, but are not
seriously injured or threatened with serious injury. Domestic apple juice
production has remained relatively constant in recent years, and recent
production is considerably above that of the late 1970's. As eKpected,
however, production has varied somewhat from year to year. Production peaked
at 182 million gallons in crop year 1980/81, a record year for domestic
production of apples (including juice apples). 39/ It then declined to 153
million gallons in crop year 1981/82, in~reased slightly to 154 m~llion
gallons in 1982/83, increased further to 169 million gallons in 1983/84, and
declined again to 158 million gallons in 1984/85 and an estimated 153 million
gallons in 1985/86. 40/ Annual domestic juice production averaged slightly
39/ Id. at A-24, A-32. All figures used in this paragraph are in terms of single-strength equivalent.
40/ Id. at A-·44.
12

13
over 100 million gallons in the late 1970's. 1.V Prices paid for both fresh
apples and juice apples have been relatively stable in recent years. 42/
The capacity of reporting U.S. producers to press juice apples has also
been fairly constant in recent years and was about 5 percent higher in crop
year 1985/86 than in 1981/82. 43/ Capacity utilization by these producers has
fluctuated, peaking at 59 percent in 1903/04, but it declined to 44 percent in
1985/86 in part due to increases in capacity. 44/
The capacity of reporting CAJ producers al so rose during the period, from
51 million gallons in 1981/82 to 59 million gallons in 1985/86 (all figures
are in single-strength equivalent). 45/ The utilization rate for producers of
domestic CAJ declined sharply from 26 percent in 1981/82 to 13 percent in
1902/83, but it has increased progressively since then to 17- percent in
1985/86. 46/
According to USDA data, domestic juice producers processed a fairly
constant 21 to 24 percent of domestic apples into juice during the most recent
6 years, which was up from an average of 18 percent during the 1970's. 47/
Capacity utilization data for domestic apple juice producers would have been
41/ Id. at A-24. 42/ Id. at A-71. 43/ Id. at A-30. Chairwoman Stern and Commissioner Orunsdale note that
capacity utilization has been fairly low because domestic concentrators convert juice into concentrate to lower storage costs, not for the purpose of exporting it. Almost all domestically produced apple juice is consumed domestically. Less than 1 percent of domestic production is Eixported. Id. at A-29.
44/ Report at A-··44. Capacity utilization figures are based on assumptions which do not necessarily reflect practical levels of capacity utilization. The trends in utilization levels are more instructive than actual utilization levels.
45/ Report at A-39. 46/ Id. at A-44. 47/ Id. at A-33.
13

14
higher if processors had not increased capacity. These data tend to discount
any severe contr·action in the utilization of facilities in this segment of the
indus Lry.
It appears that at least 17 domestic apple juice processing facilities
ceased pressing domestic juice apples and/or producing CAJ during the period
1981-85. '48/ However, these closings tended to involve smaller,
non-integrated plants. Several new plants have opened in recent years, as is
indicated by the data showing increasing capacity, relatively steady apple
juice production, and relatively steady capacity utilization levels. 0dta
indicate that processors in recent years have channeled an increasing
percentage of their domestically produced juice into the higher-priced fresh
juice market and away from the concentrated-reconstituted juice market. '49/
Net sales for reporting domestic producers of apple juice rose by almost
'40 percent between 1982 and 1905, and gross profits (net sales less cost of
goods sold) rose by a similar percentage during the same period. 50/
Operating income for these producer·s was positive throughout the period, and
1985 operating income was the highest since 1982. 51/ These firms reported
net losses in 3 of the 4 reporting years largely as a result of sharply rising
interest and depreciation expenses. 52/ Tree Top, one of the largest do111estic
48/ Id. at A-30. '49/ Id. at A-'42. As stated above, all large domestic CAJ facilities are
ow~d by domestic apple juice processors. Processors increasingly have elected to sell their domestically produced juice in the fresh juice market rather than converting it into concentrate. Instead, their concentrate needs are met by imports. The quantity of sirigle-strength apple juice produced by these firms has remained relatively constant over the last 5 years. During the first half of the most recerit crop year, the amount of juice processed increased significantly over the year earlier period. Id.
5Q/ Report at A-60. 51/ Id. 52/ Id.
14

15
processor ]3/ did not supply data e1nd opposed the gre1nting of relief. 54/
Employment in r·eporting domestic facilities producing apple juice
products increased from 547 persons in 1981 to 707 persons in 1984 before
'declining to 614 persons in 1985. 2_~/ Total wages paid also increased, except
in 1985. 56/
Inventories of reporting firms of domestically produced apple juice were
3.3 million gallons e1s of yearend 1981 (June JO) 57/ and increased to 4.7
million gallons for· 1982. Thereafter·, from 1982 to 1985 inventories never
fell below 4.3 or rose above 5.4 million gallons. This represented about 20
percent of each year's production. 50_/ Inventories of apple juice held by
importers fluctuated over the past 5 years in question, but appear to have
trended downwar·d. 59/
In summary, domestic apple juice production and processor capacity,
capacity utilization, inventories, financial performance, and employment have
all remained relatively constant in recent years. While the processor segment
of the processing industry is facing economic difficulties, these difficulties
53/ Id. at A-60. 54/ Another large processor, Cadbury Schweppes, which entered the industry
in 1982 by acquiring the facilities of Duffy-Mott, was also opposed to the granting of relief. The data that Cadbury Schweppes supplied were of limited use in view of a recent acquisition and reorganization. It should be noted that firms accounting for about two thirds of domestic apple juice processing either did not favor the granting of relief or expressed no position on the issue. The request for r·elief was supported by firms accounting for about one third of domestically produced apple juice.
55/ Report at A-·51. 56/ !.~. 57/ Id. at A-45 . . ?0/ Id. 59/ Id. at A-62.
15

16
are not of such magnitude as to constitute serious injury. In addition,
present trends do not suggest a worsening of conditions in the foreseeable
future or the threat of serious injury in the absence of present serious
injury.
f\pple growers. Entry into the commercial apple-growing business is
capital intensive and requires a long-term commitment by the grower. Persons
entering the business do so primarily for the purpose of growing apples for
the higher-priced fresh market, which has accounted for about 55 percent of
grower sales (in terms of quantity) and an estimated 75 percent of grower
revenues in recent years. Like domestic processors, domestic apple growers
are also facing economic difficulties but are not seriously injured or
threatened with serious injury.
Domestic apple production and the share of domestic apples utilized in
juice production have remained relatively constant in recent years. Domestic
apple production declined from its record high level of 8.83 billion pounds in
crop year 1980/81 to 7.75 billion pounds in 1981/82, but increased irregularly
to 8.29 billion pounds in 1984/85 (all figures are in terms of fresh
weight) . 60/
The quantity of apples consumed in juice production declined from 2.14
billion pounds (fresh weight) in 1980/81 to 1.80 billion pounds in 1981/82,
but increased irregularly to an estimated 1.88 billion pounds in 1985/86. 61/ ..
The share of total apple production utilized in juice production has remained
a relatively constant 21-24 percent in recent years, which is significantly
higher than the average of 18 percent utilized in juice production during the
1970's. 62/
60/ Id. at A-32. £1/ Id. at A-33. 62/ .Id.
16

17
While the estimated number of juice apples not gathered or harvested has
increased in recent years, 63/ at the same time the volume and value of juice
apples processed into juice has increased. In addition, the number of a..:res
of producing apple trees has increased in recent years. The USDA reported
that the total area planted to apples increased 6 percent between 1978 and
1902. 64/ These new plantings replace older, poorer yielding trees with
younger, higher yielding ones. The plantings also mean replacements with
dwarf trees that allow for more densely planted orchards, increasing overall
yields for the orchard. 65/ Furthermore, domestic apple production is
expected to increase significantly by 1990 over present levels. 66/
Employment data gathered from a sampling of 80 domestic growers suggest
that employment in apple growing operations (including production of juice
apples) remained relatively constant during the most recent 5-year
period. 67 I Employment and hours worked trended upward in several
categories. 68/.
Juice apples, while constituting an average of about 22 percent of the
total apple crop, constitute only about 10 percent of the value of that
crop, 69/ and thus have a relatively small effect on the profitability of
overall apple growing operations. Financial data received from domestic apple
growers suggest that sales of both all apples and juice apples rose during the
period 1981-04. JOI Although many apple growers reported that they operated
63/ Id. at A-34. 64/ Id. at A-0-9. 65/ Id. at A-00. 66/ Id. at A-34. 67/ Id. at A-49. 68/ Id. 69/ Id. at A-52. Data for 1905 are not wholly comparable because not all
firms furnishing data for the earlier years were able to supply 1985 data. Z.9./ Report at A-55-56.
17

18
at a loss on their overall apple operations, 71/ losses appear to hctve
preceded the surges in imports in 1903 and 1985 and do not appear to correlate
with them. 72,,I We do not consider losses on overall apple growing operations
sufficient evidence of serious injur·y to the domestic industry producing apple
juice.
Inventories of all apples and juice apples of reporting U.S. growers'
fluctuated during the period in question. Grower inventories as of December
31 have trended upward, but March 31 inventories, which reflect stocks after
most of the crop from the previous fall has been sold off, have remained
constant in the last 3 years. 73/
In summary, grower· operations are oriented to the fresh apple market
where growers sell over half their apples and from which they derive most of
their revenues. Domestic production, sales, producing acreage, inventories,
and employment in the apple grower segment of the apple juice producing
industry have been either relatively constant or increasing in recent years.
While financial data for some domestic growers indicate that they h<>ve
experienced difficulties, we do not find that they are seriously injured. In
addition, trends do not suggest that lhey are threatened with serious injury.
Causation 74/
We note that even if we had determined that the apple juice producing
71/ Id. 72/ J..g. at A-52. 73/ Id. at A--40. 74/ Since the Commission has not found the industry seriously injured or
threatened with serious injury, Commissioner Brunsdale finds it inappropriate to address the issue of causation. She acknowledges that the apple grower segment of the industry is comprised of geographical pockets of growers and that these pockets have had a variety of experiences over the past several years. While growers in some regions, particularly Washington State, have done well, .other growers have experienced difficulties. These difficulties do not, however, support a conclusion that lhe grower segment, on a national basis, is seriously injured.
18

19
industry is seriously injured, we would not have found that imports were the
substantial cause of serious injury. Any such economic difficulties are
concentrated in the grower segment of the industry. As we have noted, the
driving force behind the grower's decision to enter or expand production is
the return on sales in the fresh apple market. To the extent that importers
of juice have affected over-all operations, that impact has been limited to a
narrow source of grower revenues··--j uice apple sa Les. Oased on l i1ni tod
questionnaire data for large grower·s, about 10 percent of revenues for large
growers comes from juice apple sales; for smaller growers, the share tends lo
be slightly higher.
Other problems unrelated to imports of juice are affecting the overall
performance of the growers of apples. Although we do not find that domestic
apple growers as a whole are seriously injured or threatened with serious
injury, it appears that growers in some regions of the country are
experiencing greater difficultlties than growers located in other regions.
Washington State growers, who account for 35 percent of all domestic apple
production, have doubled their sales and production of fresh market apples in
the past 12 years. 75/ A further expc1nsion of around 50 percent is projected
by 1990. To some extent they have displaced apples produced in other regions
of the country and in so doing, may have advers Ly af'fec tad growers in those
other regions. For example, they have displaced apples from other regions in
the fresh market and caused those apples to be sold in the less profitable
canning and juice apple markets. 76/
?_?./ Table ci.rcu lated by the Office of Investigations, May 20, 1986. 76/ Only 15 percent of Washington State apples have been utilized in 1u1ce
production in recent years, but an estimated 46 percent of California apples, 36 percent of Michigan apples, and 29. percent of N<>w York apples were or will be utilized in juice dur-ing crop year 1985/86. In the mid-1970' s a significantly smaller percentage of the apple production of those states W<>s utilized in juice.
19

20
As the result of these trends as well as generally increasing production
trends, more domestic apples, once destined for lhe higher-return fresh
market, must now be marketed as canned or juice apples by some growers. A
reduction in the percentage of apples sold in the fresh market will adversely
affect returns on a grower's overall apple production. Thus, the difficulties
that some growers are experiencing also appear to be related to changing
competitive conditions in the fresh market.
finally, it should be noted that domestic apple juice consumption could
not have risen by the 40 percent that it has in recent years without
significant imports of foreign juice ur1less domestic apples had been diverted
from the fresh market.
20

21
VIEWS OF VICE CHAIRMAN SUSAN W. LIEBELER
Apple Juice, Inv. No. TA-201-59
I concur with the majority that apple juice, not mixed
and not containing over 1 percent ethyl alcohol by volume,
is not being imported into the United States in such
increased quantities as to be a substantial cause of
serious injury, or the threat thereof, to the domestic
industry producing an article like or directly competitive
with the imported article.
1 section 201 of the Trade Act of 1974 authorizes the
International Trade Commission (•commission•) to recommend
temporary import relief, under certain circumstances, to
domestic industries. The Commission begins a Section 201
investigation by defining the domestic industry. It then
inquires whether three statutory requirements are met:
(1) Have the foreign products under investigation been
imported in increased quantities? (2) Is the domestic
1 19 u.s.c. § 2251 (1982).
21

-22-
industry seriously injured or threatened with serious
injury? (3) Are the increased imports a substantial cause
of the injury or the threat of injury? Only if the
commission answers all three questions affirmatively can
it consider the question of remedy. I consider these
matters in turn.
I. Like Product and Domestic Industry
The imports in this investigation consist of apple
juice, not mixed and not containing over one percent ethyl
alcohol by volume. Almost all the apple juice imports
under investigation come into the country in the form of 2
six-strength concentrate.(CAJ) Once here, the
concentrate is diluted with water. It may also be blended
with domestic juice.
Section 201 defines the domestic industry as the
domestic producers of "an article like or directly
2 Staff Report at A-24.
2
22

-23-
3 competitive with" the imported article. In the
legislative history of Section 201, the Senate Finance
Committee explained that:
"like" articles are those which are substantially identical in inherent or intrinsic characteristics (i.e., materials from which made, appearance, quality, texture, etc.), and "directly competitive articles" are those which, although not substantially identical in their inherent or intrinsic characteristics, are substantially equivalent for commercial purposes, that is, are adapted to the same uses and are
4 essentially interchangeable therefor.
There is no question that the imported apple juice, even
though it comes into the country in concentrated form, is
like or directly competitive with domestic apple juice.
Single-strength juice made from U.S. apples or from
domestic CAJ is substitutable for single-strength juice
5 made from imported CAJ. A simple processing procedure
turns the imported concentrate into apple juice which is
•substantially identical* to the domestic product.
3 19 u.s.c. § 225l(b) (3) (1982).
4 s. Rep. No. 1298, 93rd Cong., 2d Sess. 122 (1974).
5 CAJ is used to make 100 percent apple juice products
and other products in which apple juice is only one ingredient.
3
23

-24-
When determining the proper definition of the domestic
industry, the Commission traditionally has considered the
industry to include all the facilities involved in the 6
production of the product. When several stages are
involved in the production of an article, it has
considered the industry to include the facilities involved 7
in the various stages to be part of the industry.
I have identified two basic groups of domestic
productive resources involved in the production of apple
juice: growers and processors. The apple growing farms
produce as a residual product the juice apples that are 8
subsequently pressed into domestic juice. It would be
incorrect to define the domestic industry solely in terms
of growers' juice apple operations. Domestic apple juice
6 ~, Certain Canned Tuna Fish, Inv. No. TA-201-53,
USITC·Pub. No. 1558 (1984), at 5-7; Unwrought Copper, Inv. No. TA-201-52, USITC Pub. 1549 (1984) at 7-8.
7 Id.
8 Some JU1ce operations are more complicated. The juice
may be evaporated and formed into concentrate. Later, just like the foreign concentrate, the domestic concentrate may be reconstituted into apple juice.
4
24

-25-
is made from juice apples, which traditionally are
sort-outs, tree-run fruit, weather damaged fruit, 9 10
drops, and leftovers from other grades. Few
growing operations are dedicated to juice apples. Almost
all grower operations are dedicated to growing the most
profitable apples -- fresh apples and peelers for 11
canning. Juice apples are accidents of nature and
growers try to avoid production of such fruit. It would
be bizarre indeed to have a •domestic industry" that
consisted of articles no one intended to produce.
Thus, the productive facilities involve the entire
apple growing operation, not just juice apples. The
productive facilities for apple growing are common to
juice, canned, and fresh apples. Trees are planted,
watered, fertilized, sprayed, and picked using common
production factors. The sorting of fruit also involves
9 Drops are apples that fall or are accidentally knocked
to the ground during harvesting by pickers. Staff Report at A-2.
10 Id.
11 See generally Staff Report at A-1-3.
5
25

-26-
12 common production factors. Consequently, the correct
analysis is to view apple growing operations in their
entirety as one component of a domestic apple juice
industry.
The second component of the apple juice industry
consists of the processors who produce apple juice from
apples and concentrate. The different types of processors
will be examined in turn.
There are various methods by which apple juice is
produced. Most broadly, it is produced directly from
pressing apples, from mixing water with concentrate, or a
combination of the two. Members of the processing sector
include cider mills and other producers of fresh
single-strength (not pasteurized) apple juice and 13
producers of pasteurized apple juice. There are about
25 large firms known to the Commission that account for
12 The only significant exception to this common use of
production factors occurs in the harvesting of drops, but this accounts for only a minor proportion of the overall expenses incurred by the grower.
13 Staff Report at A-12.
6
26

-27-
75-80 percent of the total domestic production of apple 14
juice.
There are also processors making CAJ by dehydrating
and concentrating single-strength juice in evaporators.
Concentrating is done to reduce storage and transportation
costs. During 1981-85, at least 16 U.S. firms produced or 15
had the capacity to produce CAJ. Most large producers
of domestic apple juice own concentrating equipment.
currently, large capacity CAJ-producing plants are owned 16
by large producers of domestic apple juice.
Reconstitutors are firms that purchase CAJ, dilute it
by adding water, and package single-strength reconstituted
juice into retail size containers. Reconstitutors 17
generally use only imported CAJ.
Bottlers are firms that also package single-strength
apple juice in retail size containers. Bottlers, however,
14 Staff Report at A-15
15 Staff Report at A-15
16 Staff Report at A-15-16
17 Staff Report at A-16
7 27

-28-
may purchase domestic juice in bulk containers,
reconstitute CAJ themselves, or blend purchased domestic
juice with imported CAJ.
The domestic industry includes all these processors as 18
well as the growers. Petitioner argues that the
Commission should find multiple industries, including one 19
comprised of only juice apple growers. Petitioner
asserts that the like product is six-strength concentrate
and the producers thereof comprise a separate industry.
Petitioner then argues that there are two other domestic
industries, juice apple growers and U.S. producers of
retail processed juice, which are directly competitive
with the imported concentrate.
Respondents argue that apples are not directly
18 The term "petitioner" is used herein to refer to those
supporting the petition.
19 Preliminary Submission to the International Trade
Commission on the Domestic Industries to be Examined in Inv. TA-201-59 (Apr. 11, 1986), at 1.
8
. .
28

-29-20
competitive with apple juice concentrate. They also
state that the Commission has not found one integrated
industry where the raw product and the processing sector
do not exhibit substantial economic interdependence as 21
well as substantial interlocking ownership. Finally,
Respondents, arguing in the alternative, note that "to the
extent that apple growers are considered at all, the
Commission must examine their total operations, including 22
apples sold for the fresh market and for canning.
Both Petitioner and Respondents cite Section 601(5) of
the Trade Act of 1974 in support of their arguments. This
section provides that
20
an imported article is "directly competitive with" a domestic article at an earlier or later stage of processing and a domestic article is "directly competitive with" an imported article at an earlier or later stage of processing, if the importation of the article has an economic effect on producers of the domestic article comparable to the effect of
Posthearing brief submitted on behalf of Apple Juice Group of the Association of Food Industries, Inc., at 9 (Apr. 24, 1986).
21 Prehearing brief submitted on behalf of Apple Juice
Group of the Association of Food Industries, Inc., at 10-11.
22 Id. at 12.
9
29
-30-
importation of articles in the same stage of 23
processing as the domestic article.
Petitioner notes that "the effect upon domestic growers of
juice apples is the same regardless of whether imports
enter in the form of juice apples or in the form of
24 six-strength concentrate.• Petitioner also argues
that reconstitutors and concentrators of non-six strength
concentrate are harmed to the same degree as the domestic 25
producers of CAJ. Petitioner concludes that products
which meet the "directly competitive" test are entitled to
their own industry definition except under extraordinary 26
circumstances.
The statute provides that the commission should
assess injury against •the domestic industry producing an
article like or directly competitive with the imported 27
article." There is no discretion to find more than
23 19 u.s.c. § 2481(5) (1980).
24 Id. at 10.
25 Id. at 11-12.
26 Id. at 20-26.
27 19 u.s.c. § 225l(b) (1) (1980) (emphasis added).
10
'
30

-31-
one industry if there is only one imported article. Thus,
all producers of articles like and directly competitive
are aggregated into one industry. I am not persuaded by 28
Commission decisions that may be to the contrary.
Petitioner cites United Shoe Workers of America v. 29
Bedell, as support for the proposition that the
Commission has the authority to find multiple industries.
I do not find this argument persuasive.
Bedell and its progeny stand for the proposition
that component parts manufacturers are not entitled to
adjustment assistance even if they are put out of business
because of the importation of finished products. These
cases were decided under Section 223(3) of the Trade Act 30
of 1974 and its predecessor which contain language
substantially identical to that at issue here. Under the
trade adjustment assistance program, workers may be
28 See, e.g., Mushrooms, Inv. No. TA-201-43, USITC Pub.
No. 1089 (1980), at 6-14.
29 506 F.2d 174, 185-86 (D.C. Cir. 1974)
30 19 u.s.c. § 2272(3) (1980).
11
31

-32-
certified as eligible for adjustment assistance, if in
addition to meeting other criteria, "increases in imports
of articles like or directly competitive with articles
produced by such workers' firm . . . contributed
importantly to such total or partial separation" of the 31
worker from the firm. As noted earlier, Section 201
refers to "the domestic industry producing an article like 32
or directly competitive with the imported article."
These cases raise a serious question whether growers
have standing in an escape clause case. They do not
indicate that more than one industry can be found when a
directly competitive article is present. For instance, in 33
Gropper v. Donovan, petitioners made finished fabric.
Increased imports of garments (the result of assembling
finished fabric) reduced the demand for domestic finished
fabric and allegedly caused petitioner to close. Trade
adjustment assistance was denied by the Secretary of Labor
because the petitioner's product was
31 Id.
32 19 u.s.c. { 225l(b) (1) (1980).
33 569 F. Supp. 883 (Ct. Int. Trade 1983).
12
32

-33-
not like or directly competitive with the imported
product. The court found that these products were not
interchangeable with nor substitutable for the downstream 34
product. It is possible that under this line of
cases, decided on the basis of statutory language and
legislative history directly relevant to our own statutory 35
mandate, the juice apple growers might not be eligible
for adjustment assistance due to increased imports of 36
apple juice in any form. As the court noted in
Morristown Magnavox Former Employees v. Marshall,
34
Congress has made a policy decision and drawn a line; our duty is to give the language of the statute a meaning that will carry out that policy.
see also Holloway v. Donovan, 585 F. Supp. 1427 (Ct. Int. Trade 1984) (car parts not like or directly competitive with cars); Morristown Magnavox Former Employees v. Marshall, 671 F.2d 194 (6th Cir. 1982) (TV components not like or directly competitive with imported TV's).
35 The decisions with respect to adjustment assistance
were formerly made by the Commission. The language governing the required industry definitions are based in the escape clause. See, e.g., Gropper v. Donovan, supra note 33, at 886. Congress was aware of the Bedell decision when it amended section 201 in 1974. s. Rep. No. 1298, 93rd Cong., 2d Sess. 122 (1974).
36 I do not off er an opinion on the outcome of such a
case.
13
33

-34-
The result may appear harsh in this day of high unemployment and rising cost of living, but the remedy for congressional policies that do not extend beyond lawful bounds is in the legislature. * * * The restriction in the bill of such adjustment to job loss resulting from competition of "like or directly competitive" products has been repeatedly criticized and debated in Congress. But to date all proposals to eliminate or mitigate these two restrictions have been defeated.
Nonetheless, I do not concur with the argument of
Respondents that apple growers have no standing. As noted
earlier, the Commission often includes all the domestic
facilities involved in the production of the like or
directly competitive product. Such an analysis makes
37 sense. Moreover, whether a particular component or
raw material is directly competitive with an imported
product is a factual determination left to the
Commission. Although it is a close call as to whether
finding growers directly competitive with imported
concentrate would comport with the case law in this area,
I am persuaded that such a finding is defensible based on
37 The amount of vertical integration in the United
States does not persuade me one way or the other on whether a domestic product is like or directly competitive with an import.
14
34

-35-
38 Commission practice. Thus, even though I have
reservations about whether the growers have standing under
Bedell, I choose the economically meaningful
interpretation and include the growers within the industry
producing the like or directly competitive product.
As indicated above, I conclude the apple growers are
properly included within the domestic industry as part of
the domestic productive resources employed in the
production of the like or directly competitive article.
This provides juice apple growers with an opportunity to
seek relief under the statute. Having defined the
domestic industry, I turn next to the question of
increased imports.
II. Increased Imports
The statute requires the Commission to *determine
whether an article is being imported into the United
38 There does not appear to be a way to determine whether
a more liberal definition of directly competitive would withstand judicial scrutiny. Any petitioner of a
(Footnote continued to page 16)
15
35

-36-
states in such increased quantities as to be a substantial 39
cause of serious injury, or the threat thereof ..• "
If the Commission finds that imports have not increased, 40
it may not recommend any remedy.
Several Commission opinions suggest that the
"increased quantities" requirement can be satisfied by an 41
increase in the market share of imports. This
(Footnote continued from page 15) component part granted adjustment assistance would not appeal. It is unlikely that anyone else would have standing to raise the issue.
39 19 u.s.c. § 225l(b) (1) (1982) (emphasis added).
40 19 u.s.c. § 225l(d) (1) (1982).
41 See,~·· Nonrubber Footwear, Inv. No. TA-201-55,
USITC 1717 ((July 1985) (hereinafter cited as Nonrubber Footwear; Views of Chairwoman Stern at 11-12; Views of Commissioner Lodwick at 81-82; Views of Commissioner Rohr at 95; Views of Commissioner Eckes at 60); Stainless Steel and Alloy Tool Steel, Inv. No. TA-201-48, USITC Pub. No. 1377, at 16 (1983); Sugar, Inv. No. TA-201-16, USITC Pub. No. 807, at 11 (1977); Unwrought copper, Inv. No. TA-201-52, USITC Pub. No. 1549, at 829 (1984) (Views of Commissioners Eckes, Lodwick and Rohr) (hereinafter cited as Copper); Certain Canned Tuna Fish, Inv. No. TA-201-53, USITC Pub. No. 1558, at 8 (1984) (Views of Commissioners Eckes, Lodwick and Rohr) (hereinafter cited as Tuna); Potassium Permanganate, Inv. No. TA-201-54, USITC Pub. No. 1682, at 6-7 (1985) (Views of Chairwoman Stern and Commissioners Lodwick and Rohr) (hereinafter cited as Potassium Permanganate);
In response to a question by then-Chairman Eckes at (Footnote continued to page 17)
16
36

-37-
interpretation is contrary to the clear language of the
statute and the intent of Congress. The statute uses the
phrase "increased quantities." The word quantity, in its
normal use, refers to an amount and carries no connotation 42
of relativity. When Congress wanted the Commission to
consider the relative market share of imports, it used 43
precise language to convey that intent. Later in
(Footnote continued from page 16) the hearing for Carbon Steel, the petitioners were unable to cite a single case in which the Commission made an affirmative injury determination where imports had not increased absolutely. Despite this lack of precedent, however, the Commission majority in Carbon steel made affirmative determinations with respect to plates and structural shapes and units even though imports of both products had declined. (I made negative determinations with respect to both product groups because they failed the increased imports requirement. carbon Steel, at 145, 153 (Views of Vice Chairman Liebeler) .)
42 In 1984 former Commission Vice Chairman Michael J.
Calhoun testified that his prior interpretation of "increased quantities" was erroneous and that Section 201 requires an absolute increase in imports. Import Relief for the U.S. Non-Rubber Footwear Industry: Hearing Before the Subcommittee on International Trade of the Senate Committee on Finance, 98th Cong., 2d Sess. (June 22, 1984).
43 See, ~., Section 406 of the Trade Act of 1974, 19
u.s.c. § 2437(e) (2) (1982) ("Market disruption exists within a domestic industry whenever imports of an article, like or directly competitive with an article produced by such domestic industry, are increasing rapidly, either absolutely or relatively, so as to be a significant cause
(Footnote continued to page 18)
17
37

-38-
Section 201, for example, it provided that the Commission
can examine both the absolute and relative increase in
imports to determine whether the increased quantity of 44
imports is a substantial cause of serious injury.
Thus, the statute provides clear support for the position 45
that imports must be increasing absolutely.
Imports of apple juice enter under TSUS item 165.15,
which covers both apple and pear juice. Apple juice makes
up the large majority of items entering under this item
(Footnote continued from page of material injury, or threat industry.") (Emphasis added).
44
17) thereof, to such domestic
19 u.s.c. § 225l(b) (2) (C) (1982). For example, a given absolute increase will normally have a larger impact in a shrinking market than in a growing market.
45 The legislative history also supports this
interpretation. The Senate Report on the Trade Act of 1974 distinguished between the finding of increased imports and causation. According to the Senate Committee: "An industry must be seriously injured or threatened by an absolute increase in imports, and the imports must be deemed to be a substantial causec:lf the injury before an affirmative determination should be made." S. Rep. 1298, 93rd Cong., 2d Sess. 121 (1974). (Emphasis added.) We offer this reference to the legislative history because the majority cites a different position to support their "relative increase" position. The legislative history is mixed and only relevant if the statute is ambiguous. The statute is not ambiguous and thus the legislative history is not relevant on this point.
18
•
38

-39-46
and nearly all is imported in concentrated form. In
order to evaluate whether an absolute increase in imports
has occurred, the period under investigation must be
determined. Typically in a section 201 case, the
Commission looks at data for the last five years. Imports
of juice increased from 70 million gallons in crop year 47
1980/81 to 209 million gallons in 1984/85. Imports
also increased from 113 million gallons in July
1984-January 1985 to 120 million gallons in July
1985-January 1986. Therefore, this criterion of the
statute is met.
III. Serious Injury and Threat of Serious Injury
A. Definition
Section 201 requires that the injury or threat to
the industry be serious in order for relief to be
granted. Although serious injury plays an important role
46 Staff Report at A- 24.
47 The crop year extends from July 1 of one year to June
30 of the following year.
19
39

-40-
in a Section 201 investigation, the statute does not
define the term. Instead, it lists several factors that
are evidence of serious injury:
the significant idling of productive facilities in the industry, the inability of a significant number of firms to operate at a reasonable level of profit, and significant unemployment or underemployment
48 within the industry.
The legislative history only reiterates what is in the statute,
and emphasizes that the enumerated factors are only evidence of
49 injury and thus no single factor is dispositive.
48 Sections 20l(b) (2) (A) and (B) of the Trade Reform Act
of 1974, 19 u.s.c. § 225l(b) (2) (A) and (B) (1982).
49 s. Rep. 1298, 93rd Cong., 2d Sess. 121 (1974). In
addition, the commission may take into account any other economic factors it considers relevant. 19 u.s.c. § 225l(b) (2) (1982). The 1984 amendments to section 201 added a subsection which addresses the relevant weight to be accorded the factors:
[T]he presence or absence of any factor which the Commission is required to evaluate in subparagraphs (a) and (b) shall not necessarily be dispositive of whether an article is being imported into the United States in such increased quantities as to be a substantial cause of serious injury or threat of serious injury to the domestic industry. Trade and Tariff Act of 1984, 19 Stat. 2999 (amending 19 u.s.c. § 225l(b) (2) (D) (1982)). Section 20l(b) (7), as amended by the 1984 Act, defines the phrase
(Footnote continued to page 21)
20
40

-41-
Serious injury is obviously a much stricter standard than
the material injury standard used in Title VII investigations.
The degree of severity that Congress intended when it used the
term "serious" was described in the Report of the Senate
Finance Committee:
For many years, the congress has required that an "escape clause" be included in each trade agreement. The rationale for the "escape clause" has been, and remains, that as barriers to international trade are lowered, some industries and workers inevitably face serious injury, dislocation and perhaps economic extinction. The "escape clause" is aimed at providing temporary relief for an industry suffering from serious injury, or the threat thereof, so that the industry will have sufficient time to adjust to the freer
50 international competition.
The Commission has defined serious injury in past
investigations as "an important, crippling, or mortal injury,
(Footnote continued from page 20)
50
•significant idling of productive facilities" as "the closing of plants or the underutilization of production capacity". Id. (amending 19 u.s.c. § 2251(b) (7) (1982)).
s. Rep. No. 1298, 93d Cong. 2d Sess. 119 (1974). (Emphasis added.) It is also worth noting that the Committee in proposing to relax the standards for "escape clause" relief decided to weaken the causation standard, rather than change the serious injury standard.
21
41

·-42-51
one having permanent or lasting consequences." In
determining whether there is threat of serious injury, the
Collllllission must consider:
51 See, ~., Electric Shavers, Inv. No. TA-201-57, USITC
Pub. 1819 at 8 (1986); Bolts, Nuts and Screws of Iron or Steel, Inv. No. TA-201-2, USITC Pub. 747 at 19 (1975) (Views of Commissioner George Moore). I regard this definition as consistent with a "major contraction of a domestic industry or its extinction." The use of the term "serious injury" in the same phrase as "extinction" suggests that "serious injury", if not strictly limited to economic extinction, is something very close. See Nonrubber Footwear, at 32 (1985) (Views of Vice Chairman Liebeler) ; Potassium Permanganate, at 20 (Views of Vice Chairman Liebeler).
I direct my inquiry toward the viability of the industry instead of the factors of production only after a careful analysis of the Act as a whole. The statute directs the Commission to determine whether increased imports are a substantial cause of serious injury "to a domestic industry producing an article like or directly competitive with the imported article." 19 u.s.c. § 225l(b) (1) (1982) (emphasis added). Thus, Congress, in enacting Section 201, was concerned with the effect of imports on domestic industries, rather than on those who provide labor and capital to individual firms. This interpretation is not weakened by the statutory requirement that the Commission consider unemployment and the profitability of firms. Such factors are indicia of injury to an industry. Furthermore, the use of the terms "industry" and "producer" or "firm", sometimes in the same sentence and in opposition to one another, see, ~., 19 u.s.c. § 225l(b) (3) (A) (1982) ("The Commission may, in the case of a domestic producer which also imports, treat as part of such domestic industry only its domestic production."), makes it clear that Congress did not equate the returns to the firms and workers with the existence of
(Footnote continued to page 23)
22
42

-43-
a decline in sales, a higher and growing inventory, and a downward trend in production, profits, wages, or employment (or increasing underemployment) in the domestic industry concerned. . . . and all [other] factors which it considers
52 relevant."
The legislative history states that, by threat of serious
53 injury, Congress meant injury that is clearly imminent.
The Commission traditionally requires that the threat be real
rather than speculative and that serious injury be highly
(Footnote continued from page 22) the industry. Finally, the House Report on the Trade and Tariff Act of 1984, which amended several provisions of Section 201, underscored congressional concern with the viability of the industry. It declared that, in assessing the condition of the industry, the commission should not treat the industry's profit data as dispositive, but should also give careful consideration to plant closings and employment trends. H. R. Rep. No. 1156, 98th Cong., 2d Sess. 142 (1984). An industry may be profitable in an accounting sense, even though it is shrinking or dying. If the providers of capital are earning what they could earn in their next best use (i.e., their opportunity costs), and if barriers to entry and exit in the industry are low, then plant closings and employment trends may indicate a contracting or dying industry. See my discussion of serious injury in Carbon Steel, at 135-36 (Views of Vice Chairman Liebeler).
52 19 u.s.c. § 2251 (b) (2) (1982).
53 The Senate Finance Committee's Report on the Trade Act
of 1974 states that "[i]t is the intention of the Committee that the threat of serious injury exists when serious injury, although not yet existing, is clearly imminent if import trends continued unabated." s. Rep. 1298, 93d Cong., 2d Sess. 121 (1974).
23
43

-«-54
probable in the foreseeable future.
B. Is the Domestic Apple Juice Industry Seriously Injured?
1. The Growers
Since the bumper harvest of crop year 1980/81, domestic 55
production of all apples has been relatively stable.
Production totaled 8.8 billion pounds in crop year 1980/81, 7.8
billion pounds in crop year 1981/82, 8.1 billion pounds in crop
year 1982/83, 8.4 billion pounds in crop year 1983/84, and 8.3 56
billion pounds in crop year 1984/85. This represents a
decrease in production since 1980/81 of only around 6 percent.
Thus, there is no indication that the grower sector is 57
suffering a "significant idling of productive facilities."
54 Nonrubber Footwear: Report to the President, Inv. No.
TA-201-50, USITC PUb. No. 1545 (1984) at 19 (hereinafter referred to as Footwear III).
55 staff Report at A-24.
56 Staff Report at A-32, Table 13.
57 Juice apple production mirrors the trend for total
apple production, changing from 2.1 billion pounds in 1980/81 to 1.8 billion pounds in 1981/82 and 1982/83 to
(Footnote continued to page 25)
24
44

-45-
Financial data for apple growers is not consistent with a
finding of serious injury. For large growers, net sales of all
apples increased from $17.7 million in 1981 to $20.5 million in 58
1984. Net income before income taxes as a share of net
sales was (3.8) percent in 1981, 0.8 percent in 1982 and 1983,
and (1.2) percent in 1984. Although this means that large
apple growers were barely breaking even, a claim of serious
injury is belied by their planned future investments in apple
(Footnote continued from page 24) 2.0 billion pounds in 1983/84, to 1.9 billion pounds in 1984/85. Reflecting increased consumer demand for apple juice, the ratio of juice apples to total utilized apple production increased from a U.S. average of 16 percent in the first half of the 1970's to 20 percent in the last half of the decade, to 23 percent in the first half of this decade. Staff Report at A-,33 . Table 14. It is estimated that this ratio will drop slightly to 21 percent in crop year 1985/86. As can be seen from the data on juice apples, there has been no significant contraction there either.
58 Staff Report at A-53, Table 26, addresses
income-and-loss experience on overall operations of farms on which apples are grown. Figures for 1985 are not reliable because 7 of the 38 growers did not provide data for that year. I hesitate to rely on data for small growers, since the responding growers account for about one-half of one percent of total production by small growers. In any event, their figures do not materially differ from those for large growers, and, in fact, their net income ratios have been generally higher. Staff Report at A-56, Table 28.
25
45
-46-
growing. Apple growers were asked to predict expected
production to the year 1990. Using 1985 as a base year
(1985=100), large farms forecast a production index increase to
127 in the year 1990. Small farms were more optimistic,
projecting an index of 151. In light of the fact that juice
apples are the least profitable portion of the crop, growers
are adjusting their future product mix by planting new trees in 59
order to produce more apples for the fresh market. If
growers did not believe they had the ability "to operate at a
reasonable level of profit," one would expect to see exit from
the industry, not projected future growth. In fact, the
acreage of producing apple trees has been stable during the 60
last three crop years. In short, the apple growing sector
has been stable during the past few years and there is no sign
of serious injury to the industry.
59 staff Report at A- 80. Sixty percent of the·larger
growers stated that they had responded to increased imports of CAJ by investing in the renewal of existing orchards or in new orchards. New plantings replace older trees that produce smaller apples suitable only for juice.
60 staff Report at A-35-36, Tables 15 and 16.
26
46

-47-
2. The Processors
The diversity of processing operations, discussed above, is
matched by the processors' divergent views of the petition
seeking relief. Major U.S. producers such as Tree-Top,
Cadbury, National and Bowman, oppose relief. This is
significant because these producers represent from one-third to 61
one-half of U.S. juice apple production. Seneca, also a
major producer, is neutral.
Why should so many processors oppose relief? One of the
most eloquent explanations for processor opposition came from
Tree Top, Inc., a grower-owned apple processing and marketing
cooperative. Tree Top noted that processors of raw product
have found they can use imported apple juice concentrate to 62
their advantage in many ways:
It is a low-cost substitute for fruit solids which can allow the processor to divert more of his raw product to higher profit items such as dried apples while still retaining shelf space for apple juice with a blend of local raw product and imported concentrate.
61 Because of incomplete questionnaire responses, staff
was able to estimate only roughly these firms' share of the market.
62 Letter from Dennis Colleran, President and General
Manager of Tree Top, Inc., to Commission (April 8, 1986).
27
47

-48-
When imported concentrate prices are favorable, the processor can realize increased margins.
Blending local raw product with purchased concentrate helps the processor maintain a consistent quality and flavor despite variations in available apples. Raw product deliveries are not flexible, but purchased concentrates can be useful in setting up reliable production schedules.
Processors can leverage their capital investments more effectively with additional production volume derived from purchased concentrates.
In the event of crop failures, processors can protect their shelf space by supplementing raw product with purchased concentrate.
According to industry sources, all but one or two producers
63 of domestic apple juice purchase imported CAJ. Many
national brand name apple juice products are made entirely from
imported CAJ. These makers state that a very large and steady
supply of raw material is needed to support a national line, 64
and it can be secured only from foreign sources. Thus, for
many U.S. producers of juice, import "relief" might injure the
industry.
There is no indication that the processors are suffering
serious injury. U.S. production of single-strength apple juice
63 Staff Report at A-45.
64 staff Report at A-45.
28
48
-49-
was highest in crop year 1980/81, when the largest apple crop 65
was harvested, at 182 million gallons. since then,
production has fluctuated rather minimally, from 153 million
gallons in crop year 1981/82, to 154 million gallons in crop
year 1982/83, to 169 million gallons in crop year 1984/84, to
158 million gallons in crop year 1984/85. Production is 66
estimated to be 153 million gallons for crop year 1985/86.
The income-and-loss experience for ten producers accounting
for 30 percent of U.S. production showed net sales rising from
$104.9 million in 1982 to $142.2 in 1985. Operating income as
a share of net sales was 5.3 percent in 1982, 2.7 percent in 67
1983, 2.2 percent in 1984, and 2.8 percent in 1985. Gross
profits increased steadily during 1982-85 in absolute terms,
65 Staff Report at A-23, Table 7.
66 staff Report at A- 44, Table 20 (USDA data). Because
of increased consumer preference for apple juice, these figures are about 50 percent higher than comparable figures during the mid-1970's. staff Report at A- 24 Table 8. '
67 All data in the text of this paragraph are from Staff
Report at A-60, Table 31. It should be noted that Cadbury Schweppes furnished information which was too late to be included in the financial tables. However, it opposed the petition.
29
49

-50-68
and were relatively stable as a percentage of net sales.
While a number of processors support the petition (they account
for about one-third of U.S. production), the processors
accounting for the bulk of production oppose it or are
neutral. This is in and of itself a significant indication
that the financial data reported above do not reflect serious
injury.
I do not find there to be a threat of serious injury to the
growers or processors. Although there is significant worldwide
capacity to produce apple juice, and imports have increased,
growers are not reducing apple acreage. Rather forecasts are
for increased plantings. Processors have stated important
reasons for their use of imported CAJ and there is no reason to
think they will not benefit from the imports in the future.
IV. CONCLUSION
Although some data indicate that the industry has
contracted in the last few years, the industry's decline has
68 The relatively low operating incomes may be accounted
for by heavy promotional expenses because of intense competition for supermarket shelf space.
30
50

-51-
not been sufficient to constitute serous injury, nor is there
evidence that a threat of serious injury exists. Therefore, I
determine that the domestic industry is not seriously injured
or threatened with serious injury. Because of my determination
of no serious injury or threat thereof, I do not reach the
issue of causation.
31
51

-52-
DISSENTING VIEWS OF COMMISSIONER DAVID B. ROHR
Unlike my colleagues, I believe that the statutory requirements for import relief
for an injured domestic industry under Section 201 of the Trade Act of 1974 have been
satisfied in this investigation. Apple juice is being imported into the United States
in such increased quantities as to be a substantial cause of serious injury to the
domestic apple juice industry. The fundamental points of disagreement between my
colleagues and myself are in our characterization of the domestic industry and in our
application of the statutory criteria in the context of an agricultural industry.
The fact that this investigation involves an agricultural product is important.
Agricultural products do not easily fit within the traditional analytic frameworks of
Section 201 investigations, which have developed primarily In the context of
manufactured products. Applying the statutory criteria to a realistically defined apple
juice industry, and recognizing the unique problems of agricultural industries, there
can be no question that this industry is experiencing serious injury, a substantial
cause of which is Imported apple juice.
The Domestic Apple Juice /11dustry
The first issue in this investigation is the definition of the domestic Industry.
The industry with which the statute is concerned ls "the domestic industry producing an
article like or directly competitive with the imported article." This definition has
always been interpreted more expansively than its counterpart in the countervailing and
antidumping duty laws. The goal of the Commission should be to develop a commercially
realistic definition of the industry. 52 The imported article in this investigation is, generically, apple juice. More

-53-
specifically, the imports consist primarily of concentrated (6X) apple juice. This is a
commercial product used in the production of other products for sale to ultimate
consumers. In addition, there are smaller quantities of imports of apple juice In
lesser concentration. The predominance of 6X imports is important for it focuses the
investigation on competition at the bulk, rather than the retail, level of trade.
The difficulty for the Commission in this investigation, as in many other
investigations involving agricultural products, exists on two levels. First, we must
determine what product or products fit the statutory criteria of being "like or directly
competitive" with this imported apple juice. Then, we must define the parameters of the
domestic Industry which produces that product.
On one hand, the more narrowly and precisely that these definitions are made, the
more focused ls the Commission's investigation, and the less chance there is for the
Commission to be faced with competing domestic interests that can not be reconciled
within the statutory framework of a Section 201 investigation. On the other hand,
narrow definitions may obscure commercial reallty, which often Involves many different
stages of production and different, though related, products.
The domestically produced product with which this investigation Is concerned Is
apple juice, without regard to concentration or degree of processing. It Is true that
distinctions may be drawn, for example, between different strengths of apple juice based
upon how they reach the ultimate consumers. Fresh squeezed, single-strength juice,
often sold directly to consumers or retailers by apple growers, can be distinguished
from concentrated apple juice, primarily used by companies that blend or otherwise
reconstitute the juice for commercial sale as frozen triple-strength concentrate or
single-strength pasteurized juice. While such differences affect our analysis of the
market, they do not require analysis of separate Industries.
For purposes of this investigation, the significant question Is who we Include
within the scope of the domestic industry. The production of apple juice Includes many 53
·
different stages, from apple growers at one end to packagers of retail products at the

-54-
other. The analysis is complicated because some stages may be combined with others or
eliminated altogether. A further complication is that apple juice production is seldom
the sole activity of any producer. Growers produce apples for juice and for other
markets; processors process apple juice and other beverages.
The initial stage in the production of apple juice is the growing of apples to be
processed into juice. Unlike, for example, oranges, certain varieties of which are
grown by specialized growers for the juice market, no specific variety of juice apple is
grown; and few, If any, growers produce solely for the juice market. Apples used in the
production of apple juice are, rather, those which, because of damage or imperfection,
cannot be sold in the more profitable fresh or canning markets. Nonetheless, juice
apples have historically represented a relatively stable portion (20 to 25 percent) of
total domestic apple production, with certain geographic locations having historically
high or lower percentages.
In Investigations involving manufactured products, Commission precedent is to look,
to the extent possible, only at that portion of the individual firms' operations
producing the goods competing with the imports. In our recent investigation of foundry
products, TA-201-58, for example, the foundries in the investigation produced a much
wider array of products than those alleged to be causing injury. In that investigation,
the Commission focused its investigation only on those operations producing the like or
directly competitive products to those alleged to be causing Injury.
To be sure, the difference between a decorative tree-grate and a manhole assembly
is more easily visualized than the difference between a fresh market apple and a juice
apple, but the distinction is there. The market perceives the difference between such
apples. It assigns different prices to each. Producers also know that a certain
portion of their production will be of apples for which juice is the only use.
Also, certain costs of producing apples, such as maintenance of the trees, will be
the same whether the apples are sold in the fresh or the juice market. By analogy,
54 however, this is to say uo more than that raw steel goes into the manufacture of plate,

-55-
sheet, or wire rod. The grower does make a decision, independent of his decisions with
regard to fresh market apples, whether to "produce", i.e. harvest, juice apples, and, if
he does so, he incurs a set of expenses independent of expenses on his other apples.
Similar considerations led the Commission In a recent dumping investigation, Red
Raspberries from Canada, 731-TA-196, USITC Pub. No. 1707 (1985), under the more
restrictive provisions of that statute to distinguish between fruit intended for the
fresh and processing, and even more specifically, the bulk processing market.
Similarly, in Table Wine from the Federal Republic of Germany, France, and Italy,
701-TA-258-60, 731-TA-283-85, USITC Pub. No. 1771 (1985), the Commission distinguished
between grapes grown for table use or for raisins from those used for wine.
A separate question is whether growers of juice apples should be viewed as part of
the "Industry" or merely as suppliers to the apple juice Industry, defined as the
processors. The Commission's application of the countervailing duty and antldumplng
duty laws suggest that such an Interpretation Is reasonable. Section 201, however, is
not limited by the requirements applicable to the unfair trade laws. In view of the
particular circumstances of this agricultural Investigation, a broader Interpretation Is
necessary. It Is appropriate to look at growers as a part or the domestic Industry and
to focus, as much as possible, specifically on their activities relating to juice apples.
In addition to apple growers, apple juice processors must be considered part of the
domestic industry. There are three segments of the processing Industry. The first
consists of the pressing of juice apples to produce single strength apple juice, which
can be sold fresh or pasteurized or passed on to the next stage of production. The
second segment of the Industry consists of the concentrators who produce the basic
commercially-used product, 6X Concentrated Apple Juice (CAJ). Most concentrating
capacity in the U.S. is owned by the large producers of single strength juice. The
final stage of production is the reconstituting or packaging of the retail product by
companies who use either imported or domestic CAJ or domestic single strength i"t§e.
The larger producers often operate at all levels.

-56-
The interests of companies who operate on these different levels are not always the
same. A producer whose operations include packaging facilities and who can take
advantage of low priced imported CAJ may see his interests differently from a producer
who must sell his product in direct competition with the imported product. The focus of
the Commission's analysis must be on the latter. It ls a mistake for the Commission,
which is ill-equiped for the task, to try to balance the competing Interests of such
producers. The fask of the Commission is to determine whether that portion of domestic
production that competes with the Imports ls injured, whether that Injury Is serious,
and whether imports are a substantial cause of that injury. That ls what I have done.
Increasing Imports
The first question that the Commission must answer In any Section 201 Investigation
is whether Imports are Increasing. In this investigation, imports have risen
dramatically using all relevant measurements. U.S. Imports for consumption under the
tariff schedule classification for apple juice (which Includes a small quantity of pear
juice) rose from 44 million gallons (single strength equivalent, SSE) in 1980 to 214
million gallons SSE In 1985. Adjusted to a crop year basis, the increase Is also
dramatic, from 70 million gallons SSE, valued at 52 million dollars, In 1980/81 to 209
million gallons SSE, valued at 140 million dollars, in 1984/85. Further adjusted to
discount the presence of pear juice, the increase is from 70 million gallons In 1980/81
to 196 million gallons In 1984/85.
Focusing on imported CAJ, the 6X commercial product In the form in which it is most
commonly Imported, the increase ls from 9 million gallons to 29 million gallons over the
period of the investigation. In relation to U.S. production, imports rose from 38
percent to 124 percent of domestic production. Partial data for the current year
reflect further increases in imports, even though the data do not include those quarters
In which imports have traditionally been heaviest. Thus, Imports increased over the 56
period of investigation; they are currently increasing; and they are projected to

-57-
Increase even further. The increased imports criterion for relief under section 201 has
been met.
Serious Injury
In order to analyze the condition of the domestic apple juice industry, It is
necessary to look separately at the growing and processing sectors because injury, or
lack thereof, will be evidenced by different indicators in each. However, the question
before the Commission is whether there is serious injury to the industry as a whole.
This judgment is necessarily qualitative rather than quantitative. Because of unique
features of agricultural Industries, the purely statistical Indicators must be
approached cautiously as they may not reveal the actual conditions of production,
employment, and profitability In the industry.
For processors, production declined Irregularly over the period of Investigation
from an estimated 182 million gallons to 153 million gallons. Based upon our
questionnaire responses, which are significantly understated In absolute volumes but
appear to accurately reflect trends, production of CAJ shows a sharper drop, from 670
thousand gallons to 155 thousand gallons. Similarly, sales of domestically produced CAJ
dropped to virtually nothing, from 290 thousand gallons In 1981/82 to 15 thousand
gallons In 1985/86. The evidence, as a whole, establishes a substantial reduction In
production of apple juice, particularly of the concentrated product that Is In direct
competition with the imports.
Capacity utilization in concentrating facilities producing CAJ decreased from
approximately 26 percent in 1981/82 to 13 percent In 1982/83 before stabilizing at 16 to
17 percent for the remainder of the period. At least 17 plants, equivalent to almost
one-quarter of 1985 concentrating capacity, closed during the period of Investigation.
Employment by processors Increased until 1984. However, there were significant declines
in the number of employees, hours worked, and compensation In 1985. 57
The financial position of firms in the processing sector was not strong In 1982 and

-58-
declined further over the period of the investigation. After registering a small profit
in 1982, the industry experienced losses from 1983 through 1985. More than half of the
firms reporting to the Commission experienced losses In each year for which the
Commission has financial data. These losses are reported by both small and large firms
and, thus, cannot be attributed to a particular scale of operations. All the key
financial ratios for the domestic producers deteriorated over the period and reflect the
very serious financial problems facing this industry and the limited resources available
to deal with these problems.
The statistics for apple grower operations are also mixed. Production both of all
apples and of juice apples peaked in the 1980/81 crop year at 8.8 and 2.1 billion
pounds, respectively. After a sharp drop In 1981/82, production of all apples
fluctuated around 8.2 billion pounds. Juice apple production followed the same trend,
fluctuating around 1.85 billion pounds.
Most production indicators for grower juice apple operations remained stable
throughout much of the period of lnvestlaatlon. There are two significant exceptions.
The number of acres devoted to apple production declined for small growers in 1985 and
for large growers in 1984. Most significantly, there was a huge Increase In the number
of juice apples not harvested or left to rot in the orchards. After remaining one
percent or less of the crop for most of the period of Investigation, data for the
current crop year show that as much as four to five percent of this year's crop Is being
left unharvested.
The financial picture of the growers Is also very precarious. Only In 1982 and
1983 did growers achieve even small overall profits, registering losses In the other
years of the investigation. Net sales of juice apples declined steadily after 1982.
Grower assets and capital equity have declined sharply, and the debt to equity ratios of
the growers deteriorated, reflecting at least in substantial part the significantly
declining revenues from juice apples. 58
Statistics, however, do not tell the whole story of conditions In this Industry or

-59-
of the serious injury that it is experiencing. Production, for example, must be seen in
light of the overall growing and harvesting of apples. The planting of apple trees
entails a commitment to long-term production, a part of which is production of juice
apples. Of course, production of apples will vary to some extent in the short run due
to many factors. Some will be exogenous, such as the weather; some are within the
growers' control, for example pruning and fertilizing. However, the most important
factor affecting overall production in a particular year is the number of bearing apple
trees. This is the result of planting decisions made years before the current growing
season. As a result, it is unlikely that production statistics will reflect current
factors affecting the market.
Further, it is also clear that the decision to produce juice apples will not be the
major determinant of the decision to plant trees or plan production for a given year.
Producers make their decisions in an attempt to satisfy the overall demand, particularly
the fresh market demand, for apples. In so doing, a certain percentage of the crop,
roughly one quarter, will be grown, whether intentionally or not, for the juice market.
It could be argued therefore, from the statistics, that production of juice apples
is not important for growers and that reduction in demand for juice apples could not
have a serious impact on overall grower operations. This would not be correct. The
current indicators of production reflect decisions made long before apple juice imports
began to increase. Most production indicators will not begin to reflect the current
impact of imports for some time. This does not mean that the injury isn't occurring
now, but only that there are lags in the statistics.
The one indicator which most accurately reflects the current impact of the market
on production is the percentage of juice apples that are being left unharvested. The
decision whether to invest the three to five cents per pound cost to harvest juice
apples is made by the grower on the basis of current market conditions. This indicator
reflects that, under normal market conditions, one percent or less of the crop will be 59
left unharvested. In the most recent year, however, four to five percent is being left

-60-
to rot because it is uneconomic to harvest t' em. Because juice apples themselves are
roughly 25 percent of the crop, this means that as many as 20 percent of juice apples
are being left unharvested. To analogize to manufacturing cases, this is equivalent to
a 20 percent decline in juice apple production, with concomitant effects on the pressing
and concentrating segments of the industry.
In the short run, the inability to sell juice apples will pose difficulties for
individual firms. This may or may not be serious for such firms depending upon the
market for their other apple products. However, the continued inability to sell the
apples is certainly indicative of serious injury to the Industry as a whole.
Juice apples will continue to be grown. As long as apples are grown, some apples
will be flt only for juice. But, If the juice market ls not available, as the trends
clearly suggest, those apples will simply be left to rot. Long-run apple production
cannot but be affected by the fact that as much as 25 percent of the crop is generating
no economic return.
A second Important aspect of the situation concerns the financial Impact of
declining sales of juice apples on growers. Here, too, the Importance of the "Injury•
depends on the relationship between production of juice apples and total apple
production. The data collected by the Commission establishes the juice apple production
has not been, and ls unlikely to be, "profitable" In a conventional sense. The cost of
growing an apple, whether It is eventually sold In the fresh market or the juice market,
will essentially be the same. When these costs are allocated to juice apples and total
expenses attributable to juice apples are compared to revenues derived from juice
apples, "losses" are virtually certain to result.
"Profitability", however, ls not the issue. The key element In the analysis of the
financial data in this Investigation Is the contribution that juice apple revenue makes
to total apple revenue. In this context, juice apples may or may not be significant,
and the revenue loss may or may not be serious. Opponents of import relief concludt'/)
that the contribution of juice apples is not significant. Apple growers, evidenced by

-61-
their many statements to the Commission, clearly believe otherwise. I believe that the
sale of juice apples is significant, and the revenue loss to growers is serious.
For the crop years 1980/81 through 1984/85, juice apple production for smaller
growers represented 27, 23, 27, 33, and 22 percent of total apple production. Over the
same period, revenue for the smaller growers from sales of these apples averaged 12.7,
17.3, 19.9, 11.8, and 7.6 percent of total revenue. For larger growers, juice apple
production averaged 20, 20, 20, 19, and 15 percent of production and 10.8, 13.2, 12.9,
10.2, and 8.5 percent of revenue. Thus, there has been a precipitous drop in the
contribution of juice apples to apple growers income. I believe this to be a strong
indication of serious injury to the growers.
The Industry, however, is composed not only of juice apple growers, but also of
apple juice processors. For juice processors, the largest portion of their capital
investment is for their apple pressing and concentrating facilities. Assuming a 4
million gallon capacity, a pressing facility requires approximately 4 million dollars.
A bottling plant to process CAJ, on the other hand, would require only 600 thousand
dollars.
The comparatively smaller investment required to enter the market with a bottling
plant, taking advantage of cheaper imported CAJ, puts considerable pressure on
processers that have made an investment in domestic pressing facilities to cut costs and
also use the cheaper imports. Similarly, a significant factor affecting the processing
sector is the fact that the largest pressing and concentrating facilities are owned by
companies that are integrated throughout the various stages of production and that are
In a position to use imported CAJ in their operations as a substitute for domestically
produced juice. The evidence suggests that the domestic facilities, particularly In the
concentrating segment of the industry, are suffering major losses as they are idled,
while the bottlers, and those integrated companies which are in a position to do so,
turn to imported CAJ to maintain their competitive edge in the market place and their
overall profits. 61

-62-
I believe that, as a consequence of these factors, the apple juice industry is
experiencing serious injury, with repercussions for both growers and processors. For
growers, it is unlikely that they will be able to maintain long-term production with a
quarter of their production bringing in almost no revenue. For processors, it is likely
that the current trend towards the closing of pressing and concentrating facilities will
continue. This will increase pressure on growers and accelerate the movement out of the
pressing and concentrating segments of the industry. Given the relatively large
investment required for pressing and concentrating, compared to using CAJ, the longer
facilities are idled and the more that go out of business, the more difficult it will be
to reenter these segments of the industry. The result will be a further reduction in
demand for domestically grown juice apples.
Substa11tia/ Cause
Having determined that imports are increasing and that the domestic Industry is
seriously injured, it only remains to be determined whether Imports are a substantial
cause of that injury. Often, this ls a difficult question despite attempts to simplify
it using abstract economic theories. Here, It Is not difficult and the Information
gathered by the Commission is clear.
The point of competition between the imports and the domestic product Is at the
level of the retail packager. This is the purchaser who can decide whether to use
imported CAJ or juice from domestic apples. The Commission extensively investigated
these companies, some of whom also own domestic pressing and concentrating facilities.
The virtually universal response of purchasers of the imported CAJ to explain their
decision to close domestic facilities, to cut back domestic production, or to reduce
purchases of domestically produced concentrate was the availability of low priced
imported concentrate. Financial losses are being suffered despite the Increasing
overall demand for apple juice because the price of apple juice has been decreasing due 62
to the availability of low priced imported CAJ, which is in turn forcing down the price

-63-
of domestic CAJ and, ultimately, the price of juice apples. Regardless of the theories,
this is how the businessmen in the industry, whether or not they support import relief,
explain the situation. Imports are clearly an important cause of the current situation.
An issue that remains of concern is the question of unfair trading practices. The
presence of subsidies or less than fair .alue sales, is not relevant to the questions
that the Commission must decide in a Section 201 investigation. In this investigation,
the Commission, lo fact, did receive information relating to alleged subsidies being
granted to producers of a particular country. As required by the statute, we referred
the matter to the Department of Commerce for action under the appropriate statutes.
Under Section 201, however, it is the impact of all imports, not just imports from a
particular country and not just unfair imports, that must be the subject of our
determination. It Is not proper to discount the effect of particular imports because
they might be subject to action under some other statute.
It was also argued that some of the plants and firms that have left the Industry
over the period of investigation were too small and inefficient to survive. Whether
true or not, the Information gathered by the Commission suggests that both lar1e and
small and old and new facilities went out of production or are experiencing low levels
of capacity utilization and profits. In the presence of such generallzed conditions, it
is not possible to conclude that obsolete technologies or poor management decisions by
particular firms have been as important a cause of injury as Imports. Thus, there Is no
other cause which is as important a cause of injury to the industry as imports.
Conclusion
This investigation defies easy analysis in accordance with the traditional
frameworks of Commission Section 201 determinations. The data obscure as much as they
reveal about the operation of this industry. Imports have started the industry onto a
slide from which it will be difficult to recover. Whether we label this slide seriou'l33
injury or threat thereof is not important. Whether we parse distinctions between

-64-
growers and processors is not important.
The reality is that over the last few years a massive surge of imports has
seriously dampened prices and caused a severe disruption in the utilization of the
productive resources of this industry. It has reduced revenues significantly and poses
a threat to the continued >iability of the industry. It has caused serious dislocations
in the traditional relationships between the various parts of the industry and
introduced new factors to which the industry must adjust. The facilitation of this
adjustment to new international competitive factors is a legitimate purpose of section
201.
I recognize that temporary relief from Imports would not have sohed all the
problems of the apple juice industry. The evidence suggests, however, that the Industry
may not have the resources or ability because of imports to get off of its current
downward splral. Import relief would have provided growers the opportunity to reduce
their reliance on juice apples. It would have allowed processors to utlllze and upgrade
their domestic pressing and concentrating facllities. Certainly, unless major efforts
were to have been made during the period of relief, the industry might have been no
better off. I believe that the industry recognized this when they brought this petition
for temporary relief. They made their case and should have been given the opportunity
to adjust that Section 201 provides.
This Is why I have made an affirmative determination and concluded that this
industry satisfied the requirements for import relief under section 201 of the Trade Act
of 1974.
64

A-1
INFORMATION OBTAINED IN THE INVESTIGATION
Introduction
On December 27, 1985, the U.S. International Trade Commission instituted investigation No. TA-201-59 under section 20l(b) of the Trade Act of 1974 to determine whether apple juice, not mixed and not containing over 1 percent ethyl alcohol by volume, provided for in item 165.15 of the Tariff Schedules of the United States (TSUS), is being imported into the United States in such increased quantities as to be a substantial cause of serious injury, or the threat thereof, to the domestic industry producing articles like or directly competitive with the imported article. The investigation resulted from a request received by the Commission on December 27, 1985, from the United States Trade Representative (USTR).
Notice of the institution of the investigation and scheduling of a public hearing to be held in connection therewith was given by posting a copy of the notice in the Office of the Secretary, U.S. International Trade Commission, Washington, DC, and by publishing the notice in the Federal Register of January 24, 1986 (51 F.R. 3266). The public hearing was held in Washington, DC, on April 17, 1986. The briefing and vote on injury were held on May 21, 1986. !/
The Products
Juice apples
Apples are the fresh fruit of a deciduous tree. Juice apples are apples that are destined for pressing into apple juice. Most of the apples grown in the United States are sold as fresh-market fruit (fresh-market sales). The sale of fresh-market apples is based primarily on eye appeal of the fruit, i.e., color and shape. Apples that have good color and shape and that are free of surface blemishes are sold as fresh-market fruit; the larger the size of such fruit, the higher the price the apple generally commands. A second category of harvested apples is the processing or canning grade. Canning apples ("peelers") must be over 2-1/2 inches in diameter; peelers may have surface damage since they will be peeled in the process of making apple sauce or slices, but they must be round for the peeling machines to handle them properly. The third major category of apples is juice apples. Approximately one-third of the apples grown East of the Mississippi River are used for juice. In Washington State, about 15 percent of the crop is juice apples; production for the country as a whole averages about 23 percent. The sources of juice apples traditionally are sort-outs, tree-run fruit, weather-damaged fruit, drops, and leftovers from other grades.
Sort-outs are those apples selected out mechanically because they are smaller than 2-1/2 inches in diameter; such selection is performed throughout
!/ Copies of the letter from the USTR, the Federal Register notice, and a list of witnesses appearing at the hearing are presented in app. A.

A-2
the marketing season (until the next crop) as apples are taken from storage and sorted for fresh-market sales or for canning (peeling). lf
Tree-run and damaged apples are, respectively, those harvested when the average grade of the fruit on the tree is such that it is most suitable for juice apples, and fruit that has been damaged by hail or otherwise bruised. When the fruit in the orchard is harvested in its entirety for use as juice apples, it is usually grown with less care (and less expense).
Drops are another source of juice apple supply. As the pickers pick apples in orchards oriented toward fresh-market or canning apples, apples fall or are accidentally knocked to the ground; these are drops. The only use for drops is juice production. The total amount of drops in an average year is 4 to 6 percent of the total crop. If strong winds occur during the harvesting period, when the apples are more prone to drop, the share of drops increases and may be as much as 15 percent of the total. Drop apples must be picked up from the ground within a short period of time, otherwise they will begin to rot. In cooler areas, such as New York, the time available to the grower to pick up drops can be as much as 7 to 10 days, as decay begins more slowly. In orchards located in the South, such time may be as little as 1 to 2 days, because decay starts immediately in warmer weather. The growers thus must decide quickly whether or not to pick up drops. The cost of picking up drops is reported by the growers to be 1 to 3 cents per pound, with a possible further cost of 1.5 cents for cold storage. !f Additional costs are for transportation, storage bins, and interest. Thus, if juice producers are not buying juice apples at the time of harvest, the grower must decide whether to invest approximately 3 cents or more per pound in his drops. The grower's decision whether or not to pick up drops or leave them on the ground depends on juice apple prices and the grower's perception of the willingness of producers of domestic apple juice to purchase such juice apples. ~ Supporters of import relief contend that growers increasingly make the decision not to pick up drops since juice apple prices have decreased, and at the lower prices, the growers consider such markets uncertain and limited. Supporters of relief state that at a price of around 5 cents per pound, the drops would be picked up, adding to the supply of juice apples. Respondents argue that drops are crop abandonment that is normal in the growing of a perennial product where, if demand is to be satisfied in a year of lesser harvest, an oversupply is unavoidable during years of better harvests.
Leftovers from other grades are an addition to the sortouts. Sortouts are separated mechanically from other grades according to size; leftovers are selected out on the grading table, generally by hand. The juice apple market also serves to accommodate these leftovers, as described below.
lf Some canners prefer to peel larger apples; they may set their size limit over 2-1/2 inches for better profit margins on canning apples. !f If the grower expects to sell the juice apples within 90 days, he can put
them in cold storage. If they are not sold in 90 days, he loses his investment in those drops. The cost of cold storage is generally $0.60 per bushel (42 pounds.) ~ Telephone conversation with * * * and transcript of the hearing, pp.
76-77.
2

A-3
The largest fresh-market apples serve a high-paying, high-price market segment that is very steady; most often the largest Red Delicious apples with the best eye appeal are sold in this market segment. When, however, these apples have blemishes or bruises, or are damaged by hail or suffer other surface damage, they too are put into the juice apple category, because Red Delicious apples are not suitable for peeling or making sauce. Other varieties of large apples, even those suitable for canning/peeling, may still not be used for canning, because the mechanical apple-peeling machines cannot handle apples larger than 3 to 3-1/4 inches in diameter, thereby also relegating these apples to the juice apple market.
The smallest fresh-market apples are bagged apples. Between the smallest and largest fresh-market apples is a category of midsized apples. This is a very dynamic and competitive category of the fresh market in which Eastern apples compete with Western apples, and Macintosh, Rome, and other varieties compete with Red Delicious. Exports are generally from this category; conversely, when there are fewer exports, more apples remain in this category. When the price of juice apples is higher, the packers maintain somewhat higher standards of quality and appearance; they pack better fresh-market fruit by diverting apples into the juice bin more generously. If juice apple prices are weaker, the packer will not take out the marginal quality apples from the fresh-market pack. There are no data available as to the quantity of these diverted apples nationwide.
Another category for which the juice apple market is the only outlet are peelers that are too large to be utilized in making apple slices for end products such as pie fillings. The uniform size of the apple slices is a requirement for this end product. Tree-run apples processed for slices contain not only smaller (sort outs), but also larger size fruit than that required for slicing.
The supply of juice apples is affected by the price the grower receives for such apples. When the grower considers juice apple prices to be low, he will divert juice apples to the fresh market, selling smaller size, lower grade apples on the fresh market (bagged in 3-pound bags) rather than on the juice market. Such testimony was given by a Washington State grower. !f The Commission's staff queried an Eastern grower on the same issue; he stated that about one-half of the juice apples from sort-outs can be diverted to the fresh market. In the current marketing season the above-mentioned Eastern grower realizes about * * * cents per pound from sales of diverted juice apples sold on the fresh market; if the producer could receive a similar price, he would rather sell the same apples for juice and save the packing and selling efforts. The diverted juice apples exert downward pressure on the prices of lower grade fresh market apples. ~
!f Transcript of the hearing, p. 90. ~ Telephone conversation with * * * and transcript of the hearing, p. 184.
3

A-4
Single-strength apple juice
"Single strength" means a juice th' t., when in its natural unconcentrated or undiluted condition, is suitable for sale as a natural fruit juice. For apple juice, this means, technically, a juice having a sugar level in the range of 9 to 14 degrees Brix. In the remainder of this report, single-strength apple juice will frequently be referred to merely as "apple juice" or as "juice."
Fresh single-strength juice.--Fresh single-strength apple juice is the product of pressing fresh apples without further processing to prevent spoilage or increase the concentration of the sugars. Some fresh singlestrength juice is filtered to remove seeds, skins, stems, and so forth; it appears cloudy, not clear. More filtering produces a clearer juice. The cloudy juice is often referred to as "cider." Preservative agents are sometimes added to fresh apple juice to extend the relatively short shelf life of the product. 'llhen fresh single-strength apple juice is packed in retail-size containers it is called "fresh pack." Fresh apple juice includes sweet apple cider sold by cider mills and by roadside stands, often in 1-gallon and 1/2-gallon glass or paperboard containers. Fresh pack apple juice is also sold by dairies and retail food stores; it is kept under refrigeration with other fresh juices or dairy products, typically in 1/2 gallon, quart, or pint containers of plastic, glass, or paperboard. Fresh single-strength apple juice is also sold in bulk by the producer of the juice to other companies that in turn retail pack and sell to consumers.
Fresh single-strength apple juice is the most basic apple juice product; other apple juice products, such as concentrates, are made from fresh singlestrength apple juice.
Pasteurized single-strength Juice.--Pasteurized single-strength apple juice has been heat processed to prevent spoilage prior to filling retail-size containers; it has the degree of sweetness of natural unconcentrated juice. Such juice is usually filtered to a clear consistency; it may be fortified with vitamins or with apple essence to enhance apple flavor, but sugar is seldom added. The quality of this prod11ct in the minds of retail consumers is dependent upon appearance and flavor, which can be altered in the manufacturing process. Pasteurized single-strength apple juice may be produced from fresh apple juice that is pressed from domestic apples, from concentrated apple juice made from domestic apples, from imported concentrated apple juice, or from any combination of imported and domestic juices. Pasteurized single-strength apple juice is sold from the nonrefrigerated grocery shelves in food chain stores, grocery stores, delicatessens, and fast-service food stores and is frequently served in cafeterias, restaurants, hotels, or other food-serving establishments in individual servings. In stores, the product is packed in glass containers, usually of 8, 10, 12, 16, 24, 32, or 64 ounces, and in metal cans, usually of 8, 12, or 16 ounces.
The process of manufacturing pasteurized single-strength apple juice requires filtration equipment, heat exchangers for flash pasteurization, and high-speed bottling and can-closing equipment that is not required in the production of fresh pack apple juice. Much of this equipment can be used to process other fruit juices or fruit drinks in addition to apple juice.
4

A-5
Concentrated apple juice
Concentrated apple juice is the product obtained by removing water from fresh single-strength apple juice. In the concentrating process, the natural sugars and acids in the juice remain with the product; their ratio to the shrinking liquid volume increases as more water is removed. The concentration of sugars is measured in degrees Brix. Also in the concentrating process, volatile flavors are driven off from the natural juice by heat, but these flavors are usually recaptured by distillation to obtain another product called apple essence. When the apple essence is added back during the reconstitution of the concentrate, the single-strength product obtained acquires a flavor very similar to that of the original single-strength juice.
In commercial practice, only two levels of apple juice concentrate are usually produced. The first is a 3-to-l concentrate, having a range of 44 to 46 degrees Brix. This is often called three-strength (or 3X) concentrate (three times more concentrated than single-strength juice); when three parts of water are added to 3X concentrate, it makes single-strength juice. The three-strength concentrate is often referred to as "frozen concentrated apple juice."
The second commercially significant concentrate is a 6-to-l concentrate having a range of 69 to 72 degrees Brix (but usually 71 degrees Brix). This is often called six-strength concentrate or "6X" (six times more concentrated than single-strength juice). It is widely referred to in the industry as "concentrate" or as "concentrated apple juice" (CAJ). In this report, the term "CAJ" will be used throughout to mean concentrated apple juice of 69 to 72 degrees Brix.
Frozen concentrated apple juice.--Frozen concentrated apple juice is a three-strength concentrate; it is a retail-packaged consumer product produced from either domestic single-strength apple juice by concentration or from CAJ (domestic or imported) by dilution and freezing. It is usually marketed in 6- or 12-ounce cans in the freezer compartment of retail food stores, together with frozen concentrated orange juice and other frozen fruit juices.
Concentrated apple juice.--Concentrated apple juice of 69 to 72 degrees Brix is a commercial product produced, traded, and sold to and used only by manufacturers in making other products that contain apple juice. !/ Because of the high level of concentration, CAJ does not need to be frozen to prevent spoilage. It is usually packed in plastic or metal drums containing from 55 to 60 gallons each for trade and transport.
!f Past experiments in retail marketing 69 to 72 degrees Brix concentrated apple juice in the United States have not resulted in a viable business. For example, the U.S. Department of Agriculture reported on such experiments in Consumer Preference for a 6-to-l Apple Juice Concentrate, Marketing Research Report No. 343, July 1959. The product was manufactured in a Michigan processing plant and test marketed. The 6-to-l concentrate was not successful as a consumer product.
5

A-6
CAJ is used both in the manufacture of products that are 100 percent apple juice and in the manufacture of other products in which apple juice is only one ingredient. For 100 percent apple juice products, CAJ is used to produce three-strength frozen concentrated apple juice, reconstituted singlestrength apple juice made entirely from CAJ, and blended single-strength apple juice made by mixing juice from concentrate with single-strength juice that has never been concentrated. Products other than 100 percent apple juice that use CAJ as an ingredient include mixed fruit juices containing apples and some other fruit (in either frozen concentrate or single-strength forms); fruit drinks (products whose level of juice content is less than single strength); fermented (hard) cider, apple wine, and other products containing alcohol; apple vinegar; jellies, jams, and fruit butters; and flavorings and sauces.
Reconstituted and blended apple juice
When apple juice concentrate is diluted with water to concentration levels of single-strength juice it is called reconstituted juice. Singlestrength juice made from U.S. apples or from domestic CAJ is substitutable for single-strength juice made from imported CAJ. None of the parties have disputed the substitutability of domestic apple juice with apple juice made from imported CAJ.
When single-strength apple juice that has never been concentrated is mixed with apple juice from concentrate it is called a blended juice. Blends are made to adjust the taste of the product or to lower its cost. Blending for taste may involve mixing a sweeter (low acid) single-strength juice with juice from a more acid concentrate or mixing a high-acid single-strength juice with juice from a sweeter concentrate, thus modifying the taste of the unblended juices. Some apples are sweeter (e.g., Red Delicious), others are more acid (e.g., Granny Smith); furthermore, all apples are more acid in the first days of harvest and sweeter toward the end of the harvest as they become more mature. Also, a season or growing area with more sunshine produces sweeter apples than one having more cloudy days. The amount of precipitation and the temperatures throughout the growing season also affect the sugar/acid balance of the apples. Accordingly, the sugar/acid balance of a CAJ shipment, whether imported or domestic, varies depending on the apple variety, the maturity of the fruit when pressed, and the weather in the area where the apple was grown. Blending for cost reduction purposes may be done when the price of concentrate is low enough compared with the price of single-strength juice so that mixing them results in a lower cost blended juice.
The parties dispute the substitutability of CAJ used for blending. The parties opposing import relief maintain that imported CAJ assures the availability of CAJ with the proper acid content to blend with domestic single-strength juice, particularly with the relatively sweet juice of the Red Delicious apple grown in Washington State, thereby assuring U.S. consumers of consistent quality (taste) over time for the same brand of apple juice.
The parties in support of relief from imports of CAJ maintain that blending with imported CAJ is also done for cost reduction, that such blending displaces significant amounts of domestic juice from the end products and, hence, causes the reduced use of juice apples by U.S. producers of domestic
•.
6

A-7
apple juice. !J They further claim that domestic CAJ is also suitable for blending; for example, New York State and Michigan apples are high in acid and would complement well the juice of Red Delicious apples from Washington State, if such domestic CAJ production were economically viable. y They further claim that much of the CAJ imported from Argentina is made from Red Delicious apples; hence, it cannot possibly be blended for taste purposes, but only for cost reduction.
U.S. Tariff Treatment
The imported apple juice covered by this investigation is provided for under TSUS item 165.15. This tariff item provides for apple or pear juice, concentrated or not concentrated, whether or not sweetened, that is not mixed with other fruit juices (nor with each other) and that does not contain over 1.0 percent of ethyl alcohol by volume. If concentrated, the imported apple juice may be in liquid, powdered, or solid form. ~
The current rates of duty applicable to imported apple juice are "free" for products from countries eligible for column 1 treatment and 5 cents per gallon for products of column 2 countries. !!J These rates have been in effect since January 1, 1971. ~ Because the column 1 duty rate is free, imported
!J Transcript of the hearing, p. 23.
y * * *· ~ For the current statutory description of the products, the TSUS headnotes
relating to beverages and fruit juices and the rates of duty for apple juice, see excerpts from the Tariff Schedules of the United States Annotated (TSUSA) (schedule 1, pt. 12, subpt. A) in app. B.
!!J The col. 1 rate of duty is the most-favored-nation (MFN) rate and is applicable to imported products from all countries except those Communist countries and areas enumerated in general headnote 3(d) of the TSUSA, which are assessed the col. 2 rate of duty. Currently, the only Communist countries receiving the MFN duty rate are the People's Republic of China, Hungary, Romania, and Yugoslavia. The col. 2 rate applies to products of the enumerated Communist countries, whether imported directly or indirectly. ~ Prior to the effective date of the Tariff Schedules of the United States
on Aug. 31, 1963, apple juice was not specifically provided for in the U.S. tariff treatment of imported products. Rather, "cider" was provided for at the rate of 5¢ per gallon under paragraph 738 of the Tariff Act of 1930, and nonenumerated fruit juices were provided for at 70¢ per gallon under paragraph 806. U.S. customs treatment prior to the TSUS held that cider could be either apple cider or pear cider, including fermented ciders containing alcohol and subject to the provisions of the Internal Revenue Code for wines. Apple juice was dutiable under the provision for cider. In 1939, the rate of duty on cider was reduced to 3¢ per gallon in a trade agreement with Canada, and this rate was affirmed under the GATT in 1948 as the MFN-Trade-Agreement rate. When the TSUS bbcame effective, the MFN 3 cents-per-actual-gallon rate was converted to a 0.5¢ per gallon rate on natural unconcentrated juice to avoid increasing the
(continued)
7

apple juice covered in this investigation is not eligible for duty-free treatment under the Generalized System of Preferences, nor is it afforded preferential duty treatment if imported from least developed developing countries (LDDC's), from beneficiary countries under the Caribbean Basin Economic Recovery Act of 1983, or from Israel under the free-trade area established between the Governments of the United States and Israel.
The specific rates of duty on imported fruit juices, including apple juice, are assessed per gallon of natural unconcentrated juice, or per gallon of reconstituted juice that is equivalent to the number of gallons of natural unconcentrated juice that could be obtained from the imported concentrate. !/ The degree of concentration of an imported fruit juice is determined by the Brix value of the concentrate in relation to the Brix value of the natural unconcentrated juice. ~ The average Brix value of unconcentrated natural apple juice in the trade and commerce of the United States for purposes of finding the dutiable quantity of imports of the concentrate has been determined to be 13.3 degrees Brix. ~ Official statistics on imports of concentrated apple juice are reported only in gallons of natural unconcentrated juice equivalents.
The U.S. Market
The production of apple juice is one of the uses for apples grown in the United States. The apple business in the United States is the largest of the noncitrus tree-fruit businesses today; it encompasses apple growers, packers, and processors of apples. Processors of apples include producers of domestic apple juice, as well as producers of domestic processed apple products such as apple sauce; sliced, canned, and dried apples; frozen apples; and other apple products. Often the same firm makes apple juice and processed apple products.
Apples are grown in 48 States of the United States; commercial production is reported annually for 35 States by the U.S. Department of Agriculture. In 1982, according to the U.S. Census of Agriculture, 41,187 farms in the United
(continued)
incidence of the duties under the then new schedules; the col. 2 rate was not converted. As a result of modifications in the col. 1 rates of duty granted under the GATT in 1967 (Kennedy Round), the MFN rate on apple juice was reduced in 4 annual stages and became free of duty effective Jan. l, 1971. !I The term "natural unconcentrated juice" as used in the TSUS has
essentially the same meaning as the term "single-strength juice" or "single-strength equivalent juice" as used elsewhere in this report. ~Brix value is defined in headnote 3(c), pt. 12A, schedule 1 of the TSUSA
as the refractometric sucrose value of the juice, adjusted to compensate for the effect of any added sweetening materials, and thereafter corrected for acid. For tariff purposes, any fruit juice having a degree of concentration that does not exceed 150 percent of the average Brix value of that juice in its natural unconcentrated form is regarded as a natural unconcentrated juice. ~ 19 CFR 151.91.
8

A-9
States had apple trees. The total area planted was 591,000 acres, with 59 million apple trees; this was an increase of 6 percent in the number of acres and farms since 1978. The number of commercial apple growers is not known but is estimated to be a fraction of the total Census figure.
Growers
Nearly 85 percent of the U.S. juice apple production is harvested in seven States--California, Michigan, New York, North Carolina, Pennsylvania, Virginia, and Washington. These States are also the major producers of apples for all uses, but the share of the crop in each State that is used for juice apples varies owing to different growing and marketing operations. For example, in Washington, which has the lowest ratio of juice apples to total apples produced, only 15 percent of the growers• crops during the most recent 5 years were designated as juice apples, but in California, which has the highest ratio, 46 percent of the growers• crops were used as juice apples.
Growing operations.--Regardless of geographic location, the various functions of growing a commercial apple crop are much the same, although the decisions on what apple varieties to grow and how to market them vary by growers and locations. Major grower activity begins in late winter with pruning of excess branches from trees before new growth begins in the spring; the preferred practice is to prune each tree at least once every 2 years. Then, starting in the spring (the date depends on the weather) and continuing throughout the summer until near harvest time, there is a constant program of spraying to control diseases and insects and, if the grower chooses, applying growth regulators for improved yields and marketable fruit. Ten to fifteen sprayings in a season may be applied, or an average of orie every 7 to 10 days. Harvesting, which starts in July or August in Southern States and extends until November for late-harvest crops, is virtually all done by hand. Most harvest laborers are brought into the orchards from seasonal labor supplies and housed nearby in facilities provided by the growers. The apples are picked and placed, without sorting, into large bins (wooden crates) in the orchard. Each bin holds up to 25 bushels (from 800 to 900 pounds). Unsorted apples placed in such bins are called •orchard-run" fruit. The bins of orchard-run fruit are taken directly for fresh-market packing, canning, juice production, or storage. When placed in storage, the fruit generally remains in the bins until withdrawn from storage. The storage may be either cold storage, which is a conventional refrigerated room, or "controlled atmosphere" (CA) storage. CA storage rooms are specially constructed large rooms that can be hermetically sealed. The oxygen level in the CA rooms is reduced from the normal 20.5 percent to below 5 percent. The lack of oxygen retards the "breathing," thus ripening, of the apples. CA rooms are also refrigerated. Apples remain in good condition for up to 90 days in conventional refrigerated storage and for up to 1 year in CA rooms.
A grower may deliver his apples to a cooperative, sell orchard-run fruit to a cash buyer on the spot market, or market his own fruit. In order to market through a cooperative and share in the proceeds from the cooperative•s sales, the grower must be a member of the grower cooperative organization. Some cooperatives specialize in handling apples for juice, sauce, etc.; others
9

A-10
may specialize in fresh-market fruit only. !J For membership in the cooperative the grower purchases stock in the cooperative, usually based on an apple tonnage, for the privilege of delivering fruit to the cooperative for sale or processing in the plant owned by the cooperative. The profits of the cooperative are shared among the members. Cooperatives may also purchase apples from nonmember growers. The apple grower may also sell his orchard-run fruit to cash buyers on the spot market. Noncooperative producers of domestic apple juice buy juice apples for cash at the going market price. ~ The third marketing option is a do-it-yourself method whereby the grower invests in a packing house, storage facilities, and fresh-market packing equipment and/or fresh-juice-pressing equipment (e.g., cider mill). Such grower operations, when large enough, sell fresh apples regionally, nationally, and internationally, or when smaller, sell their fruit locally. There are few growers that produce juice apples exclusively; several such growers did not even harvest their apples in 1985, particularly in Western New York State, where domestic producers of juice decreased their purchases.
Cost of growing.--The cost of producing fresh market apples or canning apples varies with the grower's circumstances. Growers in Washington State indicate growing costs of about 8 cents per pound; costs in other parts of the country can be lower because no irrigation expense is incurred. ~ When the apples are intended for juice production from the outset of the growing season, the cost of producing is lower because: (1) the trees are cheaper to prune, (2) more apples are allowed to grow on the same tree, thus saving on mechanical or chemical thinning and achieving larger tonnage of smaller fruit, (3) fewer sprayings are needed for juice apples, and (4) harvest costs are less because the apples can be picked more rapidly and with less care. Also, juice apple production is less exposed to such risks as hail and wind damage, because such damage is not material for juice apple acceptance.
Apples that drop to the ground are suitable only for juice production. In Washington State, drops account for about 4 percent of the total crop, but they are traditionally not picked up, because at the prevailing juice apple prices during the last 5 years, it has not been economical to pick them up from the ground. In other parts of the country, drops generally have been picked up when the price of juice apples was 4 cents per pound or higher. As the price of juice apples declined to 3 to 3.5 cents per pound in the Midwest and East during 1985, more drops remained on the ground.
!J At present, some cooperatives do not accept new members, as is the case with Knouse Foods, a grower-owned firm that produces juice and other processed apple products. Knouse buys only juice apples and canning apples, not fresh-market apples. Knouse no longer buy apples from nonmembers, as it used to in past years. Tree Top is also a cooperative that buys only juice apples and processing apples and has closed its membership rolls. ~ Such firms as Duffy-Mott, Red Check, and National are noncooperative
cash buyers. ~ For example, a Pennsylvania grower reported growing costs of 4.8 cents
per pound.
10

A-11
A California apple grower stated that he would realize greater profits if he could grow only juice apples and sell them for 5.5 cents per pound than if he grew canning (processing) apples and sold those for 8 cents per pound. !f This grower also stated that California apple producers have to sell an ever-increasing share of their total production for other than the fresh market, because they cannot compete with Washington State fresh apples; hence, an increasing share of the California apple crop must be utilized by juice/CAJ producers and producers of other apple products (sauce, slices, dried, frozen, and so forth). As the consumption of the latter products is not increasing, the juice market needs to absorb the apples. According to this grower, every cannery in California has a juice-pressing plant; in his estimation, the California juice plants are utilizing about 20 percent of their productive capacity.
A juice apple broker in California predicted a larger influx of Washington State apples in the coming years as that State's production increases by an expected 50 percent by 1990, which will divert to the juice market an even larger share of California apples that are now sold on the California fresh market. '!,/
Juice production of growers.--Small juice pressing operations (called cider mills) and on-the-farm apple presses supply all of the production of apple juice by growers. Such output is of fresh single-strength apple juice, commonly called cider, a large share of which is sold at harvest time. Such fresh juice is widely available from local sources and competes with singlestrength pasteurized apple juice made with domestic or imported apple juice. Domestic apple juice produced by growers represents approximately 5 percent of total production of domestic apple juice, according to responses by growers to the Commission's questionnaires.
Entry into and exit from the industry.--Entry into apple growing on a commercial scale is capital intensive and requires a long-term commitment by the operator. Growers that make this commitment do not expect to leave the industry if they have a poor crop caused by weather or an occasional year of low prices, because the trees remain in place and will have a crop again the following year. The family of one respondent to the Commission's questionnaire has been growing apples commercially since 1886. The decision to exit from the industry is usually a slow process; however, some respondents to the questionnaire indicated that they were seriously considering leaving the industry entirely within the next year. Other growers reported reducing their acreage of apple trees over the past 5 years, and many growers reported efforts to reduce the proportion of juice apples in their total output of all apples. Some examples of growers' comments on their operations are reproduced in appendix C.
!f Telephone interview by staff with*** May l, 1986. ?,! Telephone interview with***• May l, 1986.
11

A-12
Packers
Packers are firms that receive orchard-run apples in bins, each containing some l,000 pounds of fruit, from growers for sorting, grading, and packing into 42-pound boxes for fresh-market sales. The apples that do not meet the requirements for sales on the fresh market are graded out in this operation and sold on the juice apple market to domestic producers of juice. Packers may purchase the apples and pack and sell them for their own account, or they may pack them on a contract basis for a fee (with the grower keeping title). The packers may also pack and sell the grower's fruit on a netreturn-to-the-grower basis, deducting expenses; grower cooperative packers fall into the last group. Figure l illustrates a tally sheet to an apple grower selling fresh-market apples through a packer on a net return basis. It shows three quality grades for color (e.g., extra fancy, fancy, and fancy standard) and several size grades, each separately priced. Apples that are not packed for lack of adequate quality (or lack of demand) are classified as culls and sold as juice apples, at the lowest return to the grower.
Processors of U.S. apples
Apple processors are firms that press, peel, slice, pulp, can, freeze, or dehydrate fresh apples. They seldom are the same firms that pack apples for fresh-market sales. Among the processors are the producers of domestic apple juice, !J firms that press U.S.-grown apples into apple juice.
Producers of domestic juice
Producers of domestic apple juice include cider mills and other producers of fresh single-strength (not pasteurized) apple juice and producers of pasteurized apple juice. The production of pasteurized apple juice from domestic fresh apples requires extensive facilities and processing equipment, which represents a large capital investment. In the process of making apple juice from fresh fruit, juice apples are dumped into a tank of water, washed, and initially inspected. Apple cores and peelings from canning operations may be added in those plants that also process other apple products. The apple meat is pulverized in a hammermill, at which point it is referred to as "pulp." A press aid is added to the pulp, and the mixture is sent through a screw-type press. The cider extracted from the pulp, which is now referred to as "pomace," is sent over a shaker screen to eliminate solids and then sent on to a treatment tank. After treatment and settling, the juice is decanted and sent through a pressure filter using diatomaceous earth. The filtered juice is held in storage tanks.
The investment required for a facility capable of pressing enough apples to produce 4 million gallons of apple juice annually with a 1-shift operation
!J For the purposes of this report, producers of domestic apple juice are firms that produce apple juice by pressing U.S.-grown apples. They are different from firms that make apple juice only by reconstituting imported CAJ. The latter are referred to as "reconstitutors."
12

A-13
·-------- -=,-,--Md_ cel~cio11o9 _____ 1984 Crop ____ _
NO- Boa•• ·- --Sh'-~- __ ...:;P~·l<,1-' Ch. r·· -~ --iExt:JL.f_a:u:y ___ . ___ ·-- 72 _ _ 20 aa.: _ _ _ -~--~-+--1-
: . -j~-~:~-= _: __ --=-_~------ ~ :: - - ~: :: ~~'.:-!..J_-, ·:__ i ~: •. ,
8
9
!U
ll
I~
'5
18
17.
;- • • _,100
lll
••
---- _ l_l l_IL__! __ ·I~+-' +-1--'4!:-'..::'.:1!"-"•q-: _ 10 l 8 l ! . : I .,,- ~'
... ... h ' .
100 ' so! : -- -... .. .. ··-- -- ·- . '
. ~7! ._ : l l.i.J ,_,.., • 3'1e ·-- ___ • ___ _ __ . µ,~ _ _ _ _ __, ,o :--- -'- _ _:_1:~·~vr 13 . • _ µs s 15i · . ~ "~ 0 -·· - . . . -
1ll -- .. - . 6 al~ ·: . --;-' .. '~ • I
· j ""'r· ·• · ·· · · · ---~so · -, ~ .. l --, -;~ - i-- 1 1 'f e - · I I j . . _ _10 . 6 JO f . ._.·. ~- _ .l
'I o 175 1 1 ' I 1
I d l o - . - 12/Jf~~~-.
1 ' J7 .! : -- I I _._"'+-'I ;
~= --. • 1/4° 4 91 ! ; : I ~ d~~::i. 2
;!_-;-rs~~---'~-\:: _ ---·-· :-~~i. ·--:--; :1 I:
Figure 1.--Packer's tally to grower for season's pack of fresh market apples and culls (juice apples) of one variety, Washington State, 1984 crop.
13

A-14
is currently estimated at about $4 million. !J In addition, the operating costs of the plant would be about 2.2 cents per pound of fresh apples. An itemized listing of these investment costs is shown in the following tabulation:
Item Investment costs
for equipment
Apple bin boxes----------------------Cold storage facilities--------------Forklift equipment-------------------Conveying equipment------------------Apple pressing-----------------------Juice screening----------------------Juice collection and treatment-------Juice heat exchanger-----------------Juice holding tanks------------------Ultrafiltration----------------------Pomace disposal-----------------------
Total-----------------------------
!J Not shown in the total.
$614,400 2,400,000
25,500 75,000
700,000 8,500
19,000 9,000
25,000 178,000
1/ 4,054,400
At this stage the apple juice is in single-strength form, in bulk, and ready for packaging into consumer-size retail units. Additional packaging equipment and investment requirements are needed for bottling and packing. The investment cost for the basic equipment needed to package apple juice in a plant producing 4 million gallons per year is estimated to be $596,000. These costs are itemized as follows:
Item
Investment costs for equipment to package
pasteurized apple juice
Juice storage----------------------------Heat exchanger--------------------------Can handling, empty---------------------Can (or bottle) filler equipment--------Can closure equipment-------------------Can handling, filled---------------------Cooling---------------------------------Labeling--------------------------------Case packer-----------------------------Palletizer-------------------------------Warehousing------------------------------
Total--------------------------------
ll Variable and not shown in the total.
$25,000 20,000 60,000
110,000 100,000
25,000 136,000 25,000 20,000 75,000 1/
596,000
lf Estimates of investment costs and operational costs were supplied by >'< * *, a producer of domestic juice.
14

A-15
In order to produce domestic apple juice for retail sale from domestic apples, a firm needs both preparation equipment and packaging equipment. In order to reconstitute apple juice from concentrate, a firm needs only packaging equipment, which represents a much smaller investment.
There are many companies with presses that produce domestic apple juice. The larger ones (about 25 firms) are known to the Commission; the smaller firms have not all been identified by the parties, nor could they be identified by the Commission. The larger ones account for about 75 to 80 percent of the total production of domestic apple juice. Three of the largest firms are Tree Top, Cadbury Schweppes (Duffy Mott), and Seneca. They account for an estimated * * * percent of total sales of apple juice (imported and domestic combined.)
Concentrators of domestic juice
Producers of CAJ produce it by dehydrating and concentrating singlestrength juice in evaporators; hence, they are called concentrators. Such operations require investment in evaporators and other equipment to make the concentrate.
Questionnaire responses and other information indicate that at least 16 U.S. firms produced CAJ or had the capacity to produce CAJ from domestically grown apples during 1981-85. By 1985, several of these firms closed or idled completely their capacity to produce CAJ or were no longer in existence. These domestic CAJ producers include Coca Cola in Michigan, which ceased production in 1982 and thereafter purchased imported CAJ; Musselmans in Pennsylvania, which was sold in 1981 to another firm that did not utilize the CAJ capacity and subsequently sold it to Knouse in 1984, which did not refurbish the CAJ capacity; and the Sebastopol Cooperative in California, which went out of business in 1983 and the facilities of which were acquired shortly thereafter from the banks by the Vacu-Dry Co. !f The Albion Cooperative in New York went out of business in 1985. American Conserving Co. in Washington State ceased operations, and its CAJ concentrating equipment was liquidated. One of the smaller concentrators that concentrates other fruit juices besides apple juice (Gama Foods in Washington State) stated that American Conserving went out of business because it tried to survive by producing apple juice concentrate only; "apple alone cannot carry a small company because the margins in CAJ are too small. One has to be large, as Tree Top, or has to diversify the concentrate product line as Gama Foods in order to stay in business, at least here (in Washington State.)" ?:J The Michigan concentrators closed or idled are Cherry Hill and R.V. Saur.
Most large producers of domestic apple juice (Tree Top, Duffy Mott, Seneca, Knouse, etc.) own concentrating equipment, and some smaller producers of domestic single-strength apple juice also own such equipment. By concentrating apple juice, the costs of storing and transporting juice are reduced significantly; to reduce such costs was the purpose of Cadbury
!f Vacu-Dry refurbished this CAJ capacity in 1985. ~/ Telephone conversation with the president of Gama Foods, May 5, 1986.
15

A-16
Schweppes when it built * * * concentrating facility, in 1984/85. In addition, other firms, generally smaller in si3e, are or have been primarily in the business of concentrating apple juice or fruit juices with an emphasis on apple juice. Currently all large-capacity CAJ-producing plants are owned by large producers of domestic apple juice.
Reconstitutors
Reconstitutors are firms that purchase CAJ, dilute it by adding water, and package single-strength reconstituted juice into retail-size containers. Some reconstitutors dilute the CAJ from 69 to 72 degrees Brix to 45 degrees Brix and package it into retail-size frozen concentrate (6 ounces, 12 ounces, and so forth). Reconstitutors generally use only imported CAJ; they do not press apples, nor do they buy domestic apple juice in bulk and retail package it or blend it with imported CAJ.
Bottlers
Bottlers are firms that also package single-strength apple juice in retail-size containers. Similar to reconstitutors, bottlers do not press fresh apples. Unlike reconstitutors, however, bottlers may purchase domestic juice in bulk containers. Bottlers may also reconstitute CAJ themselves and retail package some, or they may blend purchased domestic single-strength juice with imported CAJ.
U.S. importers
More than 100 companies imported CAJ in varying quantities during 1981-85. Some of the apple juice concentrate is imported by food-trading companies, many of which specialize in fruit concentrates and flavors. The importing trading companies, in turn, sell the CAJ to U.S. firms that use the imported CAJ. Many of the U.S. user firms also import some or all of their needs directly rather than purchasing from the U.S. importer-trading companies.
The imported apple juice is shipped from the foreign sources to the United States in 5-gallon pails, 50- to 60-gallon plastic or steel drums, or in 3,000- to 3,800-gallon high-strength flexible plastic bags/containers. Generally, the importers arrange for shipments to be forwarded directly to the users/purchasers; rarely do the importers keep inventories of imported CAJ.
U.S. importers were asked what determines the country of origin for their imports of CAJ. The responses indicate that, in addition to supply, price, and quality, the seasonal availability of foreign CAJ is also a factor in the importers' selection of foreign suppliers. U.S. importers seek out countries whose supply of apple juice exceeds local demand. Eighty-two percent of the responding importers purchase from more than one country; the larger importers purchase from 6 to 9 different countries. Seventy-three percent purchase from countries in both hemispheres to assure year-round supply.
16

A-17
Some of the CAJ imported from West Germany and Austria originates in Eastern European countries; .!J it is reprocessed in Western Europe before export to the United States. One importer reported the following:
* * * * * * *
Some U.S. importers are exclusive agents/importers for specific foreign exporters/producers of CAJ. The exclusive importing rights are generally based on long-term business relationships and verbal agreements between the larger foreign producers and U.S. importers, rather than on written contracts.
Channels of distribution
Users of imported CAJ purchase the concentrate through U.S. importers and directly from foreign sources (table 1). Such users consist of producers of domestic apple juice that blend apple juice produced from domestically grown apples with imported concentrate, reconstitutors of apple juice from concentrate, producers of mixed fruit juices and beverages, and other food producers such as bakeries, wineries, and so forth. Table 2 provides estimates of the total quantity of concentrated apple juice sold by importers to these producers. During 1981 and 1985, the largest shares of imported CAJ were sold to companies that blend imported concentrate with juice produced from domestically grown apples, followed by reconstitutors of single strength and threestrength frozen concentrated apple juice for retail sale (44 to 46 degree Brix). Sales of imported CAJ to producers of mixed fruit juices and drinks increased from 5.3 percent of total sales in 1981 to 9.1 percent in 1985.
Table 1.--Concentrated apple juice (CAJ): Distribution of purchases from U.S. importers and directly from foreign sources, crop years 1980/81 to 1984/85
(In percent)
Item 1980/81 1981/82 1982/83 1983/84 1984/85
Purchases from: U.S. importers-------------: 50.4 58.5 35.3 35.8 42.6 Foreign sources directly---:~~-4_9_._6~~~4_1~.5~~~-6_4_._7~~~-6_4_._2~~~~5_7_._4
Total--------------------: 100.0 100.0 100.0 100.0 100.0
Source: Compiled from data submitted in response to questionnaires of the U.S. International Trade Commission .
.!J Transcript of the hearing, p. 46.
17

A-18
Table 2.--Concentrated apple juice (CAJ): Importers' sales of imports, by types of users, 1981 and 1985
1981 1985 Type of user
Quantity Percent of total Quantity Percent
of total
Companies that blend imported
1,000 gallons
1,000 gallons
CAJ with domestic juice------: 2,243 41.4 9,780 49.7 Reconstitutors or bottlers-----: 1,982 36.6 4,648 23.6 Producers of frozen concen-
trate (44 to 46 degree Brix)-: 656 12.l 2,327 11.8 Other producers of apple
juice products---------------: 62 1.1 50 .3 Producers of mixed fruit
juices and drinks------------: 288 5.3 1,788 9.1 Other food producers-----------: 148 2.7 923 4.7 Dairy companies----------------: 37 .7 161 .8
Total----------------------: 5,416 100.0 19. 677 100.0
Source: Compiled from data submitted in response to questionnaires of the U.S. International Trade Commission.
Note.--Because of rounding, figures may not add to the totals shown. Quantities are in 1,000 gallons of concentrate.
Producers of domestic apple juice package the juice in bottles or cans for retail sale. The bulk of such juice is sold to retail stores directly or through brokers or wholesalers. Some domestic apple juice, however, is sold in bulk to bottlers or dairy companies with bottling facilities, which package the juice and distribute it to retail stores, and a portion of the juice is sold to food services. Finally, a small percentage is sold to producers of mixed fruit juices and blends. Questionnaire responses concerning such sales are presented in table 3.
Data on sales of apple juice by producers of reconstituted CAJ, provided in table 4, are limited to a few questionnaire respondents that account for only a small share of total sales. These responses indicate that total sales have shifted from food service industries to the retail market, particularly direct sales to retail stores.
18

A-19
Table 3.--Single-strength apple juice: Distribution of sales by producers of domestic juice, by types of purchasers, 1981 and 1985
1981 1985 Type of purchaser Percent Percent Quantity of total Quantity of total
1,000 1,000 gallons gallons
Retailers----------------------: 13,866 31.9 17,884 29.3 Brokers/distributors-----------: 22,347 51.3 30,669 50.3 Bottlers-----------------------: 3,473 8.0 5,506 9.0 Dairy companies----------------: 77 .2 1,966 3.2 Food service suppliers---------: 3,147 7.2 4,758 7.8 Producers of other fruit
juice------------------------: 612 1.4 228 .4 Total----------------------: 43,522 100.0 61,0ll 100.0
Source: Compiled from data submitted in response to questionnaires of the U.S. International Trade Commission.
Note.--Quantities are in 1,000 gallons of single-strength juice.
Table 4.--Single-strength apple juice: Distribution of sales by reconstitutors, by types of purchasers, 1981 and 1985
1981 1985 Type of purchaser Percent Percent Quantity Quantity of total of total
1,000 1,000 gallons gallons
Retailers----------------------: 66 4.4 2,368 40.5 Wholesalers/distributors-------: 637 42.7 2,334 39.9 Bottlers-----------------------: Dairy companies----------------: Food service suppliers---------: 788 52.9 1,145 19.6 Producers of other fruit
juice------------------------: Total----------------------: 1,491 100.0 5,847 100.0
Source: Compiled from data submitted. in response to questionnaires of the U.S. International Trade Commission.
Note.--Quantities are in 1,000 gallons of single-strength juice.
19

A-20
Transportation factors affecting demand
The effects on regional markets of the transportation of juice apples from the grower to the producer, imported concentrate from the port of entry to the producer, and single-strength juice from the producer to the retail market are examined below.
Data from questionnaire responses indicate that the maximum distance juice apples are transported from growers to producers of domestic juice ranges from 10 to 900 miles, with an average maximum distance of roughly 350 miles in all regions of the United States. These data also indicate that the maximum distance single-strength juice is transported from producers to retail markets ranges from 120 to 3,000 miles, with an average maximum distance of roughly 1,300 miles. The costs of transportation as a share of the price of juice apples and single-strength juice, calculated from questionnaire data, are provided in table 5. These data indicate that such costs are very large for juice apples, ranging from 10.5 percent for distances less than 100 miles to over 40 percent for distances of 500 to l,000 miles. Transportation costs for apple juice are lower than those for juice apples, although still very large, ranging from 4.5 percent for distances less than 100 miles to 27.9 percent for distances greater than 1,000 miles. Therefore, producers of domestic juice tend to be located nearer to the orchards that supply their apples than to their markets for juice.
Table 5.--Apples and apple juice: Transportation costs as a share of the price, by distances
Product
Juice apples-------: Single-strength
juice------------:
y Not available.
Less than 100 miles
10.5
4.5
(In percent)
100-500 miles
Distance
24.9
9.6
500-1,000 miles
43.5
13.2
Greater than l,000 miles
y
27.9
Source: Compiled from data submitted in response to questionnaires of the U.S. International Trade Commission.
CAJ is imported through most major ports in the United States. The largest quantities of imports in 1985 were entered in New York, Washington, Florida, Maryland, and California. With the exception of Florida, these areas are also major apple-growing regions of the United States. Thus, imported concentrate appears to be competing in the same geographic markets in which juice is produced.
20

A-21
Apple Industry Trade Associations
International Apple Institute
The International Apple Institute (IAI) is a trade association whose stated purpose is to provide the means for all segments of the apple industry to join in appropriate collective efforts to profitably produce and market apples and apple. products. ·IAI promotes the use of apples and apple products, collects aggregate data, and assists in the formulation of legislation and regulations that affect the IAI's membership, which includes U.S. growers, processors, brokers, warehousers, distributors, jobbers, retailers, shippers, truckers, related trade associations, and professionals. IAI's membership also includes U.S. importers of CAJ and foreign exporters and producers in 26 foreign countries, including the major suppliers of the CAJ imported into the United States.
IAI is governed by a 30-member Board of Trustees; 15 members are elected from among the U.S. apple grower members of IAI, and the other 15 trustees represent the other segments of the apple industry (processing, shipping, etc.) IAI supports the effort of seeking relief from the subject imports.
Processed Apple Institute
Originally a trade association of producers of domestic apple juice and their suppliers and related industries, the Processed Apple Institute (PAI), since March 1986, allows among its membership reconstitutors and bottlers, as well. PAI performs legislative and regulatory work, including pursuing regulations for labeling the country of origin on the retail product. PAI also performs technical work related to the manufacturing processes employed by the industry. PAI has remained neutral in the current investigation.
Grower associations
Trade, promotion, lobbying, and research associations whose purposes are to benefit apple growers are nearly all based on a Statewide membership, although some regional groups have a wider base, such as the New York and New England Apple Institute. Every State with significant apple production has its own associations that apple growers may join. Those with "Horticultural Society" as part of the title concern themselves largely with production management questions; those with "Commission" or "Board" as part of the title are usually concerned with promotional activities for fresh apples; and the American Farm Bureau Federation and its state chapters, of which many apple growers are members, pursue a wide range of lobbying activities for their members with various governing bodies.
21

A-22
Apparent U.S. Consumption
U.S. per capita consumption of apple juice has trebled since 1975, while per capita consumption of fresh apples and apple products has remained relatively stable, as shown in table 6.
Table 6.--U.S. per capita consumption of apples apple products, 1975-84
(In 12ounds of fresh-weight eguivalents~
Year
1975---------------: 1976---------------: 1977---------------: 1978---------------: 1979---------------: 1980---------------: 1981---------------: 1982---------------: 1983---------------: 1984---------------:
y Sauce and slices. y Not available.
Fresh
19.l 17.1 16.9 17.5 17.6 19.l 16.8 17.9 18.4 18.1
. . ;canned y;
4.2 3.0 3.3 3.6 3.3 3.3 2.7 2.7 3.1
y
.Juice Frozen
4.4 0.8 5.1 .7 5.1 .7 6.5 .7 8.1 .6 7.3 .6 9.9 .6
11.0 .7 13.2 .5 y y
and
Dried
1.0 1.1 1.0 1.0 1.0 1.0 1.1
.9
.9 y
Source: U. S. Department of Agriculture, Economic Research Service.
Total
29.5 27.0 27.0 29.3 30.6 31.3 31.l 33.2 36.2
y
Table 7 shows U.S. production, imports, apparent consumption, and market penetration of apple juice in the United States during crop years y 1980/81 to 1984/85 and estimated data for crop year 1985/86. Comparable data, as well as the producer price index for apple juice from all sources, for crop years 1975/76 to 1984/85 are shown in table 8. As indicated, U.S. production was highest in crop year 1980/81, when the largest apple crop was harvested. Consumption decreased in crop year 1981/82 and then increased steadily through crop year 1984/85.
y The crop year extends from .July 1 of one year to .June 30 of the following year.
22

A-23
Table 7.--Apple juice: Apparent U.S. consumption on a single-strength basis, crop years 1980/81 to 1984/85 and July-January of crop years 1984/85 and 1985/86
July-Jan-- y :1980/81'.1981/82:1982/83:1983/84:1984/85: . Item . . . . . . ; 1984/85; 1985/86
U.S. production of single-strength apple juice
million gallons--: U.S. imports: '±/
Quantity million gallons--:
Percent change from : previous year-----:
Apparent U.S. consumption: y
Quantity
182 153
70 75
+52 +7
154 169 158 158 153
139 138 196 107 116
+85 0 +42 +8
million gallons--: 252 228 293 307 354 265 269 Percent change from :
previous year-----: Ratio of imports to-- :
U.S. production percent--:
U.S. consumption percent--:
U.S. population million people--:
y -9
38 49
28 33
227 230
+28 +5
90 82
47 45
232 234
+15 y +2
124 y 68 y 75
55 y 40 y 43
236 236 238 Apparent U.S. annual
per capita consump- : tion-------gallons--: 1.1 1.0 1.3 1.3 1. 6 y y
y Data on U.S. production for 1984/85 are for the full crop year and for 1985/86 are estimated for the full crop year based on crop production in 1985; data on imports are for the periods from July to January. Hence, ratios are not comparable with those for the full crop years.
y Exports of apple juice are not separately reported in official U.S. statistics. According to questionnaire responses, exports of apple juice are less than 1 percent of production.
y Not available. '±J Pear juice excluded.
Source: Compiled from official statistics of the U.S. Departments of Commerce and Agriculture, except as noted.
23

A-24
Table 8.--Apple juice: U.S. production, imports, apparent U.S. consumption, and Producers' Price Index, crop years 1975/76 to 1984/85
Crop year
U.S. . productioh :of domestic · juice
U.S. imports
y
Apparent U.S.
consumption
---------Million gallons--------
1975/76----: 104 27 131 1976/77- - - - : 96 29 125 1977/78----: 109 42 151 1978/79----: 129 63 192 1979/80----: 169 46 215 1980/81----: 182 70 252 1981/82----: 153 75 228 1982/83----: 154 139 293 1983/84----: 169 138 307 1984/85----: 158 196 354
y Pear juice excluded. y Data are for calendar years.
Ratio of imports to
consumption
Percent
21 23 28 33 21 28 33 47 45 55
:Producers' real :price index for
apple juice from all
sources 2/ 1975=100.0
100.0 107.2 117.6 132.8 127.0 112.3 120.l 112.l 107.8
99.7
Source: U.S. production, calculated from data of the U.S. Department of Agriculture, Crop Reporting Board; U.S. imports, compiled from data of the U.S. Department of Commerce; is computed from data provided for 1985 Apple Crop Statistics and Market Analysis, American Agricultural Marketing Association and deflated using the wholesale price index.
The Question of Increased Imports
U.S. imports
Imports of apple juice enter under TSUS item 165.15, which covers both apple and pear juice. Apple juice makes up the large majority of th.e imports under this item and nearly all is imported in concentrated form. Importers receiving the Commission's questionnaires were asked what share of their imports is represented by apple juice. The staff estimates that responding importers accounted for almost all pear juice imports but only about 60 percent of apple juice imports. Therefore, the share of pear juice imports for all importers was adjusted. Both reported and adjusted shares are shown in the following tabulation (in percent):
Period
Crop year: 1981/82---------------------1982/83---------------------1983/84---------------------1984/85---------------------
July-December: 1984/85---------------------1985/86---------------------
Share of apple juice in total imports
Reported Adjusted
99 99 92 93
93 96
99 99 95 95
95 97
24

A-25
Import statistics will be discussed on a crop-year basis (July of one year through the following June). Import statistics are collected on the basis of gallons of natural unconcentrated juice or gallons of reconstituted juice.
Crop-year data.--Imports of apple and pear juice increased from 70 million gallons, valued at $52 million, in crop year 1980/81 to 209 million gallons, valued at $140 million, in 1984/85 (table 9). This represents a 198-percent increase in quantity and a 169-percent increase in value over the period. Imports also increased from 113 million gallons, valued at $79 million, in July 1984-January 1985 to 120 million gallons, valued at $78 million, in July 1985-January 1986 (table 10).
In terms of value, Argentina was the primary supplier in crop years 1980/81 through 1982/83 but slipped to second place in 1983/84 and 1984/85. West Germany was the primary supplier in the latter 2 crop years, moving up from fourth place in 1981/82. Austria, the third largest supplier in crop years 1983/84 and 1984/85, was not among the top 10 suppliers in crop years 1980/81 and 1981/82.
The top three suppliers accounted for 79 percent of total imports in crop year 1980/81; their share then declined to about 60 percent of the total in the remaining years. The top three suppliers in July 1984-January 1985 and July 1985-January 1986 were Argentina, West Germany, and Austria; they accounted for about 60 percent of total imports. Imports converted to a CAJ basis for major suppliers are shown in table 11 . .!/
Quarterly data.--Quarterly import data are presented in appendix D for crop years 1980/81 through 1984/85. In 1980/81, 1982/83, and 1984/85, quarterly imports increased from July-September to April-June. In 1980/81, there was a 179-percent increase, and in the latter 2 years, there were increases of about 29 percent. In contrast, crop year 1981/82 had high imports in the July-September and April-June quarters, and crop year 1983/84 had high imports in October-December and January-March. These quarterly trends seem to be dictated by the trends of one or two of the largest suppliers.
Customs district data.--The primary Customs district for entry of imports of apple or pear juice is New York, which accounted for approximately 30 percent of total imports during 1980-85 (table 12). The next three largest entry districts were Seattle, Tampa, and Baltimore. Imports entering New York showed a steady increase from 14 million gallons in 1980 to 57 million gallons in 1985, reflecting a similar increase in total imports from 44 million gallons in 1980 to 214 million gallons in 1985 .
.!f CBERA countries did not export any CAJ to the United States until 1985; imports from such countries represented a minute (0.03 percent) share of total imports in that year.
25

A-26
Table 9.--Apple or pear juice: U.S. imports for consumption, by principal sources, crop years 1980/81 to 1984/85
Source 1980/81 1981/82 : 1982/83 : 1983/84
Quantity (1,000 gallons)
1984/85
West Germany--------------: 3,662 6,184 35,025 34,802 49,736 Argentina-----------------: 38,979 32,166 38,180 36,230 51,685 Austria-------------------: 682 1,072 10,339 13,962 23,884 Netherlands---------------: 2,582 3,620 9,154 9,327 17,195 Spain---------------------: l,769 6,375 8,261 12,620 16,601 South Africa--------------: 12,196 9,973 10,328 11,275 14,952 Hungary-------------------: 354 570 1,054 2,860 6,131 Chile---------------------: 1,688 1,428 2,072 4,237 6,017 France--------------------: 1,206 893 7,618 420 2,982 Switzer.land---------------: 802 0 5,957 422 3,754 Israel--------------------: l,260 2,643 1,173 l,623 1,601 All other-----------------: 5,145 11,517 10,666 17,397 14,650
~~~~~~~~~'--~.=.o.~"'-"--'----="-'~-'---'--~~"'--"~
Total-----------------:~-7~0~·~3=2=5-'---'7=6~·~44~1~'--=1=3~9~,8~2~7_..:._1~4~5~·=1~7=5-'-~=2=0=9~,1~8~8
Value (l,000 dollars)
West Germany--------------: 2,830 5,202 27,849 26,443 34,395 Argentina-----------------: 28,316 25,037 30,389 23,761 30,686 Austria-------------------: 562 842 8,653 12,154 17,407 Netherlands---------------: 1,913 3,595 6,991 9,253 13,541 Spain---------------------: l,469 6,095 7,024 9,547 11,522 South Africa--------------: 9,547 7,575 8,714 8,189 9,281 Hungary-------------------: 180 333 l,821 2, 763 4, 711 Chile---------------------: l,034 1,417 2,194 3,086 3,757 France--------------------: l,490 624 5,615 762 2,163 Switzerland---------------: 574 4,196 262 1,986 Israel--------------------: 850 2,485 l,013 1,281 l,152 All other-----------------:~--=3~·=5=0=2-'---=l~l~·=l~98"--''--~~9~,0~7=3'--'---'1~3~,=3=3=8-'-~~=9~,6~9~8
Total-----------------=~~5~2~·=2=6~7-'---=6~4~·~4=03"--''--=1=14~,0~4~0_..:,_l~l~0~,=8=3=9-'-~=1~4=0~,2~9::.=9
Unit value (per gallon)
West Germany--------------: $0.77 $0.84 $0.80 $0.76 $0.69 Argentina-----------------: .73 .78 .80 .66 .59 Austria-------------------: .82 . 79 .84 .87 . 73 Netherlands---------------: .74 .99 .76 .99 .79 Spain---------------------: .83 .96 .85 . 76 .69 South Africa--------------: .78 .76 .84 .73 .62 Hungary-------------------: .51 .58 l.73 .97 .77 Chile---------------------: .61 .99 l.06 .73 .62 France--------------------: l.24 .70 .74 l.81 .72 Switzerland---------------: .72 .70 .62 .53 Israel--------------------: .67 .94 .86 .79 .72 All other-----------------=~~--=·~6~8--=-~~-'-'·9~7"--''--~~=·8~5:......::__~--=-·=7=7-'-~~~=·=6=6
Average---------------: . 74 .84 .81 . 76 .67
Source: Compiled from official statistics of the U.S. Department of Comme:J;tl;,

A-27
Table 10.--Apple or pear juice: U.S. imports for consumption, by principal sources, July-September, October-January, and crop year to date, 1984/85 and 1985/86
Source July
Sept. Oct.Jan.
Crop year to date 1984/85
JulySept.
Oct.Jan.
Quantity (l,000 gallons)
Crop year to date 1985/86
Argentina----------: 18,196 21,153 39,349 18,082 15,703 33,785 West Germany-------: 9,008 11,934 20,942 10,566 13,387 23,953 Austria------------: 5,972 5,524 11,496 7,790 5,993 13,783 Spain--------------: 2,865 5,386 8,251 3,123 8,437 11,560 Netherlands--------: 3,016 5,113 8,129 4,834 4,663 9,497 South Africa-------: 2,820 6,122 8,942 5,586 1,317 6,903 Chile--------------: 2,360 1,199 3,559 2,594 1,399 3,993 Australia----------: 0 140 140 1,259 963 2,222 France-------------: 56 572 628 662 448 1,110 Canada-------------: 513 514 1,027 418 880 1,298 Israel-------------: 74 304 378 217 286 503 Switzerland--------: 901 1,667 2,568 21 39 60 All other- - - - - - - - - - : -=-1 z..:• 5:..:2:..:6'--'---'5""''-'6:.::8c.::2__:_ __ _,_7_,_, =-2 0:::8:......:_=-2 -'-'' 6:::3:..:9"-..!_8::.i.:• 3:..:0:.::8c__.:_ __ _,,l:.::0_,_, =--9 4~7
Total----------:_47~,3~0~7--'-_6_5~,'-'3=1~0~-=1=1=2_,_,-'-61~7---'---=-5-'-7,_,7:..:9:..:1:......:--=.61~,8=-=2=3----'-----'1=1~9_,_,-'-61=-c.4
Value (1,000 dollars)
Argentina----------: 11,566 12,352 23,918 9,993 8,876 18,869 West Germany-------: 6,847 9,400 16,247 6,278 9,815 16,093 Austria------------: 4,364 4,430 8,794 5,461 4,091 9,552 Spain--------------: 1,927 4,463 6,390 l, 769 6,434 8,203 Netherlands--------: 2,998 4,022 7,020 3,192 3,139 6,331 South Africa-------: 1,920 3, 778 5,698 2,591 1,198 3,789 Chile--------------: 1,813 723 2,536 l,609 679 2,288 Australia----------: 100 100 654 745 1,399 France-------------: ll2 488 600 472 762 1,234 Canada-------------: 620 506 1,126 442 791 1,233 Israel-------------: 175 284 459 ll3 163 276 Switzerland--------: 643 8ll 1,454 55 95 150 All other - - - - - - - - - - : -,-1~, 2=5=3--'--,-3~,'-'3-'-9~3~---=~4_,_, _,_6 4c..6:......:_.=l.,_, 6=-4-"8'----'~-'-7 ,_, 0:..:0:..:5----'---~8_,_, -'-6 5=-=.3
Total----------:-=-34-'-'-',2=3:.::8__:._4c..4~,'-'7=5~0-'-----'-7=8_,_,=--98=-8:......:--=.3_,_4-'-',2=-7:..:7:......:___,_4=-3,_,7:..:9:..:3'--'---=7=8_,_,=-07~0
Unit value (per gallon)
Argentina----------: $0.64 $0.58 $0.61 $0.55 $0.57 $0.56 West Germany-------: .76 .79 .78 .59 .73 .67 Austria------------: .73 .80 .76 .70 .68 .69 Spain--------------: .67 .83 .77 .57 .76 .71 Netherlands--------: .99 .79 .86 .66 .67 .67 South Africa-------: .68 .62 .64 .46 .91 .55 Chile--------------: .77 .60 .71 .62 .49 .57 Australia----------: .71 .71 .52 .77 .63 France-------------: · 1.98 .85 .96 . 71 1. 70 l.ll Canada-------------: 1.21 .98 1.10 1.06 .90 .95 Israel-------------: 2.37 .93 1.21 .52 .57 .55 Switzerland--------: .71 .49 .57 2.57 2.44 2.50 All other----------: __ .:..:8:..:2:......:--=-·=-60~~------'-"-'-64~~-=·=6=2'--'-__ .:..:8~4:......: ____ .:..:7~9
Average--------: .72 .69 .70 .59 .71 .6~7
Source: Compiled from official statistics of the U.S. Department of Commerce.

A-28
Table 11.--Concentrated apple juice (CAJ): .!/ U.S. imports for consumption from specified major suppliers, annually and by quarters, crop years 1980/81 to 1984/85, July 1984-January 1985, and July 1985-January 1986
Period
1980/81-------: 1981/82-------: 1982/83-------: 1983/84-------: 1984/85-------: July-Jan.--
1984/85-----: 1985/86-----:
1980/81: July-Sept---: Oct-Dec-----: Jan-Mar-----: Apr-June----:
1981/82: July-Sept---: Oct-Dec-----: Jan-Mar-~---:
Apr-June----: 1982/83:
July-Sept---: Oct-Dec-----: Jan-Mar-----: Apr-June----:
1983/84: July-Sept---: Oct-Dec-----: Jan-Mar-----: Apr-June----:
1984/85: July-Sept---: Oct-Dec-----: Jan-Mar-----: Apr-June----:
(In thousands of gallons 2/)
European
West Nether-: G Austria: lands Spain ermany:
469 793
4,491 I
4,462 6,376
2,685 3,071
38 20 32
379
252 196 227 118
476 1,009 l,807 l,199
810 1,278 1,392
982
1,155 1,001 2,166 2,054
88 137
1,325 1,790 3,062
1,474 1,767
48 2 6
32
57 16 61
3
39 381 451 454
368 436 510 476
766 505
1,004 787
331 464
1,173 l,196 2,205
1,042 1,218
0 51 65
215
13 86
139 226
410 253 281 229
230 373 408 185
387 492 688 638
227 818
l,059 l,617 2,128
1,058 1,482
16 25 47
139
54 184 455 125
74 364 376 245
46 430 760 381
367 431 639 691
Southern Hemisphere
Argen- South tina Africa
4,997 4,123 4,896 4,646 6,626
5,045 4,331
654 1,120 1,463 1,760
1,501 477 294
l,851
2,068 l,165
265 1,398
1,825 l,234
785 802
2,333 2,121
922 l,250
l,563 1,278 1,324 1,446 1,918
l,146 885
237 518 390 418
458 274 231 315
552 300 192 280
451 415 311 269
362 666 279 611
.!/ Includes pear juice estimated at 5 percent annually.
Total
9,015 9,800
17,927 18,612 26,819
14,438 15,335
l,246 l,907 2,386 3,476
2,810 l,789 2,003 3,198
3,916 4,186 4,760 5,065
4,369 4,946 5,330 3,967
6,065 6,158 6,786 7,810
~Conversion factor used was 7.8 gallons of single-strength juice per l gallon of CAJ.
Source: Compiled from official statistics of the U.S. Department of Commerce, as noted.
28

A-29
Table 12.--Apple or pear juice: U.S. imports for consumption, by principal U.S. Customs districts, 1980-85
{In thousands of single-strength gallons2
Customs district 1980 1981 1982 1983 1984
New York, NY--------------: 14,157 23,392 31,268 41, 770 53,611 Seattle, WA---------------: 3,226 1,739 6,581 21,337 20,722 Tampa, FL-----------------: 8,065 26,192 24,319 30,094 33,758 Baltimore, MD-------------: 3,993 4,202 12,949 10,455 12,937 Los Angeles, CA-----------: 3,580 7,454 6,316 11,973 9,487 Boston, MA----------------: 3,430 3,125 4,894 8,408 9,602 Buffalo, NY---------------: 221 1,852 2,344 5,151 7,617 Detroit, MI---------------: 267 460 405 2,235 2,940 San Francisco, CA---------: 2,751 1,831 3,194 3,394 3,115 Philadelphia, PA----------: 131 l,134 361 331 1,356 Houston, TX---------------: 305 2,309 3,515 3,849 3, 776 Charleston, SC------------: 188 732 801 1,185 921 Ogdensburg, NY------------: 172 382 218 182 215 Chicago, IL---------------: y 20 58 746 1,526 New Orleans, LA-----------: 1,024 1,398 321 831 1,338 All other-----------------: 2,040 5,381 6,214 7,354 4,939
1985
56,983 34' 591 32,398 23,500 14,238 12, 184
7,345 6,681 4,919 4,816 4,573 2,969 2,196 2,102 1,663 3,283
Total-----------------: 43,550 81,603 :103,758 :149,295 :167,860 :214,441
y Less than 500 gallons.
Source: Compiled from official statistics of the U.S. Department of Commerce.
U.S. exE:orts
Statistics on exports of apple juice from the United States are not collected separately or on the same basis as import statistics. Exports of apple juice are reported under three schedule B items: 165.26 (other unconcentrated fruit juice), 165.60 (other frozen concentrated fruit juice), and 165.88 (other not frozen concentrated fruit juice). Exports of apple juice are believed to account for only a small part of these fruit juice exports. U.S. exports aggregated for these three fruit juice categories averaged about 25 million single-strength gallons for crop years 1980/81 through 1984/85 (table AP-6 in app. D).
Questionnaire responses from producers of domestic apple juice indicate that exports of apple juice were less than l percent of production. If U.S.-produced CAJ were exported to the European Community it would be dutiable at 42 percent ad valorem. The Canadian MFN customs duties for apple juice range from 5 to 10 percent ad valorem.
29

A-30
The Question of Serious Injury
U.S. plant closings
Apple growers and processors were asked for iifformation concerning any firms or plants that produced apple juice or CAJ from domestic apples that have closed or were idled in recent years. Responses and testimony yielded the following list of plants that ceased pressing domestic juice apples or went out of business during 1981-85:
State NW..ber
New York-------- 7 Michigan-------- 4 California------ 2 Pennsylvania---- l Virginia-------- l North Carolina-- 1 Washington------ 1
Total------- 17
Of the CAJ plants closed entirely, the Albion Cooperative and the Coca Cola plant had the largest capacities. !/ Albion's plant was an investment by apple growers in New York State specifically to produce domestic CAJ. The supporters of import relief, including Albion's former general manager, testified at the Commission's hearing that the facility was a state-ofthe-art plant operating 3 shifts with 58 employees, which went bankrupt in 1985. Because their potential customers for CAJ would buy from them only at world market prices, Albion could only have paid to growers such low prices for juice apples that no one would sell them. '!:./ Opponents of relief contend that Albion was a victim of inadequate grower support because growers preferred to sell their juice apples to other purchasers for cash rather than wait for the cooperative to distribute its proceeds. ~ In addition, * * * stated that Albion was "too small to be profitable." !!J
In Michigan, a major apple-growing State where more than one-third of the annual crop is used as juice apples, there were at lellst 28 firms that processed apples during 1981-85, and 21 of these firms produced apple juice. Three of the firms had the capacity during 1981-85 to produce CAJ: the Coca Cola plant in Paw Paw; Cherry Hill Processing, Inc., in Bailey; and Morrison Orchards in Williamsburg. Coca Cola stopped CAJ production in 1982, partly because its apple-unloading facilities were not winterized and the firm decided that it was not economical to put new investments irito a manufacturing
!/ * * *· ?:J Transcript of the hearing, p. 43; posthearing brief of the American Farm Bureau Federation and the Farm Bureaus of 28 States, pp. 29-30. ~ Respondents' posthearing brief, pp. 19-20. y Staff interview with * * *
30

A-31
plant for domestic CAJ. !/ In its questionnaire response, Coca Cola stated that it"***·" y Cherry Hill, whose principal business was the production of CAJ, went into bankruptcy in October 1983. ~ Morrison Orchards continued to produce CAJ during 1981-85, although at a very low capacity utilization rate. '!/
Knouse Foods has five concentrating plants, three of which haven't operated for 4 years and one that has not operated for 3 years. The fifth plant is operated only to keep the new equipment in use, but well below capacity. ~ Smucker idled its CAJ plant in California in 1984. U.S. Grape had a significant CAJ capacity but left the CAJ business entirely in 1983, closing its plant in Sunnyside, WA, and stating that the low price of offshore concentrate made production of domestic CAJ unprofitable. Gerber Foods was a producer of domestic juice in New York; Gerber closed its plant in 1985 * * *·
U.S. production, capacity, and shipments
U.S. production and utilization of apples.--Table 13 shows U.S. production and utili~ation of apples during crop years 1980/81 to 1984/85. Production of all apples decreased from 8.8 billion pounds in 1980/81 to 7.8 billion pounds in 1981/82, or by 12 percent. Production increased in the next 2 years and averaged 8.3 billion pounds during crop years 1982/83 to 1984/85. Juice apple production has almost doubled since 1970 (table 14). From 1980/81 to 1981/82, production of juice apples decreased by 16 percent; it subsequently increased together with total apple production. The share of. juice apples in total apple production has also increased since 1970, from 16 percent to over 20 percent. During crop years 1980/81 through 1984/85, it remained relatively stable, ranging between 22 and 24 percent, and then decreased to 21 percent in 1985/86.
!/ Telephone interview with T. Butler, May 9, 1986. A representative. of Coca Cola indicated that the capacity of the Paw Paw plant to produce CAJ, which was its only apple juice product, was * * * gallons of concentrate (about ***bushels of apples, or ***percent of the juice apple supply in Michigan in 1982). He also said that the CAJ equipment has been dismantled. (Telephone conversation with***).
y Coca Cola subsequently purchased*** imported CAJ. ~ The estimated capacity of Cherry Hill to produce CAJ was * * * gallons
of concentrate, according to Mr. Butler, who is a trustee for that company's bankruptcy proceedings.
'!J Posthearing brief of counsel for the American Farm Bureau Federation and the Farm Bureaus of 28 States, exhibit 19. ~ Transcript of the hearing, p. 65.
31

A-32
Table 13.-•Apples: U.S. production and utilization, crop years 1980/81 to 1984/85
Item 1980/81 1981/82 1982/83 1983/84 1984/85
Quantity (million pounds, fresh weight)
Fresh, domestic sales--------: 4,276 3,887 3,971 4,165 4,274 Fresh, exports Y------------: 666 567 566 455 390 Not marketed-----------------: 18 48 12 21 14 Canned-----------------------: 1,202 1,002 1,249 1,201 1,169 Juice------------------------: 2,139 1,800 1,808 1,984 1,854 Dried------------------------: 195 190 210 283 284 Frozen-----------------------: 167 173 191 170 198 All other--------------------: 165 87 ll6 95 102
Total production---------: 8,828 7,754 8,122 8,373 8,286 Imports: y
Fresh----------------------: 169 158 216 228 274 Juice----------------·-----: 827 899 1,644 1,707 2,460
Percent of total production
Fresh, domestic sales--------: 48.5 50.2 48.9 49.7 51.6 Fresh, exports Y------------: 7.5 7.3 7.0 5.4 4.7 Not marketed----------·------: .2 .6 .1 .3 .2 Canned-----------------·--·--: 13.6 12.9 15.4 14.4 14.1 Juice-------------------··---: 24.2 23.2 22.3 23.7 22.4 Dried----------·-------------: 2.2 2.5 2.6 3.4 3.4 Frozen----------------·-·----: 1.9 2.2 2.3 2.0 2.4 All other-------------·------: 1.9 1.1 1.4 1.1 1.2
Total production---------: 100.0 100.0 100.0 100.0 100.0 Imports:
Fresh----------------------: 1.9 2.0 2.7 2.7 3.3 Juice-- - - - - - - - - - - - - - - -·- - -- - : 9.4 11. 6 20.2 20.4 29.7
y Fresh exports plus fresh domestic sales equals total fresh utilization; fresh apple exports are calendar-year data.
y Juice imports (from table 9) converted to fresh equivalent weights at the rate of 8.5 single-strength gallons per 100 pound of apples, or, 1 gallon equals 11.76 pounds of apples; fresh apple imports are calendar year data.
Source: Production and utilization, compiled from official statistics of the U.S. Department of Agriculture, Crop Reporting board; exports and imports, compiled from official statistics of the U.S. Department of Commerce as noted.
Note.--Because of rounding, figures may not add to the totals shown.
32

Tabla 14.--Juice apples: U.S. production, by principal States and by crop years, 5-year averages 1970/71 to 1974/75, 1975/76 to 1979/80, 1980/81 to 1984/85, and annually 1980/81 to 1985/86
5-year averages Annual I tea
1970/71-: 1975/76-: 1980/81-: 1974l'.75 1979L80 1984L85 1980/81 1981/82 1982/83 1983/84 1984/85 ; 1985/86 y
Quantity (aillion pounds)
Washington------·-······: 174 311 427 505 430 331 440 432 310 Nev York----------------: 174 222 301 335 214 303 343 310 293 Kichigan----------------: 178 183 289 331 216 367 278 253 391 California--------------: 135 178 232 200 314 246 212 190 245 Horth Carolina----------: 27 82 137 157 133 63 176 155 119 Pennsylvania------------: 76 83 125 162 97 118 117 132 133 Virginia----------------: 66 83 106 91 106 109 128 94 85 All other---------------: 170 254 299 356 288 271 290 288 309
U.S. total----------: 1,000 1,396 1,916 2,137 1,798 1,808 1,984 1,854 1,885
Ratio of juice apples to total utilized apple production (percent)
Vaahington--------------: 11 14 15 17 16 13 14 15 15 Nev York-----------·----: 21 24 29 31 27 27 31 30 29 Kichigan-------·-····---: 27 28 36 37 33 37 37 33 36 California-------··-----: 29 35 46 39 52 51 46 39 46 Horth Carolina----------: 12 28 40 39 36 37 42 43 40 Pennaylvania------·-···-: 16 18 24 28 24 23 23 23 24 Virginia----------······: 15 22 23 22 23 22 28 20 23 All other---------------: 11 15 18 19 18 16 18 18 18
U.S. average--------: 16 20 23 23 23 22 24 22 21
y Estiaated. Juice apple production ia computed froa the total apple crop harvested in 1985 and fro• the average ahare that vea utilized aa juice apples in each State during 1980/81 to 1984/85.
Source: eo.piled froa official atatiatica of the U.S. Departaent of Agriculture, Crop aeporting Board.
> I
"' "'

A-34
Small and large apple growers (those with less than 100 acres of apple trees and those with 100 acres or more, respectively) were sampled separately by the Commission's questionnaires. Tables 15 and 16 show production and sales of apples reported by the two sample groups of growers. !J For the larger growers, sales of juice apples as a share of their total apple production was slightly below the national average, ranging from 15 to 20 percent from crop year 1980/81 to July-December 1985. The comparable share for the smaller growers was usually above the national average, generally 20 to 26 percent, but reached 32 percent in the sample in 1983/84. The larger growers pressed into juice about one-half of 1 percent of their total production; the share was 1 to 2 percent for the smaller growers.
The estimated amount of juice apples not harvested by the smaller growers was no more than 1 percent of their total production during crop years 1980/81 to 1984/85; it then increased to 5 percent in 1985/86. The estimated amount of juice apples not harvested by the larger growers also was no more than 1 percent of their total production during crop years 1980/81 to 1984/85, and then increased to 4 percent in 1985/86. Professor Brunk, testifying for the respondents at the Commission's hearing, stated that crop abandonment is a normal phenomenon in agricultural production. The U.S. Department of Agriculture (USDA) uses 2 percent as normal crop abandonment in apple growing. '!:./
The yield of apple orchards depends on the age of the trees. Table 17 shows the age of apple trees on the farms surveyed by the Commission. No more than 5 percent of the apple trees are over 50 years old. The share of trees in the different age groups was similar for the smaller and larger farms, indicating the presence of uniform orchard management techniques throughout the grower population.
Table 18 shows future production of apples and juice apples forecast by the small and large apple growers surveyed by the Commission. A steady growth in apple production is expected by the growers for 1986-90. The expected share of juice apples in total production, however, is smaller than the actual average in recent years. In light of the fact that juice apples are the least profitable portion of the apple crop, it may be that the low expectations for juice apples reflect hopes of the growers for a relatively greater share in the future for fresh-market apples, which bring higher prices.
U.S. production capacity for apple juice and CAJ.--Single-strength apple juice can be pressed from fresh apples by growers in small-scale operations or by producers in large plants. The aggregate U.S. capacity to press apple juice from fresh apples is made up of a large number of firms. Th8' data reported here should be viewed for trends rather than for absolute values.
!J According to the Bureau of Census, the smaller growers produce about one-half of the total U.S. apple crop. Although the number of larger growers is only 3 percent of the total number of growers, they account for 50 percent of total production.
'!:.! A telephone survey by the Virginia Farm Bureau indicated that 17 percent of Virginia's crop was left on the ground. Posthearing brief of the American Farm Bureau Federation and the Farm Bureaus of 28 States, p. 9, and attachments Nos. 3-8 thereto.
34

A-35
Table 15.--Applei: SmalJ.,er !/ U.S. grover•' production and 1ala1, crop year a 1980/Bl to 1984/85 and July-December 1985 y
Item 1980/81 1981/82 1982/83 1983/84 1984/85 :July-Dec. 1985
T9tal acreage producing all product•-------------------: 4,787 4,833 4,992 5,037 5,234 5,219
Number of acre• of apple tree• producing------------: 1,275 l,304 l,368 1,336 1,360 1,338
All apple• harve1ted 1,000 bu1hels--: 640 606 676 635 641 y 666
Sales of applu: Fre1h-market apple•:
Quantity--l,000 bushels--: 343 343 359 311 361 204 A1 a 1hare of total
harve1ted-----percent--: 54 57 53 49 56 41
Proce11in1 apple•: y Quantity--1,000 bushels--: 115 114 145 114 144 183 A1 a share of total
harvasted-----percent--: 20 19 11 10 11 37
Juice apple• 1old for juice production:
Quantity--1,000 bu1hel1--: 159 136 173 103 111 103 A• a 1hare of total
harve1ted-----percent--: 15 11 16 31 10 21
Juice apple• pressed by or for th• grover to produce apple juice:
Quantity----1,000 bushels--: 10 8 7 9 10 I As a 1hare of total
harvested-------percent--: 1 l l l 1 1
Juice apples not gathered or harvested and left in the orchard: y
Quantity----1,000 bushela--: 6 l 3 3 8 33 Ratio to total apples
harvested-------percent--: l §/ §/ §/ l 5
y Lesa than 100 acres of applea. total production by small grova'ra.
Responding producers accounted for about l percent of
y July-December 1984 data vera requested but not received. y Sales by these groven through Dec. 31, 1985, totaled 498,000 bushels. The balance,
168,000 bushels (15 percent of the harveated crop), remained unsold and in storaa• on that date.
y !%eluding juice apples. y Estimated. §/Lesa than 0.5 percent.
Source: Compiled from data 1ubmitted in rHponH to quutionnairH of the U.S. International Trad& Commission.
35

A-36
Table 16.--Applea: Larger .!I U.S. grover•' production and sale1, crop year1 1980/81 to 1984/85 and July-December 1985 ~
Icem 1980/81
Total acreage producing ail product•---------------••·-: 22,312
Number of acres of apple tree1 producing···-···-···-: 13,266
All apple& harvested: 1,000 bushels·-: 6,300
Sales of apples: Fresh-market applea:
Quantity·-1,000 bushels·•: 2,599 As a share of total
harveated-----percen~·-: 41
Processing apples: !J Quantity·-1,000 buahela·-: 2,352 4a a 1hare of total
harvested···-·percent-·: 37
Juice applaa sold for juice production:
Quantity--1,000 bushel•·-: l,211 Aa a share of total
harvaatad-·-··parcent·•: 20
Juice apple• pressed by or for the grover to produce apple juice:
Quantity-···l,000 bushels··: A• a ahara of total
harveatad·····-·parcent··:
Juice apple• not gathered. or harvested and left in the orchard: Y
Quantil:y····l,000 bushels··: 4a a •hara of total
harveatad·····-·p•rcent··:
29
33
l
1981/82
21,813
13,299
5,898
2,484
42
2,257
31
1,132
19
32
l
62
l
1982/83
26,081
13,355
6,251
2,466
39
2,511
40
l,257
20
30
30
1983/84
23,099
13,509
6,447
2,754
43
2,575
40
l,249
19
32
50
l
1984/85 :July-Dec. 1985
22,733 22,949
13,495 13,663
6,459 y 6,934
2,925 2,057
45 34
2,465 2,763
38 46
961 1,150
15 19
29 30
l
71 243
l 4
.!I Kore than 100 •eras of apples. &eportina producer• accounted for about 7 percent of total production by large grovara. ~ January-December 1984 data vara raquaatad but not received. y Sala• by th••• grovara through Dae. 31, 1915, totaled 6 million buahala. Tha balance
934,000 buahela (13 percent of tha harveated crop), remained unsold end in atoraga on that date.
!J !zcludina juic• apples. ~ Lesa than O.S percent. y Estimated.
Source: Compiled froa data aubllittad in ruponaa to quutionnairu of the U.S. International Trade Commission.
36

A-37
Table 17.--Apples: Age of trees in 1985 on large and small apple farms
Item 1-5 6-14 15-49 50 years: Total years years years or more
Number of acres: Large farms _!/-------------: 3,520 3,804 7,698 746 15,768 Small farms Y-------------: 389 588 721 85 1,783
Total--------------------: 3,909 4,392 8,419 . 831 17,551 Share of total acres of trees:
of all ages (percent): Large farms _!/-------------: 22 24 49 5 100 Small farms Y-------------: 22 33 40 5 100
Total--------------------: 22 25 48 5 100
_!! 54 farms from a 7-State sample of large apple farms each having over 100 acres.
y 40 farms from a 7-State sample of small apple farms each having less than 100 acres of apple trees.
Source: Compiled from data submitted in response to questionnaires of the U.S. International Trade Commission.
Table 18.--Apples: Expected production and share of juice apples in expected production, by farm sizes, 1986-90
Year
Expected production
Large Small
:Index of expected production
Large Small :farms 1/: farms 2/: farms farms
--1,000 pounds-- ----1985=100----
Reported production: 1985---------------: ·7. 636 872 100 100
Expected production: : 1986---------------: 8,466 1,104 111 127 1987---------------: 8,757 1,148 115 132 1988---------------: 8,949 1,199 117 138 1989---------------: 9,381 1,258 123 144 1990---------------: 9,666 1,315 127 151
:Juice use share of :expected production
Large Small farms farms ----Percent----
17.8 21.1
14.6 14.9 14.4 15.2 14.8 14.3 14.7 13.9 14.8 13.7
_!! Totals of 53 large farms averaging 262 acres of apples per farm in a 7-State sample.
y Totals of 38 small farms averaging 41 acres of apples per farm in a 7-State sample.
Source: Compiled from data submitted in response to questionnaires of the U.S. International Trade Commission.
37

A-38
Smaller producers of domestic juice that press fresh, nonpasteurized apple juice (cider) operate their presses only at harvest time, i.e., about 2 to 3 months of the year. Larger concerns generally operate their apple presses at least 7 or more months of the year (September to March).
Single-strength domestic apple juice.--Producers of apple juice made trom fresh apples were asked the capacity of their firm to press juice apples and to package single-strength apple juice in retail-size containers. Information was received on 28 firms that pressed juice apples during 1981-85. The data were converted to an equivalent capacity basis using a standard of operating the facilities (hereafter called standard capacity) 2 shifts per day (18 hours), 5 days a week, for 7 months (30 weeks) during each crop year, which is equivalent to operating the facilities for 2,700 hours per crop year. !J The operating basis used by the responding firms for reporting maximum capacity ranged from 640 to 6,440 hours per year. Reported capacity of U.S. producers for pressing juice apples accounts for approximately one-half of the total estimated pressing capacity in the United States. ~ The data on standard capacity in crop years 1981/82 to 1985/86 for pressing apple juice are shown in the following tabulation, along with a comparison of pressing capacity if the operating season were extended to 10 months (in millions of single-strength gallons):
Crop year Standard capacity
(operating 7 months) Extended capacity
(operating 10 months)
1981/82---------------------1982/83---------------------1983/84---------------------1984/85---------------------1985/86---------------------
204 215 228 227 215
300 316 334 333 316
The data show that standard capacity for pressing by the reporting firms increased from 204 million gallons in 1981/82 to 228 million gallons in 1983/84, or by 11.8 percent, and then declined to 215 million gallons in 1985/86, or by 5.7 percent from 1983/84.
!J A 7-month operating period is believed to be realistic for juice apples from the orchard and from conventional storage. When the more expensive controlled-atmosphere storage, some of which is owned by large processing firms, is taken into account, the realistic maximum operating period may be extended to 10 months. Also, many fresh-market packers of apples have CA storage from which juice apples may be obtained, but such supplies during the late months of the crop year are not in amounts equal to the industry's daily pressing capacity, and it is unlikely that all of the U.S. apple-pressing facilities could be operated at full capacity during those months. ~ Data on capacity were not received from Tree Top in Washington, which is
estimated to account for*** percent of U.S. capacity, and from an unknown number of other firms throughout the United States estimated to collectively account for 10 to 30 percent of U.S. capacity.
38

A-39
Of the 28 firms from which data were received for pressing juice apples, 20 had the capacity to package apple juice into retail-size containers; data were received from 18 of these firms on their packaging capacity. The capacity to retail package apple juice during the 7-month period that coincides with the standard pressing capacity period is shown in the following tabulation, along with the capacity to package during an extended 12-month period, allowing 3 weeks down time for maintenance and repair (in millions of single-strength gallons):
Crop year
1981/82---------------------1982/83---------------------1983/84---------------------1984/85---------------------1985/86---------------------
Capacity to Operating 7 months
202 202 213 212 210
retail package Operating 12 months
330 330 348 345 342
These data show that the capacity of the reporting firms that press juice apples to retail package apple juice during 7 months of operations increased from 202 million gallons in 1981/82 to 213 million gallons in 1983/84, or by 5.4 percent, and then declined to 210 million gallons in 1985/86, or by 1.4 percent from that in 1983/84.
CAJ.--Data received from responding CAJ producers were converted to a standard capacity based on operating the facilities 7 months, 5 days per week, 18 hours per day. The following tabulation shows the capacity to produce CAJ in the United States on this standard basis for the past 5 years (in millions of gallons of single-strength equivalent):
Crop year Capacity
1981/82--------------------- 51 1982/83--------------------- 58 1983/84--------------------- 51 1984/85--------------------- 61 1985/86--------------------- 59
The aggregate capacity shown above represents about 65 percent of total CAJ capacity in the United States. The data exclude * * *· * * *·
The cost of producing CAJ from fresh apples in Canada was examined in 1985 by Agriculture Canada, because Canada's apple production is increasing and because an increasing share of the Canadian apple juice market is being taken by imported concentrates . .!/ Data in the study indicate that the cost
.!/ The Economic Potential for Concentrated Apple Juice Production in Canada, working Paper No. 10/85, Marketing and Economics Branch, Agriculture Canada, May 1985.
39

A-40
of CAJ-producing equipment was about $400,000 Canadian, or 28 percent of total capital costs for a plant built especially for the purpose of .producing CAJ. This cost represents a 38-percent increase over the capital needs if the same plant produced only single-strength apple juice. Further, the study chose a price of U.S. $6.50 per gallon of CAJ to examine the breakeven production level. It found the breakeven !/ point at a production level of 235,000 gallons of concentrate, which was equivalent to operating the plant 14 hours per day for 4 months. It is likely that costs for equipment and installation in the United States are similar; in that case, the investment needed for a profitable new facility for CAJ production in a juice plant would be U.S. $1.20 for every gallon of CAJ produced in that facility. ~ In order to produce CAJ, the plant first has to produce (press) single-strength juice, which is then concentrated by the concentrating equipment in the plant. There are many U.S. juice plants that do not now have concentrating equipment but which could probably install such equipment at the cost indicated above.
* * *· The president of * * * stated that he believes that if he could pay 5 to 5.5 cents per pound for juice apples there would be substantial additional quantities of juice apples grown by the growers because there are growers for whom it is easier and less costly to grow juice apples than to grow fresh-market or processing apples, particularly on older, full-size trees. He further stated that he believes the current trend of cutting down the apple trees ~ and using the farms for other purposes would be reversed if the farmers could sell their juice apples profitably. * * * estimated that with higher juice apple prices there would be enough additional apples for his firm * * *· * * * believes that if the farmers in his area could be assured of 5 cents per pound for juice apples, they would rather grow juice apples in their entire orchard than try to grow fresh-market apples. The cost of producing juice apples when an entire orchard or block (portion of an orchard) is committed to juice apple production is lower since most costs (e.g, pressing, spraying, and harvesting) are less. There is less risk associated with juice apples (weather and so forth), hence the attractiveness of juice apple production at price levels of 5 cents or higher. !±f
Inventorying apples in cold storage or CA storage or keeping singlestrength apple juice in holding tanks or retail containers requires substantial space and entails cooling costs. On the other hand, the storage of CAJ requires less space and refrigeration. If large amounts of domestic CAJ were produced during the harvest time, apple juice (in CAJ form) could be stored and transported more economically than juice apples, and it could be used for reconstituting or blending at any time throughout the country.
!J At 15-percent return on investment. ~At Can$1.00 equal to US$0.70. ~ Transcript of the hearing, p. 76. !±J Telephone interview with***· Also see attachment 19 of the posthearing
brief by counsel for the American Farm Bureau.
40

A-41
Production and movements of CAJ and single-strength apple juice made entirely of U.S.-grown apples.--Table 19 shows production and shipments of apple juice and CAJ made entirely from U.S.-grown apples, as reported by questionnaire respondents. Producers of about 20 percent of the domestic apple juice produced provided responses that were. complete with the requested breakdown of production and sales by type of juice and by container type (bulk or retail). Production and capacity data were also obtained from additional producers; capacity utilization was calculated based on this increased data base, which accounts for about 60 percent of total production. Utilization data are presented at the end of this section.
The production of CAJ by the reporting firms decreased from 670,000 gallons in 1980/81 to 155, 000 gallons in 1984/85. Most of this production is used by the producing firms. Sales of domestically produced CAJ to unrelated buyers virtually ceased in 1984/85, as shown in the following tabulation:
Quantity Crop year (l,000 gallons)
1980/81-------------- 290 1981/82-------------- 198 1982/83-------------- 189 1983/84-------------- 246 1984/85-------------- 15
Value (l,000 dollars)
1,996 1,500 1,297 1,675
96
Unit value (per gallon)
$6.88 7.58 6.86 6.81 6.40
There was even less reported production of concentrated apple juice of 45 degrees Brix, the frozen concentrate, indicating that most frozen concentrate is made from imported CAJ.
The production of domestic single-strength apple juice by the reporting firms is shown in table 19. The aggregate production·of domestic singlestrength apple juice estimated from total U.S. production of juice apples is shown in table 20. Aggregate domestic juice production decreased from 1980/81 to 1981/82 by approximately 16 percent, increased during 1982/83 and 1983/84, and decreased again, by -about 7 percent. in 1984/85.
The questionnaire respondents' production and shipments of fresh, nonpasteurized domestic apple j~ice increased substantially during crop years 1981/82 to 1984/85, whereas their pr·oduction and shipments of pasteurized domestic apple juice fluctuated more sharply. Fresh juice represented only 5 percent of total domestic' juice production by the reporting firms in 1980/81; the comparable share was 13 percent in 1984/85.
41

T•ble 19.--Apple juice and CAJ: Production, ehipmente, and faventorte.e ot do•~•tfc apple juJce and CAJ raade eatirely fra. U.S. appl••• crop yeara 1980/81 to l984/8S, July-Dece•ber 1984, and July-Oecobcr 198S
July-Dec-ber--Itu 1980/81 1981/82 1982/83 1983/84 1984/8S
19114 19tS
C4J 69-12 dear•• lrt•-eat1rali tr• u.s. •r1?:•••: : le&taataa taveator -1,000 &• loaa--: 69 102 46 14 b8 08 lit. Producttoa- ..... o---: 670 S99 181 l21 BS BO 106 lb1,..•t• (Hlea) •• CA.I 69-12 dqree lrta
to MDrelate4 U.S. ltuyere: QuaaUt -1,000 1allon1-: 290 198 189 246 H 8 10 Valu--- 1,oetiQ dollara--: 1,996 1,SOO 1,2f7 l,67S 96 Sl 02
U..d capttvely ta tb• producttoa of other product•!/ 1,000 a•lloaa--: 30 457 24 21 32 a 0
laport ·--: - . - : - ' - ' IDdtaa taveatory-- ------40--: 102 46 14 ... 116 202 272 CAJ 47-68 d!fr•• lrt•-eattrelz fro• u.s. •eflea: :
ieal .. i., •w.atory------ -i,600 1•1 oaa--: - : - : - : l6 H 89 3 •roductto --------do--: - : - : 36 106 - ' 1
lbt .. HU (Hlao) H C.LI 47-68 ...... lrb to uarelated U.S. ... ,. .... , :
Quaatttr 1,000 aallo .. --1 - . - : - : s 27 19 Vol 1,000 •ollar.--: - : - : - : 28 U4 109 >
Uaa• capttwl7 ta tba production of other J,. product• 1/ -1,000 1atloa ... -1 - : -. - : 48 59 2l l ..
bporte- - ----do--: - . - : - : - : - : ladtoa taveatory--- -------do--: - : - . l6 89 l 47 9
Cf.I 44-46 dear•• lrt• 'tncluclt!I frosen I
coacentrate~-enttrelz from U.S. •eel••: laalnalaa l•ve•tory:
let•il ····------------1,000 aalloar-: _, - : - : - : lion-retail atae--------------do----: 198 96 lO 41 9 9 4
•roctucctoa: I
htail atae- -do--: - I - : 68 - ' - : ••-r•i.11 •!&• ..... o--; - : - : - ' - : - ' ,........ ( .. l••) to 11nralat.e4 U.S • t.u1era1 .. ,.11 •••••
Qu••tttr------- 1,000 a•llona--z - : - : - ' - : Value -1,000 dollar.--: - : - : - : - : - '
Moa-retatl atae: QuaaUt 1,000 a•lloaa--: - I - : - : - ' - ' - ' Value-----------1,000 dollara--: - : - ' - : - : - ' - :
U1ed capttvely 1D tbe producttoa of other 66 51 l8 s l product• !I 1,000 1•lloa1--: 102 I
laporta- -do--: - I - I - : - ' ladtaa 1a,,.ator1:
letatl atae ----.10--1 - ' - ' - : - ' Mon-retail atse--------------do--1 96 lO 47 9 4 6 4
.... "' Sae footaotaa at erut of tal:lle.

Table 19.--Apple juice and CAJ: Production, shipknt•, and inventurie• of doaeatic apple juice o1nJ l.:AJ lllade entirely fro• U.S. apple•, crop yeara 1980/81 to 1984/8~, July-l>ecea~r 1984, and July-Deceaber 198~--coutinueU
July-Vece111be:r--I tea
Preah (non aateurized SSAJ-.ade entire! fro• U.S. •eele•: 2 :
Production- ----=--------1,000 1allona--: Shi.,.eata (Nlea) to unrelated U.S. buyer• ••
freah SSA.I not blended, not aixed: Retail •i&e:
Quantity--------------1,000 gallon•--: Value--------------1,000 dollara--:
Mon-retail aize: Quantity-----------1,000 gallon•--: Value-----------------1,000 dollar8--:
Uaed captively in the producti9n of other product• 1/-----------1,000 gallon•--:
Exporta----=-----------------do---: SSA.I 9-14 de1ree Brix, eaateurized or otherviae
ere•erved ..... de entirely of U.S. apelea: Bealnnlng Inventory:
Retail •1&e----------.ill1on galloaa-: Hon-retail aize----------------10---:
Production: Retail aize-------------------10 ... --: Mon-retail aize------------------do--:
Ship9enta (aalea) to unrelated U.S. buyera: Retail a1&e:
Quantity----------1illion gallona--: Value-----------.illion dollara--:
Hon-retail •i&e: Quantity--------------.1111on aallona--: Value-------------.... illioa dollar•--:
Uaed.captively in the production of other product• 11-------...illion gallona--:
Exporta------------------do--: Ending inventory:
Retail ai&e-----------------do---: 110..-reta11 •ize--------------do----:
1980/81
1,042
217 451
1,777 1,369
4.1 - :
19.2 2.6
20.1 27.5
- :
2.6
3.3 - :
1981/82
863
346 719
l,42S 1,2S8
- :
3.2 - :
15.9 1.4
14.4 29.3
- : - :
1.2 - :
4.7
1982/83
1,734
107 223
2,970 1,886
- :
4. 7 •
20.2 l.2
19.3 29.5
- : - :
9.4 - :
5.4
1983/84
2,6)8
141 293
l,348 2,576
- : - :
S.4
24.4 1.0
i~. l 35.9
7.7
5.1
1984/85
3,671
717 1,030
J,S84 2,9Sb
- :
4.9
21. 7 2.0
22.5 35.3
- :
- :
4.3 - :
1984 198~
l,S49
94 195
l ,8)) l,S80
s. l
'3.0 l. l
12. 7 U.5
- :
1.1
4.4
3,301
238 49S
3,126 2,361
219
4.J
l!i. 7 l. 3
ll.4 20.b
1.2
5.3
1/ Include• all that have been uaed in the production of other apple juice product•, aixed fruit juicea or dr1n~a. jeTliea, vinegar, wine, etc.
2/ Include• production of SSA.I even if all of it 1a intended for aale •• blended juice or other products. ...&' the rePortin& fin blended all SSAJ vfth CAJ,· then the total produced quantity la reported under '"u•ed in the production 01 other producta•.
Soul'ce: Co•piled fl'Oll data aubmitted in reaponee to queetionna1rea of the U.S. International ·.ro1de co1miaaio11.

A-44
Table 20.--Apple juice, single-strength equivalent: Estimated U.S. production based on the production of juice apples, by principal States, crop years 1980/81 to 1985/86
~In millions of single-strength gallons~ lL
State 1980/81 1981/82 1982/83 1983/84 1984/85 :1985/86 y
Washington---------: 43 37 28 37 37 27 New York-----------: 28 18 26 29 26 26 Michigan-----------: 28 18 31 24 22 34 California---------: 17 27 21 18 16 21 North Carolina-----: 13 11 5 15 13 10 Pennsylvania-------: 14 8 10 10 11 11 Virginia-----------: 8 9 9 11 8 7 All other----------: 30 24 23 25 24 17
Total----------: 182 153 154 169 158 153
!J Fresh weight converted at the rate of 100 pounds of juice apples per 8.5 gallons of single-strength apple juice.
y Estimated on the basis of data in table 14 of this report.
Source: Compiled from official statistics of the U.S. Department of Agriculture, as noted.
Note.--Because of rQUJlding, figures may not add to the totals shown.
Utilization of productive capacity for producers of domestic CAJ and
domestic single-strength apple juice is shown in the following tabulation (in
percent):
Crop year
1981/82--------------1982/83--------------1983/84--------------1984/85--------------1985/86--------------
CAJ !/
26 13 16 16 17
Single-strength apple juice Y
49 55 59 56 44
!J Data include firms that account for approximately 70 percent of U.S. production.
y Data include firms that account for approximately 60 percent of U.S. production.
44

A-45
Imports and purchases of juice apples and CAJ by producers of domestic juice.--According to industry sources, all but one or two producers of domestic apple juice purchase imported CAJ. Producers of domestic juice purchase or directly import foreign CAJ either to blen4; it with domestic juice they press or to reconstitute it. Virtually all producers of domestic juice have some customers for which they merely reconstitute imported CAJ to single-strength juice or to frozen three-strength concentrate; for other customers, they blend imported CAJ with;domestic.juice. They ma). also sell purely domestic juice, i.e., not blended with any imported CAJ. Those producers of apple juice whose sales consist mostly of private-brand apple juice use more imported CAJ than do firms that produce well-recognized brand names of apple juice. This means that the store brands <>f apple.juice are more likely to be reconstituted from foreign CAJ. However, many nationalbrand-name apple juice products (* * *) are also made entirely of imported CAJ. The makers of national-brand-name apple juice products state that, for a national-brand-name product, a very large and steady supply of 'raw material is needed, which can only b.e secured from fOreign sources. * * * ,, The price of CAJ is also determinant .. in the purchase de.cision. The presidetit of New England Apple Products testified that he would buy domestic CAJ if the price were comparable with that of imported CAJ.
Table 21 shows purchases of· U.S. apples, domestic apple juice, and imported CAJ by producers of domestic apple juice. The reporting producers of domestic apple juice purchased 396,000 tons (18.8 million bushels) of juice apples in crop year 1980/81. Such purchases decreased by 8 percent in 1981/82, incre~sed by .12 percent in 1982/83 and an additional 7 percent in 1983/84, and then dropped by 13 percent in 1984/85. ·
Imports and purchases of CAJ by reconstitutors. --Those U.S .. · firms that bottle apple juice, but do not press U.S. juice apples, have obtained most of their CAJ supply from foreign sources by importing directly or ·by purchasing from other U.S. importers/trading' companies. T-able 22 shows such imports and purchases. Reconstitutors directly import 2 to 3 times as much foreign CAJ as they purchase from other U.S. importers/trading companies. Their purchases and imports of foreign CAJ peaked in 1982/83 and 1983/84 and decreased sharply, by 38 percent, in 1984/85. Such .. purchases quadrupled during July-December 1985 compared with those. during the corre~pondlng period of 1984 .
. ::..
Inventories of juice apples and domestic apple juice and:CAJ
Growers repor.ted no inventories of apple juice. Inventories of all apples and juice apples reported by the growers are shown in table 23.
Inventories of domestically produced apple juice ari shown in table 19. . " f
Such inventories were 3.3 .• million gallons on June 30, 1981; they then increased to 4.7 million gallons in 1982 and remained between 4,j million and 5.4 million gallons during 1982-85, ·representing about 20 percent of the same year's production.
45

·Table 21.--Applea and apple juice: Purchases and l.mporta by producers of doaestic apple juice, crop years 1980/ll to 1984/85, July-Decaaber 1914, and July-December 1985
Item purchased or imported
U.S. apples for juice production: Quantlty----------------------1,000 tons--: Value (net cost)---------111illion dollars--:
U.S. nonretail CAJ 69-72 degrees Brix: Quantity------------1,000 gallons of CAJ--: Value----------------------1,000 dollars--:
Foreign nonretail CAJ 69-72 degrees Brix iaported directly:
Quantity------------1,000 gallons of CAJ--: Value----------------------1,000 dollars--:
Foreign nonretail CAJ 69-72 degrees Brix purchased from U.S. importers:
Quantity------------1,000 gallons of CA.I--: Value----------------------1,000 dollars--:
Total foreign-non-r~•il CAJ acquired in apple Oiq\il~li!i>ta: · y
Quantity----------------------1,000 tona--: Value--------------------million dollars--:
y Not available. y l gallon of CAJ•92 pounds of apples.
1980/81 1981/82 1982/83 1983/84 1984/85
396 30.8
36 216
2,337 y
484 2,582
108 y
363 36.8
301 2,106
2,524 y
815 5,459
154 y
408 37.4
106 717
5,202 y
895 5,563
280 y
438 41.l
254 1,540
l,922 y
l,028 5,954
136 y
382 37.4
97 558
5,910 y
l,601 8,442
346 y
July-December--
1984 1985
291 27.5
46 269
2,096 y
427 2,223
116 y
331 28.0
75 397
2,020 y
843 4,428
l32 y
Source: Compiled froa data subaitted in response to queationnairea of the U.S. Intemational Trade Co-iaaion.

Table 22.--Apple juice: Reconatitutors• purchases and i•porta, crop years 1980/81 to 1984/85, July-Dece•ber 1984, and July-Dece•ber 1985
Itea purchased or imported
U.S. nonretail CAJ 69-72 degrees Brix: Quantity------------1,000 gallona of CAJ--: Value----------------------1,000 dollars--:
Foreign nonretail CAJ 69-72 degrees Brix imported directly:
Quantity------------1,000 gallons of CAJ--: Value----------------------1,000 dollars--:
Foreign nonreta.11 CAJ 69-72 degrees Brix purchased from other U.S. i•porter(a):
Quantity------------1,000 gallons of CAJ--: Value----------------------1,000 dollars--:
Total foreign nonretail CAJ 69-72 degrees Briz acquired in apple equivalents: !/
Quantity----------------------1,000 tona--: Value--------------------aillion dollars--:
!/ l gallon of CAJ•92 pounda of apples.
1980/81
2,820 16,328
2,684 15,813
253 32.l
1981/82
3,870 27. 248
5,302 34,292
422 61.5
1982/83
8,565 54,564
3,060 18,573
535 73.l
1983/84
8,969 55,431
2,582 14,031
531 69.5
1984/85
4,991 22. 370
2,618 12,803
350 35.2
July-December--
'1984 1985
497 2,589
l,049 S,383
7l 8.0
4,562 23,136
l,SOl 7 ,lSS
279 30.3
Source: Co•piled from data submitted in response to questionnaires of the U.S. International Trade co .. isaion.

A-48
Table 23.--Apples: U.S. growers• inventories as of Dec. 31 and Mar. 31, crop years 1981/82 to 1985/86
(In thousands of bushels)
As of Dec. 31 As of Mar. 31 Crop year
All apples Juice apples All apples Juice apples
Smaller growers: y: 1981/82----------: 1982/83----------: 1983/84----------: 1984/85----------: 1985/86----------:
Larger growers: y : 1981/82----------: 1982/83----------: 1983/84----------: 1984/85----------: 1985/86----------:
y Less than 100 acres. y Not available. y Over 100 acres.
48 85 61 52
107
1,241 1,452 1,583 1,618 1,850
6 11 5 20 7 8 7 7
13 y y
144 322 162 528 247 548 217 545 275 y y
Source: Compiled from data submitted in response to questionnaires of the U.S. International Trade Commission.
Inventories of domestic CAJ were the highest at the end of crop year 1984/85. Midyear inventories of domestic CAJ totaled 202,000 gallons in crop year 1984/85 and 272,000 gallons in crop year 1985/86.
Employment
Data on employment reported by apple growers responding to the Commission's questionnaires are presented in table 24. The average number of full-time employees per grower ranged from 2.3 to 2.5 for the small growers and from 7.9 to 8.7 for the larger growers. The average number of part-time harvest employees per grower ranged from 9.7 to 11.3 per farm for the smaller growers and from 51.9 to 58.3 per farm for the larger growers. Full-time employment by the larger growers varies more than that by the smaller growers because the latter have less flexibility in reducing employment. y
1 3 1 1
29 82 72 79
y A reduction by 1 full-time worker per farm by the average smaller grower is equivalent to a reduction of more than 40 percent, whereas it would be only a 12-percent reduction for the average large grower.
48

A-49
Table 24.--Apples: Full-time and part-time employment and unpaid employment on U.S. apple farms, crop years 1980/81 to 1984/85/
Item 1980/81: 1981/82: 1982/83: 1983/84: 1984/85
Small growers: !/ Average number of year-round,
full-time, paid employees employed in apple-growing operations (including paid owner and family members)-----: 76
Average number of temporary employees hired for har-vesting the apple crop--------: 327
Number of unpaid hours worked by owner, family, etc., in the firm's apple-growing operations for which the firm paid no wages
1,000 hours--: 41
Large growers: ~ Average number of year-round,
full-time, paid employees employed in apple-growing operations (including paid owner and family members------: 372
Average number of temporary employees hired for har-
77
321
45
402
84 84 84
373 355 357
45 43 40
397 408 384
vesting the apple crop--------: 2,740 2,478 2,437 2,505 2,498
Number of unpaid hours worked by owner, family, etc., in the firm's apple-growing operations for which the firm paid no wages
1,000 hours--: 60 65 72 79
!/Less than 100 acres. their farms in 1984/85 was ~More than 100 acres.
their farms in 1984/85 was
Data represent 33 growers; the average size of 41 acres. Data represent 47 growers; the average size of 287 acres.
Source: Compiled from data submitted in response to questionnaires of the U.S. International Trade Commission.
80
49

A-50
Six processors reported data on employment for fiscal years 1981-85 in their operations producing domestic apple juice. The number of production and related workers producing domestic apple juice increased steadily from 547 in 1981 to 707 in 1984 and then decreased by 13 percent to 614 in 1985. Hours worked, wages, and total compensation paid to these production and related workers show the same trend as the number of employees (table 25). During the interim period ended December 31, 1985, the number of production workers was 3 percent lower and hours worked and wages paid to such employees were more than 10 percent lower than the corresponding figures in the interim period ended December 31, 1984.
Financial experience of U.S. growers and producers of domestic apple juice
U.S. growers.--Financial data were provided by both large (over 100 acres) and small (under 100 acres) growers. The responses of the large growers indicate a predominantly corporate structure for their operations, whereas the small growers were essentially sole proprietorships. This information is shown in the following tabulation (in percent):
Corporate structure
Corporation-----------------Partnership-----------------Sole proprietorship----------
Total--------------------
63 23 14
100
Small
13 29 58
100
The growers maintain that their financial status has deteriorated because of low prices for juice apples. An individual grower's profitability depends upon a combination of factors such as the proportion of apples in different price ranges sold in relation to total apple production, the share of the total apple crop not utilized or sold, the time of season the crop is sold (storage costs), weather, and the total growing and harvesting costs. These factors vary from year to year and from region to region. Other farm income received by growers includes proceeds from livestock and other crops, land rental, and machine usage. The financial results of the growers show that 47 percent sustained losses on their overall farm operations for the 5-year period and 63 percent suffered losses on their apple growing operations.
The juice apple portion of the average grower's crop represents about 25 percent of his total apple production in terms of quantity and a smaller portion in terms of sales value. The financial data received by the Commission indicate that, in the aggregate, total apple growing operations are unprofitable. The data provided by 66 growers are presented in tables 26 to 29.
Although growers generally do not keep separate records for fresh apples and juice apples, they were asked to estimate their financial operations on juice apples. With respect to juice apples, the data provided indicate that the excess of expenses over sales (on a percentage basis) generally increased over the 5-year period 1981-85. For small growers, juice apple expenses
50

Table 25.--Average number of U.S. production and related workers engaged in the production of apple juice, and hours worked and wages and total compensation paid to such employees, fiscal years 1981-85 and interim periods ended Dec. 31, 1984, and Dec. 31, 1985
Item
Average number employed in the reporting establishment(s):
All persons------------------------------:
Production and related workers producing- -
All products- - - - - - - - - - - - - - - - - - - ·- - - - - - -- :
Single-strength apple juice and other apple juice products made entirely from U.S. apples---------------------:
Hours worked by production and related workers producing--
All products----------------1,000 hours--:
Single-strength apple juice and other apple juice products made entirely
1981
2,345
1,917
- 547
4,780
from U.S. apples----------1,000 hours--: 1,029 Wages paid to production and related
workers producing--All products--------------1,000 dollars--: 30,115
Single-strength apple juice and other apple juice products made entirely from U.S. apples-------1,000 dollars--: 6,995
Total compensation paid to production and related workers producing--
All products--------------1,000 dollars--: 37,720
Single-strength apple juice and other apple juice products made entirely from U.S. apples--------1,000 dollars--: 8,084
1982 1983
2,387 2,522
1,949 2,070
571 681
4,815 4,859
1,233 l,419
31,088 33,629
7,967 8,936
40,583 44,424
9,268 10,575
1984 1985
2,559 2,434
2,106 1,953
707 614
4,800 4,563
l,478 1,303
35,362 36,101
9,732 9,061
46,356 46,937
11,537 10, 770
Interim period ended Dec. 31--
1984 1985
2,185 2,165
1,813 1,766
366 355
3,051 2,955
556 463
23,989 25,054
3,204 3,145
30,895 31,637
4,368 3,969
Source: Compiled from data submitted in response to questionnaires of the U.S. International Trade Commission.

A-52
exceeded sales by 79 percent in 1981 and 94 percent in 1982. The excess of expenses over sales narrowed to 47 percent in 1983, but expenses in 1984 and 1985 were 2.5 to 3 times as large as sales in those years. For large growers, juice apple expenses also exceeded juice apple sales in each of the years covered. The data for both the smaller and larger growers are shown in the following tabulation:
Item 1981 1982 1983 1984 1985
Small growers: y Net sales------------1,000 dollars-- 63 68 135 61 43 Expenses----------------------do---- ll3 132 198 153 129
Excess of expenses----------do---- (50) (64) (63) (92) (86) Expenses as a share of net sales-----------------percent-- 179.4 194.1 146.7 250.8 300.0
Large growers: y Net sales------------1,000 dollars-- 1,057 1,323 1,284 1,046 1,031 Expenses----------------------do---- 1,812 1,842 2,151 1,938 1,925
Excess of expenses----------do---- (755) (519) (867) (892) (894) Expenses as a share of
net sales-----------------percent-- 171.4 139.2 167.5 185.2 186.7
y 10 growers. y 20 growers.
The parties dispute the importance of the income from juice apples for the growers. Supporters of import relief contend that juice apple revenue provides a key contribution to overhead and business planning. !/ A representative of a producer of apple juice that testified in opposition to import relief stated that "it is important to note that many growers depend on revenue from juice apples and other processing apples to maintain their cash flow position." y Counsel for parties in opposition to import relief argued that such revenues are not important to the growers because they constitute only 10 percent of the sales value of the crop and are a bonus to the growers as they consider juice a salvage market. ~
Large growers.--The income-and-loss experience of the large growers on the overall operations of their farms on which apples are grown is shown in table 26 for 1981-85. Net sales rose from $26.9 million in 1981 to $31.0 million in 1984, an increase of 15.0 percent. Net sales in 1985 totaled $25.4 million. '±/ In the aggregate, the reporting growers sustained net losses in 1981, 1984, and 1985. Losses totaled $1.0 million in 1981, or 3.8 percent of sales; $373,000 in 1984, or 1.2 percent of sales; and $1.1 million
y Posthearing brief of the American Farm Bureau, p. 38, and transcript of the hearing, pp. 77, 82, 89, 93.
y Prehearing brief of New England Apple Products Co., p. 1. ~Respondents• prehearing brief, p. 12, and posthearing brief, p. 9. '±f Only 31 of the 38 growers that provided data in 1984 furnished usable
data for 1985.
52

A-53
Table 26.--Income-and-loss experience of large apple growers lJ on the overall operations of their farms on which apples are grown, 1981-85
Item 1981
Net sales: All apples, excluding juice apples
1,000 dollars--:17,654 Apples for juice production only-------do----:-1,711
1982
:18,739 : 2,610
1983 1984 1985 '!:./
:19,693 :20,486 16,830 : 2,304 : 2,042 1,754
Apple juice or cider-------------------do----:~-=-3~6~3-'-~-=-'-"--'-~-'-c.o,---'-,~..c..==--'-~-,.~ Total--------------------------------do----:19,728
370 478 425 67 :21,719 :22,475 :22,953 18,651
~~~~~~~~~~~~~~~~~~~
Other crops and livestock--------------do----: 4,278 : 4,911 : 5,431 : 5,032 3,676 Other farm income----------------------do----:-=-2~·~9~3~5-'-.,--'-~"-"--'--=-~~--'-,~'-'--'-'--'--=.~~
Total net sales and other income-----do----:26,941 : 3,343 : 3,089 : 3,008 3,106 :29,973 :30,995 :30,993 25,433
Growing and operating expenses: Juice apples and apple juice purchased-do----: 671 819 Other goods purchased for resale-------do----: 855 679 Hired labor----------------------------do----: 8,518 8,959 Plants and seeds purchased-------------do----: 285 362 Fertilizers, lime, and chemicals-------do----: 2,412 2,709 Materials and supplies-----------------do----: 1,423 1,635 Repairs and maintenance----------------do----: 1,168 1,334 Depreciation and amortization----------do----: 1,968 2,260 Taxes and insurance--------------------do----: 2,101 2,170 Gasoline, oil, and fuel----------------do----: 1,181 1,138 Water and electricity------------------do----: 570 608 Shipping and selling expenses----------do----: 452 430 Office expenses, including salaries----do----: 453 497 Officers' or partners' salaries--------do----: 1,108 1,262 Interest expense-----------------------do----: 1,660 1,670
914 515
9,119 275
2,903 1,563 1,400 2,511 2,321 1,098
635 397 530
1,233 1,856
686 578 481 497
9,688 8,275 245 251
3,120 2,537 1,727 1,484 1,404 1,195 2,660 2,436 2,262 2,139 1,100 876
696 559 582 406 549 516
1,256 993 2,033 1,761
All other expenses---------------------do----:-=.3~·=1~4~7-=.-=.3~·~18~8=--=--'-'-c'""'"--'--''--'-'~,..-'~~-'--'-=--Total expenses-----------------------do----:27,972 :29,720
Net income or (loss) before income taxes
3,492 2,877 2,009 :30,762 :31,366 :26,512
1,000 dollars--:(1,031): 253 Depreciation-------------------------do----: 1,968 2,260 Cash flow--------------~-------------do----: 937 2,513
Number of farms reporting losses-------------: 15 19
233 2,511 2,744
16
(373): (l,079) 2,660 2,436 2,287 1,357
17 18 Number of farms reporting data---------------:~~~3~7-'-~---'3~8=--=--~-=--''---''--~-=.::'--'~~-=.=--38 38 31
As a share of net sales: Total expenses----------------------percent--: 103.8 99.2 99.2 101.2 104.2 Net income or (loss) before income
taxes--------------------------------do----: (3.8) 0.8 0.8 (1. 2): (4.2)
l/ The responding growers accounted for about 6 percent of total production by large growers.
'!:.! 7 of the 38 growers did not provide data for 1985.
Source: Compiled from data submitted in response to questionnaire of the U.S. International Trade Commission.
53

A-54
in 1985, or 4.2 percent of sales. In 1982, a profit of $253,000 was achieved, and in 1983 net income totaled $233,000; both profits were equivalent to 0.8 percent of sales. The growers• largest expense was labor, which averaged 31 percent of sales over the 5-year period. Estimated cash flow (net income or (loss) before income taxes plus depreciation) was $9.8 million for the reporting period.
Total apple products sales as a share of total farm operations ranged from 72 to 74 percent during the period. The proportion of apples sold (in terms of sales dollars) for juice production ranged from 6.4 to 8.7 percent during the reporting period, as shown in the following tabulation (in percent):
Item 1981 1982 1983 1984 1985
Apples sold, excluding juice apples---- 65.5 62.5 63.5 66.0 66.2 Apples sold for juice production only-- 6.4 8.7 7.5 6.6 6.9 Apple juice or cider sold-------------- 1.3 1.2 1.5 1.4 .2
Total apple product sales---------- 73.2 72.5 72.5 74.0 73.3 Other crops and livestock sold--------- 15.9 16.4 17 .5 16.2 14.5 Other farm income---------------------- 10.9 11.2 10.0 9.8 12.2
Total net sales .!/----------------- 100.0 100.0 100.0 100.0 100.0
.!/ Individual items have been rounded in order for the totals to equal 100 percent.
The income-and-loss experience of the large growers on their total apple operations is shown in table 27 for 1981-85. Net sales rose by 11.8 percent from $19.5 million in 1981 to $21.8 million in 1982. A decline of 3.7 percent occurred in 1983 to sales of $21.0 million. In 1984, sales rose by 5.0 percent to $22.1 million. Net sales in 1985 were $19.2 million. In the aggregate, the growers incurred net losses on their apple growing operations in all of the reporting years. Losses totaled $2.8 million, or 14.4 of sales, in 1981; $1.3 million, or 6.2 percent of sales, in 1982; $3.0 million, or 14.1 percent of sales, in 1983; $3.1 million, or 14.1 percent of sales, in 1984; and $2.1 million, or 11.0 percent of sales, in 1985. During the reporting period, 73 percent of the farms reported net losses on their operations.
The sales value realized from apples sold for juice production represented a declining share of total apple product sales, as shown below (in percent):
Item 1981 1982 1983 1984 1985
Apples sold, excluding juice apples---- 89.2 86.8 87.1 89.8 91.5 Apples sold for juice production only-- 9.0 11. 5 10.7 8.3 8.2 Apple juice or cider sold-------------- 1.8 1. 7 2.2 1.9 .3
Total apple product sales---------- 100.0 100.0 100.0 100.0 100.0
54

A-55
Table 27.--Income-and-loss experience of large apple growers !Jon their total apple operations, 1981-85
Item 1981
Net sales: All apples, excluding juice apples
1,000 dollars--:17,420 Apples for juice production only
1,000 dollars--: 1,755
1982
:18,962
: 2,507
1983 1984 1985 '!:!
:18,304 :19,826 :17,611
: 2,242 : 1,833 : l,569 Apple juice or cider-----------do----=~-=-3~6~3-'-~-=-'"""'--'-~--'-'-'----'---~-=c=.......o.,.~-=--'
Total apple products---------do----:19,538 Growing and operating expenses:
370 477 425 67 :21,839 :21,023 :22,084 :19,247
Juice apples and apple juice purchased--------------------do----: 671 819 914 686 578
Harvest labor------------------do----: 4,865 5,297 5,540 5,840 5,170 Storage cost-------------------do----: 582 635 636 675 694 Depreciation and rent----------do----: 2,673 2,915 3,159 3,318 3,023 Interest expense---------------do----: 1,262 1,231 1,400 1,577 1,432 All other fruit costs----------do----:12,296 :12,291 :12,331 :13,065 :10,470
Total fruit costs------------do----:22,349 :23,188 :23,980 :25,161 :21,367 Net (loss)-----------------------do----:(2,811):(1,349):(2,957):(3,077):(2,120)
Number of farms reporting losses-----: 28 26 24 29 22 Number of farms reporting data-c-----: 36 37 36 37 30
As a share of net sales: Total expenses--------------percent--: 114.4 Net (loss) before income taxes
106.2 114.1 114.0 111.0
percent--: (14.4): (6.2): (14.1): (14.0): (11.0)
!J The responding growers accounted for about 6 percent of total production by large growers.
1f 7 of the 37 growers did not provide data for 1985.
Source: Compiled from data submitted in response to questionnaires of the U.S. International Trade Commission.
Small growers.--The income-and-loss experience of the small growers on the overall operations of their farms on which apples are grown is shown in table 28 for 1981-85. Net sales rose 6.7 percent from $3.8 million in 1981 to $4.1 million in 1982. A decline of 4.0 percent occurred in 1983 to sales of $3.9 million. In 1984, sales rose 21.8 percent to $4.8 million but fell to $4.5 million in 1985, or by 5.4 percent. In the aggregate, the reporting growers were profitable in 1981, 1982, and 1984. Income totaled $262,000, or 6.9 percent of sales, in 1981; $101,000, or 2.5 percent of sales, in 1982; and $240,000, or 5.0 percent of sales, in 1984. In 1983, the growers sustained a loss of $142,000, or 3.6 percent of sales, and in 1985, the loss totaled $16,000, or 0.4 percent of sales. The growers' largest expense was labor, which averaged 25 percent of net sales over the 5-year period. Estimated cash flow (net income or loss before income taxes plus deprecation) totaled $2.9 million for the reporting period.
55

A-56
Table 28-Income-and-loss experience of small apple growers !f on the overall operations of their farms on which apples are grown, 1981-85
Item 1981 1982 1983 1984
Net sales: All apples, excluding juice apples
1985
1,000 dollars--: 1,648 1,807 1,655 1,976 1,830 Apples for juice production only-------do----: 318 337 375 280 124 Apple juice or cider-------------------do----:_,.--.,-4~2=--'---,-=~5~8~_,...-,-,4~9~-=--.,.~56~~~-,-,-5-=-5
Total--------------------------------do----: 2,008 2,202 2,079 2,312 2,009 Other crops and livestock--------------do----: 1,470 1,379 1,336 1,691 1,646 Other farm income----------------------do----: 345 499 503 771 862
Total net sales and other income---do----:-=3-,787273~--:-4-,078~0=-~3=-',9~1~8=-~4~.~7~7~4~~~4-,517 Growing and operating expenses:
Juice apples and apple juice purchased-do----: 23 15 45 59 67 Other goods purchased for resale-------do----: 164 161 132 152 116 Hired labor----------------------------do----: 822 1,050 1,005 1,167 1,201 Plants and seeds purchased-------------do----: 57 40 44 34 41 Fertilizers, lime, and chemicals-------do----: 386 392 479 489 453 Materials and supplies-----------------do----: 204 219 160 251 218 Repairs and maintenance----------------do----: 138 199 204 247 192 Depreciation and amortization----------do----: 355 441 493 564 603 Taxes and insurance--------------------do----: 257 269 257 261 307 Gasoline, oil, and fuel--·-------------do----: 181 180 172 182 177 Water and electricity------------------do----: 81 85 95 110 106 Shipping and selling expenses-----~----do----: 85 42 49 42 52 Office expenses, including salaries----do----: 13 17 18 15 13 Officers' or partners' salaries--------do----: 197 218 221 244 219 Interest expense-----------------------do----: 269 308 305 360 393 All other expenses---------------------do----:-,-_3~2~9~'---,,-:,3~473~-.,..-3~8~1~-.,---,:-3~57~~~~377-=-5
Total expenses-----------------------do----: 3,561 3,979 4,060 4,534 4,533 Net income or (loss) before income taxes
1,000 dollars--: Depreciation-----------------------~-do----: Cash flow----------------------------do----:
Number of farms reporting losses-------------: Number of farms reporting data---------------:
As a share of net sales: Total expenses----------------------percent--: Net income or (loss) before income taxes-----:
--------------------------------------percent--:
262 355 617
9 24
93.1
6.9
101 441 542
15 26
97.5
2.5
(142): 493 351
15 26
103.6
(3.6):
240 564 804
9 26
95.0
5.0
!f The responding growers accounted for about 0.5 percent of total production by small growers.
Source: Compiled from data submitted in response to questionnaire of the U.S. International Trade commission.
(16) 603 587 12 26
100.4
(0.4)
56

A-57
Total apple product sales as a share of total farm operations ranged from 44 to 54 percent during the period. The proportion of apples sold (in terms of sales dollars) for juice production was in the range of 2.8 to 9.6 percent during the reporting period, as shown in the following tabulation (in percent):
Item 1981 1982 1983 1984 1985
Apples sold, excluding juice apples---- 43.1 44.3 42.2 41.4 40.5 Apples sold for juice production only-- 8.3 8.3 9.6 5.9 2.8 Apple juice or cider sold-------------- 1.1 1.4 1.3 1.1 1.1
Total apple product sales---------- 52.5 54.0 53.1 48.4 44.4 Other crops and livestock sold--------- 38.5 33.8 34.1 35.4 36.5 Other farm income---------------------- 9.0 12.2 12.8 16.2 19.l
Total net sales 1/----------------- 100.0 100.0 100.0 100.0 100.0
lf Individual items have been rounded in order for the totals to equal 100 percent.
The income-and-loss experience of the small growers on their total apple operations is shown in table 29 for 1981-85. Net sales rose by 8.2 percent from $2.0 million in 1981 to $2.2 million in 1982. A decline of 7.1 percent from 1982 occurred in 1983 to sales of $2.0 million. In 1984, sales rose by 23.1 percent to $2.5 million. Sales in 1985 declined by 18.6 percent, to $2.0 million. In the aggregate, the growers incurred net losses on their apple-growing operations in 1982, 1983, and 1985. Losses totaled $4,000, or 0.2 percent of sales, in 1982; $106,000, or 5.3 percent of sales, in 1983; and $282,000, or 13.9 percent of sales, in 1985. In 1981, the reporting growers earned a profit of $176,000, or 8.8 percent of sales; in 1984, they achieved a profit of $38,000, or 1.5 percent of sales. During the reporting period, 49 percent of the farms reported net losses on their operations.
The sales value realized from apples sold for juice production represented a declining share of total apple product sales, as shown in the following tabulation (in percent):
Item 1981 1982 1983 1984 1985
Apples sold, excluding juice apples---- 87.3 82.6 80.1 88.2 92.4 Apples sold for juice production only-- 11.5 15.7 18.7 10.3 5.9 Apple juice or cider sold-------------- 1.2 1.6 1.2 1.5 1. 7
Total apple product sales---------- 100.0 100.0 100.0 100.0 100.0
Capital expenditures.--Reported capital expenditures for total farm operations increased from $1.8 million in 1981 to $2.4 million in 1982 and 1983. Expenditures declined to $2.3 million in 1984 and $1.8 million in 1985. Capital expenditures made for apple plantings increased from $445,000 in 1981 to $484,000 in 1982. Such expenditures declined to $401,000 in 1983 but then rose to $537,000 in 1984. In 1985, expenditures declined to $444,000. Capital expenditures made by the smaller growers on their overall operations increased from 1981, peaked in 1984, and decreased in 1985. Such expenditures by the larger growers peaked earlier, in 1982, and have decreased consistently
57

A-58
Table 29.--Income-and-loss experience of small apple growers!/ on their total apple operations, 1981-85
Item 1981 1982 1983 1984 1985
Net sales: All apples, excluding juice apples
1,000 dollars--: 1,755 1,618 2,192 l,796 1,870 Apples for juice production only
1,000 dollars--: 231 342 378 256 119 Apple juice or cider----·------do----:~--'2~4"'-''-c~=3=6-=-~---=2~3'-'~~3~8"-''-c~=3~4-
Total apple products---------do----: 2,010 2,174 2,019 2,486 2,023 Growing and operating expenses:
Juice apples and apple juice purchased--------------------do----: 10 26 32 40 30
Harvest labor------------------do----: 458 574 555 557 580 Storage cost-------------------do----: 72 76 61 85 53 Depreciation and rent----------do----: 273 352 356 383 404 Interest expense---------------do----: 137 168 175 200 206 All other fruit costs----------do----:~-8~8~4"'-''-c-=-9=8=2-=-~~9~4~6'-'-=lL,=18~3"-''-'l~,~0=3=2-
Total fruit costs------------do----:-=.1L,8~3~4"'-''-'2~,~1~7=8-=-~2~,~1~2~5'-'-=2L,4~4~8"-''-'2~,=3=0=5-Net income or (loss)-------------do----: 176 (4): (106): 38 (282)
Number of farms reporting losses-----: 7 : 12 : 13 : 11 : 14 Number of farms reporting data-------: 21 24 24 24 24
As a share of net sales: Total expenses--------------percent--: 91.2 Net income (loss) before income taxes:
percent--: 8.8
100.2 105.3 98.5
(.2): (5.3): 1.5
113.9
(13.9)
!J The responding growers accounted for 0.05 percent of total production by small growers in crop year 1984/85.
Source: Compiled from data submitted in response to questionnaires of the U.S. International Trade Commission.
since then. Expenditures for apple plantings by both groups of growers increased in 1982, decreased by about 20 percent in 1983, increased again in 1984 by about 30 pe,rcent, and decreased by about 20 percent in 1985, as shown in the following tabulation (in thousands of dollars):
1981 1982 1983 1984 1985 Overall operations:
Small growers-------------- 375 396 491 593 481 Large growers-------------- l,428 1,978 1,881 1,707 1,323
Total-------------------- 1,803 2,374 2,372 2,300 1,804 Apple plantings:
Small growers-------------- 48 50 31 57 20 Large growers-------------- 397 434 370 480 424
Total-------------------- 445 484 401 537 444
58

A-59
Financial position of U.S. growers.--The major balance sheet information for the growers is presented in table 30. The ratio of debt to equity increased from 82 percent in 1981 to 109 percent in 1985 for the small growers and from 67 percent in 1981 to 97 percent in 1984 for the large growers.
Table 30.--Selected balance sheet items for U.S. apple growers, as of the end of accounting years 1981-85
Item
Small growers: !J Total assets-----1,000 dollars--: Total liabilities--------do-----: Capital equity-----------do-----: Debt-to-equity ratio------------:
Large growers: ~ Total assets-----J,000 dollars--: Total liabilities---------do----: Capital equity------------do----: Debt-to-equity ratio------------:
!J Data provided by 18 growers.
1981
5,626 2,530 3,096 0.82
31,459 12,644 18,815
0.67
1982
6,250 2,660 3,590 0.74
32,842 14,832 18,010
0.82
1983
7,613 2,900 4, 713 0.62
34,857 15,817 19,040
0.83
1984
6,665 3,475 3,190 1.09
35,839 17 ,654 18,185
0.97
~Data provided by 30 growers for 1981-84, 23 growers for 1985.
1985
6,690 3,484 3,206 1.09
31,784 14,353 17,431
0.82
Source: Compiled from data submitted in response to questionnaires of the U.S. International Trade Commission.
Operations of producers of domestic apple juice.--The income-and-loss experience of 10 producers on their operations producing 100 percent apple juice is shown in table 31 for 1982-85. The data reported are equivalent to the total establishment operations for the firms except for one company. Net sales rose by 35.5 percent, from $104.9 million in 1982 to $142.2 million in 1985. In the aggregate, the processors achieved operating profits throughout the reporting period. Operating income totaled $5.5 million, or 5.3 percent of sales, in 1982; $3.1 million, or 2.7 percent of sales, in 1983; $2.9 million, or 2.2 percent of sales, in 1984; and $4.0 million, or $2.8 percent of sales, in 1985. The relatively low operating incomes were primarily due to heavy promotional expenses (included in general, selling, and administrative expenses) because of intense competition for supermarket shelf space. !J These promotional expenses include advertising, rebates, and allowances. After achieving a net profit in 1982, the producers sustained net losses in 1983, 1984, and 1985. These net losses were mainly attributable to high interest expense payments.
l/ Promotional expenses increased in 1983 and 1984 for several companies. These development efforts often affect sales volume in a subsequent year.
59

A-60
Table 31.--Income-and-loss experience of 10 producers on their operations producing domestic apple juice, accounting years 1982-85
Item 1982 1983 1984 1985
Net sales !/-----------1,000 dollars--: 104,917 116,545 129,622 142,174 Cost of goods sold---------------do----:~8~2=-'""',1~9~1:--~~9~1~·~16~5,__~l~O~l~,73~176~~1~1~1~·~573~9_ Gross profit---------------------do----: 22,726 25,380 28,306 30,635 General, selling, and administrative
expenses--------------1,000 dollars--:~_17~,2~4~3~~-2_2~,_28_5~~-2_5~,_4_5_3~~2~6~·~6~4~5-0perating income-----------------do----: 5,483 3,095 2,853 3,990 Interest expense, net------------do----: 4,080 4,131 4,819 5,717 Other income, net----------------do----=~~-=-5~0~8--'-~~-3~0~4"'-'--~--=2~8~1°"-''--~~~6~6-Net income or (loss) before
income taxes-------------------do----: 1,911 (732): (l,685): (1,661) Depreciation and amortization expense
included above--------1,000 dollars--:~-=li,~5~7~6--'-~~2=-'-,7~9~9'--'----'3~,~1~1~4~'---=3~,~3~6~3-Cash flow from operations--------do----: 3,487 2,067 1,429 1,702 As a share of net sales:
Cost of goods sold----------percent--: Gross profit-------------------do----:
78.3 21.7
78.2 21.8
78.2 21.8
78.5 21.5
General, selling, and administrative : expenses------------------percent--:
Operating income---------------do----: Net income before income taxes-do----:
16.4 5.3 1.8
19.1 2.7
(0.6):
19.6 2.2
(1.3):
18.7 2.8
(1.2) Number of firms reporting operating
losses-------------------------------: Number of firms reporting net losses---:
4 6
4 8
5 6
!/Firms included account for approximately 30 percent of U.S. production.
Source: Compiled from data submitted in response to questionnaires of the U.S. International Trade Commission.
S.S. Pierce is the parent company of Seneca Foods, a major apple juice processor that accounted for about ***percent of total U.S. production in 1985. Seneca did not provide profit-and-loss data, but the 1985 annual report of S.S. Pierce indicated that the profitability of their apple juice operations declined in 1985.
5 6
Tree Top, estimated to account for about * * * percent of U.S production, did not provide data. The April 1985 issue of the company's magazine, Tree Topics, stated the following:
The competitive nature of the current apple juice market allows for a very small profit margin. Utilizing our member raw product for juice is the least profitable use we can make of that fruit. For this reason, we have placed a major emphasis on the effective peeling and dehydration of juice apples.
60
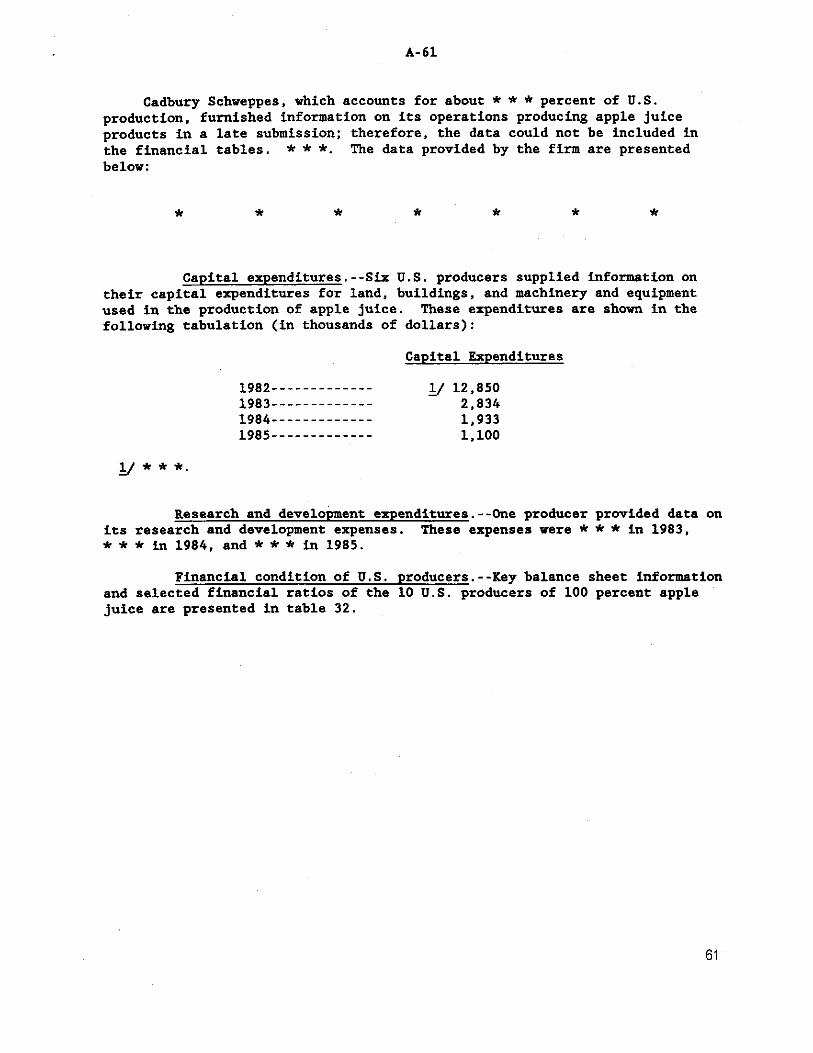
A-61
Cadbury Schweppes, which accounts for about * * * percent of U.S. production, furnished information on its operations producing apple juice products in a late submission; therefore, the data could not be included in the financial tables. * * *· The data provided by the firm are presented below:
* * * * * * *
Capital expenditures.--Six U.S. producers supplied information on their capital expenditures for land, buildings, and machinery and equipment used in the production of apple juice. These expenditures are shown in the following tabulation (in thousands of dollars):
y * * *·
1982-------------1983-------------1984-------------1985-------------
Capital Expenditures
y 12,850 2,834 1,933 1,100
Research and development expenditures.--One producer provided data on its research and development expenses. These expenses were * * * in 1983, * * * in 1984, and*** in 1985.
Financial condition of U.S. producers.--Key balance sheet information and selected financial ratios of the 10 U.S. producers of 100 percent apple juice are presented in table 32.
61

A-62
Table 32.--Selected balance sheet and financial ratios for producers of domestic apple juice on their overall operations, as of the end of accounting years 1982-85
Item
Total current assets----1,000 dollars--: Property, plant, and equipment, net
1,000 dollars--: Total assets---------------------do----: Total current liabilities--------do----: Long-term debt due after 1 year--do----: Total liabilities----------------do----: Equity--------------------C------do----: Working capital !/---------------do----: Current ratio ~------------C----------: Total debt-to-equity ratio-------------: Ratio of pretax income or
1982
43,556
36,548 93,454 25,255 14,531 57,704 35,750 18,301
1. 72 1.61
1983
49,587
37. 917 100,044 28,496 15,197 65,810 34,234 21,091
1. 74 1.92
1984
46,8ll
37,013 97,567 31,214 13,642 68,922 28,645 15,597
1.50 2.41
1985
56,284
43,140 ll0,079 37,594 25,290 83,866 26,213 18,690
1.50 3.20
(loss) to-Equity-------------------------------: Total assets-------------------------: Invested capital;!!------------------:
5.3 2.0 3.5
(2.1): (.7):
(1. 2):
(5.9): (1. 7): (3.2):
(6.3) (1. 5) (2.7)
!/ Current assets minus current liabilities. ~ Current assets divided by current liabilities. ;!! Working capital plus net property, plant, and equipment.
Source: Compiled from data submitted in response to questionnaires of the U.S. International Trade Commission.
The Question of Threat of Serious Injury
U.S. importers' inventories
The importers that responded to the Commission's over 60 percent of all imports of apple juice in 1985. following end-of-the-crop-year inventories of imported gallons):
As of the end of the crop year (June 30)--
1980/81-------------------1981/82-------------------1982/83-------------------1983/84-------------------1984/85-------------------
As of the middle of the crop year (Dec. 31)--
1984/85-------------------1985/86-------------------
Inventories of imported CAJ
642 334 447 638 502
515 288
questionnaires accounted They reported the
for
CAJ (in thousands of
Single-strength equivalent
4,494 2,338 3,129 4,466 3,514
3,605 2,016 62

A-63
There were no reported inventories of imported single-strength apple juice during 1980-85 (there were no imports of such juice by these firms).
Foreign industries
World production of apples increased significantly over the decade from the early 1970•s to the early 1980's, and a certain share of this production in every country, as in the United States, is used as juice apples for the production of apple juice or CAJ. During the 5 crop years 1980/81 to 1984/85, the production of apples in 28 significant apple-producing countries for which historic data are available averaged 22.8 million metric tons per year (or 50.4 billion pounds). !/ This production was up 35 percent from the average production of 16.9 million metric tons 10 years earlier during 1970/71 to 1974/75 (table 33). In Europe, where the greatest world production of apples occurs, apple production (excluding cider apples) over the decade increased by 5 percent in the 12 countries that are currently members of the European Community (EC), to an average level of 7.8 million tons during 1980/81 to 1984/85. Production increased by 60 percent in six Central and Eastern European countries that are not members of the EC, to 2.9 million tons. The increased production for these six countries--Hungary, Yugoslavia, Bulgaria, Czechoslovakia, Austria, and Switzerland--amounted to 1.1 million tons over the decade, which was more than the 0.9 million ton increase in annual average production in the United States over the same decade. Additionally, apple production in two other Eastern European countries, Poland and Romania, probably averaged 2.3 million tons annually during the most recent 5 years, based on available information; however, comparable historic data are not available. Polish apple production is said to have increased from 1.0 million to 1.8 million tons annually between the late 1970's and 1982-84, and the production of CAJ in Poland, and its export, is said to have shown spectacular increases, making Poland the fourth most important exporting country of concentrated apple juice in the world. ~ The source also indicated that modern processing equipment used in Poland is imported from Western European sources on the basis of a barter arrangement and paid for with apple juice concentrate.
Imports of CAJ into West Germany from the Eastern bloc countries increased from 5,000 to 11,000 tons, as shown in the following tabulation: 11
1983--------------1984--------------1985--------------
Quantity (tons)
5,157 5,859
10,940
!/ Comparing 5-year averages of annual apple production more accurately reflects foreign industry trends and expectations than would comparing annual changes during a 5-year period because of annual variations in production caused by weather, which can be significant. ~ AgraEurope, Report on European Agricultural Statistics, July 1985. 11 Data provided by the German Agricultural Marketing Board in a letter to
the Commission dated Apr. 23, 1986. 63

Table 33.--Applea; World production for all uaea in selected regions and countries, by crop yeara, S-year average• 1970/71 to 1984/8S and annually 1981/82 to 198S/86
(In thousands of met rlc tont1)
5-year average• Annual Region and country
1970/71-: 1975/76-: 1980/81-: 1981/82 1982/83 1974/7S 1979/80 1984/8S : 1983/84 ;1984/8S 198S/86
United Statea-----: 2,8S7 l,310 3,752 3,517 3,684 3, 798 3,7S8 J,542 Europe: 1/
EC-12:-2/ lt•lF-------: 1,914 1,999 2,131 1,773 2,642 2,056 2,217 2,070 Prance------: 1,692 1,663 1,768 1,502 1,978 1,575 1,962 l, 77 J. Weat Geruny--; 1,6S8 1,686 1,680 113 2,637 1,3.l3 1,799 1,300 Spain-------: 762 976 946 : 1,008 891 1,012 9S9 1,000 Netherland a----: 443 417 380 260 440 364 388 310 United KJft&doa---: 420 316 299 227 340 292 316 293 Greece-----: 210 236 292 300 26S 312 321 319 Other IC----: 326 328 296 184 ll8 260 294 2)4
Total EC---: 7,425 7,621 7,792 6,027 9,531 7,184 8.176 7,338 Other Europe:
Huagarr----: 720 926 1,151 1,232 1,279 1,141 1,088 .l, 130 a-.nta : 3/ 3/ 4/ S25 74S 755 600 l/ Yuaoalovia----: -346 -409 - S76 sos 746 SS7 S84 600 Bulaaria----: 331 ]20 424 433 426 468 400 11 C&echoalovakia---: 138 183 3Sl 167 S04 427 378 l.I Auatria-----: 170 218 261 186 340 263 276 2S2 Svitnrland---: 97 112 123 83 140 llS 159 131 Total--~---: 1,802 2,168 2,886 l,134 4,180 J,726 3,48S }_/ >
f Southern "' Heetaphere: ..,..
Argentina SU 827 869 804 817 872 943 600 South Africa----: 302 372 465 486 423 Sil 453 49fJ Chile- 103 179 367 335 370 410 4l0 480 Auat~•lia------: 392 296 302 294 301 267 340 320 Nev Zealand----: 144 179 242 235 192 256 285 311
Total--------: l,4s4 1,853 2,245 2,154 2,103 2,318 2,44 .. 2,240 Other countriea:
Chiu--------: 992 2,113 2,856 3,006 2,430 3,591 2,941 j,000 Turkey-----: 836 I 1,050 : 1,S66 1,450 1,600 1,750 l,&00 1,900 Japan--------: 960 857 918 846 923 l,U48 812 961J C.uda 412 434 476 422 478 485 441 490 Heaico- 182 297 339 280 394 302 437 403
Total-------: 3,382 41 7s1 6,155 61004 51825 1,176 6,231 6,762 Grand total,
apecif ted couotriee---: 16,920 19, 703 22,830 20,836 2j,l24 24, 203 24,191 l.I
1/ Doea not tnclude:varietiea:arovn epe~ifically ;or .. ktng:alcoholic:apple ctd~r. "'ii The 12 ... ber countriea of the EC are Belgi1.m, De11118rk, France, Greece, Ireland, lt•ly.
Lui"eabourg, the lletherlaoda, Portuaal, Spain, Weat Ge,..ny, end the United Kinadom. Spain and Portugal becaae ... ber countriea on Jan. 1 1 1986; data are not available for Portua•l.
Q) 3/ llot available. ... !I Production in aouaie duriag 1980/81 to 1984/SS averaged 608,000 metric tons annually.
Source: Ca.piled froa off tctal atatiatice of the Foreign Agriculture Service, U.S. Depart•ent of £ar1culture, except ea noted.

A-65
Apple production in five Southern Hemisphere countries with significant apple industries increased by 54 percent over the decade and averaged 2.2 million tons annually during the most recent 5-year period. Apple production in Argentina, the leading supplier of CAJ to the United States in most recent years, increased over the decade from 513,000 tons annually to 869,000 tons, or by 69 percent. Other Southern Hemisphere countries that export apple juice are the Republic of South Africa, Chile, Australia, and New Zealand.
The supply and utilization of fresh apples in 10 countries is shown in table 34. Five of the top six U.S. import sources are included in the table. Argentina utilized from 40 to 45 percent of its apples in processing in the past few crop years, and it imports no fresh apples. The Netherlands, Spain, and West Germany sold most apples in the domestic fresh market, placing only about 20, 6, and 30 percent, respectively, into processing. South Africa exported slightly more fresh apples than were sold in its domestic fresh market and utilized about 25 percent in processing. The processing figures include all types of operations, of which juice production is only a part.
Questionnaire responses provide some information about the foreign juiceprocessing industry, specifically that part producing concentrated apple juice (69-72 degrees Brix). This is the primary product exported, although some 45 degree Brix concentrate is exported as well. The concentrate is generally exported in 50- to 65-gallon plastic or steel drums.
Generally, there are three or more foreign firms exporting concentrated apple juice from each of the different countries that export to the United States. There are at least 15 countries that export significant quantities of CAJ to the United States: Argentina, Spain, Turkey, West Germany, Austria, Italy, Hungary·, the Netherlands, Belgium, South Africa, New Zealand, Denmark, Mexico, Chile, and Israel. Chile's capacity to produce CAJ is being doubled by construction of a new plant by Coca Cola. !/
Table 35 shows data on production and exports from the major supplying countries. In 1985, Argentina produced CAJ at 79 percent of its capacity; almost all exports were to the United States. According to the source of the data in the table, West Germany's capacity to produce CAJ is "big enough to process available apples without problems." West Germany's exports to the United States represented a relatively small share, 5 to 7 percent, of its total production in 1981 and 1982, but they increased to 17 to 26 percent in 1983-85. Austria's exports to the United States showed the sharpest increase among the countries shown during 1981-85, from 3 percent of production in 1981 to 61 percent in 1985. Chile operated at full capacity in 1984 and 1985; the data presented do not include the new plant of Coca Cola, which reportedly aims to produce 882,000 gallons of CAJ in 1986 and 1.7 million gallons in 1987.
!J Prehearing brief of counsel for the American Farm Bureau Federation, p. 21.
65

A-66
Table 34.--Apples: Supply, utilization, and share of production processed, by countries and crop year
Country/ Supply Utilization Share of
crop year Produc- : : . . production Imports: Exports Market :Processed: processed tion : : . .
------------------Metric tons----------------- Percent Argentina:
1/83-12/83----: 817,000 0 220,475 266,525 330,000 40 1/84-12/84----: 934,000 0 200,000 334,000 400,000 43 1/85-12/85----: 942,800 0 215,000 327,800 400,000 42 1/86-12/86----: 600,000 0 100,000 230,000 270,000 45
Australia: 1/84-12/84----: 267,000 0 16,000 196,000 55,000 21 1/85-12/85----: 340,000 0 28,000 196,000 116,000 34 1/86-12/86----: 320,000 0 30,000 193,000 97,000 30
Canada: 7/83-6/84-----: 484,853 91,288 77. 352 228,152 211,378 44 7/84-6/85-----: 440,558 97,276 40,533 232,301 215,000 49 7/85-6/86-----: 490,000 :100,000 60,000 260,000 210,000 43
Chile: 1/84-12/84----: 410,000 0 208,370 151,630 50,000 12 1/85-12/85----: 420,000 0 203,000 157,000 60,000 14 1/86-12/86----: 480,000 0 235,000 175,000 70,000 15
France: 8/83-7/84-----:1,574,900 :122,400 546,100 772,200 185,000 12 8/84-7/85-----:1,981,700 : 83,200 620,000 784,200 148,000 7 8/85-7/86-----:1,772,000 :100,000 640,000 785,000 150,000 8
Netherlands: 7/83-6/84-----: 403,000 :218,000 154,000 381,000 86,000 21 7/84-6/85-----: 431,000 :204,000 154,000 395,000 75,000 17 7/85-6/86-----: 340,000 :280,000 150,000 390,000 70,000 21
New Zealand: 10/84-9/85----: 255,700 4,100 126,000 52,700 81,100 32 10/85-9/86----: 285,000 3,000 149,000 56,000 83,000 29 10/86-9/87----: 311,000 3,000 157,000 57,000 100,000 32
South Africa: 1/83-12/83----: 423,396 359 143,896 162,359 117,500 28 1/84-12/84----: 513,105 367 221,372 163,800 128,300 25 1/85-12/85----: 453,132 325 199,619 155,838 98,000 22 1/86-12/86----: 498,530 275 214,255 155,850 128,700 26
Spain: 7/84-6/85-----:1,012,000 560 56,150 805,210 50,000 5 7/85-6/86-----: 959,000 3,000 29,400 766,700 70,000 7 7/86-6/87-----:1,000,000 4,000 40,000 804,000 60,000 6
West Germany: 7/83-6/84-----:1,313,071 :716,618 51,545 :1,554,447 410,297 31 7/84-6/85-----:1,799,269 :708,996 35,233 : 1,883, 112 548,120 30 7/85-6/86-----:1,300,000 :700,000 40,000 :l,600,000 325,000 25
Source: Foreign Agricultural Service, U.S. Department of Agriculture.
66

A-67
Table 35.-Concentrated apple juice (CAJ) (69-72 degree Brix): All apples produced, apples used for CAJ, capacity to produce CAJ, production of CAJ, and exports of CAJ to the United States, by sources, 1981-85
Item 1981 1982 1983 1984 1985
Arxentina: : 11 apples produced 1/---------: 905 804 817 933 928
Apples used for CAJ !!-----: 268 : 334 : 345 393 366 percent of total----------: 30 : 42 : 42 42 39
Ca~acit1 to ~ro9uce.CAJ 2/-------: 10,000 10,000 : 10,000 10,000 : 10,000 apacity u 1l1zat1on (1)------: 58 72 : 74 84 : 79
Production of CAJ 3/---------: 5,762 7, 188 7,425 8,449 : 7,861 Exports of CAJ to US ~/-------: 5,201 6,537 5,738 7,342 : 7,627
ll!trcent of total------------: 90 91 77 87 : 97 West Gennany: :
All apples produced 1/-------: 772 2,637 1,313 1, 799 : 1,850 Apples used for CAJ !!------: 232 : 791 : 394 540 : 555
percent of to ta 1------------: 30 : 30 : 30 30 : 30 Capacit1 to produce CAJ------: 4/ : 4/ 4/ 4/ 4/ Production of CAJ 3/--------: 9,lJ53 3z-;299 : 16-;-011 22-;-028 22-;-653 Exports of CAJ to US ~/------: 700 : 1,513 : 4,202 3, 746 5,525
eercent of total----------: 7 : 5 : 26 17 24 Austria: · :
243 : 428 : All apples produced Y-----: 231 353 293 Apples used for CAJ Y------: 160 : 330 : 150 270 210
percent of total----------: 66 : 77 : 65 76 : 72 Capaci t1 to ~roduce CAJ Y----: 6,200 : 6,030 : 8,000 8,300 : 8,800 Production of CAJ 3/---------: 4,087 : 8,500 : 3,890 7 ,000 : 5,450
Capacity utilization (%)----: 66 : 141 : 49 84 : 62 Exports of CAJ to US ~/-------: ll3 : 492 : 1,736 2,290 : 3,350
ll!trcent of total-----------: 3 : 6 45 33 : 61 Bilgn111: ~ : :
All apples produced 1/-----: 581 523 : 640 600 601 Apples used for CAJ T/-----: 75 81 90 97 145
percent of total--=----------: 13 15 : 14 16 24 Production of CAJ 3/---------: 1,935 2, 105 : 2,315 2,515 3,675 Exports of CAJ to US Y------: 387 1,052 : 1, 158 1,505 2,446
ll!trcent of total------------: 20 50 : . so 60 66 Spain: :
All apples produced Y-------: 1,062 891 : 1,075 1,019 1,057 Apples used for CAJ Y---------: 39 : 90 : 83 ll5 170
percent of total-----------: 4 : 10 : 8 ll 16 Capacit1 to produce CAJ §!---: 10,494 : 10,494 : 10,494 10,494 10,494 Production of CAJ 3/-----------: 720 : 1,750: 1,600 2,350 3,450
Capacitf utilization (%)----: 7 : 17 15 22 : 33 Exports o CAJ to US ~/-------: 428 : 1,031 1, 1 ll 1,965 : 2,~ eercent of total-------------: 59 59 69 84 :
Chi le: : All apples produced 1/-----: 340 : 353 : 340 407 : 422 Apples used for CAJ !!-------: 21 : 36 : 35 : 51 : 48
percent of total---------: 6 : 10 : 10 : 12 : 11 Capacit1 to produce CAJ Y---: 686 : 145 : 745 1,078 : 1,078 Production of CAJ 3/------------: 413 : 763 : 913 1,209 : 1,157
Capacit¥ utilization (%)-----: 60 : 102 : 92 ll2 : 107 Exports o CAJ to US ~/----------: 349 : 386 : 689 969 : 975
eercent of total-----------: 84 : 50 : 75 80 : 84 1/ l,000 metric tons. ~I 1,000 gallons CAJ; capacity based on 100 working days per year. ~I 1,000 gallons CAJ. y "Big enough to process available industrial apples without problems." 5/ Ca~ity to produce CAJ not available. ~ 1, gallons CAJ; capacity based on 28,750 gallons per day, 365 days per
year.
Source: Posthearing submission by counsel to parties opposing in.,ort relief.
67

A-68
The Question of Imports as a Substantial Cause of Serious Injury
Market penetration
The ratio of imports of apple juice to apparent U.S. consumption rose from 28 percent in crop year 1980/81 to 55 percent in crop year 1984/85, as shown in the following tabulation:
Prices
Ratio of imports to apparent consumption
Crop year (percent)
1980/81------------------------ 28 1981/82------------------------ 33 1982/83------------------------ 47 1983/84------------------------ 45 1984/85------------------------ 55 July-January
1984/85---------------------- 40 1985/86---------------------- 43
The price of apple juice depends on the demand for apple juice and on factors affecting the supply of apple juice, which in turn depends on factors affecting the supply of juice apples and imported concentrate. The price of juice apples depends on factors affecting the supply of juice apples such as weather conditions and the market for apples in other uses, and the demand for juice apples, which derives from the demand for apple juice. These interrelationships are examined using data from public sources and from questionnaire responses.
Apple juice.--Apple juice is supplied primarily from two sources: pressing domestically grown apples (i.e., domestic apple juice) and reconstituting imported CAJ. The supply of apple juice from domestically grown apples is affected by the supply of juice apples during a given crop year, the market for apples in other uses, and the supply of imported CAJ. !/ The quantity of domestic apple juice produced increased fairly steadily from 1975 to 1980 and then fell off somewhat from 1981 to 1985 (tables 8 and 20).
The remainder of the apple juice consumed in the U.S. market is supplied by reconstituting imported CAJ. Imported CAJ may be simply reconstituted and sold as single-strength juice or frozen concentrate, or it may be blended with apple juice produced from domestically grown apples either for the purposes of taste modification or cost reduction. The total quantity of imported CAJ has increased substantially over the last 10 years, with very large increases occurring since 1981 (table 8).
!/ During a given crop year, some juice apples may be abandoned if the costs of gathering wind-drops from the ground or of transporting apples culled from packing or storage exceed prices paid for such apples.
68

A-69
Two factors may have influenced the demand for apple juice during the past 10 years. First, some evidence indicates that there has been a shift in consumers' preferences towards greater consumption of fruit juice and drinks. 1:f Second, the ready availability of a standardized quality of juice may have stimulated the demand for apple juice. '!,/ Per capita consumption more than doubled from 1975 to 1983, the last year for which data are available.
Indexes of the price of apple juice provided by the American Agricultural Marketing Association (AAMA) and calculated from a limited number of questionnaire responses are provided in tables 36 and 37. ~ The nominal price index provided by the AAMA of apple juice produced from domestically grown apples and imported CAJ increased steadily from 1975 to 1981 and then declined from 1982 to 1984. When adjusted for inflation, the price index increased from 1975 to 1978 and then declined irregularly during 1979 to 1984. The rise in the price of apple juice during 1975 through 1979 was accompanied by a steadily increasing quantity of apple juice consumed. Thus, the rise in the price may have resulted from an increase in the demand for apple juice. From 1981 to 1984, the supply of apple juice, primarily that produced from imported CAJ, continued to increase while the price of apple juice declined.
Table 36.--Index of prices 1:f of apple juice produced from domestically grown apples and imported concentrate, 1975-84
1975-100
Price index Price index Year .. Year
Nominal: Real .. Nominal Real .. . .
1975---------------: 100.0 100.0 .. 1980------------: 168.1 112.3 1976---------------: 111.6 107.2 .. 1981------------: 197.8 120.1 1977---------------: 129.9 117.6 .. 1982------------: 190.6 112.1 1978---------------: 158.0 132.8 . . 1983------------: 186.4 107.8 1979---------------: 167.9 127.0 .. 1984------------: 176.0 99.7
1:f Prices were deflated using the wholesale price index, provided by the Bureau of Labor Statistics.
Source: 1985 Apple Crop Statistics and Market Analysis, American Agricultural Marketing Association.
1:f See for example, Food News, Oct. 19, 1984, and Fruit Grower, May 1985. '!,/ Note that an increase in the supply of apple juice by itself would cause
an increase in consumption. In addition, an increase in the supply may cause a long-run shift in the consumers' taste for the product, increasing demand. ~ Sufficient questionnaire data were not available to calculate separate
price series for single-strength or frozen concentrated juice produced from domestic and imported sources, on a quarterly basis.
69

A-70
Table 37.--Index of weighted-average prices!/ of apple juice reported by producers, 1981-85
1981=100
Year All apple juice Domestic Reconstituted from imEorted CAJ
Nominal Real Nominal Real Nominal Real
1981-----------: 100.0 100.0 100.0 100.0 100.0 100.0 1982-----------: 107.7 103.7 110.3 106.2 107.2 103.2 1983-----------: 98.5 93.2 99.0 93.7 100.0 94.6 1984-----------: 98.5 91.2 100.5 93.1 97.8 90.6 1985-----------: 91.8 84.3 95.1 87.3 87.8 80.6
!f Prices were deflated using the wholesale price index, provided by the Bureau of Labor Statistics.
Source: Compiled from data submitted in response to questionnaires of the U.S. International Trade Commission.
The nominal and inflation adjusted price indexes for apple juice produced from domestic and imported sources calculated from questionnaire responses indicate a general downward trend in prices from 1982 to 1985. The decline in the price of apple juice during this period w4s more pronounced for juice made from imported concentrate than that made from domestic apples.
Juice aEEles.--The price of juice apples is influenced by factors affecting the supply of juice apples and by the demand for juice apples, which depends on the demand for apple juice and the supply of imported CAJ. Juice apples are supplied from two sources: (1) those not suitable for the fresh or canning markets that are sorted at harvest, during the packing process, or from storage, and (2) wind drops that are recovered from the ground. Because juice apples that are sorted at harvest or from storage are a coproduct of apple production geared primarily for other markets, !f the costs of production are not separable from those associated with apple production for other uses. Therefore, the supply of such apples from a given harvest is largely determined by the quantity and quality of apples harvested and the markets for fresh and canning apples. ~ A poor harvest may result in a decline in the overall quantity of apples in all uses or it may result in a larger share of the total crop that is used for juice. The costs of recovering wind-drops from the ground, in contrast, are separable. Therefore, the supply of wind-drop apples depends on the cost of gathering relative to the price received for such apples.
!f The question of whether a juice apple is a coproduct or a byproduct of apples destined for the fresh market or for canning depends on whether a grower targets his production for the fresh, canning, or juice apple market. ~ The quality and quantity of an apple harvest is primarily affected by
weather conditions and diseases.
70

A-71
Total juice apple utilization increased fairly steadily from a 5-year average of 1 billion pounds during crop years 1970/71 to 1974/75 to 1.4 billion pounds during 1975/76 to 1979/80 and 2.1 billion pounds in crop year 1980/81. Such utilization leveled off during crop years 1981/82 to 1984/85 (table 14).
The demand for juice apples depends on the demand for apple juice and the supply of the substitute input, imported CAJ. As discussed above, the demand for apple juice has increased during the last 10 years. At the same time, imports of CAJ have increased significantly.
Data on the price of juice apples provided by the U.S. Department of Agriculture show irregular movements from crop year 1975/76 to crop year 1984/85 (table 38). Prices increased from 2.63 cents per pound in crop year 1975/76 to 5.50 cents per pound in 1978/79 and then declined during the next 2 crop years to 3.69 cents per pound in 1980/81. The price of juice apples rose to 5.15 cents per pound in crop year 1982/83 and then declined during crop years 1983/84 and 1984/85 to 4.40 cents per pound in the latter year.
Table 38.--Prices of apples, .!/by uses, crop years 1975/76 to 1984/85
(In cents per pound)
All uses Fresh Canned Juice
Crop year : Constant: : Constant: : Constant: : Constant :Current:l975/76 :Current:l975/76 :Current:l975/76 :Current:l975/76
prices prices prices prices
1975/76-----: 6.50 6.50 8.80 8.80 2.88 2.88 2.63 2.63 1976/77-----: 9.10 8.59 11.50 10.86 6.00 5.67 4.58 4.32 1977/78-----: 10.60 9.41 13.80 12.86 6.65 5.91 5.45 4.84 1978/79-----: 10.40 8.44 13.90 11.28 5.95 4.83 5.50 4.46 1979/80-----: 10.90 7.85 15.40 11.09 6.25 4.50 5.15 3. 71 1980/81-----: 8.70 5.57 12.10 7.75 4.87 3.12 3.69 2.36 1981/82-----: 11.10 6.48 15.40 8.98 6.05 3.53 4.40 2.57 1982/83-----: 10.00 5.51 13.20 7.28 6.60 3.64 5.15 2.84 1983/84-----: 10.50 5.71 14.90 8.10 5.85 3.18 4.45 2.42 1984/85-----: 11.20 6.02 15.50 8.34 6.85 3.68 4.40 2.37
.!/ Prices were deflated using the wholesale price index, provided by the Bureau of Labor Statistics.
Source: Noncitrus Fruits and Nuts, U.S. Department of Agriculture, Crop Reporting Board, various issues.
Although it is difficult to sort out all factors affecting this market, a few events are noteworthy. First, the increase in the price of juice apples from 1975 to 1978, which was accompanied by an increase in both juice apple utilization and imports of concentrate, was probably caused by an increase in the demand for apple juice. Juice apple utilization peaked in crop year 1980/81 and imported CAJ increased 52 percent over the previous year, causing
71

A-72
the price of juice apples to drop to 3.69 cents per pound. Since 1980, juice apple utilization appears to have leveled off. However, imports of CAJ have continued to rise. These increases in the level of imports, particularly during crop years 1982/83 to 1984/85, coincided with a decline in the price of juice apples.
Data on prices of juice apples compiled from questionnaire responses are provided in table 39 for crop years 1981/82 through 1984/85 and for July-December 1985. These data show a slight, irregular downward trend in the price of juice apples in current and constant dollars from 1981/82 to 1984/85. During July-December 1985, prices dropped significantly. Data on quarterly selling prices of juice apples for the same period, provided in table 40, show an irregular downward trend in the price of juice apples from the last half of crop year 1981/82 to October-December 1985. However, any trend in quarterly purchase prices is less evident.
Table 39.--Selling and purchase prices !I of juice apples, crop years 1981/82 to 1984/85 and July-December 1985
(In cents per pound)
Selling prices Purchasing prices
Period Current
Constant 1981/82 prices
Current Constant 1981/82 prices
1981/82------------------------: 1982/83------------------------: 1983/84------------------------: 1984/85------------------------: 1985 (July-December)-----------:
5.31 5.08 4.56 4.59 3.60
5.31 4.80 4.25 4.23 3.31
4.93 5.70 4.89 5.23 3.89
!I Prices were deflated using the wholesale price index, provided by the Bureau of Labor Statistics.
4.93 5.39 4.55 4.82 3.58
Source: Compiled from data submitted in response to questionnaires of the U.S. International Trade Commission.
Concentrated apple juice.--Unit values of imported CAJ are provided in table 41 for imports from all sources and in table 42 for countries that supplied the largest quantity of imports in 1984/85. Unit values of imported CAJ increased steadily from 35 cents per gallon of single-strength equivalent (SSE) in crop year 1975/76 to $1.06 per gallon of SSE in crop year 1979/80. Unit values declined in crop year 1980/81 to 74 cents per gallon of SSE and then increased to 84 cents per gallon of SSE in 1981/82. Unit values declined steadily during the next 3 crop years to 67 cents per gallon of SSE in crop year 1984/85. Unit values from all countries reported in table 42 declined during crop year 1984/85 and the last half of 1985 and were lower during July-December 1985 than during the preceding crop years.
72

A-73
Table 40.--Quarterly purchase and selling prices of juice apples, July 1981-December 1985
(In cents per pound)
Period Selling price Purchase price
1981/82: July-September-----------------------: October-December---------------------: January-March------------------------: April-June---------------------------:
1982/83: July-September-----------------------: October-December---------------------: January-March------------------------: April-June---------------------------:
1983/84: July-September-----------------------: October-December---------------------: January-March------------------------: April-June--------"------------------:
1984/85: July-September-----------------------: October-December---------------------: January-March------------------------: April-June---------------------------:
1985: July-September-----------------------: October-December---------------------:
3.44 5.47 6.16 6.63
5.30 4.91 5.86 5.22
5.92 4.33 4.45 4.02
4.25 4.57 4.99 4.89
3.81 3.58
4. 78 4.39 5.98 6.57
5. 77 5.34 6.83 7.30
6.12 4.49 5.47 6.01
6.10 4.56 6.32 6.48
5.87 3.42
Source: Compiled from data submitted in response to questionnaires of the U.S. International Trade Commission.
Table 41.--Estimated unit values !J of imported concentrated apple juice from all sources, crop years 1975/76 to 1984/85 and July-December 1985
(Per gallon Constant::
Crop year Current 1975/76 .. prices ..
. . 1975/76------------: $0.35 $0.35 .. 1976/77------------: . 60 .57 .. 1977/78------------: . 79 .70 .. 1978/79------------: . 92 .74 .. 1979/80------------: l.06 .76 .. 1980/81------------: . 74 .47 ..
of SSE)
Crop year
1981/82---------: 1982/83---------: 1983/84---------: 1984/85---------: 1985 (July-
December)-----:
Current
$0.84 .81 .76 .67
.65
Constant 1975/76 prices
$0.49 .45 .41 .36
.35
!J Prices were deflated using· the wholesale price index, provided by the Bureau of Labor Statistics.
Source: Compiled from official statistics of the U.S. Department of Commerce. 73

A-74
Table 42.--Estimated unit values of imported concentrated apple juice from largest suppliers, crop years 1982/83 to 1984/85 and July-December 1985
(Per gallon of SSE) Federal
Period :Argentina: Republic :Austria:Netherlands: Spain of Germany:
1982/83-------: $0.80 $0.80 $0.84 $0.76 $0.85 1983/84-------: .66 .76 .87 .99 .76 1984/85-------: .59 .69 .73 .79 .69 1985 (July-
December----: .56 .67 .69 .67 . 71
Republic of
South Africa
$0.84 .73 .62
.55
Source: Compiled from official statistics of the U.S. Department of Commerce.
Purchase prices of CAJ were asked by the Commission in its questionnaire from producers of apple juice. Purchase prices of domestic CAJ (i.e., that produced from domestically grown apples) and imported CAJ, calculated from questionnaire data, are provided in table 43 for crop years 1981/82 through 1984/85 and for July-December 1985. The purchase price of domestic CAJ declined steadily from 1982/83 to July-December 1985. The price of imported CAJ also declined steadily from crop years 1982/83 to 1984/85, before increasing slightly during July-December 1985. The purchase price of imported CAJ was consistently below the domestic purchase price during the period covered.
Table 43.--Purchase prices !J of domestic and imported concentrated apple juice, crop years 1981/82 to 1984/85 and July-December 1985
(Per gallon)
Period
1981/82--------------------------------: 1982/83--------------------------------: 1983/84--------------------------------: 1984/85--------------------------------: 1985 (July-December)-------------------:
Domestic
Current
$6.68 7.07 6.16 5.88 5.53
Constant: 1981/82 prices
$6.68 6.68 5.74 5.42 5.09
Imported
Current
$6.39 6.42 5.30 4.61 4.86
Constant 1981/82 prices
$6.39 6.07 4.93 4.25 4.48
!J Prices were deflated using the wholesale price index, provided by the Bureau of Labor Statistics.
Source: Compiled from data submitted in response to questionnaires of the U.S. International Trade Commission.
74

A-75
Quarterly prices of imported and domestic CAJ are provided in tables 44 and 45 for the same period. These data show an irregular downward trend in prices of both domestic and imported concentrate from July-September 1982 through April-June 1985. Again, prices increased slightly during JulyDecember 1985.
Table 44.--Quarterly purchase prices of domestic and imported concentrated apple juice, July 1981-December 1985
(Per gallon)
Period
1981/82: July-September-----------------------: October-December---------------------: January-March------------------------: April-June---------------------------:
1982/83: July-September-----------------------: October-December---------------------: January-March------------------------: April-June---------------------------:
1983/84: July-September-----------------------: October-December---------------------: January-March------------------------: April-June---------------------------:
1984/85: July-September-----------------------: October-December---------------------: January-March------------------------: April-June---------------------------:
1985: July-September-----------------------: October-December---------------------:
Domestic
$7.52 6.00 6.62 7.13
7.47 7.08 6.71 6.50
6.74 6.03 6.17 6.21
6.50 5.83 6.03 5.22
5.56 5.30
Imported
$5.75 6.26 6.50 6.56
7.24 6.57 6.30 5.67
5.75 5.56 5.53 4.90
5.06 4.43 4.58 4.55
4.65 5.04
Source: Compiled from data submitted in response to questionnaires of the U.S. International Trade Commission.
75

A-76
Table 45.--Quarterly purchase prices of imported concentrated apple juice, by sources, July 198l"December 1985
~Per gallon2
Period Argentina West Austria : Netherlands : Spain Republic of
Germany: South Africa : :
1981/82: July-Sept- - - : $5.91 $5.68 y y y y Oct. -Dec----: 5.74 6.40 $5.20 $6.45 $6.04 y Jan. -Mar----: 6.42 6.91 y 6.45 6.00 y Apr. -June---: 5.55 7.30 y 6.45 7.30 y
1982/83: July-Sept---: 6.12 7.20 y 7.35 y y Oct. -Dec- - - - : 6.38 6.59 6.25 7.25 6.28 y Jan. -Mar----: 5.50 6.47 5.40 6.35 6.25 y Apr. -June---: 5.46 5.62 y 5.65 6.04 y
1983/84: July-Sept- - - : 5.40 5.78 5.59 5.65 y $5.40 Oct. -Dec- - - - : 5.48 5.60 5.61 5.50 5.45 y Jan. -Mar----: 5.40 5.42 5.85 5.50 5.85 5.50 Apr. -June---: 4.52 5.28 5.46 y 5.12 5.55
1984/85: July-Sept---: 4.37 5.38 5.51 5.85 y 4.57 Oct. -Dec----: 4.18 4.48 5.00 5.35 4.15 y Jan. -Mar----: 5.75 4.68 4. 74 5.75 4.48 4.27 Apr.-June---: 4.35 4.73 4.80 5.85 4.33 4.55
1985: July-Sept---: 5.19 4.69 4.55 4.60 4.35 4. 73 Oct.-Dec----: 4.67 4.99 5.30 4.70 5.00 4.55
!/ The numbers of firms reporting purchases from each country were as follows: Argentina, 5; West Germany, 11; Austria, 3; Netherlands, l; Spain, 3; and the Republic of South Africa, 2.
y No purchases reported.
Source: Compiled·from data submitted in response to questionnaires of the U.S. Intel;llational Trade Commission.
Exchange rates
The largest importer testified that exchange-rate variations have not played any role in the selection of source countries. !J One of the factors considered in examining the competitive position of domestic producers of juice apples and apple juice vis-a-vis foreign producers of CAJ is the exchange rate between the U.S. dollar and the currencies of the major foreign supplying countries. Quarterly indexes of exchange rates and producer prices of the top six supplying countries of apple juice concentrate during 1985 are presented in table 46 from data reported by the Intel:llational Monetary
!J Transcript of the hearing, p. 255.
76

Table 46.--Exct .. nae ratee: l/ NoaJnal-excbaqe-rate equivaleota of •elected currenctee tn U.!>. dollar&, real-exchaaae-rate equivaTeote, and producar price 1ad1cator• lo apec1f1ed couotriea 1 !/ indexed by quarter•, January 1981-Dec .. ber 1985
Period
1981: : Jaa.-tt.r--: Apr.-June-: July-Sept-: Oct.-Dec--:
1982: Jaa.-tt.mr-: j,pr.-Juu-: Jul1-S.p~-: Oct.-Dec--:
1983: ' Jao.-Har-: .Apr.-June-: July-Sept-: Oct.-Dec-:
1984:
u.s. Pro
ducer Price Index
100.0 102.2 I
102.9 102.8
103.7 103.8 104.3 104.4
104.5 104.8 105.8 106.4
Jan.-tlar--J 101.S Apr.-Juae-: 108.2 July-Sept-: 107.9 Oct.-Dec--: 107.7
1985:
Araeotioa
Pro- Hoainal-: Baal- Pro- Nominal-: Real-ducer :eachanae-: exchana;e-: ducer :exchange-: exchaaae-: Price rate rate : Price rate : rate Index : index : index J/ : Index index : index 3/ :
:---Doiiara/auatral--: :--Dollara/achillina-:
100.0: 132.8: 185.9: 236.7:
313.3: 389.l: 663.3: 967.2:
1388.3: 1849.2: 2820.3: 4693.8:
7175.8: 11923.4: 19971.9: 33350.8:
100.00 57.89 43.14 33.85
21.36 16.06
5.84 5.24
3.83 2.81 2.95 1.24
0.79 O.H 0.32 0.17
100.0 75.2 I
78.0 78.0
64.5 60.2 37.l 48.5
50.8 49.7 54.7 54.5
52.8 58.9 58.7 51.5
100.0 102.0 102.5 103.2
105.6 107.5 104.2 103.4
105.9 105.7 105.l 106.6
109.8 110.7 109.0 109.7
100.0 91.8 86.4 93.9
89.8 88.3 84.7 84.l
87.3 84.5 79.6 78.4
77.6 77.6 72.1 68.9
100.0 91.6 86.1 94.3
91.4 91.4 84.6 83.3
88.5 85.2 79.0 78.6
79.3 79.4 72.8 70.2
Netherlawh1
Pro- Noainal-ducer :exchange- excbdAKe-Prlce r•te rate Index index index J/
:---Dollare/guilder---
100.0: 102.1' 104.6: 105.8:
108.6: 109.7: 110. 7: 110.7:
110.8: 111.l: 112. 7: 112.9:
115. 7: 116.4: 117.l:
· 117.3:
118.1: 119.3: 118.6:
100.0 90.4 84.5 92.5
88.7 86.6 83.7 83.4
85,ti 81.8 77.2 76.0
75.0 74.9 69.4 bb.J
100.0 90.2 85.9 95.2
92.8 91.5 88.8 88.4
~l.O 86.8 82.l 80. 7
80. 7 80.5 7 5. 3 72.2
08.l 72.6 79.1
Jan.-tUr--: 107.S Apr.-Juae-: 107.6 July-Sept-: 106.8 Oct.-Dec--: 107.S
59061.7: :132607.8: :178198.4: :182632.0:
0.09 0,04 I
0.03 0.03
48.5 48. 7 45.8 46.7
114.3 114.9 111.3 110.l
64.6 68.1 73.8 81.4
68.7 72.7 70.9 83.3 :~/117 .6:
62.0 b!J.!"> 7!.2 78.4 !!_I 85.8
: See footootea at end of table.

Table 46.--Exchange ratea: l/ No•inal-exchange-rate equivalent• of &elected currenciea ln U.S. dollarli, real-exchange-r•te equivaTenta, and producer price indicator• in apectfled countr lea, l./ indexed by quartera, January 1981-Deceaber 1985~Cont1nued
South Africa Spain Weat lieruny U.S.
Period Pro- Pro- Nominal-: Real- Pro- No•lnal-: Real- Pro- Noalnal- Real-ducer ducer eachanae-: ezchange-: ducer : exchange-: e zchanse-: ducer :ezchange- exchange-Price Price rate rate Price I rate rate Price rate rate Indez Index index tndez 3/ : Index index tndeJt 3/ : Index index in.Jex J/
:- Dollara7rand-- -: ·- Dollara/~eaeta---: :-~--t>oliara/~Jrk----1981:
Jan.-tt.r--: 100.0 100.0: 100.0 100.0 100.0 100.0 100.0 100.0 !00.0 100.0 Apr.-June-: 102,2 I 102.1: 91.9 91.8 105.3 92.2 95.0 102.5 91.7 91.9 July-Sept-: 102.9 106.3: 82.0 84.7 108.3 85.8 90.J 104.7 85.8 8i. 3 Oct.-Dec--: 102.8 109.7: 80.0. BS.4 111.1 87.5 94.5 106.2 93.0 96.1
1982: Jan.-tt.r--: 103.7 112.9: 11.9 84.8 115.2 83.1 I 92.3 108.1 89.9 92.6 Apr.-June-: 103.8 117.0: 71.6 80.6 118.3 79.3 90.3 109.1 81.1 92.2 July-Sept-: 104.3 120.9: 67.0 77.6 120.1 74.9 86.3 110.1 84.1 88.7 Oct. -Dec--; 104.4 125.3; 68.3 82.0 122. 7 10.0 82.3 110.5 83.4 88.3
1983: Jan.-Kar--: 104.5 127. 9: 71.1 87.0 130.5 64.7 80.8 110.2 86. 7 !.11.4 Apr.-June-: 104.8 130.6: 10.1 88.2 134.2 60.5 77 .5 110.5 84.0 86.b Jul,-Sept-: 105.8 132.8: 69.5 87.3 137.3 55.9 72.6 111.4 79.0 83.1 Oc.t.-Dec--: 106.4 135.1: 65.6 83.3 142.3 54.4 72.8 112.1 77.9 82.1
1984: Jan.~r--: 107.5 136. 9: 62.4 79.5 148.3 54.4 75.1 113.1 77.2 8LJ Apr.-Juae-: 108.2 140.l: 60.4 I 78.2 152.2 55.0 11.3 114.0 11.0 81.1 July-Sept-: 107.9 143.8: 49.0 65.3 154.l 55.9 72. 7 114.5 71.5 75.8 Oct.-Dec--: 107.7 I 149. 5: 42.4 58.9 156.2 49.3 71.5 115.3 68.3 73.2
1985: Jan.-tt.r--: 107.5 156. 7: 37.9 55.2 I 161.8 46.7 70.3 ll6. 5 64.l 69. 5 Apr.-June-: 107.6 162.9: 39.2 59.3 164.4 48.l 13.8 117 .0 67 .6 73.5 July-Sept-: 106.8 168.3: 34.4 54.2 165.7 50.3 78.l 117 .0 73.2 H0.2 Oct.-Dec--: 107.5 •l/176.9: 29.1 ~/ 48.0 167.l 52.9 82.3 116.8 80.8 87 .7
: I/ Ezchanae ratea expreaaed in U.S. dollara per unit of foreign currency. 2! Producer price iadicatora--lntended to •eaaure final product price•--•re baaed on average quarterly
indexea pre.anted ta line 63 of the International Financial Statistic•. 3/ The real value of • currency ta the nominal value adjuated for the difference between inflation rates
••-•eaaured here by the Producer Price Index in the United State• and the respective foreign country. Producer prtcea in the United State• increaaed 7.5 percent between Janu.riry 1981 and Uece•ber 1985 compared with increaaea of 182,532 percent In Argentina, 10.l percent In Auatria, 17.6 percent in the HctherJ.ande, 76.9 percent in South Africa, 67.3 percent in Spain, and 16.8 percent in Weat Geraany during the .... period.
4/ Derived fraa Netherlanda producer price data for October only. !/ Derived fro• South African producer price data for October and Nove•ber only.
Source: International Monetary Fund, international Financial Statiatica, April 1985 and 1986.
liote.--Jaauar7-Harch 1981•100.0
> I ..... "'

A-79
Fund. !/ Exchange-rate indexes of the Argentine austral, the Austrian schilling, the Netherlands guilder, the South African rand, the Spanish peseta, and the West German mark indicate that during January 1981-December 1985, the nominal value of the respective currency of each country depreciated by 99.97 percent, 18.6 percent, 21.6 percent, 70.9 percent, 47.1 percent, and 19.2 percent, respectively, relative to the U.S. dollar. '!:J The level of inflation in the Netherlands and West Germany was slightly higher than in the United States over the 20-quarter period, whereas the level of inflation in Austria was approximately the same as in the United States. Therefore, changes in the real value of the Netherlands guilder, the West German mark, and the Austrian schilling were not significantly different from changes in the nominal value. In contrast, the high levels of inflation in Argentina, South Africa, and Spain over the same period resulted in the devaluation of the currency of each of the aforementioned countries in real terms by 53.3 percent, 52.0 percent, and 17.7 percent, respectively, relative to the U.S. dollar--significantly less than the respective apparent depreciations of 99.97 percent, 70.9 percent, and 47.1 percent, respectively, represented by the nominal devaluation.
Factors other than imports affecting the domestic indust""Y
Factors other than imports that may be affecting the apple juice industry include markets for apples in other uses and markets for other fruit juices.
Per capita consumption of apples in other uses remained fairly constant from 1975 to 1983 (table 6). Inflation-adjusted prices of apples in all uses, provided in table 38, rose from 1975/76 to 1977/78, declined during the next 3 years, then leveled off from 1980/81 to 1984/85. Thus, there does not appear to be any major change in the market for other apples that is affecting the apple juice industry.
The market for other fruit juices also does not appear to be adversely affecting the apple juice industry. The inflation-adjusted price index of all fruit juices provided by the Bureau of Labor Statistics indicates that prices were constant from 1980 to 1983 and then rose by roughly 9 percent in 1984. Per capita consumption of orange juice, which comprises the largest share of fruit juice consumption, declined from 1980 to 1983, the last year for which data are available. The inflation-adjusted price index of orange juice rose by 16.7 percent from 1980 to 1981, fell by 12.3 percent from 1981 to 1983, and then rose by 27.7 percent in 1984.
Competitive Efforts Against Imports
Growers of juice apples and producers of domestic apple juice were asked in questionnaires what, if any, efforts their firm had taken during the past 5 years to compete against imports of CAJ.
!/ The six foreign countries are West Germany, Argentina, Austria, the Netherlands, Spain, and the Republic of South Africa.
'!:/ International Financial Statistics, April 1985 and 1986.
79

A-80
Small growers
Nineteen of the thirty-nine questi.onnaires returned from growers with less than 100 acres planted in apple trees contained no response to the question of what efforts they have taken to compete against imports of CAJ. Eight of the remaining twenty respondents stated that they have taken no efforts, the reason (indicated by a few growers) being that small growers do not compete against imports.
The 12 small growers that cited efforts taken to compete against imports presented a wide variety of alternative measures. By far the major alternative, specified by eight of these growers, was investment in new plantings. These plantings replace older, poorer yielding trees with younger, higher yielding ones that hopefully will produce better quality apples, meaning better and fewer juice apples. The plantings also mean replacements with dwarf trees that allow for more densely planted orchards, increasing overall yields for the orchard.
Other efforts taken include voicing opinions through farm bureau and agricultural cooperative marketing associations, accepting lower prices for juice apple deliveries, or even dumping (discarding) some orchard-runs. Yet other efforts were replacing, repairing, or adding to old machinery to reduce labor costs; investing in new spray programs, using cheaper chemicals and integrated pest control to reduce crop management costs; joining cooperatives to expand juice apple markets; and keeping wages for laborers as low as legally or practically possible.
Although the predominant efforts made by these small growers were to keep production costs in check and increase production for the fresh market, many growers noted that they felt any efforts were futile because there was no way to compete against the low labor costs and subsidized production they perceived to exist in other countries.
Large growers
Of the growers that had more than 100 acres of apple trees, nearly 70 percent, or 35 firms, answered the question concerning efforts they have taken in apple production with regard to competitive imports of CAJ. Additional investment was the most commonly named activity. Of the firms that supplied answers, 60 percent had invested in the renewal of existing orchards or in new orchards. The new plantings often eliminate older trees that produce smaller apples suitable only for juice. Twenty-nine percent of the larger growers had made investments in new equipment, either for orchard operations or, more frequently, for fresh-apple-packing operations to gain higher average returns; 26 percent had made investments in new storage facilities. Nearly one-fourth of the responding firms had made specific cost-reduction efforts on existing equipment or facilities. To grow fewer juice apples was the stated goal of 43 percent of the firms. Efforts named also included a change in labor practices; some used less hand labor to reduce labor costs, while others used more hand labor to reduce the proportion of juice apples produced. A change in the use of chemical spray materials was mentioned by 11 percent of the firms; some used more spray to reduce hand labor costs, while others used less
80

A-81
spray to save expenses. Other efforts listed by the respondents included diversification into crops other than apples (10 percent), organizational changes in the way they do business (e.g., from bulk shipping apples to packaging the apples); technological improvements in their CA storage facilities; and joining a grower cooperative or entering into marketing contracts to assure a market for their apples at harvest time.
Producers of domestic apple juice
Five fLrms described their efforts to compete against imports of CAJ.
* * * * * * *
Adjustment If Relief Were to be Granted
Industry members were also asked in questionnaires sent to growers of juice apples and producers of domestic apple juice what adjustments would be made in their operations should temporary relief be granted as a result of this investigation.
Small growers
Of the 39 questionnaires received from small growers, 21 contained no response to the question of what adjustments would be made in their operations if temporary relief were granted. Of those 18 growers that responded to the question, 10 indicated that new, updated, or rejuvenated plantings would be the adjustment made. Other adjustments included new or reconditioned machinery, new storage facilities, new employees, investment specifically in the production of juice or CAJ, and more numerous and more efficient markets for apples.
Only a few of the responses estimated the cost of any possible adjustments, resulting in a range of $1,000 to $12,000 for orchard investment costs, and a range of $60,000 to $500,000 for machinery investment costs. Most of these estimates appeared to be based on the particular circumstances of the individual orchard, so they probably are not reflective of general investment costs unless they can be adjusted on a per acre basis.
The competitive advantage to be gained from these adjustments manifests itself in a number of ways for the growers. Predominantly, it is believed, these changes will mean better prices for apples, thus providing increased profits, more reinvestment money, and a stronger market share for these growers. Other advantages would include longer and better condition storage
81

A-82
capability, meaning improved quality and market power (i.e., waiting for a better price); increased yields and lower production costs; new technology and p~oducts; and better employee pay. One interesting suggestion was that these adjustments would result in the development of a domestic CAJ industry (possibly with labeling to indicate "Made in the U.S.A.") This suggests a grower feeling that competition could be at the level of the concentrate market, not just the juice market. One grower suggested the possibility of increased vertical integration as another advantage.
It was noted by some growers, however, that the relief shouldn't be temporary because of the need for higher domestic returns to support a higher domestic standard of living and because temporary relief would not help a small grower.
Large growers
Responses of large growers to the question of what adjustments they would make if relief were granted were varied and not focused in any one direction, except that they almost all agreed that juice apples were being sold below the cost of production. Of the 53 questionnaires, 37 (or 70 percent) supplied responses to the question of adjustment actions.
Twenty-seven percent of the responses indicated positive actions--things the grower would do on his farm if relief were granted. Most frequently named was removal of older trees and replanting, or investing in new orchards (12 percent of the total responses); next were actions to sell more fresh apple juice locally or increase juice apple supplies. Other actions cited would be investments to upgrade equipment, storage facilities and migrant housing, or to improve pruning. Twenty-five percent responded that they would continue their ongoing efforts against imports but would take no new actions if relief were granted.
Eighteen percent responding indicated a less positive approach; they stated that it is not possible to make adjustments in their operations or stated that they believe temporary relief would be of no value.
Producers of domestic apple juice
* * * replied in detail with projected and anticipated possible adjustments the firm would make if relief were granted. * * *·
Other Comments of Producers
Producers of domestic juice and/or CAJ
A number of producers of domestic apple juice identified actions they would like to see with regard to imported CAJ if some form of remedy were recommended. These are summarized as follows:
82

A-83
1. Require that the country of origin be printed on the labels of retail apple juice containers.
2. Assessments that apply on domestic products to obtain funds for organizations and promotion should be applied to imported CAJ on an equal ,basis.
3. An increase in the price of imported CAJ. One firm also said that imports would not be a problem if the minimum price of the imported CAJ were $6.50 per gallon).
4. Require that imported CAJ or apples of which it was made not contain chemicals not permitted in the United States, or contain chemicals in quantities not permitted in the United States.
Further, several firms specifically noted that a temporary remedy was no solution because of the long investment times for apple orchards and apple juice production.
Growers
Growers also provided general observations regarding the industry as a whole. Some mentioned that the same rules and regulations with respect to the use of chemical spray materials that are enforced for domestic juice should be enforced for imported CAJ as well; others noted that the United States needs to develop a domestic CAJ industry. Other comments included the period of time that relief would be in effect needs to be sufficient to renew orchards, imports of CAJ or apples should be subject to the same promotional assessments that apply to U.S. apples, currency exchange rates should be brought in "line", and the oversupply of apples in the United States is likely to continue.
During the course of the investigation, 54 letters were received from apple growers in 8 States. The predominant source of the letters was Michigan with 24; the others were West Virginia (7), Washington (5), New York (5), Pennsylvania (5), Virginia (3), North Carolina (1), Wisconsin (1), and 3 unspecified.
The growers all expressed their fears concerning imports of concentrated apple juice. They feel that these imports are the cause of all their problems--low prices for juice apples; the inability to cover harvest, labor, and pesticide costs; the loss of jobs in the growing and processing industries; the closing of plants that press juice apples; and the inability to sell all their apples, leaving them on the ground to rot.
The growers believe that foreign producers of concentrated apple juice are being subsidized by their governments, because the concentrate is so inexpensive. They believe that foreign producers can use pesticides that are
83

A-84
not allowed in the United States, and that their labor costs are lower. One grower mentioned the tranasbipment of products from Eastern to Western Europe.
All these growers believe some sort of temporary protection would help because it would raise the price for juice apples and increase profits, as well as raise the prices for canning and fresh market apples. The price for the imported concentrate vould also be higher, enabling the domestic product to be competitive with tha imports. If imports were restricted, they believe, the decreased availability of concentrate could be made up with domestic apples and processors would go back to pressing fresh apples. Several growers also suggested that the imported concentrate should be labeled with the country or origin, to distinguish it from a domestic product.
84

A-85
APPENDIX A
NOTICE IN THE FEDERAL REGISTER OF INSTITUTION OF INVESTIGATION NO. TA-201-59, LETTER FROM THE UNITED STATES TRADE REPRESENTATIVE, AND LIST OF WITNESSES APPEARING AT THE HEARING
85

A-86
Peden! !leplllr I Vol. 51. NG. 11 I fridaJ. JanW1ry 2c. 19111 I Notic:a
INnRNATIONAL TRADE COMMISSION
(In ... ..,_ No. TA-2111-1
tmpon 1wa1 r im; Apple~
AOUOCT: f.alelllatiaul n.de Commiuioa. ACT10IC lulitulian of an ~atica under 1ection 2DI al ti. Tnm Ad. of 1974 (111 u.s.c. mu aad tdlitdalinf ol a hearinc to be held ID connection widt the invelli&atioa.
SUIHIAllT: Followinc recalpt an December 'Z7. 1915. of a reqwtl !ram die United State• Trade Reprftftltaliwe. the United Stetea l.awmticmal n.de Commi11ioo ln1tltured m...-utipllan No. TA-201...W under HC!ioa ZDl ol IM Trade Act of 1174 to delarmille wlletbaepple juice. not mixed end DOI containinc over 1.0 percmt of etbJl
. alcobol bJ TOI- p-XW for ID 11-155.15 of tha TerilrSdi.dW. of dw United Stat"' 19 beinl imparl9d Into Ille United Statu In ncb i11C?tt1ed quanHHH ••to be• Nbolantial e11ae of HriOUI injwy. ar tM Ihnat lheeaf. lo tho domestic indu1try prod111:la1 ea article like or directly ~tiliwe wllil tho imported article. ni. c-nu.aiaa will make ill dttermla.lli• in lbia lnveati9alion b' 1- 71. 1• f-1ect1on Zot(d)(Z) al the eel (lf U.SC. Wl(dJ(Z))).
Por further lafarmatiOD c:oactr0Jns Iha conduct of thla lnvestiptio11. beartna pn>CillflDft. end Nin of general applic:alioa. couult Iha CnmmiuiW1'1 RwH of l'tac:!fct end Procedure. Patt ZOii. Subpena A end B (19 CFll Part ZOSJ. aod Part :llJt. Subput. A dlniailii ! (lf CFR Put :mJ, IPnCTMI UTE 0-ber 'Z7, !!lllS.
- PUaTMU - .,_ COllTACT: Stephan v aa1aa1i 2llZ 52)--0?A oa-- al l.avutipliaoa. U.S. lnteniatioml Trade Cmn•i••la11.10l E Str.t. NW. W••hinatoL DC 2IK3& Heari:Da-impei.red illd!vidula an adviltd lbal lnfarmatloll aa. thia ""'liar C&ll be obtained by contaclioa rJie Cammiuioll'a TDD teraiDal"" lllZ-724-IDIZ. rnt-.liOD. mar alao be obl&iD.ed via eleclra~ mail bJ acr:naiq the Office oC lovutfaa!iou' ,_.,ta bW!etiA board 111W. for im-al c:ampute-a al :zm liZ3-0IOIL .... 'l'"rAll'I US M'YIG&
ParlieipoliM ill llw ~ r.raona nhillf to participata ia !be lnvntiaalillll u parliet - file IA talr)' or eppearaaca wilil tbe Stcatary to cM- <Ammiyiaa,. U pravidm ia 1 zm.n of die C?mmjeefaa•a nla (11 CFll Z17Llt). oat latar tbu IWCIJ-<iat (Zl) da19 eflar pllblicalioA ol tllia DDlil:e ill Ille F.i.nl ....... AAJ t1111J ol 1ppearan&:a !!lad &flu dlla dale wiD be reCernd to Ille CbainwomaA. wba will de!a'llline wulbu ID ecapl Iha !ale entry for aood caUH 1hoW11 hr die person de•irinl la me !he m117.
SerTit:tl Hsi. ----Pia aaeat Ill I ZOl.?t(d) of dw Canmdwtlon't nzla tu en 20U1(d}J. lb 5ec11>a1 will prwpme e aemce lilt contailllns tire names and addrft .. or aD p.,wam. at dleir 1ep1ewutattns. who aw partia ta tllia lnvuliplioo opllll die npirallaa of di. period for !Iliac enlriH al 1ppe1raDC11. In ecmrdance willl I Zlft.Ul(c) al die nzln (tt CF1t Zl7Lttl(c1J. •di clocoment filed lrJ • Pattr Ill Ille lnws!lplioa must be aerwed oa aD olller putia Ill the lnvu!lptiaa (11 ldailifttd bJ die nl'Ylce list). and a certtllcale al aerrlca muat eccompanr die doaunent. l1le Secn1117 will oat .....,1 a clac:ammt f.,, Oline without a cartificate al -ce.
H«1rin1.-Th1 ~ wiU boW In connection with thit invatlptio. begimlinf at tG:llD L& oa April 17, t• at the U.S. lntematianal Tl'ade Commi11io11 Buildin&. 70! ! S-NW. Wuhin11on. DC. 11eq,_18 ID appe~r al tht he.arillf lilouJd be llJed la Writinc with the Secretary IO the CommiaaiOA nol l•••r than tht cloae or buillesa (5:15 p.m.J Oil April .. i-. All~ dt1irin1 to appear at tht ........ IDd ,.i.. on.I ,.._iaao.. wldl the ucaptlon of public omctala •1111 Jl'lf'On&
not repreeentad by 00tm..J. thDald In. prehnnn, brief1 and ettnd • prebeariat conr.....,.10 be beld ., f!30 a.m. on April L ta. la IGO• 117 ol die U.S. lntaM!lanel Tnde C.onnnitlion BwldU.. Tiie deedli• far lllillf ~b·-· briefa • Aprit n. 1-Postheanns brim mut be wbmin" ...,. later than Iha clo• al balill- an April JI. I- Cmdldeallal mar.rial "-id be filed la acconl&nce witll Iha procadurw daaibad bet-.
hrtia.,. ~ID limit their te1ti.many at the ta.nq ID 1 noccml5deatlai ""7 ad analJSit ol matenal C011taimd iD pnbeari11s briefs ud ID ialanMlioa DOI nailable II the - the Jll'lhnrias briel -1ubmitted. /Vq wnttm _ _.. 1ubzm1ted at the bariq- be m.d ia KCDrdanca wi~ ti:• i*C t 11W d.....;beQ bUaw ud BJ ....mi.DIUlt ma'an.i. - be mbmitted al leul thtw (31 -rt.ma .,. prior Ill Ille be&linS l- '201.l(b}IZ} ol IM Commiuioa"a Nia (UI CFll 2Dl.llbJ1%))}
Putila ... ~led ID - Ille followina Wlila a( .......... wt.ea p~ dalA ad cMna .. bNfa. taUmaaJ. ad oat. , .. m;.,m. (1) Thouaada. mi11Mw• m billiou al pound& for qaD!ilin al appl• IZJ eaata pv _.d far prias of apple. wbelber lor freela marUt. or lor proc-ins: (31 tbo-0 + er milliona ol 111lcna al •inSle a&reaatla eq\livalml. lor 'IDUliliea or CDDCtDlnllA or lnsb jllicc ud l•l dollan ad calUa pu liqle tfNllltla galloa for pnc.. al jak& wbetb. concentrate of frfthly aqueaed. nae uniform uae of llllCb unita will make the data In all nbmiHioaa c:omparabla. Convert all concentrate to tiqla •lretlllli eqaivalmt ...... mil ..... Facton pabliobod la Nlnant )lllbltcatlon of the U.S. ~of Aptc:ultun.
Wriuirn mbmiuion&-IY mentioned. partiet la 11119 lnneticatlaa 11U1J Ille preheartns and poethearins brWI bf the dateo th- abooe. In ecldlli- UIJ' pe,,.,,. who bu llOI entencl • appearance• 1 party to Iha lnve11t9ation may 111bmi1 a wrtlla ata temeol of information ~ lo Iha aubject ol the lnvullptian an or before April Z4. 19811. A alpted orfgtnal and fourteen IHI copl• of each Nbmission mull be 61ed widt Ille Secnta17 to th• Commimiae la ..,..,..,_ wilh • 20lA of tht Comll\i9aian't nolea (II en 20U). All writtm .ubmiuiona naept lor conlidmlial buai._ dala will bao available far p!lbllc impectiaa d~ replar busineaa houn (8'45 LDL W'S:lS p.m.) In the Office of the SecrelUJ to the Com.mi11ioa..
Any bu1lnna lnfonnaHon for wltldl conlldenllal traatment la dw11Ncf alleU

A..S7
Federal Jtesbt• I Vol 51. No. 111 I Friday, January Z4. 191111 I Noticea
be 1ubmi1tecl aepantely. Tb• avelope and 1U pqn of aucb aubmiulona muat be cleorty libeled "Confidential Bu1ine11 lnfann1Uon. • ConfldenU1l 1ubmisaion1 and reque111 for coniideritial tre1tment must confonn · with th• requirem•nll of I 2111.1 of the Conuniuion'• ruin (11 CF1l 2171.1).
Remedy.-«i the event th1t the Commi11im1 makn an af!lnnatlve injllt)' dclarminatton in thia investt1at1on. remedy brief• will be due to tht Secretary no liter than th1 cloae of bu1inea1 on May za. 19811. and muat conform with the requirement• of I 2171.I of the Commi11ion'1 nilea. Partin are reminded that no M!l4nll heartnc oa the i11ue of remedy wiU be held. Thoae partiea wi1hin1 to pretent oral ar111ment1 on the laaue of remedy meJ do 10 at the heartns acheclulecl for April 17.19811.
Au-.,. Tiiie ln-ti,ed• I• beina conduelod ""de ta. autbcmlJ' of -- Jiii al Ille Trldo AC1 ol 117t. nu. oolim ii publiahod JIUIWUHI IO Melian 1111-10 al Ille Commiu111c,., n.leo (11 CFR :1111.10~
luuect , .... ,,. 17. 1-lr order of IM Com•i•tia&. k-L-S.CtWttuy.
(FR Doc. •uoo l'llocl 1-Doa 1:t11 ... 1 _.._ __
•
87

A-88
THE UNTEC STATES TAAOE AEPACSCNTATlVE . W~7QN IF'fU Of ll£ Of:.lilWt>WI
20toe ilSITC
It~? Dec~r 23, 1915 85 0(C27 P ~: 33
Th• Bonor~l• Paula Stern Chairvc:nu.n c.a.·+ntarnational Trade co .. i••ion 701 1·straat, a.w. Wa•h1n9ton, o.c. 2043'
Dear Kadaa Chairvoaan:
. Plu'•uant to ••etion 201 (b) (1) of tha Trade Act of 1974 (19 tJ. S. c:. 2251 (b) ( 1)), I requ••t that. the tJ. S. International Trad• c:o .. iaaion conduct. an invaat.iqation to dateraina whether apple juice provided for it•• 165.15 of th• Tariff Schedules of th• tJnited States i• bainf iaported in such incr••••d quantiti•• a• to be a •~•tantial cau•• of serious injury, or tha threat thereof, to th• do•••tic industry producin; a lik• or directly coapatitiva. article. .
I look forward t.o racaivin; t.ha c:oaai•aion'• report..
88

A..89
CALENDAR OF PUBLIC HEARING
Those listed below appeared as witnesses at the United States International, Trade Cor.mission's hearing on:
Subject
Inv. No.
Date and time
Apple Juice
TA-201-59
April 17, 1986 - 10:00 a.m.
Sessions were held in connection with this investigation fn the Hearing Room of the United States International Trade Conmission, 701 E Street, N.W., in Washington.
Congressional appearances:
Honorable Guy Vander Jagt, United States Representative, State of Michigan
Honorable Willfam Goodling, United States Representative, State of Pennsyl van fa
Donald Upson, Executive Assistant, on behalf of: Honorable Frank Horton, United States Representative, State of New York
Joe Jessup, Administrative Assistant, on behalf of: Honorable 0. French Slaughter, State of Virginia
Governnent appearance:
Federal Trade Collll!ission, Bureau of Competition, Washington, O.C.
Benjamin Cohn, Attorney
Lorenzo Brown, Economist
In support of the petition:
Skadden, Arps, Slate, Meagher & Flom--Counsel Washington, O.C.
on behalf of
The American Fann Bureau Federation California Fann Bureau Federation Colorado Fann Bureau Connecticut Fann Bureau Association, Inc.
- more -89

A-90
- 2 -
Skadden, Arps, Slate, Meagher & Flom--Counsel
Delaware Fann Bureau, Inc. Georgia Fann Bureau Federation Illinois Agricultural Association Iowa Fann Bureau Federation Kansas Farm Bureau (entucky Farm Bureau Federation Maine Farm Bureau Association Maryland Farm Bureau, Inc. Michigan Farm Bureau Missouri Fann &.lreau Federation New Hampshire Farm Bureau Federation New Jersey Farm Bureau New Mexico Farm & Livestock Bureau New York Farm Bureau, Inc. North Carolina Farm Bureau Federation Ohio Farm Bureau Federation, Inc. Oregon Farm Bureau Federation, Inc. Pennsylvania Farmers Association Tennessee Fann Bureau Federation, Inc. South Carolina Farm Bureau Utah Farm Bureau Federation Vermont Farm Bureau, Inc. Virginia Farm Bureau Federation, Inc. Washington State Farm Bureau Wisconsin Farm Bureau Federation
Kenneth L. Nye, Director, Horticulture Department, American Farm Bureau Federation
Thomas C. Butler, Manager, Michigan Processing Apple Growers Coordinator, American Agricultural Marketing Association
APPLE GROWERS
Paul Baker, Ransomville, New York
Bill Flippin, Tyro, Virginia
Jerry Sietsema, Grand Rapids, Michigan
Doug Zahn, Methow, Washington
- more -90

A-91
- 3 -
Skadden, Arps, Slate, Meagher & Flom (continued)
APPLE PROCESSORS AND CONCENTRATORS
Dean carey, Knouse Foods
Peter Morrison, Morrison's, Inc.
Sam Reid, '°"rray's Cider Company, Inc.
Stacey Wood, formerly of Albion Cooperative, Inc.
AGRICULTURAL ECONJMISTS
Professor Desmond 0' Rourke, Wash1 ngton State University
Professor Donald Ricks, Michigan State University
In opposition to the petition:
Harris & aerg--Counse 1 Washington, O.C.
on behalf of
Thomas R. Graham Shirley A. Coffield William J. Guzick William P. Ingram
The Apple Juice Group of the Association of Food Industries
Dr. Max Brunk, Consultant, ProT'essor Emeritus of Cornell University
Frank Armstrong, III, Chairman and President of National Fruit Product Company, Inc.
Jack B. t¥rtog, Jr., President, Hartog Foods International, Inc.
) ) )--OF COUNSEL )
Norman Oppenheimer, ~resident, Camerican, Inc.
Robert Ward, Consultant
Herbert E. Harris II))·-OF COUNSEL Cheryl Ellsworth 91
- more -

Arnold & Porter--Counsel Washington, D.C.
on behalf of
A-92
- 4 -
Mangal Upper Galilee Juice Ltd.
Yaakof Gali, Managing Director, Galilee Development Company Ltd.
,
Patrick F.J. Macrory) OF COUNS-L Moshe Goldberg i·· c.
New England Apple Products Co., Inc,, Littleton, Massachusetts
David F. Rowse, President
German Fruit Juice Association Bonn, Gennany
Wernder Gneiting, CMA New York
capital Legal. Foundation, Washington, O.C. and
Competitive Enterprise Institute, Washington, O.C.
James Moody, Esq.
Fred Smith
92

A-93
APPENDIX B
EXCERPTS FROM THE TARIFF SCHEDULES OF THE UNITED STATES ANNOTATED (1986), SCHEDULE 1, PART 12, SUBPART A
93

St.at ittlil Sol·
!1.z
.
A-94
TARIFF SCHEDULES 01' THE UNlTED n'ATES ANNOTATED ( 199~
SC!l!llDU 1 , • AllIHAI. AlfD V!C!TAIIZ PlODOi:n Par~ 12. - Sev•raa••
ouu Aft1cUe of
Quacicy 1
PilT 12. • l!V!IAG!S
Part 12 lleldaoc••:
1. ?!Ii• pcrc conn •11 pniiloct• tibicb _.. fie to-rue a beftr .... or tor -....r ... parpaMe.
2 • nte •tmd.nl fn cl.ten:i.•iq tile proof of 1n.-., .... ocber ''irit• OT litiaon of ..,. ki .. -.. i9'0ft, .. i• tbe .... •• thee 1llllicll la d•fi..-1 la ctt. 1 ... nlciq to i11c•nal r ....... ?be S.Cnc_,. of tbe Tl'e.-ry, ia bi• diacnti•, uy -.cllori• tbe .. cnt•i- of tbe ,.roof of"'••· cerdial1, or ac:ber li~n .- fnit J•icee ltf 4iacilleci• • «.taerri••· .._, it la bilrreccicmltl• to acenaia ._. proof ~ tlM .... Pl'••cri1*1 '7 aiac 1-.: l• • rqul.ti011a.
J. fte 411C iae Pl"ffCl'i-.. • ~-ta C ..... ~ tbia p.n _.. la .Uiti• co tile inenal cc -,_, i.,o.- .-er aieci .. 1• n .., ad~ M:C., tlM 1111.cia'·~- .. lll'ohc:CI -e"""4 '7 tllis ,..C •idl .. edj•C alM CO inera.l tcsew c ... _. m,o. .. •lf • tH ~iti• ••Jecc co nidl. c-•• ac.,c cue, ia c..,. , ... et •tecill .. ••tries tr•efel"'nll co th .._.. .. pr.m ... of e lllliecilleil -.irit• pl..C _,_ tile ,....,i•t. ... of ..eti• SUZ of tlM tac ..... 1 ......_ eo.I• of ltS4, tlM •.ct .. .,. iapNeill .. tlM Cl•ftCitJ wi.CW'C'.- tr. cut.- ... ,...,.
•• 'h'ori•i-. for tlM !Tee .. '7 of cert•i• •~l•• of alc•olt.c -... ...... .,. c...,... ~ pat S of sclte4.l• I.
Subpan A. • F'nl1 t Jtilcea
, .. !!!! ' ......... :
1. !be pt'Olhlet• •••cri'*I b tbt.• M,,.c: .,. CIW9.,... bont.a wb.cbff or· eiK c•&•iaiq dllJL alcMol. lNt _, ••ell pt"Oll•&• 1111r.idl _. •IN ... 1cri._. ia aidlpert. C ot' D of tlai• ~ ..-. el .. al• ff.dle t.a ••t.4 nb,at C or D.
z. Joi' tbo ,_,..., of tlai• nlllpat, •c ... ..-tr•&Oll jaice .., be i• llC1•i4, ,...__., or .. 1u , ....
laCU of Du.CJ
·-w.
p ... 1·79
1·12•A
z
94

Pace 1 -80
1 • 12 • A 1~~-1 "i . , . ,_
1'5.15
16'.U
Stat kt• !lz
.. 20 ...
165.27 00
115.n oo
A-95
TAIUJ'J' SCHEDULES OJ' THE UNITED STATES ANNOTATED (1986)
SCH!DULI 1 • • Alll!W. AND O!G?TABU: Part 12. • !everas••
••• ..u..i..
J. '°" th ,_.~au of thi• .W.pan: -(a) Cb• CC'WI "••lloo.• .1.• tb.• "lAic .. of hey•
col- ttf tb• pt'O'f'1.•10aa .q11pl.1.caltla co fnait juc• .-.. 1alloa of a.cud .-co.aacrac .. jUc• or 1alloe of recCMYticuc .. juca;
(\) th c-. ~ec-..citYt• j11ica• ... th prMa:C wtl1dl c• It• a9C&Ulllll by U.Z.1.Q& tb.e i.aoon.ed: co-..-:race wi.U. wacc ua •ocb- "'°'°rt.i.oa cb.at tb• l'l'Clliact will b..W• a Iris. valWI ~11&1 to that foUDll by cbe Screcary of the tr .. _.,. tram c1.a1e co ti.a
to ff th• avuac• lru w&J.,,a of ll.lr.a ucural 1111C.cecratM juic• La tbe cr.U ... c-.rca of UI• Ouc• sec•; ad
(c) tile taw '"1ria •aloe" .. _. cba rah'acc...cric •cro•• •aJ.IM of c.11.a j11ice, •j~c• to c-.-u.• for ell.a affect of .., •4• "41•.nas -cuiala, ... tb.uufcar correct• for acid.
4. ta detanli.lliat tba .-cr of aallo• of r-.a.acicuc .. ~it jUc• vbidl ca ba •en.a .. &• a coac•crac:a. tlaa il-ar .. of cmcncrac&.o. •la.all •• calc•l•t .. n • wol.- b•U co tb.a uc•c O.S ,._, .. , ea 4ecenU.a• "1 tlM ruia of c.11.a lrt.a wal .. of dla ~- coacaacru• j•ic• co tb.U of tllla recoaacit•t• j•ica. COftacc• for 4iffuaar::• of tpeific sr41rity of clNi jaic•· Aaf j'Dica Uri• • ,._ .. of ca.cam:racW of ln• t~ 1.5 (u du.-... llefore correct io9 to tit.• .._., 0_.5 4-.rM) d&ll M r._.. .. u • ucual .. aim:.acrac• Jaica.
S. la 4.c.m.a.Uc ct.a 4&11'• of cmcacracioe of .U.. tr.ic Jlli.c• Cit• 16S.65), tllo aU:cva •M.11 k c_i.d._. .. u baill& wllolly of tit.a c~omc jaice ~ tit.• l09eat lria wal•.
Sua.P!!"C 4 lta&iatical b ... 90CI!
1. ror tit.a purpoe• of •t•tiatical report:J..111 i.a tlllU ••,.c, cbe cen "a•lj"" i.a ch "hit• of 0...cuy" col- --. 1alloa o 111taral 11DCoac..r.r1c• JU.ca • a•llo• of recoutit•t• jUca Cu 4efi.a• i• be.-OC• 3(,) *-•>.
Pn.:it Jvic•, iaclll4iq mi.a .. fruit juic•, co.c.-.r•c• or DOC coacncrac•, ••bar or DOC ........ !
!>Uta •f
<).aaClty
PRODUCTS
la~ of Diiey
l Special. 2
lot .ur: .. ad DOC coutiai.ac owe l.O ,_c .. of acbyl a.lcobol by ,.1_:
~·ft,.. ................................ . Clal ••••• rr .. !/ .5c ,_ 111. !I CitTU tr.it:
w.o ....••..•••...•..•••....•..•••.•.•••. lOc pc 1&1. !/ 'free (I) !/ 70c ,_ 1a.l. !f
lloc coac.crac•. •• •• •• • ••• •• • • •• • • • kl. Coac.-l'ac• •••••••••• •·•• •• •• •• •••• o.i •
0r-.e1 lloc co.ceacr•c• _. ooc .... fT• a j-.ice bft'\q a 4qr• of cmc.cracioo of 1.5 or -r• (u dac .... ma• be for• corr Kc ioa co tbe oe•-
le ,... ••1.(1)!/
•C 0.5 dqr .. ) •••••••• •••••••• ••••• c:.l. •• •• 20c pa aal. lf h• (I) !/
Otbs •••••••• ••••••••••••••••••·•••. Q.al. •••• lJc ,.r 1al. !/ h• (I)!/
I
, .. - 1"1. ll
70e - 1"1. !/
!/ lapof'ca .-u cbi.a le•.., •• 1ullject co , .. ar&l bcit• Ta (16 11.1.c. SOOl .., 5041) u foll .... : .&.) If coacaioi .. diacill .. ''irica. at• of 112.SO per proof 1alloa _.a pro,.niouca ta ac t ... ,.l.,Lko r••
• a.11 tracci.a .. l ,.rii:a of a ,..oof 1alloe. ~!J I) tf coecai.01111 wiae, a ta. of --
1) 17c il'ft' riaa 1alloo • 1cill irio.• couai•1• eoc •ra c11i .. l•i of 1lcobol ' ' wrol-; 1) 61c ,_ wi.M 1&J.lo• ••till •i.•• C09C&1.•1.• •r• tb• 141 ... MC ace•h .. 21i of deolllel '7' wl-t ]) 12.ZS ,_ •i•• 1alln • •till wio• cosc&i•.1.• •r• tb• 111 ... ...c •c• .. i .. 142 of alceM>l ~ wl-• 4) 13.40 ,_ wi•• 1all09 • di.....-• _. ocher •JoUkli• •••• * S) 12 .... ,_ wi•• 1all• • cc1ficially cedouc .. wi••·

96
A-97
APPENDIX C
CERTAIN APPLE GROWERS' COMMENTS ON THEIR OPERATIONS THAT WERE SUPPLIED VOLUNTARILY WITH THE RETURN OF THE COMMISSION QUESTIONNAIRE
97

A-98
* * * * * * *
98

A-99
APPENDIX D
STATISTICAL TABLES
99

A-100
Table D-1.--Apple or pear juice: U.S. imports for consumption, by principal sources and quarters, crop year 1980/81
Source
Argentina-----------: South Africa--------: West Germany--------: Netherlands---------: France--------------: Spain---------------: Chile---------------: New Zealand---------: Canada--------------: Israel--------------: Switzerland---------: All other-----------:
Total-----------:
Argentina-----------: South Africa--------: West Germany--------: Netherlands---------: France--------------: Spain---------------: Chile---------------: New Zealand---------: Canada--------------: Israel--------------: Switzerland---------: All other-----------:
Total-----------:
Argentina-----------: South Africa--------: West Germany--------: Netherlands---------: France--------------: Spain---------------: Chile---------------: New Zealand---------: Canada--------------: Israel--------------: Switzerland---------: All other-----------:
Av~rage---------:
JulySept.
5,105 l,852
295 0
348 129 143
21 53
272 447
1,058 9,723
5,284 1,918
3S7
339 136 ll7
20 65
190 307 888
9,621
$1.04 1.04 1.21
.97 1.06
.82
.94 1.23
.70
.69
.84
.99
Source: Compiled from official
Oct.Dec.
Jan. -March
Quantity (l,000
8, 738 ll,4ll 4,039 3,041
159 251 398 509 259 74 193 365 186 5ll 375 268 10 363
159 515 160 195 196 1,109
14,872 18,612
Value (1,000
6,195 7,372 2,645 2,234
163 142 287 36S 32S 352 303 318 122 278 2S2 148
24 277 87 375
1S8 108 136 S81
10,697 12,SSO
AprilJune
gallons)
13. 725 3,264 2,957 1,674
525 1,081
847 842 574 314
0 1,314
27,ll7
dollars)
9,464 2,750 2,169 1,262
473 712 Sl7 S8S S02 198
768 19,400
Unit value (per gallon)
$0.71 $0.65 $0.69 .6S .73 .84
1.03 .S6 .73 . 72 .72 .7S
l.2S 4.78 . 90 1. S7 .87 .66
.66 .S4 .61
.67 .S5 .69 2.44 .76 .87
.SS .73 .63
.99 .56
.69 .S2 .S8
. 72 .67 .72
statistics of the U.S. Department
Crop year total
38,979 12,196
3,662 2,582 1,206 1,769 1,688 1,506 1,000 1,260
802 3,675
70,325
28,316 9,547 2,830 1,913 1,490 1,469 1,034 l,OOS
869 8SO S74
2,370 S2,267
$0.73 .78 . 77 . 74
1.24 .83 .61 .67 .87 .67 .72 .64
10074
of Commerce.

A-101
Table D-2.--Apple or pear juice: U.S. imports for consumption, by principal sources and quarters, crop year 1981/82
Source
Argentina-----------: South Africa--------: Spain---------------: West Germany--------: Mexico--------------: Netherlands---------: New Zealand---------: Israel--------------: Chile---------------: Canada--------------: All other-----------:
Total-----------:
Argentina-----------: South Africa--------: Spain---------------: West Germany--------: Mexico--------------: Netherlands---------: New Zealand---------.: Israel--------------: Chile---------------: Canada--------------: All other-----------:
Total-----------:
Argentina-----------: South Africa--------: Spain---------------: West Germany--------: Mexico--------------: Netherlands---------: New Zealand---------: Israel--------------: Chile---------------: Canada--------------: All other-----------:
Average---------:
JulySept.
ll, 7ll 3,574
418 1,966
450 100 422 490 736 230
1,819 21,916
7,546 2,453
359 1,577
527 82
315 354 641 273
1,378 15,505
$0.64 .69 .86 .80
1.17 . 81 .75 .72 .87
1.18 .76 . 71
, .
Source: Compiled from official
Oct.Dec.
Jan. -March
Quantity, (1,000
'3, 723 2,291 2,141 1,805 1,433 3,547 1,527 l, 774 1,913 452
673 l,082 1,080 1,621
556 1,145 57 6
251 239 603 1,658
13,957 15,620
Value (l,000
2,843 2,027 1,675 1,246 1,523 3,198 1,261 1,,474 2,260 416
801 1,076 998 1,147 534 1,095
72 5 344 394 461 1 385
12. 772 13,463
AprilJune
gallons)
14,441 2' 454.
976 917
1,954 1,765
489 452 629 274 597
24,948
dollars)
12,620 2,201 1,014
891 1,768 1,636
563 501 700 397 372
22,663
Unit value (per gallon)
$0.76 $0.88 $0.87 .78 .69 .90
1.06 .90 1.04 .82 .83 .97
1.18 .92 .90 1.19 .99 .93
.92 . 71 1.15
.96 .96 l.ll 1.25 .83 l.ll 1.37 1.64 1.45
.76 .84 .62
.92 .86 .91
statistics of the U.S. Department
Crop year total
32,166 9. 973 6,375 6 ,184 4,768 3,620 3,613 2,643 1,428
994 4,677
76,441
25,037 7,575 6,095 5,202 4,972 3,595 3,023 2,485 1,417 1,407 3,595
64,403
$0.78 .76 .96 .84
1.04 .99 .84 .94 .99
1.42 . 77 .84
of Commerce.
101

A-102
Table D-3.--Apple or pear juice: U.S. imports for consumption, by principal sources and quarters, crop year 1982/83
Source
Argentina-----------: West Germany--------: South Africa--------: Austria-------------: Spain---------------: Netherlands---------: France--------------: Switzerland---------: Chile---------------: Canada--------------: Israel--------------· All other-----------:
Total-----------:
Argentina-----------: West Germany--------: South Africa--------: Austria-------------: Spain---------------: Netherlands---------: France--------------: Switzerland---------: Chile---------------: Canada--------------: Israel--------------: All other-----------:
Total-----------:
Argentina-----------: West Germany--------: South Africa--------: Austria-------------: Spain---------------: Netherlands---------: France--------------: Switzerland---------: Chile---------------: Canada--------------: Israel--------------: All other-----------:
Average---------:
JulySept.
16,128 3,710 4,307
303 574
3,200 4 0
695 lll 147
1,362 ~0,541
14,487 2,650 3,720
407 332
l,893 9
1,062 207 ll8
1,520 26,405
$0.90 . 71 .86
1.34 .58 .59
2.16
1.53 1.86
.80 1.12
.86
Source: Compiled from official
Oct. -Dec.
Jan. -March
Quantity (l,000
9,086 2,065 7,867 14,093 2,340 1,498 2,972 3,520 2,842 2,935 1,975 2,194 1,944 5,275
202 1,857 294 5 699 378 471 241
1,958 3,069 32,650 37,130
Value (1,000
7,117 1,376 7,503 10,935 1,981 1,099 2,665 2,754 2,873 2,295 1,808 1,750 2,310 3,105
109 1,363 316 7 749 456 431 164
1,941 2,946 29,803 28,248
AprilJune
gallons)
10,902 9,354 2,183 3,543 l,9ll 1,785
395 3,898 1,078
391 314
3,754 39,508
dollars)
7,409 6,762 1,914 2,828 1,524 1,542
191 2,725
809 516 299
3,064 29,583
Unit value (per gallon)
$0.78 $0.67 $0.68 .95 .78 .72 .85 . 73 .88 .90 .78 .80
1.01 .78 .80 .92 .80 .86
1.19 .59 .48 .54 .73 . 70
1.08 1.36 .75 1.07 1.21 1. 32
.91 .68 .95
.99 .96 .82
.91 .76 .75
statistics of the U.S. Department
Crop year total
38,180 35,025 10,328 10,339
8,261 9,154 7,618 5,957 2,072 1,579 l,173
10,141 139,827
30,389 27,849 8, 714 8,653 7,024 6,991 5,615 4,196 2,194 1,928 1,013 9,473
114,040
$0.80 .80 .84 .84 .85 .76 .74 .70
1.06 1.22
.86
.93
10:!2
of Commerce.

A-103
Table D-4.--Apple or pear juice: U.S. imports for consumption, by principal sources and quarters, crop year 1983/84
Source
West Germany--------: Argentina-----------: Austria-------------: Spain---------------: Netherlands---------: South Africa--------: Chile---------------: Canada--------------: Hungary-------------: Turkey--------------: Israel--------------: Switzerland---------: All other-----------:
Total-----------:
West Germany--------: Argentina-----------: Austria-------------: Spain---------------: Netherlands---------: South Africa--------: Chile---------------: Canada--------------: Hungary-------------: Turkey-------------c: Israel--------------: Switzerland---------: All other-----------:
Total-----------:
West Germany--------: Argentina-----------: Austria-------------: Spain---------------: Netherlands---------: South Africa--------: Chile---------------: Canada--------------: Hungary-------------: Turkey--------------: Israel--------------: Switzerland---------: All other-----------:
Average---------:
JulySept.
6,320 14,232
2,870 359
1,794 3,516 2,364
338 195 358 450
l/ l,279
34,075
4,619 9,799 2,174
356 1,480 2,804 1,787
480 161 689 388
1 1,037
25. 775
$0.73 .69 .76 .99 .83 .80 .76
1.42 .83
1. 93 .86
1.89 .81 .76
l/ Less than 500 gallons.
Source: Compiled from official
Oct.Dec.
Jan. -March
Quantity (l,000
9,966 10,858 9,622 6,121 3,402 3,975 3,354 5,932 2, 910 3,181 3,234 2,425 1,026 80
819 850 605 1,444 341 1,263 660 354
46 0 2,598 5,089
38,583 41,572
Value (l,000
7,336 8,108 6,355 3,940 2,567 3,405 2,880 4,050 2,432 3,691 2,178 1,408
650 87 803 933 347 1,586 209 793 440 317
38 2,214 3,301
28,449 31,619
AprilJune
gallons)
7,658 6,255 3. 714 2,974 1,442 2,100
768 574 616
1,060 158 376
3,250 30,945
dollars)
6,381 3,667 4,008 2,260 1,649 1,800
563 606 670 675 136 223
2,357 24,995
Unit value (per gallon)
$0.74 $0.75 $0.83 .66 .64 .59 .75 .86 1.08 .86 .68 .76 .84 1.16 1.14 .67 .58 .86 .63 1.09 .73 .98 1.10 1.06 .57 1.10 1.09 .61 .63 .64 .67 .89 .86 .83 .59 .85 .65 .73 . 74 .76 .81
statistics of the U.S. Department
Crop year total
34,802 36,230 13,962 12,620
9,327 ll,275
4,237 2,581 2,860 3,022 l,623
422 12,214
145 ,175
26,443 23,761 12,154
9,547 9,253 8,189 3,086 2,823 2,763 2,366 1,281
262 8,9ll
110,839
$0.76 .66 .87 .76 .99 .73 .73
1.09 .97 .78 .79 .62 .73 .76
of Commerce.

A-104
Table D-5.--Apple or pear juice: U.S. imports for consumption, by principal sources and quarters, crop year 1984/85
Source JulySept.
Oct.Dec.
Jan.March
AprilJune
Quantity (1,000 gallons)
Crop year total
West Germany--------: 9,008 7,806 16,899 16,022 49,736 Argentina-----------: 18,196 16,542 7,194 9,753 51,685 Austria-------------: 5,972 3,941 7,830 6,142 23,884 Netherlands---------: 3,016 3,838 5,367 4,973 17,195 Spain---------------: 2,865 3,364 4,984 5,388 16,601 South Africa--------: 2,820 5,192 2,174 4,765 14,952 Hungary-------------: 0 878 2,288 2,964 6,131 Chile---------------: 2,360 1,163 389 2,105 6,017 France--------------: 56 461 987 1,478 2,982 Switzerland---------: 901 1,644 183 1,026 3,754 Israel--------------: 74 172 661 695 1,601 All other-----------:~~2~·~0~3~9--=-~---"3~·~03~5'---'~~3~·~9~7~4---'-~---=5~,~6~0~4-=-~~~~1~4~,~6::..=.50
Total-----------: 47,307 48,036 52,930 60,915 209,188 ~~~~~~~~~~~---'-~-'-'--~~~~~'----~~---'-~~~
Value (l,000 dollars)
West Germany--------: 6,847 5,683 12,230 9,635 34,395 Argentina-----------: 11,566 9,446 4,166 5,507 30,686 Austria-------------: 4,364 3,112 5,425 4,506 17,407 Netherlands---------: 2,998 2,989 3,682 3,873 13,541 Spain---------------: 1,927 2,807 3,288 3,500 11,522 South Africa--------: 1,920 3,168 1,346 2,847 9,281 Hungary-------------: 342 2, 726 1,643 4, 711 Chile---------------: 1,813 674 221 1,049 3,757 France--------------: ll2 341 677 1,033 2,163 Switzerland---------: 643 798 95 451 l,986 Israel--------------: 175 190 393 393 1,152 All other-----------: 1,873 1,873 2,730 3,222 9,698
~-,-_..,,-,,-'~~-,.~~'---'~-:--=-'-"'"-=-"--'---:-~=.=.=--'--~~-:---=-"'-'-'~
Total-----------:~-3~4~·=2~3~8--=-~~3=1~,4~2~3'---'~--=-36~·~9~7~9---'-~~3~7~·~6~5~9-=-~~--'1~4~0~,=2~99
Unit value (per gallon)
West Germany--------: $0. 76 $0. 73 $0.72 $0.60 $0.69 Argentina-----------: .64 .57 .58 .56 .59 Austria-------------: .73 .79 .69 .73 .73 Netherlands---------: .99 .78 .69 .78 .79 Spain---------------: .67 .83 .66 .65 .69 South Africa--------: .68 .61 .62 .60 .62 Hungary-------------: .39 1.19 .55 . 77 Chile---------------: . 77 .58 .57 .50 .62 France--------------: 1.98 . 74 .69 . 70 . 73 Switzerland---------: . 71 .49 .52 .44 .53 Israel--------------: 2.37 l.ll .59 .57 . 72 All other-----------: .92 .62 .69 .57 .66
~~~~:--'~~~'-7"--'--~~-'-'-"'--'--~~~7-'--~~~~---'-~
Average---------: .72 .65 .70 .62 .6104
Source: Compiled from official statistics of the U.S. Department of Commerce.
•

A-105
Table D-6.--0ther fruit juices, including apple juice: !./U.S. exports of domestic merchandise, by markets, crop years 1980/81 to 1984/85
Market :1980/81 1981/82 : 1982/83 : 1983/84 1984/85
Quantity (1,000 gallons)
Canada----------------------: 6,924 7,806 8,334 8,661 6,521 Japan-----------------------: 966 1,076 1,315 1,571 2,889 Saudi Arabia----------------: 1,160 2,480 3,324 2,560 2,659 United Arab Emirates-··------: 566 1,376 1,330 1,347 1,694 Bahamas---------------------: 1,611 722 929 804 1,558 Panama----------------------: 666 501 478 427 582 Netherlands Antilles--------: 1,865 1,238 1,122 851 643 Leeward and Windward Isles--: 1,265 1,270 1,259 1,162 1,116 Hong Kong-------------------: 321 365 190 165 495 Singapore-------------------: 229 372 429 271 457 Israel----------------------: 121 178 47 89 52 All other-------------------: 8,095 7,633 6,169 6,866 4,716
Total-------------------:-=--23~.~7~8~9-'---,2~5~,~071~7~~~2~4~,9~2~6---'~724~,7~7~4-'-~--,2~3i,~38"72
Value (1,000 dollars)
Canada----------------------: 6,520 7,088 7,471 7,549 6,988 Japan-----------------------: 2,223 2,802 3,065 3,212 5,581 Saudi Arabia----------------: 1,635 3,055 3,829 3,006 2,232 United Arab Emirates--------: 696 1,355 1,067 1,350 1,819 Bahamas---------------------: 1,650 1,341 1,623 1,750 1,639 Panama----------------------: 1,295 1,196 1,097 1,207 1,231 Netherlands Antilles--------: 1,990 1,908 1,850 1,522 1,211 Leeward and Windward Isles--: 1,191 1,176 1,079 1,298 1,170 Hong Kong-------------------: 936 675 421 395 802 Singapore-------------------: 457 525 670 482 532 Israel----------------------: 168 251 91 78 34 All other-------------------:_1~3~·~3=1~7-'----'1~0~·~9~5~7--'--~-=-8~,7~1~1=----'~-9'-'-',7~9=3___,_~~=6i•~3"'-"30
Total-------------------: 32,078 32,329 30,974 31,642 29,569 ~~~~~~~~~~~~~~~~~~~~~~~
Unit value (per gallon)
Canada----------------------: $0.94 $0.91 $0.90 $0.87 $1.07 Japan-----------------------: 2.30 2.61 2.33 2.05 1.93 Saudi Arabia----------------: 1.41 1.23 1.15 1.17 .84 United Arab Emirates--------: 1.23 .99 .80 1.00 1.07 Bahamas---------------------: 1.02 1.86 1.75 2.18 1.05 Panama----------------------: 1.95 2.39 2.30 2.83 2.11 Netherlands Antilles- - - - - - - - : 1. 07 1. 54 1. 65 1. 79 1. 88 Leeward and Windward Isles--: .94 .93 .86 1.12 1.05 Hong Kong-------------------: 2.91 1.85 2.22 2.39 1.62 Singapore-------------------: 2.00 1.41 1.56 1.78 1.17 Israel----------------------: 1.39 1.41 1.95 .87 .66 All other-------------------: 1.65 1.44 1.41 1.43 1.34
~~~~~~~~~~~~~~~~~~~~~~~
Average-----------------: 1.35 1.29 1.24 1.28 1.26
!./ Nonenumerated fruit juices under schedule B Nos. 165.26, 165.60, and lill'5.88.
Source: Compiled from official statistics of the U.S. Department of Commerce.

,
106