applicability of emission-based attenuation map for rapid
TRANSCRIPT
Maeda et al. EJNMMI Physics (2015) 2:12 DOI 10.1186/s40658-015-0115-2
ORIGINAL RESEARCH Open Access
Applicability of emission-based attenuation mapfor rapid CBF, OEF, and CMRO2 measurementsusing gaseous 15O-labeled compoundsYukito Maeda1,2*, Nobuyuki Kudomi3, Yasuhiro Sasakawa2, Toshihide Monden2, Koji Kato2, Yuka Yamamoto4,Nobuyuki Kawai5 and Yoshihiro Nishiyama4
* Correspondence:[email protected] of Social andEnvironmental Medicine, GraduateSchool of Medicine, KagawaUniversity, 1750-1 Ikenobe, Miki-cho,Kita-gun, Kagawa 761-0793, Japan2Department of Clinical Radiology,Kagawa University Hospital, Kagawa761-0793, JapanFull list of author information isavailable at the end of the article
©Am
Abstract
Background: Cerebral blood flow (CBF), oxygen extraction fraction (OEF), and cerebralmetabolic rate of oxygen (CMRO2) images have facilitated understanding of thepathophysiological basis of cerebrovascular disorders. Such parametric images can berapidly, measured within around 15 min, using positron emission tomography (PET) withsequentially administered 15O-labeled oxygen and water. For further shortening, oneoption is to eliminate the transmission scan by applying an emission-based attenuationcorrection.
Methods: The validity of the present method was tested by comparing parametricvalues with emission-based attenuation correction to those with transmission-basedcorrection. This was applied to 27 subjects who were diagnosed with or withoutcerebrovascular disorders. All subjects received the rapid CBF/OEF/CMRO2 PETmeasurements. An emission-based attenuation map was generated by estimatingthe edge of the brain tissue contour on an obtained sinogram and by assuming theuniform tissue coefficient to be 0.1 cm−1. Then images were reconstructed, andparametric images were computed.
Results: No difference was apparent between the emission- and transmission-basedmethods. Paired t-test showed no significant differences in CBF, OEF, or CMRO2 valuesbetween the emission- and transmission-based methods, except in the parietal andoccipital and cerebellum and occipital regions, and the differences were less than 10%.The regression analysis showed a close correlation of r = 0.89 to 0.99.
Conclusions: The present study revealed that the attenuation correction can beperformed by the emission-based estimation method and clinical PET duration can beshortened for the CBF, OEF, and CMRO2 gas study.
Keywords: Shortening PET examination; CBF; OEF; CMRO2
BackgroundCerebral blood flow (CBF), oxygen extraction fraction (OEF), and cerebral metabolic
rate of oxygen (CMRO2) images have facilitated the understanding of the pathophysio-
logical basis of cerebrovascular disorders. These images have been quantitatively mea-
sured using positron emission tomography (PET) with bolus administrations of
gaseous 15O-labeled oxygen (15O2), carbon dioxide (C15O2) or water (H215O), and car-
bon monoxide (C15O), in the conventional three-step method [1-3]. These parametric
2015 Maeda et al.; licensee Springer. This is an Open Access article distributed under the terms of the Creative Commonsttribution License (http://creativecommons.org/licenses/by/4.0), which permits unrestricted use, distribution, and reproduction in anyedium, provided the original work is properly credited.
Maeda et al. EJNMMI Physics (2015) 2:12 Page 2 of 12
images have been measured with separate emission scans for three tracers of C15O for
cerebral blood volume (CBV), C15O2 for CBF, and 15O2 for CMRO2, with additional
waiting times set between the scans in order to avoid contamination from the previous
tracer on the PET data, requiring a relatively long duration of around 1 h.
Recently, the duration for measuring CBF, OEF, and CMRO2 has been shortened by
using dual-tracer autoradiography (DARG) and, further, by applying dual-tracer basis
function methods (DBFM) [4,5]. Both of these methods are characterized by sequential
administration of dual tracers of 15O2 and C15O2 typically with a 3-min interval during
a single PET scan. The DBFM method can shorten the total examination period to
approximately 15 min while maintaining the image quality and quantitative accuracy
[5]. In order to shorten the examination period even more, alternatives are to shorten
the transmission (or a CT-based) scan [6] which is applied for the attenuation correc-
tion or to eliminate the transmission scan. For attenuation correction without the use
of the transmission scan data, an emission-based attenuation map becomes necessary.
In this study, we estimated the attenuation map from measured emission scan data,
namely, sequentially administered gaseous 15O2 and CO2 scan data. The feasibility of
this method was tested by comparing the regional values of CBF, OEF, and CMRO2 ob-
tained against those with attenuation maps from transmission scans in subjects with or
without cerebrovascular disorders.
MethodsSubjects
The subjects were retrospectively selected from a clinical database in our hospital. All
of them received PET examination due to suspected cerebrovascular disorders between
February 2010 and June 2013. According to Powers’ classification of chronic
hemodynamics compromised by occlusive cerebrovascular disease [7], hemodynamic
impairment can be categorized into two stages. Stage I is defined as an increase in CBV
in the hemisphere distal to the occlusive lesion, with normal CBF, OEF, and CMRO2.
Stage II is characterized by reduced CBF and increased OEF with normal CMRO2. On
the basis of this classification, we separated the subjects into the following three groups:
Group-0 consisted of subjects diagnosed as being without significant disorder from
PET parametric images, namely, without any apparent differences in the arterial terri-
tories between hemispheres in CBV, CBF, OEF, or CMRO2 images (n = 10, 10 males,
weight = 64.3 ± 7.4 kg, age = 63.5 ± 11.2 years). Group-1 consisted of patients diagnosed
with chronic stenosis or occlusion with elevated CBV (n = 6, 5 males and 1 female,
weight = 65.4 ± 13.1 kg, age = 63.1 ± 14.5 years). Group-2 consisted of patients diag-
nosed with chronic stenosis or occlusion with reduced CBF, elevated OEF (n = 10, 6
males and 4 females, weight = 54.9 ± 15.6 kg, age = 54.7 ± 25.1 years). The study was
approved by Kagawa University Ethics Committee.
PET measurement protocol
PET acquisition was carried out in 2D mode using a PET scanner (ECAT HR+,
Siemens-CTI, Knoxville, TN, USA). After a 300-s transmission scan with Ge/Ga rod
source (three sources were set and last for 1 year, with the strength at the beginning
being around 180 MBq), a static scan was started at 3 min after the inhalation of

Maeda et al. EJNMMI Physics (2015) 2:12 Page 3 of 12
2,000 MBq of C15O for 3 min. After at least 10 min for radioactive decay, 15O2
(3,000 MBq, 60-s duration) and then C15O2 (3,000 MBq, 60-s duration) were administered
in sequence, at a 10.0-min interval during the single PET scan, which consisted of 39
frames for a total of 780 s (6 × 10 s, 6 × 20 s, 3 × 30 s, 3 × 120 s, 12 × 5 s, and 9 × 10 s).
During the dynamic scan, blood was manually sampled (approximately 1 ml) through a
catheter inserted in the right radial artery at the start of each scan frame. The radioactivity
concentration in the blood samples was measured using an ARC-400 well counter (Aloka,
Tokyo, Japan).
Data processing
For generating an attenuation correction map by the emission-based method, we
applied an edge detection technique [8] which is implemented in the scanner software
[9]. Briefly, an edge contour on a sinogram was detected by setting a threshold. The
contour on the sinogram was smoothed by retaining lower order Fourier coefficients,
and the smoothed contour was transformed to the edge contour on a reconstructed
image. Then an attenuation map was generated using the algorithm implemented in
the scanner software, assuming the tissue attenuation coefficient value to be uniform
[9]. To apply the method, we first summed the measured sinogram in the following
three phases: total scan duration phase, from 20th (640 s) to the end of the scan phase
(second tracer phase), and from 35th (720 s) to the end of the scan phase (phase after
second tracer inhalation). The edge of the brain tissue region on each summed sino-
gram was defined by setting a threshold value. The threshold value was set as 0.1 of the
maximum value on the summed sinogram. The tissue attenuation coefficient value
applied was 0.1 cm−1, which was preliminarily obtained for ten subjects randomly
chosen from the present data set.
Dynamic sinogram data were corrected for dead time in each frame in addition to
detector normalization. Tomographic images were reconstructed from the corrected
sinogram data by the filtered back-projection method with a Hann filter with 9 mm
FWHM. Attenuation correction was applied by the generated emission-based map, as
well as the transmission-based map. The reconstructed images consisted of a 128 ×
128 × 63 matrix size with a pixel size of 1.71 mm × 1.71 mm and 2.45 mm and with
39 frames.
Measured arterial blood time activity curves (TAC) were calibrated to the PET scan-
ner and separated to oxygen and water content while correcting for delay and disper-
sion simultaneously [4,10-14]. The separated blood TACs were used as input functions.
Two sets of CBF, OEF, and CMRO2 images were generated according to the DBFM
formula [5], one being from the dynamic reconstructed image from the emission-based
attenuation map and the other from the transmission-based one.
Data analysis
We placed regions of interest (ROI) on each of the bilateral parietal, frontal, temporal,
and occipital cortical regions, white matter, and cerebellar cortical regions, namely, 36
ROIs in total, in each subject on the obtained CBF image. The ROI shape and size used
comprised a circle 8.6 mm in diameter. Values of CBF, OEF, and CMRO2 in the same
ROIs were compared between the emission- and transmission-based images using
Maeda et al. EJNMMI Physics (2015) 2:12 Page 4 of 12
regression analysis and Bland-Altman plot. The obtained values were also compared by
the paired t-test. p < 0.05 was considered statistically significant.
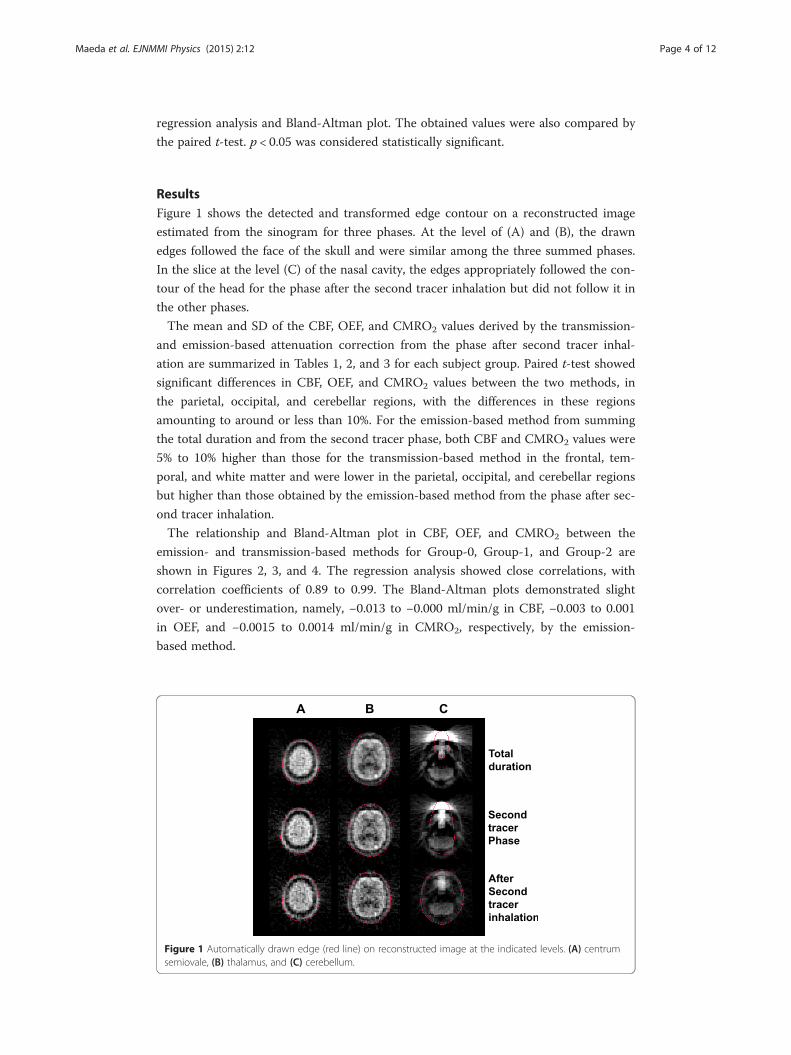
ResultsFigure 1 shows the detected and transformed edge contour on a reconstructed image
estimated from the sinogram for three phases. At the level of (A) and (B), the drawn
edges followed the face of the skull and were similar among the three summed phases.
In the slice at the level (C) of the nasal cavity, the edges appropriately followed the con-
tour of the head for the phase after the second tracer inhalation but did not follow it in
the other phases.
The mean and SD of the CBF, OEF, and CMRO2 values derived by the transmission-
and emission-based attenuation correction from the phase after second tracer inhal-
ation are summarized in Tables 1, 2, and 3 for each subject group. Paired t-test showed
significant differences in CBF, OEF, and CMRO2 values between the two methods, in
the parietal, occipital, and cerebellar regions, with the differences in these regions
amounting to around or less than 10%. For the emission-based method from summing
the total duration and from the second tracer phase, both CBF and CMRO2 values were
5% to 10% higher than those for the transmission-based method in the frontal, tem-
poral, and white matter and were lower in the parietal, occipital, and cerebellar regions
but higher than those obtained by the emission-based method from the phase after sec-
ond tracer inhalation.
The relationship and Bland-Altman plot in CBF, OEF, and CMRO2 between the
emission- and transmission-based methods for Group-0, Group-1, and Group-2 are
shown in Figures 2, 3, and 4. The regression analysis showed close correlations, with
correlation coefficients of 0.89 to 0.99. The Bland-Altman plots demonstrated slight
over- or underestimation, namely, −0.013 to −0.000 ml/min/g in CBF, −0.003 to 0.001
in OEF, and −0.0015 to 0.0014 ml/min/g in CMRO2, respectively, by the emission-
based method.
Figure 1 Automatically drawn edge (red line) on reconstructed image at the indicated levels. (A) centrumsemiovale, (B) thalamus, and (C) cerebellum.

Table 1 CBF, OEF, and CMRO2 values in Group-0 calculated applying the transmission-and emission-based attenuation correction
Transmission Emission
CBF (ml/min/g) Parietal 0.36 ± 0.08 0.34 ± 0.07*
Frontal 0.40 ± 0.07 0.41 ± 0.07
Temporal 0.43 ± 0.06 0.43 ± 0.07
Occipital 0.44 ± 0.06 0.38 ± 0.06*
Cerebellum 0.53 ± 0.09 0.51 ± 0.08*
White matter 0.24 ± 0.04 0.24 ± 0.04
OEF Parietal 0.47 ± 0.04 0.47 ± 0.05
Frontal 0.46 ± 0.05 0.46 ± 0.05*
Temporal 0.44 ± 0.05 0.44 ± 0.05
Occipital 0.48 ± 0.04 0.47 ± 0.04*
Cerebellum 0.50 ± 0.03 0.49 ± 0.03*
White matter 0.43 ± 0.05 0.43 ± 0.05
CMRO2 (ml/min/g) Parietal 0.027 ± 0.006 0.025 ± 0.004*
Frontal 0.030 ± 0.004 0.030 ± 0.004
Temporal 0.031 ± 0.005 0.031 ± 0.005
Occipital 0.034 ± 0.006 0.029 ± 0.005*
Cerebellum 0.044 ± 0.008 0.041 ± 0.007*
White matter 0.016 ± 0.003 0.017 ± 0.003
Values are presented as means ± SD. *Significant difference (p < 0.05) between the transmission- and emission-basedmethods.
Maeda et al. EJNMMI Physics (2015) 2:12 Page 5 of 12
Representative sets of CBF, OEF, and CMRO2 images are shown in Figure 5. No
apparent difference was seen between the emission- and transmission-based methods.
DiscussionIn the present study, we generated CBF, OEF, and CMRO2 images applying an
emission-based attenuation map rather than transmission scan data. The differences
between the emission- and transmission-based methods in the CBF, OEF, and CMRO2
values were around or smaller than 10%, though some of them differed significantly
such as in the parietal, occipital, and cerebellum regions. The regression analysis
showed close correlations with r = 0.89 to 0.99 between the methods, meaning that the
regional contrast in the images was similar. These findings suggest that the present
approach eliminating the transmission scan is applicable for clinical examination,
particularly for patients with acute stroke.
The present application attainable here is as follows. First, several studies have
already demonstrated emission-based attenuation correction like in the present
method; however, they performed the scan by administering the tracer via only injec-
tion but not gas inhalation. It was not specified how the inhaled gas affected, particu-
larly in the nasal cavity, the generated attenuation map by the emission-based method.
The present study clarified the applicability for the gas inhalation method. Second,
because of the considerable shortening of the total examination duration by eliminating
the transmission scan, the patient’s burden, in particular, the need to stay still, would

Table 2 CBF, OEF, and CMRO2 values in Group-1 calculated applying the transmission-and emission-based attenuation correction
Contra-lateral hemisphere Ipsi hemisphere
Transmission Emission Transmission Emission
CBF (ml/min/g) Parietal 0.43 ± 0.10 0.40 ± 0.07 0.42 ± 0.07 0.38 ± 0.05
Frontal 0.44 ± 0.07 0.45 ± 0.08 0.39 ± 0.04 0.41 ± 0.05
Temporal 0.45 ± 0.05 0.47 ± 0.04 0.43 ± 0.06 0.46 ± 0.05*
Occipital 0.46 ± 0.04 0.42 ± 0.04* 0.44 ± 0.08 0.40 ± 0.07*
Cerebellum 0.54 ± 0.08 0.55 ± 0.07 0.54 ± 0.09 0.56 ± 0.07
White matter 0.22 ± 0.05 0.23 ± 0.04* 0.24 ± 0.04 0.25 ± 0.04
OEF Parietal 0.46 ± 0.03 0.45 ± 0.03 0.44 ± 0.05 0.44 ± 0.05
Frontal 0.44 ± 0.03 0.44 ± 0.03 0.47 ± 0.04 0.47 ± 0.04
Temporal 0.42 ± 0.03 0.43 ± 0.04 0.44 ± 0.03 0.45 ± 0.03
Occipital 0.47 ± 0.03 0.46 ± 0.03* 0.46 ± 0.04 0.45 ± 0.04*
Cerebellum 0.48 ± 0.03 0.49 ± 0.04 0.48 ± 0.04 0.49 ± 0.04
White matter 0.44 ± 0.04 0.44 ± 0.04 0.43 ± 0.06 0.43 ± 0.06
CMRO2 (ml/min/g) Parietal 0.032 ± 0.006 0.029 ± 0.004* 0.030 ± 0.005 0.027 ± 0.005*
Frontal 0.031 ± 0.007 0.032 ± 0.007 0.030 ± 0.005 0.031 ± 0.006
Temporal 0.031 ± 0.003 0.032 ± 0.003 0.031 ± 0.003 0.033 ± 0.003
Occipital 0.035 ± 0.002 0.030 ± 0.002* 0.033 ± 0.005 0.029 ± 0.004*
Cerebellum 0.042 ± 0.003 0.043 ± 0.006 0.042 ± 0.005 0.043 ± 0.002
White 0.016 ± 0.004 0.016 ± 0.003 0.016 ± 0.001 0.017 ± 0.001
Values are presented as means ± SD. *Significant difference (p < 0.05) between the transmission- and emission-basedmethods.
Maeda et al. EJNMMI Physics (2015) 2:12 Page 6 of 12
be reduced. Third, the applicability can be extended to the acute stroke patient, for
whom the most rapid possible intervention is needed [15], and furthermore to assess-
ments of hemodynamic change in a subject receiving a time-limited balloon occlusion
test [16]. Bai et al. suggested that images without attenuation correction can give
misleading, namely, a sphere in a thorax phantom was not visible without attenuation
correction [17]. Careful attention is warranted to apply the present method when
uniform structure cannot be assumed.
Some studies have focused on the elimination of transmission scans aside from PET/
CT or PET/MRI. Weinzapfel and Hutchins in a CBF study during activation with and
without transmission-based attenuation map found no significant difference between
the methods [18]. Montandon and Zaidi demonstrated a method of template-based
attenuation [19]. Kaneko et al. conducted a FDG study without transmission scan and
found less adequate qualitative measurement in the uppermost and lowermost parts
[20]. In generating the attenuation map by the emission-based method in the present
study, we used the sinogram from 12 min to the end to define the edge of a brain
contour and confirmed that the detected edge in the sinogram follows exactly the brain
edge contour on a reconstructed image. When a sinogram from the total duration was
used, the edge was blurred due to spillover of inhaled and exhaled 15O-labeled gas,
resulting in an inappropriate attenuation map. Thus, extracting a phase not affected by
the labeled gas is crucial for quantification of CBF, OEF, and CMRO2 in studies in
which 15O-labeled gas compounds are administered.

Table 3 CBF, OEF, and CMRO2 values in Group-2 calculated applying the transmission-and emission-based attenuation correction
Contra-lateral hemisphere Ipsi hemisphere
Transmission Emission Transmission Emission
CBF (ml/min/g) Parietal 0.45 ± 0.17 0.42 ± 0.14* 0.39 ± 0.16 0.36 ± 0.14*
Frontal 0.44 ± 0.15 0.46 ± 0.17 0.36 ± 0.16 0.37 ± 0.16
Temporal 0.48 ± 0.18 0.48 ± 0.18 0.40 ± 0.13 0.40 ± 0.13
Occipital 0.47 ± 0.14 0.42 ± 0.11* 0.44 ± 0.13 0.39 ± 0.12*
Cerebellum 0.51 ± 0.17 0.48 ± 0.17 0.56 ± 0.15 0.53 ± 0.16
White matter 0.23 ± 0.07 0.24 ± 0.07 0.19 ± 0.05 0.20 ± 0.05
OEF Parietal 0.48 ± 0.08 0.48 ± 0.09 0.52 ± 0.09 0.51 ± 0.09*
Frontal 0.47 ± 0.07 0.48 ± 0.07 0.53 ± 0.13 0.53 ± 0.13
Temporal 0.46 ± 0.08 0.46 ± 0.08 0.50 ± 0.10 0.50 ± 0.09
Occipital 0.48 ± 0.07 0.47 ± 0.08 0.51 ± 0.08 0.50 ± 0.08*
Cerebellum 0.50 ± 0.07 0.50 ± 0.06 0.50 ± 0.06 0.49 ± 0.05
White matter 0.47 ± 0.10 0.48 ± 0.10* 0.54 ± 0.14 0.54 ± 0.13
CMRO2 (ml/min/g) Parietal 0.035 ± 0.017 0.032 ± 0.014* 0.032 ± 0.017 0.029 ± 0.013*
Frontal 0.033 ± 0.013 0.034 ± 0.015 0.029 ± 0.013 0.030 ± 0.012
Temporal 0.035 ± 0.015 0.035 ± 0.014 0.032 ± 0.014 0.032 ± 0.012
Occipital 0.035 ± 0.011 0.031 ± 0.008* 0.036 ± 0.014 0.030 ± 0.010*
Cerebellum 0.040 ± 0.012 0.037 ± 0.011 0.044 ± 0.012 0.041 ± 0.011
White matter 0.017 ± 0.005 0.018 ± 0.006* 0.016 ± 0.005 0.016 ± 0.005
Values are presented as means ± SD. *Significant difference (p < 0.05) between the transmission- and emission-basedmethods.
Maeda et al. EJNMMI Physics (2015) 2:12 Page 7 of 12
The tissue coefficient value applied was 0.1 cm−1, which was obtained from the mean of
measured attenuation maps for ten subjects randomly chosen from the present data set.
For the ten values, mean and SD were 0.0996 ± 0.0013 cm−1, suggesting quite similar
values across subjects. In fact, quite a similar value and variation of 0.099 ± 0.002 cm−1
was also demonstrated in a previous CBF study [18]. Some factors are potential sources of
inaccuracy, such as sex, ethnic group, and age, and thickness of skull. When we applied
the software for estimating attenuation map, the thickness of skull was not involved for
the estimation, because that is not same across subjects and level of head. However, we
do not anticipate significant errors attributable to these factors.
The CBF and CMRO2 values were obtained from uptake rate in water and oxygen
phase and thus directly affected by the pixel value, thus degree of difference of these
two parametric values between the methods were similar. The variations in OEF were
less because that is computed as a rate of uptake rates in oxygen and water, meaning
that the bias in the estimated pixel values was canceled.
There were significant differences in the CBF, OEF, and CMRO2 values between the
emission- and transmission-based methods, such as in the parietal, frontal, cerebellum,
and occipital regions. Such significant differences are likely attributable to some factors
not taken into account in estimating the attenuation map, such as head-rest and skull
for parietal region, and eyeball, muscle, ventricles, and bone, which could have different
attenuation coefficients from that of the brain tissue, for occipital and cerebellar
regions, and also any 15O-labeled gas retained in the nasal cavity and trachea. These

Figure 2 Relationship and Bland-Altman plot for Group-0 between the emission- and transmission-basedmethods. The regression lines are y = 0.83 x + 0.05 ml/min/g (r = 0.92), y = 0.91 x + 0.04 ml/min/g (r = 0.96),and y = 0.79 x + 0.005 ml/min/g (r = 0.92), for CBF, OEF, and CMRO2, respectively. In the Bland-Altman plot,solid and broken lines show mean of difference and its respective 2SD, respectively. Mean ± SD values are−0.013 ± 0.047 ml/min/g for CBF, 0.001 ± 0.018 for OEF, and 0.0014 ± 0.0042 ml/min/g for CMRO2,respectively.
Figure 3 Relationship and Bland-Altman plot for Group-1 between the emission- and transmission-basedmethods. The regression lines are y = 0.88 x + 0.05 ml/min/g (r = 0.92), y = 0.97 x + 0.01 ml/min/g (r = 0.97),and y = 0.88 x + 0.003 ml/min/g (r = 0.89), for CBF, OEF, and CMRO2, respectively. In the Bland-Altman plot,solid and broken lines show mean of difference and its respective 2SD, respectively. Mean ± SD values are−0.000 ± 0.047 ml/min/g for CBF, 0.001 ± 0.012 for OEF, and −0.0005 ± 0.0043 ml/min/g for CMRO2,respectively.
Maeda et al. EJNMMI Physics (2015) 2:12 Page 8 of 12

Figure 4 Relationship and Bland-Altman plot for Group-2 between the emission- and transmission-basedmethods. The regression lines are y = 0.91 x + 0.02 ml/min/g (r = 0.96), y = 0.97 x + 0.01 ml/min/g (r = 0.99),and y = 0.84 x + 0.003 ml/min/g (r = 0.90), for CBF, OEF, and CMRO2, respectively. In the Bland-Altman plot,solid and broken lines show mean of difference and its respective 2SD, respectively. Mean ± SD values are−0.014 ± 0.048 ml/min/g for CBF, −0.003 ± 0.013 for OEF, and −0.0015 ± 0.0048 ml/min/g for CMRO2,respectively.
Figure 5 Representative view of CBF, OEF, and CMRO2 for Group-2 by transmission- and emission-basedattenuation correction.
Maeda et al. EJNMMI Physics (2015) 2:12 Page 9 of 12
Maeda et al. EJNMMI Physics (2015) 2:12 Page 10 of 12
factors appeared to bias the attenuation map in the emission-based method. Also, there
is a methodological difference, namely, the transmission-based method is always
affected by noise, while the other assumes uniform distribution of tissue coefficients,
and thus is not affected by noise. This factor appeared as regional variation in attenu-
ation maps from the transmission-based method. Such factors could result in regional
dependency of over- or underestimation in the reconstructed pixel value and thus in
estimated CBF, OEF, and CMRO2 values. In fact, the obtained CBF and CMRO2 values
by the present method appeared lower than those by the transmission method in the
parietal and occipital regions and cerebellum, due to the assumption that tissue coeffi-
cient values are uniform not only for brain but also for other tissues whereas they are
in fact subject to bias from bone and soft tissue regions. In contrast, if the emission-
based attenuation map was generated from a sinogram including a gas inhaling phase,
the nasal cavity filled with 15O gas and its surrounding region might be considered
brain tissue, resulting in overestimation of the pixel value and thus higher CBF and
CMRO2 values. The CBF and CMRO2 values were obtained from the uptake rate in
water and oxygen phase and thus directly affected by the pixel value. Thus, the degree
of the difference in these two parametric values between the methods was similar. The
variations in OEF were less marked because it is computed as a rate of uptake rates in
oxygen and water, meaning that the bias in the estimated pixel values was canceled.
The differences, however, were around or less than 10% in CBF and CMRO2 in the
parietal, occipital, and cerebellum regions for the present emission-based method and
were smaller than the SDs. As a whole, any apparent difference would not adversely
affect any clinical determination of optimal treatments.
Recently, most PET systems are integrated PET/CT or PET/MRI scanners, and the
2D acquisition mode, which the present study applied, is not available, while only the
3D mode is. It would be important to refer the applicability of the present method to
the 3D mode, but it would be important to directly test its validity. In theory, the
present method might be extended to the 3D mode, because edge contour determin-
ation on the sinogram would be possible in the 3D mode like in the 2D mode. Then
we could proceed with the same procedure. It should be noted that quantitative estima-
tion of CBF, OEF, and CMRO2 has been achieved with 2D mode, while scatter coinci-
dence events disturb the quantitative nature for 3D mode [20]. To overcome this, a
hybrid dual-energy window method (HDW) [21,22] was applied and the validity of
CBF, OEF, and CMRO2 images was demonstrated [23]. When scatter coincidence
events interfere with the edge detection on sinograms, it would be possible to detect
them on reconstructed images without attenuation correction, implementing the above
HDW and proceeding with the following procedure. Thus, implementation of a hybrid
scatter correction method would be essential for applying the 3D mode.
In the present study, the duration of transmission was 5 min, and the total true count
was more than 50 M counts depending on the Ge/Ga rod source. In a previous study
that estimated noise levels in CBF, OEF, and CMRO2 enhanced from transmission data,
an N-index was introduced and the noise level was found not to be enhanced when the
transmission true count was more than 40 M counts [6]. A simple comparison between
the present and previous counts may not be feasible because of the different protocols
as well as different PET scanners used, but, the count level in our study is higher, and
thus, the transmission duration would be sufficient for the image quality. We also

Maeda et al. EJNMMI Physics (2015) 2:12 Page 11 of 12
measured the N-index in our data set for those parametric images and found no signifi-
cant deterioration in quality on parametric images.
We separated the present subjects into three groups with (two grades) and without
cerebrovascular disorders and tested the validity of the present method, particularly in
regions with elevated CBV and reduced CBF. The obtained parametric images showed
that the CBF reduced and OEF elevated regions in the transmission-based method can
also be identified with the emission-based method. The regional ROI values did not
differ between the methods in any of the groups. These findings suggest that the
present method with gas study is applicable to patients with cerebrovascular disorders,
particularly acute stroke.
We set the time interval between the sequential administration of two tracers to
11 min, which is much longer than the 3 min the conventional methodology allows
[4,5], in the present examination. The reason for this longer interval was due to limita-
tions of the synthesizer system. The limitation is due to the need for a sequential
supply of two radioactive compounds, namely, 15O2 and C15O2, within a short interval,
including radio-synthesis, quality control, and purity examination before administra-
tion. An automated synthesis system able to operate under the same operation system
as for the 15O-dedicated cyclotron would help to improve the logistics necessary in the
procedures [24].
ConclusionsThe present study confirmed that the attenuation correction can be performed by the
emission-based estimation method and clinical PET duration can be shortened for the
CBF, OEF, and CMRO2 gas study.
Competing interestsThe authors declare that they have no competing interests.
Authors’ contributionsYM and NKu carried out the data processing and analysis. NKu, YY, and YN involved in drafting the manuscript. YS, TM,KK, and NKa contributed to the clinical study. All authors read and approved the final manuscript.
AcknowledgementsThe authors thank the staff of the Department of Clinical Radiology, Kagawa University Hospital. The work of NKu wassupported by the Ministry of Education, Science, Sports and Culture of Japan, a Grant-in-Aid for KAKENHI (C) Grantnumber 23590675 2011–2013.
Author details1Division of Social and Environmental Medicine, Graduate School of Medicine, Kagawa University, 1750-1 Ikenobe,Miki-cho, Kita-gun, Kagawa 761-0793, Japan. 2Department of Clinical Radiology, Kagawa University Hospital, Kagawa761-0793, Japan. 3Department of Medical Physics, Faculty of Medicine, Kagawa University, Kagawa 761-0793, Japan.4Department of Radiology, Faculty of Medicine, Kagawa University, Kagawa 761-0793, Japan. 5Department ofNeurological Surgery, Faculty of Medicine, Kagawa University, Kagawa 761-0793, Japan.
Received: 23 February 2015 Accepted: 20 April 2015
References
1. Mintun M, Raichle M, Martin W, Herscovitch P. Brain oxygen utilization measured with O-15 radiotracers andpositron emission tomography. J Nucl Med. 1984;25:177–87.2. Hatazawa J, Fujita H, Kanno I, Satoh T, Iida H, Miura S, et al. Regional cerebral blood flow, blood volume, oxygen
extraction fraction, and oxygen utilization rate in normal volunteers measured by the autoradiographic techniqueand the single breath inhalation method. Ann Nucl Med. 1995;9:15–21.
3. Shidahara M, Watabe H, Kim K, Oka H, Sago M, Hayashi T, et al. Evaluation of a commercial PET tomograph-basedsystem for the quantitative assessment of rCBF, rOEF and rCMRO2 by using sequential administration of 15O-labeledcompounds. Ann Nucl Med. 2002;16:317–27.

Maeda et al. EJNMMI Physics (2015) 2:12 Page 12 of 12
4. Kudomi N, Hayashi T, Teramoto N, Watabe H, Kawachi N, Ohta Y, et al. Rapid quantitative measurement of CMRO2
and CBF by dual administration of 15O-labeled oxygen and water during a single PET scan - a validation studyand error analysis in anesthetized monkeys. J Cereb Blood Flow Metab. 2005;25:1209–24.
5. Kudomi N, Hirano Y, Koshino K, Hayashi T, Watabe H, Fukushima K, et al. Rapid quantitative CBF and CMRO2
measurements from a single PET scan with sequential administration of dual 15O-labeled tracers. J Cereb BloodFlow Metab. 2013;33:440–8.
6. Kudomi N, Watabe H, Hayashi T, Oka H, Miyake Y, Iida H. Optimization of transmission scan duration for 15O PETstudy with sequential dual tracer administration using N-index. Ann Nucl Med. 2010;24:413–20.
7. Powers WJ, Press GA, Grubb Jr RL, Gado M, Raichle ME. The effect of hemodynamically significant carotid arterydisease on the hemodynamic status of the cerebral circulation. Ann Intern Med. 1987;106:27–34.
8. Tomitani T. An edge detection algorithm for attenuation correction in emission CT. IEEE Transactions on NuclearScience 1987, NS34:309–12
9. Siemens AG. Medical Solutions Henkestrasse 127 91052 Erlangen Germany. PET Software Version 7.2.2 OperatingInstruction. CPS INNOVATIONS 2002, 101, 626
10. Iida H, Higano S, Tomura N, Shishido F, Kanno I, Miura S, et al. Evaluation of regional differences of tracerappearance time in cerebral tissues using [15O] water and dynamic positron emission tomography. J Cereb BloodFlow Metab. 1988;8:285–8.
11. Iida H, Kanno I, Miura S, Murakami M, Takahashi K, Uemura K. Error analysis of a quantitative cerebral blood flowmeasurement using H2(15)O autoradiography and positron emission tomography, with respect to the dispersionof the input function. J Cereb Blood Flow Metab. 1986;6:536–45.
12. Meyer E. Simultaneous correction for tracer arrival delay and dispersion in CBF measurements by the H215O
autoradiographic method and dynamic PET. J Nucl Med. 1989;30:1069–78.13. Kudomi N, Watabe H, Hayashi T, Iida H. Separation of input function for rapid measurement of quantitative
CMRO2 and CBF in a single PET scan with a dual tracer administration method. Phys Med Biol. 2007;52:1893–908.14. Kudomi N, Hayashi T, Watabe H, Teramoto N, Piao R, Ose T, et al. A physiologic model for recirculation water
correction in CMRO2 assessment with 15O2 inhalation PET. J Cereb Blood Flow Metab. 2009;29:355–64.15. Lees KR, Bluhmki E, von Kummer R, Brott TG, Toni D, Grotta JC, et al. Time to treatment with intravenous alteplase
and outcome in stroke: an updated pooled analysis of ECASS, ATLANTIS, NINDS, and EPITHET trials. Lancet.2010;375:1695–703.
16. Kawai N, Kawanishi M, Shindou A, Kudomi N, Yamamoto Y, Nishiyama Y, et al. Cerebral blood flow and metabolismmeasurement using positron emission tomography before and during internal carotid artery test occlusions: feasibilityof rapid quantitative measurement of CBF and OEF/CMRO2. Interv Neuroradiol. 2010;18:264–74.
17. Chuanyong B, Kinahan PE, David B, Claude C, Townsend DW, Meltzer CC, et al. An analytic study of the effects ofattenuation on tumor detection in whole-body PET oncology imaging. J Nucl Med. 2003;44:1855–61.
18. Weinzapfel BT, Hutchins GD. Automated PET attenuation correction model for functional brain imaging. J NuclMed. 2001;42:483–91.
19. Montandon ML, Zaidi H. Quantitative analysis of template-based attenuation compensation in 3D brain PET.Computerized Med Imag and Graph. 2001;31:28–38.
20. Kaneko K, Kuwabara Y, Sasaki M, Koga H, Abe K, Baba S, et al. Validation of quantitative accuracy of the post-injectiontransmission-based and transmissionless attenuation correction techniques in neurological FDG-PET. Nucl MedCommuni. 2004;25:1095–102.
21. Ishikawa A, Kitamura K, Mizuta T, Tanaka K, Amano M, Inoue Y, et al. Implementation of on-the-fly scatter correction usingdual energy window method in continuous 3D whole body PET scanning. Nuclear Science Symposium ConferenceRecord. 2005;5:2497–500.
22. Ferreira NC, Trebossen R, Lartizien C, Brulon V, Merceron P, Bendriem B. A hybrid scatter correction for 3D PETbased on an estimation of the distribution of unscattered coincidences: implementation on the ECAT EXACT HR+.Phys Med Biol. 2002;47:1555–71.
23. Ibaraki M, Miura S, Shimosegawa E, Sugawara S, Mizuta T, Ishikawa A, et al. Quantification of cerebral blood flowand oxygen metabolism with 3-dimensional PET and 15O: validation by comparison with 2-dimensional PET.J Nucl Med. 2008;49:50–9.
24. Miyake Y, Iida H, Hayashida K, Ishida Y. New method for the synthesis of 15O-1abeled carbon monoxide and15O-1abeled dioxide for rapid supply in clinical use. Internalional Congress Series. 2004;1265:93–6.
Submit your manuscript to a journal and benefi t from:
7 Convenient online submission
7 Rigorous peer review
7 Immediate publication on acceptance
7 Open access: articles freely available online
7 High visibility within the fi eld
7 Retaining the copyright to your article
Submit your next manuscript at 7 springeropen.com