application delivery-controller-brand-leader-report-itbrandpulse
TRANSCRIPT

Application Delivery Controller 2014 Brand Leader Report
Brand201412 Copyright © 2014 IT Brand Pulse
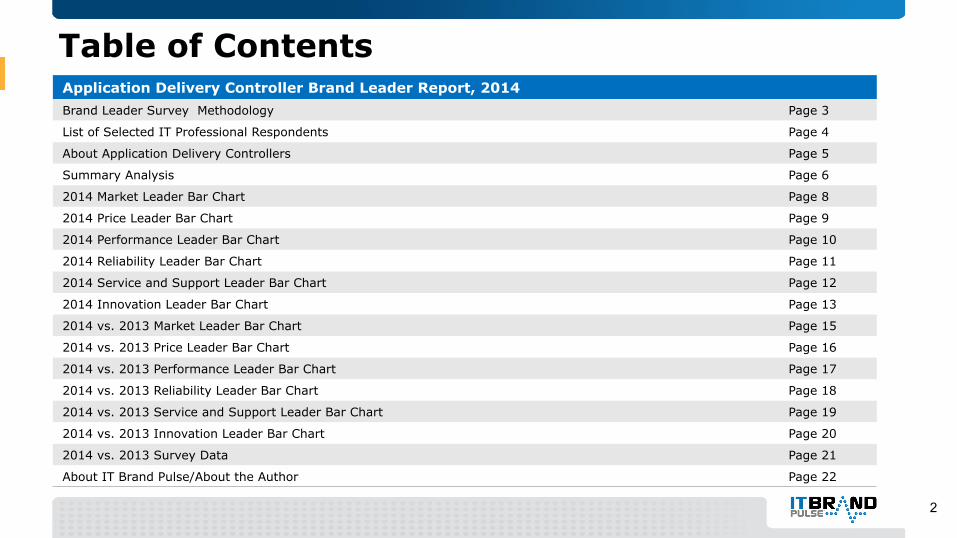
Table of Contents
2
Application Delivery Controller Brand Leader Report, 2014 Brand Leader Survey Methodology Page 3
List of Selected IT Professional Respondents Page 4
About Application Delivery Controllers Page 5
Summary Analysis Page 6
2014 Market Leader Bar Chart Page 8
2014 Price Leader Bar Chart Page 9
2014 Performance Leader Bar Chart Page 10
2014 Reliability Leader Bar Chart Page 11
2014 Service and Support Leader Bar Chart Page 12
2014 Innovation Leader Bar Chart Page 13
2014 vs. 2013 Market Leader Bar Chart Page 15
2014 vs. 2013 Price Leader Bar Chart Page 16
2014 vs. 2013 Performance Leader Bar Chart Page 17
2014 vs. 2013 Reliability Leader Bar Chart Page 18
2014 vs. 2013 Service and Support Leader Bar Chart Page 19
2014 vs. 2013 Innovation Leader Bar Chart Page 20
2014 vs. 2013 Survey Data Page 21
About IT Brand Pulse/About the Author Page 22

Application Delivery Controller Brand Leader Survey Methodology
• Brand Leader Reports are designed to measure the pulse of brand leadership in specific product categories using independent, non-sponsored surveys.
• The Application Delivery Controller survey was conducted in October, 2014. – Respondents were solicited from over 1,000,000 members of 100+ online IT groups, and from the IT Brand
Pulse IT professional database. – Responses were collected using an online survey engine.
• In each part, respondents were provided with a product category description, list of vendor choices
(plus an “Other” answer choice to add a vendor, if applicable), and were asked six questions: 1. Who do you perceive as the Application Delivery Controller market leader? 2. Who do you perceive as the Application Delivery Controller price leader? 3. Who do you perceive as the Application Delivery Controller performance leader? 4. Who do you perceive as the Application Delivery Controller reliability leader? 5. Who do you perceive as the Application Delivery Controller service & support leader? 6. Who do you perceive as the Application Delivery Controller innovation leader?
3

Selected Organizations Represented
4
Colliers Crimial Justice Institute Daiwa Securities Group Inc. Delta Airlines Department of Defense Duke Clinical Research Institute Duke University EDD CA GOV Emergent BioSolutions Emerson Electric Entercom Ernst & Young Expedia ExxonMobil Fairfield Residential Company Fifth Third Bank FLTCYBERCOM (US Navy) Fluor Ford Motor Company Gates Corporation General Electric General Motors Halliburton
Alba Health Amercian Airlines AOL Aramco Associated Food Stores Assurant AT&T ATPCO Attorneys Title Fund Services Avon Products, Inc. Bank of America Bard Baylor College of Medicine BELLIN Treasury Services BioTek Instruments Booz Allen Hamilton Boston Dynamics British Amercian Tobacco British Columbia Lottery Corp. CA Judicial Courts Admin. CalPERS Christus Health Chubb Insurance
Huntington Bancshares, Inc. Inenco Jamaica Hospital Medical Center JP Morgan Chase Kaspersky Kingston Technology Legal Technicalities Lockheed Martin L.A. Co. Dept. of Public Health MESSA Morgan Stanley NASA Ames Research Center National Institute of Health New York Life NYC Dept of Correction Omnicom Owens Corning Pacific Northwest National Lab. Philips Providence Health REI Rutgers University Sabre
Seneca Gaming Corporation Siemens Sony Online Entertainment Southern Company TD Bank Temple University T-Mobile Transamerica UBS United Health Group/Optum United Nations Fed. Credit Union Universal Parks and Resorts University of Michigan Univ. of Pittsburgh Medical Ctr. Univ. of TX SW Medical Ctr. USAF Academy USC Marshall School of Business Verizon Virginia Tech vRad XOEye Technologies Yale University York (Canada)
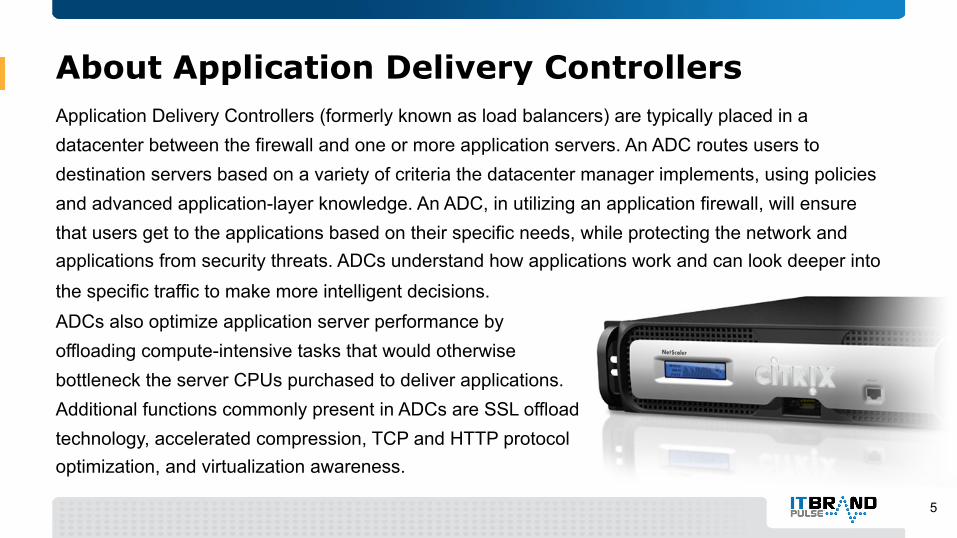
About Application Delivery Controllers
5
Application Delivery Controllers (formerly known as load balancers) are typically placed in a datacenter between the firewall and one or more application servers. An ADC routes users to destination servers based on a variety of criteria the datacenter manager implements, using policies and advanced application-layer knowledge. An ADC, in utilizing an application firewall, will ensure that users get to the applications based on their specific needs, while protecting the network and applications from security threats. ADCs understand how applications work and can look deeper into the specific traffic to make more intelligent decisions.
ADCs also optimize application server performance by offloading compute-intensive tasks that would otherwise bottleneck the server CPUs purchased to deliver applications. Additional functions commonly present in ADCs are SSL offload technology, accelerated compression, TCP and HTTP protocol optimization, and virtualization awareness.

Summary Analysis
• Momentum accelerates in 2014 as IT Pros select Citrix as ADC Market Leader – In 2013, driven by the Cisco partnership, Citrix vaulted past F5 in IT voting for ADC Market Leader.
Based on the results of the 2014 brand leader survey, it definitely was not a fluke. IT voting for Citrix accelerated as the company achieved the highest score of the survey in this category, and opened a double-digit lead over second-place F5. With Cisco eliminated from this year’s survey, Riverbed stepped into a distant third position for Market Leader.
• Citrix sweeps all six categories of ADC brand leadership – For a second consecutive year, ADC survey respondents chose Citrix as the leader in all six categories:
Market, Performance, Reliability, Innovation, Price, and Service & Support. To understand what is behind the IT professionals’ perceptions, we focused on where Citrix scores improved, as well as the biggest spread between leader and runner-up. Votes for Citrix increased in every category, with the most considerable span occurring in both Price and Reliability. Once again, the survey results indicated that for ADCs, the breadth of Citrix capabilities stands out in an ultra-competitive field of contenders.
• Removing the halo of the Cisco brand – In past ADC surveys, Cisco received a greater percentage of votes than you would expect from a
vendor who was not succeeding in the market segment. The 2014 survey removed the Cisco halo brand factor, and Cisco votes went to the two market share leaders. Among F5 and Citrix, the survey results reflect the trend towards Citrix’s growing market share and demonstrate IT Pro perceptions that Citrix offers a better “whole product.”
6

Application Delivery Controller 2014 Survey Results
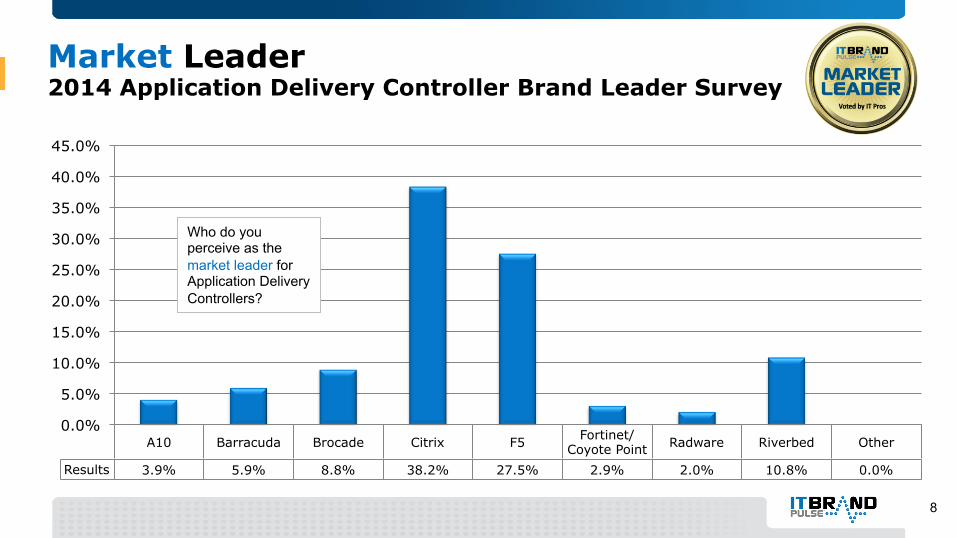
Market Leader 2014 Application Delivery Controller Brand Leader Survey
8
A10 Barracuda Brocade Citrix F5 Fortinet/ Coyote Point Radware Riverbed Other
Results 3.9% 5.9% 8.8% 38.2% 27.5% 2.9% 2.0% 10.8% 0.0%
0.0%
5.0%
10.0%
15.0%
20.0%
25.0%
30.0%
35.0%
40.0%
45.0%
Who do you perceive as the market leader for Application Delivery Controllers?

Price Leader 2014 Application Delivery Controller Brand Leader Survey
9
A10 Barracuda Brocade Citrix F5 Fortinet/ Coyote Point Radware Riverbed Other
Results 5.9% 12.8% 9.8% 31.4% 19.6% 5.9% 0.0% 13.7% 1.0%
0.0%
5.0%
10.0%
15.0%
20.0%
25.0%
30.0%
35.0%
Who do you perceive as the price leader for Application Delivery Controllers?

Performance Leader 2014 Application Delivery Controller Brand Leader Survey
10
A10 Barracuda Brocade Citrix F5 Fortinet/ Coyote Point Radware Riverbed Other
Results 2.9% 6.9% 10.8% 32.4% 26.5% 2.9% 2.9% 13.7% 1.0%
0.0%
5.0%
10.0%
15.0%
20.0%
25.0%
30.0%
35.0%
Who do you perceive as the performance leader for Application Delivery Controllers?

Reliability Leader 2014 Application Delivery Controller Brand Leader Survey
11
A10 Barracuda Brocade Citrix F5 Fortinet/ Coyote Point Radware Riverbed Other
Results 4.9% 5.9% 11.8% 37.3% 25.5% 3.9% 1.0% 8.8% 1.0%
0.0%
5.0%
10.0%
15.0%
20.0%
25.0%
30.0%
35.0%
40.0%
Who do you perceive as the reliability leader for Application Delivery Controllers?

Service and Support Leader 2014 Application Delivery Controller Brand Leader Survey
12
A10 Barracuda Brocade Citrix F5 Fortinet/ Coyote Point Radware Riverbed Other
Results 3.9% 8.8% 7.8% 37.3% 27.5% 2.9% 2.0% 8.8% 1.0%
0.0%
5.0%
10.0%
15.0%
20.0%
25.0%
30.0%
35.0%
40.0%
Who do you perceive as the service and support leader for Application Delivery Controller?
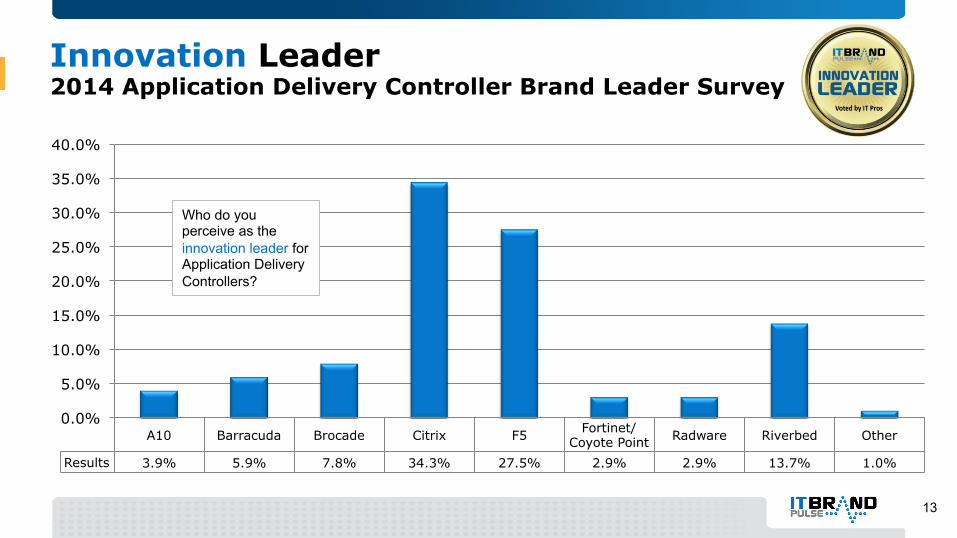
Innovation Leader 2014 Application Delivery Controller Brand Leader Survey
13
A10 Barracuda Brocade Citrix F5 Fortinet/ Coyote Point Radware Riverbed Other
Results 3.9% 5.9% 7.8% 34.3% 27.5% 2.9% 2.9% 13.7% 1.0%
0.0%
5.0%
10.0%
15.0%
20.0%
25.0%
30.0%
35.0%
40.0%
Who do you perceive as the innovation leader for Application Delivery Controllers?

Application Delivery Controller 2014 vs. 2013 Survey Results

Market Leader Application Delivery Controller Brand Leader Survey: 2014 vs 2013
15
A10 Barracuda Brocade Cisco Citrix F5 Fortinet/ Coyote Point
Radware Riverbed Other
2014 3.9% 5.9% 8.8% 38.2% 27.5% 2.9% 2.0% 10.8% 0.0% 2013 2.9% 5.8% 7.2% 18.8% 29.0% 22.5% 0.0% 2.9% 10.9% 0.0%
0.0%
5.0%
10.0%
15.0%
20.0%
25.0%
30.0%
35.0%
40.0%
45.0%
Who do you perceive as the market leader for Application Delivery Controllers?
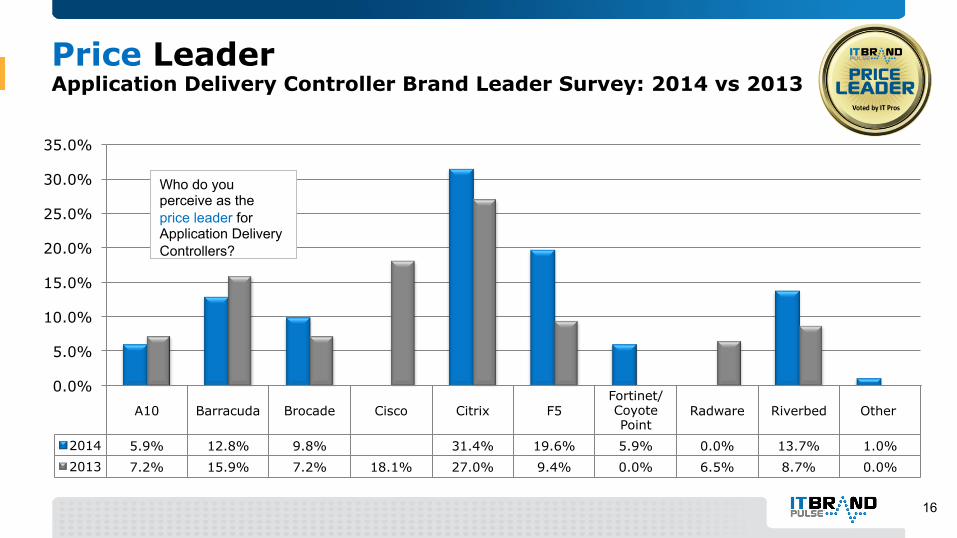
Price Leader Application Delivery Controller Brand Leader Survey: 2014 vs 2013
16
A10 Barracuda Brocade Cisco Citrix F5 Fortinet/ Coyote Point
Radware Riverbed Other
2014 5.9% 12.8% 9.8% 31.4% 19.6% 5.9% 0.0% 13.7% 1.0% 2013 7.2% 15.9% 7.2% 18.1% 27.0% 9.4% 0.0% 6.5% 8.7% 0.0%
0.0%
5.0%
10.0%
15.0%
20.0%
25.0%
30.0%
35.0%
Who do you perceive as the price leader for Application Delivery Controllers?

Performance Leader Application Delivery Controller Brand Leader Survey: 2014 vs 2013
17
A10 Barracuda Brocade Cisco Citrix F5 Fortinet/ Coyote Point
Radware Riverbed Other
2014 2.9% 6.9% 10.8% 32.4% 26.5% 2.9% 2.9% 13.7% 1.0% 2013 5.8% 5.8% 8.0% 20.3% 28.2% 18.1% 0.0% 5.1% 8.7% 0.0%
0.0%
5.0%
10.0%
15.0%
20.0%
25.0%
30.0%
35.0%
Who do you perceive as the performance leader for Application Delivery Controllers?

Reliability Leader Application Delivery Controller Brand Leader Survey: 2014 vs 2013
18
A10 Barracuda Brocade Cisco Citrix F5 Fortinet/ Coyote Point
Radware Riverbed Other
2014 4.9% 5.9% 11.8% 37.3% 25.5% 3.9% 1.0% 8.8% 1.0% 2013 5.1% 5.1% 8.7% 23.2% 24.7% 18.1% 1.4% 1.4% 12.3% 0.0%
0.0%
5.0%
10.0%
15.0%
20.0%
25.0%
30.0%
35.0%
40.0%
Who do you perceive as the reliability leader for Application Delivery Controllers?

Service and Support Leader Application Delivery Controller Brand Leader Survey: 2014 vs 2013
19
A10 Barracuda Brocade Cisco Citrix F5 Fortinet/ Coyote Point
Radware Riverbed Other
2014 3.9% 8.8% 7.8% 37.3% 27.5% 2.9% 2.0% 8.8% 1.0% 2013 2.9% 7.2% 9.4% 21.7% 26.1% 17.4% 2.2% 2.2% 10.9% 0.0%
0.0%
5.0%
10.0%
15.0%
20.0%
25.0%
30.0%
35.0%
40.0%
Who do you perceive as the service and support leader for Application Delivery Controllers?
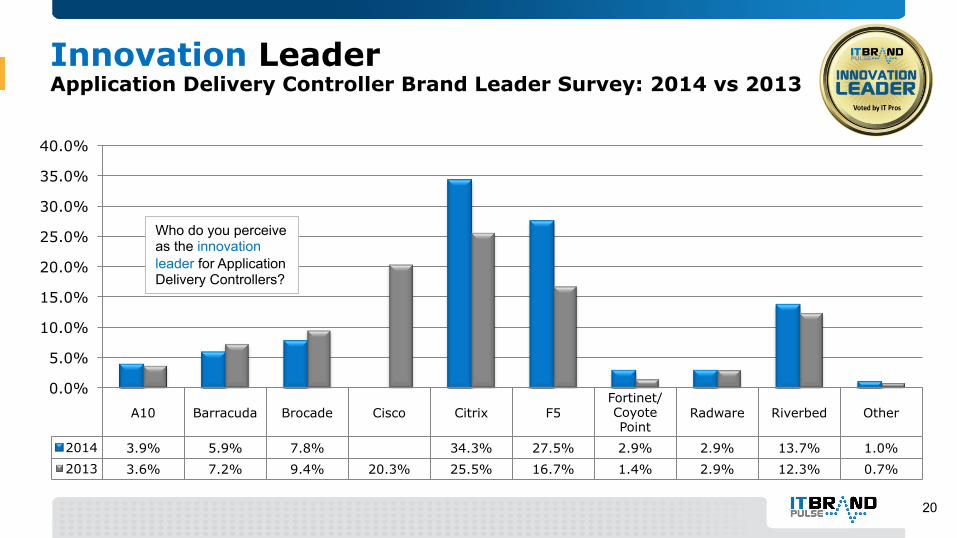
Innovation Leader Application Delivery Controller Brand Leader Survey: 2014 vs 2013
20
A10 Barracuda Brocade Cisco Citrix F5 Fortinet/ Coyote Point
Radware Riverbed Other
2014 3.9% 5.9% 7.8% 34.3% 27.5% 2.9% 2.9% 13.7% 1.0% 2013 3.6% 7.2% 9.4% 20.3% 25.5% 16.7% 1.4% 2.9% 12.3% 0.7%
0.0%
5.0%
10.0%
15.0%
20.0%
25.0%
30.0%
35.0%
40.0%
Who do you perceive as the innovation leader for Application Delivery Controllers?

21
Application Delivery Controller Brand Leader Survey Data: 2014 vs. 2013
Application Delivery Controllers A10 Barracuda Brocade Cisco Citrix F5
For4net/ Coyote Point
Radware Riverbed Other Total
2014 Market Leader 3.9% 5.9% 8.8% 38.2% 27.5% 2.9% 2.0% 10.8% 0.0% 100% Price Leader 5.9% 12.8% 9.8% 31.4% 19.6% 5.9% 0.0% 13.7% 1.0% 100% Performance Leader 2.9% 6.9% 10.8% 32.4% 26.5% 2.9% 2.9% 13.7% 1.0% 100% Reliability Leader 4.9% 5.9% 11.8% 37.3% 25.5% 3.9% 1.0% 8.8% 1.0% 100%
Service & Support Leader 3.9% 8.8% 7.8% 37.3% 27.5% 2.9% 2.0% 8.8% 1.0% 100%
Innovation Leader 3.9% 5.9% 7.8% 34.3% 27.5% 2.9% 2.9% 13.7% 1.0% 100% 2013 Market Leader 2.9% 5.8% 7.2% 18.8% 29.0% 22.5% 0.0% 2.9% 10.9% 0.0% 100% Price Leader 7.2% 15.9% 7.2% 18.1% 27.0% 9.4% 0.0% 6.5% 8.7% 0.0% 100% Performance Leader 5.8% 5.8% 8.0% 20.3% 28.2% 18.1% 0.0% 5.1% 8.7% 0.0% 100% Reliability Leader 5.1% 5.1% 8.7% 23.2% 24.7% 18.1% 1.4% 1.4% 12.3% 0.0% 100%
Service & Support Leader 2.9% 7.2% 9.4% 21.7% 26.1% 17.4% 2.2% 2.2% 10.9% 0.0% 100%
Innovation Leader 3.6% 7.2% 9.4% 20.3% 25.5% 16.7% 1.4% 2.9% 12.3% 0.7% 100%

IT Brand Pulse
22
IT Brand Pulse, Inc. is an analyst firm and trusted source of product testing, IT Pro research, and analysis covering data center infrastructure including servers, storage, networking, operating platforms and applications. IT Brand Pulse is also the publisher of World’s Top Data Centers, the superstore for vital statistics about data centers around the world. Learn more at www.itbranddpulse.com and www.worldstopdatacenters.com.
Cheryl Parker , Director and Senior Analyst, End User Research Cheryl Parker oversees the IT Pro Research practice for IT Brand Pulse. Cheryl and her team conduct IT Brand Leader, technology adoption, and customer satisfaction surveys, as well as focus groups and custom research. Cheryl has spent more than 25 years in communications, research, PR, marketing and sales, and is a former reporter and sportswriter for the Los Angeles Times. You can reach Cheryl at [email protected]
The Author