application example: quality control injection molding: quality
TRANSCRIPT
Copyright © 2008 GOM mbH All rights reserved! Rev. A (en) 03042008 www.gom.com 1
Application Example: Quality Control
Injection Molding: Quality Control in plastic blow molding
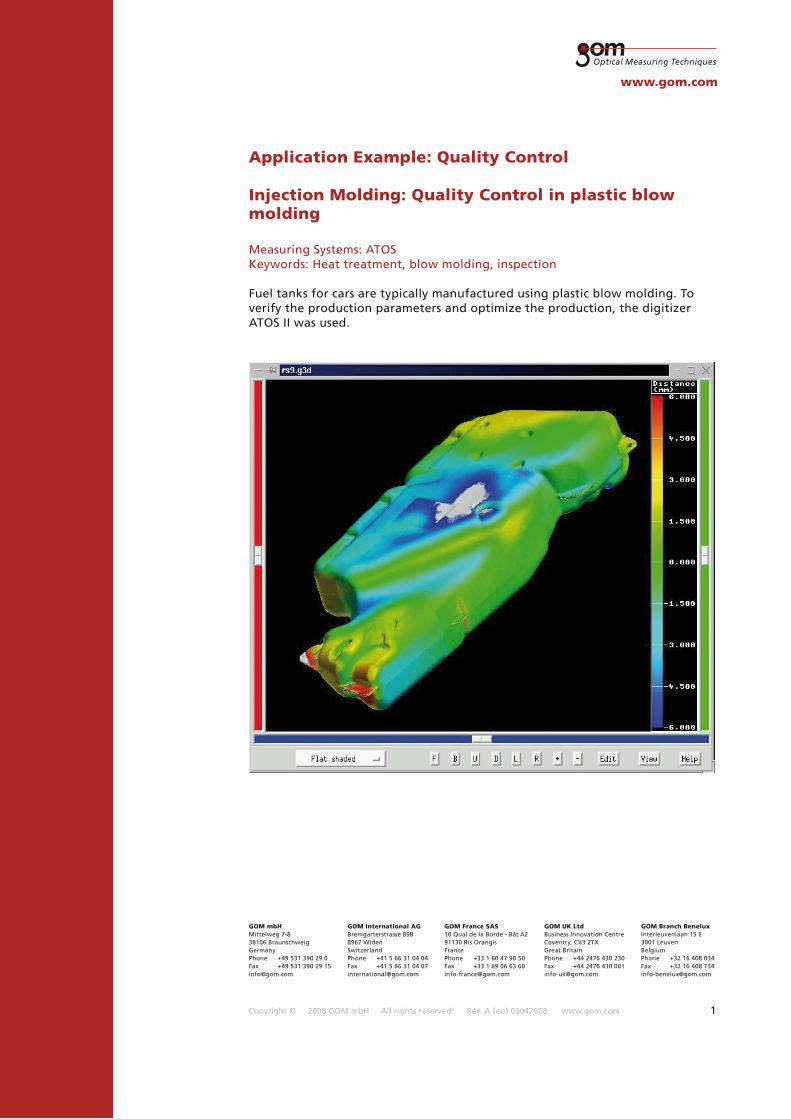
Measuring Systems: ATOSKeywords: Heat treatment, blow molding, inspection Fuel tanks for cars are typically manufactured using plastic blow molding. To verify the production parameters and optimize the production, the digitizer ATOS II was used.
GOM mbHMittelweg 7-838106 BraunschweigGermanyPhone +49 531 390 29 0Fax +49 531 390 29 [email protected]
GOM Branch BeneluxInterleuvenlaan 15 E3001 LeuvenBelgiumPhone +32 16 408 034Fax +32 16 408 [email protected]
GOM International AGBremgarterstrasse 89B8967 WidenSwitzerlandPhone +41 5 66 31 04 04Fax +41 5 66 31 04 [email protected]
GOM France SAS10 Quai de la Borde - Bât A291130 Ris OrangisFrancePhone +33 1 60 47 90 50Fax +33 1 69 06 63 [email protected]
GOM UK LtdBusiness Innovation CentreCoventry, CV3 2TXGreat BritainPhone +44 2476 430 230Fax +44 2476 430 [email protected]
www.gom.com
Copyright © 2008 GOM mbH All rights reserved! Rev. A (en) 03042008 www.gom.com 2
Quality Control / Injection Molding
Quality Control in plastic blow molding
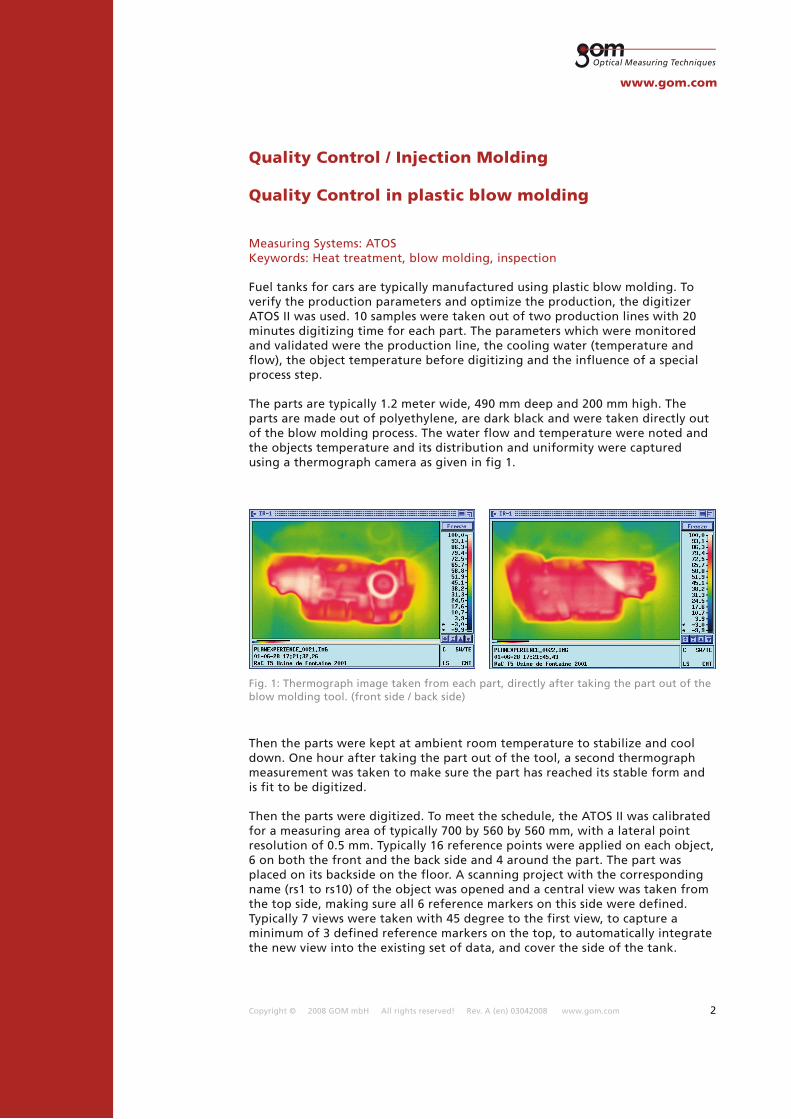
Fig. 1: Thermograph image taken from each part, directly after taking the part out of the blow molding tool. (front side / back side)
www.gom.com
Measuring Systems: ATOSKeywords: Heat treatment, blow molding, inspection
Fuel tanks for cars are typically manufactured using plastic blow molding. To verify the production parameters and optimize the production, the digitizer ATOS II was used. 10 samples were taken out of two production lines with 20 minutes digitizing time for each part. The parameters which were monitored and validated were the production line, the cooling water (temperature and flow), the object temperature before digitizing and the influence of a special process step.
The parts are typically 1.2 meter wide, 490 mm deep and 200 mm high. The parts are made out of polyethylene, are dark black and were taken directly out of the blow molding process. The water flow and temperature were noted and the objects temperature and its distribution and uniformity were captured using a thermograph camera as given in fig 1.
Then the parts were kept at ambient room temperature to stabilize and cool down. One hour after taking the part out of the tool, a second thermograph measurement was taken to make sure the part has reached its stable form and is fit to be digitized.
Then the parts were digitized. To meet the schedule, the ATOS II was calibrated for a measuring area of typically 700 by 560 by 560 mm, with a lateral point resolution of 0.5 mm. Typically 16 reference points were applied on each object, 6 on both the front and the back side and 4 around the part. The part was placed on its backside on the floor. A scanning project with the corresponding name (rs1 to rs10) of the object was opened and a central view was taken from the top side, making sure all 6 reference markers on this side were defined. Typically 7 views were taken with 45 degree to the first view, to capture a minimum of 3 defined reference markers on the top, to automatically integrate the new view into the existing set of data, and cover the side of the tank.
Copyright © 2008 GOM mbH All rights reserved! Rev. A (en) 03042008 www.gom.com 3
www.gom.com
Then the part was turned around (placed on its front side) and a new project, down, was opened. Once again, a central view was taken and typically 7 views were taken to get the front and the side covered completely. The reference points on the side of the object were used to combine the front and the down project. Finally the combined project was registered to the Master CAD data to have all scanning data in the Master coordinate system. Then it was time to relax one minute and wait for the next object.
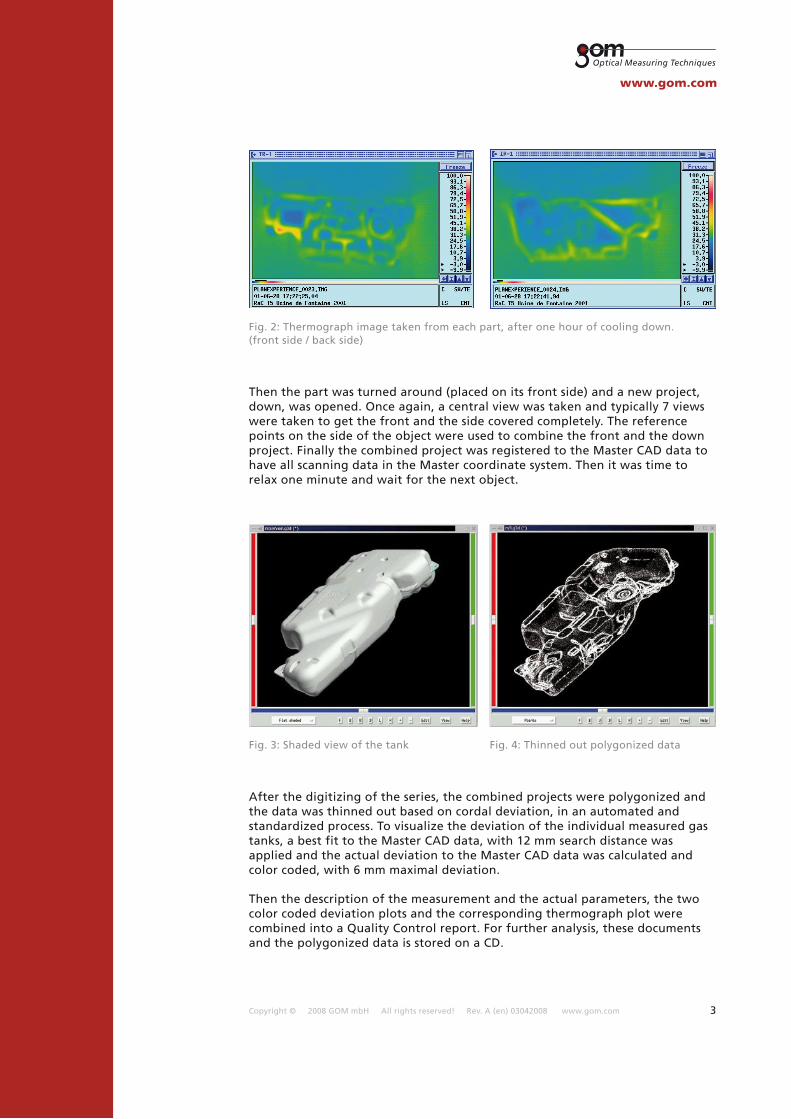
Fig. 2: Thermograph image taken from each part, after one hour of cooling down. (front side / back side)
Fig. 3: Shaded view of the tank Fig. 4: Thinned out polygonized data
After the digitizing of the series, the combined projects were polygonized and the data was thinned out based on cordal deviation, in an automated and standardized process. To visualize the deviation of the individual measured gas tanks, a best fit to the Master CAD data, with 12 mm search distance was applied and the actual deviation to the Master CAD data was calculated and color coded, with 6 mm maximal deviation.
Then the description of the measurement and the actual parameters, the two color coded deviation plots and the corresponding thermograph plot were combined into a Quality Control report. For further analysis, these documents and the polygonized data is stored on a CD.
Copyright © 2008 GOM mbH All rights reserved! Rev. A (en) 03042008 www.gom.com 4
www.gom.com
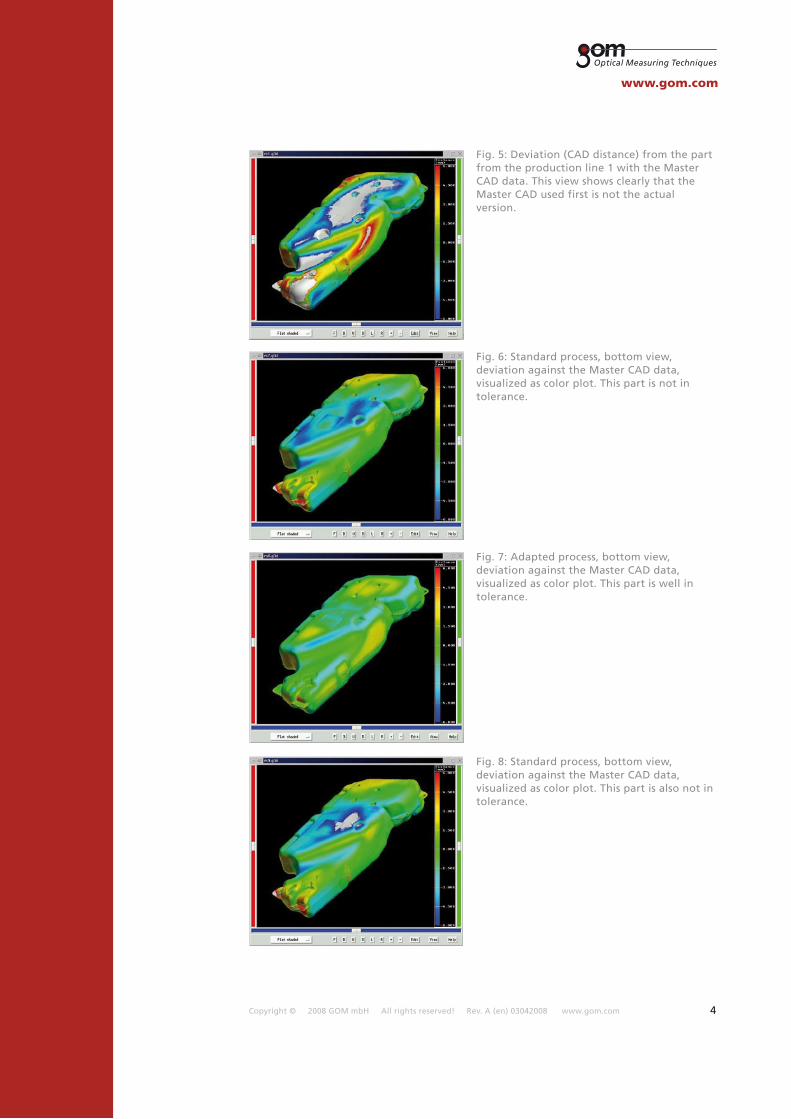
Fig. 5: Deviation (CAD distance) from the part from the production line 1 with the Master CAD data. This view shows clearly that the Master CAD used first is not the actual version.
Fig. 6: Standard process, bottom view, deviation against the Master CAD data, visualized as color plot. This part is not in tolerance.
Fig. 7: Adapted process, bottom view, deviation against the Master CAD data, visualized as color plot. This part is well in tolerance.
Fig. 8: Standard process, bottom view, deviation against the Master CAD data, visualized as color plot. This part is also not in tolerance.
Copyright © 2008 GOM mbH All rights reserved! Rev. A (en) 03042008 www.gom.com 5
www.gom.com
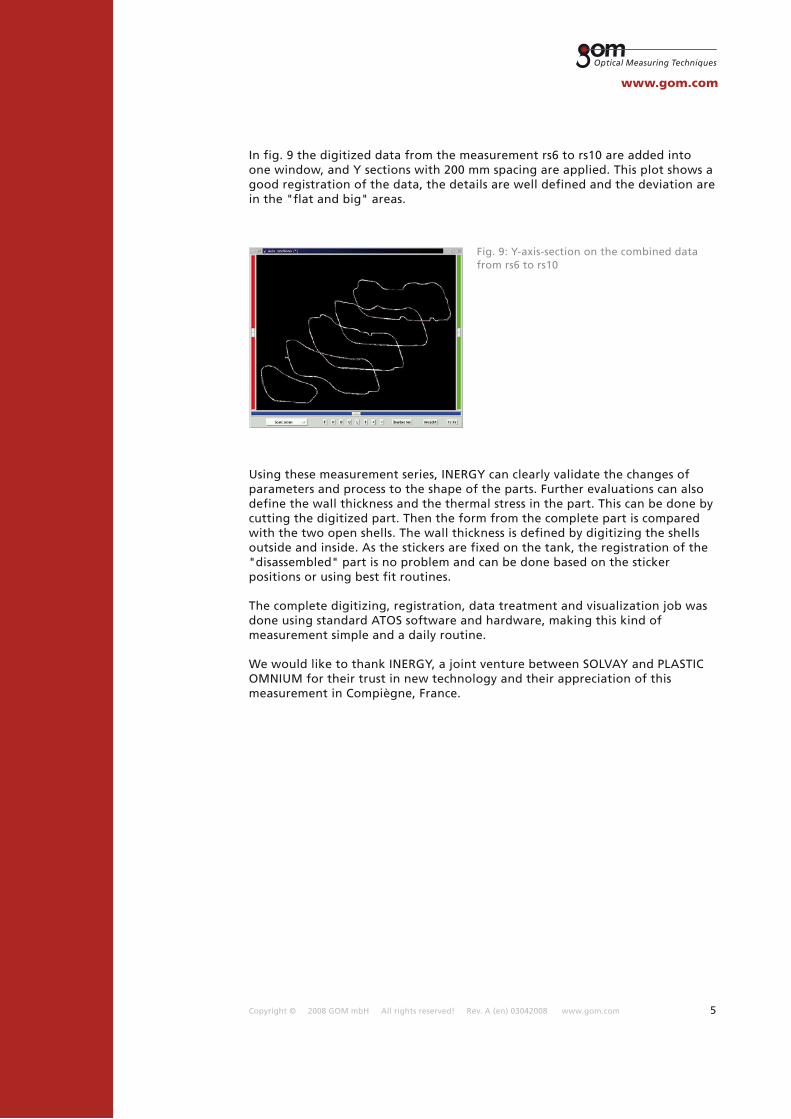
In fig. 9 the digitized data from the measurement rs6 to rs10 are added into one window, and Y sections with 200 mm spacing are applied. This plot shows a good registration of the data, the details are well defined and the deviation are in the "flat and big" areas.
Using these measurement series, INERGY can clearly validate the changes of parameters and process to the shape of the parts. Further evaluations can also define the wall thickness and the thermal stress in the part. This can be done by cutting the digitized part. Then the form from the complete part is compared with the two open shells. The wall thickness is defined by digitizing the shells outside and inside. As the stickers are fixed on the tank, the registration of the "disassembled" part is no problem and can be done based on the sticker positions or using best fit routines.
The complete digitizing, registration, data treatment and visualization job was done using standard ATOS software and hardware, making this kind of measurement simple and a daily routine.
We would like to thank INERGY, a joint venture between SOLVAY and PLASTIC OMNIUM for their trust in new technology and their appreciation of this measurement in Compiègne, France.
Fig. 9: Y-axis-section on the combined data from rs6 to rs10