application note 28-9806-80 aa chromatography …...imagination at work application note 28-9806-80...
TRANSCRIPT

imagination at work
Application note 28-9806-80 AA Chromatography columns
Process scale-up from HiScreen™ to HiScale™ columnsIn this study two capture purification steps were scaled up from HiScreen to HiScale columns in order to evaluate process reproducibility and robustness. The two media used, MabSelect SuRe™ and Capto™ Q showed strong reproducibility and high yield (> 96%) during scale-up, demonstrating the excellent performance and consistency of HiScreen and HiScale columns as well as the BioProcess™ media.
IntroductionMethod development for protein purification processes is preferably done at small scale due to both convenience and time. The aim of method development is typically to obtain a robust, scalable process with the highest possible throughput at the lowest cost without compromising with the product quality.
The pressure stable HiScale column family was developed for preparative purification and process development, providing compatibility with modern, high-performance bioprocess media, making this column format especially suited for scale-up experiments.
Two scale-up experiments were performed: The first application was a capture purification step of monoclonal IgG loaded onto a column packed with MabSelect SuRe, where the process was scaled up from small-scale HiScreen columns to HiScale 16/40 columns. The second application was an anion exchange chromatography capture step of green fluorescent protein (GFP) on Capto Q using the same column formats.
Materials and methodsUNICORN™ control software was used to create the experimental methods. The application on MabSelect SuRe was run on an ÄKTAexplorer™ system using UNICORN 5.1 software while the Capto Q application was run on an ÄKTA™ avant 25 system using UNICORN 6.0. Tables 1 and 2 summarize the chromatography methods used in the two experiments.
Antibody capture using MabSelect SuReFor the MabSelect SuRe experiment a CHO cell supernatant was used with an IgG concentration of 0.8 mg/ml. The feed was pH neutralized with 0.5 M Na2PO4 and filtrated through a 0.2 µm filter (Sarstedt) before the sample was loaded on an ÄKTAexplorer 100 chromatographic system.
The protein concentration and host cell proteins (HCP) removal were measured by using a CHO cell assay in CD format (Gyrolab Bioaffy™ 200). The columns used were two prepacked HiScreen MabSelect SuRe connected in series, to a total of 20 cm bed height, and a HiScale 16/40 packed with MabSelect SuRe to a bed height of 21.2 cm.
GFP capture using Capto QIn the Capto Q scale-up experiment, GFP from clarified Escherichia coli homogenate was used as a model protein. The start material had a GFP concentration of 4 mg/ml and was filtered through a 0.45 µm filter (Sarstedt) before being loaded onto the columns.
The protein concentration was determined by spectrophotometric measurements at the absorbance maximum for GFP (490 nm). For assessment of protein purity, Coomassie™ stained SDS-PAGE under reducing conditions (ExcelGel SDS, gradient 8-18) was used. The columns used were two prepacked HiScreen Capto Q connected in series (20 cm bed height) and a HiScale 16/40 packed with Capto Q to a bed height of 20.8 cm.
GE HealthcareLife Sciences
2 28-9806-80 AA
Table 2. Methods used for capture of GFP on Capto Q
Step Duration Buffer Linear flow (cm/h) Comment
Equilibration 6 CV 50 mM Tris, pH 8.2 600
Load 425/1840 ml N/A 300 Residence time: 4 min Load 18 mg/ml
Elution, step gradient
8 CV 10% B 6 CV 33% B 4 CV 100% B
50 mM Tris pH 8.2 (A buffer) 50 mM Tris, pH 8.2 + 1 M sodium chloride (B buffer)
600 Peak fractionation between 300 mAU and 300 mAU at 490 nm
CIP 7 CV 1 M sodium hydroxide 200 Total contact time: 43 min
Re-equilibration 5 CV 50 mM Tris, pH 8.2 + 1 M sodium chloride
600 Until stable pH is reached
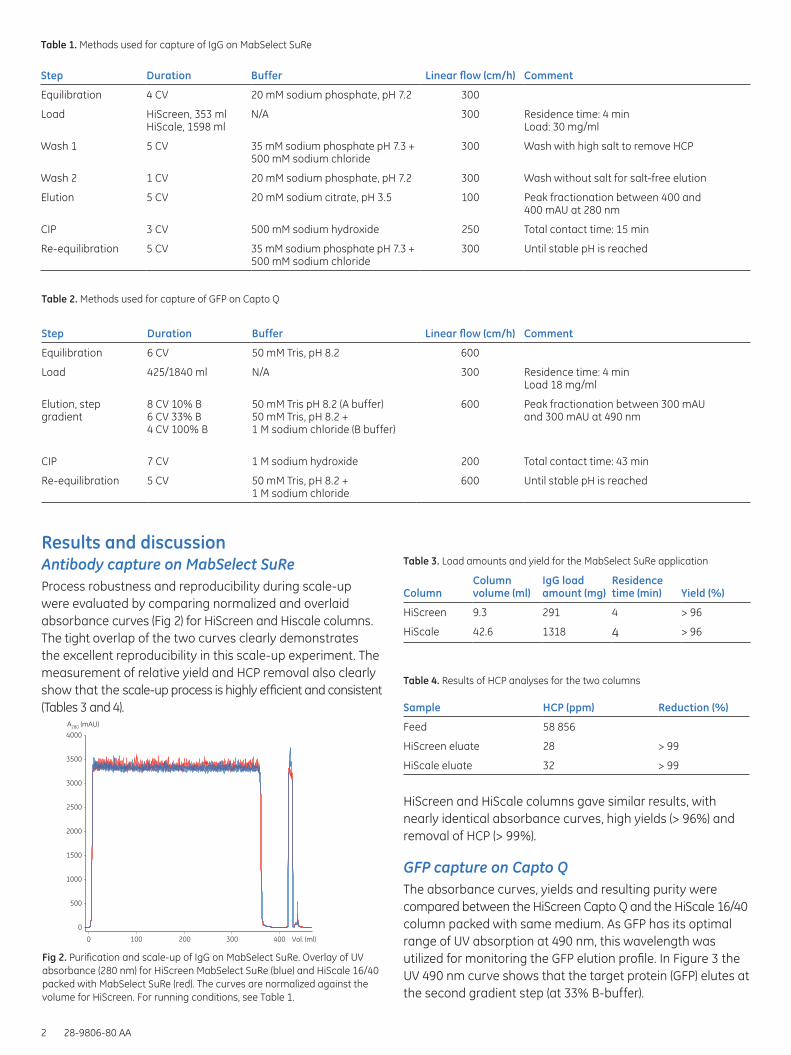
Fig 2. Purification and scale-up of IgG on MabSelect SuRe. Overlay of UV absorbance (280 nm) for HiScreen MabSelect SuRe (blue) and HiScale 16/40 packed with MabSelect SuRe (red). The curves are normalized against the volume for HiScreen. For running conditions, see Table 1.
4000
3500
3000
2500
2000
1500
1000
500
0
0 100 200 300 400 Vol. (ml)
A280 (mAU)
Table 1. Methods used for capture of IgG on MabSelect SuRe
Step Duration Buffer Linear flow (cm/h) Comment
Equilibration 4 CV 20 mM sodium phosphate, pH 7.2 300
Load HiScreen, 353 ml HiScale, 1598 ml
N/A 300 Residence time: 4 min Load: 30 mg/ml
Wash 1 5 CV 35 mM sodium phosphate pH 7.3 + 500 mM sodium chloride
300 Wash with high salt to remove HCP
Wash 2 1 CV 20 mM sodium phosphate, pH 7.2 300 Wash without salt for salt-free elution
Elution 5 CV 20 mM sodium citrate, pH 3.5 100 Peak fractionation between 400 and 400 mAU at 280 nm
CIP 3 CV 500 mM sodium hydroxide 250 Total contact time: 15 min
Re-equilibration 5 CV 35 mM sodium phosphate pH 7.3 + 500 mM sodium chloride
300 Until stable pH is reached
Results and discussionAntibody capture on MabSelect SuReProcess robustness and reproducibility during scale-up were evaluated by comparing normalized and overlaid absorbance curves (Fig 2) for HiScreen and Hiscale columns. The tight overlap of the two curves clearly demonstrates the excellent reproducibility in this scale-up experiment. The measurement of relative yield and HCP removal also clearly show that the scale-up process is highly efficient and consistent (Tables 3 and 4).
Table 3. Load amounts and yield for the MabSelect SuRe application
ColumnColumn volume (ml)
IgG load amount (mg)
Residencetime (min) Yield (%)
HiScreen 9.3 291 4 > 96
HiScale 42.6 1318 4 > 96
Table 4. Results of HCP analyses for the two columns
Sample HCP (ppm) Reduction (%)
Feed 58 856
HiScreen eluate 28 > 99
HiScale eluate 32 > 99
HiScreen and HiScale columns gave similar results, with nearly identical absorbance curves, high yields (> 96%) and removal of HCP (> 99%).
GFP capture on Capto QThe absorbance curves, yields and resulting purity were compared between the HiScreen Capto Q and the HiScale 16/40 column packed with same medium. As GFP has its optimal range of UV absorption at 490 nm, this wavelength was utilized for monitoring the GFP elution profile. In Figure 3 the UV 490 nm curve shows that the target protein (GFP) elutes at the second gradient step (at 33% B-buffer).

28-9806-80 AA 3
Fig 3. Purification and scale-up of GFP on Capto Q chromatography medium. The figure is an overlay of UV absorbance (490 nm) for HiScreen Capto Q (blue), HiScale 16/40 packed with Capto Q (red). The green line shows % B-buffer during elution. For running conditions, see Table 2.
2500
2000
1500
1000
500
0
0 50 100 150 200 250
A490 (mAU)
min
The result from both scales show that the UV 490 curves match each other well and the yields are also equivalent (> 97%; Table 5).
Lanes1. LMW2. HiScreen FT3. HiScreen 10% B4. HiScreen 33% B (1:10)5. HiScreen 100% B6. Feed
7. Feed (1:5)8. HiScale FT9. HiScale 10% B10. HiScale 33% B (1:10)11. HiScale 100% B12. LMW
Fig 5. SDS-PAGE under reducing conditions (ExcelGel SDS, gradient 8-18), Coomassie stained.
kDa
97
66
45
30
20.1
14.4
1 2 3 4 5 6 7 8 9 10 11 12
Samples from feed, flowthrough and all elution steps were run on an SDS-PAGE gel in order to compare purity (Fig 5). Most of the GFP was located in gradient eluate 33% B (lane 4 for HiScreen and lane 10 for HiScale). The electrophoresis gel shows that there are traces of other protein bands left in the eluted fraction, as expected for an anion exchange capture step.
The overlay in Figure 4 shows that the UV 280 curves from running HiScreen and HiScale match each other well and that proteins other than GFP were eluted both during flowthrough and all three elution steps.
2500
2000
1500
1000
500
0
A280 (mAU)
0 50 100 150 200 250 min
Fig 4. Purification and scale-up of GFP on Capto Q chromatography medium. The figure is an overlay of UV absorbance (280 nm) for HiScreen Capto Q (blue) and HiScale 16/40 packed with Capto Q (red). The green line shows % B-buffer during elution.
ConclusionsThe results for both MabSelect SuRe and Capto Q show that when scaling up from HiScreen format to HiScale, reproducibility is excellent and yields were high (> 96% for IgG on MabSelect SuRe and > 97% for GFP on Capto Q). The results are almost identical at the two scales for both applications. Capture of IgG on MabSelect SuRe gave a very high removal of HPC (> 99%). The purification factor of GFP in the capture on the anion exchanger was aslo high, but as expected, not as high as for the MAb application.
Table 5. Load amounts and yield for the Capto Q experiment
ColumnColumn volume (ml)
GFP load amount (g)
Residencetime (min) Yield (%)
HiScreen 9.3 150 4 > 97
HiScale 40.8 753 4 > 97

4 28-9806-80 AA
imagination at work
GE, imagination at work, and GE monogram are trademarks of General Electric Company.
ÄKTA, ÄKTAexplorer, BioProcess, Capto, HiScale, HiScreen, HiTrap, MabSelect SuRe, and UNICORN are trademarks of GE Healthcare companies. All third party trademarks are the property of their respective owners.
© 2011 General Electric Company—All rights reserved. First published Jan. 2011.
All goods and services are sold subject to the terms and conditions of sale of the company within GE Healthcare which supplies them. A copy of these terms and conditions is available on request. Contact your local GE Healthcare representative for the most current information.
GE Healthcare UK Limited Amersham Place Little Chalfont Buckinghamshire, HP7 9NA UK
GE Healthcare Europe, GmbH Munzinger Strasse 5 D-79111 Freiburg Germany
GE Healthcare Bio-Sciences Corp. 800 Centennial Avenue, P.O. Box 1327 Piscataway, NJ 08855-1327 USA
GE Healthcare Japan Corporation Sanken Bldg., 3-25-1, Hyakunincho Shinjuku-ku, Tokyo 169-0073 Japan
For local office contact information, visit www.gelifesciences.com/contact
www.gelifesciences.com/hiscale
GE Healthcare Bio-Sciences ABBjörkgatan 30751 84 UppsalaSweden
28-9806-80 AA 01/2011
Ordering informationProduct Code no.
ÄKTA avant 25 28-9308-42
ÄKTAexplorer 100 18-1112-41
HiScreen MabSelect SuRe 28-9269-77
HiScreen Capto Q 28-9269-78
HiScale 16/40 28-9644-24