application note analyzing in vitro results for the 5-ht ... · analyzing in vitro results for the...
TRANSCRIPT

Analyzing In Vitro Results for the 5-HT Ligands
REACHING A DEEPER UNDERSTANDING OF LIGAND–RECEPTOR INTERACTIONS Effective drug discovery depends on a deep understanding of the function and therapeutic potential of a compound as well as a clear picture of the chemical structure and druggability of the compound. Using the example of serotonin receptors, this application note looks at how in vitro data from Reaxys® Medicinal Chemistry facilitate such studies on the interface of biology and chemistry.
APPLICATION NOTE

2
The study of serotonin (5-HT) receptor pharmacology has been and remains an area of major interest for pharmaceutical research. Indeed, in the last 50 years, drugs directly or indirectly targeting these receptors have emerged as important therapeutic agents, providing treatments for a broad range of clinical conditions.
Many different serotonin receptor subtypes have been described in the literature (1, 2). The 5-HT1, 5-HT2, 5-HT4, 5-HT5, 5-HT6 and 5-HT7 receptor families all belong to the G-protein-coupled receptor (GPCR) class A superfamily (3). The 5-HT1 receptor family is one of the most complex in terms of molecular diversity and pharmacological interactions. Selective 5-HT1B/1D receptor agonists, such as sumatriptan and rizatriptan, have established a new standard in the acute treatment of migraine headaches.
Unlike other serotonin receptors, the 5-HT3 receptor is not a GPCR but a ligand-gated ion channel. Its ligands have been extensively studied. Selective antagonists at 5-HT3 receptors have transformed cancer therapy by preventing chemotherapy- and radiation-induced emesis. The most popular compounds in this category are ondansetron and tropisetron.
A systematic examination of the in vitro results and pharmacological properties for agonists and ligands for the 5-HT receptor families could reveal even broader possibilities for their therapeutic application. This study was performed to illustrate a potential methodology for such an examination.
ANALYTICAL METHODAll of the bioactivity data were retrieved using Reaxys Medicinal Chemistry. Data were initially viewed using the Heatmap and Analysis View in the web-based user interface. Then, all details on the bioactivity data were exported into Microsoft® Excel® for further manipulation. Queries focused on three members of the 5-HT receptor family: 5-HT1B, 5-HT1D and 5-HT3. Table 1 shows the overall Reaxys Medicinal Chemistry statistics on these sub-families.
A systematic look at 5-HT receptor family ligands could reveal even broader possibilities for their therapeutic application.
Table 1. Statistics on the 5-HT receptor data in Reaxys Medicinal Chemistry. 5-HT variants, isoforms and mutants are included. Valid as of August 2015.
TargetNumber of bioactivities
Number of substances
Number of bioactivities with pX > 7
Number of substances with pX > 7
5-HT all 531,564 153,560 126,550 57,447
5-HT1B 23,231 13,006 4,154 2,280
5-HT1D 26,790 13,526 5,645 3,060
5-HT3 27,416 15,457 5,678 2,890

3
Figure 1. The Heatmap for inhibitors of all of the5-HT receptors with pX > 7.0 (affinity < 100 nM)
To facilitate comparisons of bioactivity data from different publications and assay types, all in vitro data points in Reaxys Medicinal Chemistry have pX values. pX values are calculated by transforming parameters such as EC50, IC50 and Ki into the –Log equivalent (pEC50, pIC50, pKi). These are normalized values assigned to the data that enable easy quantification of compound–target affinity and comparison of information from all around the world.
Initially, the most active molecules against the targets had to be identified. Then, all of the biological responses could be analyzed in detail, focusing particularly on species and the organ, tissue or cell lines used as biological material. The affinities or activities reported in second messenger, isolated organ or electrophysiological protocols were also analyzed and correlated.
By setting the pX values at > 7 (affinity < 100 nM for IC50 or Ki values) and focusing on the most popular in vitro protocols (i.e., binding and second messenger for the GPCRs 5-HT1B and 5-HT1D; and binding and electrophysiology for the ion channel 5-HT3), the most active molecules could be retrieved with the help of the Reaxys Medicinal Chemistry Heatmap (Figure 1). The Heatmap visualizes the relationships between compounds and their targets in terms of key parameters, allowing rapid identification of relevant compound–target interactions. The highest pX values were selected for display in the Heatmap.
In the Heatmap, biological affinities or activities are quantified as a pX value and displayed from 1 (low activity) in blue to 15 (high activity) in red. The color of the Heatmap cells represents the maximal pX retrieved for a given compound (row) against a given target (column). The thumbnail provides an overview of the entire Heatmap with a panel highlighting the section of the map currently displayed on the screen. The data density display enables analyses of the dataset, such as an examination of the number of compounds retrieved per target.

4
THE AFFINITY OF TRIPTANS FOR 5-HT SUBTYPESThe key reference drugs of the 5-HT1B/D agonist sub-family of the triptans are almotriptan, naratriptan, rizatriptan and sumatriptan. The full activity profile for these drugs is visualized in a Heatmap (Figure 2). Extensive data are available on sumatriptan and the Heatmap clearly displays the selectivity profile of that drug.
Figure 2. The Heatmap showing the full affinity/activity profile for sumatriptan, rizatriptan, naratriptan and almotriptan (in order of appearance down the left hand column)

5
The pX values for almotriptan, naratriptan, rizatriptan and sumatriptan for 5-HT1A, 5-HT1B, 5-HT1D, 5-HT1E, 5-HT1F, 5-HT6 and 5-HT7 were selected using Analysis View and viewed as a Heatmap (Figure 3).
Figure 3. A Analysis View was used to filter the Heatmap by target. B The Heatmap showing the affinity/activity profile (pX values) for selected 5-HT subtypes for sumatriptan, rizatriptan, naratriptan and almotriptan (in order of appearance down the left hand column).
A
B

6
A large number of binding data points are available for naratriptan, rizatriptan and particularly for sumatriptan against all of the targets selected, especially the 5-HT1B and 5-HT1D receptors (Figure 4). pX values extracted from the literature show a large variation, especially for sumatriptan against the 5-HT1B and 5-HT1D receptors.
Figure 4. Some Binding affinities of the selected triptans against the 5-HT subtypes. Each binding point represents a pX value extracted from publications or patents.
3
4
5
6
7
8
9
10
5-‐HT 1a 5-‐HT 1b 5-‐HT 1d 5-‐HT 1e 5-‐HT 1f 5-‐HT 6 5-‐HT 7
pX Value
s
Sumatriptan
3
4
5
6
7
8
9
10
5-‐HT 1a 5-‐HT 1b 5-‐HT 1d 5-‐HT 1e 5-‐HT 1f 5-‐HT 6 5-‐HT 7
pX Value
s
Rizatriptan
3
4
5
6
7
8
9
10
5-‐HT 1a 5-‐HT 1b 5-‐HT 1d 5-‐HT 1e 5-‐HT 1f 5-‐HT 6 5-‐HT 7
pX Value
s
Naratriptan
3
4
5
6
7
8
9
10
5-‐HT 1a 5-‐HT 1b 5-‐HT 1d 5-‐HT 1e 5-‐HT 1f 5-‐HT 6 5-‐HT 7
pX Value
s Almotriptan

7
The large number of data points available for sumatriptan on 5-HT1B resulted in significant differences in reported pX values. Differences in the experimental conditions under which these data were obtained could explain the discrepancies. Figure 5 illustrates the analysis of these data points by receptor species and by human cell line used in the assay.
Figure 5. Binding affinities, expressed in pX values, of sumatriptan for 5-HT1B subtypes. The top chart displays the affinities according to the different target protein species. The bottom chart shows how the human binding data is spread out depending on the cell line used.
3
4
5
6
7
8
9
10
Cavia porcellus Gorilla Human Rabbit Rat
pX Value
s
Sumatriptan 5-‐HT1B Binding Data by Species
3
4
5
6
7
8
9
10
C6 CHO COS HEK Hela L929sA Others
pX Value
s
Sumatriptan 5-‐HT1B Human Binding Data by Cell Line
8
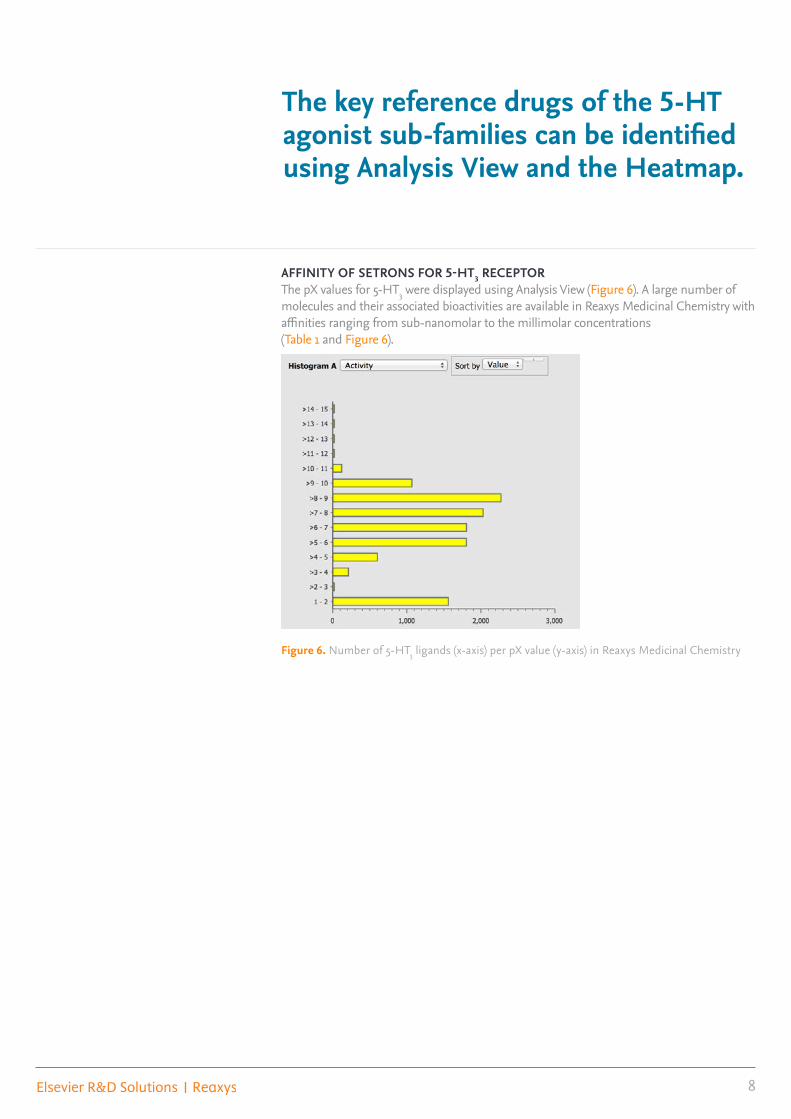
AFFINITY OF SETRONS FOR 5-HT3 RECEPTORThe pX values for 5-HT3 were displayed using Analysis View (Figure 6). A large number of molecules and their associated bioactivities are available in Reaxys Medicinal Chemistry with affinities ranging from sub-nanomolar to the millimolar concentrations (Table 1 and Figure 6).
The key reference drugs of the 5-HT agonist sub-families can be identified using Analysis View and the Heatmap.
Figure 6. Number of 5-HT3 ligands (x-axis) per pX value (y-axis) in Reaxys Medicinal Chemistry

9
The key reference drugs of the 5-HT3 agonist sub-family of the setrons are bemesetron, tropisetron and ondansetron. The full activity profile for these drugs is visualized in a Heatmap. The compound details could be assessed in detail in the “Substances” tab and data were exported for further exploration (Figure 7).
Figure 7. A. The Heatmap showing the full affinity/activity profile for bemesetron, tropisetron and ondansetron (in order of appearance down the left hand column). B. Full details on each drug can be explored using the “Substances” tab.
A
B
10
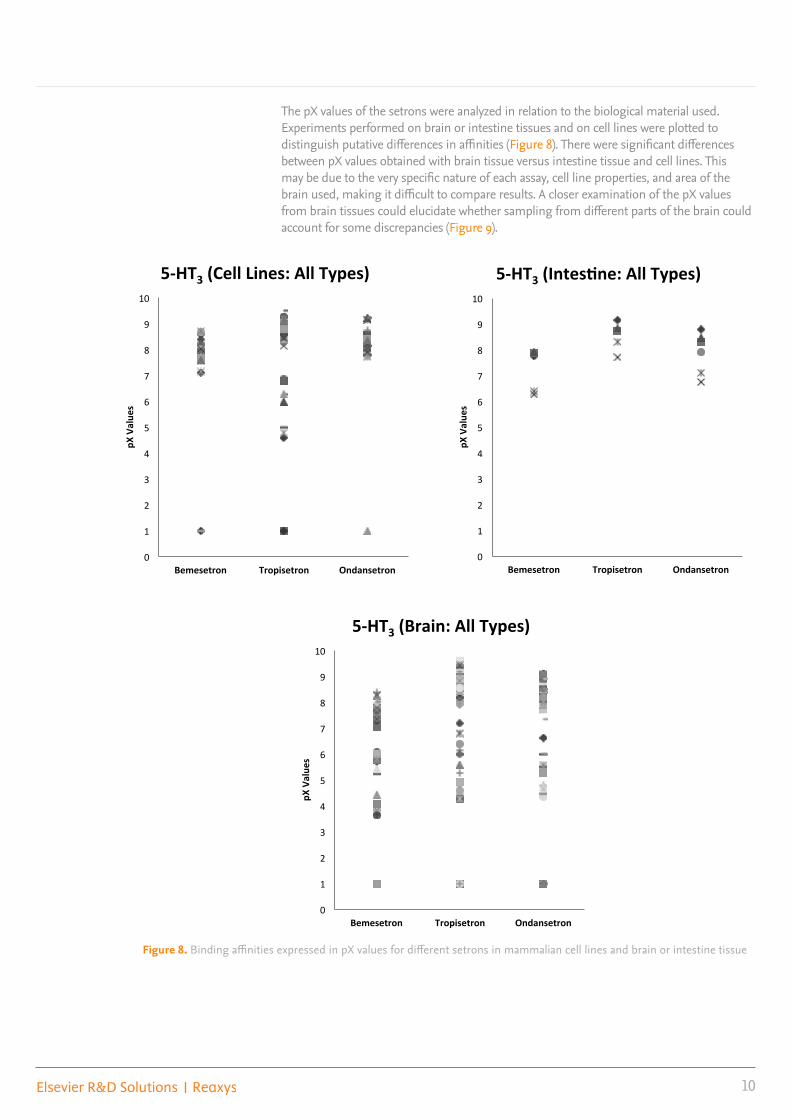
The pX values of the setrons were analyzed in relation to the biological material used. Experiments performed on brain or intestine tissues and on cell lines were plotted to distinguish putative differences in affinities (Figure 8). There were significant differences between pX values obtained with brain tissue versus intestine tissue and cell lines. This may be due to the very specific nature of each assay, cell line properties, and area of the brain used, making it difficult to compare results. A closer examination of the pX values from brain tissues could elucidate whether sampling from different parts of the brain could account for some discrepancies (Figure 9).
0
1
2
3
4
5
6
7
8
9
10
Bemesetron Tropisetron Ondansetron
pX Value
s
5-‐HT3 (Cell Lines: All Types)
0
1
2
3
4
5
6
7
8
9
10
Bemesetron Tropisetron Ondansetron
pX Value
s
5-‐HT3 (Intes:ne: All Types)
0
1
2
3
4
5
6
7
8
9
10
Bemesetron Tropisetron Ondansetron
pX Value
s
5-‐HT3 (Brain: All Types)
Figure 8. Binding affinities expressed in pX values for different setrons in mammalian cell lines and brain or intestine tissue

11
CHEMICAL SPACES ASSOCIATED WITH 5-HT LIGANDSA principal components analysis (PCA) was performed to show the chemical space covered by 5-HT ligands. Succinctly, PCA reduces the dimensionality of data, which is useful for graphical visualization. PCA latent variables were computed from 12 Burden eigenvalue (BCUT) descriptors using the MOE cheminformatic suite (4). These bi-dimensional descriptors incorporate both connectivity and atomic properties (atomic charge, polarizability and hydrogen bond abilities) that are relevant to intermolecular interactions.
Figure 10 displays a 3D-projection based on the first three PCAs for 803 unique 5-HT3 active structures. The resulting chemical space is relatively dispersed, reflecting the heterogeneity of chemical structures.
The same analysis was performed on active and selective 5-HT1B and 5-HT1D ligands to determine their corresponding chemical space boundaries (Figure 11). All molecules selected exhibited an affinity or activity below 200 nM and molecules that are active on both 5-HT1B and 5-HT1D were discarded. Figure 11 shows the clear overlap in space and limited regions that are more populated by either 5-HT1B or 5-HT1D ligands.
Figure 9. Binding affinities expressed in pX values for different setrons in various brain tissues
0
1
2
3
4
5
6
7
8
9
10
Brain Brain: cerebellum
Brain: cortex Brain: cortex entorhinal
Brain: cortex frontal
Brain: hippocampus
Brain: Other
pX Value
s
5-‐HT3 (Brain: Various Types)

12
OOH
O
OH
O
O
N
O
O N
O
O
N
O
N NHN
N NN
O
NH2 N
NH
N
NH
N
S
O
N+
OH
O O
NH+
OOH
NH2
NH
NH
Cl
F
FF
5 -HT3
Figure 10. Chemical space of a set of active 5-HT3 ligands determined by principal component analysis (PCA) using MOE chemical descriptors. Ligands were selected on the basis of biological responses available in binding or electrophysiology protocols with EC50, IC50 or Ki < 200 nM. A few specific structures are included as examples.
Figure 11. The chemical space for a set of active and selective 5-HT1B and 5-HT1D ligands determined by principal component analysis using MOE chemical descriptors. Ligands were selected on the basis of biological responses available in binding or second messenger protocols with EC50, IC50 or Ki < 200 nM on one target and > 700 nM for the other. 5-HT1B are in red and 5-HT1D in blue.
5 -HT1B5 -HT1D

13
Note: This application note is for illustrative purposes only: the information in this report should not be referenced or relied upon as a basis for further research and development.
DISCUSSIONAccessing detailed experimental data on the bioactivity of substances grants insights into the influences of protocol conditions on affinity/activity measurements. The examples examined in this paper highlight a significant spread in affinity measurements for both 5-HT1B/D and 5-HT3 ligands depending on the biological material used and other protocols conditions. By collecting and excerpting information from a vast literature base, Reaxys Medicinal Chemistry assists in defining the impact of the species and specific cell line used on in vitro binding data. Such insights can streamline assay development and lead optimization.
For effective drug discovery, an understanding of the function and therapeutic potential of a ligand should be always linked to chemical structure and druggability of the compound. Mining biological data in Reaxys Medicinal Chemistry enables a better understanding of the biological spaces associated with a target and the association to chemical structure is needed to gain a global picture.
Linking together chemistry and biology guides the efforts of medicinal chemists and pharmacologists during lead discovery and optimization phases by helping to identify innovative new structures, optimize selectivity issues and select the most appropriate and efficient test conditions to characterize compounds.
ESSENTIAL DRUG DISCOVERY SOLUTIONReaxys Medicinal Chemistry is an extensive database containing chemical information linked to in vitro and in vivo biological activities extracted from over 300,000 articles, 90,000 patents and 5,000 journals. More than 6 million chemical compounds are associated with their biological data (> 29 million bioactivity data points) and linked to information on 12,700 pharmacological targets, allowing the scientists to reveal connections between compounds, effects and targets. The data is indexed and normalized for maximum searchability and consistency.
REFERENCES1. Barnes, N.M. and Sharp, T. (1999) A review of central 5-HT receptors and their function.
Neuropharmacology 38: 1083–1152.
2. Gershon, M.D. (2004) Serotonin receptors and transporters – roles in normal and abnormal gastrointestinal motility. Aliment. Pharmacol. Ther. 20: 3–14.
3. IUPHAR receptor database: http://www.iuphar-db.org/GPCR/ReceptorFamiliesForward
4. MOE, Chemical Computing Group Inc., Montreal, Canada: www.chemcomp.com

Visit elsevier.com/rd-solutions or contact your nearest Elsevier office.
ASIA AND AUSTRALIA
Tel: +65 6349 0222Email: [email protected]
JAPAN
Tel: +81 3 5561 5034Email: [email protected]
KOREA AND TAIWAN
Tel: +82 2 6714 3000Email: [email protected]
EUROPE, MIDDLE EAST AND AFRICA
Tel: +31 20 485 3767Email: [email protected]
NORTH AMERICA, CENTRAL AMERICA AND CANADA
Tel: +1 888 615 4500Email: [email protected]
SOUTH AMERICA
Tel: +55 21 3970 9300Email: [email protected]
REAXYS is a trademark of Reed Elsevier Properties SA, used under license. Microsoft and Excel are registered trademarks of the Microsoft Corporation. Copyright© 2015 Elsevier B.V. All rights reserved.
November 2015
LEARN MORETo request information or a product demonstration, please visit elsevier.com/reaxys or email us at [email protected].