application of a mechanistic uv/hydrogen peroxide model at
TRANSCRIPT

1
Application of a mechanistic UV/hydrogen peroxide model at full-scale: sensitivity analysis, calibration and performance evaluation
Wim T.M. Audenaert1,2, Yoshi Vermeersch1, Stijn W.H. Van Hulle1,2, Pascal Dejans1, Ann Dumoulin1 and Ingmar Nopens
Corresponding author:
2
1EnBiChem Research Group, Department of Industrial Engineering and Technology, University College West Flanders, Graaf Karel de Goedelaan 5, 8500 Kortrijk
2
Tel.: +32 56 241237
BIOMATH, Department of Applied Mathematics, Biometrics and Process Control, Ghent University, Coupure Links 653, 9000 Gent
Fax.: +32 56 241224
Abstract
Numerous mechanistic models describing the UV/H2O2 process have been proposed in literature. In this study, one of them was used to predict the behavior of a full-scale reactor. The model was calibrated and validated with non-synthetic influent using different operational conditions. A local sensitivity analysis was conducted to determine the most important operational and chemical model parameters. Based on the latter, the incident UV irradiation intensity and two kinetic rate constants were selected for mathematical estimation. In order to investigate changes of the NOM content over time, some time delay was considered between calibration and validation data collection. Hydrogen peroxide concentration, the decadic absorption coefficient at 310 nm (UVA310, as a surrogate for natural organic matter) and pH could be satisfactorily predicted during model validation using an independent data set. It was demonstrated that quick real-time calibration is an option at less controllable full-scale conditions. The reactivity of UVA310 towards hydroxyl radicals did not show significant variations over time suggesting no need for frequent recalibration. Parameters that determine the initiation step, i.e. photolysis of hydrogen peroxide, have a large impact on most of the variables. Some reaction rate constants were also of importance, but nine kinetic constants did show absolutely no influence to one of the variables. Parameters related to UV shielding by NOM were of main importance. At the conditions used in this study, i.e. H2O2 concentrations between 0.5 and 4 mM, hydraulic residence times between 90 and 200 s and alkalinity concentrations between 2.5 and 6 mM, competitive radiation absorption by NOM was more detrimental to the micro pollutant removal efficiency than hydroxyl radical scavenging. Hydrogen peroxide concentration was classified as a non-sensitive variable, in contrast to the concentration of a micro pollutant which showed to be very to extremely influential to many of the parameters. UV absorption as a NOM surrogate is a promising variable to be included in future models. Model extension by splitting up the UVA310
Keywords: advanced oxidation processes, UV/H
into a soluble and a particulate fraction seemed to be a good approach to model AOP treatment of real (waste)waters containing both dissolved and particulate (suspended) material.
2O2
, NOM, UV absorption, sensitivity analysis, model calibration
2
Nomenclature
Abbrevations: AOPs: advanced oxidation processes CFD: computational fluid dynamics COD: chemical oxygen demand (mg L-1
CSTR: continuously stirred tank reactor )
DAEs: differential and algebraic equations DBCP: 1,2-Dibromo-3-chloropropane DOC: dissolved organic carbon (mg L-1
HA: humic acid )
HRT: hydraulic retention time (s) LP: low pressure MP: medium pressure NDMA: N-Nitrosodimethylamine NOM: natural organic matter RSF: relative sensitivity function SF: sensitivity function SUVA: specific UV absorption coefficient (cm-1 (mg L-1)-1
TIC: Theil’s inequality coefficient )
TIS: tanks in series TOC: total organic carbon (mg L-1
UV: ultraviolet )
UVA: decadic UV absorption coefficient (cm-1
WSSE: weighted sum of squared errors )
Symbols: A254
b: optical path length (cm) : UV absorbance at 254nm
f: the fraction of UV absorbed by a species k: reaction rate constant Ka
N: number of data points : acid dissociation constant
t: simulation time (s) UVA310: decadic absorption coefficient at 310 nm (cm-1
UVA)
310S: soluble fraction of decadic absorption coefficient at 310 nm (cm-1
UVA)
310X: particular fraction of decadic absorption coefficient at 310nm (cm-1
w)
j
ŷ weight assigned to variable j
ij
ŷ(θ): model prediction at time i for variable j using parameter value θ
ij
y(θ�): model prediction at time i for variable j using the optimal parameter value θ�
ij
Y: stoichiometric conversion factor for NOM : experimental data at time i for variable j
ε: molar extinction coefficient ξ: perturbation factor θ: parameter φ: primary quantum yield for photolysis

3
1. Introduction
1.1. The UV/hydrogen peroxide process
The increasing pressure of emerging micro pollutants on the aquatic environment and fresh water resources has resulted in an intensification of scientific research on the sources, fate, effects and removal of these products. Advanced oxidation processes (AOPs) have recently been proven to be very suitable in this context, which has already led to several full-scale applications [1, 2]. The driving force of AOPs is the formation of the hydroxyl radical which can virtually oxidize any compound present in the water matrix because of its high oxidation potential [3]. Besides this oxidative power, AOP technologies often simultaneously achieve disinfection and can facilitate the removal of natural organic matter (NOM), which perfectly fits into the multiple-barrier concept often applied at water treatment sites. Ultraviolet radiation (UV) can effectively deactivate waterborne cysts and oocysts of Gardia and Cryptosporidium which are resistant to conventionally applied chlorine doses [4-6]. This, along with their oxidizing performance and process flexibility makes that UV-initiated AOPs are appealing to be part of the water treatment train, in particular the UV/hydrogen peroxide process (UV/H2O2). This AOP is initiated by the UV photolysis of hydrogen peroxide resulting in a direct production of hydroxyl radicals [7]. Nowadays, research also focuses on the use of AOPs for wastewater treatment and especially the role they can play as integrated tertiary treatment [1, 8, 9]. The use of mathematical models in this context can be of great value for design and optimization purposes. While different models describing the UV/H2O2
process were already developed, it is noteworthy that full-scale model studies and implementations are scarce. This can probably be attributed to two major causes: (i) often, research ends at lab-scale and experiments conducted in real natural water are limited, which restricts actual implementation of models at full-scale AOP reactors; (ii) even when very detailed and generally accepted radical pathways are available, the complex reaction mechanism of NOM often impedes the modeling exercise severely which leads to black box approaches that severely limit model performance and applicability. Another important issue is the overparameterisation of models and the lack of sensitivity studies. The latter could shed light on the extent at which model parameters are influencing the model’s output variables. Detailed studies regarding this question are scarce, but are very important when performing modeling studies, especially at full-scale.
1.2. Modeling the UV/H2O2
The structure and features of models describing the UV/H
process
2O2
Empirical models are not based on known physical and chemical laws and in this way try to avoid ending up with complex sets of equations. Artificial neural networks can be used to investigate the influence of parameters on the process without understanding the actual phenomena [10]. To optimize costs or efficiency, response surface methodologies can be used [11, 12]. Although these models are relatively easy to build, their value regarding AOP process design is rather limited. In addition, these models are data driven and therefore require intensive experimental investigation.
process are highly dependent on the goal of the modeling exercise. Consequently, comparing existing models is not straightforward, although some common features exist. In the following section, an overview of different types of models is given, based on differences in research goals and approaches.
Often, phenomenological approaches can offer an answer to the abovementioned drawbacks. Mineralization studies are lab-scale studies that attempt to unravel a degradation mechanism of typically one or a few model compounds whereby parent compound and intermediary metabolite concentrations can be calculated as function of time [13-15]. Often, the focus is to improve the understanding of a mechanism of (micro) pollutant decay, rather than to build a model for engineering application, despite the fact that the used rate expressions are based on chemical principles knowledge. A third category of models aims to include more water quality and process variables in order to provide a flexible tool to determine operational optima and to gain process insight. These mechanistic models are based on known chemical and photochemical principles and can help understanding the often complex chemical mechanisms. They can be of great value during the design and engineering process [16-24]. For this reason, the model discussed in this paper belongs to this group. More recently, attempts to combine the typical stiff systems of kinetic relations describing the UV/H2O2 process with hydrodynamic reactor models have been reported [25, 26]. Computational fluid dynamics (CFD) models allow computing the fluid hydrodynamics and can be combined with kinetic equations to make more accurate predictions in both space and time and account for spatial heterogeneity. This is indeed a powerful tool for

4
design and optimization of pilot and full-scale reactors. However, before this can yield useful results, the kinetic model validity should be proven at full-scale. Hence, a CFD model was not considered in this study. 1.3. Kinetic model applications
Glaze et al. [Glaze et al.19] combined the results of several fundamental studies to propose a kinetic model for the UV/H2O2 process. 1,2-Dibromo-3-chloropropane (DBCP) was used as a model compound to verify the model. All radical species were assumed to be at steady-state concentrations which allowed to analytically solve all mass balances. The model was evaluated by calculating pseudo-first-order rate constants of DBCP at different reactor conditions and comparing model predictions with experimental data. Model predictions agreed well with experimental data, however, the modeling exercise did not incorporate effects of NOM such as scavenging and UV shielding and was limited to studies in a well known water matrix. Hong et al. [16] modeled AOPs based on ozone, hydrogen peroxide and UV irradiation by invoking the steady-state assumption for all radical species. UV initiated AOPs showed to be more effective in producing hydroxyl radicals as compared to dark processes. Nevertheless, the model was not experimentally verified and the modeling results were limited to organic-free water systems which severely limits its application. Liao and Gurol [22] successfully incorporated the influence of NOM by studying the concentrations of n-chlorobutane and hydrogen peroxide in the presence of a known humic acid (HA). No steady-state assumptions were made and the experimental reactor operated in a continuous flow mode. Crittenden et al. [18] significantly improved the earlier model of Glaze et al. [19] by rejecting the pseudo-steady-state assumptions and including a pH change during the process as a result of acid formation. Further, the effects of NOM could be included although this was not verified as no new experiments were carried out. A useful application of this model was the optimization and dimensioning of a full-scale UV/H2O2 reactor [23]. Sharpless and Linden [20] investigated N-Nitrosodimethylamine (NDMA) removal with low-pressure (LP) and medium-pressure (MP) UV lamps. As NDMA is subject to direct photolysis, this study particularly stressed aspects related to UV reactor geometry. Nevertheless, the addition of hydrogen peroxide was tested and the effects of scavengers as NOM were included into a model that accurately predicted pseudo-first order rate constants. UV shielding by NOM was not considered. In the work of Rosenfeldt and Linden [17], the model was used to predict the degradation of three endocrine disruptors. In this case, hydroxyl radical induced degradation was the dominating destruction mechanism and consequently, scavenging by NOM became more important. The model was verified in synthetic natural water, but also in real natural water, which cannot commonly be found in literature. These researchers highlighted the influencing role of NOM during UV/H2O2
1.4. UV absorption as NOM surrogate
treatment and the importance and variability of the dissolved organic carbon (DOC) content.
Total organic carbon (TOC) and DOC, expressed in mg (or mole) carbon L-1, are frequently used surrogates for (natural) organic matter [20, 22, 23, 25]. These variables can be easily determined and cover all organic compounds present in the water. However, it is known that using this surrogate has several disadvantages: (1) lumping the whole organic carbon content into one variable implies the use of just one kinetic rate constant in the hydroxyl radical mass balance. However, it has been demonstrated that not all DOC can be classified as NOM and that some waters contain different NOM structures with varying reactivity towards the hydroxyl radical [27]; (2) in cases where AOPs are integrated in a treatment train and NOM itself is also a target compound to (partially) oxidize (e.g. in drinking water production), models must be able to predict also the concentration and/or structural changes of the organic matter during the treatment. As in these cases the focus is merely to partially oxidize compounds at relatively short hydraulic retention times (HRTs), TOC or DOC do not give a good representation of the reaction progress as they only describe mineralization which mainly occurs at longer reaction times; (3) because of the lack of information provided at short term, the use of TOC or DOC in UV shielding equations is only valid at the beginning of simulations because the amount of shielding can decrease rapidly as the reaction proceeds. This is mainly due to hydroxyl radical attack at reactive double bond sites, which often occurs at a speed which is not proportional to the TOC or DOC reduction. For these reasons, Song et al. [21] used the decadic UV absorption at coefficient at 310 nm (UVA310) as a NOM surrogate (the decadic absorption coefficient is defined as the absorbance divided by the optical path length of the solution [28]). Indeed, only an insignificant TOC reduction during the first 10 minutes of UV/H2O2 treatment at H2O2 concentrations ranging between 2 and 6 mM was demonstrated. Moreover, Beltrán et al. [29] highlighted the disadvantages of TOC in kinetic AOP modeling and used the chemical oxygen demand (COD) instead. As such, the model of Crittenden et al. [18] was modified with this new surrogate and additionally, a pH decrease as a result of TOC mineralization was included. However, it is important to note that the latter is just a rough and simplistic assumption as not all TOC is being mineralized during AOP treatment. Mostly, low molecular weight fractions are produced such as aldehydes and

5
carboxylic acids [3], which is not equivalent to carbon dioxide formation. Additionally, the shape of the TOC mineralization curve shown by Song et al. [21] was clearly not in accordance with that of a conventional second order reaction, while the model did assume this. However, due to a current lack of knowledge, not many alternatives exist. As similar HRTs and H2O2
The objectives of this contribution are to: (i) evaluate the performance of a kinetic UV/H
concentrations as in the study of Song et al. [21] were applied, this model seemed suitable to use in this study. Moreover, the interest was to predict NOM concentrations and structural changes during the oxidation process, rather than to follow the concentration of a single organic pollutant in time. An important drawback of UVA measurements however, is that they do not cover the whole organic carbon content, but focus on the olefinic structures containing carbon-carbon double bonds. As such, this surrogate is limited to describe the conversions of only the unsaturated part of the DOC [30].
2O2
model from literature calibrated at full-scale using a real water matrix, (ii) evaluate the usage of the NOM surrogate using non-synthetic influent for different operational conditions, (iii) determine the relative importance of each model parameter through a local sensitivity analysis and (iv) extend the model and discuss further improvements in order to broaden its applicability. Consequently, gaining mechanistic knowledge was the main goal.
2. Materials and methods
2.1. UV/Hydrogen peroxide reactor
A full-scale UV reactor for water reuse at a horticultural industry was used for this study. To investigate the potential of additional water treatment with advanced oxidation to lower the overall TOC content, the reactor, originally only designed for disinfection, was extended with a hydrogen peroxide dosing system. Obviously, the purpose of this research was not to obtain an optimal AOP reactor, but to get insight into the process at full-scale. A schematic representation of the installation is shown in Figure 1. The AOP unit is part of a small wastewater treatment plant consisting of primary sedimentation, biological reed bed filtration, secondary sedimentation, sand filtration, UV/H2O2
treatment, granular activated carbon filtration and storage. Surplus crop irrigation water as well as grey and black domestic wastewater are treated.
Figure 1: Schematic presentation of the process set-up
The typical influent composition of the UV/H2O2 reactor (already primary and secondary treated) is given in Table 1. The AOP reactor consisted of four stainless steel pipes each containing a 205 Watt low-pressure UV lamp that was 114.5 cm in length (Heraeus, No. NNI 201/107 XL, 480 µW/cm² irradiance at 1m distance) and installed parallel to the water flow. Each lamp was enclosed by a quartz jacket. The total irradiated reactor volume of the four pipes approximated 7.3 L. The influent channel was split into two parts so that each water stream flowed along two lamps in series. The reactor, operating at a nominal flow rate of 2,000 L h-1, was equipped with nitric acid and hydrogen

6
peroxide dosing systems. Nitric acid was used prior to each measurement campaign to rinse the quartz jackets and to prevent scaling of carbonates. Hydrogen peroxide dosing was flow controlled after setting a fixed value at the dosing pump. The HRT in the reactor was manually adjusted by controlling the incoming water flow with a valve. Flow rates between 120 and 300 L h-1
were applied to allow for a sufficient reaction time. Influent samples were taken at a point located just before the hydrogen peroxide dosing pipe. A tap located downstream of the reactor was used to sample the effluent. Samples were taken after a period of three times the HRT to allow the reactor reaching steady-state. Two operational settings were varied during different runs: flow rate (and thus HRT) and hydrogen peroxide concentration.
Table 1: Composition of the reactor influent
Influent parameter Concentration
pH 7.4-8.2
COD 20-26 mg L
TOC
-1
20 mg L
UVA
-1
0.10-0.11 cm310
UVA
-1
0.20-0.21 cm254
Alkalinity
-1
2.6-6.1 mM
Total nitrogen 0.55 mg L
Ortho-phosphate
-1
0.70 mg L
-1
2.2. Modeling approach
2.2.1. Conceptualization
The kinetic model of Crittenden et al. [18], later modified by Song et al. [21] was used in this study. However, it should be noted that the simulated data of Song et al. [21] could not be reproduced. An investigation of the mass balances revealed that a stoichiometric conversion factor to deal with the dissimilarity between the units of UVA (expressed in cm-1) and the hydroxyl radical concentration (expressed in mole L-1) was missing. After adding a factor Y with a numerical value around 1x10⁴ L mole-1 cm-1 to the mass balance of NOM, the same results could be obtained and the model was ready for use. According to previous models and due to the ease of implementation, the semi- empirical Lambert-Beer law was used to describe the direct photolysis conversion rate. This implied that a point source was assumed and that the photolysis rate of a given compound was calculated from the irradiance absorbed by that compound over the optical path length of the reactor. The irradiance (eins s-1
Some adaptations to the model were made. First, Crittenden et al. [18] stated that degradation of humic substances by direct photolysis could be ignored. This was experimentally verified and indeed, no significant UVA
) was volume-averaged.
310
The original model was extended by splitting up the the NOM surrogate, UVA
reduction could be observed. Furthermore, a sensitivity analysis of the original model of Song et al. [21] classified the parameters with respect to direct NOM photolysis as insignificant (results not shown). Hence, this effect was discarded from the model. Second, as this study merely focuses on NOM conversion, no micro pollutant concentrations were predicted, nor experimentally determined. However, during the sensitivity analysis, a fictive synthetic organic compound was included to compare the sensitiveness of its concentration to the other variables.
310, into two different fractions. UVA310 was found to consist of a soluble and a particulate (suspended) fraction, each contributing to UV shielding at 254 nm, but playing different roles in scavenging hydroxyl radicals. This research revealed that the particulate fraction, UVA310
X, remained relatively constant during the treatment, and thus only the soluble part, denoted as UVA310S, was
assumed to participate in the radical chain. Consequently, for the extended model, two extinction coefficients for NOM at 254 nm, εUVA310S and εUVA310X (cm-1/cm-1), were used in absorption calculations and hydroxyl radical scavenging by soluble NOM was calculated using one reaction rate constant, k16’ ((1/cm-1).s-1). For describing UV shielding and radical scavenging with the original model, one molar extinction coefficient, εUVA310 (cm-1/cm-1), and a rate constant, k16 ((1/cm-1).s-1), were used, respectively. In both models, a stoichiometric conversion factor Y (L mole-1 cm-1) was introduced as discussed earlier. Simulation results of the original and the extended model were compared.

7
The reaction system is schematically presented in Table 2. In this Gujer matrix [30], the different elementary processes are indicated in the left column. The components shown at the top of the table represent the derived state variables (mole L-1) which have to be calculated with numerical integration. Reaction products such as oxygen or water that do not have a mass balance are therefore not included in the table. A detailed overview of all reaction products can be found in refs. [18] and [21]. The right column contains the reaction rates of each individual process. The square brackets indicate the concentration of the compound enclosed in the brackets, expressed in mole L-1
The fractions of UV radiation absorbed by hydrogen peroxide and a model compound M, respectively, were calculated with the following equations [21]:
. Finally, the central matrix elements are stoichiometric factors used in the mass balances. Mass balances can be easily built up by multiplying each matrix element of one column (one variable) by the reaction rate at the same row of the element. A summation of these products yields the conversion terms of the mass balance [31]. After addition of the transport terms, the complete mass balances can be recovered. A detailed description of composing the mass balances is given in the appendix. This Gujer matrix notation is an elegant way to summarize a set of ordinary differential equations and gives a clear overview of all elementary reactions occurring during the process. More information about the parameters and their values can be found in Table 3.
𝑓𝑓𝐻𝐻2𝑂𝑂2 =𝑏𝑏×(𝜀𝜀𝐻𝐻2𝑂𝑂2 ×[𝐻𝐻2𝑂𝑂2]+𝜀𝜀𝐻𝐻𝑂𝑂2
−×[𝐻𝐻𝑂𝑂2−])
𝐴𝐴 (2)
𝑓𝑓𝑀𝑀 = 𝑏𝑏×(𝜀𝜀𝑀𝑀×[𝑀𝑀])𝐴𝐴
(3)
For the original model, the absorbance of the solution at 254 nm (A254
𝐴𝐴254 = 𝑏𝑏 × (𝜀𝜀𝐻𝐻2𝑂𝑂2 × [𝐻𝐻2𝑂𝑂2] + 𝜀𝜀𝐻𝐻𝑂𝑂2− × [𝐻𝐻𝑂𝑂2
−] + 𝜀𝜀𝑈𝑈𝑈𝑈𝐴𝐴310× �𝑈𝑈𝑈𝑈𝐴𝐴310 �) (4)
) was calculated during each time step as follows:
For the extended model, Eq. 4 becomes:
𝐴𝐴254 = 𝑏𝑏 × (𝜀𝜀𝐻𝐻2𝑂𝑂2 × [𝐻𝐻2𝑂𝑂2] + 𝜀𝜀𝐻𝐻𝑂𝑂2− × [𝐻𝐻𝑂𝑂2
−] + 𝜀𝜀𝑈𝑈𝑈𝑈𝐴𝐴310𝑆𝑆 × [𝑈𝑈𝑈𝑈𝐴𝐴310
𝑆𝑆 ] + 𝜀𝜀𝑈𝑈𝑈𝑈𝐴𝐴310𝑋𝑋 × [𝑈𝑈𝑈𝑈𝐴𝐴310
𝑋𝑋 ]) (5)
Table 2: Gujer matrix presentation of the reaction system
Process Components Reaction Rate
H2O •OH 2 O2
- CO• 3- HCO• 3 H- 2CO M 3 UVA UVA310 310 UVAS 310 TOC X
Photolysis H2O2 -1 (initiation) 2
φH2O2 *I0*fH2O2 *(1-exp(-
2,303*A)
M
)
-1
φM *I0*fM *(1-exp(-2,303*A)
Propagation
)
H2O2 -1 + •OH -1 1
k1*[•OH]*[H2O2
HO
]
2- -1 + •OH -1 1
k2*[•OH]*[HO2
-
H
]
2O2 + O2- -1 • 1 -1
k3*[O2
-•]*[H2O2
H
]
2O2 + HO2 -1 • 1 -1
k4*[HO2•]*[H2O2
H
]
2O2 + CO3- -1 •
1 -1 1
k5*[H2O2]*[CO3
-
HO
•]
2- + CO3
- -1 •
1 -1 1
k6*[HO2-]*[CO3
-
Termination
•]
•OH + HO2
• -1 -1
k7*[•OH]*[HO2
•OH + HO•
•]
1 -2
k8
•OH + CO
*[•OH]*[•OH]
3-
• -1
-1
k9*[•OH]*[CO3
-
•OH + O
•]
2-
• -1 -1
k10*[•OH]*[O2
-
O
•]
2-• + CO3
-
• -1
-1 1
k11*[O2
-•]*[CO3-
O
•]
2-• + HO2 1 •
-2
k12*[O2
-•]*[HO2
HO
•]
2• + HO2 1 •
-2
k13*[HO2•]*[HO2
CO
•]
3-• + CO3
-
•
-2
k14*[CO3
-•]*[CO3-
Scavenging
•]
HO• + CO3
2- -1
1 -1
k15*[•OH]*[CO32-
HO• + UVA
]
310
S -1
-Y 0
k16’*[•OH]*[UVA310S]

8
HO• + UVA
310 -1
-Y
k16*[•OH]*[UVA310
HCO
]
3-
+ •OH -1
1 -1
k17*[•OH]*[HCO3
-
Micropollutant destruction
]
•OH + M
-1
-1
k18
Acid formation *[•OH]*[M]
•OH + TOC
1
-1 k19
*[•OH]*[TOC]
The dissociation equilibria of carbonates, hydrogen peroxide and hydroperoxyl radicals were described as follows:
𝐾𝐾𝑎𝑎𝐻𝐻2𝐶𝐶𝑂𝑂 3 = �𝐻𝐻+�×[𝐻𝐻𝐶𝐶𝑂𝑂3−]
[𝐻𝐻2𝐶𝐶𝑂𝑂3] (6)
𝐾𝐾𝑎𝑎𝐻𝐻𝐶𝐶𝑂𝑂 3− = �𝐻𝐻+�×�𝐶𝐶𝑂𝑂3
2−�[𝐻𝐻𝐶𝐶𝑂𝑂3
−] (7)
𝐾𝐾𝑎𝑎𝐻𝐻2𝑂𝑂2= �𝐻𝐻+�×[𝐻𝐻𝑂𝑂2
−][𝐻𝐻2𝑂𝑂2]
(8)
𝐾𝐾𝑎𝑎𝐻𝐻𝑂𝑂 2• = �𝐻𝐻+�×[𝑂𝑂2
−•][𝐻𝐻𝑂𝑂2
•] (9)
Table 3: Parameters of the kinetic model and their values
Parameters Initial value Source initial value
Incident light intensity I0 6.9 x10a -5 eins L-1 s This work -1
Optical path length b 1.2 cm This work
Second order rate constants
k 2.7 x101
7 M-1s [31] -1
k 7.5 x10²
9 M-1s [32] -1
k 0.13 M3
-1s [33] -1
k 2.7 x10⁴
7 M-1s [34] -1
k 8 x10⁵
5 M-1s [35] -1
k 3 x10⁶
7 M-1s [35] -1
k 6.6 x10⁷
9 M-1s [31] -1
k 5.5 x10⁸
9 M-1s [31] -1
k 3 x10⁹ 9 M-1s (Holeman et al., 1987 as cited in [21]
-1
k 8 x10¹⁰
9 M-1s [35] -1
k 6.5 x10¹¹
8 M-1s [36] -1
k 9.7 x10¹²
7 M-1s [34] -1
k 8.6 x10¹³
5 M-1s [33] -1
k 2 x10¹⁴
7 M-1s [35] -1
k 3.9 x10¹⁵
8 M-1s [31] -1
k161.2 x10 a
4 (1/cm-1)s [21] -1
K16’ 1.2 x10a 4 (1/cm-1)s [21]
-1
k178.5 x10
6 M-1s [31] -1
k 2.2 x10¹⁸
9 M-1s [21] -1
k194.5 x10 a
7 M-1s [21] -1
Primary quantum yields for photolysis φ 0.5 mole einsteinH2O2 [7]
-1b
φ 0.14 mole einsteinM [21]
-1b
Molar extinction coefficients
ε 2.58 cmUVA310S -1/cm This work -1
ε 1,39 cmUVA310X -1/cm This work -1
ε 2,04 cmUVA310 -1/cm This work -1

9
ε 466.7 MM -1cm [21] -1
ε 19.6 MH2O2 -1cm [7] -1
ε 228 MHO2- -1cm [7] -1
Equilibrium constants
K 6.3 aH2CO3 [18]
K 10.3 aHCO3- [18]
K 11.6 aH2O2 [18]
K 4.8 aHO2• [18]
Stoichiometric factors Y 1 x10⁴(L mole-1 cm-1 This work ) athese parameters are modified later in this study through parameter estimation b
one Einstein equals one mole of photons
2.2.2. Software implementation and numerical solution
The system consisting of 33 parameters, 10 ODEs and 8 algebraic equations was implemented in the generic modeling and simulation platform WEST® (MOSTforWATER, Belgium). Simulations were run in its associated kernel Tornado® [32] which allows to rapidly numerically simulate the stiff system of differential and algebraic equations (DAEs). The stiff solver CVODE [33] was used for all numerical integrations with an absolute and relative tolerance of 1 x10-35 and 1 x10⁻⁵
To simulate the AOP reactor, 25 completely stirred tank reactors (CSTRs) in series were used, according to results of tracer tests (see section 3.1.). These describe the transport of the water in the system [34]. Each reactor contains the complete kinetic model as described above. The configuration as used in the software program is given in Figure 2.
, respectively.
Figure 2: Implementation of the UV/H2O2
reactor in the simulation platform WEST®
2.2.3. Model calibration and validation
Conventionally, the UV reactor modeling exercise starts with determining two important reactor properties by means of chemical actinometry: the optical path length and irradiation intensity [3, 35]. In this case, performing these tests was not practically feasible. It was not allowed to stop the operation for a long period and to modify the water circuit. These conditions are needed to pump around ultra pure water containing e.g. dissolved sodium ferrioxalate to perform the actinometer test. The irradiation intensity was mathematically estimated (see further), which is not commonly done. However, the most important of the three variables used for estimation of this parameter was the hydrogen peroxide concentration. This is a compound with a well known extinction coefficient and quantum yield. The main difference with hydrogen peroxide actinometry was that the calibration was not performed in ultra pure water, but by using the real water matrix with a known absorbance.The initial value of I0 was calculated according to the nominal power input of the lamps (data from the manufacturer), assuming that the LP-UV lamps have an efficiency of 33% [20]. Using a factor of 471,652 J Ein-1 at wavelength 253.7 nm [3], a value of 6.9x10⁻⁵ Ein L-1s-1 was obtained as initial value. The optical path length was assumed to be equal to the physical path length (1.2 cm) which is the distance between the quartz sleeve and the inner reactor wall and, hence, assumes that all transmitted UV radiation was

10
instantly absorbed by the reactor wall. As mentioned earlier, optimizing the lamp configuration was not the main target of this study, because at this short path length, only around 35 % of the incident UV radiation gets absorbed by the hydrogen peroxide and the water matrix at standard experimental conditions (an intermediate H2O2 concentration of 1.8 mM and an average influent decadic absorption coefficient at 254 nm). UV radiation absorption by hydrogen peroxide ranges between 3.5 and 12 % of A254,t (depending on the applied concentration) while the water matrix absorbs 88-97% of A254,t). Also two chemical parameters related to natural organic matter were mathematically estimated: rate constants k16 (k16’ in the extended model) and k19 (see Tables 2 and 3). The value of the stoichiometric parameter Y was kept constant for two reasons. First, this parameter is strongly correlated to k16 and as such, these two parameters are not practically identifiable and should not be estimated together. Only the product k16xY is identifiable. Second, this allows a rough comparison of the estimated k16 with the value obtained by Song et al. [21], assuming that still an equal amount UVA310 reacts per mole OH radicals. The extinction coefficient of UVA310 was determined by dividing the average influent UVA254 by the average influent UVA310. For the extended model, the extinction coefficients of UVA310
S and UVA310X were determined by dividing the average UVA254
S and UVA254X values by the
average UVA310S and UVA310
X
The Parameter estimation was performed by using the Simplex algorithm provided in Tornado® and simulations were performed as discussed in section 2.2.2. The variables used to calculate the objective function were the effluent hydrogen peroxide concentration, the UVA
values, respectively. It was thus assumed that absorption coefficients at 310 nm were linearly related to absorption coefficients at 254 nm via the extinction coefficient, which was confirmed by the experimental results obtained (data not shown).
310S and pH. The objective function calculation was based on a weighted
sum of squared errors (WSSE) between the model predictions and measurements as shown in Eq. 10. Weighting factors were used to prevent discrimination of variables with low numerical values such as UVA310
. It can be derived from this equation that objective function calculation was performed for all three variables simultaneously.
(10)
in which J(θ) represents the objective function based on N data points and y ij and ŷij(θ) represent the model prediction and experimental data of variable j, respectively. wj is the weight factor applied to the variables . Numerical values of pH and H2O2 concentrations (the latter expressed in mM) were of the same order of magnitude, while those of UVA310 were about two orders of magnitude lower. Hence, a weighting factor of hundred was assigned to UVA310 while factors of one were applied to pH and H2O2. Weighting factors for UVA310
Five experimental data points per variable were used in the calibration process. Each data point corresponded to an experimental run with specific operational conditions. Similarly, an independent dataset corresponding to five independent runs was used to validate the model. To investigate changes of the NOM content over time, several months were left between the collection of experimental data for validation and calibration. The dates of data collection together with the influent data and operational conditions that were used for calibration and validation are given in Table 4. Hydrogen peroxide concentrations were chosen according to literature (refs. [15-22]) and practice.
ranging between 50 and 150 were tested and yielded no significant differences in parameter estimates, confirming the location of the optimum is not affected by the definition of the objective function.
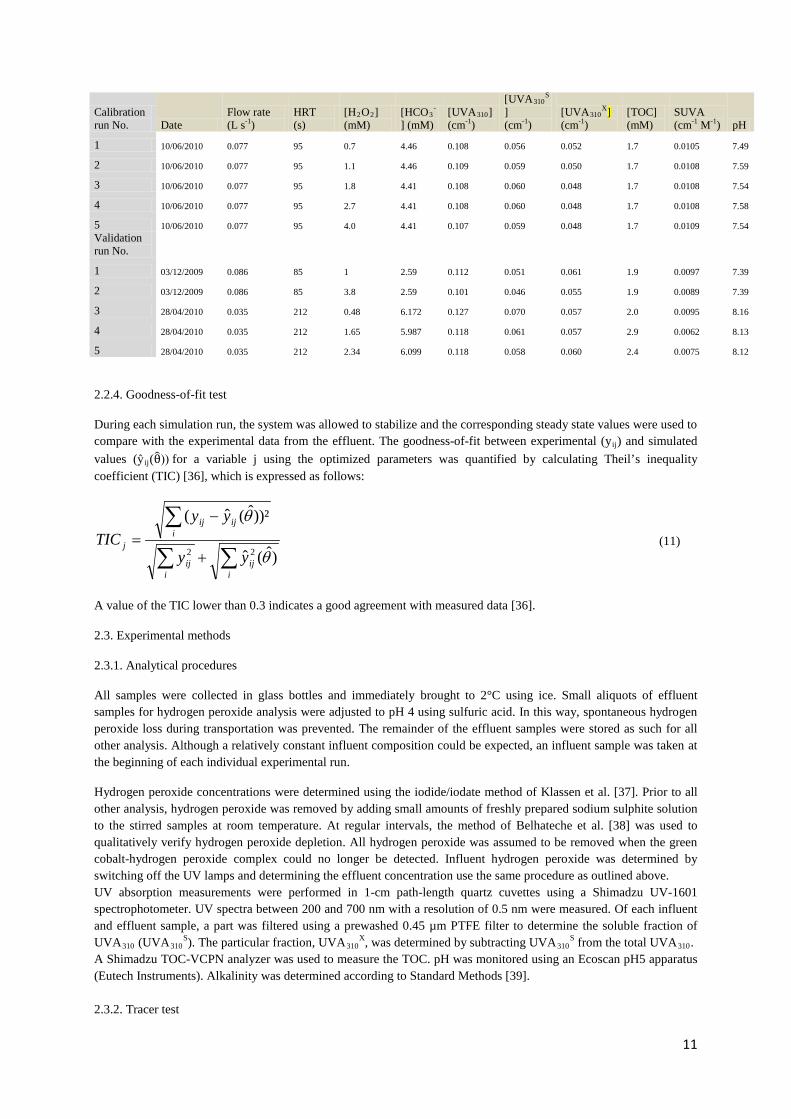
Table 4: Influent and operational conditions used for calibration and validation data collection
𝐽𝐽(𝜃𝜃) = ��𝑤𝑤𝑗𝑗 (𝑦𝑦𝑖𝑖𝑗𝑗
𝑁𝑁
𝑖𝑖=1
3
𝑗𝑗
− 𝑦𝑦�𝑖𝑖𝑗𝑗 (𝜃𝜃))²
11
Calibration run No. Date
Flow rate (L s-1
HRT (s) )
[H2O2 [HCO] (mM)
3- [UVA
] (mM) 310
(cm]
-1
[UVA
)
310S
(cm]
-1[UVA
) 310
X
(cm]
-1[TOC] (mM) )
SUVA (cm-1 M-1 pH )
1 10/06/2010 0.077 95 0.7 4.46 0.108 0.056 0.052 1.7 0.0105 7.49
2 10/06/2010 0.077 95 1.1 4.46 0.109 0.059 0.050 1.7 0.0108 7.59
3 10/06/2010 0.077 95 1.8 4.41 0.108 0.060 0.048 1.7 0.0108 7.54
4 10/06/2010 0.077 95 2.7 4.41 0.108 0.060 0.048 1.7 0.0108 7.58
5 10/06/2010 0.077 95 4.0 4.41 0.107 0.059 0.048 1.7 0.0109 7.54 Validation run No.
1 03/12/2009 0.086 85 1 2.59 0.112 0.051 0.061 1.9 0.0097 7.39
2 03/12/2009 0.086 85 3.8 2.59 0.101 0.046 0.055 1.9 0.0089 7.39
3 28/04/2010 0.035 212 0.48 6.172 0.127 0.070 0.057 2.0 0.0095 8.16
4 28/04/2010 0.035 212 1.65 5.987 0.118 0.061 0.057 2.9 0.0062 8.13
5 28/04/2010 0.035 212 2.34 6.099 0.118 0.058 0.060 2.4 0.0075 8.12
2.2.4. Goodness-of-fit test
During each simulation run, the system was allowed to stabilize and the corresponding steady state values were used to compare with the experimental data from the effluent. The goodness-of-fit between experimental (yij) and simulated values (ŷ ij
∑∑
∑
+
−=
iij
iij
iijij
jyy
yyTIC
)ˆ(ˆ
))²ˆ(ˆ(
22 θ
θ
(θ�)) for a variable j using the optimized parameters was quantified by calculating Theil’s inequality coefficient (TIC) [36], which is expressed as follows:
(11)
A value of the TIC lower than 0.3 indicates a good agreement with measured data [36].
2.3. Experimental methods
2.3.1. Analytical procedures
All samples were collected in glass bottles and immediately brought to 2°C using ice. Small aliquots of effluent samples for hydrogen peroxide analysis were adjusted to pH 4 using sulfuric acid. In this way, spontaneous hydrogen peroxide loss during transportation was prevented. The remainder of the effluent samples were stored as such for all other analysis. Although a relatively constant influent composition could be expected, an influent sample was taken at the beginning of each individual experimental run.
Hydrogen peroxide concentrations were determined using the iodide/iodate method of Klassen et al. [37]. Prior to all other analysis, hydrogen peroxide was removed by adding small amounts of freshly prepared sodium sulphite solution to the stirred samples at room temperature. At regular intervals, the method of Belhateche et al. [38] was used to qualitatively verify hydrogen peroxide depletion. All hydrogen peroxide was assumed to be removed when the green cobalt-hydrogen peroxide complex could no longer be detected. Influent hydrogen peroxide was determined by switching off the UV lamps and determining the effluent concentration use the same procedure as outlined above. UV absorption measurements were performed in 1-cm path-length quartz cuvettes using a Shimadzu UV-1601 spectrophotometer. UV spectra between 200 and 700 nm with a resolution of 0.5 nm were measured. Of each influent and effluent sample, a part was filtered using a prewashed 0.45 µm PTFE filter to determine the soluble fraction of UVA310 (UVA310
S). The particular fraction, UVA310X, was determined by subtracting UVA310
S from the total UVA310
A Shimadzu TOC-VCPN analyzer was used to measure the TOC. pH was monitored using an Ecoscan pH5 apparatus (Eutech Instruments). Alkalinity was determined according to Standard Methods [39].
.
2.3.2. Tracer test

12
To mimic the hydraulic behaviour of the AOP reactor, a tanks-in-series (TIS) approach was used. A tracer test [34] was performed to determine the number of CSTRs to be used in the simulation software. A pulse of 10 ml sodium chloride (10 %) was rapidly injected into the hydrogen peroxide addition port. On-line conductivity measurements at the effluent sampling valve were used to record the salt concentration residence time distribution (as sodium chloride concentration is directly correlated to conductivity). A data-acquisition device based on voltage measurements (Cole-Parmer) connected to a PC was used for data storage. The tracer test was performed at three different flow-rates to study the effect of the liquid velocity on the mixing properties. The tested flow-rates were 1000, 350 and 120 L h-1
As mentioned in section 2.1., the irradiated reactor volume approximated 7,3 L. Nevertheless, this volume could not be used in the calculations, because the reactor volume between the point of tracer injection and conductivity measurement contained extra, non-active reactor parts (see Figure 1). The total volume measured with the tracer test was calculated to be 11 L, which was a realistic value.
. Through comparison of the experimentally obtained dimensionless hydraulic residence time distributions (E(t’)) and the theoretical computed ones, the optimal number of tanks (n) was determined according to Ref. [34].
2.3.3. Sensitivity analysis
A sensitivity analysis was used to help with determining the calibration parameters and to investigate and quantify the influence each model parameter exerts on every variable calculated in the system. The latter could be described as a sort of robustness test. To allow comparison between sensitivity functions (SFs) of different variable-parameter combinations, relative sensitivity functions (RSFs) were used [36] rather than absolute SFs. All simulations were run using the Tornado® kernel (backend of the WEST modeling and simulation platform) and the steady-state RSF values were calculated using the optimized parameters (see section 3.2.). An additional organic compound (M) with known reactivity towards the hydroxyl radical was included in this experiment to study the parameter sensitivity of micro pollutants during model predictions. According to ref. [21], this compound was assumed to be completely mineralized. The synthetic organic compound alachlor was used for this purpose [21]. The RSF was calculated from the absolute sensitivity function (ASF) using the finite forward difference method with a perturbation factor of 1x10⁻⁶
(12)
. This means that ASFs were calculated by perturbing the default parameter value with an amount equal to the perturbation factor times the default value:
in which y(t, θ j) represents the output variable, θ j
RSFs can then be calculated as follows:
represents the nominal parameter value and ξ is the perturbation factor.
(13)
A RSF less than 0.25 indicates that the parameter is not influential. Parameters are moderately influential when 0.25<RSF<1. When 1<RSF<2 and RSF>2, the parameter seems to be very and extremely influential, respectively [36] (and references therein). The sign of the RSF value specifies if raising the parameter impacts the variable in a positive (higher variable value) or negative (lower variable value) way. The extended model was used to perform the sensitivity analysis.
3. Results and discussion
3.1. Tracer test
A typical curve obtained during the tracer tests is shown in Figure 3. This graph represents a tracer test at a flow rate of 1000 L h-1
j
jjj
j
tytyyξθ
θξθθθ
),(),( −+=
∂∂
+
. It can be clearly noted that a perfect fit could not be reached. Apparently, a small fraction of the tracer load leaves the reactor later than would be expected. As a result, the measured curve has a shoulder at its right side. This effect becomes more pronounced as the flow-rate decreases, suggesting the occurrence of different hydrodynamical behaviour in the two parallel water streams. Indeed, Figure 1 shows that the first set of two pipes in series at the
),( θθ
tySFRSF ×
=

13
beginning of the influent pipe is favoured due to a higher local water pressure. Consequently, the second parallel lane, which is located more downstream, receives a lower flow rate and thus has a longer residence time. However, as it was impossible to test each reactor tube separately with a tracer test, this effect was further neglected.
Figure 3: Measured and calculated E(t’) curves at a flow rate of 1000 L h
For all three flow rates tested, a value of 25 TIS was the final outcome, indicating not well-mixed conditions. As such, this number was used in the simulation configuration depicted in Figure 2 with each reactor having the same volume (V
-1
n) of 0.44 L. Four non-irradiated tanks at the beginning and at the end represented the dark reactor parts, with the irradiance set to zero. Hence, the active reactor part was represented by 17 of the 25 tanks. The influent was found to be non-dynamical and hence, every effluent data point represents a steady-state situation of constant flow, influent concentration and H2O2
3.2. Model calibration
dosing. Consequently, drastic transitions of influent (and thus effluent) concentration-time profiles did not have to be predicted, but only the final steady-state values. Unfortunately, due to practical limitations, it was not possible to conduct tracer experiments for each irradiated pipe separately. The number of TIS for these pipes could be expected to be higher than 17 because these smooth and straight channels are optimal to create plug flow conditions. Apart from the shape of transient concentration profiles, the number of TIS also determines the level of the steady-state plateau, but preliminary experiments revealed that increasing the number above 15 no longer significantly affects the output. This sensitivity check indicated that the number of 17 could be used without expecting significant errors. In the irradiated tanks, the estimated irradiance (see section 3.2.) was used.
The rationale for extending the model can be explained using Figure 4. This figure shows that the particulate fraction of UVA310 is not affected by AOP treatment and only the soluble part is oxidized and thus responsible for UVA310 decrease. The influent bar was constructed by averaging the influent values of each calibration run, while the remaining bars represent the effluent concentrations corresponding to the respective runs. The influent UVA310 was around 0.108 cm-1 and remained relatively constant during the different experimental runs. The conditions corresponding to each run number (indicated on the x-axis) are presented in Table 4. UVA310 rapidly decreases as the applied hydrogen peroxide concentration is increased up to 2.7 mM (run No. 4). Beyond this concentration (run No. 5), the remaining UVA310 remains unchanged at a value of 0.070 cm-1. It is hypothesised that at this concentration hydrogen peroxide itself becomes an important scavenger for hydroxyl radicals. Song et al. [21] in their studies used the synthetic organic chemical alachlor and showed a stabilization of the observed pseudo-first-order rate constant between 2 and 3 mM hydrogen peroxide.
-0.5
0
0.5
1
1.5
2
2.5
0 0.5 1 1.5 2 2.5 3 3.5 4
Vol
tage
(V)
Dimensionless time
E(t')_measured

14
Figure 4: changes of UVA310
Calibration results for UVA
composition due to AOP treatment during the calibration runs
310 are depicted in Figure 5. Low TIC values (0.009 for the original and 0.013 for the extended model) revealed that an excellent agreement was obtained between calculated and experimental data for both models. The value of k16, the second order rate constant for reaction between the *OH radical and UVA310 in the original model, was estimated to be 17,138 (1/cm-1)s-1. This value is in the same order of magnitude but significantly higher than the value of 12,000 (1/cm-1)s-1 experimentally determined by Song et al. [21]. This illustrates the variable character and related reactivity of organic matter, even within the class of olefinic structures (associated with UVA measurements). Westerhoff et al. [30] highlighted the importance of molecular weight and other characteristics with respect to *OH radical attack. Rate constant k16’ related to hydroxyl radical scavenging of UVA310
S in the extended model was estimated to be 34,498 (1/cm-1)s-1. It was expected that this value would be approximately twice the value of k16 of the original model since the influent total UVA310 consists of about 50% UVA310
S
(see Figure 4).
Figure 5: Measured and predicted UVA310
Measured and predicted hydrogen peroxide concentrations are presented in Figure 6. The error bars correspond to the 95% confidence interval of three replicate measurements. Simulation outputs of the two models were not presented separately as the results obtained were almost identically.
after model calibration
0.00
0.02
0.04
0.06
0.08
0.10
0.12
Influent 1 2 3 4 5
UV
A31
0(c
m-1
)
Calibration run No.
UVA310_S
UVA310_X
0
0.02
0.04
0.06
0.08
0.1
0.12
1 2 3 4 5
UV
A31
0(c
m-1
)
Calibration run No.
Influent_meas Effluent_meas
15
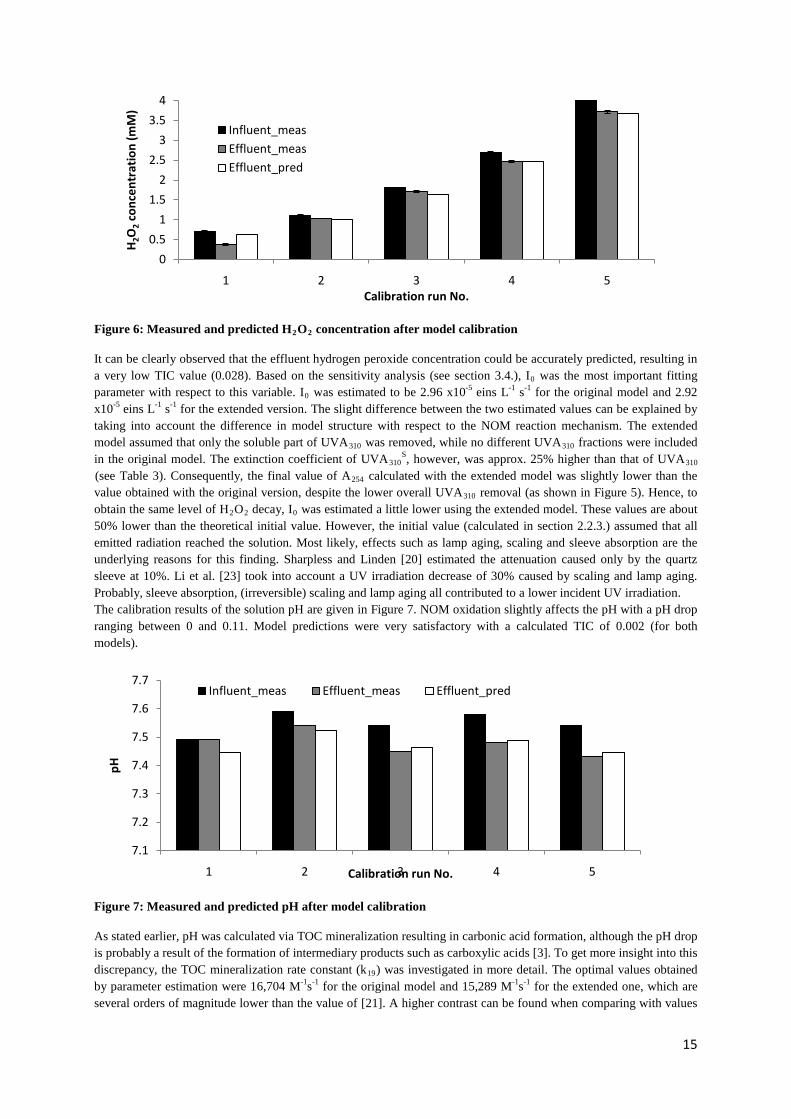
Figure 6: Measured and predicted H2O2
It can be clearly observed that the effluent hydrogen peroxide concentration could be accurately predicted, resulting in a very low TIC value (0.028). Based on the sensitivity analysis (see section 3.4.), I
concentration after model calibration
0 was the most important fitting parameter with respect to this variable. I0 was estimated to be 2.96 x10⁻⁵ eins L-1 s-1 for the original model and 2.92 x10⁻⁵ eins L-1 s-1 for the extended version. The slight difference between the two estimated values can be explained by taking into account the difference in model structure with respect to the NOM reaction mechanism. The extended model assumed that only the soluble part of UVA310 was removed, while no different UVA310 fractions were included in the original model. The extinction coefficient of UVA310
S, however, was approx. 25% higher than that of UVA310
(see Table 3). Consequently, the final value of A254 calculated with the extended model was slightly lower than the value obtained with the original version, despite the lower overall UVA310 removal (as shown in Figure 5). Hence, to obtain the same level of H2O2 decay, I0
The calibration results of the solution pH are given in Figure 7. NOM oxidation slightly affects the pH with a pH drop ranging between 0 and 0.11. Model predictions were very satisfactory with a calculated TIC of 0.002 (for both models).
was estimated a little lower using the extended model. These values are about 50% lower than the theoretical initial value. However, the initial value (calculated in section 2.2.3.) assumed that all emitted radiation reached the solution. Most likely, effects such as lamp aging, scaling and sleeve absorption are the underlying reasons for this finding. Sharpless and Linden [20] estimated the attenuation caused only by the quartz sleeve at 10%. Li et al. [23] took into account a UV irradiation decrease of 30% caused by scaling and lamp aging. Probably, sleeve absorption, (irreversible) scaling and lamp aging all contributed to a lower incident UV irradiation.
Figure 7: Measured and predicted pH after model calibration
As stated earlier, pH was calculated via TOC mineralization resulting in carbonic acid formation, although the pH drop is probably a result of the formation of intermediary products such as carboxylic acids [3]. To get more insight into this discrepancy, the TOC mineralization rate constant (k19) was investigated in more detail. The optimal values obtained by parameter estimation were 16,704 M-1s-1 for the original model and 15,289 M-1s-1 for the extended one, which are several orders of magnitude lower than the value of [21]. A higher contrast can be found when comparing with values
0
0.5
1
1.5
2
2.5
3
3.5
4
1 2 3 4 5
H2O
2co
ncen
trat
ion
(mM
)
Calibration run No.
Influent_measEffluent_measEffluent_pred
7.1
7.2
7.3
7.4
7.5
7.6
7.7
1 2 3 4 5
pH
Calibration run No.
Influent_meas Effluent_meas Effluent_pred

16
reported by [27] and [40] which varied between 1 x10⁸ and 1 x10⁹ M-1s-1. Liao and Gurol [22] used parameter estimation to determine the rate constant for the reaction of a known humic acid with the *OH radical and found a value of 1.9 x10⁸ M-1s-1. The contradictory outcome of k19 probably has the following two explanations: (i)describing TOC mineralization (and carbonic acid formation) by a second order relationship is not valid, which can be substantiated by studying the shape of a typical TOC concentration-time profile and (ii) if this wrong assumption is used, the implementation of a stoichiometric conversion factor (S) is essential, as only a fraction of the *OH-TOC reaction events directly forms carbon dioxide. Consequently, an implementation in the form of Sxk19 in the mass balance of TOC has to be performed. E.g. if it is assumed that in this study k19 has a value of 2 x10⁸, which is in the range of the reported values, the stoichiometric factor in this case would be around 7.6 x10⁻⁵ mole carbon dioxide per mole *OH radicals. The product of those values gives the estimated k19
3.3. Model validation
. It is noteworthy that the calculated stoichiometric factor is merely a rough estimate to illustrate a possible kinetic implementation and needs further validation. However, the simplistic assumption apparently resulted in a good agreement between experimental determined and calculated pH values.
To check the model validity, an independent set of experimental data was used as input for the model. The same three variables were used to evaluate the model predictions. Validation results for the UVA310 are shown in Figure 8. This graph indicates a successful validation. Very low TIC values of 0.056 and 0.052 for the original and extended model, respectively, confirmed the good agreement between experimental and calculated data. Based on TIC, the extended model thus gives a slightly better result which is, however, proven to be not not statistically significant using an F-test [41]. These data were collected at least four months before the data for calibration (and data of run No’s 1 and 2 with another two weeks difference). The deviations between experimental and predicted data are most likely a result of a changing NOM content and its complex reaction mechanism. The specific UV absorption coefficient at 254nm (SUVA254, (mg C/L-1)cm-1) which is calculated by dividing the UVA254 by the TOC concentration (in mg L-1) is often related to the reactivity of NOM [30]. The mean SUVA of the influent during the calibration experiments was around 0.0108 (mg C/L-1)cm-1
while that of the validation runs was approximately 20% less. SUVA values and dates of data collection are given in Table 4.
Figure 8: Measured and predicted UVA310
Rosenfeldt and Linden [17] recognized the complexity of performing modelling studies in the presence of an unknown NOM matrix. Several factors that can influence the reaction rate are not included in the model. pH may affect the reactivity of the humic acid part of the DOC content. The reactivity of the deprotonated and thus negatively charged form is usually higher than that of the protonated form because of the decreased nucleophilicity [42]. However, this effect is probably of less importance as only minor changes in pH were observed during all experiments (see further). Moreover, a part of NOM acts as direct radical scavenger, while another fraction can act as a chain promoter [27]. Another issue that may affect the UVA
in the validation process
310S concentration profile is the formation of oxidation by-products that have a
higher extinction coefficient at 254 nm than the parent compound. Glaze et al. [24] showed that during the oxidation of naphthalene naphthols and quinones are formed, which have higher absorptivities than naphthalene. Hence, a
-0.01
0.01
0.03
0.05
0.07
0.09
0.11
0.13
1 2 3 4 5
UV
A31
0(c
m-1
)
Validation run No.
Influent_meas Effluent_meas Effluent_pred_orig_model Effluent_pred_ext_model

17
stabilization of UVA was observed during prolonged oxidation. These results suggest that UVA310
The validation results for hydrogen peroxide are depicted in Figure 9. Again, simulation outputs of both models were not presented separately as these results were almost identically.
is a promising variable to be part of future and more complex models but more studies are needed to further improve the predictions.
Figure 9: Measured and predicted H2O2
Bearing in mind the excellent calibration results, the hydrogen peroxide concentration was expected to show good predictions during validation. Indeed, the residual hydrogen peroxide concentration was described very well by the model, with a resulting TIC value of 0.026. However, a slight underestimation of the H
concentration in the validation process
2O2 concentration can be observed. Although the UVA310 extinction coefficients εUVA310 (for the original model) and εUVA310S and εUVA310X (for the extended model) showed some time-related variations, they are unlikely to significantly influence the hydrogen peroxide conversion as they can be classified as not influential with regard to this variable (see further in section 3.4.). On the other hand, a process variable that is not included in the model and known to alter chemical rate constants is temperature. As mentioned before, the data collection for calibration and validation was separated by several months. The water temperature in the secondary sedimentation basin however, is to a large extent dependent on weather conditions. A comparison of the influent temperatures during calibration and validation experiments revealed a mean difference of 8°C. Performing the calibration procedure at significantly higher influent temperatures most likely resulted in a higher hydrogen peroxide decomposition rate. Hence, this leads to an overestimation of this rate when using the validation data which was collected at colder reactor temperatures. Possibly, some of the rate constants related to indirect hydrogen peroxide decomposition (k1-k6
The validation results for pH are presented in Figure 10. For the same reason as mentioned above, simulation outputs of both models were presented by just one bar. A satisfactory model prediction was obtained (TIC=0.01). The shape of the calculated curve describes the general trend of the experimental data points very well. The influent pH of run Nos 3 to 5 is relatively high compared to all others, which explains the more drastic pH drops during AOP treatment (as pH is a logarithmic scale). However, the model significantly underestimates the acid formation of these runs. This can be a result of time-related changes of TOC characteristics with respect to reactivity (the variability of SUVA was discussed earlier).
) are temperature dependent [43]. However, this issue was not subject of this study and needs further investigation.
0.000
0.500
1.000
1.500
2.000
2.500
3.000
3.500
4.000
1 2 3 4 5
H2O
2co
ncen
trat
ion
(mM
)
Validation run No.
Influent_meas
Effluent_meas
Effluent_pred
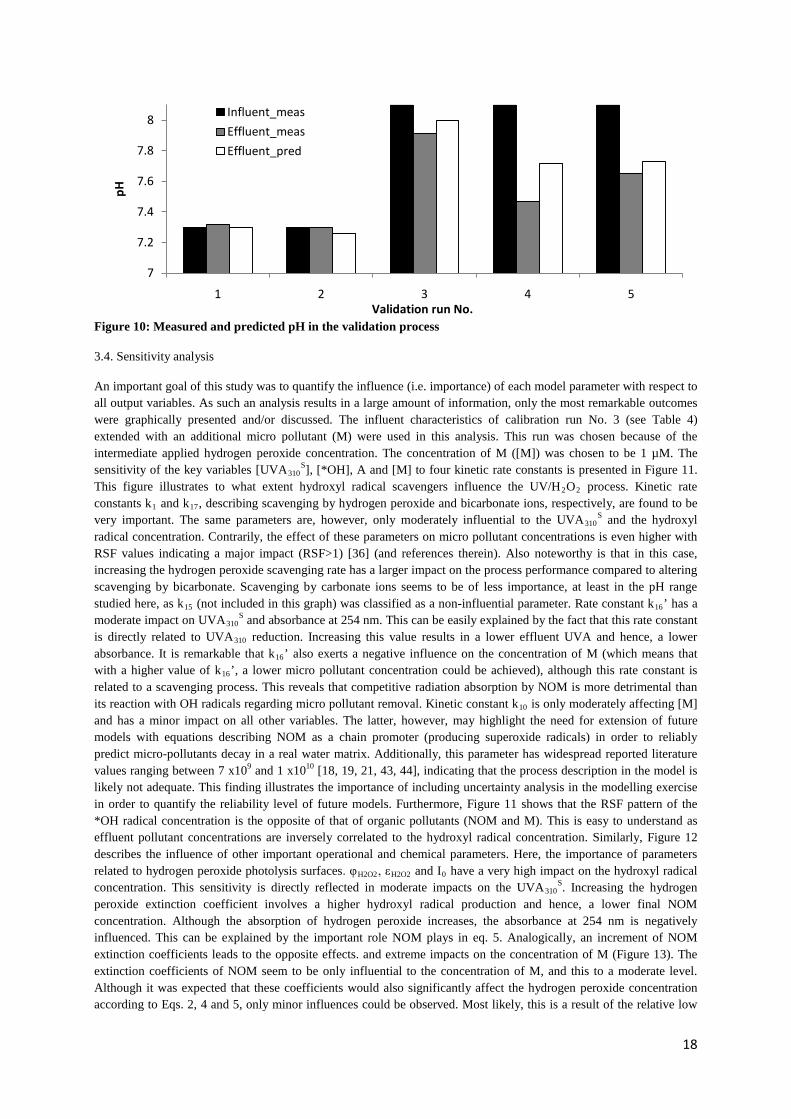
18
Figure 10: Measured and predicted pH in the validation process
3.4. Sensitivity analysis
An important goal of this study was to quantify the influence (i.e. importance) of each model parameter with respect to all output variables. As such an analysis results in a large amount of information, only the most remarkable outcomes were graphically presented and/or discussed. The influent characteristics of calibration run No. 3 (see Table 4) extended with an additional micro pollutant (M) were used in this analysis. This run was chosen because of the intermediate applied hydrogen peroxide concentration. The concentration of M ([M]) was chosen to be 1 µM. The sensitivity of the key variables [UVA310
S], [*OH], A and [M] to four kinetic rate constants is presented in Figure 11. This figure illustrates to what extent hydroxyl radical scavengers influence the UV/H2O2 process. Kinetic rate constants k1 and k17, describing scavenging by hydrogen peroxide and bicarbonate ions, respectively, are found to be very important. The same parameters are, however, only moderately influential to the UVA310
S and the hydroxyl radical concentration. Contrarily, the effect of these parameters on micro pollutant concentrations is even higher with RSF values indicating a major impact (RSF>1) [36] (and references therein). Also noteworthy is that in this case, increasing the hydrogen peroxide scavenging rate has a larger impact on the process performance compared to altering scavenging by bicarbonate. Scavenging by carbonate ions seems to be of less importance, at least in the pH range studied here, as k15 (not included in this graph) was classified as a non-influential parameter. Rate constant k16’ has a moderate impact on UVA310
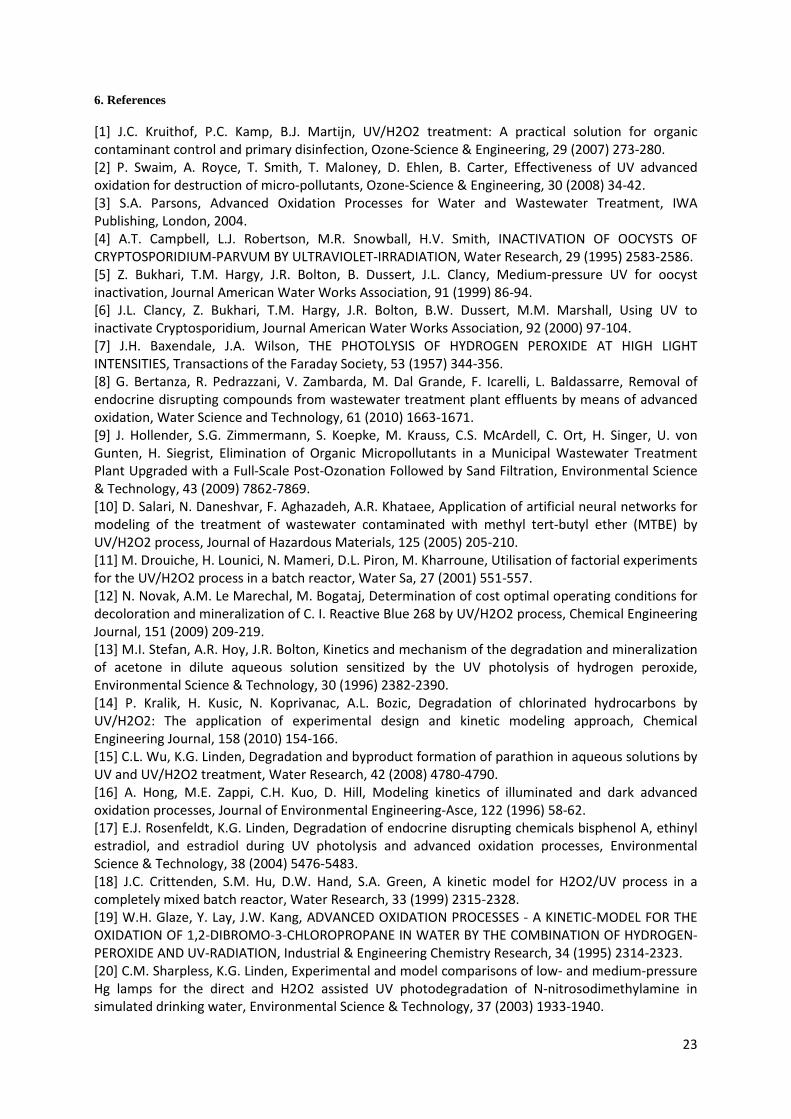
S and absorbance at 254 nm. This can be easily explained by the fact that this rate constant is directly related to UVA310 reduction. Increasing this value results in a lower effluent UVA and hence, a lower absorbance. It is remarkable that k16’ also exerts a negative influence on the concentration of M (which means that with a higher value of k16’, a lower micro pollutant concentration could be achieved), although this rate constant is related to a scavenging process. This reveals that competitive radiation absorption by NOM is more detrimental than its reaction with OH radicals regarding micro pollutant removal. Kinetic constant k10 is only moderately affecting [M] and has a minor impact on all other variables. The latter, however, may highlight the need for extension of future models with equations describing NOM as a chain promoter (producing superoxide radicals) in order to reliably predict micro-pollutants decay in a real water matrix. Additionally, this parameter has widespread reported literature values ranging between 7 x10⁹ and 1 x10¹⁰ [18, 19, 21, 43, 44], indicating that the process description in the model is likely not adequate. This finding illustrates the importance of including uncertainty analysis in the modelling exercise in order to quantify the reliability level of future models. Furthermore, Figure 11 shows that the RSF pattern of the *OH radical concentration is the opposite of that of organic pollutants (NOM and M). This is easy to understand as effluent pollutant concentrations are inversely correlated to the hydroxyl radical concentration. Similarly, Figure 12 describes the influence of other important operational and chemical parameters. Here, the importance of parameters related to hydrogen peroxide photolysis surfaces. φH2O2, εH2O2 and I0 have a very high impact on the hydroxyl radical concentration. This sensitivity is directly reflected in moderate impacts on the UVA310
S. Increasing the hydrogen peroxide extinction coefficient involves a higher hydroxyl radical production and hence, a lower final NOM concentration. Although the absorption of hydrogen peroxide increases, the absorbance at 254 nm is negatively influenced. This can be explained by the important role NOM plays in eq. 5. Analogically, an increment of NOM extinction coefficients leads to the opposite effects. and extreme impacts on the concentration of M (Figure 13). The extinction coefficients of NOM seem to be only influential to the concentration of M, and this to a moderate level. Although it was expected that these coefficients would also significantly affect the hydrogen peroxide concentration according to Eqs. 2, 4 and 5, only minor influences could be observed. Most likely, this is a result of the relative low
7
7.2
7.4
7.6
7.8
8
1 2 3 4 5
pH
Validation run No.
Influent_meas
Effluent_meas
Effluent_pred
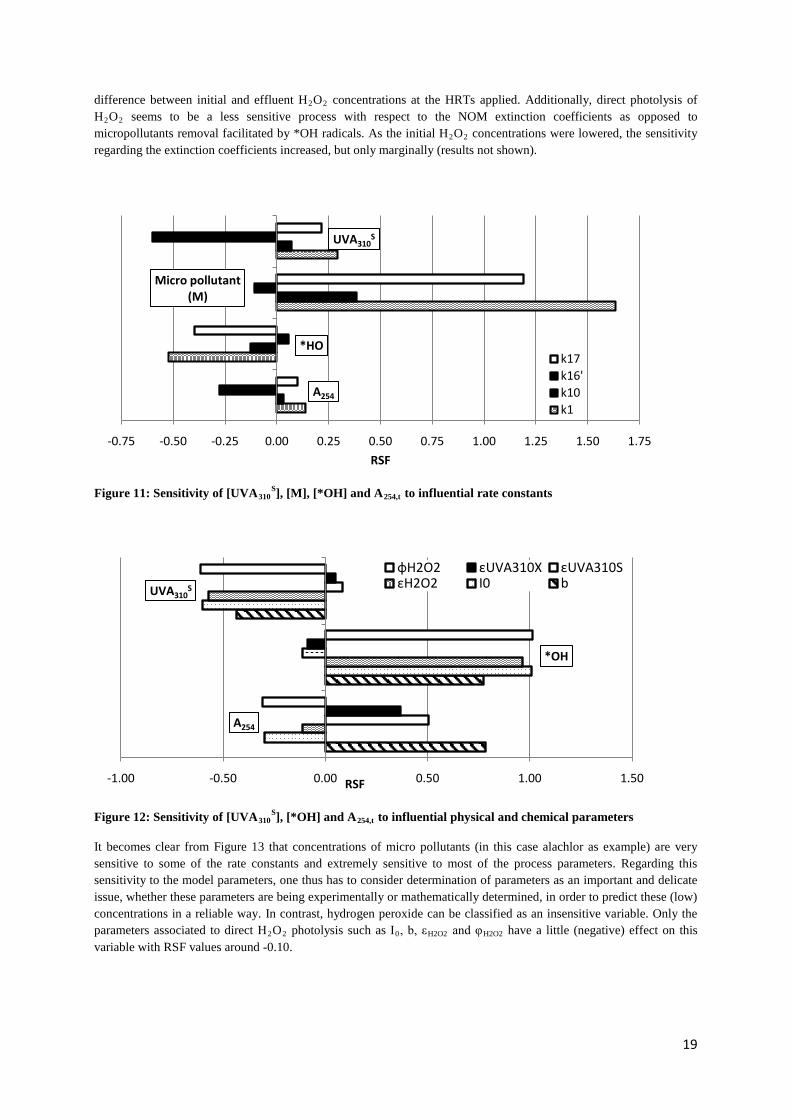
19
difference between initial and effluent H2O2 concentrations at the HRTs applied. Additionally, direct photolysis of H2O2 seems to be a less sensitive process with respect to the NOM extinction coefficients as opposed to micropollutants removal facilitated by *OH radicals. As the initial H2O2
concentrations were lowered, the sensitivity regarding the extinction coefficients increased, but only marginally (results not shown).
Figure 11: Sensitivity of [UVA310S], [M], [*OH] and A254,t
to influential rate constants
Figure 12: Sensitivity of [UVA310S], [*OH] and A254,t
It becomes clear from Figure 13 that concentrations of micro pollutants (in this case alachlor as example) are very sensitive to some of the rate constants and extremely sensitive to most of the process parameters. Regarding this sensitivity to the model parameters, one thus has to consider determination of parameters as an important and delicate issue, whether these parameters are being experimentally or mathematically determined, in order to predict these (low) concentrations in a reliable way. In contrast, hydrogen peroxide can be classified as an insensitive variable. Only the parameters associated to direct H
to influential physical and chemical parameters
2O2 photolysis such as I0, b, εH2O2 and φH2O2 have a little (negative) effect on this variable with RSF values around -0.10.
A254
*HO
Micro pollutant (M)
UVA310S
-0.75 -0.50 -0.25 0.00 0.25 0.50 0.75 1.00 1.25 1.50 1.75
RSF
k17k16'k10k1
A254
*OH
UVA310S
-1.00 -0.50 0.00 0.50 1.00 1.50RSF
φH2O2 εUVA310X εUVA310SεH2O2 I0 b

20
Figure 13: Influence of process and chemical parameters on the prediction of a micro pollutants concentration [M]
The influence of the most important parameters regarding the concentrations of the intermediate radical species is given in Figure 14. Again, parameters related to hydrogen peroxide photolysis are moderately to very influential which can be easily understood as the initiation reaction is the driving force of the radical chain. In addition, the scavenging reaction of hydrogen peroxide producing the superoxide anion is of moderate importance. The dissociation constant of carbonic acid moderately affects the superoxide and hydroperoxyl concentrations. Raising KaH2CO3
results in a stronger pH drop and, hence, in a shift from the superoxide to the protonated hydroperoxyl species.
Figure 14: sensitivities of the intermediate radical species to their most influential parameters
Although just very little amounts of the protonated form are produced at the pH levels in this study (pKaHO2.=4.8), the dissociation constant of carbonic acid (and thus pH) has a moderate impact on the superoxide anion concentration. This may indicate that the termination reaction from the protonated and diprotonated form to hydrogen peroxide is of major importance. This was confirmed by the RSF value of k12 indicating a moderate impact. The principal fate of the carbonate radical probably is its reaction with hydrogen peroxide [19]. A strong impact of the rate constant related to this reaction (k5
Nine rate constants showed to exert absolutely no influence to all of the variables: k
) supported this finding. Another but slightly less important termination step with respect to this radical is the reaction with the superoxide anion. The involvement of bicarbonate in carbonate radical production seemed to be negligible at the applied pH values.
2-k4, k6-k9 and k13 and k14. Fábián [44] mechanistically modeled ozone decomposition in the presence of hydrogen peroxide and removed some of these kinetic parameters. Also in this study, the reliability of the handful of literature reported kinetic parameters was
I0
b
εH2O2
εM
εUVA310S
εUVA310X
k18
φH2O2
φM
-4.50 -3.50 -2.50 -1.50 -0.50 0.50 1.50RSF
HO2•
CO3-•
O2-•
-1.00 -0.75 -0.50 -0.25 0.00 0.25 0.50 0.75 1.00 1.25RSF
k1 bεH2O2 Ka_HO2•Ka_H2CO3 I0

21
questioned. They were therefore determined by mathematical parameter estimation. Another parameter that was of negligible influence was εHO2-, at least at the conditions used in this study. Despite the contrast with the value of εH2O2
4. Conclusions
, the dissociation of hydrogen peroxide seems to be of minor importance.
Mechanistic modeling of organic matter conversions during AOP treatment is one of the current research challenges. Although these mechanisms are often very complex and highly time and case dependent, completing this exercise is essential in order to provide models that are widely applicable and can be used for system optimisation and process control. In this study, an existing UV/H2O2 model containing a general accepted radical mechanism was calibrated and validated using data of a full-scale reactor treating non-synthetic influent. It was shown that using the decadic absorption coefficient at 310 nm is a useful variable to include in AOP models. Both the models were able to describe the residual hydrogen peroxide concentration, NOM conversions in terms of UVA310 and acid formation resulting in pH drops. The models were successfully validated. Model extension by splitting up the UVA310
Making models more complex at one side might be performed in parallel with simplifying the models at the side of the radical mechanism in order to balance the model complexity. Sensitivity analysis can be of great value in this context as it indicates insensitive model parameters. Additionally, the sensitivity output provides information that can be valuable in process engineering as the most important parameters are determined. Model simplification will be part of future research but was beyond the scope of this work. This study revealed that the UV/H
into a soluble and a particulate fraction seemed to be a good approach to model AOP treatment of real (waste)waters containing both dissolved and particulate (suspended) material. Based on TIC, predictions of the extended model were slightly better than those of the original model but differences were not statistically significant. Hence, further model development, has to focus on understanding and effectively extending the concept of (natural) organic matter conversion. A small attempt to extend an existing model was made in this study. To build these more complex models, more advanced measurement techniques should be used that provide more detailed information about the characteristics of the organic matrix such as mass spectrometry and polarity measurements. On-line spectral measurements could be of great value in this context as they often supply a large amount of (reliable) data. Future AOP models should also incorporate parameter and input uncertainty to quantify their output uncertainty. This is a very important issue with respect to full-scale applications.
2O2
process is highly affected by just a fraction of the operational and chemical parameters. Parameters that determine the initiation step, i.e. photolysis of hydrogen peroxide, are very influential to most of the variables. Some reaction rate constants, however, were also of importance. Residual hydrogen peroxide concentration could be classified as a non-sensitive variable. This is in contrast with the extreme sensitivity of micro pollutant concentrations to most of the process parameters. In order to predict these in a reliable way, one thus has to consider determination of parameters as an important and delicate issue, whether these parameters are being experimentally or mathematically determined.
5. Acknowledgements
The authors gratefully acknowledge Hans Pattyn of the V.T.I.-VSBBO Poperinge for the cooperation and making the sampling campaign possible. This research was partially funded by a University College West Flanders PhD research grant and is in close cooperation with the Veg-i-Trade FP7-KBBE-2009-3 project.

22
Appendix
Composing mass balances from the Gujer matrix
As an example, the mass balance of HCO3- is derived from the Gujer matrix. The mass balance is built up by first
multiplying each matrix element of the column of HCO3- by the reaction rate at the same row of the element. A
summation of these products yields the conversion terms of the mass balance. The complete mass balance of a species concentration (in this case HCO3
-
) consists of transportation and conversion terms:
𝑟𝑟𝐻𝐻𝐶𝐶𝑂𝑂3− = 𝑑𝑑[𝐻𝐻𝐶𝐶𝑂𝑂3
−]𝑑𝑑𝑑𝑑
= 𝑑𝑑𝑟𝑟𝑎𝑎𝑡𝑡𝑡𝑡𝑡𝑡𝑡𝑡𝑟𝑟𝑑𝑑 + 𝑐𝑐𝑡𝑡𝑡𝑡𝑐𝑐𝑐𝑐𝑟𝑟𝑡𝑡𝑖𝑖𝑡𝑡𝑡𝑡 (14) To describe the bicarbonate concentration in the ith
𝑑𝑑𝑟𝑟𝑎𝑎𝑡𝑡𝑡𝑡𝑡𝑡𝑡𝑡𝑟𝑟𝑑𝑑 =
reactor of n completely stirred tank reactors (CSTRs) in series operating in a continuous flow mode, transportation terms must be added as follows:
𝑄𝑄𝑈𝑈𝑡𝑡
([𝐻𝐻𝐶𝐶𝑂𝑂3−]𝑡𝑡𝑜𝑜𝑑𝑑 ,𝑖𝑖−1 − �𝐻𝐻𝐶𝐶𝑂𝑂3
−]𝑡𝑡𝑜𝑜𝑑𝑑 ,𝑖𝑖� (15)
Where Q represents the flow rate (L s-1) and Vn
is representing the volume of each single tank (L).
Using the Gujer matrix, the conversion terms are composed:
𝑐𝑐𝑡𝑡𝑡𝑡𝑐𝑐𝑐𝑐𝑟𝑟𝑡𝑡𝑖𝑖𝑡𝑡𝑡𝑡 =
+𝑘𝑘5 × [𝐻𝐻2𝑂𝑂2]𝑖𝑖 × [𝐶𝐶𝑂𝑂3−•]𝑖𝑖 + 𝑘𝑘6 × [𝐻𝐻𝑂𝑂2
−]𝑖𝑖 × [𝐶𝐶𝑂𝑂3−•]𝑖𝑖 + 𝑘𝑘11 × [𝑂𝑂2
−•]𝑖𝑖 × [𝐶𝐶𝑂𝑂3−•]𝑖𝑖 (16)
−𝑘𝑘15 × [𝐻𝐻𝑂𝑂• ]𝑖𝑖 × [𝐶𝐶𝑂𝑂32−]𝑖𝑖 − 𝑘𝑘17 × [𝐻𝐻𝑂𝑂• ]𝑖𝑖 × [𝐻𝐻𝐶𝐶𝑂𝑂3
−]𝑖𝑖
The complete mass balance is as follows: 𝑑𝑑[𝐻𝐻𝐶𝐶𝑂𝑂3
−]𝑖𝑖𝑑𝑑𝑑𝑑
=𝑄𝑄𝑈𝑈𝑡𝑡
([𝐻𝐻𝐶𝐶𝑂𝑂3−]𝑡𝑡𝑜𝑜𝑑𝑑 ,𝑖𝑖−1 − �𝐻𝐻𝐶𝐶𝑂𝑂3
−]𝑡𝑡𝑜𝑜𝑑𝑑 ,𝑖𝑖�
+𝑘𝑘5 × [𝐻𝐻2𝑂𝑂2]𝑖𝑖 × [𝐶𝐶𝑂𝑂3−•]𝑖𝑖 + 𝑘𝑘6 × [𝐻𝐻𝑂𝑂2
−]𝑖𝑖 × [𝐶𝐶𝑂𝑂3−•]𝑖𝑖 + 𝑘𝑘11 × [𝑂𝑂2
−•]𝑖𝑖 × [𝐶𝐶𝑂𝑂3−•]𝑖𝑖 (17)
−𝑘𝑘15 × [𝐻𝐻𝑂𝑂• ]𝑖𝑖 × [𝐶𝐶𝑂𝑂32−]𝑖𝑖 − 𝑘𝑘17 × [𝐻𝐻𝑂𝑂• ]𝑖𝑖 × [𝐻𝐻𝐶𝐶𝑂𝑂3
−]𝑖𝑖
23
6. References
[1] J.C. Kruithof, P.C. Kamp, B.J. Martijn, UV/H2O2 treatment: A practical solution for organic contaminant control and primary disinfection, Ozone-Science & Engineering, 29 (2007) 273-280. [2] P. Swaim, A. Royce, T. Smith, T. Maloney, D. Ehlen, B. Carter, Effectiveness of UV advanced oxidation for destruction of micro-pollutants, Ozone-Science & Engineering, 30 (2008) 34-42. [3] S.A. Parsons, Advanced Oxidation Processes for Water and Wastewater Treatment, IWA Publishing, London, 2004. [4] A.T. Campbell, L.J. Robertson, M.R. Snowball, H.V. Smith, INACTIVATION OF OOCYSTS OF CRYPTOSPORIDIUM-PARVUM BY ULTRAVIOLET-IRRADIATION, Water Research, 29 (1995) 2583-2586. [5] Z. Bukhari, T.M. Hargy, J.R. Bolton, B. Dussert, J.L. Clancy, Medium-pressure UV for oocyst inactivation, Journal American Water Works Association, 91 (1999) 86-94. [6] J.L. Clancy, Z. Bukhari, T.M. Hargy, J.R. Bolton, B.W. Dussert, M.M. Marshall, Using UV to inactivate Cryptosporidium, Journal American Water Works Association, 92 (2000) 97-104. [7] J.H. Baxendale, J.A. Wilson, THE PHOTOLYSIS OF HYDROGEN PEROXIDE AT HIGH LIGHT INTENSITIES, Transactions of the Faraday Society, 53 (1957) 344-356. [8] G. Bertanza, R. Pedrazzani, V. Zambarda, M. Dal Grande, F. Icarelli, L. Baldassarre, Removal of endocrine disrupting compounds from wastewater treatment plant effluents by means of advanced oxidation, Water Science and Technology, 61 (2010) 1663-1671. [9] J. Hollender, S.G. Zimmermann, S. Koepke, M. Krauss, C.S. McArdell, C. Ort, H. Singer, U. von Gunten, H. Siegrist, Elimination of Organic Micropollutants in a Municipal Wastewater Treatment Plant Upgraded with a Full-Scale Post-Ozonation Followed by Sand Filtration, Environmental Science & Technology, 43 (2009) 7862-7869. [10] D. Salari, N. Daneshvar, F. Aghazadeh, A.R. Khataee, Application of artificial neural networks for modeling of the treatment of wastewater contaminated with methyl tert-butyl ether (MTBE) by UV/H2O2 process, Journal of Hazardous Materials, 125 (2005) 205-210. [11] M. Drouiche, H. Lounici, N. Mameri, D.L. Piron, M. Kharroune, Utilisation of factorial experiments for the UV/H2O2 process in a batch reactor, Water Sa, 27 (2001) 551-557. [12] N. Novak, A.M. Le Marechal, M. Bogataj, Determination of cost optimal operating conditions for decoloration and mineralization of C. I. Reactive Blue 268 by UV/H2O2 process, Chemical Engineering Journal, 151 (2009) 209-219. [13] M.I. Stefan, A.R. Hoy, J.R. Bolton, Kinetics and mechanism of the degradation and mineralization of acetone in dilute aqueous solution sensitized by the UV photolysis of hydrogen peroxide, Environmental Science & Technology, 30 (1996) 2382-2390. [14] P. Kralik, H. Kusic, N. Koprivanac, A.L. Bozic, Degradation of chlorinated hydrocarbons by UV/H2O2: The application of experimental design and kinetic modeling approach, Chemical Engineering Journal, 158 (2010) 154-166. [15] C.L. Wu, K.G. Linden, Degradation and byproduct formation of parathion in aqueous solutions by UV and UV/H2O2 treatment, Water Research, 42 (2008) 4780-4790. [16] A. Hong, M.E. Zappi, C.H. Kuo, D. Hill, Modeling kinetics of illuminated and dark advanced oxidation processes, Journal of Environmental Engineering-Asce, 122 (1996) 58-62. [17] E.J. Rosenfeldt, K.G. Linden, Degradation of endocrine disrupting chemicals bisphenol A, ethinyl estradiol, and estradiol during UV photolysis and advanced oxidation processes, Environmental Science & Technology, 38 (2004) 5476-5483. [18] J.C. Crittenden, S.M. Hu, D.W. Hand, S.A. Green, A kinetic model for H2O2/UV process in a completely mixed batch reactor, Water Research, 33 (1999) 2315-2328. [19] W.H. Glaze, Y. Lay, J.W. Kang, ADVANCED OXIDATION PROCESSES - A KINETIC-MODEL FOR THE OXIDATION OF 1,2-DIBROMO-3-CHLOROPROPANE IN WATER BY THE COMBINATION OF HYDROGEN-PEROXIDE AND UV-RADIATION, Industrial & Engineering Chemistry Research, 34 (1995) 2314-2323. [20] C.M. Sharpless, K.G. Linden, Experimental and model comparisons of low- and medium-pressure Hg lamps for the direct and H2O2 assisted UV photodegradation of N-nitrosodimethylamine in simulated drinking water, Environmental Science & Technology, 37 (2003) 1933-1940.

24
[21] W. Song, V. Ravindran, M. Pirbazari, Process optimization using a kinetic model for the ultraviolet radiation-hydrogen peroxide decomposition of natural and synthetic organic compounds in groundwater, Chemical Engineering Science, 63 (2008) 3249-3270. [22] C.H. Liao, M.D. Gurol, CHEMICAL OXIDATION BY PHOTOLYTIC DECOMPOSITION OF HYDROGEN-PEROXIDE, Environmental Science & Technology, 29 (1995) 3007-3014. [23] K. Li, D.R. Hokanson, J.C. Crittenden, R.R. Trussell, D. Minakata, Evaluating UV/H2O2 processes for methyl tert-butyl ether and tertiary butyl alcohol removal: Effect of pretreatment options and light sources, Water Research, 42 (2008) 5045-5053. [24] W.H. Glaze, F. Beltran, T. Tuhkanen, J.-W. Kang, Chemical Models of Advanced Oxidation Processes, Water Poll. Res. J. Canada, 27 (1992) 23-42. [25] S.M. Alpert, D.R.U. Knappe, J.J. Ducoste, Modeling the UV/hydrogen peroxide advanced oxidation process using computational fluid dynamics, Water Research, 44 (2010) 1797-1808. [26] M. Mohajerani, M. Mehrvar, F. Ein-Mozaffari, CFD Modeling of Metronidazole Degradation in Water by the UV/H2O2 Process in Single and Multilamp Photoreactors, Industrial & Engineering Chemistry Research, 49 (2010) 5367-5382. [27] P. Westerhoff, R. Song, G. Amy, R. Minear, Applications of ozone decomposition models, Ozone-Science & Engineering, 19 (1997) 55-73. [28] S.E. Braslavsky, Glossary of terms used in Photochemistry 3(rd) Edition (IUPAC Recommendations 2006), Pure and Applied Chemistry, 79 (2007) 293-465. [29] F.J. Beltran, M. Gonzalez, J.F. Gonzalez, Industrial wastewater advanced oxidation .1. UV radiation in the presence and absence of hydrogen peroxide, Water Research, 31 (1997) 2405-2414. [30] P. Westerhoff, G. Aiken, G. Amy, J. Debroux, Relationships between the structure of natural organic matter and its reactivity towards molecular ozone and hydroxyl radicals, Water Research, 33 (1999) 2265-2276. [31] M. Henze, W. Gujer, T. Mino, M. van Loodsrecht, Activated sludge models ASM1, ASM2, ASM2d and ASM3, IWA Publishing, London, 2000. [32] F.H.A. Claeys, P. Fritzson, P.A. Vanrolleghem, Generating efficient executable models for complex virtual experimentation with the Tornado kernel, Water Science and Technology, 56 (2007) 65-73. [33] A.C. Hindmarsh, L.R. Petzold, Algorithms and software for ordinary differential equations and differential-algebraic equations, Computers in Physics, 9 (1995) 148-155. [34] G.F. Froment, K.B. Bischoff, Chemical Reactor Analysis and Design, 2 ed., John Wiley & Sons, New York, 1990. [35] K.G. Linden, C.M. Sharpless, S. Andrews, K. Atasi, V. Korategere, M. Stefan, I.H.M. Suffet, Innovative UV Technologies to Oxidize Organic and Organoleptic Chemicals, IWA Publishing, London, 2005. [36] W.T.M. Audenaert, M. Callewaert, I. Nopens, J. Cromphout, R. Vanhoucke, A. Dumoulin, P. Dejans, S.W.H. Van Hulle, Full-scale modelling of an ozone reactor for drinking water treatment, Chemical Engineering Journal, 157 (2010) 551-557. [37] N.V. Klassen, D. Marchington, H.C.E. McGowan, H2O2 DETERMINATION BY THE I-3(-) METHOD AND BY KMNO4 TITRATION, Analytical Chemistry, 66 (1994) 2921-2925. [38] D. Belhateche, J.M. Symons, USING COBALT ULTRAVIOLET SPECTROPHOTOMETRY TO MEASURE HYDROGEN-PEROXIDE CONCENTRATION IN ORGANICALLY LADEN GROUNDWATERS, Journal American Water Works Association, 83 (1991) 70-73. [39] Standard Methods for the Examination of Water and Wastewater, in, American Public Health Association Inc., New York, 1992. [40] P. Westerhoff, S.P. Mezyk, W.J. Cooper, D. Minakata, Electron pulse radiolysis determination of hydroxyl radical rate constants with Suwannee river fulvic acid and other dissolved organic matter isolates, Environmental Science & Technology, 41 (2007) 4640-4646. [41] P. Kletting, G. Glatting, Model selection for time-activity curves: the corrected Akaike information criterion and the F-test, Z Med Phys, 19 (2009) 200-206.

25
[42] U. von Gunten, Ozonation of drinking water: Part I. Oxidation kinetics and product formation, Water Research, 37 (2003) 1443-1467. [43] F.G. Einschlag, M.R. Feliz, A.L. Capparelli, Effect of temperature on hydrogen peroxide photolysis in aqueous solutions, Journal of Photochemistry and Photobiology a-Chemistry, 110 (1997) 235-242. [44] I. Fabian, Reactive intermediates in aqueous ozone decomposition: A mechanistic approach, Pure and Applied Chemistry, 78 (2006) 1559-1570.