application of a real-time qpcr method for detection
TRANSCRIPT

P.O. Box 1390, Skulagata 4
120 Reykjavik, Iceland Final Project 2008
APPLICATION OF A REAL-TIME qPCR METHOD FOR DETECTION OF
SALMONELLA SPP. IN SHRIMP AND SCALLOP AND ITS PARTIAL
VALIDATION
Md. Murad Mufty
Department of Fisheries,
Bangladesh [email protected]
Supervisors
Professor Hjorleifur Einarsson, PhD
University of Akureyri, Iceland [email protected]
and
Associate Professor Kristinn P. Magnusson, PhD
University of Akureyri, Iceland [email protected]
ABSTRACT
Salmonella is one of the major causes of foodborne infection in humans, referred to as
salmonellosis. It is common worldwide and widespread in fisheries products of
Bangladesh because of poor post-harvest handling. The conventional microbiological
detection methods of Salmonella require more time and need many tests for the
confirmation of pathogenicity. Therefore, the requirement for more rapid and
conformatory methods of Salmonella detection becomes apparent. The purpose of this
study was to apply the real-time qPCR (Quantitative Polymerase Chain Reaction)
method for detection of Salmonella spp. in shrimp (Pandalus borealis) and scallop
(Chlamys islandica), which is more convenient and less time consuming than
conventional microbiological methods. In addition, its partial validation will be
developed further for routine analysis of shrimp and fish. PCR and real-time qPCR
were initially tested and compared with pure culture of seven Salmonella spp. Each
detection method was tested using artificially contaminated shrimp and scallop
samples. The method validation of the real-time PCR method was performed
according to ISO 17025 in contrast to qualitative, quantitative and reliability criteria
of validation. The sensitivity of the real-time PCR, as well as the decreased time
requirements of this detection method, would suggest its usefulness in commercial
laboratory practices.
Keywords: Polymerase Chain Reaction (PCR), Salmonella spp. real-time PCR,
shrimp.

Mufty
2
UNU-Fisheries Training Programme
TABLE OF CONTENTS
LIST OF TABLES ....................................................................................................... 5
LIST OF FIGURES ..................................................................................................... 5
TERMS ......................................................................................................................... 7
LIST OF ABBREVIATIONS ..................................................................................... 8
1 INTRODUCTION ................................................................................................ 9
1.1 Present fisheries situation of Bangladesh .......................................................... 9
1.2 Food hazards ................................................................................................... 10
1.3 Salmonella ........................................................................................................ 10
1.4 Methods of Salmonella detection ..................................................................... 11
1.5 Method validation ............................................................................................ 11
1.6 Polymerase Chain Reaction (PCR) ................................................................. 12
1.7 PCR in Bangladesh .......................................................................................... 13
1.8 Objectives ......................................................................................................... 13
2 LITERATURE REVIEW ................................................................................. 14
3 MATERIALS AND METHODS ...................................................................... 18
3.1 Salmonella strains ............................................................................................ 18
3.2 Preparation of pure culture of Salmonella spp. for DNA extraction ............... 18
3.3 Preparation of spiked shrimp and scallop samples and estimation of the
contamination levels ................................................................................................ 18
3.4 Proficiency testing for Salmonella ................................................................... 20
3.5 Culture of E.Coli for the negative control of PCR and real-time PCR ........... 21
3.6 Salmonella detection in environmental swab samples ..................................... 21
3.6.1 Sample collection ..................................................................................... 21
3.6.2 Sample preparation for DNA extraction .................................................. 22
3.7 DNA extraction ................................................................................................ 22
3.7.1 Method:1 .................................................................................................. 22
3.7.2 Method: 2 ................................................................................................. 23
3.8 Calculation of the amount of DNA ................................................................... 23
3.9 Optimisation of PCR ........................................................................................ 23
3.10 Protocol of the PCR ..................................................................................... 25
3.11 Salmonella strains in PCR ........................................................................... 26
3.12 Spiked shrimp and scallop analysis for Salmonella on PCR ....................... 27

Mufty
3
UNU-Fisheries Training Programme
3.13 PCR of the proficiency testing sample ......................................................... 27
3.14 Environmental swab samples ....................................................................... 27
3.15 SYBR Green real-time qPCR ....................................................................... 27
3.15.1 Concept of SYBR Green real-time qPCR ............................................ 27
3.15.2 Protocol of the SYBR real-time qPCR ................................................ 27
3.16 Creating a gDNA standard curve for Salmonella serovar Montevideo from
real-time qPCR ........................................................................................................ 28
3.16.1 Standard curve from Maxima TM SYBR Green qPCR Master Mix
(2X) 28
3.17 Real-time qPCR with spiked shrimp and scallop ......................................... 31
3.18 Quantification Salmonella DNA from shrimp and scallop samples ............ 31
3.19 Validation ..................................................................................................... 32
4 STATISTICS ...................................................................................................... 32
5 RESULTS ........................................................................................................... 33
5.1 Optimisation of PCR ........................................................................................ 33
5.2 Salmonella strains ............................................................................................ 34
5.3 Spiked shrimp and scallop samples ................................................................. 36
5.4 Reference sample ............................................................................................. 36
5.5 Environmental swab samples ........................................................................... 37
5.6 Creating a gDNA standard curve for Salmonella serovar Montevideo from
real-time qPCR ........................................................................................................ 39
5.6.1 Standard curve from Maxima TM SYBR Green Qpcr Master Mix (2X) 39
5.6.2 Standard curve from Power SYBR Green Qpcr Master Mix ................. 40
5.7 Real-time PCR with spiked shrimp and scallop ............................................... 41
5.8 Quantitation of Salmonella DNA in shrimp and scallop ................................. 43
5.9 Development of real-time qPCR methods for detection of Salmonella spp. .... 44
5.10 Validation of real-time qPCR for detection of Salmonella spp. .................. 44
6 DISCUSSION ..................................................................................................... 46
7 CONCLUSIONS AND RECOMMENDATIONS ........................................... 48
7.1 Future works .................................................................................................... 48
DEDICATION ............................................................................................................ 49
ACKNOWLEDGEMENTS ...................................................................................... 49
LIST OF REFERENCES .......................................................................................... 50
Appendix 1: Real-Time PCR Fluorescence quantity against cycles in six dilution
series (106,105,104,103,102,101) of Salmonella serovar Montevideo in Maxima

Mufty
4
UNU-Fisheries Training Programme
TM SYBR Green qPCR Master Mix (2X), E.coli and non-DNA template were
used as negative control. ............................................................................................ 56
Appendix 2: Real-Time PCR Fluorescence quantity against cycles in six dilution
series (106,105,104,103,102,101) of Salmonella serovar Montevideo in Power
SYBR Green qPCR Master Mix. .............................................................................. 57
Appendix 3: Real-Time PCR Fluorescence quantity against cycles in two dilution
series (106,103) of spiked Salmonella serovar Montevideo into shrimp (Pandalus
borealis) and scallop (Chlamys islandica) in Power SYBR Green qPCR Master
Mix. Non-spiked shrimp, scallop and non-DNA template were used as negative
control. ........................................................................................................................ 58

Mufty
5
UNU-Fisheries Training Programme
LIST OF TABLES
Table 1: Overview of primers and corresponding characteristics ............................... 24 Table 2: The reaction mixture used for primer concentration for optimisation of the
PCR .............................................................................................................................. 24
Table 3: Primer concentrations used for optimisation ................................................. 25 Table 4: Reaction mixture used for assay development of the PCR ............................ 25 Table 5: Reaction mixture used for assay development of the SYBR real-time qPCR28 Table 6: Six dilutions series in 2 μl template DNA of Salmonella serovar Montevideo29 Table 7: Copy of invA gene in dilutions of template DNA of Salmonella serovar
Montevideo. ................................................................................................................. 30 Table 8: Temperature Protocol for real-time PCR ....................................................... 30 Table 11: Quantity of DNA in six Salmonella strains. ................................................ 35 Table 12: Quantity of Salmonella serovar Montevideo DNA in Pandalus borealis and
Chlamys islandica. ....................................................................................................... 36
Table 13: Quantity of DNA (invA gene) in spiked shrimp (Pandalus borealis) and
scallop (Chlamys islandica), calculated from the CT value of control/standard DNA
(Salmonella serover Montevodeo). .............................................................................. 44
LIST OF FIGURES
Figure 1: Flow diagram showing preparation of pure culture of Salmonella for spiking
of shrimp and scallop samples and isolation of DNA for PCR analysis. .................... 19 Figure 2: Salmonella strains in (a) TSI & LIA agar tube (b) nutrient broth (c) sub-
culture in TSI agar tube (d) nutrient agar plate (e) XLD agar plate ............................ 20 Figure 3: RV broth ready for DNA extraction in (a) 25 mL test-tube, (b) 1.5 mL tube22
Figure 4: PCR amplification of Salmonella serovar Montevideo on primer set (1)
Shima 122 bp (2) invA 119 bp (3) ttr6/4 94 bp (4) Sal/inv 139/141 284 bp. InvA 119
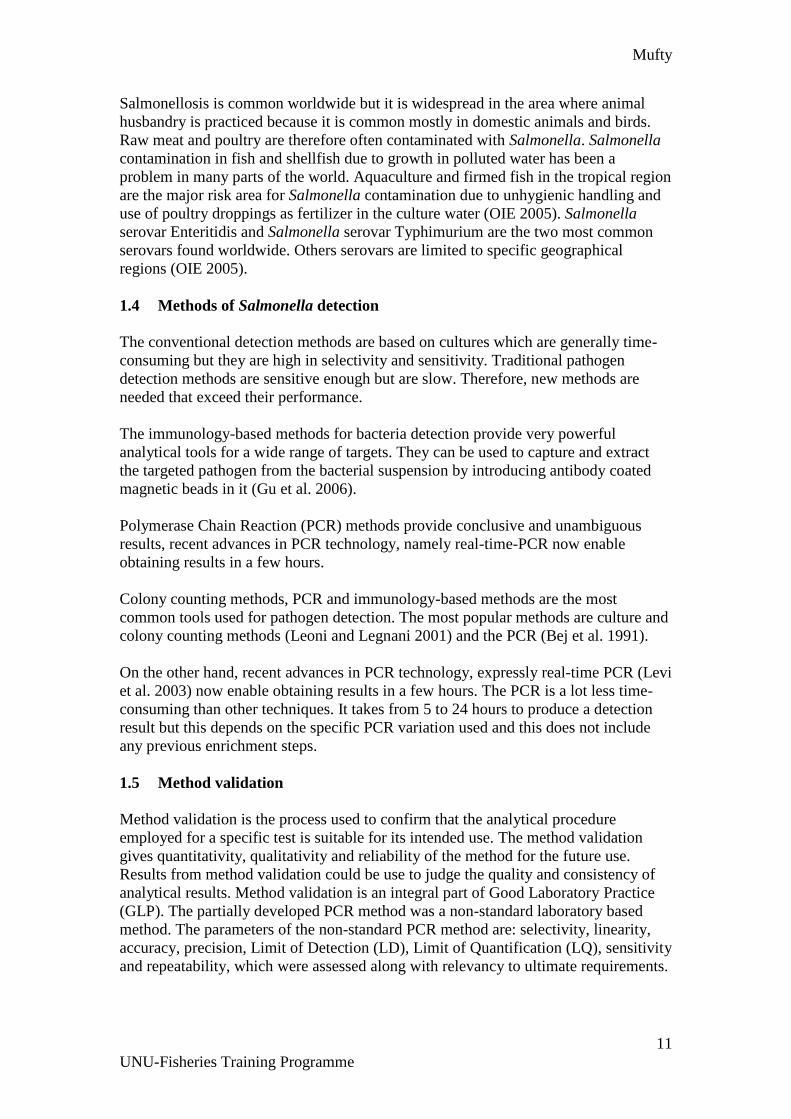
bp (arrow mark) shows the best band. ......................................................................... 33 Figure 5: PCR amplification of Salmonella spp. on 2% agarose gel by 119-base pair
invasion (invA) gene primer set in three different annealing temperatures (a) 55C (b)
58°C (c) 60°C; and six different concentrations of primer sets: 1. 0.3 μM Forward (F)
and Reverse (R) primer each with no template DNA. 2. 0.3 μM F and R primer. 3. 0.1
μM F and 0.3 μM R primer. 4. 0.1 μM F and R primer. 5. 0.2 μM Fand R primer. 6.
0.3 μM F and 0.1μM R primer. 0.3 μM F and R primer and 60°C annealing
temperature shows the best efficiency on gel-electroferosis (arrow sign in c) without
any primer-dimer. ........................................................................................................ 34 Figure 9: Fluorescence quantity of 40 swab samples, Salmonella serovar Montevideo
and Salmonella serovar Dublin as positive contol and non-template DNA as negative
control. ......................................................................................................................... 37
Figure 10: Melting curve analysis of two swab samples, Salmonella serovar
Montevideo and Salmonella serovar Dublin as positive contol and non-template DNA
as negative control. ...................................................................................................... 38 Figure 11: Melting curve analysis of two swab samples, Salmonella serovar
Montevideo and Salmonella serovar Dublin as positive contol and non-template DNA
as negative control. ...................................................................................................... 38 Figure 12: Fluorescence quantity shows 40 cycles in real-time PCR of six dilution
series (106, 105, 104, 103, 102, 101) of Salmonella serovar Montevideo in Maxima
TM SYBR Green qPCR Master Mix (2X), E.coli and non-DNA template were used as
negative control. ........................................................................................................... 39

Mufty
6
UNU-Fisheries Training Programme
Figure 13: Standard curve of the 10-fold serial dilutions (106 to 101) of Salmonella
serover Montevideo in the real-time qPCR in Maxima TM SYBR Green qPCR Master
Mix (2X). ..................................................................................................................... 40 Figure 14: Fluorescence quantity shows 40 cycles in real-time PCR of six dilution
series (106, 105, 104, 103, 102, 101) of Salmonella serovar Montevideo invA gene in
Power SYBR Green qPCR Master Mix. ...................................................................... 40 Figure 15: Standard curve of the 10-fold serial dilutions (106 to 101) of Salmonella
serovar Montevideo (triplicate samples) in the real-time qPCR in Power SYBR Green
qPCR Master Mix. ....................................................................................................... 41 Figure 16: Fluorescence quantity (Y-axis) shows in 40 cycles (X-axis) in real- time
PCR of (a) duplex Salmonella serovar Montevideo strains (b) Two concentrations
(106 CFU/mL and 103 CFU/mL) Salmonella serovar Montevideo contaminated with
shrimp (Pandalus borealis) (c) Two concentrations (106 CFU/mL and 103 CFU/mL)
Salmonella serovar Montevideo contaminated with scallop (Chlamys islandica). Non-
spiked shrimp, scallop and non-DNA templates were used as negative control (blank).42
Figure 17: Fluorescence quantity (Y-axis) versus cycle no. (X-axis) in real-time PCR
shows two concentrations (106 CFU/mL and 103 CFU/mL) of Salmonella serovar
Montevideo contaminated with shrimp (Pandalus borealis) and scallop (Chlamys
islandica). Non-spiked shrimp, scallop and non-DNA templates were used as negative
control (blank), Salmonella serovar Montevideo strains were used as positive control.42

Mufty
7
UNU-Fisheries Training Programme
TERMS
A standardised PCR method
A standardised PCR method is a method that constantly gives the same results for a
given sample when analysis is repeated several times and when performed by
different analysts in different laboratories (Malorny et al. 2003).
Selectivity
Selectivity refers to the extent to which it can determine particular analyte in a
complex mixture without interference from other components in the mixture.
Linearity
Linearity is the ability of an analytical procedure to produce results that are
proportional to the concentration of analyte in samples within a given concentration
range.
Accuracy
The relative accuracy is defined as the degree of correspondence between the
response obtained by the reference method (traditional microbiological method) and
the response obtained by the alternative method (here real-time PCR) on identical
samples.
Precision
The degree to which further measurements or calculations show the same or similar results
Limit of detection
The limit of detection is the lowest quantity of a substance that can be distinguished
from the absence of that substance (blank value) within a stated confidence limit
(generally 1%).
Limit of Quantification
The Limit of Quantification (LOQ) is the limit at which we can reasonably tell the
difference between two different values.
Sensitivity
The sensitivity is defined as the percentage of positive samples giving a correct
positive signal. The term sensitivity has been used to describe the smallest amount of
a target organism that can be reliably detected by a PCR-based technique.
Repeatability
Repeatability of qualitative data was defined as the percentage chance of finding the
same result, positive or negative, from two identical samples analysed in the same
laboratory under predefined repeatability conditions.
Seer fish
Seer fish refers to a subfamily of the Scombridae or Mackerel family. Seer fish
include such species as: Pacific king mackerel (Scomberomorus guttatus), streaked
Spanish mackerel (Scomberomorus lineolatus), spotted Spanish mackerel
(Scomberomorus guttus), king mackerel (Scomberomorus commerson) and wahoo
(Acanthocybium solandri).

Mufty
8
UNU-Fisheries Training Programme
LIST OF ABBREVIATIONS
AHCYTOEN - Cytolytic Enterotoxin Gene
bp - base pair
BPW - Buffered Peptone Water
CCA - Central Competent Authority
CFU - Colony Forming Units
CFU - Colony Forming Unit
CT - Threshold Cycle
DFBMD - Division of Food Borne Bacterial and Mycotic Diseases, United
States of America.
DNA - Deoxyribo Nucleic Acid
EDTA - Ethylene Diamine Tetra Acetic Acid
ELISA - Enzyme-Linked Immuno Sorbent Assay
EU - Europen Union
GLP - Good Laboratory Practice
GSS - Global Salm-Surv
HPLC - High Performance Liquid Chromatography
ICDDRB - International Centre for Diarrhoeal Disease Research, Bangladesh
ISO - International Organization for Standardization
LD - Limit of Detection
LIA - Lysine Iron Agar
LQ - Limit of Quantification
NARST - National Association of Research in Science Teaching
NMKL - Nordic Committee on Food Analysis
PCA - Plate Count Agar
PCR - Polymerase Chain Reaction
RAPD - The Random Amplified Polymorphic DNA
RFLP - Restriction Fragment Length Polymorphism
RT-PCR - Real-Time Polymerase Chain Reaction
RV - Rappaport Vassiliadis
SPC - Standard Plate Count
TBE - Tris/ Borate/EDTA
TMA - Trimethylamine
TSA - Tryptic Soy Agar
TSI - Triple Sugar Iron
TVBN - Total Volatile Base Nitrogen
UNAK - University of Akureyri
UNIDO - United Nations Industrial Development Organization
UNU-FTP - United Nations University-Fisheries Training Programme
USA - United States of America
USFDA - United States Food and Drug Administration
WHO - World Health Organization
WSSV - White Spot Syndrome Virus
XLD - Xylose Lysine Desoxycholate

Mufty
9
UNU-Fisheries Training Programme
1 INTRODUCTION
1.1 Present fisheries situation of Bangladesh
Bangladesh is a South Asian country with abundant of fishery resources both in inland
and in marine water. Each year Bangladesh produces about 2.4 million metric tonnes
of fishery products and exports about 0.74 million metric tonnes of fishery products
(DoF 2007). Most of the exportable products are shrimp from aquaculture and marine
catch. Bangladesh also produces and exports different species of white fish mainly to
the EU, USA, Japan and Middle East. About 4.90% of the total export earnings comes
from fisheries (DoF 2007).
Salmonella spp. is common in fisheries products of Bangladesh because of poor
handling of fish from culture and capture grounds to processing. Salmonella
contamination mostly occurs in post-harvest handling stages rather than in pre-harvest
production sources (USAID, Bangladesh 2006). In Bangladesh, people prefer to buy
and consume live or fresh fish, which is a source of easy Salmonella contamination
through rough handling and due to lack of hygienic conditions during the process. A
microbiological analysis of 12 species of raw fish carried out in 2007 from fish
markets of Bangladesh found that two-thirds of the samples contained with
Salmonella spp. (Das et al. 2007). In 2008, a total of 30 consignments of Bangladeshi
fishery products were refused by the USA due to Salmonella contamination (Import
Refusal Reports for OASIS 2009).
The Department of Fisheries is the Central Competent Authority (CCA) for quality
and safety assurance of fish and fishery products. In Bangladesh, there are three
regional microbiological laboratories in the Fish Inspection and Quality Control office
under the Department of Fisheries to verify the exportable fishery products in Dhaka,
Chittagong and Khulna, which are equipped with microbiological and chemical
laboratory facilities. The regional laboratories have microbiological test facilities like
SPC (Standard Plate Count), E. coli, Vibrio cholere, Vibrio parahaemolyticus,
Staphyllococcus aureus, Listeria monocytogen, Salmonella spp. etc. and chemical
tests like TVBN and TMA.
The UNIDO (United Nations Industrial Development Organization) is conducting a
project called “Strengthening of Fish Inspection and Quality Control Service in
Bangladesh”. One part of the project is to install ELISA (Enzyme-Linked Immuno
Sorbent Assay), PCR (Polymerase Chain Reaction), HPLC (High Performance Liquid
Chromatography) and other necessary techniques, methods and equipments to
modernise the laboratory.
Within a very short time, PCR could be set up for regular pathogenic analysis of fish
samples. For the laboratory, this reduces labour, resources, and finally costs. PCR
gives confirmatory results more quickly than by following the complete traditional
microbiological identification scheme. Another part of the UNIDO project is to
increase the competence of the laboratories in such a way that they can be accredited
according to the ISO 170251 standard to be competent to carry out tests using
standard and non-standard methods and laboratory-developed methods.
1ISO 17025 - General Requirements for the Competence of Calibration and Testing Laboratories

Mufty
10
UNU-Fisheries Training Programme
1.2 Food hazards
Food is essential for health and well-being. Food may also be a cause of illness when
it is hazardous. Food safety has become an issue of special importance for the food
industry. There are many opportunities for food to be contaminated between
production and consumption. Fish can become contaminated at the farm, processing
plants, during storage and transport or in the sea.
Foodborne hazards can be classified as biological, chemical or physical. Biological
hazards are caused by parasites, viruses or bacteria. Chemical contaminants in foods
can come from industrial and agricultural sources, from food processing or from the
food itself. Toxic chemicals also come from biological sources such as moulds and
algae. Foreign objects present in food could constitute a physical hazard (glass, metal
etc.) to the consumer.
Foodborne illness caused by microorganisms is a large and growing public health
problem. Foodborne illness is caused by infection and intoxication. Infection occurs
when living bacteria are ingested into the stomach with food of sufficient numbers.
These bacteria then pass into the small intestine where they multiply and produce
symptoms. Intoxications happen when the bacteria grow in the food producing a
toxin. When the food is eaten the toxin, rather than the microorganisms, causes illness
symptoms of intoxication.
Microorganisms are everywhere and they can spoil food. Pathogenic microorganisms
can be part of a food‟s natural microflora, or may be contaminants. Contaminants can
come from the normal environment or a polluted environment, pests and pets, the
food handler and equipment. Bacteria, viruses, moulds and parasites are examples of
microorganisms that can cause foodborne illness. Diseases caused by microorganisms
in food include pathogens such as Salmonella spp., Campylobacter spp., Vibrio spp.,
Escherichia coli etc. A common type of foodborne infection is Salmonellosis. This is
caused by Salmonella bacteria that are frequently found in poultry, eggs and fish.
Shrimps and scallops accounted for 58% of the Salmonella violations compared to
other foodborne pathogens from the USFDA (United States Food and Drug
Administration) imported fisheries products in 2001 (Jane et al. 2003) and Salmonella
is the second most common cause of foodborne illness in the United States (U.S.
Public Health Service 2009).
1.3 Salmonella
The genus Salmonella belongs to the family Enterobacteriaceae. Salmonella are
facultative anaerobic Gram-negative rods. They are non-spore forming, usually motile
with peritrichous flagella, capable of growing on ordinary media. They are pathogenic
to man and animals (OIE 2005). Salmonella spp. are mainly transmitted by the faecal-
oral route. Fish and invertebrates can also infect. Salmonella, when present, are
usually found in low numbers in foods and often in the presence of considerably
larger numbers of other members of Enterobacteriaceae. In foods which have been
heated, refrigerated, frozen or dried, viable Salmonella bacteria may be present.
Salmonella bacteria cause foodborne illness. Every year approximately 40,000 cases
of Salmonellosis are reported in the United States (DFBMD 2009). Salmonellosis is a
common foodborne illness in most industrial countries (Tirado and Schmidt 2001).
Mufty
11
UNU-Fisheries Training Programme
Salmonellosis is common worldwide but it is widespread in the area where animal
husbandry is practiced because it is common mostly in domestic animals and birds.
Raw meat and poultry are therefore often contaminated with Salmonella. Salmonella
contamination in fish and shellfish due to growth in polluted water has been a
problem in many parts of the world. Aquaculture and firmed fish in the tropical region
are the major risk area for Salmonella contamination due to unhygienic handling and
use of poultry droppings as fertilizer in the culture water (OIE 2005). Salmonella
serovar Enteritidis and Salmonella serovar Typhimurium are the two most common
serovars found worldwide. Others serovars are limited to specific geographical
regions (OIE 2005).
1.4 Methods of Salmonella detection
The conventional detection methods are based on cultures which are generally time-
consuming but they are high in selectivity and sensitivity. Traditional pathogen
detection methods are sensitive enough but are slow. Therefore, new methods are
needed that exceed their performance.
The immunology-based methods for bacteria detection provide very powerful
analytical tools for a wide range of targets. They can be used to capture and extract
the targeted pathogen from the bacterial suspension by introducing antibody coated
magnetic beads in it (Gu et al. 2006).
Polymerase Chain Reaction (PCR) methods provide conclusive and unambiguous
results, recent advances in PCR technology, namely real-time-PCR now enable
obtaining results in a few hours.
Colony counting methods, PCR and immunology-based methods are the most
common tools used for pathogen detection. The most popular methods are culture and
colony counting methods (Leoni and Legnani 2001) and the PCR (Bej et al. 1991).
On the other hand, recent advances in PCR technology, expressly real-time PCR (Levi
et al. 2003) now enable obtaining results in a few hours. The PCR is a lot less time-
consuming than other techniques. It takes from 5 to 24 hours to produce a detection
result but this depends on the specific PCR variation used and this does not include
any previous enrichment steps.
1.5 Method validation
Method validation is the process used to confirm that the analytical procedure
employed for a specific test is suitable for its intended use. The method validation
gives quantitativity, qualitativity and reliability of the method for the future use.
Results from method validation could be use to judge the quality and consistency of
analytical results. Method validation is an integral part of Good Laboratory Practice
(GLP). The partially developed PCR method was a non-standard laboratory based
method. The parameters of the non-standard PCR method are: selectivity, linearity,
accuracy, precision, Limit of Detection (LD), Limit of Quantification (LQ), sensitivity
and repeatability, which were assessed along with relevancy to ultimate requirements.

Mufty
12
UNU-Fisheries Training Programme
The recorded results and procedures were used for validation and a statement was
made as to whether the method is fit for the intended use. The techniques used for the
determination of the performance of the method included the followings:
a) Calibration using reference sample of Salmonella spp.
b) Comparison of results achieved with conventional method.
c) Systematic assessment of the factors influencing the results.
1.6 Polymerase Chain Reaction (PCR)
The basic protocol of PCR for rapid detection bacteria in samples is: denaturation of
DNA to single strands, annealing of sequence specific primers and extension by
polymerase 25-40 cycles. The PCR results in a product that represents a 50-10,000 bp
specific part of a genome that can be analysed by gel electrophoresis or DNA
sequencing.
RT-qPCR is a laboratory technique based on PCR, which is used to amplify and
simultaneously quantify a targeted DNA molecule. It enables simultaneously, both
detection and quantification of a specific DNA sequence in a sample in real-time after
each amplification cycle. Two common methods of quantification involve fluorescent
dyes that intercalate with double-stranded DNA during PCR and modified DNA
oligonucleotide probes that illuminate after hybridization with complementary DNA and
extension. Real-time qPCR is a combination of two steps: the amplification of the
DNA using PCR and the detection and quantification of amplified DNA in real-time.
The accuracy and reliability depends on template quantity, quality and optimal assay
design. Real-time PCR (qPCR) uses fluorescent dyes to combine the amplification
and detection steps of the PCR reaction; the fluorescent signal is proportional to the
amount of DNA produced during PCR cycles. The use of probes labelled with
different reporter dyes allows the detection and quantification of multiple target genes
in a single PCR reaction.
PCR should not be considering a substitute for conventional microbiology techniques,
but it is rapid and requires less time to achieve competence than conventional
microbiology. Conventional microbiology is often considered to be less technically
demanding than PCR. However, PCR can detect bacteria that can not be grown in
culture.
PCR complements and enhances the traditional microbiological methods by
increasing speed, sensitivity, and specificity for detecting pathogens in fish. PCR can
be performed rapidly in the field and limits the number of cultures and isolations to
the few samples identified as positive by PCR to decrease the workload, labour,
resources, and costs.
There are two types of real-time PCR techniques. The first one is TaqMan and SYBR
Green I. TaqMan PCR is fluorescent-probe-based, here fluorescent-probe-based
assays require availability of primers and probes that must be selected according to
very rigid conditions, which cannot always be easily applied. In SYBR Green I PCR
use of the doublestranded DNA binding dye SYBR Green I for detection of PCR
products has overcome this limitation by allowing real-time PCR to be applied
without the need for probes linked to fluorescent molecules (Aarts et al. 2001).

Mufty
13
UNU-Fisheries Training Programme
SYBR-Green real-time qRT-PCR assay provides a rapid outcome compared to others.
The detection is based on the binding of the SYBR-Green dye into double stranded
PCR products, which is a sequence independent process.
1.7 PCR in Bangladesh
In Bangladesh PCR has been used mainly for detection of viral diseases (EUS or
Epizootic Ulcerative Syndrome) of shrimp and white fish. A PCR-equipped lab was
installed in Dhaka in 2006 and another one in Cox‟s Bazar only for detection of white
spot diseases. The first PCR tested larvae was released in April 2004 in Cox„s Bazar.
The common use of PCR in the International Centre for Diarrhoeal Disease Research,
Bangladesh (ICDDRB) is for research of diarrhoeal disease in Bangladesh. A
cytolytic enterotoxin gene (AHCYTOEN) in Aeromonas hydrophila was identified by
PCR techniques by Rahman et al. (2002). The Random Amplified Polymorphic DNA
(RAPD), Restriction Fragment Length Polymorphism (RFLP) and microsatellite markers
have already been used to delineate some sort of distinct population and/or stock
groups of Catla (Catla catla) (Alam and Islam 2005), Magur (Clarias batrachus)
(Islam et al. 2007) and Hilsa shad (Tenualosa ilisha) in Bangladesh with different
levels of genetic distances. A population bottleneck2 has been identified in magur fish
(Clarias batrachus) (Islam et al. 2007). Detection of whitespot syndrome virus
(WSSV) in cultured shrimps (Penaeus monodon), P. monodon brooders, shrimp
postlarvae and water samples in Bangladesh was carried out by PCR using five
different pairs of primers (Hossain et al. 2004).
1.8 Objectives
This study intends to develop a pathogenic detection procedure in a most precise way
using real-time PCR for the further enhancement of laboratory services of the
competent authority. The project intends to achieve this by developing intensive
microbiological laboratory analysis of pathogens using real-time PCR, developing a
PCR method and developing a validation protocol for it. The study will seek the
practice and competency in an accredited microbiological laboratory.
The objective of the present study is to establish a simple and robust real-time PCR
method using SYBR Green that would be suitable for routine analysis of Salmonella
spp. in exportable fish samples. The study has three sub-objectives:
1. Application of the real-time qPCR method for detection of Salmonella spp. in
shrimp and scallop.
2. Partial validation of the applied PCR method.
3. To gain competence and expertise with pathogen detection methods using real-
time qPCR techniques.
2 A population bottleneck (or genetic bottleneck) is an evolutionary event in which a significant
percentage of a population or species is killed or otherwise prevented from reproducing (Wikipedia).

Mufty
14
UNU-Fisheries Training Programme
2 LITERATURE REVIEW
The Salmonella bacterium was first isolated from pigs suffering from hog cholera by
an American scientist, Dr Daniel E. Salmon, in 1885 (Bremer et al. 2003). The
Salmonella genus includes over 2435 serotypes of bacteria (Bremer et al. 2003) and
Salmonella have been recognised as a major cause of gastrointestinal disease in both
humans and animals (Darwin and Miller 1999). Salmonella is one of the major causes
of zoonotic infection in the world. Salmonellae are among the most common bacterial
foodborne pathogens worldwide (Eleni et al. 2006a).
Drinking contaminated water is a major source of Salmonella worldwide. Salmonella
spp. have been found in raw meats, poultry, eggs, milk and dairy products, fish,
shrimp, frog legs, yeast, coconut, sauces and salad, cake mixes, dried gelatin, peanut
butter, cocoa and chocolate. Farmed shrimp might be contaminated with Salmonella
due to their culture in poor quality growing waters (Bremer et al. 2003). Salmonella
have also been found in fishmeal and in fish feed factories (Trond et al. 2003).
The most common global distributed Salmonella human serotype is Salmonella
Enteritidis (61%) which is also common in Asia (33%) (Global Salm-Surv (GSS)
2006). In 2002, a total of five serotypes were reported among the 15 most common
human serotypes from all six regions of the world: Salmonella serovar Enteritidis,
Salmonella serovar Typhimurium, Salmonella serovar infantis, Salmonella serovar
Montevideo, and Salmonella typhi (Eleni et al. 2006b). Domestic animals act as a
reservoir for the foodborne spread of serovars such as S. Typhimurium which accounts
for the high incidence of non-typhoid Salmonella infections worldwide. S.
Typhimurium DT104 has developed resistance to five commonly prescribed
antibiotics and is a major concern in many countries because of its rapid spread during
the 1990s (Food Safety (WHO) 2008).
An estimated 500 people in the United States are infected with typhoid by Salmonella
annually. Most cases of documented typhoid disease are related to foreign travel to
developing nations such as India (30%), Pakistan (13%), Mexico (12%), Bangladesh
(8%), Philippines (8%), and Haiti (5%) (Michael and Dirk 2008). The USFDA
(United States Food and Drug Administration) noted an overall incidence of 7.2% in
imported and 1.3% in domestic seafood during a nine year study (1990-1998) of
11,312 imported and 768 domestic seafood samples (Heinitz et al. 2000). Nearly 10%
of imported and 2.8% of domestic raw seafood were positive for Salmonella.
Distribution of Salmonella in seafood on a regional basis indicated the incidence to be
highest in the central Pacific and Africa and lowest in Europe/Russia and North
America (12% versus 1.6%). Data on a country basis indicated Vietnam to have the
highest (30%) and Republic of Korea the lowest (0.7%) rates. While the most frequent
serotypes in imported seafood were Salmonella Weltevreden (1st), Salmonella
Senftenberg (2nd), Salmonella Lexington and Salmonella Paratyphi-B (3rd), the top
20 list included Salmonella Enteritidis (5th), Salmonella Newport (6th), Salmonella
Thompson (7th), Salmonella Typhimurium (12th), and Salmonella Anatum (13th)
commonly involved in foodborne illness in the United States (Heinitz et al. 2000).
Salmonella has been isolated from freshwater fish culture ponds in many countries. A
survey in Japan showed that Salmonella spp. are present in 21% of eel culture ponds
(Saheki et al. 1989) and the incidence of Salmonella in freshwater cultured catfish in
the USA was estimated to be 5% (Wyatt et al. 1979). The incidence of Salmonella in

Mufty
15
UNU-Fisheries Training Programme
seafoods from India has been reported by a number of investigators. Varma et al.
(1985) reported the presence of Salmonella in 7.46% of frozen peeled and deveined
shrimp. Iyer and Shrivastava (1989) demonstrated the presence of Salmonella in 12%
peeled and deveined3 shrimp, 10% headless, shell-on shrimp, 14% peeled and
undeveined shrimp, 17% lobsters, 14% cuttlefish, 25% catfish and 20% seer fish4.
The presence of Salmonella in fish and fishery products has been reported from other
Asian countries such as Sri Lanka (Fonseka 1990), Thailand (Rattagool et al. 1990),
Taiwan (Chio and Chen 1981) and Indonesia (Sunarya et al. 1990). This pathogen is a
public health problem associated with fish and fishery products (Kumar et al. 2003).
The number of incidence of Salmonella in shrimp from USFDA regulated products
was 369 out of 4,724 samples from 2001-2005 and two unusual serotypes Salmonella
Augustenborg and Salmonella Tteko were isolated from the imported shrimp of
Bangladesh (Madson 2006). In a Salmonella outbreak in Bangladesh by food
poisoning in March 1980, 10 of 11 members of a family who ate a food called jalar
jao5 experienced acute gastroenteritis within four-12 hours. All 10 patients were
hospitalised at the International Center for Diarrheal Disease Research, Bangladesh
(ICDDRB) field hospital at Matlab, Bangladesh. Jalar jao may be an important
vehicle for transmitting pathogenic organisms (Yunus et al. 1981).
Bangladesh is a third world country where the use of antibiotics is not controlled
neither in dose nor duration. Since 1997, treatment failures with ciprofloxacin have
been reported from Bangladesh and other countries due to infection with nalidixic
acid resistant Salmonella enterica serovar Typhi (NARST) that had decreased
susceptibility to ciprofloxacin (Rahman et al. 2005). Salmonella typhi stains were
found resistant against β-lactam antibiotic, penicillin (Parvez et al. 2004).
Salmonellosis pneumonia was found common in a research survey in Dhaka Shishu
Hospital, Bangladesh in 2001 by WHO (World Health Organization), out of 200
people eight had Salmonella (including 4 S. typhi) caused pneumonia (Factor et al.
2001).
The incidence of Salmonella spp. in tropical seafood was studied using standard
microbiological techniques and polymerase chain reaction by Kumar et al. (2003).
Simultaneous detection of Escherichia coli O157:H7, Listeria monocytogenes and
Salmonella strains by real-time PCR was evaluated using artificially contaminated
fresh produce. The real-time PCR successfully detected all three pathogens when
fresh produce was washed with artificially contaminated water containing E. coli
O157:H76 and S. enterica serovar Typhimurium down to the predicted level of 1 to 10
cells/mL and L. monocytogenes at 1000 cells/mL (Arvind 2002). Effects of sample
preparation and bacterial concentration on Salmonella enterica detection in poultry
meat using culture methods and PCR assaying of preenrichment broths was done by
Kanki et al. (2008). The S. Typhimurium isolates were analyzed by PCR to detect the
presence of virulence genes invA and spvC (Cheng-Hsun and Jonathan 1996). A rapid
and sensitive 8 hour PCR assay has been developed for detection of Salmonella
serovars in seafood by (Kumar et al. 2008a). A total of 110 fresh and raw seafood
3 Deveined - to remove the vein or veins or digestive tract (dorsal vein) of a shrimp.
4 Seer fish refers to a subfamily of the Scombridae or Mackerel family (Wikipedia).
5 Jalar jao- is traditionally eaten food made from rice and sugar or molasses, eaten cold by rural people
during hot summer months. 6 Escherichia coli O157:H7: is an enterohemorrhagic strain of the bacterium Escherichia coli and a
cause of foodborne illness.

Mufty
16
UNU-Fisheries Training Programme
samples were analysed for the presence of Salmonella using different enrichment
periods prior to PCR assay. Seafood samples included in this study were fish, shrimp,
mussel, crab, edible oyster, and clam, collected from local fish markets in Cochin
(India). Evaluation of culture, ELISA (Enzyme-Linked Immuno Sorbent Assay) and
PCR assays for the detection of Salmonella in seafood was done. The PCR assay
exhibited 31.6% positive for Salmonella followed by ELISA (23.7%) and culture
method (21.3%) (Kumar et al. 2008 b). Nowadays PCR assay is very popular among
researchers for rapid diagnostic and screening of a large number of samples
simultaneously (Kumar et al. 2008 b). A recent study evaluated the efficiency of
culture, ELISA and PCR assays for the detection of Salmonella in naturally
contaminated seafood. In the study, 215 seafood samples comprising fish, shrimp,
crab, clam, mussel, oyster, squid, cuttlefish and octopus from the fish market of
Cochin (India), were compared by culture, ELISA and PCR methods (Anonymous
2008). Comparison of PCR-ELISA and LightCycler real-time PCR assays for
detecting Salmonella spp. in milk and meat samples was done by (Perellea et al.
2004).
Diagnostic real-time PCR for detection of Salmonella from 110 various food samples
(chicken rinses, minced meat, fish, and raw milk) were investigated for Salmonella by
Malorny et al. (2004). The diagnostic accuracy was shown to be 100% compared to
the traditional culture method. The overall analysis time of the PCR method was
approximately 24 hours in contrast to four to five days of analysis time for the
traditional culture method. This study was planned to assess the inter-laboratory
performance of this diagnostic PCR method.
111 samples of raw imported aqua-cultured shrimp have been examined for bacterial
pathogens and for pathogen viruses by Mitzscherling and Kuhne (2008). The samples
originated from Southeast Asia except for eight Latin American samples. Most
samples (40) were taken from Bangladesh. The bacteriological quality of these
samples was analysed in terms of aerobic plate count, Escherichia coli,
Staphylococcus aureus, Salmonella spp., Listeria monocytogenes and Vibrio species.
Rotavirus, norovirus and hepatitis A-virus were detected by using a nested RT-PCR.
The aerobic plate count was found to be in a range between 4,8×10² to 1,3×10⁹
CFU7/gm. Fourteen (14) samples (12.6 %) showed an aerobic plate count >107 cfu/g.
One sample was found to be contaminated with Escherichia coli at a level of 1,9×10³
cfu/g. Staphylococcus aureus was isolated from 16 samples. Listeria monocytogenes
was not detected in any of the shrimp samples examined. Salmonella spp. was found
in eight samples. Salmonella Weltevreden was the most frequently isolated serovar
(Mitzscherling and Kuhne 2008).
Development and Validation of PCR Primers for Detection of Tetracycline Efflux
Genes of Gram-Negative Bacteria was done by Aminov et al. (2002). This study
confirmed that the antibiotic resistance gene pool generated in animal production
systems might be mobile and persistent in the environment with the potential to enter
the food chain.
A validation study of two blockcycler and one capillary-based real-time PCR method
for the detection of Salmonella in milk powder was done by Malorny et al. (2007).
7 CFU-Colony Forming Unit.

Mufty
17
UNU-Fisheries Training Programme
The traditional cultural method according to EN ISO 6579:20028 for the detection of
Salmonella in food was performed as the reference method. Inter-laboratory tests
were done between 13 laboratories using various models of real-time PCR
blockcyclers (Malorny et al. 2007).
Review on Validation of Polymerase Chain Reaction-based techniques for proxy
detection of bacterial fish pathogens was done by Maura and Peter (1998). They
suggested a framework for a validation protocol, problems and possible solutions for
environmental applications of validation methods.
Evaluation, validation and standardisation of PCR for Salmonella primers within 16
laboratories were done for the quality assurance of laboratories (Malorny et al. 2003).
A validation study was carried out followed by a comparative study of a PCR method
and the standard culture-based method NMKL-71 (1999)9 for detection of
Salmonella. Validation was performed according to the validation protocol from the
Nordic validation organ for validation of alternative microbiological methods
(NordVal) on 250 artificially or naturally contaminated animal feed samples. More
Salmonella-positive samples were found with the PCR method compared to the
NMKL method (Lofstrom et al. 2008).
The European Commission approved a research project on validation and
standardisation in 1999 entitled “FOOD-PCR with the aim of validating and
standardising the use of PCR-based methods for detection of the five major foodborne
pathogens: thermophilic Campylobacter, E. coli O157, Y. enterocolitica, Listeria
monocytogenes and Salmonella spp.”(Hoorfar and Cook 2003). A consortium of 35
institutes, companies and universities from 14 EU countries and seven associated
states worked on the project. The project group proposed the process of developing a
standardised PCR-based method. The group also suggested a set of specific
definitions of validation parameters and test controls.
A real-time PCR method for detection of Salmonella spp. in food samples has been
developed and validated in-house. The method was evaluated with 1,293 naturally
contaminated food samples and compared to the conventional cultural method (Made
et al. 2004).
8 EN ISO 6579:2002- Microbiology of food and animal feeding stuffs -- Horizontal method for the
detection of Salmonella spp 9 NMKL-71, 1999: Nordic Committee on Food Analysis, Salmonella Detection in Foods, Method No
71, 5e ed., 1999, page 2(9).

Mufty
18
UNU-Fisheries Training Programme
3 MATERIALS AND METHODS
3.1 Salmonella strains
The Salmonella strains were obtained from the Promat Laboratory, Akureyri, Iceland.
All the stains had been stored on nutrient agar (Difco) at -20C. From the nutrient agar
small aliquots were transferred to PCA (Plate Count Agar) (Difco) and incubated at
37°C for 24 hours (Figure 1). From the PCA a loop-full of Salmonella colony was
transferred to both TSA (Tryptic Soy Agar) (Difco) and TSI (Triple Sugar Iron)
(Difco) agar tube. The TSA plate was incubated for 24 hours at 37°C. The loop-full of
Salmonella strains were streaked on the TSI agar tube slope surface and stabbed on
the butt and the TSA tubes were incubated at 37°C for 24 hours. From the TSI tubes a
loop-full of Salmonella strains were grown on 10 mL nutrient broth (Difco) for 24
hours at 37°C. The Salmonella content of the nutrient broth was approximately 109
CFU/mL, from where 0.1 mL of the cultured nutrient broth was transferred to 10 mL
0.15% peptone water (Difco) solution which was 10-7 CFU/mL and a series of serial
dilutions (10-5, 10-3, 10-2 and 10-1 CFU/mL respectively) of peptone water were
made. From the peptone water dilutions (10-3, 10-2 and 10-1) 1mL of Salmonella
containing peptone water was inoculated to TSA agar plates and was incubated at
37°C for 24 hours (Figure 1). The concentration of cells were determined by viable
counts on the TSA plates.
3.2 Preparation of pure culture of Salmonella spp. for DNA extraction
One mL of the cultured nutrient broth containing Salmonella was mixed homoginately
with 10 mL of a selective enrichment medium (Rappaport Vassiliadis (RV)) (Oxoid,
UK), and incubated for 5 hours at 42°C in a circulating water bath.
One mL of aliquots of a 5 hour enriched RV was used for DNA extraction for the
real-time PCR assay of pure culture. Before use, the sample was stored at -20°C for
upcoming PCR analysis.
3.3 Preparation of spiked shrimp and scallop samples and estimation of the
contamination levels
The shrimp (Pandalus borealis) and scallop (Chlamys islandica) were used for
artificial contamination, bought from the Superstore, Akureyri, Iceland. The
Salmonella serovar Montevideo was made contaminated with both the samples. The
Salmonella serovar Montevideo concentration in the nutrient broth was 38 x109
CFU/mL. For contamination level 1, 0.66 mL of the 10-6 CFU/mL Salmonella culture
nutrient broth dilution and for contamination level 2, 3.3 mL of the 102 CFU/mL
dilution of the nutrient browth was inoculated and mixed homoginately with the 25 g
each shrimp and scallop samples. 25 g Salmonella contaminated shrimp and scallop
samples each were mixed and homoginated with 225 mL Buffered Peptone Water
(BPW) (Difco, USA) and incubated for 20 hours at 37°C. From each four pre-
enriched aliquotes, 1 mL was homoginated with 10 mL of RV broth and incubated at
42°C for 24 hours for the continuation of traditional microbial tests and similarly
other four RV broth were inoculated and incubated at 42°C for 5 hours for DNA
extraction (Figure 1).

Mufty
19
UNU-Fisheries Training Programme
1 mL aliquot in 10 mL RV broth
The presence of Salmonella was verified according to NMKL-71 (1999). For the
verification of Salmonella presence 1 mL aliquot from the selective 24 hour enriched
RV broth was inoculated to XLD agar plates which and incubated at 37°C for about
48 hours and finally checked for the characteristic colonies (Figure 2).
Pure cultre artificially
contaminated sample
Figure 1: Flow diagram showing preparation of pure culture of Salmonella for
spiking of shrimp and scallop samples and isolation of DNA for PCR analysis.
Transfer a loop of
enrichment on XLD
agar-plate
Preenrichment for 16-20 h at 37°C in BPW
Culture in
PCA
10
-2 a
nd 1
0-6
CF
U/m
L
1 loopful suspension
Enrichment for 5 h exactly at 42°C in RV
Resuspension each in 225 mL BPW
1 mL aliquot in 10 mL RV broth
Suspension in 300 μl
0.1xTE buffer
300 μl aliquot from RV broth
Roughly mix for 10 s
2 μl aliquot of template DNA
Salmonella colony
suspension
Centrifuge at 10,000 to 15,000 xg in a
microcentrifuge tube for 5 min at 4°C.
Enrichment for further 13-17 h at 42°C in RV
Growth for 21-27 h at 37°C on agar plates
Real-time PCR analysis
Salmonella strain in Nutrient Broth
Incubate for 24 h at 37°C
Culture in TSA and TSI
Shrimp and scallop samples (25 g each )
Incubation for 15 min at 95°C
in a thermomixer
Centrifugation at 14,000 x g at 4°C for 5 min
Salmonella confirmatory test according to
NMKL-71, 1999
Nutrient Broth

Mufty
20
UNU-Fisheries Training Programme
Figure 2: Salmonella strains in (a) TSI & LIA agar tube (b) nutrient broth (c)
sub-culture in TSI agar tube (d) nutrient agar plate (e) XLD agar plate
3.4 Proficiency testing for Salmonella
An ampoule containing six types of freeze-dried bacteria was obtained from the
National Food Administration, Microbiology Division, Upsala, Sweden. The material
after reconstitution, can be used for quantitative and qualitative testing of Salmonella
and in this project to compare the efficiency of the PCR methods with “standard”
methods. The specification of the sample was:
Manufacturer: Microbiology Division, National Food Administration,
Sweden
Labelled: 2007:1
Date of manufacture: March 16, 2007
Storage: -18°C or lower
Durability: December 2008
The following strains, of which the majority have been isolated directly from food,
were included the ampoule:
(b) (a) (c)
(e) (d)

Mufty
21
UNU-Fisheries Training Programme
Strain Strain no
Micrococcus sp. SLV-055
Klebsiella oxytoca SLV-089
Escherichia coli SLV-082
Staphylococcus aureus SLV-350
Clostridium perfringens SLV-442
Salmonella serover Dublin SLV-242
Reconstitution of the reference samples
The ampoule was opened according to instructions. One mL of 0.1% peptone water
was added and the content of the vial loosened using a sterile Pasteur pipette. The
walls were carefully rinsed. The suspension was transferred to a sterile vessel
containing 100 mL peptone water (a total volume of 104 mL). These 104 mL are
equivalent to an undissolved sample. After careful mixing, the sample was ready for
analysis.
Sample analysis
The sample was analysed for the presence of Salmonella using conventional
microbiological procedure (NMKL-71 1999), PCR and real-time PCR methods. The
sample contains approximately seven Salmonella Dublin per mL of reconstituted
aliquote, 1 mL of the solution was inoculated to 10 mL BPW, incubated at 37ºC for
20 hours for pre-enrichment. One mL was homoginated with 10 mL of RV broth and
incubated at 42ºC in a circulating water bath for 24 hours for the continuation of
traditional microbial tests and similarly RV broth was inoculated and incubated at
42ºC for 5 hours for DNA extraction.
For the verification of Salmonella presence, 1 mL aliquot from the selective 24 hour
enriched RV broth was inoculated to XLD agar plates which was incubated at 37ºC
for about 48 hours and finally checked for the characteristic colonies.
3.5 Culture of E.Coli for the negative control of PCR and real-time PCR
The E. coli culture was obtained from the Promat Laboratory, Akureyri, Iceland. One
mL of E. coli from LST broth was inoculated into 10 mL BPW for pre-enrichment
and incubated at 37ºC for 20 hours. One mL of the pre-enrichment was homoginated
with 10 mL of RV broth and was incubated at 42ºC into a circulating water bath for 5
hours for DNA extraction.
3.6 Salmonella detection in environmental swab samples
3.6.1 Sample collection
Forty (40) environmental samples were taken by swabbing at different locations in the
neighbourhood of a fish processing facility in northern Iceland. Samples were
transported to the laboratory on ice, and analysis was started within 24 hours.

Mufty
22
UNU-Fisheries Training Programme
3.6.2 Sample preparation for DNA extraction
The swab samples were homogenate with 10 mL BPW and were incubated at 37±1°C
for 20 hours. Transfer 1 mL of each pre-enrichment bottle to 10 mL of Rappaport -
Vassiliadis soya peptone broth, previously warmed to 42°C and incubated at 42°C for
48 hours in a circulating water bath for the continuation of traditional microbial tests
and similarly the other RV broth was inoculated and was incubated at 42°C for 5
hours for DNA extraction (Figure 3).
(a) (b)
Figure 3: RV broth ready for DNA extraction in (a) 25 mL test-tube, (b) 1.5 mL
tube
3.7 DNA extraction
DNA extraction is the the removal of Deoxyribonucleic Acid (DNA) from the cells of
bacteria. It is the early step of PCR analysis to break open (lyse) the cells of bacteria
containing the DNA of interest.
3.7.1 Method:1
For the DNA extraction, 300μl each of 5 hour incubated RV enrichment broth were
used as cell suspension.
Cell Lysis
Three hundred (300) μL cell suspension (containing 0.5- 1.5 billion cells) was added
to a 1.5 mL microfuge tube on ice and was centrifuged at 13,000 g for 5 seconds to
pellet cells and the supernatant was removed with a pipet. 300 μL Cell Lysis Solution
was added into the tube and was pipet up and down to suspend cells and then
incubated at 80ºC for 5 minutes to lyse cells. Now, in this condition cells are stable in
Cell Lysis Solution for at least two years at room temperature.
Protein precipitation
The sample was cooled down from 80°C to room temperature by placing it on ice for
1 minute and 100 μL protein precipitation solution was added to the cell lysate. The
solution was vortexed vigorously at high speed for 20 seconds to mix the protein
precipitation solution uniformly with the cell lysate. The solution was then centrifused
at 13,000 g for 3 minutes. The precipitated proteins formed a tight pellet. For some
samples, the pellet was not tight enough, then the vortex was done vigorously at high (a)
(a)

Mufty
23
UNU-Fisheries Training Programme
speed for 20 seconds and was incubated on ice for 5 minutes and was centrifuge again
at 13,000 g for 3 minutes.
DNA precipitation
The DNA containing supernatant was poured (leaving behind the precipitated protein
pellet) into a clean 1.5 mL microfuge tube containing 300 μL 100% isopropanol (2-
propanol). The sample was mixed by inverting gently 50 times and was centrifuged at
13,000 g for 1 minute to make the DNA visible as a small white pellet. The
supernatant was discarded and the tube was drained on clean absorbent paper, 300 μL
70% ethanol was added into the tube and was inverted several times to wash the
DNA. Then the tube was centrifuged at 13,000 g for 1 minute and ethanol was poured
carefully and was inverted on clean absorbent paper to air dry for 5-10 minutes.
DNA hydration
Fifty (50) μL DNA Hydration Solution was added to the tube and DNA was
rehydrated by incubating for 1 hour at 65°C. The tube containing DNA was kept at
room temperature overnight before PCR analysis.
3.7.2 Method: 2
For the DNA extraction 300 μL each of 5 hours incubated RV enrichment broth were
used, the enriched RV culture was centrifuged at 10,000 to 15,000 g in a
microcentrifuge tube for 5 minutes at 4°C. The supernatant was carefully discarded
and the cell pellet was suspended in 300 μL 0.1xTE buffer (1 mM Tris-HCl, 0.1 mM
EDTA [pH 8.0]). The suspension of the microcentrifuge tube was incubated for 15
minutes at 95°C in a water bath, afterwards roughly mixed for 10 seconds. After
centrifugation at 14,000 g at 4°C for 5 minutes, the supernatant containing DNA was
carefully transferred to a new microcentrifuge tube and stored on ice until use in the
real-time PCR. A 2 μL aliquot was used as the template DNA for the PCR.
3.8 Calculation of the amount of DNA
The quantification of DNA was measured using a fluorometer (Invitrogen). 200 μl
working solution was made for each sample by mixing and homogenating 199 μL of
Quant- iT buffer with 1 μl of Quant- iT reagent. 10 μL of each two standards were
homogenated with 190 μL of working solutions. 198 μL of the working solution was
mixed homogenated with 2 μL of extracted DNA sample in a new tube; the final
volume was 200 μL. The two standard solutions were placed into a fluorometer, and
then the sample solutions were placed into the fluorometer to measure the quantity of
DNA.
3.9 Optimisation of PCR
The optimisation is essential to maximise the specificity and efficiency of PCR, it
includes optimal and suitable primer sequences, appropriate primer and template
DNA concentrations and annealing temperature.
Primer sequence
PCR primers are oligonucleotides which are typically 15-30 bases long. When
choosing two PCR primers (Table 1), it is important that they not contain bases
complementary to eachother. Complementarity at the 3' ends was avoided to minimise

Mufty
24
UNU-Fisheries Training Programme
the primer-dimer. A 40% - 60% G+C content is recommended for each primer,
avoiding internal secondary structure and long stretches of any one base. For the
experiment, 45% and 40% G+C content of left and right primers were used.
Primers were used in real-time RT-PCR as described in Table 1 and were purchased
from Sigma Genosys Ltd. (Switzerland).
Table 1: Overview of primers and corresponding characteristics
Primer Targeted
sequence
Amplicon
size (bp)
Primer
concen
(μM)
Forward primer, Reverse primer sequence
(5′-3′)
Reference
Shima himA 122 0.2 CGTGCTCTGGAAAACGGTGAG
CGTGCTGTAATAGGAATATCTTCA
(Chen et
al. 1999)
InvA invA 119 0.2 TCGTCATTCCATTACCTACC
AAACGTTGAAAAACTGAGGA
(Mi Nam
et al.
2005)
ttr6/ttr4 Ttr
RSBCA
locus
94 0.2 CTCACCAGGAGATTACAACATGG
AGCTCAGACCAAAAGTGACCATC
(Malorny
et al.
2004)
InvA141/139 InvA 284 0.2 GTGAAATTATCGCCACGTTCGGGCAA
TCATCGCACCGTCAAAGGAACC
(Malorny
et al.
2003)
The four pairs of Salmonella specific primers were initially selected which are Shima
(122 bp), invA119 (119 bp), ttr6/4 (94 bp) and Sal/inv 139/141 (284), all the four
pairs were tested with the DNA of Salmonella serovar Montevideo strains.
Primer concentration
The amount of primers available during the PCR reaction influences the ultimate
results. The concentration of primer in the amplification reaction should be between
0.1 and 1.0 μM. Low primer concentration generally ensures cleaner product and
lower background. The primer concentration into the reaction mixture is also
important for better implification. For the optimisation of PCR, different
concentrations of primers were used (Table 3) in the reaction mixture to find out the
suitable primer set for good PCR amplification. All the primer sets were run on the
same reaction mixture (Table 2) with 2 μl Salmonella serover Montevideo as template
DNA.
Table 2: The reaction mixture used for primer concentration for optimisation of
the PCR
10x PCR buffer
(Provides a final concentration of 2.5 mM
MgCl2)
2.50 μl
DNTP 2.00 μl
Taq polymerase (1 U) 0.30 μl
Template DNA 2.00 μl
Water, nuclease-free to 25
μl
Total volume 25 μl

Mufty
25
UNU-Fisheries Training Programme
Table 3: Primer concentrations used for optimisation
Annealing temperature
Annealing temperature is one of the most important parameters that need adjustment
in the PCR reaction. The PCR reaction temperature is lowered to 50-65°C seconds
allowing annealing of the primers to the single-stranded DNA template. Typically the
annealing temperature is about 5ºC below the melting temperature (Tm) of the
primers used. In the experiment for the optimisation of PCR, the PCR reaction
mixture (Table 2) was used in three different annealing temperatures (55°C, 58°C and
60°C) to find out the better efficiency of the PCR reactions.
3.10 Protocol of the PCR
The Polymerase Chain Reaction of Salmonella DNA was done by Peltier Thermal
Cycler, PTC-200 (MJ Research). The programming of the DNA engine moves
through five steps: initiating the programme, naming the programme, choosing a
temperature control method, entering the programme‟s steps and entering the end or
closing step.
The Salmonella specific primers TCGTCATTCCATTACCTACC and
AAACGTTGAAAAACTGAGGA was used to amplify a 100- base pairs fragment of
the invasion (invA) gene. Primers were synthesized by Sigma Genosys
Ltd.(Switzerland). All runs were included a negative control without target DNA and
Salmonella serovar Montevideo as the positive control.
Reaction set-up
A reaction master mix was prepared by adding the following (Table 4) components
(except template DNA) for each 25 μl reaction to a eppendorf tube at room
temperature, all solutions were gently vortexed and briefly centrifuged after thawing.
Table 4: Reaction mixture used for assay development of the PCR
10x PCR Buffer
(Provides a final concentration of 2.5 mM MgCl2)
2.50 μl
DNTP 2.00 μl
Taq Polymerage (1 U)10 0.30 μl
Forward Primer (3U/μl) 1.00 μl
Reverse Primers (3U/μl) 1.00 μl
Template DNA 2.00 μl
Water, nuclease-free to 25 μl
Total Volume 25 μl
10
Taq DNA Polymerase (Prokaria, Iceland)
Primer concentration (μM)
Forward Reverse
0.3 0.3
0.1 0.3
0.1 0.1
0.2 0.2
0.3 0.5

Mufty
26
UNU-Fisheries Training Programme
The master mix was mixed throughly and dispensed in appropriate volumes into PCR
plates. Template DNA was added to a volume of 2.00 μl to the individual PCR tubes
containing the master mix. The reactions were mixed by centrifuge gently without
creating bubbles. Thermal cycling conditions were: 94°C for 5 min, followed by 30
cycles of 94°C for 50 seconds, 60°C for 30 seconds, and 72°C for 30 seconds. A final
extension of 72°C for 7 minutes was employed. All thermal cycling conditions were
performed using a three-step cycling protocol. The PCR assay was run on 2% agarose
gel electrophoresis with ethidium bromide staining. The voltage and time of the gel
electrophoresis was 70 Watt for 1.5 hours. DNA moves towards positive anode due to
the negative charges on its phophate backbone. The gel was stained into ethidium
bromide solution for at least 15 minutes.
Preparation of reaction mixture for agarose gel electrophoresis
Two (2) μL of 6x loading dye solution (MBI, Fermentas) was mixed with 10 μl of
DNA sample on a piece of aluminium foil wrap. After mixing a 10 μl solution it was
inserted into the gel hole and 3 μL of 100 base pair DNA ladder (MBI, Fermentas)
were inserted into a hole. For each gel run there was a negative control of template
DNA.
Preparation of agarose gel
Two (2) g of Agarose powder (Sigma, Germany) were mixed and homogenated with
200 mL of 0.5x TBE; 50 mL of 10x TBE were mixed into 1 l of distilled water to
prepare 0.5x TBE and 5x TBE were prepared into a stock solution of 54 g of Tris base
(TRIZMA-BASE, Sigma, USA), 27.5 g of boric acid and 20 mL of 0.5 M EDTA (pH
8.0).
Preparation of ethidium bromide gel coloring bath
The ethidium bromide solution was used to bath the agarose gel. 65 μl of 10 mg/mL
ethidium bromide (Plus One, Pharmacia Biotech) was added to 649.35 mL of TBE.
The final solution was 1 μg/mL ethidium bromide bath, ready to use.
A positive response was defined as the presence of a visible band at the expected size,
while a negative response was defined as the lack of any band at the expected size.
The gel was documented with a digital camera.
3.11 Salmonella strains in PCR
The selected Salmonella strains were tested with the 16S rDNA primer (5′-
AGAGTTTGATCCTGGCTCAG-3′ and 5′-TACGGCTACCTTGTTACGACTT-3).
The 16S rDNA sequence is a gene encoding small sub-unit ribosomal RNA, it acts as
a common primer to nonselectively amplified any bacterial DNA in the sample.
Six Salmonella strains were run on PCR using the reaction mixture (Table 4) with 1 μl
each primer set, which are Salmonella Tennesse, Salmonella serovar Montevideo,
Salmonella serovar Schwarzengrund, Salmonella serovar Agona, Salmonella serovar
Bredeney, and Salmonella serovar Infantis. The same volume (2 μl) of the template
DNA were used for each Salmonella spp.

Mufty
27
UNU-Fisheries Training Programme
3.12 Spiked shrimp and scallop analysis for Salmonella on PCR
Two concentrations (106 CFU/mL and 103 CFU/mL) of Salmonella serovar
Montevideo contaminated shrimp (Pandalus borealis) and scallop (Chlamys islandica)
were run on PCR gel-electroferosis. The Salmonella serovar Montevideo and
Salmonella serovar Dublin were as positive control and non-template DNA as
negative control.
3.13 PCR of the proficiency testing sample
The Salmonella serovar Dublin from the proficiency testing sample contained approx.
seven Salmonella Dublin per mL of reconstituted aliquote, were run on PCR gel-
electrophoresis and SYBR Green Real-time qPCR.
3.14 Environmental swab samples
Forty environmental samples were taken by swabbing at different locations in the
neighbourhood of a fish processing facility in northern Iceland and were analysed by
the SYBR Green Real-time qPCR.
3.15 SYBR Green real-time qPCR
3.15.1 Concept of SYBR Green real-time qPCR
SYBR-Green real-time qRT-PCR assay provides a rapid outcome. The detection is
based on the binding of the SYBR-Green dye into double stranded PCR products,
which is a sequence independent process.
The sensitivity of detection with SYBR-Green may therefore be compromised by the
formation of primer-dimers, lack of specificity of the primers, primer concentration
and the formation of secondary structures in the PCR product. All of these factors
could lead to the creation of unexpected double-stranded DNA products, which would
incorporate SYBR-Green and register a fluorescent signal.
3.15.2 Protocol of the SYBR real-time qPCR
Real-time PCR and data analysis was performed in the MiniOpticon™ real-time
detection system with Supports Opticon Monitor™ version 3.1 (Bio-Rad
Laboratories) using Maxim® SYBR Green qPCR Master Mix (2X) (Fermentas).
The Salmonella specific primers invA (TCGTCATTCCATTACCTACC and
AAACGTTGAAAAACTGAGGA) were used to amplify a 100 base pairs fragment of
the invasion (invA) gene. Primers were synthesised by Sigma Genosys Ltd.
(Switzerland). All runs included a negative control without target DNA and
Salmonella serovar Montevideo as the positive control.
Reaction set-up
A master mix was prepared by adding the following (Table 5) components (except
template DNA) for each 25 μl reaction to a tube at room temperature. All solutions
were gently vortexed and briefly centrifuged after thawing.

Mufty
28
UNU-Fisheries Training Programme
Table 5: Reaction mixture used for assay development of the SYBR real-time
qPCR
Maxima TM SYBR Green qPCR Master Mix (2X)
(Provides a final concentration of 2.5 mM MgCl2)
25 μl
Forward Primer (3U/μl) 0.3
μM
Reverse Primers (3U/μl) 0.3
μM
Template DNA 2.0
μM
Water, nuclease-free to 50
μl
Total Volume 50 μl
The master mix was mixed throughly and dispensed in appropriate volumes into PCR
plates. Template DNAwas added to a volume of 2μl/reaction to the individual PCR
tubes containing the master mix. The reactions were mixed by centrifuge gently
without creating bubbles.
Thermal cycling conditions were as follows: 95°C for 10 minutes, followed by 40
cycles of 95°C for 15 seconds, 60°C for 30 seconds, and 72°C for 30 seconds. A final
extension of 72°C for 5 minutes was employed. All thermal cycling conditions were
performed using a three-step cycling protocol. Data acquisition was performed during
the extension step. Reproducibility of Maxim® SYBR Green qPCR Master Mix real-
time PCR was assessed by running samples independently on different days.
The designed new PCR assay was verified to the product specificity by gel
electrophoresis with ethidium bromide stained 2% agarose gels (Sigma, Germany) as
melting temperatures of a specific product and primer-dimers may overlap depending
on the sequence composition. The gel was documented with a digital camera.
A positive response was defined as the presence of a visible band at the expected size,
while a negative response was defined as the lack of any band at the expected size.
3.16 Creating a gDNA standard curve for Salmonella serovar Montevideo from
real-time qPCR
3.16.1 Standard curve from Maxima TM SYBR Green qPCR Master Mix (2X)
Genomic DNA (gDNA) is commonly used as standards in quantitative PCR. The
mass of gDNA corresponds to copy numbers of target nucleic acid sequences
(Applied Biosystems 2003). A standard curve was prepared in which a gene of
interest is present at 1,000,000 copies, 100,000 copies, 10,000 copies, 1000 copies,
100 copies and 10 copies.
The size of the Salmonella genome is approximately 4.8 million bp (haploid11). The
mass of the genome was calculated by inserting the genome-size value in the
following formula (Applied Biosystems 2003).
11
The haploid number is the number of chromosomes in a gamete of an individual (Wikipedia)

Mufty
29
UNU-Fisheries Training Programme
m = where n = genome size (bp)
m = mass
e-21 = x 10-2
The formula above was derived as follows:
where:
n = DNA size (bp)
m = mass
Avogadros number = 6.023e23 molecules / 1 mole
Average Molecular Weight (MW) of a double-stranded DNA molecule = 660 g/mole
The mass of the Salmonella genome (haploid) is calculated as follows:
m = g = pg =
The mass of the genome was divided by the copy number of the gene of interest per
haploid genome. The invA gene is a target that exists as a single copy gene per
haploid genome.
Therefore, 0.00526 pg of Salmonella gDNA contains one copy of the invA gene.
The mass of gDNA was calculated which contains the copy numbers of interest, that
is 1,000,000 to 10 copies (Table 6).
Therefore, copy number of interest × mass of haploid genome = mass of gDNA
needed.
The mass of gDNA needed was divided by the volume to be pipetted into each
reaction.
Table 6: Six dilutions series in 2 μl template DNA of Salmonella serovar
Montevideo
Copy
Number
Mass of gDNA
needed (pg)
Final concentration
(pg/μl) of gDNA.
1000000 5260 2630
100000 526 263
10000 X0.00526 pg 52,6 /2 μl 26,3
1000 5,26 2,63
100 0,526 0,263
10 0,0526 0,0263

Mufty
30
UNU-Fisheries Training Programme
A serial dilution of the gDNA was prepared using the following formula:
The stock concentration of Salmonella gDNA was determined by spectrophotometric
analysis to be 4.21 μg/μl or 4210 pg/ μl. Therefore, in this example, C1= 4210 pg/μl.
Each dilution prepared has a final volume (V2) of 100 μl.
So, dilution no. 1:
V1= 62.47 μl
Volume of diluent = 100 μl – 62.47 μl = 37.53 μl
To achieve the final volume of 100 μl, add 62.47 μl of stock gDNA to 37.53 μl of
diluent. The diluent can be sterile 1X TE (1mM Tris, 0.1mM EDTA, pH8.0) or sterile,
nuclease-free H2O. For the diluton of Salmonella serovar Montevideo nuclease-free
H2O were used. Dilutions 2 to 5 were calculated using the same types of calculations
(C1V1 = C2V2) as presented above for dilution no. 1. The following table (Table 7)
presents the calculated volumes of gDNA and diluent for all dilutions.
Table 7: Copy of invA gene in dilutions of template DNA of Salmonella serovar
Montevideo.
All the 6 dilutions were run using the following protocol (Table 8).
Table 8: Temperature Protocol for real-time PCR
Steps Temperature Duration
1 940C 5 minutes
2 940C 15 Seconds
3 600C 30 Seconds
4 720C 30 Seconds
5 Go to Step 2 40 Times
6 720C 7 minutes
7 End
Standard curve
Dilution
No
Source of
gDNA for
Dilution
Initial
concentrat
ion (pg/μl)
Volume of
gDNA(μl)
Volume of
diluent (μl)
Final
Volume
(μl)
Final
concentrat
ion of
dilution
(pg/μl)
Resulting
copy #
invA
gene/2μl
1 Stock 4210 62,47 37,53 100 2630 1000000
2 Dilution 1 2630 10 90 100 263 100000
3 Dilution 2 263 10 90 100 26,3 10000
4 Dilution 3 26,3 10 90 100 2,63 1000
5 Dilution 4 2,63 10 90 100 0,263 100
6 Dilution 5 0,263 10 90 100 0,0263 10

Mufty
31
UNU-Fisheries Training Programme
A standard curve was obtained for the real-time PCR reaction by analyzing 10-fold
serial dilutions of a Salmonella serovar Montevideo. Log-linear regression analysis
was performed using Microsoft Excel 2007 software.
Standard curve from Power SYBR Green qPCR master mix
To establish the reliability of SYBR Green the real-time PCR method, the
reproducibility of the standard curve was verified with the standard curve produced by
Power SYBR Green qPCR Master Mix. Following Table 9, components (except
template DNA) for each 25 μl reaction were added to a tube at room temperature to
get a final volume of 25 μl. The Master Mix was mixed throughly and dispensed in
appropriate volumes into PCR plates. Template DNA was added to a volume of 2.5
μl/reaction to the individual PCR tubes containing the Master Mix. The reactions were
mixed by centrifuge gently without creating bubbles.
Table 9: Reaction mixture used for assay development of the SYBR real-time
qPCR
Power SYBR Green qPCR Master Mix
(Provides a final concentration of 2.5 mM MgCl2)
12.5 μl
Forward Primer 0.1 μM (1
μl)
Reverse Primers 0.1 μM (1
μl)
Template DNA 2.5 μl
Water, nuclease-free to 25 μl
Total Volume 25 μl
Thermal cycling conditions were as follows: 95°C for 10 minutes, followed by 40
cycles of 95°C for 15 seconds, 60°C for 30 seconds, and 72°C for 30 seconds. A final
extension of 72°C for 5 minutes was employed. Data acquisition was performed
during the extension step using StepOne (Applied Biosystems) real-time PCR system.
3.17 Real-time qPCR with spiked shrimp and scallop
Two concentrations (106 CFU/mL and 103 CFU/mL) of Salmonella serovar
Montevideo contaminated shrimp (Pandalus borealis) and scallop (Chlamys islandica)
were run on real-time PCR using Power SYBR Green qPCR Master Mix. Non-spiked
shrimp, scallop and non-DNA templates were used as negative control. The
Salmonella serovar Montevideo was a positive control.
3.18 Quantification Salmonella DNA from shrimp and scallop samples
Real-time PCR is often used to obtain quantitative information on the DNA
concentration of the unknown samples. The concentrations are derived as a ratio
relative to the DNA content in the other samples. The concentrations of the unknown
samples are derived from the ratio of known concentration of standard samples. The
ratio of templates from the CT values can be calculated because the CT values are
related to the initial template concentration.
Each PCR cycle doubles the amount of PCR product. It is possible to compare copy
number ratios by comparing their CT values. The relationship between copy number

Mufty
32
UNU-Fisheries Training Programme
and CT value is inversely related, the higher the CT, the lower the copy number of
starting template and since the cycling reaction causes the template to double, the
relationship is also logarithmic:
The copy number is proportional to:
= Ratio of standard DNA template
to sample DNA template
From the above equation, the number of known invA genes of Salmonella and the
unknown number of invA genes were calculated.
3.19 Validation
“Validation is the conformation by examination and the provision of objective
evidence that the particular requirements for a specific intended use are fulfilled.”
(ISO/IEC 17025:2005(E)).
In this work, validation was done in four steps by qualitatively and quantitatively
determining Salmonella by PCR and RT-qPCR in:
Pure cultures of seven Salmonella strains,
Spiked shrimp and scallop samples,
A proficiency testing sample (National Food Administration, Uppsala, Sweden), and
Environmental swab samples.
In all four steps results from PCR analysis were compared directly or indirectly to the
“conventional” culture method.
4 STATISTICS
A PCR reaction is positive if the amplification curve indicates a clear exponential
increase of the PCR product and crosses the threshold line before cycle 40.
For level L0, the specificity was defined as the percentage of negative samples giving
a correct negative signal. For levels L1 and L2, the sensitivity was defined as the
percentage of positive samples giving a correct positive signal. The relative accuracy
is defined as the degree of correspondence between the response obtained by the
reference method (traditional microbiological method) and the response obtained by
the alternative method (here real-time PCR) on identical samples.
Repeatability of qualitative data was defined as the percentage chance of finding the
same result, positive or negative, from two identical samples analysed in the same
laboratory under predefined repeatability conditions.
Standard curves were constructed by plotting quantity versus threshold cycle (CT)
produced for the target gene. For a comparison of PCR amplification efficiencies and

Mufty
33
UNU-Fisheries Training Programme
detection sensitivities among different experiments, slopes of standard curves were
calculated by performing a linear regression analysis with Microsoft Excel 2007.
5 RESULTS
5.1 Optimisation of PCR
Primer sequence
Four pairs of Salmonella specific primers were initially selected. They are Shima (122
bp), invA119 (119 bp), ttr 6/4 (94 bp) and Sal/inv 139/141(284). All the four pairs
were tested with the DNA of Salmonella serovar Montevideo strains. The invA119
(119 bp) primar pairs showed the best gel-electroferosis band (Figure 4) signal
compared to the others, so the invA119 primer pairs were used for all the next
experiments.
Figure 4: PCR amplification of Salmonella serovar Montevideo on primer set (1)
Shima 122 bp (2) invA 119 bp (3) ttr6/4 94 bp (4) Sal/inv 139/141 284 bp. InvA
119 bp (arrow mark) shows the best band.
Primer concentration
From the different concentration of primers (Table 3) the better efficiency is shown in
0.2 μM primer concentration (Figure 5c) which was selected for the next intended use
of the project.
Annealing temperature
After comparing three different annealing temperatures (55°C, 58°C and 60°C), the
60°C annealing temperature showed better efficiency of the PCR reactions (Figure
5c). For the next PCR reactions, the 60°C annealing temperature was used.
1 2 3
4
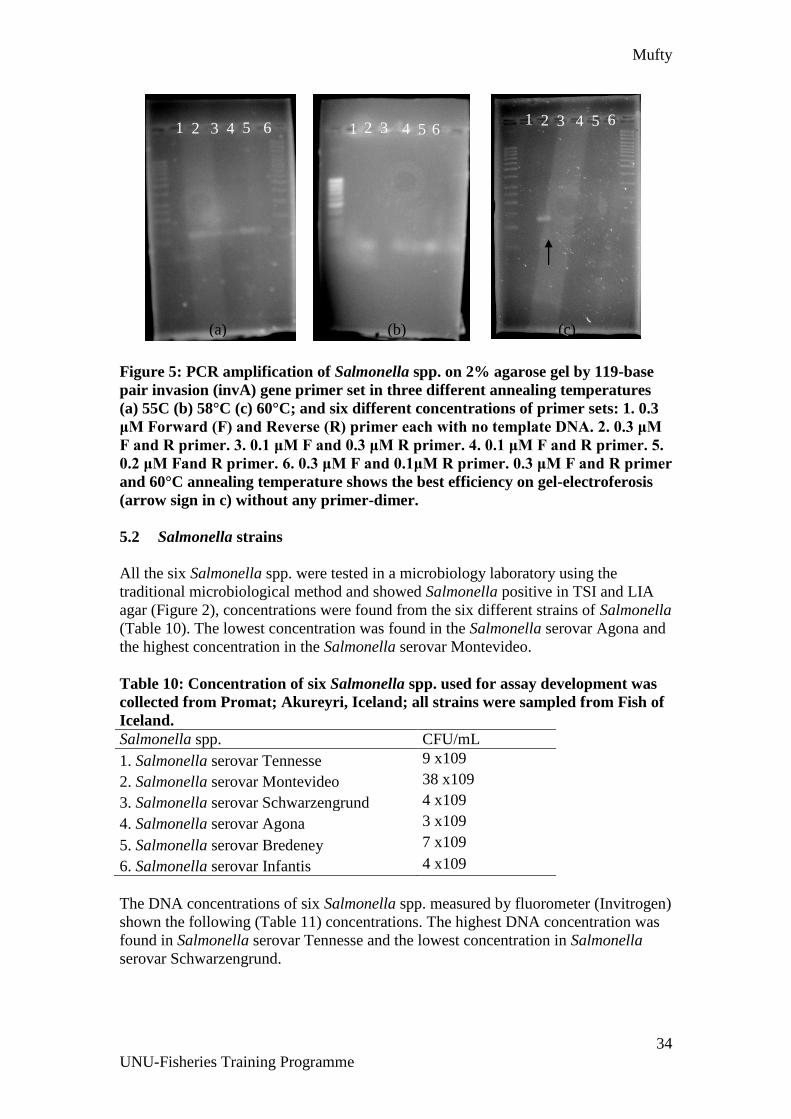
Mufty
34
UNU-Fisheries Training Programme
Figure 5: PCR amplification of Salmonella spp. on 2% agarose gel by 119-base
pair invasion (invA) gene primer set in three different annealing temperatures
(a) 55C (b) 58°C (c) 60°C; and six different concentrations of primer sets: 1. 0.3
μM Forward (F) and Reverse (R) primer each with no template DNA. 2. 0.3 μM
F and R primer. 3. 0.1 μM F and 0.3 μM R primer. 4. 0.1 μM F and R primer. 5.
0.2 μM Fand R primer. 6. 0.3 μM F and 0.1μM R primer. 0.3 μM F and R primer
and 60°C annealing temperature shows the best efficiency on gel-electroferosis
(arrow sign in c) without any primer-dimer.
5.2 Salmonella strains
All the six Salmonella spp. were tested in a microbiology laboratory using the
traditional microbiological method and showed Salmonella positive in TSI and LIA
agar (Figure 2), concentrations were found from the six different strains of Salmonella
(Table 10). The lowest concentration was found in the Salmonella serovar Agona and
the highest concentration in the Salmonella serovar Montevideo.
Table 10: Concentration of six Salmonella spp. used for assay development was
collected from Promat; Akureyri, Iceland; all strains were sampled from Fish of
Iceland.
Salmonella spp. CFU/mL
1. Salmonella serovar Tennesse 9 x10⁹
2. Salmonella serovar Montevideo 38 x109
3. Salmonella serovar Schwarzengrund 4 x10⁹
4. Salmonella serovar Agona 3 x10⁹
5. Salmonella serovar Bredeney 7 x10⁹
6. Salmonella serovar Infantis 4 x10⁹
The DNA concentrations of six Salmonella spp. measured by fluorometer (Invitrogen)
shown the following (Table 11) concentrations. The highest DNA concentration was
found in Salmonella serovar Tennesse and the lowest concentration in Salmonella
serovar Schwarzengrund.
2 2 2
1 3 3 4 5 6 1 3 4 5 6
1 4 5 6
(a) (b) (c)
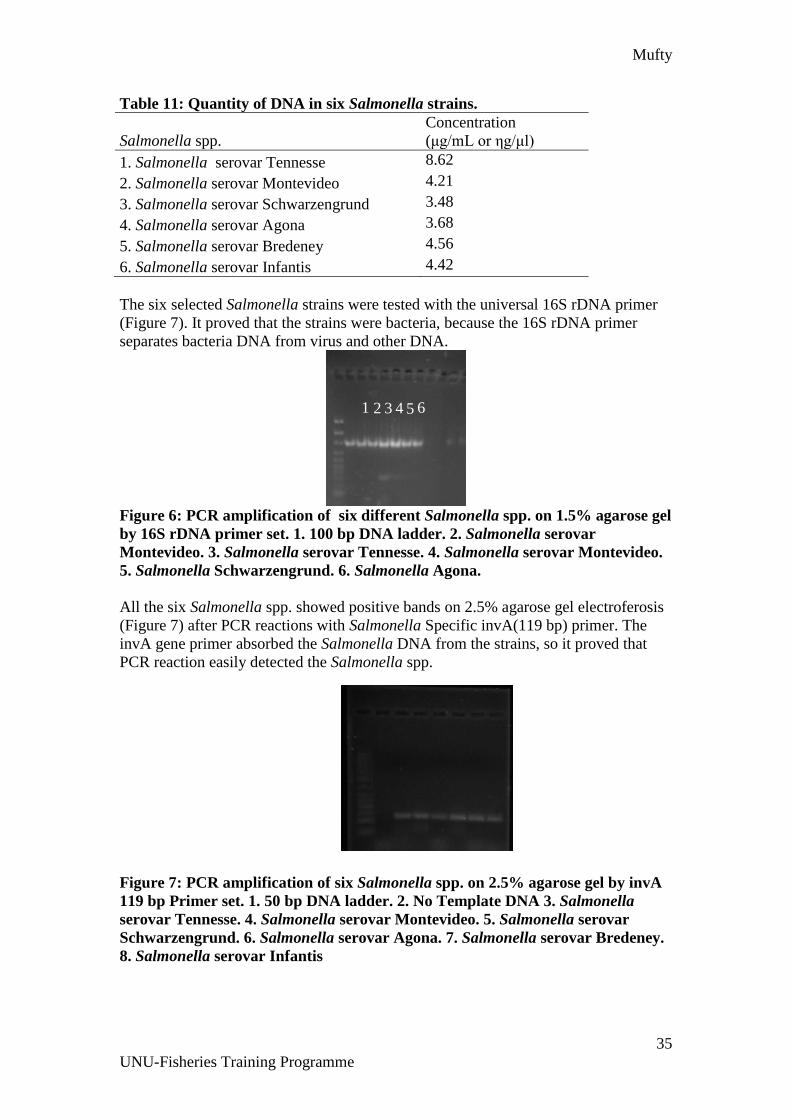
Mufty
35
UNU-Fisheries Training Programme
Table 11: Quantity of DNA in six Salmonella strains.
Salmonella spp.
Concentration
(μg/mL or ηg/μl)
1. Salmonella serovar Tennesse 8.62
2. Salmonella serovar Montevideo 4.21
3. Salmonella serovar Schwarzengrund 3.48
4. Salmonella serovar Agona 3.68
5. Salmonella serovar Bredeney 4.56
6. Salmonella serovar Infantis 4.42
The six selected Salmonella strains were tested with the universal 16S rDNA primer
(Figure 7). It proved that the strains were bacteria, because the 16S rDNA primer
separates bacteria DNA from virus and other DNA.
Figure 6: PCR amplification of six different Salmonella spp. on 1.5% agarose gel
by 16S rDNA primer set. 1. 100 bp DNA ladder. 2. Salmonella serovar
Montevideo. 3. Salmonella serovar Tennesse. 4. Salmonella serovar Montevideo.
5. Salmonella Schwarzengrund. 6. Salmonella Agona.
All the six Salmonella spp. showed positive bands on 2.5% agarose gel electroferosis
(Figure 7) after PCR reactions with Salmonella Specific invA(119 bp) primer. The
invA gene primer absorbed the Salmonella DNA from the strains, so it proved that
PCR reaction easily detected the Salmonella spp.
Figure 7: PCR amplification of six Salmonella spp. on 2.5% agarose gel by invA
119 bp Primer set. 1. 50 bp DNA ladder. 2. No Template DNA 3. Salmonella
serovar Tennesse. 4. Salmonella serovar Montevideo. 5. Salmonella serovar
Schwarzengrund. 6. Salmonella serovar Agona. 7. Salmonella serovar Bredeney.
8. Salmonella serovar Infantis
1 2 3 4 5 6 7 8
2 1 3 4 5 6

Mufty
36
UNU-Fisheries Training Programme
5.3 Spiked shrimp and scallop samples
Two concentrations (106 CFU/mL and 103 CFU/mL) of Salmonella serovar
Montevideo contaminated shrimp (Pandalus borealis) and scallop (Chlamys islandica)
were tested using traditional microbiological methods and showed positive in TSI and
LIA agar, the concentration was measured by fluorometer (Invitrogen) (Table 12).
The scallop had highest concentration of Salmonella of 21.1 μg/mL.
Table 12: Quantity of Salmonella serovar Montevideo DNA in Pandalus borealis
and Chlamys islandica.
Species Concentration
(μg/mL)
Pandalus borealis 4.98
Chlamys islandica 21.1
The template DNA from Salmonella serovar Montevideo contaminated shrimp
(Pandalus borealis) and scallop (Chlamys islandica) were analysed with PCR gel-
electrophoresis, showed strong band (Figure 9). The Salmonella serovar Montevideo
and Salmonella serovar Dublin were as positive control and non-template DNA as
negative control.
Figure 8: PCR amplification of Salmonella serovar Montevideo contaminated
with shrimp (Pandalus borealis) and scallop (Chlamys islandica) on 2.5%
agarose. 1. 50 bp DNA ladder 2. Negative control (non-template DNA) 3.
Salmonella serovar Montevideo as positive control 4. Salmonella serover Dubllin
as positive control 5. Non-spiked Pandalus borealis 6. Pandalus borealis (106
CFU/mL) 7. Pandalus borealis (103 CFU/mL) 8. Non-spiked Chlamys islandica
9. Chlamys islandica (106 CFU/mL) 10. Chlamys islandica (103 CFU/mL)
The PCR easily detected 103 CFU/mL of Salmonella Montevideo from shrimp and
scallop, the non-spiked shrimp and scallop showed no band (Figure 9(5) and (8)) with
the invA 119 bp primer, possibly other bacteria may present in the non-spiked shrimp
and scallop.
5.4 Reference sample
The reference Salmonella serover Dublin which was collected from the Microbiology
Division, National Food Administration, Sweden, contains approximately seven
Salmonella serover Dublin per mL of reconstituted aliquote, were run on PCR gel-
1
2 3 4
5
6 7
8
9 10

Mufty
37
UNU-Fisheries Training Programme
electrophoresis shown positive band (Figure 9(4)). Therefore, PCR was able to detect
reference Salmonella serover Dublin. It was the important part quantitative validation
of the PCR method.
5.5 Environmental swab samples
Among the 40 collected swab samples from different locations in the neighbourhood
of a fish processing facility in northern Iceland, one sample that showed a positive
response was taken from personal rest area but this need to be confirmed.
Figure 9: Fluorescence quantity of 40 swab samples, Salmonella serovar
Montevideo and Salmonella serovar Dublin as positive contol and non-template
DNA as negative control.
From the 40 swab samples, most of the swabs showed positive on the real-time PCR
run, the flurescence quantity (∆Rn) crossed the threshold lines from the 26 cycles
which means they are possibly positive. Among all the possible Salmonella positive
sample,s only one sample (sample 28) proved the conformation of the presence of
Salmonella in melting curve analysis (Figure 11). It showed the same melting
temperature as like Salmonella Montevideo and Salmonella Dublin (Figure 11).
S. Montevideo
S. Dublin
40 swab
samples
Blan
k
Threshold
line Line

Mufty
38
UNU-Fisheries Training Programme
Figure 10: Melting curve analysis of two swab samples, Salmonella serovar
Montevideo and Salmonella serovar Dublin as positive contol and non-template
DNA as negative control.
For the conformation of the presence of Salmonella in the swab sample 28, the
melting curve analysis was repeated (Figure 12). It showed the same melting
temperature as positive control (Salmonella serovar Montevideo and Salmonella
serovar Dublin).
Figure 11: Melting curve analysis of two swab samples, Salmonella serovar
Montevideo and Salmonella serovar Dublin as positive contol and non-template
DNA as negative control.
1
6
S. Dublin
S. Montevideo
Swab sample
28
Temperature
Der
ivat
ive
Rep
ort
er
S. Montevideo
S. Dublin
Swab sample
28
Blank
Temperature
Der
ivat
ive
Rep
ort
er

Mufty
39
UNU-Fisheries Training Programme
5.6 Creating a gDNA standard curve for Salmonella serovar Montevideo from
real-time qPCR
5.6.1 Standard curve from Maxima TM SYBR Green Qpcr Master Mix (2X)
Six serial dilutions (106 to 101) of Salmonella serovar Montevideo were analysed in
real-time qPCR, show a relation of Threshold Cycle (CT) value with the fluorescence
signal (Figure 12) (Appendix-1).
Figure 12: Fluorescence quantity shows 40 cycles in real-time PCR of six dilution
series (106, 105, 104, 103, 102, 101) of Salmonella serovar Montevideo in Maxima
TM SYBR Green qPCR Master Mix (2X), E.coli and non-DNA template were
used as negative control.
A standard curve was obtained for the real-time PCR reaction by analysing 10-fold
serial dilutions of Salmonella serovar Montevideo. Log-linear regression analysis was
performed using Microsoft Excel 2007 software. There was a good correlation
(R2=0.922) between the CT values and the copy numbers of invA gene of Salmonella
serovar Montevideo (Figure 14).
Threshold line

Mufty
40
UNU-Fisheries Training Programme
Figure 13: Standard curve of the 10-fold serial dilutions (106 to 101) of
Salmonella serover Montevideo in the real-time qPCR in Maxima TM SYBR
Green qPCR Master Mix (2X).
5.6.2 Standard curve from Power SYBR Green Qpcr Master Mix
A standard curve was obtained using the power SYBR Green Qpcr Master Mix in the
Applied Biosystems StepOne Real-Time PCR. Ten-fold six serial dilutions (106 to
101) were used to produce an amplification plot (Figure 16) of fluorescence quantity
vs. CT value (Appendix-2).
Figure 14: Fluorescence quantity shows 40 cycles in real-time PCR of six dilution
series (106, 105, 104, 103, 102, 101) of Salmonella serovar Montevideo invA gene
in Power SYBR Green qPCR Master Mix.
106
105
104
103
102
101
Threshold line
102
Threshold line

Mufty
41
UNU-Fisheries Training Programme
A standard curve was obtained by analysing 10-fold serial dilutions of a Salmonella
serovar Montevideo. Each sample was used in triplicate to get an average CT value.
Log-linear regression analysis was performed using Microsoft Excel 2007 software.
Figure 15: Standard curve of the 10-fold serial dilutions (106 to 101) of
Salmonella serovar Montevideo (triplicate samples) in the real-time qPCR in
Power SYBR Green qPCR Master Mix.
Both the dilution curves (Figures 13 and 15) showed that the real-time qPCR easily
detected 103 invA gene, the flurescence was visible after 24 cycles. The two standard
curves (Figures14 and 16) revealed that the real-time PCR can quantify Salmonella
DNA with a particular difference in CT values in each 10-fold dilution. There was a
good correlation (R2=0.922 and 0.9296) between the CT values and the copy numbers
of invA gene of Salmonella serovar Montevideo (Figure 16). Experimental error may
cause unequal difference of CT values in dilution series.
5.7 Real-time PCR with spiked shrimp and scallop
Two concentrations (106 CFU/mL and 103 CFU/mL) of Salmonella serovar
Montevideo contaminated shrimp (Pandalus borealis) and scallop (Chlamys islandica)
were run on real-time PCR using Power SYBR Green qPCR Master Mix. Non-spiked
shrimp, scallop and non-DNA template were used as negative control. The
Salmonella serovar Montevideo was as positive control.
Y= -3,54 x+ 41,14
R2 = 0.9296

Mufty
42
UNU-Fisheries Training Programme
The Salmonella serovar Montevideo strains show positive thresholds (CT value 28.58
and 30.01), where the non-spiked shrimp, scallop and non-DNA templates show no
thresholds (Figure 16a).
Figure 16: Fluorescence quantity (Y-axis) shows in 40 cycles (X-axis) in real-
time PCR of (a) duplex Salmonella serovar Montevideo strains (b) Two
concentrations (106 CFU/mL and 103 CFU/mL) Salmonella serovar Montevideo
contaminated with shrimp (Pandalus borealis) (c) Two concentrations (106
CFU/mL and 103 CFU/mL) Salmonella serovar Montevideo contaminated with
scallop (Chlamys islandica). Non-spiked shrimp, scallop and non-DNA templates
were used as negative control (blank).
Figure 17: Fluorescence quantity (Y-axis) versus cycle no. (X-axis) in real-time
PCR shows two concentrations (106 CFU/mL and 103 CFU/mL) of Salmonella
serovar Montevideo contaminated with shrimp (Pandalus borealis) and scallop
(Chlamys islandica). Non-spiked shrimp, scallop and non-DNA templates were
used as negative control (blank), Salmonella serovar Montevideo strains were
used as positive control.
S. Montevideo Spiked Shrimp (10
6)
Spiked Shrimp (103)
Spiked Scallop (106)
Spiked Scallop (103)
(a) (b) (c)
Blank/ Shrimp/Scallop Blank/ Shrimp/Scallop
Blank/ Shrimp/Scallop
Spiked Shrimp (106)
Spiked Shrimp (103)
Spiked Scallop (106)
Spiked Scallop (103)
S.Montevideo strains
Blank/ Non-spiked Shrimp/Scallop
Threshold line

Mufty
43
UNU-Fisheries Training Programme
The Salmonella serovar Montevideo contaminated shrimp (Pandalus borealis) with a
concentration of 106 invaA gene and 103 invA gene show a significant (standard
deviation 0.65) difference (2.44) of CT values, 29.31 and 31.75 for 106 invaA and
103 invA gene respectively. Salmonella serovar Montevideo contaminated scallop
(Chlamys islandica) with the same Salmonella specific invA gene concentrations
show a significance (standard deviation 3.60) CT value difference (2.87) (Figures
16b, 16c and 17).
5.8 Quantitation of Salmonella DNA in shrimp and scallop
From the following equation, the number of known invA gene of Salmonella, the
unknown number of invA gene from the shrimp (Pandalus borealis) and scallop
(Chlamys islandica) were calculated.
= Ratio of Standard DNA Template
to Sample DNA Template
The copy number of invA gene of Salmonella spp. (1000,000 invA gene) (Table 7)
were used as control/standard DNA. The mean CT values were calculated from the
two CT values of Salmonella serover Montevodeo, spiked shrimp (Pandalus borealis)
(106 CFU/mL and 103 CFU/mL) and scallop (Chlamys islandica) (106 CFU/mL and
103 CFU/mL) which were used to calculate the quantity of invA gene of Salmonella.
= 2-[29.29- 29.31]
= 20.02
= 1.014
Thus, the Salmonella serover Montevodeo (control/standard) DNA had 1.014 times
more starting DNA than the Salmonella serover Montevodeo contaminated/spiked
shrimp sample (106 CFU/mL).
Therefore,
px1.014 = 1000,000
p = 986193.30, where p is the number invA gene in spiked shrimp sample (106
CFU/mL).
From the above example, the quantitations of invA gene were calculated from
different concentrations of spiked shrimp and scallop (Table 15).
Quantity of DNA (invA gene) in spiked shrimp (Pandalus borealis) and scallop
(Chlamys islandica), calculated from the CT values of control/standard DNA
(Salmonella serover Montevodeo)

Mufty
44
UNU-Fisheries Training Programme
Table 13: Quantity of DNA (invA gene) in spiked shrimp (Pandalus borealis)
and scallop (Chlamys islandica), calculated from the CT value of
control/standard DNA (Salmonella serover Montevodeo).
Standard/Samples 1st CT Value 2nd CT Value CT Mean No of invA
gene
S. Montevideo 28.58 30.01 29.29 1000000.00
Spiked Shrimp
(106 CFU/mL )
28.39 30.22 29.31 986193.30
Spiked Shrimp
(103 CFU/mL)
32,21 31.29 31.75 181818.18
Spiked Scallop
(106 CFU/mL)
28,95 31.48 30.22 526315.79
Spiked Scallop
(103 CFU/mL)
30,54 35.64 33.09 71787.51
5.9 Development of real-time qPCR methods for detection of Salmonella spp.
A real-time PCR method was developed for detection of pathogenic Salmonella spp.
from shrimp and scallop.
The method was optimised using four sets of primer pairs to get the appropriate
primer pair and its optimised concentration, three anneling temperatutes were tested to
the assay to get the best result.
In the evaluation of the real-time PCR method on Salmonella spp. Salmonella was
detected by both PCR and a traditional culture method (NMKL-71 1999). Six
Salmonella strains were analysed with the real-time PCR method and were verified
with PCR and traditional culture method.
A reference sample of Salmonella Dublin from the Microbiology Division, National
Food Administration, Sweden, was tested by the real-time PCR method, PCR and
traditional method as well to establish the reliability of the developed method.
Two standard curves were drawn using the same six dilutions (106 to 101 CFU/mL)
of Salmonella serovar Montevideo to verify the linearity of the method. The detection
limit was determined by testing triplicates of the same six conentrations of serial
dilutions. By this method, the detection limit was determined to 1000 Salmonella
serovar Montevideo (invA gene) per PCR reaction volume of 25 μl.
The quantitations of DNA from spiked shrimp (Pandalus borealis) and scallop
(Chlamys islandica) were calculated from the ratio of CT values of known
concentrations of control/standard sample (Salmonella serovar Montevideo).
5.10 Validation of real-time qPCR for detection of Salmonella spp.
The results from PCR analysis show that the PCR based methods were able to detect
and quantify Salmonella in all positive samples.
Qualitative criteria of validation
The specificity was checked out by detecting the target Salmonella specific DNA
sequence (invA gene) from purecultures of Salmonella, from spiked shrimp (Pandalus

Mufty
45
UNU-Fisheries Training Programme
borealis) and scallop (Chlamys islandica) samples and from inter-laboratory test
samples. The specificity was checked with the conventional microbiology method and
PCR gel-electroferosis.
Selectivity was demonstrated with the negative and positive process control of
Salmonella DNA from the Salmonella strains. The demonstration was done
repetitively (three times) using the same Salmonella specific primers, show the
absence of interference peaks of other unexpected pathogens.
The proficiency test sample was tested in real-time PCR, “conventional method” and
PCR method; all three methods showed positive results which provided the reliability
properties of the validation method.
Quantitative criteria of validation
Sensitivity studies were performed with Salmonella pure cultures in broth and in
shrimp samples to determine the lower detection limit of the real-time PCR assay. The
real-time PCR assay was able to detect 103 CFU/mL of Salmonella serovar
Montevideo strains 103 invA gene from the contaminated sampled.
The RT-qPCR was able to detect seven Salmonella cells per mLin the proficincy test
sample.
Standard curves were constructed using mean Threshold Cycle (CT) and various
concentrations of Salmonella (ranging from 101 to 106 invA gene) and resulted in a
linear relationship between CT and log input DNA. There was a good correlation
(R2= 0.922 and 0.9296) between the CT values and the copy numbers of invA gene of
Salmonella serovar Montevideo.
The two different contamination levels (10-3 CFU/mL and 10-6 CFU/mL) of
Salmonella concentration into the shrimp and scallop samples were analysed in both
conventional and real-time PCR methods to provide the linearity of the results. There
was a significant difference of CT values of two different concentrations of shrimp
(2.44) and scallop (2.87).
Reliability criteria of validation
The RT-qPCR method was evaluated by repeating the same run three times using the
same primers of Salmonella. The two standard curves were constructed by Maxima
TM SYBR Green Master Mix (2X) and Power SYBR Green qPCRMaster Mix, using
the six serial concentrations of Salmonella serovar Montevideo showed a good
correlation (R2= 0.922 and 0.9296).

Mufty
46
UNU-Fisheries Training Programme
6 DISCUSSION
The aim of this study was to find a fast and a reliable method to detect Salmonella in
fish samples mainly in shrimp and scallop. For this purpose, a real-time qPCR method
was chosen. PCR can be an accurate and rapid way to amplify species-specific DNA
from a given sample.
The RT-qPCR method had not been running in the laboratory previously and thus it
had to be “developed” and adapted from various sources, e.g. literature and previous
experience. The adaption procedure for the PCR method started by obtaining six
Salmonella strains and preparing purecultures for further work. These strains were
used as positive controls for the testing of the Salmonella specific assays chosen for
this study.
The second step was to select Salmonella specific primers. Four different Salmonella
specific primer pairs were tested. The first pair targeted the ttrRSBCA locus (Malorny
et al. 2004), the second amplified the himA gene (Chen et al. 1999), while the third
and the fourth pairs were situated in the invA gene (Mi Nam et al. 2005, Malorny et
al, 2003, Hein et al. 2006). All of the primer pairs gave positive signals in PCR using
the six Salmonella strains, as expected. Of the four primer pairs invA 119F/R primer
pair gave the best results and was best suited for the SYBR Green Real-time PCR
assay. The Salmonella serovar Montevideo strain was used as a quantitating control as
serial dilutions (101 to 106) to verify the linearity and a standard curve.
The third step was to optimise several reaction conditions, i.e. annealing temperature,
appropriate primer and its concentration.
Although the type of kits or machines is not crucial to get the method to work, it is
worth mentioning the variety tools used with good results. To carry out real-time
PCR, three kits were tested: IQ SYBR Green Supermix (Bio-Rad), Maxima SYBR
Green aPCR Master Mix (Fermentas) and Power SYBR Green qPCR Master Mix
(Applied Biosystem). Two thermal cyclers were used in this study MiniOpticon
(BioRad) and StepOne (Applied Biosystem).
A standard method to quantify DNA or copy number of genes is the Critical cycle
(Ct) method (Heid et al. 1996). For best results we used the serial dilution of
Salmonella DNA in real-time PCR which gave a good correlation between CT values
and the copy numbers of the invA gene.
The two different concentrations (103 and 106 CFU/ml) of Salmonella serovar
Montevideo were spiked into shrimp (Pandalus borealis) and scallop (Chlamys
islandica) and analysed to verify the efficiency of the developed real-time method,
which was acceptable (standard deviation 0.65 for shrimp and 3.60 for scallop).
The invA gene from the Salmonella Montevideo contaminated scrimp and scallop
were quantified from the difference of CT values, the CT values are related to the
initial template concentration. The two different concentrations (103 and 106CFU/ml)
of Salmonella serovar Montevideo were spiked into the shrimp and scallop, the
resultant quantity of invA gene showed a significant difference of mean CT values.

Mufty
47
UNU-Fisheries Training Programme
The important part of the real-time PCR method development was to analyse
reference samples containing seven Salmonella serovar Dublin per ml of the
reconstituted aliquote; the results showed a proven band on PCR gel-electrpferosis
and the real-time PCR as well. This shows that the applied PCR method is highly
sensitive.
A few problems were experianced with the real-time PCR method. The main problem
was with primer-dimers, a problem that introduces false positive signals, even in
blank samples. To overcome this, it is important to opitmise the primer concentration
of each primer. Variability in results mainly caused by pipetting errors, which took
some time to overcome.
The developed real-time qPCR method is a non-standard laboratory based method,
was partially validated according to ISO 17025 to imply in routine diagnostic of
Salmonella spp. In a microbiological laboratory. The project intension was to validate
the method in contrast to quality, quantity and reliability with the vertical link each to
pure culture, spiked shrimp and scallop samples, reference samples, natural swab
samples and the traditional microbiological methods.
The qualitative validation was incorporated with the target Salmonella spp. which was
detected by real-time PCR, PCR and the conventional method. Repeatation needed to
comply with the reliability of the method.
A standard curve was constructed to get the lower limit of detection of Salmonella
serover Montevideo. The 10-fold serial dilution did not show the equal CT value
difference (Table 14), because of unequal distribution of DNA between the dilutions
which is an important consideration for identifying the low limit of detection.
Two concentrations of Salmonella serover Montevideo were spiked in shrimp and
scallop to quantify the flow of different concentrations, but the invA gene ratios were
not exactly proportional to the concentration level (Table 15).
The applied real-time method was validated partialy due to constraints in experience,
DNA contamination and time limits for repeating the method. Therefore, it is essential
to work in a broader spectrum for the development of real-time PCR method and for
the development of a full validation protocol.
Traditional microbiological methods based on growth are not always not good enough
to assess the pathogen in food. A combination of molecular techniques and
microbiological analyses should be applied to obtain the most representative picture
of the microorganisms present in a fish shellfish sample. There are many factors that
need to be considered, when determining the applicability of a rapid detection method
for Salmonella contamination in a fish-processing industry. The most important of
these would be sensitivity and specificity of the assay designed for real-time PCR
reactions.
In conclusion, the evaluation of the PCR-based method applied in this study identified
the need for a nested real-time PCR, instead of the less sensitive conventional single
PCR, to enable detection of pathogenic Salmonella in contaminated shrimp and
scallop.

Mufty
48
UNU-Fisheries Training Programme
7 CONCLUSIONS AND RECOMMENDATIONS
From the results obtained in this study, it is concluded that the PCR method applied
was able to detect and quantify Salmonella in pure, mixed and spiked samples.
Sample processing time was 24 hours, in practical terms this means 2 days compared
to 48 to 120 hours for conventional methods. The method detected Salmonella in
environmental samples where conventional methods have failed so far. The method
showed big potential and should be developed further.
7.1 Future works
To continue the present work several approaches and topics can be studied more.
Direct detection of Salmonella from the environmental sample, prior to any
microbiological enrichment steps.
The first obvious attempt is to introduce PCR methods to quantify the common
bacterial community of the fish samples in real-time PCR.
An important assignment for further work would be to find out the detection limit for
the common fish spoilage bacteria in different fish species; spoilage of fish and
fishery products are very common in tropical countries like Bangladesh.
Delineate the uncertainty measurement regarding validation for specific spoilage
bacteria and develop specific guidelines for accreditation of the developed method.

Mufty
49
UNU-Fisheries Training Programme
DEDICATION
I would like to dedicate this work to my wife, Bosra Khanam,
and my mother, Peara Begum, for their support and influence in my life and work.
ACKNOWLEDGEMENTS
This work was carried out at the Icelandic Institute of Natural History Laboratory,
University of Akureyri (UNAK), Akureyri, Iceland, under the United Nations
University-Fisheries Training Programme (UNU-FTP), Iceland.
I thank God for the strength he has provided me during this research work. I would
like to express my sincere gratitude to all who have contributed to this work,
especially:
Prof. Hjorleifur Einarsson, my main supervisor, for providing me with the possibility
to start and fulfill this research at the University of Akureyri, and for engagement and
guiding me through the process of scientific writing, continuous inspiration, selfless
assistance and advice throughout this research and for being such a good and caring
supervisor.
Kristinn P. Magnusson, my supervisor, for continuous and tireless support regarding
PCR techniques and for introducing me into this exciting area of microbiology and
giving me the opportunity to initiate my research education and work as well.
UNU-FTP, Iceland and the Department of Fisheries, Bangladesh for giving me the
opportunity to come and study in Iceland and develop my knowledge and gain
experience in the latest technology of fisheries science.
Mr. Thor Asgeirsson, Mr. Konrad Thorisson, Mr. Gudni Eiriksson, Ms. Sigridur
Ingvarsdottir and Bjarni Eiriksson for their uninterrupted support, direction and
cooperation during the entire training programme.
Jon Johannesson, Eydis Elva Thorarinsdottir and Kristbjorg Goa Sigurdardottir for technical support during the project periods.
Bosra Khanam, sweet daughter Rostina Artha and my mother Peara Begum, for their
cordial inspiration, love, prayers, encouragement and continuous support to complete
this research effort.

Mufty
50
UNU-Fisheries Training Programme
LIST OF REFERENCES
Aarts, H. J., Joosten, R. G., Henkens, M. H., Stegeman, H., and Van Hoek, A. H.
(2001). Rapid duplex PCR assay for the detection ofpathogenic Yersinia
enterocolitica strains. Journal of Microbiological Methods , 47, 209–217.
Alam, M. S., and Islam, M. S. (2005). Population genetic structure of Catla catla
(Hamilton) revealed by microsatellite DNA markers. Aquaculture , 246, 151-160.
Aminov, R. I., Chee-Sanford, J. C., Garrigues, N., Teferedegne, B., Krapac, I. J. and
White, B. A.,(2002). Development, Validation, and Application of PCR Primers for
Detection of Tetracycline Efflux Genes of Gram-Negative Bacteria. Applied
Environmental Microbiology , 68(4), 1786–1793.
Anonymous. (2008). Salmonellosis; Findings from R. Kumar and co-authors broaden
understanding of salmonellosis.[Electronic version]. Retrived 29.12.2008 from
ProQuest: http://proquest.umi.com/pqdweb?did=1444466761&sid=3&Fmt=3&clientId=58024& RQT=309&VName=PQD&cfc=1
Applied Biosystems. (2003). Creating Standard Curve with Genomic DNA or Plasmid
DNA Templates for Use in Quantitative PCR. 4371090 Revision A. Roche Molecular
Systems, Inc. and F. Hoffmann-La Roche Ltd.
Arvind, A. B. (2002). Simultaneous detection of Escherichia coli O157:H7, Listeria
monocytogenes and Salmonella strains by real-time PCR. International Journal of
Food Microbiology , 84, 217-224.
Bej, A. K., Mahbubani, M. H., Dicesare, J. L., and Atlas, R. M. (1991). Polymerase
chain reaction-gene probe detection of microorganisms by using filter-concentrated
samples. Applied Environmental Microbiology , 57 (12), 3529–3534.
Bremer, P. J., Fletcher, G. C., and Osborne, C. (2003). Salmonella in seafood. Crop &
Food Research , 1-4.
Chen, W., Martinez, G., Mulchandani, A. (1999). Molecular Beacons: A Real-Time
Polymerase Chain Reaction Assay for Detecting Salmonella. Analytical
Biochemistry,
280, 166-172.
Cheng-Hsun, C., and Jonathan, T. O. (1996). Rapid Identification of Salmonella
Serovars in Feces by Specific Detection of Virulence Genes, invA and spvC, by an
Enrichment Broth Culture-Multiplex PCR Combination Assay. Journal of Clinical
Micribiology, 34 (10), 2619–2622.
Chio, T. D., and Chen, S. C. (1981). Studies on decomposition and Salmonella
isolated from clams and marine waters of Kuwait. Water, Air, Soil Pollution , 26, 59–
63.

Mufty
51
UNU-Fisheries Training Programme
Darwin, K. H., and Miller, V. L. (1999). Molecular basis of the interaction of
Salmonella with the intestinal mucosa. Clinical Microbiology , Rev. 12, 405–428.
Das, M., Hafiz, M., Ahmed, M. K., and Parveen, S. (2007). Microbiological Analysis
of Some Raw Fish Samples. Bangladesh Journal of Microbiology, 24, 67-69.
DFBMD.(2009). Salmonellosis. Division of Foodborne, Bacterial and Mycotic
Diseases. [Electronic version]. Retrived 14.01.2009 from Centers for Disease Control
and Prevention, Department of Health and Human Services
http://www.cdc.gov/nczved/dfbmd/disease_listing/salmonellosis_gi.htmL#8
DoF. (2007). Fishery Statistical Year Book of Bangladesh,2006-07. Department of
Fisheries (DoF), Fisheries Resource Survey System (FRSS), Bangladesh. Dhaka.
Eleni, G; Danilo, M A; Wong, L F and Mary, E. P (2006a). Web-based surveillance
and global Salmonella distribution, 2000–2002. [Electronic version]. Retrieved
27.12.2008 from Centers for Disease Control and Prevention:
http://origin.cdc.gov/ncidod/EID/vol12no03/pdfs/05-0854.pdf
Eleni, G., Danilo, M. A., Wong, L. F., and Mary, E. P. (2006b). Web-based
surveillance and global Salmonella distribution, 2000-2002. [Electronic version].
Retrieved 26. 12 2008 from Medscape Today:
<http://www.medscape.com/viewarticle/525115>
Factor, S. H., Schillinger, J. A., Kalter, H. D., Saha, S., Begum, H. and Hossain, A.
(2001). Diagnosis and management of febrile children using the WHO/UNICEF
guidelines for IMCI in Dhaka, Bangladesh. Researc (Bulletin of the World Health
Organization),79, 1096–1105.
Fonseka, T. S. (1990). Microbial flora of pond cultured prawn (Penaeus monodon).
FAO Fisheries Report , 401 (Supplement), 24–31.
Food Safety (WHO). (2008). Food Safety. World Health Organization. [Electronic
version]. Retrieved 27.12.2008 from World Health Organization (WHO): http://www.who.int/foodsafety/micro/general/en/
Global Salm-Surv (GSS). (2006). WHO Global Salm-Surv Progress Report 2000-
2005. [Electronic version]. Retrieved 26.12.2008 from World Health Organization
(WHO): http://www.who.int/salmsurv/links/GSSProgressReport2005.pdf
Gu, H. W., Xu, K. M., Xu, C. J., and Xu, B. (2006). Biofunctional magnetic
nanoparticles for protein separation and pathogen detection. Chemical
Communication , 9, 941–949.
Heid, C.A., Stevens, J., Livak, K. J. and Williams, P.M. (1996). Real time quantitative
PCR. Genome Research, 6, 986-994.
Hein, I., Flekna, G., Krassnig, M. and Wagner, M. (2006). Real-time PCR for the
detection of Salmonella spp. in food: An alternative approach to a conventional PCR

Mufty
52
UNU-Fisheries Training Programme
system suggested by the FOOD-PCR project. Journal of Microbiological Methods,
66, 538-547.
Heinitz, M. L., Ruble, R. D., Wagner, D. E., and Tatini, S. R. (2000). Incidence of
Salmonella in fish and seafood. Journal of Food Protection , 63(5), 579-92.
Hoorfar, J., and Cook, N. (2003). Critical aspects of standardization of PCR . Methods
in Molecular Biology , 216, 51-64.
Hossain, S. M., Otta, S. K., Chakraborty, A., Kumar, H. S., Karunasagar, I., &
Karunasagar, I. (2004). Detection of WSSV in cultured shrimps, captured brooders,
shrimp postlarvae and water samples in Bangladesh by PCR using different primers.
Aquaculture , 237, 59-71.
Import Refusal Reports for OASIS. (2009). [Electronic version]. Retrived 09.01.2009
from U.S. Food and Drug Administartion:
http://www.fda.gov/ora/oasis/ora_oasis_ref.htmL
Islam, M. N., Islam, M. S., and Alam, M. S. (2007). Genetic Structure of Different
Populations of Walking Catfish (Clarias batrachus) in Bangladesh. Biochemical
Journal , 45 (9-10), 647- 662.
Iyer, T. S., and Shrivastava, K. P. (1989). Incidence and low temperature survival of
Salmonella in fishery products. Fishery Technology,26, 39-42.
Jane, A., Jean, C. B., David, H., and David, Z. (2003). International Trade and Food
Safety: Economic Theory and Case Studies. [Electronic version]. Retrived 14.01.2009
from United States Department of Agriculture, Economic Research Service:
http://www.ers.usda.gov/publications/aer828/aer828i.pdf.
Kanki, M., Sakata, J., Taguchi, M., Kumeda, Y., Ishibashi, M. and Takao, K. (2008).
Effect of sample preparation and bacterial concentration on Salmonella enterica
detection in poultry meat using culture methods and PCR assaying of preenrichment
broths. Food Microbiology , 26, 1-3.
Kumar, H. S., Sunil, R., Venugopal, M. N., Karunasagar, I., and Karunasagar, I.
(2003). Detection of Salmonella spp. in tropical seafood by polymerase chain
reaction. International Journal of Food Microbiology , 88, 91-95.
Kumar, R., Surendran, P. K., and Thampuran, N. (2008a). An eight-hour PCR-based
technique for detection of Salmonella serovars in seafood. World J Microbiol
Biotechnol , 24, 627–631.
Kumar, R., Surendran, P. K., and Thampuran, N. (2008b). Evaluation of culture,
ELISA and PCR assays for the detection of Salmonella in seafood. Letters in Applied
Microbiology , 46, 221–226.
Leoni, E., and Legnani, P. P. (2001). Comparison of selective procedures for isolation
and enumeration of Legionella species from hot water systems. Journal of Applied

Mufty
53
UNU-Fisheries Training Programme
Microbiology , 90 (1), 27–33.
Levi, K., Smedley, J., and Towner, K. J. (2003). Evaluation of a real-time PCR
hybridization assay for rapid detection of Legionella pneumophila in hospital and
environmental water samples. Clinical Microbiology and Infection , 9 (7), 754–758.
Lofstrom, C., Axelsson, C. E., and Radstrom, P. (2008). Validation of a Diagnostic
PCR Method for Routine Analysis of Salmonella spp. in Animal Feed Samples. Food
Analytical Methods , 1, 23–27.
Made, D., Petersen, R., Trumper, K., Stark, R., and Grohmann, L. (2004). In-house
validation of a real-time PCR method for rapid detection of Salmonella ssp. in food
products. European Food Research and Technology , 219, 171–177.
Madson, S. (2006). Incidence and PFGE Analysis of Salmonella and L.
monocytogenesin Various FDA Regulated Products 2001-2005. [Electronic version].
Retrived 27.12.2008 from http://www.aphl.org/profdev/conferences/proceedings/Documents/2006_10th_Annul PulseNet_Update_Meeting/45_Madson_FDA.pdf
Malorny, B., Hoorfar, J., Bunge, C., and Helmuth, R. (2003). Multicenter Validation
of the Analytical Accuracy of Salmonella PCR: towards an International Standard.
Applied and Environmental Microbiology , 69(1), 290–296.
Malorny, B., Made, D., Teufel, P., Berghof-Jager, C., I, H. and Anderson, A. (2007).
Multicenter validation study of two blockcycler- and one capillary-based real-time
PCR methods for the detection of Salmonella in milk powder. International Journal
of Food Microbiology , 117, 211–218.
Malorny, B., Paccassoni, E., Fach, P., Bunge, C., Martin, A., and Helmuth, R. (2004).
Diagnostic Real-Time PCR for Detection of Salmonella in Food. Applied and
Environmental Microbiology , 70 (12), 7046–7052.
Maura, P. H., and Peter, R. S. (1998). Validation of Polymerase Chain Reaction-based
techniques for proxy detection of bacterial fish pathogens: Framework, problems and
possible solutions for environmental applications. Aquaculture , 162, 41–68.
Mi Nam, H., Srinivasan, V., G, B. E., and Shelton E M, S. P. (2005). Application of
SYBR green real-time PCR assay for specific detection of Salmonella spp. in dairy
farm environmental samples. International Journal of Food Microbiology , 102, 161–
171.
Michael, D. O., and Dirk, A. W. (17. 7 2008). Salmonella Infection. [Electronic
version]. Retrived 27.12.2008 from eMEDICINE:
http://emedicine.medscape.com/article/785774-overview
Mitzscherling, A., and Kuhne, M. (2008). Investigations to microbial and viral
Contamination status of shrimps from Aquaculture. Journal of Consumer Protection
and Food Safety ,3, 54 – 60.

Mufty
54
UNU-Fisheries Training Programme
NMKL-7.1 (1999). Nordic Committee on Food Analysis,Salmonella Detection in
Foods. No.71. 5 ed.,1999, page 2(9). Postboks 8156 Dep., N-0033, Oslo, NORGE.
OIE. (2005). Salmonellosis, Paratyphoid, Non-typhoidal Salmonellosis.Office
International des Epizooties (OIE). [Electronic version]. Retrived 26.12.09 from
Center for Food Security and Public Health:
http://www.cfsph.iastate.edu/ Factsheets/pdfs/Nontyphoidal_Salmonellosis.pdf
Parvez, M. K., Hakim, M. A., Chowdhury, D. K., and Rahman, M. S. (2004). Study
on Antibiotic Resistance by Pathogenic Bacteria Isolated from Clinical Specimen.
Pakistan Journal of Biological Science , 7(11), 2005-2008.
Perellea, S., Dilasser, F., B, M., Grout, J., Hoorfar, J., and Facha, P. (2004).
Comparison of PCR-ELISA and LightCycler real-time PCR assays for detecting
Salmonella spp. in milk and meat samples. Molecular and Cellular Probes , 18, 409–
420.
Rahman, M. M., Morshed, A., and Rahman, M. (2005). Salmonella enterica serovar
Typhi with decreased susceptibility. International Journal of Antimicrobial Agents ,
25, 345–353.
Rahman, M., Patricia, C. N., Inger, K., Geert, H., Jean, S., and Roland, M. (2002).
Identification and Characterization of Pathogenic Aeromonas veronii Biovar Sobria
Associated with Epizootic Ulcerative Syndrome in Fish in Bangladesh. Applied and
Environmental Microbiology , 68 (2), 650–655.
Rattagool, P., Wongchinda, N., and Sanghtong, N. (1990). Salmonella contamination
in Thai shrimp. FAO Fish. Rep. , 401, 18– 23 (Supplement).
Saheki, K., Kabayashi, S., and Kawanishi, T. (1989). Salmonella contaminationof eel
culture ponds. Nippon Suisan Gakkaishi , 55, 675– 679.
Sunarya, R. E., Susilawati, B., Murtiningsih, H. N., Hariyani, E., and Subagio, D.
(1990). FAO Fisheries Report , 401, 99– 102 (Supplement).
Tirado, C., and Schmidt, K. (2001). WHO surveillance program for control of
foodborne infections and intoxications: results and trends across greater Europe.
Journal of Infectious Diseses , 43, 80–84.
Trond, M., Eiri, S. M., Live, L. N., and Solveig, L. (2003). Susceptibility of
Salmonella isolated from fish feed factories to disinfectants and air-drying at surfaces.
Veterinary Microbiology , 94, 207–217.
USAID, Bangladesh. (2006). A Pro-Poor Analysis of the Shrimp Sector in
Bangladesh. [Electronic version]. Retrived 26.02.2009 from http://www.usaid.gov/our_work/cross- cutting_programs/wid/pubs/Bangladesh_Shrimp_Value_Chain_Feb_2006.pdf
U.S. Public Health Service.(2009). Top Five Food-Borne Pathogens. [Electronic
version]. Retrived 14.01.2009 from ECOLAB Food Safety:

Mufty
55
UNU-Fisheries Training Programme
http://www.ecolab.com/Initiatives/foodsafety/Images/fdsafefoodbornepath.pdf
Varma, P. R., Mathen, C., and Mathew, A. (1985). Bacteriological quality of frozen
seafoods for export with special references to Salmonella. In: Ravindran, K., Nair,
N.U., Perigreen, P.A., Madhavan P., Pillai, A.G.G., Panicker, P.A., Thomas, M.
(Eds.), Harvest and Post-Harvest Technology of Fish. Society of Fisheries
Technologists (India), Cochin , 483– 484.
Wyatt, L. E., Nickelson, R., and Vanderzant, C. (1979). Occurrence and control of
Salmonella in fresh water catfish. Journal of Food Science , 44, 1067– 1069.
Yunus, M., Zimicki, S., Baqui, A. H., Hossain, K. M., and Blaser, M. J. (1981).
Salmonella food poisoning in Bangladesh. Retrived 27.12.2008 from Popline:
http://www.popline.org/docs/0761/269388.htmL

Mufty
56
UNU-Fisheries Training Programme
Appendix 1: Real-Time PCR Fluorescence quantity against cycles in six dilution
series (106,105,104,103,102,101) of Salmonella serovar Montevideo in
Maxima TM SYBR Green qPCR Master Mix (2X), E.coli and non-DNA
template were used as negative control.
Cycle 10 6 10 5 10 4 10 3 10 2 10 1Blank E.coli
1 0,0059 0,0052 0,0067 0,0065 0,0143 0,0069 0,0053 0,0108
2 0,0051 0,0042 0,0058 0,0053 0,0121 0,006 0,0045 0,0099
3 0,0046 0,0031 0,0048 0,0041 0,0098 0,0051 0,0037 0,0088
4 0,0036 0,0018 0,0035 0,0026 0,007 0,0037 0,0026 0,0073
5 0,0023 0,0008 0,0023 0,0018 0,0051 0,0025 0,0018 0,0063
6 0,0019 0,0005 0,0016 0,0019 0,0038 0,0018 0,001 0,0056
7 0,0014 0,0003 0,0011 0,0019 0,0032 0,0014 0,0007 0,0049
8 0,0007 0,0002 0,0005 0,0018 0,0026 0,0009 0,0006 0,0041
9 0,0004 0,0003 0,0004 0,0019 0,0026 0,0011 0,0007 0,0039
10 0,0004 0,0005 0,0006 0,0017 0,0023 0,0011 0,0004 0,0032
11 0,0001 0,0005 0,0004 0,0012 0,0025 0,0013 0,0005 0,0031
12 0 0,0004 0,0002 0,0008 0,0017 0,0013 0,0004 0,0026
13 0 0,0002 0,0004 0,0004 0,0014 0,0014 0,0003 0,0022
14 0,0002 0 0,0001 0,0004 0,0006 0,0012 0,0001 0,0017
15 0,0008 0,0001 0,0001 0,0001 0,0005 0,0008 0 0,0013
16 0,0018 0 0,0002 0 0,0002 0,0005 0,0003 0,0008
17 0,0038 0,0001 0,0004 0,0001 0,0002 0,0003 0,0002 0,0005
18 0,0072 0,0002 0 0,0002 0 0 0 0,0001
19 0,0137 0,0008 0 0,0001 0,0006 0 0 0,0001
20 0,0242 0,0017 0,0002 0,0006 0,0009 0,0005 0,0004 0,0002
21 0,0399 0,0032 0,0002 0,0004 0,0007 0,0006 0,0002 0
22 0,0606 0,0064 0,0002 0,0003 0,0006 0,0009 0,0004 0,0002
23 0,0848 0,0118 0,0009 0,0002 0,0005 0,0011 0,0003 0,0003
24 0,1104 0,0211 0,0018 0,0004 0,0003 0,0013 0,0006 0
25 0,1352 0,0347 0,0033 0,0008 0,0001 0,0013 0,0007 0,0001
26 0,1576 0,0529 0,0067 0,0012 0,0006 0,0016 0,0009 0,0008
27 0,1769 0,074 0,0128 0,0026 0,0022 0,0022 0,0014 0,0019
28 0,1928 0,0966 0,0227 0,0054 0,0052 0,0031 0,0029 0,0043
29 0,2063 0,1186 0,0368 0,0099 0,0095 0,0049 0,0056 0,0093
30 0,2173 0,1381 0,0545 0,0166 0,0177 0,0086 0,0102 0,0172
31 0,2264 0,1552 0,0745 0,0278 0,031 0,015 0,0176 0,0291
32 0,2342 0,1696 0,0954 0,042 0,0485 0,0243 0,0276 0,0442
33 0,2411 0,1819 0,1153 0,0577 0,0692 0,036 0,0392 0,0614
34 0,2468 0,1923 0,1333 0,0738 0,0909 0,0488 0,0508 0,078
35 0,2517 0,2011 0,1486 0,0887 0,1111 0,061 0,0618 0,093
36 0,2562 0,2083 0,1619 0,1011 0,1273 0,0717 0,0708 0,1053
37 0,2596 0,2146 0,1732 0,112 0,141 0,0802 0,0784 0,1151
38 0,2625 0,2198 0,1826 0,1215 0,1519 0,0874 0,0842 0,123
39 0,265 0,2243 0,1908 0,1299 0,162 0,0933 0,0898 0,1302
40 0,2672 0,2276 0,1969 0,1368 0,1697 0,0977 0,0938 0,1358

Mufty
57
UNU-Fisheries Training Programme
Appendix 2: Real-Time PCR Fluorescence quantity against cycles in six dilution
series (106,105,104,103,102,101) of Salmonella serovar Montevideo in Power
SYBR Green qPCR Master Mix.
Cycle 10 6
10 5
10 4
10 3
10 2
10 1
1 0,0610649 0,0530109 0,0448034 0,052306 0,0461532 0,0700495
2 0,0293653 0,0212505 0,0189768 0,0253049 0,0176894 0,0354823
3 0,0141046 0,0107585 0,0136976 0,0146319 0,0109499 0,0201285
4 0,0052711 0,0055823 0,0071271 0,0071823 0,0075173 0,0121943
5 0,0021653 0,001933 0,0034636 0,0016374 0,0022211 0,0090114
6 -0,0016067 -0,00137 -0,0003139 0,0011723 0,0002852 0,0026175
7 -0,004998 0,000415 -0,001292 0,0006613 0,0012648 4,417E-06
8 -0,0059068 -0,0033019 -0,0012264 -0,0014561 0,0002688 -0,0005973
9 -0,0063252 -0,0049325 -0,0035779 -0,000834 0,0004973 -0,0042145
10 -0,006307 -0,0025328 -0,0042624 -0,0016813 -0,0008189 -0,0045939
11 -0,0063196 -0,0043373 -0,004111 -0,0015137 -0,0009551 -0,0057979
12 -0,005663 -0,0036709 -0,0033267 -0,0046123 -0,0020216 -0,0061715
13 -0,0033659 -0,0024881 -0,0034164 -0,002476 -0,0018613 -0,0062
14 -0,0014135 -0,0065386 -0,0036042 -0,0064992 -0,0016396 -0,0067251
15 0,001035 -0,0037932 -0,002432 -0,0056553 -0,0030976 -0,0058852
16 0,0054604 -0,0025676 -0,0026949 -0,0022609 -0,00263 -0,0040926
17 0,0138693 -0,0016919 -0,0025115 -0,0047901 -0,00232 -0,0062642
18 0,0247188 -0,0007247 -0,0041103 -0,0035417 -0,0041221 -0,0051667
19 0,047181 0,0032801 -0,0024931 -0,0036155 -0,0039665 -0,0041892
20 0,0806517 0,0052992 -0,0038345 -0,000572 -0,0031784 -0,0043539
21 0,137262 0,0106814 -0,001375 -0,0031093 -0,0028672 -0,002782
22 0,2275852 0,0173338 -0,0010385 -0,0043404 -0,0032344 -0,0023946
23 0,3552933 0,0324313 -0,0001033 -0,0017687 -0,0055425 -0,0023683
24 0,5237199 0,0564213 0,0008926 -5,865E-05 -0,0025603 -0,0022943
25 0,7197439 0,0974303 0,0030372 0,0002002 -0,0025316 -0,0014464
26 0,9509297 0,1584882 0,0069165 -0,0013726 -0,0017294 -0,0008594
27 1,1995049 0,251645 0,0105892 0,0019792 -0,0014567 -0,0005708
28 1,4616561 0,3737583 0,0216805 0,0041352 -0,001945 -0,000102
29 1,7334248 0,5297651 0,0363441 0,0074246 0,0001751 0,0022302
30 2,0144503 0,7058012 0,0611654 0,0111336 0,0007578 0,0052787
31 2,2776551 0,895952 0,1048543 0,0226323 0,0010206 0,0058752
32 2,5414813 1,1019956 0,171186 0,0378667 0,0022429 0,0076316
33 2,7859499 1,3115611 0,2668865 0,0654488 0,0035068 0,0120979
34 3,0243189 1,5360278 0,3956217 0,1078205 0,006579 0,0190199
35 3,2448554 1,7450404 0,5483267 0,1784603 0,0111918 0,0318448
36 3,4563856 1,9592212 0,7232394 0,2790731 0,020087 0,0503458
37 3,6496506 2,1739883 0,9130121 0,4111775 0,0317595 0,0854264
38 3,8280973 2,3690059 1,1119354 0,5628659 0,0535392 0,1388526
39 3,995795 2,5570455 1,3234588 0,7326682 0,0817663 0,2130098
40 4,1546717 2,7234657 1,5373226 0,9116558 0,1259494 0,311906
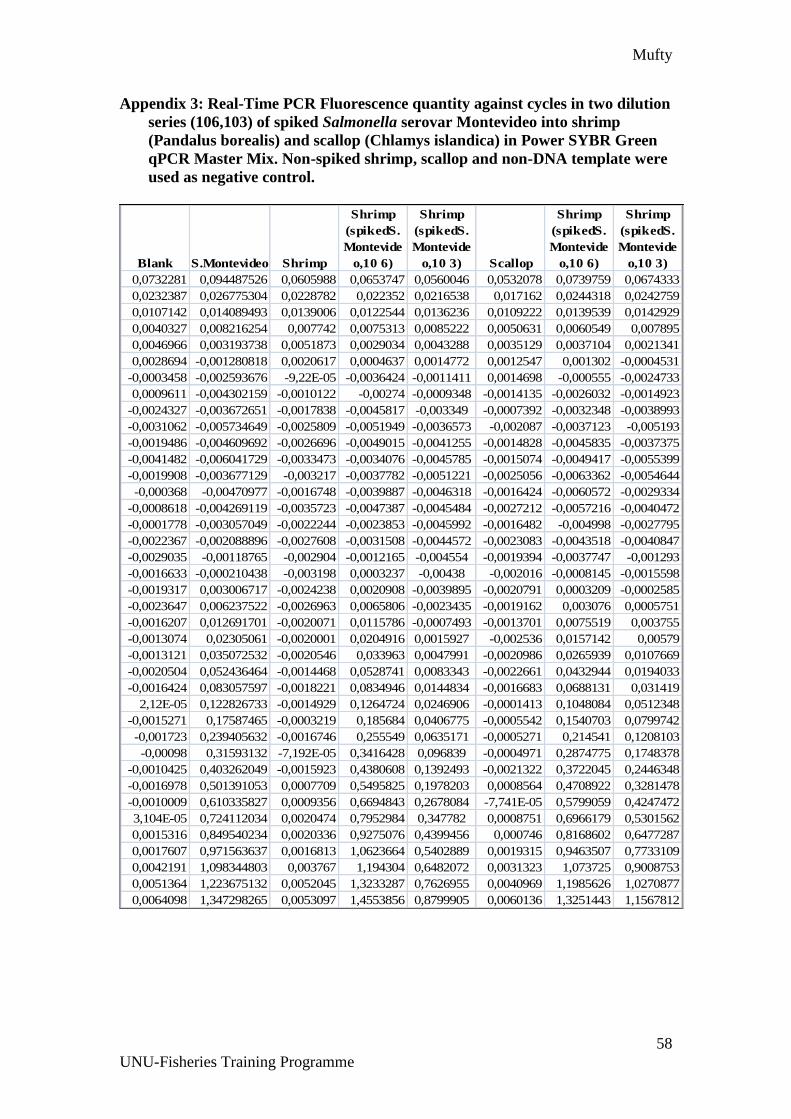
Mufty
58
UNU-Fisheries Training Programme
Appendix 3: Real-Time PCR Fluorescence quantity against cycles in two dilution
series (106,103) of spiked Salmonella serovar Montevideo into shrimp
(Pandalus borealis) and scallop (Chlamys islandica) in Power SYBR Green
qPCR Master Mix. Non-spiked shrimp, scallop and non-DNA template were
used as negative control.
Blank S.Montevideo Shrimp
Shrimp
(spikedS.
Montevide
o,10 6)
Shrimp
(spikedS.
Montevide
o,10 3) Scallop
Shrimp
(spikedS.
Montevide
o,10 6)
Shrimp
(spikedS.
Montevide
o,10 3)
0,0732281 0,094487526 0,0605988 0,0653747 0,0560046 0,0532078 0,0739759 0,0674333
0,0232387 0,026775304 0,0228782 0,022352 0,0216538 0,017162 0,0244318 0,0242759
0,0107142 0,014089493 0,0139006 0,0122544 0,0136236 0,0109222 0,0139539 0,0142929
0,0040327 0,008216254 0,007742 0,0075313 0,0085222 0,0050631 0,0060549 0,007895
0,0046966 0,003193738 0,0051873 0,0029034 0,0043288 0,0035129 0,0037104 0,0021341
0,0028694 -0,001280818 0,0020617 0,0004637 0,0014772 0,0012547 0,001302 -0,0004531
-0,0003458 -0,002593676 -9,22E-05 -0,0036424 -0,0011411 0,0014698 -0,000555 -0,0024733
0,0009611 -0,004302159 -0,0010122 -0,00274 -0,0009348 -0,0014135 -0,0026032 -0,0014923
-0,0024327 -0,003672651 -0,0017838 -0,0045817 -0,003349 -0,0007392 -0,0032348 -0,0038993
-0,0031062 -0,005734649 -0,0025809 -0,0051949 -0,0036573 -0,002087 -0,0037123 -0,005193
-0,0019486 -0,004609692 -0,0026696 -0,0049015 -0,0041255 -0,0014828 -0,0045835 -0,0037375
-0,0041482 -0,006041729 -0,0033473 -0,0034076 -0,0045785 -0,0015074 -0,0049417 -0,0055399
-0,0019908 -0,003677129 -0,003217 -0,0037782 -0,0051221 -0,0025056 -0,0063362 -0,0054644
-0,000368 -0,00470977 -0,0016748 -0,0039887 -0,0046318 -0,0016424 -0,0060572 -0,0029334
-0,0008618 -0,004269119 -0,0035723 -0,0047387 -0,0045484 -0,0027212 -0,0057216 -0,0040472
-0,0001778 -0,003057049 -0,0022244 -0,0023853 -0,0045992 -0,0016482 -0,004998 -0,0027795
-0,0022367 -0,002088896 -0,0027608 -0,0031508 -0,0044572 -0,0023083 -0,0043518 -0,0040847
-0,0029035 -0,00118765 -0,002904 -0,0012165 -0,004554 -0,0019394 -0,0037747 -0,001293
-0,0016633 -0,000210438 -0,003198 0,0003237 -0,00438 -0,002016 -0,0008145 -0,0015598
-0,0019317 0,003006717 -0,0024238 0,0020908 -0,0039895 -0,0020791 0,0003209 -0,0002585
-0,0023647 0,006237522 -0,0026963 0,0065806 -0,0023435 -0,0019162 0,003076 0,0005751
-0,0016207 0,012691701 -0,0020071 0,0115786 -0,0007493 -0,0013701 0,0075519 0,003755
-0,0013074 0,02305061 -0,0020001 0,0204916 0,0015927 -0,002536 0,0157142 0,00579
-0,0013121 0,035072532 -0,0020546 0,033963 0,0047991 -0,0020986 0,0265939 0,0107669
-0,0020504 0,052436464 -0,0014468 0,0528741 0,0083343 -0,0022661 0,0432944 0,0194033
-0,0016424 0,083057597 -0,0018221 0,0834946 0,0144834 -0,0016683 0,0688131 0,031419
2,12E-05 0,122826733 -0,0014929 0,1264724 0,0246906 -0,0001413 0,1048084 0,0512348
-0,0015271 0,17587465 -0,0003219 0,185684 0,0406775 -0,0005542 0,1540703 0,0799742
-0,001723 0,239405632 -0,0016746 0,255549 0,0635171 -0,0005271 0,214541 0,1208103
-0,00098 0,31593132 -7,192E-05 0,3416428 0,096839 -0,0004971 0,2874775 0,1748378
-0,0010425 0,403262049 -0,0015923 0,4380608 0,1392493 -0,0021322 0,3722045 0,2446348
-0,0016978 0,501391053 0,0007709 0,5495825 0,1978203 0,0008564 0,4708922 0,3281478
-0,0010009 0,610335827 0,0009356 0,6694843 0,2678084 -7,741E-05 0,5799059 0,4247472
3,104E-05 0,724112034 0,0020474 0,7952984 0,347782 0,0008751 0,6966179 0,5301562
0,0015316 0,849540234 0,0020336 0,9275076 0,4399456 0,000746 0,8168602 0,6477287
0,0017607 0,971563637 0,0016813 1,0623664 0,5402889 0,0019315 0,9463507 0,7733109
0,0042191 1,098344803 0,003767 1,194304 0,6482072 0,0031323 1,073725 0,9008753
0,0051364 1,223675132 0,0052045 1,3233287 0,7626955 0,0040969 1,1985626 1,0270877
0,0064098 1,347298265 0,0053097 1,4553856 0,8799905 0,0060136 1,3251443 1,1567812