application of a simultaneous transportation equilibrium...
TRANSCRIPT
52 TRANSPORTATION RESEARCH RECORD 1120
Application of a Simultaneous Transportation Equilibrium Model to Intercity Passenger Travel in Egypt K. NABIL A. SAFWAT
Safwat and Magnuntl have developed a combined trip-generation, trip-distribution, modaJ-spllt, and trip-assignment model that cun predict demand and performance levels on large-scale transportation networks simultaneously, that .Is, a Simultaneous Transportation Equlllbrlum Model {STEM). The major objective In this puper .ls to assess the behavioral applicability of the STEM methodology by using It to analy7.e Intercity passenger travel In Egypt. Though results were greatly Influenced by the misspecification of the trip-distribution model (particularly Its attract1veness measure) and the existence of severe fleet capacity constraints (particularly along the Calro-Banha-Tanta corridor In the middle Delta region), there were strong Indications that the approach was able to predict rational behavioral re.sponses of users to poUcy changes In the sy tern. Appropriate modlflcatlons to current specifications, which can easl.ly be Incorporated within the STEM framework, were sugge~1ed. Computational Issues of the apJlllcatlon are addressed In detail In a companion paper by Safwat in this Record.
Modeling of transportation systems must invariably balance behavioral richness and computational tractability. Safwat and Magnanti (1) developed a combined trip-generation, trip-distribution, modal-split, and trip-assignment model that can predict demand and performance levels on large-scale transportation networks simultaneously, that is, a Simultaneous Transportation Equilibrium Model (STEM). Moavenzadeh et al. (2) developed a methodology for incercity transporlation planning in Egypt with the STEM as one of its central components.
In this paper, the major objective is to assess the behavioral applicability of the STEM methodology. The main concern is assessing the ability to represent observed behavior and to predict behavioral changes. Computational issues of the application are addressed in detail in a companion paper by Safwat in this Record.
To achieve this objective, the STEM approach was applied to a real-world transportation network, the Egyptian intercity transportation system. In the next section, a STEM is briefly introduced. Next, the major issues related to intercity passenger travel in Egypt are presented. Then the focus is on the behavioral modeling of passenger transport on the system and the design of a case study. The results of the application are discussed last, followed by a summary and conclusions.
Department of Urban and Regional Planning, Texas A&M University System, College Station, Tell. 77843.
A STEM
In this section the behavioral assumptions and formulations of the components of a STEM are briefly introduced. For a detailed description, the reader is referred to the paper by Safwat and Magnanti (1 ). It should be emphasized at this point that although the assumptions of individual components of the STEM are not necessarily new, it is their internally consistent combination and simultaneous prediction that distinguishes a STEM formulation from other approaches.
Trip distribution is given by a logit model whose measured utility functions include the average minimum origin-destination (0-D) travel costs as variables with linear parameters. That is,
where
T;i
G; uij Ai 0
D;
R
exp(- 0Uij +Ai)
l: exp(-Uil, + AJ kEDi
for all ijeR
= number of trips distributed from origin i to destination j,
= number of trips generated from origin i,
= average minimum travel cost from i to j,
= attractiveness measure of destination j,
= parameter that measures the sensitivity of travelers to 0-D travel costs,
= set of destinations accessible from origin i, and
= set of all 0-D pairs ij.
Trip generation is given by any general function as long as it is linearly dependent on the system's performance through an accessibility measure based on the random utility theory of travel behavior (i.e., the expected maximum utility of travel). That is,
G; = aS; + E; for all ie/
S; = max [O, ln ~ exp(-0Uij + A}J for all iel JEDi
where
S; = accessibility variable that measures the expected maximum utility of travel for travelers at origin i,

Safwat
Ei
a
I
=
=
=
given minimum trip generation from i due to socioeconomic and land use forces, parameter that measures the sensitivity of travelers to accessibility of the system, and set of origins in the network.
Modal split and traffic assignment are simultaneously user optimized [the STEM framework allows for modal split to be given by a logit model or to be system optimized together with traffic assignment (3 )].
In the following sections, the issues involved in the application of this STEM to intercity passenger travel in Egypt are addressed.
INTERCITY PASSENGER TRAVEL IN EGYPT
For more details the reader is referred to Egypt National Transport Study, Phase 1 (4) and Phase 2 (5); papers by Safwat (3, 6); and Egypt Intercity Transport Project (7).
Existing modes for intercity passenger travel in Egypt include private car, taxi, and bus on a highway network with a total length of about 28,500 km, of which 15,000 km is paved. There are also different types of service on the railway network, which is owned by the Egyptian Railway Authority and has a total route length of about 3,260 km, excluding the Sinai lines.
Historically, rail was the dominant mode. During the last decade, however, rail has been quickly losing its position in favor of an increasingly competitive mode, the taxi. Table 1 shows the passenger kilometers produced in 1974 and 1979 by each mode in the system. In 1974 the system produced 23.5 billion passenger-km, of which 55 percent was produced by rail, 22.5 percent by taxi, 14.5 percent by bus, and 8 percent by private car. In 1979 the system produced 34.5 billion passenger-km (i.e., an increase of 12 billion passenger-km compared with 1974); only 0.9 billion passenger-km of this increase was absorbed by rail, whereas 6 billion passenger-km
TABLE 1 PASSENGER TRANSPORT, 1974 AND 1979
Passenger Kilometers (billions)
1974 1979
Mode No. Percent No. Percent
Private car 1.9 8.0 3.0 9.0 Taxi 5.3 22.5 11.3 33.0 Public bus 3.4 14.5 6.4 18.0 Railway 12.9 55.0 13.8 40.0 Total 23.5 34.5
53
(i.e., one-half of the increase) was attracted to the taxi. As a result, the rail share dropped from 55 to only 40 percent and the biggest increase was for the taxi, from 22.5 to 33 percent. In terms of the number of passenger trips in 1979 (Table 2), the taxi had the highest share, 37 percent, followed by rail at 30 percent only. Netherlands Engineering Consultants (NEDECO) predicted that this trend was expected to continue for at least five more years (5).
This trend is strikingly counterintuitive because rail has extremely low tariffs compared with other modes. Table 3 shows revenues generated and financial costs incurred in milliemes (MM) per passenger-km by mode. In 1979, the rail revenues were 2.37 MM per passenger-km compared with 12.40 MM for taxi. The severity of the problem facing rail is evident given that the financial costs incurred were more than twice the generated revenues, which indicates a large deficit (see Table 3). The problem is becoming even more serious over time because of the rapid increase of demand, estimated at about 9 percent annually during 1974-1979.
The major constraint on the Egyptian Railway is a severe limitation on fleet capacity. NEDECO (5) found that between 20 and 30 percent of all rolling stock registered as book stock in 1979 was beyond repair. Officials added that by 1982, about 82 percent was estimated to be beyond repair. The lack of sufficient tractive power was believed to be the main source of limitation. In July 1976 only 889 trains ran and 2,699 were cancelled, 2,614 of them for lack of locomotives (4).
Therefore, in the modeling and analysis of intercity passenger travel in Egypt, fleet capacity constraints must be accounted for in a satisfactory fashion. This is addressed in the next section.
BEHAVIORAL MODELING OF THE EGYPTIAN INTERCITY PASSENGER TRANSPORT SYSTEM
Modeling the Egyptian system to address the major issues indicated in the preceding section involves four major tasks: (a) the definition of passenger type-choice set mapping, (b) the specification of modal split and traffic assignment behavior and network representation, (c) the development of performance functions, and (d) the calibration of demand functions.
Passenger Type-Choice Set Mapping
Passengers may be classified into three types according to their income level: high, middle, and low. Transportation services may also be classified according to their level-of-service attributes such as travel time, tariff, comfort, safety, and so on. In
TABLE 2 PASSENGER TRANSPORT, 1979 (5)
Passenger Trips Passengers Kilometers Avg (millions) (billions) Distance
Mode No. Percent No. Percent (km)
Private car 47.3 8.0 3.0 9.0 63 Taxi 215.8 37.0 11.3 33.0 52 Public bus 146.3 25.0 6.4 18.0 44 Railway 174.2 30.0 13.8 40.0 79 Total 583.6 34.5 59
54
TABLE 3 REVENUES AND COSTS OF INTERCITY PASSENGER TRANSPORT IN EGYPT, 1979
Mode
Railway Air-~nditioned Non-air-conditioned
Bus (52 seats) Taxi
Revenues (milliemes/ passenger kilometer)
2.37 4.94 2.14 6.65
12.40
Financial Costs (milliemes/ passenger kilometer)
6.41 19.9 5.22' 6.65
12.40
fact, service types on the Egyptian system are designed so that each is most suitable for a particular income level. Available services in the system may be categorized as taxi, lux bus (an aggregation of several types of bus service that are considered "excellent," "good," or "sufficient"), normal bus (an aggregation of two types of bus service-"moderate" and "poor"), diesel train [includes first- and second-class air-conditioned (AC) service], express train (includes all types of service on rail ranging between first- and second-class AC to second- and third-class non-AC), and local train (exclusively third-class non-AC service).
In the analysis, it is assumed that a "mapping" exists between passenger income types and transportation service types (choice sets). The required mapping, based on a quality index associated with each service type [from NEDECO (5) and discussions with Egyptian transport experts], is defined in Figure 1.
In Figure l, solid lines indicate main modes and dashed lines indicate modes that may be selected by the particular passenger type whenever capacity is limited on the main modes. The mapping shown is further refined within the train types. The complete mapping may be summarized as follows:
1. Low-income passengers may select among local train, express train (third class only), normal bus, and taxi;
2. Middle-income passengers may select among express train (second class AC and non-AC), taxi, lux bus, and diesel train (second class AC only); and
3. High-income passengers may select among automobile, diesel, lux bus, express train (first class AC only), and taxi.
In this paper, analysis is focused on low-income passengers only, because they represent the majority of users in the system (about 80 percent of train users, 75 percent of bus users, and more than 65 percent of systemwide users have low incomes). Excluding other passenger types is expected to influence the
Passenger iypes .. .__ "L - 1-- ft_a 111u vllUl\iU ..,tn
·High Income ~-- Auto ---- Taxi
Lux Bus ·Middle Income -- -~ Normal Bua
,, - - Diesel (l·AC, ll·AC) ,,./ Express (l·AC, ll·AC, II, Ill)
• Low Income Local (Ill)
FIGURE 1 Passenger type-choice set mapping.
TRANSPORTATION RESEARCH RECORD 1120
results. Proper definition of low-income mapping, however, should overcome some of these inaccuracies.
Multlmodal Composed Networks
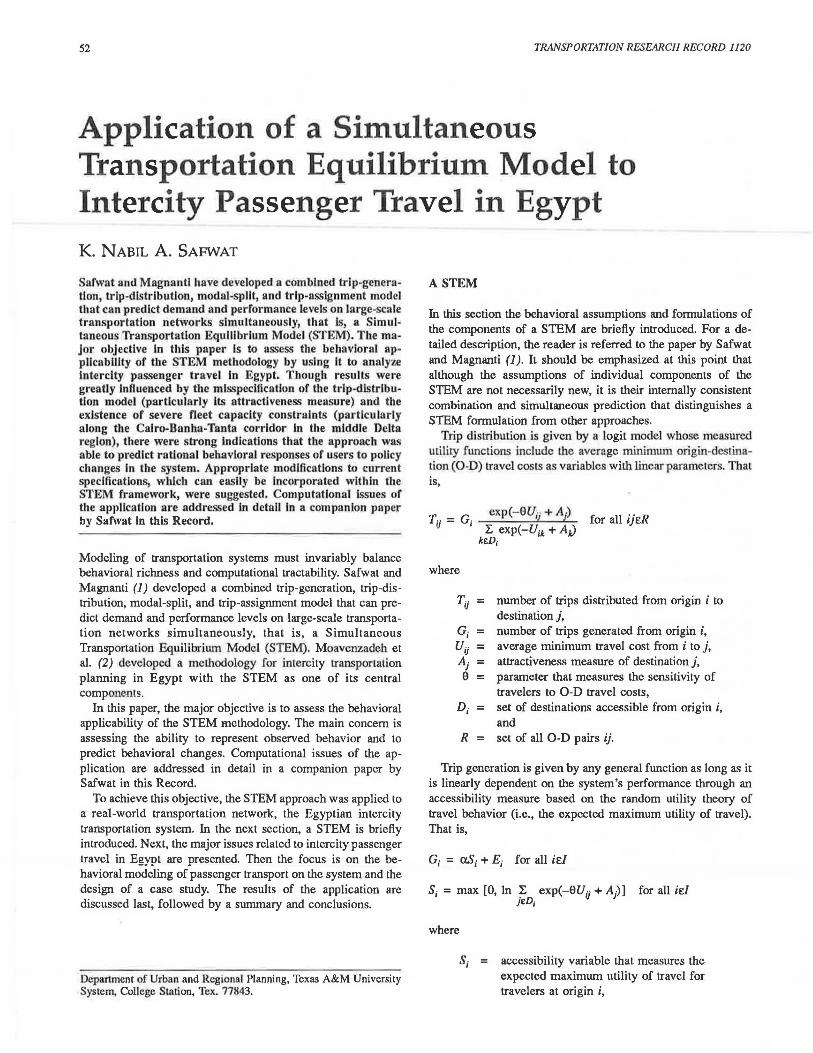
Because of the existence of transfer between transport modes in the middle of any given trip and because passengers travel as individuals or in small groups, modal split and traffic assignment on the Egyptian system are assumed to occur simultaneously in accordance with the user optimization principle of user behavior. With these behavioral characteristics (i.e., transfer between modes and user optimization behavior) the network may be best represented as a multirnodal composed network. An example of such a composed network is shown in Figure 2.
The network in Figure 2 consists of two modal networks, express train and normal bus, connected through three zonal centroids with loading and unloading links that reflect the allowable types of transfers between these two modes at each of the three zones. For example, the leftmost zone is a destination only, whereas the rightmost one can be origin or destination for both modes.
FIGURE 2 Example of multimodal composed network.
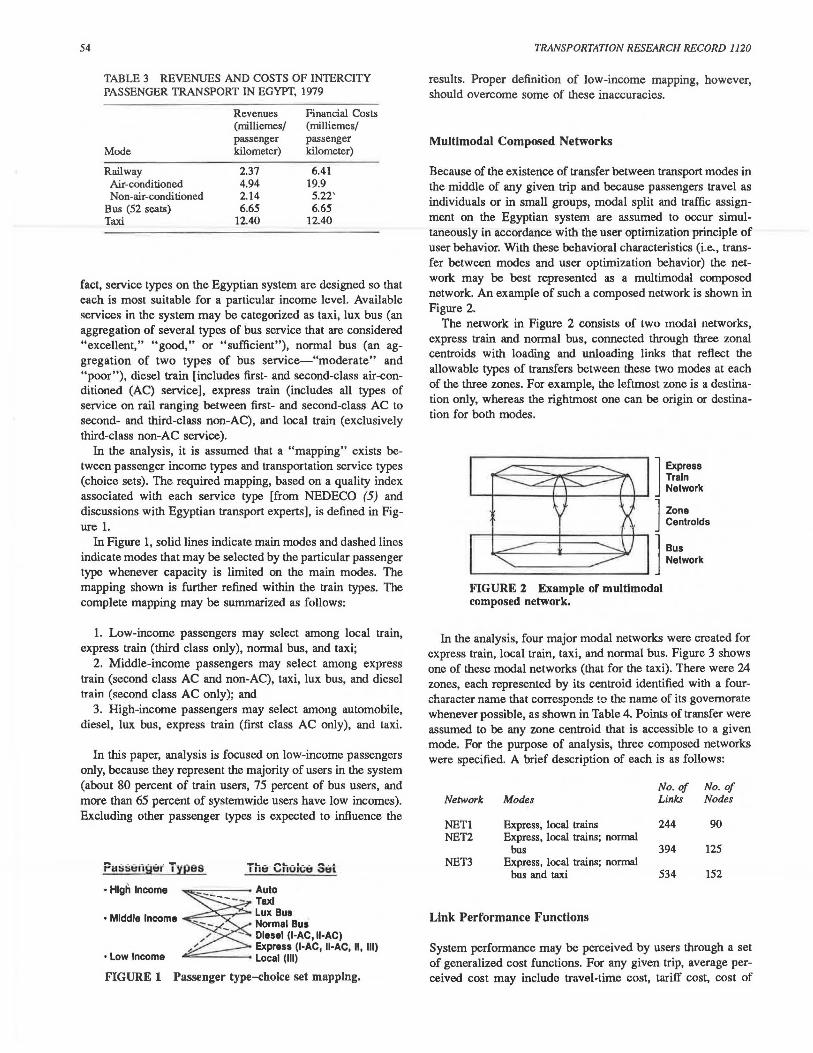
In the analysis, four major modal networks were created for express train, local train, taxi, and normal bus. Figure 3 shows one of these modal networks (that for the taxi). There were 24 zones, each represented by its centroid identified with a fourcharacter name that corresponds to the name of its govemorate whenever possible, as shown in Table 4. Points of transfer were assumed to be any zone centroid that is accessible to a given mode. For the purpose of analysis, three composed networks were specified. A brief description of each is as follows:
No. of No. of Network Modes Links Nodes
NETl Express, local trains 244 90 NET2 Express, local trains; normal
bus 394 125 NET3 Express, local trains; normal
bus and taxi 534 152
Link Performance Functions
System performance may be perceived by users through a set of generalized cost functions. For any given trip, average perceived cost may include travel-time cost, tariff cost, cost of

Safwat
Taxi-·-·-
. I , . • I I .
I I FYUM \__/
BSWF (b) Delta Region
-----Taxi
55
FIGURE 3 Egyptian intercity taxi network.
delay at intermediate nodes, and loading-unloading cost. The average perceived cost depends on several factors, such as system use, design, and operating policies, which may vary among different links and modes on the network. Therefore, performance functions are defined at the level of modal links on the composed networks.
A typical modal link User Perceived Cost (UPC) function, travel-time cost, is the value of time multiplied by the average travel time. The value of time is dependent on the average
TABLE 4 ZONING SYSTEMS
NEDECO Zoning System Safwat Zone (Govemorate) Zoning
No. Name Zone Centroid Systema
Cairo central business district Cairo-CBD CAIR
2 Giza Giza 3 Galyubia Banha BNHA 4 Sharkia (South) Zagazig ZGZG 5 Sharkia (North) Abu-Kebir ABKB 6 Dakahlia (East) Mansoura MNSR 7 Dakahlia (West) Sher bin SHRB 8 Domiat Domiat DMIT 9 Port Said Port Said PRTS
10 Ismailia Ismailia ISML 11 Swes Swes SWES 12 Minutia Shebin El-Korn SHKM 13 Gharbiya (South) Tan ta TANT 14 Gharbiya (North) Mahalla Kubra MHLK 15 Kafr El-Shaikh Kafr El-Shaikh KFRS 16 Beheita (South) Etay Baroud ETYB 17 Beheira (North) Daman hour DMHR 18 Alexandria Alexandria ALEX 19 Western Desert Marsa Matrah 20 Sinai E-Swes Tunnel 21 El-Fayum Fayum FYUM 22 Bani-Swaif Bani-Swaif BSWF 23 El-Minia Minia MNIA 24 Asyut Ayut ASYT 25 New Valley New Valley 26 So hag Sohag SHAG 27 Qena Qena QENA 28 Aswan Aswan ASWN 29 Red Sea Coast Port Safaga
a Abbreviations of wne centroid names.
annual income and was estimated at 0.15078 L.E./hr for the low-income group [based on figures from NEDECO (5, Annex II, pp. 3.27 and 3.29)]. Average travel time depends on link free-flow speed (which in tum is a function of link design and classification) and mode type (as reflected through a modal speed factor). The highway classes, railway classes, and modal speed factors were obtained from the Intercity Project (7). The speed factors for taxi and bus were assumed to include delay at intermediate nodes. For express and locai trains, delays at intermediate nodes were assumed to depend on the importance of the node as determined by the Intercity Project (7).
As far as traffic congestion is concerned, it is assumed that on the railway it is captured through the definition of "practical speed" on different track classes. On the highway, NEDECO (5) calculated the volume/capacity (V/C) ra~io for 80 intercity roadway sections; 80 percent of these were found to have V/C ratios less than 0.5. Hence, it is assumed that traffic congestion on the Egyptian intercity highway network may be ignored.
Tariff cost is estimated by multiplying the tariff per unit distance by the link length. Tariff per unit distance was approximated by the Intercity Project (7) because the actual tariff structure is distance-dependent.
Loading and unloading costs are the delays multiplied by the value of time. The average loading and unloading delays associated with different modes at different zones in the system were estimated by· the Intercity Project (7). These delays were difficult to estimate and the available information may be considered "crude" estimates.
The fleet capacity constraint on the Egyptian system may have been dealt with accurately by introducing a set of mathematical constraints to the optimization formulation. Such constraints, however, are generally nonconcave or nonconvex functions of the vector of flows of all user types on a given mode, and hence the addition of such constraints to the optimization problem will create computational difficulties. In this application, an approximate solution to the problem is suggested by introducing a term in the link UPC function that drives the user cost to a very high value whenever that capacity is exceeded. Similar approximations to deal with the problem of hard link capacity constraints have been suggested by several researchers [Daganzo (8) and Hearn (9)]. In this application, however, "capacity" refers to the available fleet capacity

56
for a given user type on a given modal link, which may be calculated given the passenger type-choice set mapping, train composition, load factors, and daily schedule (3).
Demand Functions
As indicated earlier, trip generation is given by a general linear model and trip distribution is given by a logit model. The calibration of these demand functions was based on data from NEDECO (5).
The main types of data required for calibration are 0-D matrices of trips and costs and socioeconomic data of passengers and zones. Available data include 0-D matrices for automobile, taxi, bus, and rail trips in 1979; 0-D distance matrix; and zonal population divided into urban and rural (5 ). The 0-D matrices of trips include synthesized items for highway modes and estimated values for about 50 percent of railway passenger movements based on a sample survey. This weakens their reliability. In addition, it is clear that socioeconomic data are very limited Furthermore, 0-D cost matrices are not available.
In the Intercity Project (7) a trip-distribution model was specified as follows:
where
dij
Di 00, 01
= = =
distance between zones i and j (km), number of trips attracted to j (per day), and parameters to be estimated
This trip-distribution model was calibrated within the Intercity Project (7) by Abdel-Nasser for each of the four major modes: automobile, taxi, bus, and rail, using the Gaussian leastsquares method
The corresponding calibration results for the trip-distribution model for low-income passengers are obtained by computing a weighted average of 00 anp 01 where the weights correspond to the modal split of low-income groups between bus and rail as obtained from the modal-split survey conducted in 1979 by NEDECO (5). That is,
(0) - 0.75 (0) 0.80 (0) i low - 0.75 + 0.80 i bus + 0.75 + 0.80 i rail
where i = 0 and 1. The results of this calculation imply the following values of
0o and 0, for low-income passengers: 0o = 0.01402 and 0, = 1.1044. To estimate the parameter 0 so that 00 dii = 0 Uii (recall that uij is rr.J.nimwu. travel cost from i to j), re&son~ble ~timates of U;j for selected 0-D pairs were obtained by assuming free-flow conditions (i.e., from the initial solution of the algorithm); a weighted average of those values was then computed, yielding 0 = 1.50714.
As far as the trip-generation model is concerned, the observed trip generation for the low-income group, G/, was estimated as the weighted average of bus and rail trip genera-
TRANSPORTATION RESEARCH RECORD 1120
tion based on the modal-split survey results by NEDECO (5). The corresponding accessibility, Sf, was computed as the natural logarithm of the denominator of the trip-distribution model (by definition). The minimum trip generation, E;, was assumed to represent about 90 percent of trips of the low-income group (i.e., there is a large portion of low-income passengers who must travel for socioeconomic reasons). That is, E; = 0.90 G/ for all i. A parameter a; was then estimated for each origin. Table 5 shows the values of Gf, s?. E;, and fl.; for the 24 zones of this study. In the table, fl.; is observed to be large for the major generators of traffic in the system (i.e., Cairo, Banha, Shebin Korn, and Alexandria). For the remaining zones, fl.; is almost consistently less than 200. In this study, an a= 200 was assumed; this would lead to underestimating total demands from the major generators.
BEHAVIORAL ASSESSMENT
In this section the applicability of the STEM methodology is assessed from the behavioral point of view. This includes assessment of the ability to represent observed behavior and to predict behavioral changes.
It should be mentioned at the outset that the behavioral capabilities of the STEM depend upon the state of the art of modeling travel behavior, the behavioral assumptions of the STEM itself, the ability of modeling behavior on the particular system, the availability and reliability of appropriate data, and the existence of special peculiar features on that system. The major limitation in relation to the state of the art is the lack of a well-defined theory of trip-generation and trip-distribution behavior. The STEM itself stands somewhere in the middle of the range of behaviorally acceptable transportation planning models. The behavioral modeling of the Egyptian intercity system
TABLE 5 TRIP GENERATION DATA
Zone Go I s; .Ei Cl;
CAIR 125,540. 9.363 112,986. 1,340 BNHA 81,240. 9.9286 73,116. 818 ZGZG 20,178. 9.9134 18, 160. 204 ABKB 6,803. 9.9134 6,123. 69 MNSR 21,004. 9.6107 18,904. 212 SHRB 9,700. 9.6107 8,730. 101 DMIT 6,494. 8.894 5,845. 73 PRTS 2,323. 8.3537 2,091. 28 ISML 7,846. 9.1587 7,061. 86 SWES 2,580. 8.5713 2,322. 30 SHKM 33,200. 10.0362 29,880. 331 TANT 38,677. 9.3537 34,809. 414 MHLK 9,781 9.3537 8,803. 105 KFRS 11,706. 9.538 10,535. 123 ETYB 6,000. 9.334 5,400. 64 DMHR 13.682. 9.334 12,314 147 ALEX 26,615. 8.5737 23,954 310 FYUM 11,226. 8.9846 10,103. 125 BSWF 13,751. 8.7727 12,376. 157 MNIA 6,237. 7.3347 5,613. 85 ASYT 9,867. 6.31 8,880. 156 SHAG 6,934. 5.948 6,241 117 QENA 6,062. 4.9553 5,456. 122 ASWN 2,834. 2.4167 2,550. 118

Safwat
(see previous section) appears to be reasonable in some, but not all, of its components. The main areas of limitation appear to be the calibration of demand models (because of the lack of theory and supportive data), the estimation of loading and unloading delays (~ause of the considerable amounI of research and data collection efforts required to obtain better estimates), and lhe modeling of fleet capacity constraints (because of the limitations of the state of the art). The major special features of the Egyptian intercity system are the nonexistence of the usual traffic congestion, the existence of fleet capacity constraints, and the topology of the network (i.e., a very dense network in Lower Egypt and one corridor in Upper Egypt).
The existence of these special features and limitations are expected to limit the generality of analysis. Nevertheless, results of analysis should be fruitful in terms of identifying areas of potential improvements in the particular application at hand as well as in lhe STEM approach itself.
Table 6 compares the "observed" trip-generation and tripattraction data with those pred.icted on the network representing lhe exfating situation (i.e., NET3). On the aggregate level, total demand predicted on NET3 is within 1.5 percent of lhe corresponding observed value (i.e., 473,045 versu.s 480,280 trips; see last row of Table 6); this is quite satisfactory. Percent difference between predicted and observed trip generation is less than 10 percent for all origins with number of trips exceeding 10,000 and is less than 20 percent for almost all origins with trips less than J 0,000; again thjs is very reasonable. The greatest differences, percentagewise, are observed for PRTS
57
and SWES (+63.8 and +57.8 percent, respectively). In absolute terms, however, these differences should not be overemphasized. The main reason for these discrepancies is related to lhe choice of an aggregate average value of the parameter a. This suggests that trip-generation predictions, in general, may be improved by defining a specific parameter <l; for each origin; note that the STEM methodology allows lhis modification.
Looking at trip-attraction results in Table 6, one finds that the differences are higher both percentagewise and in absolute tenns. Recall that the STEM predicts trip attraction indirectly through trip distribution. Therefore, the reasons for these discrepancies may be revealed by analyzing trip-distribution results.
Table 7 shows the results of analysis of trip distribution between the single most important 0-D pair in the systemCairo and Banha. Table 7 shows the observed data and predicted trips distributed between Cairo and Banha. It is obvious that differences between predicted and observed values are very large percentagewise and in absolute terms. Predicted trips from Cairo to Banha rcpresem an underestimation of 32 percent (i.e., 38,549 trips predicted on NET3 compared with 56,886 trips observed) and from Banha to Cairo represent an even greater underestimation of 54 percent (i.e., 32,080 trips predicted compared with 70, 729 trips observed).
The main reason for these large biases appears to be lhe misspecification of the trip-distribution model; namely, the attractiveness measure Ai = 01 In Di. It appears thal the total number of trips attracted, Di, is "Loo aggregate" to capture the
TABLE 6 COMPARISON BETWEEN PREDICTED AND OBSERVED 1RIP GENERATION AND ATTRACTION
Trip Generation Trip Attraction
Percent Percent Zone NET3 Observed Difference NET3 Observed Difference
ALEX 25,688 26,615 -3.5 14,125 26,150 -46 DMHR 14,093 13,682 +3 13,898 13,824 +0.5 ETYB 7,187 6,000 +19.8 7,953 6,224 +27.8 KFRS 12,331 11,706 +5.3 9,820 11,196 -12.3 MHLK 10,644 9,781 +8.8 12,776 9,924 +28.7 TANT 36,644 38,677 -5.2 48,555 38,452 +26.3 SHKM 31,719 33,200 -4.5 44,208 33,628 +31.5 BNHA 74,949 81,240 -7.7 88,104 66,383 +32.7 CAIR 114,739 125,540 -8.6 110,823 139,565 -20.6 ZGZG 19,992 20,178 -0.9 29,205 21,768 +34.2 ABKB 7,939 6,803 +16.7 8,385 5,716 +46.7 MNSR 20,708 21,004 -1.4 18, 178 19,692 -7.7 SHRB 10,519 9,700 +8.4 9,765 11,447 -14.7 DMIT 7,605 6,494 +17.1 4,024 6,209 -35.2 PRTS 3,805 2,323 +63.8 2,018 2,975 -32.2 ISML 8,827 7,846 +12.5 6,476 7,524 -13.9 SWES 4,070 2,580 +57.8 2,550 2,903 -12.1 FYUM 11,826 11,226 +5.3 8,156 12,156 -32.9 BSWF 14,102 13,751 +2.6 11,571 12,206 -5.2 MNIA 7,211 6,237 +15.6 4,607 6,777 -32 ASYT 10,368 9,867 +5.1 6,871 9,432 -2.7 SHAG 7,662 6,934 +10.5 5,702 7,294 -21.8 QENA 6,754 6,062 +11.4 4,115 6,025 -55.7 ASWN 3,664 2,834 +29.3 1,162 2,624 -55.7 Total 473,045 480,280 -1.5 473,045 480,280 -1.5

58
TABLE 7 ANALYSIS OF DEMAND BETWEEN CAIRO AND BANHA
To
From CAIR RNHA G;
Observed Trips
CAIR 56,886 125,540 BNHA 70,729 81,240
Di 139,565 66,383 480,280
Predicted Trips (A2)
CAIR 15,834 114,739 BNHA 21,735 74,949
Di 473,045
Predicted Trips (Al)
CAIR 51,977 114,739 BNHA 65,206 74,949
Di 473,045
Predicted Trips (NET3)
CAIR 38,549 114,739 BNHA 32,080 74,949
Di 110,823 88,104 473,045
variability in destination choice behavior of users at different origins. To see this, compare the following two specifications in which the influence of perceived cost is neglected:
Al:
= G. T ij for all ijeR I r. T·1t;
k '
A2:
Ai = ln Di T;i = G; Di for all ijeR I:.D1t; k
Table 7 also shows predictions based on Al and A2 specifications. It is quite obvious that Al represents a considerable improvement in the model specification, essentially by assuming that attractiveness of alternative destinations can be originspecific. This modification can be incorporated easily into the STEM.
Another factor that would have introduced biases in tripdistribution behavior is the parameter 0. Again, this parameter is currently specified as a systemwide average. II can, however, be an origin-specific parameter 01 for each origin. The STEM methodology also allows this modification. A third source of
TRANSPORTATION RESEARCH RECORD 1120
bias, particularly in the application at hand, is the existence of fleet capacity constraints.
The comparison between modal-split predictions on NET3 and observed values is shown in Table 8, which reveals that NET3 predictions imply more, longer trips than what was observed; that is, the average distance traveled is 56 percent greater on NET3 than it is for observed trips. This is one of the implications of the misspecification of attractiveness in the tripdistribution model. That is, the relative importance of destinations in Upper Egypt (Lower Egypt) to users originating from Lower Egypt (Upper Egypt) WWJ overestimated, and the relative importance of destinations in the same region, particularly those in Upper Egypt, was underestimated (3).
On the basis of that observation, the railway results in Table 8 are quite consistent and reasonable. As for the results of normal bus travel, predicted values are far below observed values. It seems that the assumption of the observed number of low-income passengers using the bus (i.e., 75 percent) may be relatively above the national average and hence the actual percentage may be far less than 75 percent. Unfortunately, available data could not provide a better estimate. In addition, it seems that the assumption that low-income passengers will not select lux bus under any circumstances is too restrictive, because lux bus is essentially an aggregation of five types of bus service-first class, Arrow, Flight Pullman, Lux Pullman, and Super Lux Pullman-and two of these types have a "sufficient" quality similar to the taxi (5). Therefore, including these two types in the choice set of low-income passengers should improve modal-split predictions.
At the aggregate level, predictions appear to be reasonable except that they imply longer trips than those observed, as explained earlier.
As far as traffic assignment is concerned, no observed data were available for comparison. Nevertheless, results should essentially reflect the foregoing biases.
In order to assess the ability of the approach to predict behavioral changes, it is necessary to assume that NET3 predictions represent actual behavior. In view of the previous comparison between NET3 predicted and observed trips, this assumption is not valid. However, an attempt to address this issue was made by assuming that express train fleet capacity is doubled everywhere in the system (i.e., NET4). The implications of this change on user behavior were assessed by comparing predictions before (NET3) and after (NET4) the change. The results of this comparison, though influenced by the biases introduced through the misspecification of the trip-distribution model and the existence of fleet capacity constraints, reflected the potential capability of the approach to predict rational behavioral responses of users to policy changes in the system [details on the application have been given by Safwat (3 )].
TABLE 8 COMPARISON OF MODAL-SPLIT PREDICTIONS ON NET3 AND OBSERVED VALUES
No. of Passengers Passenger Kilometers (thousands) Average Distance (km)
Percent Percent Percent Mode Observed Predicted Difference Observed Predicted Difference Observed Predicted Difference
Rail 381,808 348,861 -8.6 30,247 43,268 +43 79 124 +57 Bus 300,616 75,707 -75 13, 151 5,035 -62 44 66.5 +51 Taxi 59,097 3,903 52 66 +27 Total 682,424 519,615 -24 43,398 52,206 +20.3 64 100 +56

Safwat
SUMMARY AND CONCLUSIONS
In this paper, the major objective was to assess the applicability from the behavioral point of view of the STEM methodology developed by Safwat and Magnanti (1 ). The main concern was assessing the ability to represent observed behavior and to predict behavioral changes.
To achieve this objective, the STEM approach was applied to a real-world transportation network, namely, the Egyptian intercity transportation system.
The major conclusions may be summarized as follows:
• As to the ability to represent actual behavior, it was found that most of the biases between predicted and observed data were attributed to the misspecification of the trip-distribution model (particularly its attractiveness measure) and the existence of severe fleet capacity constraints (particularly along the Cairo-Banha-Tanta corridor in the Middle Delta region). Appropriate modifications to the current specification, which can easily be incorporated within the STEM framework, were suggested.
• As to the ability to predict behavioral changes, results were greatly influenced by the preceding conclusion. However, there were strong indications that the STEM would be capable of predicting rational behavioral responses of users to policy changes in the system.
As indicated at the introduction, the computational issues of the application are addressed in a companion paper by Safwat in this Record. In addition. a recent application to a large-scale urban transportation network (in Austin, Texas) has further demonstrated the computational tractability of the STEM methodology (JO). The value of the approach as compared with other existing methodologies was highlighted by Safwat and Magnanti ( 1 ). Several case studies involving passengers and freight on the Egyptian intercity system have recently been completed ( 11 ). An extended version of the STEM model was a central component of the methodology used in these case studies.
Further research in relation to the STEM methodology should include more applications, particularly in the urban context, a8 well as more refinement of the model assumptions and computational procedures.
ACKNOWLEDGMENTS
This work was funded by the U.S. Agency for International Development through the Technology Adaptation Program at
59
Massachusetts Institute of Technology. Support for writing of the paper was provided by the Department of Civil Engineering, Michigan Technological University, Houghton. Michigan.
The author would like to thank three anonymous referees and Yosef Sheffi, Massachusetts Institute of Technology and chairman of the TRB Task Force on Transportation Supply Analysis, for their invaluable comments on earlier versions of the paper.
REFERENCES
1. K. N. A. Safwat and T. L. Magnanti. A Combined Trip Generation, Trip DistribUlion, Modal Split and Trip Assignment Model. Working Paper OR-1 12-82 Center for Operations Research, Massachusetts Institute of Technology, Cambridge, 1982.
2. F. Moavenzadeh, M. Markow, B. Bmdemeyer, and K. N. A. Safwat. A Methodology for Intercity Transportation Planning in Egypt. Transportalion Research A, Vol. 17A, No. 6, 1983.
3. K. N. A. Safwat. The Simultaneous Prediction of EquWbrium on l.Arge-Scale Networks: A Unified Consistent Methodology for Transportation Ptam1ing. Ph.D. dissertation. Department of Civil Engineering, Massachusetts Institute of Technology, Cambridge, 1982.
4. Louis Berger, Inc. Egypt National Transport Study, Phase I, Final Report. Ministry of Transport, Cairo, Egypt, 1977.
5. Netherlands Engineering Consultants. Egypt National Transport Study, Phase 11, Final Report. Ministry of Transport, Cairo, Egypt, 1981.
6. K. N. A. Safwat. Egypt Intercity Transport Project-A Comprehensive Report. Technology Adaptation Program, Mas.sachusetts Institute of Technology, Cambridge, 1981.
7. Egypt Intercity Transport Project. Technology Adaptation Program, Massachusetts Institute of Technology, Cambridge, 1982.
8. C. F. Daganzo. On the Traffic Assignment Problem with Flow Dependent Costs, I and II. Transportation Research, Vol. 11, 1977, pp. 433-441.
9. D. W. Hearn. Study of Introducing Flow Bounds to Traffic Assignment Models. Final Report. Mathtech, Inc., Princeton, N.J., 1979.
10. K. N. A. Safwat and C. M. Walton. Application of a Simultaneous Transportation Equilibrium Model to Urban Travel in Austin, Texas. Presented at the Joint National Meeting of The Institute of Management Science and Operations Research Society of America, Los Angeles, Calif., April 1986.
11. Update and Application of the Intercity Transport Model: Final Report. CU/MlT Technology Adaptation Program, Development Research and Technological Planning Center, Cairo University, Egypt, 1986.