application of a system dynamics approach for assessment of the impact of regulations on cleaner...
TRANSCRIPT
at SciVerse ScienceDirect
Journal of Cleaner Production 20 (2012) 72e81
Contents lists available
Journal of Cleaner Production
journal homepage: www.elsevier .com/locate/ jc lepro
Application of a system dynamics approach for assessment of the impact ofregulations on cleaner production in the electroplating industry in China
Xiaoqing Donga, Chaolin Lia, Ji Lia,*, Wantao Huanga, Jia Wanga, Ruibin Liaob
a Environmental Science and Engineering Research Center, Shenzhen Graduate School, Harbin Institute of Technology, Shenzhen 518055, PR Chinab School of Medical business, Guangdong Pharmaceutical University, Guangzhou Higher Education Mega Center, Guangzhou 510006, PR China
a r t i c l e i n f o
Article history:Received 2 March 2011Received in revised form17 August 2011Accepted 17 August 2011Available online 26 August 2011
Keywords:Cleaner productionElectroplatingSystem dynamicsInvestment decisions
* Corresponding author. Tel./fax: þ86 755 2603 26E-mail address: [email protected] (J. Li).
0959-6526/$ e see front matter � 2011 Elsevier Ltd.doi:10.1016/j.jclepro.2011.08.014
a b s t r a c t
Compared with pollution transfer, cleaner production (CP) is more effective to reduce heavy metalpollution in many less developed countries. However, it’s more difficult to develop an efficient policy tomake enterprises to completely invest in CP. This paper analyses the effects of CP policies on investmentdecisions of firms using a dynamic systems model and by simulating a typical electroplating enterprise inShenzhen, China. Results show that water price could be effective only when it is increased by a sufficientamount. For instance, only when it is increased directly from 2 to 8 CNY/m3 (0.3e1.2 USD/m3), or from 8to 16 CNY/m3 (1.2e2.5 USD/m3), will an enterprise gradually increase CP investment from processmodification to recovery technology. Increasing the metal utilization rate of CP standard-plating andsurface finishing industry from its current value of 75%e85% would encourage an enterprise to addrecovery technology. Uniform preferential tax rate and penalties for the three parts of CP do not affectinvestment decisions on CP. Using the same investment subsidy rate for the three parts of CP could beeffective in promoting CP only if it is above 60%. The current emission standard of metal has played a rolein promoting CP. A comparison of three possible strategies indicates that a distinct policy for the differentparts of CP is the optimal policy combination. An overall investigation of typical enterprises based on theabovementioned framework is suggested to make more practical policies, which than can promote CPinstead of pollution transfer.
� 2011 Elsevier Ltd. All rights reserved.
1. Introduction
Excessive accumulation of heavy metals may not only seriouslycontaminate the environment, but also adversely affect humanhealth and social security, especially in developing and emergingcountries. In China, 12 cases related to heavy metal pollution,resulting in 32 public disturbances, were reported in 2009(Environmental Protection Ministry, 2010). Chinese authorities facea growing environmental and public security challenge. Althoughgovernments are planning to concentrate efforts on reducing heavymetals pollution, most of them still lack an effective policy toreduce the emission of heavymetals. A noteworthy phenomenon inthese countries is a trend of pollution transfer, which refers mainlyto the relocation of major polluting industries from economicallydeveloped areas to less developed areas, an event that may worsenthe pollution (Dong et al., 2010).
Based on the experience of developed countries, cleanerproduction (CP) is an effective way to reduce the heavy metals
92.
All rights reserved.
pollution. CP not only can reduce the emission of heavy metals, butalso can promote the recycling of resources. If CP can be success-fully promoted, then the trend of pollution transfer of heavy metalswill be effectively curbed. Thus the heavy metals pollution problemin China could be radically solved. However, historically speaking,technological innovation is highly correlated with the income levelof a country (Caselli and Coleman, 2001; Jerzmanowski, 2007;Comin and Hobijn, 2004; Tan, 2010).
Governments of some developed coastal areas in China have theability to promote CP. They also propose a series of environmentalregulations to encourage enterprises to adopt CP, especially in theelectroplating industry. Notable regulations include the IntegratedWastewater Discharge Standard (GB8978-1996) and the IntegratedEmission Standard of Air Pollutants (GB16297-1996) as amended in1996. To more effectively control pollution from electroplating, theEmission Standard of Pollutants for Electroplating (GB21900-2008)was developed and has been implemented to replace the oldstandards previously mentioned since 2008. Moreover, ChinaEnvironmental Protection Administration issued the CP standard-plating and surface finishing industry (HJ/T314-2006) to set stan-dards for the industry. The Law of the People’s Republic of China on

X. Dong et al. / Journal of Cleaner Production 20 (2012) 72e81 73
the Promotion of CP was made by the central government topromote the adoption of cleaner technologies (CT). The law itselfoffers incentives in the form of tax breaks (preferential tax rate) andequipment subsidy to enterprises that efficiently implement CP.Enterprises that violate the regulations must pay fines dependingon the severity of the violation. Furthermore, some local govern-ments have launched CP auditing in plating enterprise. Whetheractive water mechanism can promote CP has also been discussed.
Although these regulations have been implemented to promoteCP, emissions and water and metal consumptions per unit ofproduction in these areas are still higher than the average levels inmany developed countries (Guang, 2005). Even many wasterecovery methods and environmentally friendly alternative mate-rials that reduce hazards associated with electroplating processesare now being used by industries and/or are in the process of beingdeveloped with government support. However, majority of playersin the electroplating industry are still relying on emission controltechnologies rather than switching to CP as a means of achievingcompliance. Thus, policy makers, especially in less developedcountries, still are unsure of how to promote a faster deployment ofCT (Montalvo and Kemp, 2008).
Considerable research work to analyze the role of environ-mental regulation in the adoption of CP measures is in progress.Christensen and Georg (1995) demonstrated how productionpermits, wastewater (emission) licenses, and emission charges,influence firms to develop clean technologies by analyzing theresponse of the electroplating industry to the environmentalregulation implemented in Denmark. Warren et al. (1999) identi-fied factors, including economic incentives, environmental policyincentives, and individual and social incentives, that influence therelative degree of CP practiced by a firm based on the study of 26electroplating enterprises in four Chinese cities. Hilson (2000a, b)examined the legislative, technological, and economic barriers ofCP in themining industry, and discussed themajor changes that areneeded to overcome them. Baral and Engelken (2002) assessed theinfluence of regulations on the reduction of chromium emissionsfrom metal finishing industries in the United States. Reeve (2007)presented the responses of CP adoption to government legisla-tion, utilities use and discharge costs, EMS requirements, educa-tion, and benchmark competitiveness. Koefoed and Buckley (2008)analyzed some drivers and barriers for CT uptake, the appliedstrategies (choice of CP assessment methods, training strategy androle of environmental regulator) and results, and the savings ofwater, metals and chemicals. There is a more detailed overview ofthe advances in the field of CP diffusion research (Montalvo andKemp, 2008). Although previous works provide much informa-tion about the factors influencing the introduction and adoption ofCP, most of the prevailing research on the CP of the industry isbased on the qualitative analysis of case studies and surveys. Thereis still a requirement for a decision support tool for the analysis ofthe influence of CP policies on cleaner technology diffusion andpolicy innovation, especially in the area of electroplating industry.As Corral (2003) remarks, it is necessary to explore the relation-ships among determinants in a quantitative manner to assess theimportance of individual factors. The development of a reliablemodel for predicting the effects of environmental regulation onenterprise decisions and pollution generation would be useful inthe practice of CP management.
In the present paper, a simulation model based on systemdynamics (SD) for CP management is presented. SD is a method ofstudying the causal patterns of systems presented by Jay W. For-rester in 1961. The method aims to find out how policies, decisionsmaking, structure, and time delay correlate with each other andaffect the growth and stability of a given system (Kim et al., 1999;Jeong et al., 2009). A detailed description of the history of SD is
provided by the study by Jay W. Forrester (Forrester, 2007a, b). TheSD methodology is used to work out a model for scenario building,conducting policy experiments, and making projections (Anandet al., 2005; Ahmad and Franz, 2008). The initial step of themodeling approach is the identification of the relevant problemfollowed by the development of a dynamic hypothesis explainingthe causes of the problem. The dynamic model is converted to thecausal-loop diagrams or stock flow diagrams, which are based onthe interlinkage of different components associated within thesystem. This model is setup for computation simulation to aid in thestudy of the behavior with regard to the alternative policy changeswithin the system (Talyan et al., 2007).
The purpose of the present paper is to evaluate the effects ofenvironmental regulations on CP and provide policy suggestions forthe promotion of CP. This work takes a typical electroplatingenterprise as a study case, which is located in Shenzhen, one of themost developed coastal cities of China. The difficulties of adoptingCP from the point of viewof the enterprise are analyzed using an SDmodel. A causal-loop structure is constructed. The structureinvolves consumption of raw materials, waste emissions, CPbenefit, profits of the enterprise, and stimulus by policy options. Aseries of dynamo equations for each element in the diagram isincorporated in the model. The effectiveness of CP policies on CPinvestment decisions, enterprises profits, water and metalconsumptions, and pollution emission are explored. The differentpolicy options are evaluated in terms of their contribution toadoption of CP. The present research provides useful references tothe introduction of CP for less developed countries.
2. Model description
In this study, the SD methodology is adopted for the CP regu-lation modeling. For conceptualizing, simulating, analyzing andoptimizing such systems, the state-of-art software Vensim� wasemployed as the object-oriented programming tool incorporatingall equations and linkages in the model for all computations. Basedon this SD model, the performance of the CP regulation and theinfluence of policies on it can be fully evaluated.
2.1. Model assumption
Since we are interested in the impact of the overall systembehavior on enterprise’s investment decisions the model assumesthat the electroplating industry has only one firm producinga single product, Zinc Plating. This assumption is similar to thatused by Kong Chi et al. (2009) in energy policy analysis of the UKnatural gas industry.
The output of the firm will change with the market demand,scale and other factors. The focus of our research is to makea comparison of the enterprise profits between the situations withand without CP. According to the concept of the entrepreneurialS-shaped curve, product lifecycle and firm lifecycle have three orfour stages: lag, growth, saturation, and decline. So we assume thatthe output of the enterprise is increased gradually on the base ofS-curve.
In the CP investment module, it is assumed that investment willnot occur on itself. From the face-to-face interviews, the investmentdecision of the firm is quite individualistic and profits motivated. Itappeared that the firm will not make a new investment if thebenefit is less than zero. However, apart from the cost of capital,some qualitative factors, such as environmental regulators capacity,unskilled staff and CT communication, can affect an investmentdecision. But they are not considered in this study.
The main purpose of the study is to explore the effect of envi-ronmental policies on CP investment and water and metal

X. Dong et al. / Journal of Cleaner Production 20 (2012) 72e8174
consumptions or environmental emission. CP investment is usuallydivided into fixed equipment cost and operating cost. The depre-ciation of CP cost is calculated using Straight-line DepreciationMethod, which spreads the cost of the CP cost evenly over theuseful life of that asset.
Material quantities, as they pass through processing operations,can be described by material balances. For example, in the plantthat is plating zinc, the total quantity of water going into the plant isequal to the total of the reused water and the water in the wasteliquors after use. The total quantity of zinc going into the plant isalso equal to the total of the plated zinc, the reused zinc and thezinc in thewaste liquors. The consumption under special situations,such as evaporation, the bursting, dripping and leaking, will beneglected as they are small by comparison.
Cleaner production is the reduction or elimination of waste atthe source, or closed-loop recycling that takes place in a facility. Bythe implementation of CP in electroplating industry, pollution isreduced by substituting a less-toxic and/or non-regulated materialfor the material previously used, and the efficiency of the process isincreased by reusing water, heavy metal and other materials.Differences in efficiency of the reuse are dependent largely on thedifferences in technologies. The model assumes that the reuse ratesof water and heavymetal increasewith an increasing investment inCP equipment. Although histograms would be a more appropriateway to present the correlation between technology and efficiency,they cannot easily reflect the role of environmental policies inpromoting CP. Therefore, a series of continuous curves are used torepresent the relationship between CP investment options and thebenefits.
Besides, product modification and communication withcustomer can be often the most effective preventative technique.There are significant difficulties to run them by some concrete andeffective measures, which is worthy of consideration. However, theaim of the paper is to evaluate the impact of environmental regu-lations on CP by quantitative simulation, product modification andcommunication with customer has not been discussed as the focusof the work.
2.2. Conceptual framework for the model
Fig. 1 gives an overview of the conceptual framework for themodel in this paper. The model can be divided into three subsys-tems: CP investment decisions subsystem, enterprise profitssubsystem and wastewater emissions subsystem. The objective ofthis study is to analyze the impact of environmental policies onthese subsystems. The policy options for the electroplating industryare also incorporated in the model.
Benefit Investment decision Investment decision subsystem
Wastewater discharge subsystem Enterprise profit subsystem
Fixed cost Operation cost
Water emission
Heavy metal emission
CP cost
Enterprise’s
revenue from CP
Water cost
Heavy metal cost
Environmental cost
Other cost
Penalty
Output value Tax
Water recycling
Metal recycling
CP effectiveness
Fig. 1. Conceptual framework for the model.
2.2.1. Enterprise profits subsystemAs seen in left and upper side of Fig. 1, the enterprise profits
subsystem shows the correlation of enterprise profits with CPinvestment and environmental policies. The enterprise profits areaffected by fixed cost, operation cost, annual output value, and tax.Under the previous assumptions, it is the operation cost that chieflyaffects the enterprise profits through CP investment, which canchange environmental cost (penalty and pollutant discharge fee),water cost, metal cost, and other costs of an electroplatingenterprise.
2.2.2. CP investment decisions subsystemAs seen in down side of Fig. 1, the CP investment decisions
subsystem shows that the relationship between environmentalpolicies and CP investment decisions. The major impetus for CPinvestment comes from the benefit of CP strategies. The benefitobtained under CP investment decisions subsystem is furtherdivided into CP cost and CP revenue. CP cost refers to the averageannual expenditure of the plant for CP. CP revenue is subdividedinto continuously avoidable penalty, cost savings in wastewatertreatment and emission, reduction in water and metal consump-tions, the benefit of water and heavy metal recycling, and taxpreference. These variables are relevant to some policy variables,such as penalty, wastewater treatment cost and discharge fee, theprice of electricity, water andmetal price, government subsidy rate,and preferential tax rate. Stakeholders will decide whether the firmwill install the CP equipment or not according to his evaluation tothe profit from it. First the CP benefit must be positive, and then itmust be maximal. Thus, all these abovementioned variables havedifferent potential for CP investment decisions and enterpriseprofits depending upon the environmental regulators.
2.2.3. Wastewater discharge subsystemAs seen in right and upper side of Fig. 1, the wastewater
discharge subsystem shows the effect of CP investment on thewastewater discharge of the plant. The improvement of wastewaterdischarge subsystem is judged by the respective reduction of thetotal amount of water and metal in the wastewater. There isa balance between the inflow of fresh water and the outflow ofwastewater. The total amount of metal in the wastewater is alsoequal to the actual demand of metal minus the sum of the amountof metal consumption on the plating and the amount of metalrecovery. The interrelation between them can be established bycombining metal utilization rate, recycling rate, treatment rate, andso on. The wastewater discharge subsystem has an effect on thefirst two subsystems due to feedback effects between the variables,such as pollutant discharge fee, cost savings in wastewater treat-ment, and the benefit of water and heavy metal recycling.
2.3. Structure of SD model
Fig. 2 shows a simplified causal-loop diagram of a CP investmentcycle. Causal relationships between two variables are identified byarrows. The positive (negative) sign at the middle of each arrow canbe understood as the response to a positive change in the sourcevariable creating a positive (negative) variation on the target vari-able. The diagram shows the essential balancing feedback thatgoverns the long-run development of the CP investment. Althoughthe different levels of investment represent a combination ofdifferent measures. We treat CP as a whole just to illustrate theimpact of CP policies on CP investment decision. The CP expectedprofitability is composed of the expected CP benefits and expectedCost. CP expected profitability influence CP investment decisions,and the environmental policies will affect the CP expected profit-ability. Investment decisions influences the emissions of pollution,

CP ExpectedProfitabilityInvestment
DecisionExpected Costs
Expected CPBenefits
Policies
ExpextedPrice
MaterialsConsumption
PollutantEmissions
+
-
-+
+
+
-
+
+
Fig. 2. Causal-loop diagram of the CP. Correlation between variables is either positiveor negative and is expressed by a plus (þ) or minus (�) sign placed by the arrowhead.
X. Dong et al. / Journal of Cleaner Production 20 (2012) 72e81 75
which is positive correlated with materials consumption. Materialsconsumption has an effect upon expected CP benefits. Taking thisconsideration in mind, the fundamental behavior of the model canbe summarized by a detailed feedback loops.
3. Case study
Wewould like to simulate the model by presenting a case study.The electroplating industry is spread all over the China, butShenzhen, Guangzhou and Suzhou are cities in which most of theproducers are located. According to the Environmental ProtectionBureau, about 899 electroplating companies are located inShenzhen in 2009. The majority of firms are very small subcon-tractors (employing six to 20 people). Some larger firms do,however, have inhouse electroplating facilities.
The company studied is located in Shenzhen, China, and platesnickel, zinc and chrome finishes for a wide range of applicationssince 2004. The company consists of 25 workshops (like 25 smallsubcontractors) and has various clients ranging from car compo-nent manufacturers to private customers. It has an end-of-pipetreatment system, which can treat 500e800 tons wastewater perday. The company has the goal of becoming a company which lookscarefully at improving efficiency, reducing wastes and environ-mental impacts.
The company plans to accomplish the goal by developing a CPprogram. According to the relevant literature and project experi-ence, the CP program mainly consists of process modification,recovery technology and hazardous chemical replacement whichcan be simulated by adjusting current CP policies. The detailedstatement and cost of each unit is shown in Table 1. The processmodification just makes a simple modification based on existingproduction lines. Its purpose is to reduce water and metalconsumption and minimize waste emissions by increasing bath lifeefficiency, drag-out reduction, and rinse water reduction. It usually
Table 1Main steps of CP program in the enterprise.
Name Main steps of CP program
Processmodification
Recoverytechnology
Hazardous chemicalreplacement
Item Increasing bath lifeefficiency;
Reverse osmosis(RO) andultrafiltration (UF)
A non-cyanidealkaline and acidbath can beused.
Drag-out reduction;Rinse waterreduction
Cost(CNY/year)
300,000 300,000 200,000
causes little economic impact for the firm. The recovery technologyimproves the level of wastewater reuse by adding some reuseprocess. The usual technology is reverse osmosis (RO) and ultra-filtration (UF) which can improve the utilization of water andmetalby recycling wastewater of a galvanizing plant. The hazardouschemical replacement technology means that the current galva-nizing process is substituted for a non-cyanide plating process. Thenew alternative belongs to green process which will reduce healthand environmental risks. The last two parts would be costly. Themain purpose of policy makers is to improve efficiency, reducewastes and environmental impacts through these steps. The localgovernment decides to punish the company or not, depending onthe water consumption per unit of production, utilization rate ofmetal, metal discharges concentration in CP standard and emissionstandard. This means that the company can choose any part or allparts as long as it can meet the requirements of the standards.
The data of the various expenses and revenue of the companyfor the year 2005e2009 are collected from the annual financialstatements. The year 2010 is taken as the base line year to analyzethe factors affecting CP adoption. Pollution discharge fee andpenalty is obtained according to local government regulationspreviously mentioned. CP parameters such as equipment invest-ment, running cost, and corresponding utilization rate of metal andrecycling rate of water are based on literature values.
4. Results and discussion
4.1. Model validation
Actual results from 2004 to 2009 and results from the modelused in this study were compared to test the predictive accuracyand stability of the SDmodel. The annual output value, the demandfor metal, water consumption and enterprise profits variables areselected as target parameters. From this, a model’s robustness canbe determined, and a mean absolute percentage error (MAPE) canbe employed as a backcasting technique.
MAPEð%Þ ¼ 1n
Xn
t¼1
����At � Ft
At
����� 100
Where At, Ft, and n are the actual value, forecast value, andnumber of periods for which forecasts are generated, respectively(Jeong et al., 2009).
The actual and forecast values of the target parameters for thepast consecutive years are shown in Table 2. The results of back-casting indicated that the MAPE of them were less than 5%.Therefore, MAPEs were within an acceptable range for most of theendogenous variables. These proved that the model generatedbehavior is consistent with the available literature and historicaldata.
4.2. Factors analysis of affecting CP adoption
Through interviews with managers, we found that the firstconcern of most stakeholders is the economic problems. The majorimpetus for an electroplating enterprise to invest CP comes fromthe actual income of CP and investment costs. Electroplating CPincome includes the value of recycled metals, the value of reusewater, the reduction of sewage charges and the saving in penalty.The CP investment contains original equipment cost and overalloperational cost. Therefore, this section focuses on the analysis ofthe effects of equipment investment and some key policy param-eters on CP investments decisions.
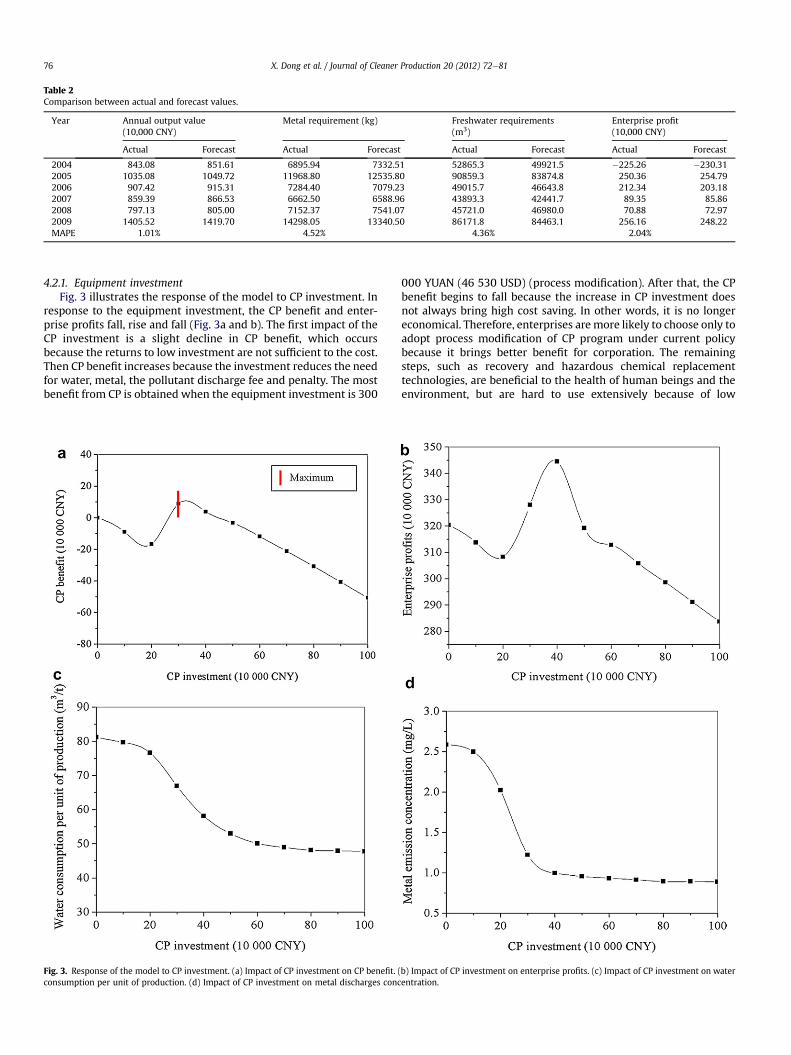
Table 2Comparison between actual and forecast values.
Year Annual output value(10,000 CNY)
Metal requirement (kg) Freshwater requirements(m3)
Enterprise profit(10,000 CNY)
Actual Forecast Actual Forecast Actual Forecast Actual Forecast
2004 843.08 851.61 6895.94 7332.51 52865.3 49921.5 �225.26 �230.312005 1035.08 1049.72 11968.80 12535.80 90859.3 83874.8 250.36 254.792006 907.42 915.31 7284.40 7079.23 49015.7 46643.8 212.34 203.182007 859.39 866.53 6662.50 6588.96 43893.3 42441.7 89.35 85.862008 797.13 805.00 7152.37 7541.07 45721.0 46980.0 70.88 72.972009 1405.52 1419.70 14298.05 13340.50 86171.8 84463.1 256.16 248.22MAPE 1.01% 4.52% 4.36% 2.04%
X. Dong et al. / Journal of Cleaner Production 20 (2012) 72e8176
4.2.1. Equipment investmentFig. 3 illustrates the response of the model to CP investment. In
response to the equipment investment, the CP benefit and enter-prise profits fall, rise and fall (Fig. 3a and b). The first impact of theCP investment is a slight decline in CP benefit, which occursbecause the returns to low investment are not sufficient to the cost.Then CP benefit increases because the investment reduces the needfor water, metal, the pollutant discharge fee and penalty. The mostbenefit from CP is obtained when the equipment investment is 300
Fig. 3. Response of the model to CP investment. (a) Impact of CP investment on CP benefit. (consumption per unit of production. (d) Impact of CP investment on metal discharges conc
000 YUAN (46 530 USD) (process modification). After that, the CPbenefit begins to fall because the increase in CP investment doesnot always bring high cost saving. In other words, it is no longereconomical. Therefore, enterprises are more likely to choose only toadopt process modification of CP program under current policybecause it brings better benefit for corporation. The remainingsteps, such as recovery and hazardous chemical replacementtechnologies, are beneficial to the health of human beings and theenvironment, but are hard to use extensively because of low
b) Impact of CP investment on enterprise profits. (c) Impact of CP investment on waterentration.

Fig. 5. Effect of investment subsidy rate on CP investment decisions. Numbers in theright of curves represent investment subsidy rates. Curves of different colors representCP benefits under different subsidy rates. (For interpretation of the references to colourin this figure legend, the reader is referred to the web version of this article.)
X. Dong et al. / Journal of Cleaner Production 20 (2012) 72e81 77
benefits. Similarly, the maximum profits are obtained when theequipment investment is 300,000 CNY/46,530 USD (processmodification).
However, the CP investment has a direct influence on the waterconsumption per unit of production and the metal dischargesconcentration. Fig. 3c and d show that the water consumption perunit of production and the metal discharges concentration gradu-ally decline until they tend to have a constant response to increasein the CP investments (Fig. 3c and d). The results indicated that theoptimal equipment investment is 800,000 YUAN/124,080 USD (thewhole CP program) for the minimal water and metal consumptionsand pollution emission.
For the present water prices these are the conclusions. Althoughlow resources consumption and little environmental pollution canbe obtained through the whole CP program, most companies inChina only adopt process modification step of CP program. The toolow return on higher CP investment is the most important factoraffecting CP adoption. This conclusion is consistent with the resultsof interviews with business owners. So the policy makers mustpromote the implementation of CP through policy interventionssuch as price mechanism, standards, subsidies, and penalty foroffenders.
4.2.2. Water priceIncrease in water price has a direct impact on CP investment
decisions as indicated in Fig. 4. In view of the overall situation, theCP benefit increases with the increasing water price. More signifi-cant for the policy makers, however, is the changes in CP invest-ment decisions of the enterprise. When the water price is increasedfrom 2 to 6 CNY/m3 (0.3e0.9 USD/m3), the most preferred optionfor the enterprise on CP investment is 300,000 CNY/46,530 USD(process modification). When the water price is increased from 8 to14 CNY/m3 (1.2e2.2 USD/m3), the most preferred option for theenterprise on CP investment is 400,000 CNY/62,040 USD (tend toadd recovery technology). When the water price is from 16 to20 CNY/m3 (2.5e3.1 USD/m3), the most preferred option for theenterprise on CP investment is 500,000 CNY/77,550 USD (tend toadd recovery technology most probably). That implies that theinterventionwith water price is an effective measure to promote CPfrom low cost to higher cost. Of course, it must be noted that too
Fig. 4. Effect of water price on CP investment decisions. X axis represents CP invest-ment cost. Y axis represents CP benefit. Numbers in the right of curves represent waterprices. Curves of different colors represent CP benefits under different water prices.The red vertical lines indicate the most preferred option for the enterprise on CPinvestment under corresponding water prices. (For interpretation of the references tocolour in this figure legend, the reader is referred to the web version of this article.)
high a price of water will affect the enterprise profits, which in turnmay influence the development of electroplating industry.
4.2.3. CP investment subsidyInvestment subsidy has a major impact on the cost of CP
investment, which in turn, is usually considered to be the primedeterminant of the most preferred option for the enterprise on CPinvestment. Fig. 5 shows the impact of investment subsidy rate onCP investment decisions. It can be observed that the CP benefitincreases with the increasing investment subsidy rate. However,the optimal choice for the enterprise on CP investment is stillalways 300,000 CNY/46,530 USD (process modification) as theinvestment subsidy rate increases from 0 to 50%. When thesubsidy rate is from 60% to 70%, 80%, 90%, the most preferredoption for the enterprise on CP investment is 400,000 CNY/62,040 USD, 500,000 CNY/77,550 USD and 600,000 CNY/
Fig. 6. Effect of CP standard for utilization rate of metal on CP investment decisions.Curves of different colors represent CP benefits under different CP standards forutilization rate of metal. (For interpretation of the references to colour in this figurelegend, the reader is referred to the web version of this article.)
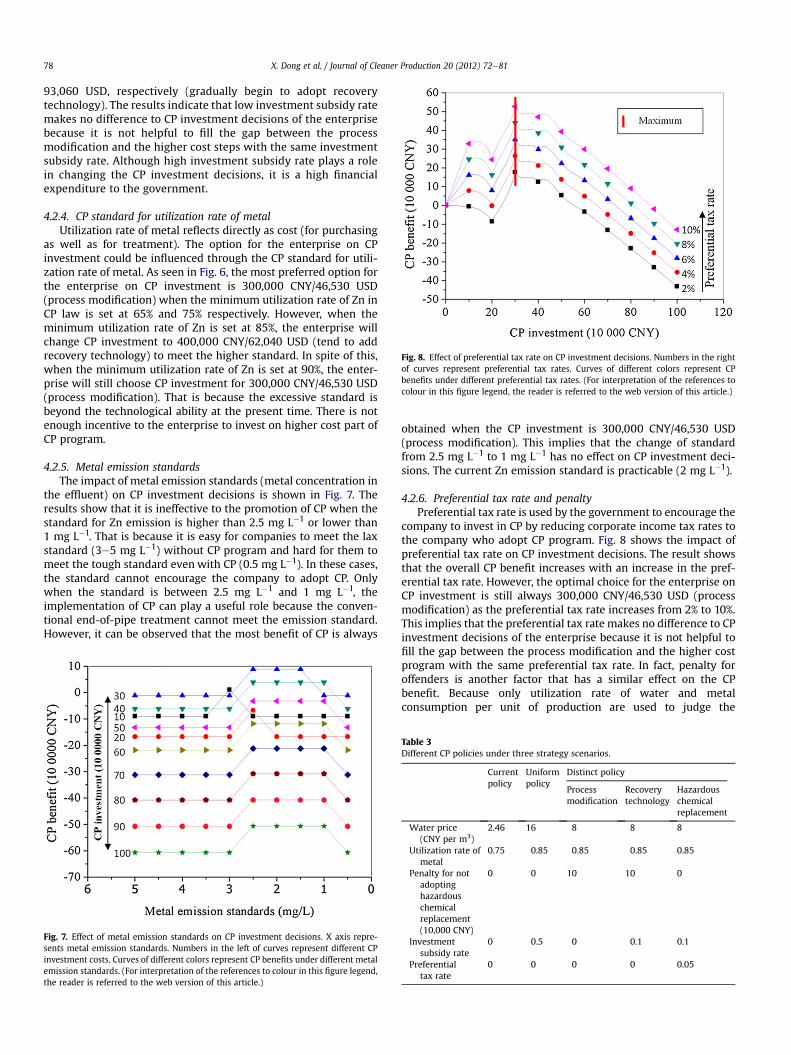
Fig. 8. Effect of preferential tax rate on CP investment decisions. Numbers in the rightof curves represent preferential tax rates. Curves of different colors represent CPbenefits under different preferential tax rates. (For interpretation of the references tocolour in this figure legend, the reader is referred to the web version of this article.)
X. Dong et al. / Journal of Cleaner Production 20 (2012) 72e8178
93,060 USD, respectively (gradually begin to adopt recoverytechnology). The results indicate that low investment subsidy ratemakes no difference to CP investment decisions of the enterprisebecause it is not helpful to fill the gap between the processmodification and the higher cost steps with the same investmentsubsidy rate. Although high investment subsidy rate plays a rolein changing the CP investment decisions, it is a high financialexpenditure to the government.
4.2.4. CP standard for utilization rate of metalUtilization rate of metal reflects directly as cost (for purchasing
as well as for treatment). The option for the enterprise on CPinvestment could be influenced through the CP standard for utili-zation rate of metal. As seen in Fig. 6, the most preferred option forthe enterprise on CP investment is 300,000 CNY/46,530 USD(process modification) when the minimum utilization rate of Zn inCP law is set at 65% and 75% respectively. However, when theminimum utilization rate of Zn is set at 85%, the enterprise willchange CP investment to 400,000 CNY/62,040 USD (tend to addrecovery technology) to meet the higher standard. In spite of this,when the minimum utilization rate of Zn is set at 90%, the enter-prise will still choose CP investment for 300,000 CNY/46,530 USD(process modification). That is because the excessive standard isbeyond the technological ability at the present time. There is notenough incentive to the enterprise to invest on higher cost part ofCP program.
4.2.5. Metal emission standardsThe impact of metal emission standards (metal concentration in
the effluent) on CP investment decisions is shown in Fig. 7. Theresults show that it is ineffective to the promotion of CP when thestandard for Zn emission is higher than 2.5 mg L�1 or lower than1 mg L�1. That is because it is easy for companies to meet the laxstandard (3e5 mg L�1) without CP program and hard for them tomeet the tough standard even with CP (0.5 mg L�1). In these cases,the standard cannot encourage the company to adopt CP. Onlywhen the standard is between 2.5 mg L�1 and 1 mg L�1, theimplementation of CP can play a useful role because the conven-tional end-of-pipe treatment cannot meet the emission standard.However, it can be observed that the most benefit of CP is always
Fig. 7. Effect of metal emission standards on CP investment decisions. X axis repre-sents metal emission standards. Numbers in the left of curves represent different CPinvestment costs. Curves of different colors represent CP benefits under different metalemission standards. (For interpretation of the references to colour in this figure legend,the reader is referred to the web version of this article.)
obtained when the CP investment is 300,000 CNY/46,530 USD(process modification). This implies that the change of standardfrom 2.5 mg L�1 to 1 mg L�1 has no effect on CP investment deci-sions. The current Zn emission standard is practicable (2 mg L�1).
4.2.6. Preferential tax rate and penaltyPreferential tax rate is used by the government to encourage the
company to invest in CP by reducing corporate income tax rates tothe company who adopt CP program. Fig. 8 shows the impact ofpreferential tax rate on CP investment decisions. The result showsthat the overall CP benefit increases with an increase in the pref-erential tax rate. However, the optimal choice for the enterprise onCP investment is still always 300,000 CNY/46,530 USD (processmodification) as the preferential tax rate increases from 2% to 10%.This implies that the preferential tax rate makes no difference to CPinvestment decisions of the enterprise because it is not helpful tofill the gap between the process modification and the higher costprogram with the same preferential tax rate. In fact, penalty foroffenders is another factor that has a similar effect on the CPbenefit. Because only utilization rate of water and metalconsumption per unit of production are used to judge the
Table 3Different CP policies under three strategy scenarios.
Currentpolicy
Uniformpolicy
Distinct policy
Processmodification
Recoverytechnology
Hazardouschemicalreplacement
Water price(CNY per m3)
2.46 16 8 8 8
Utilization rate ofmetal
0.75 0.85 0.85 0.85 0.85
Penalty for notadoptinghazardouschemicalreplacement(10,000 CNY)
0 0 10 10 0
Investmentsubsidy rate
0 0.5 0 0.1 0.1
Preferentialtax rate
0 0 0 0 0.05
X. Dong et al. / Journal of Cleaner Production 20 (2012) 72e81 79
implementation of CP and decide whether or not to impose a fine.There is no real distinction made between the different steps of CPprogram through uniform preferential tax rate and penalty.
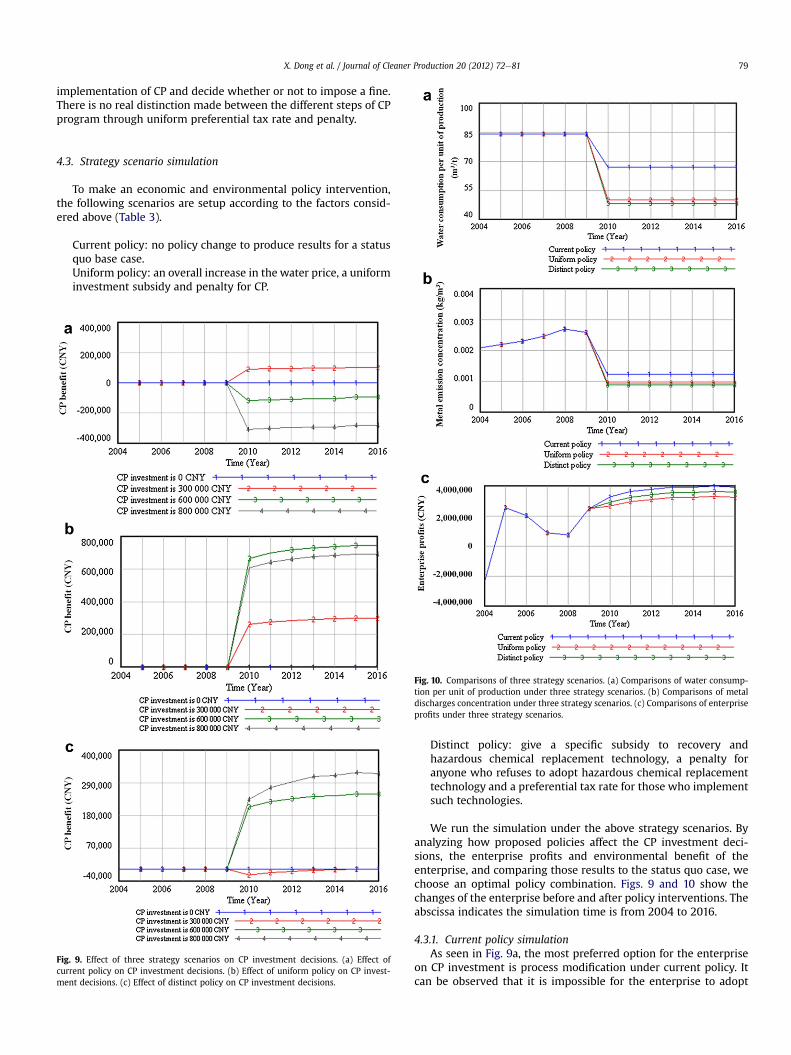
4.3. Strategy scenario simulation
To make an economic and environmental policy intervention,the following scenarios are setup according to the factors consid-ered above (Table 3).
Current policy: no policy change to produce results for a statusquo base case.Uniform policy: an overall increase in the water price, a uniforminvestment subsidy and penalty for CP.
Fig. 9. Effect of three strategy scenarios on CP investment decisions. (a) Effect ofcurrent policy on CP investment decisions. (b) Effect of uniform policy on CP invest-ment decisions. (c) Effect of distinct policy on CP investment decisions.
Fig. 10. Comparisons of three strategy scenarios. (a) Comparisons of water consump-tion per unit of production under three strategy scenarios. (b) Comparisons of metaldischarges concentration under three strategy scenarios. (c) Comparisons of enterpriseprofits under three strategy scenarios.
Distinct policy: give a specific subsidy to recovery andhazardous chemical replacement technology, a penalty foranyone who refuses to adopt hazardous chemical replacementtechnology and a preferential tax rate for those who implementsuch technologies.
We run the simulation under the above strategy scenarios. Byanalyzing how proposed policies affect the CP investment deci-sions, the enterprise profits and environmental benefit of theenterprise, and comparing those results to the status quo case, wechoose an optimal policy combination. Figs. 9 and 10 show thechanges of the enterprise before and after policy interventions. Theabscissa indicates the simulation time is from 2004 to 2016.
4.3.1. Current policy simulationAs seen in Fig. 9a, the most preferred option for the enterprise
on CP investment is process modification under current policy. Itcan be observed that it is impossible for the enterprise to adopt

X. Dong et al. / Journal of Cleaner Production 20 (2012) 72e8180
recovery technology and hazardous chemical replacement whichget a negative benefit.
4.3.2. Uniform policyThe changes in CP investment decisions when water price,
investment subsidy rate and penalty are increased as much aspossible are shown in Fig. 9b. It can be seen that although a fairlyhigh water price (16 CNY/2.5 USD) and investment subsidy rate(50%) are raised, the most preferred option for the enterprise on CPinvestment is process modification and recovery technology.Hazardous chemical replacement still cannot be used.
4.3.3. Distinct policyFig. 9c shows the benefit of CP investment under distinct policy.
We can see that the enterprisewill carry out CP program containingnot only process modification and recovery technology but alsohazardous chemical replacement. The changes of the mostpreferred option of the enterprise can be attributed to the economicincentives for CP investment through investment subsidy, penaltyand preferential tax rate, particularly for hazardous chemicalreplacement process.
4.3.4. Comparison of strategiesThe comparisons of water consumption per unit production,
metal discharges concentration, and the enterprise profits underthe three strategy scenarios are shown in Fig. 10aec. It can be seenfrom the simulation results that the distinct policy has the lowestwater consumption and pollutant emission. Although it has someeffect on the enterprise profits compared to current policy, it showsrelatively less effect than the uniform policy. Furthermore, thegovernment expenditure on CP investment subsidy in distinctpolicy (10%) is much less than that in uniform policy (50%), whichimproved subsidy efficiency greatly and lessened the burden ofgovernment finance.
5. Policy implications
In this study, the SDmethodology is adopted for the CP regulationmodeling in electroplating industry in China. Based on themodel, theeffects of main policy parameters on CP implementation wereanalyzed. The results give several crucial policy implications for thepromotion of CP in underdeveloped or less developed countries.
Firstly, increasing price of water will not always contribute tochange significantly feasibility of some CPmeasures. A rational waterprice is necessary to encourage a wider adoption of CP. However,contrary to the conventional wisdom that elimination of low waterprices will promote more efficient resources use, thereby making CPmeasures more economically attractive (Warren et al., 1999; Reeve,2007), an increase in water price may not facilitate introduction ofCP measures. Results showed that the water price increases from2 CNY/m3 to 8 CNY/m3 (0.3e1.2 CNY/m3), and then to 16 CNY/m3
(2.5 USD/m3), the enterprise will gradually increase CP investmentfrom process modification to recovery technology. But the waterprice increases from 2 to 6 CNY/m3 (0.3e0.9 USD/m3), 8 to 14 CNY/m3 (1.2e2.2 USD/m3), or 16 to 20 CNY/m3 (2.5e3.1 USD/m3), themost preferred option for the enterprise on CP investment will notchange. This indicates that water price can play an effective role onlywhen it is increased by a sufficient amount. However, an increasethat is not well planned will not play a positive role in increasing thepromotion of implementation of CP but may have negative impactsupon the development of electroplating industry.
Secondly, the simulation results imply that CP standard shouldbe set comprehensively and accurately. Although CP standard (HJ/T314-2006) has been developed specifically for plating and surfacefinishing industry, only the water consumption per unit of
production and utilization rate of metal are real practicable refer-ence standards in accordance with the requirements of its content.In fact, the implementation of CP is a multistep process. The savingsof water andmetal mainly happens in the process modification partthan with recovery technology. Moreover, the hazardous chemicalreplacement process has little effect on the savings of water andmetal and cannot be promoted only through current standards. Butit can decrease harm to the health of human beings and the envi-ronment. Therefore, the ways to increase the implementation ofhazardous chemical replacement technologies should be consid-ered during the development of the CP standard. In addition,results show that when the minimum utilization rate of Zn isincreased from 75% to 85%, the enterprise may change CP invest-ment decisions to meet the higher standard. The current CP stan-dard for metal utilization rate is 75%, which has not yet providedenough incentives to promote the implementation of CP.
Thirdly, the results indicate that a distinct policy for differentparts is more efficient in promoting CP than uniform policy. Underuniform policy, the government must increase water price, fines foroffenders and subsidy rates for adopters as much as possible inorder to better encourage CP users. These not only affect theenterprise profits seriously, but also place a heavy burden ongovernment finances. However, the CP cannot be implementedvery well. Under distinct policy, penalty and preferential tax rateare given priority to hazardous chemical replacement process. Thewater price can be raised moderately so as to reduce the adverseimpact of excessive water price on enterprise profits. It can be seenfrom the results that the distinct policy has the lowest waterconsumption and pollutant emission.
6. Conclusions
The introduction of CP in less developed countries is a subject oflarge global interest as its implementation will bring a greatreduction in metal and water consumption and pollutiondischarges. In this study, a system dynamics model for simulationof CP policy in electroplating industry was developed. The model isused to analyze the impacts of policy parameters on CP investmentdecisions of a typical electroplating enterprise in Shenzhen, China.Analyses documented that under current policy the most preferredoption for the enterprise is just process modification while theoptimal choice for the environment contains process modification,recovery technology and hazardous chemical replacement process.Water price and CP standard for utilization rate of metal need to beregulated to give greater incentive for CP implementation. CPinvestment subsidy, preferential tax rate and new penalty shouldbe set for special part of CP program. Possible strategies to promotethe adoption of CP, and reduce water consumption and metalemission are compared and discussed. Distinct policy is suggestedas the optimal policy combination. No doubt that savings of moreenergy would also have a very significant effect on the decisions toadopt or not adopt CP. However, they are not included in this work.
In general, this model shows how important it is to provide thereference for CP promotion in less developed countries. Rationalindustry water prices, more accurate standards and distincteconomic incentives for some steps are necessary to encourage CPprograms for the underdeveloped countries.
Acknowledgments
This project research is supported by special funds of theMinistry of Environmental Protection of the People’s Republic ofChina (Project No. 200809033) and China Water Pollution Controland Management of National Scientific and Technological Program(Project No. 2008ZX07211-004).

X. Dong et al. / Journal of Cleaner Production 20 (2012) 72e81 81
References
Ahmad, S., Franz, G.A., 2008. Raising taxes to reduce smoking prevalence in the US:a simulation of the anticipated health and economic impacts. Public Health 122,3e10.
Anand, S., Dahiya, R.P., Talyan, V., Vrat, P., 2005. Investigations of methane emissionsfrom rice cultivation. Environment International 31, 469e482.
Baral, A., Engelken, R.D., 2002. Chromium-based regulations and greening inmetal finishing industries in the USA. Environmental Science & Policy 5,121e133.
Caselli, F., Coleman, W.J., 2001. Cross-country technology diffusion: the case ofcomputers. American Economic Review 91, 328e335.
Chi, K.C., Nuttall, W.J., Reiner, D.M., 2009. Dynamics of the UK natural gas industry:system dynamics modelling and long-term energy policy analysis. Technolog-ical Forecasting & Social Change 76, 339e357.
Christensen, P., Georg, S., 1995. Regulatory effects in the electroplatingindustry-a case study in Denmark. Journal of Cleaner Production 3,221e224.
Comin, D., Hobijn, B., 2004. Cross-country technology adoption: making the theo-ries face the facts. Journal of Monetary Economics 51, 39e83.
Corral, C.M., 2003. Sustainable production and consumption systemsdcooperationfor change: assessing and simulating the willingness of the firm to adopt/develop cleaner technologies. The case of the in-bond industry in northernMexico. Journal of Cleaner Production 11, 411e426.
Dong, X., Li, C., Li, J., Wang, J., Liu, S., Ye, B., 2010. A novel approach for soilcontamination assessment from heavy metal pollution: a linkage betweendischarge and adsorption. Journal of Hazardous Materials 175,1022e1030.
Environmental Protection Ministry, 2010. China’s Heavy Metal Pollution Causing4035 People to Suffer Excessive Blood Lead Levels in 2009. http://news.163.com/10/0125/19/5TT9RS7R000120GU.html [accessed 03.2011].
Forrester, J.W., 2007a. System dynamics-a personal view of the first fifty years.System Dynamics Review 23, 345e358.
Forrester, J.W., 2007b. System dynamicsdthe next fifty years. System DynamicsReview 23, 359e370.
Guang, T., 2005. The characteristics of China’s electroplating industry. Metal World1, 8e9 (in Chinese).
Hilson, G., 2000a. Barriers to implementing cleaner technologies and cleanerproduction (CP) practices in the mining industry: a case study of the Americas.Minerals Engineering 13, 699e717.
Hilson, G., 2000b. Pollution prevention and cleaner production in the miningindustry: an analysis of current issues. Journal of Cleaner Production 8,119e126.
Jeong, S.J., Kim, K.S., Park, J.W., 2009. CO2 emissions change from the sales authori-zation of diesel passenger cars: Korean case study. Energy Policy 37, 2630e2638.
Jerzmanowski, M., 2007. Total factor productivity differences: appropriate tech-nology vs. efficiency. European Economic Review 51, 2080e2110.
Kim, D.H., Moon, T.H., Kim, D.W., 1999. System Dynamics, first ed. Daeyoung Press.Koefoed, M., Buckley, C., 2008. Clean technology transfer: a case study from the
South African metal finishing industry, 2000e2005. Journal of CleanerProduction 16, S78eS84.
Montalvo, C., Kemp, R., 2008. Cleaner technology diffusion: case studies, modelingand policy. Journal of Cleaner Production 16, S1eS6.
Reeve, D.J., 2007. Environmental improvements in the metal finishing industry inAustralasia. Journal of Cleaner Production 15, 756e763.
Talyan, V., Dahiya, R.P., Anand, S., Sreekrishnan, T.R., 2007. Quantification ofmethane emission from municipal solid waste disposal in Delhi. Resources,Conservation and Recycling 50, 240e259.
Tan, X., 2010. Clean technology R&D and innovation in emerging countries-experience from China. Energy Policy 38, 2916e2926.
Warren, K.A., Ortolano, L., Rozelle, S., 1999. Pollution prevention incentives andresponses in Chinese firms. Environmental Impact Assessment Review 19,521e540.