application of advance techniques for energy … of advance...application of advance techniques for...
TRANSCRIPT

Application of advance techniques for Energy Conservation in Sugar Industry
Abdul Aziz Tahir, Technical Director, Ranipur Sugar Mills, Sindh Abstract: Pakistan Sugar Industry is facingtechnical challenges to cut down the production cost for its sustainability in global Sugar Industry. There are number of factors contributing to control the cost of production. One of these is technical upgrading of the Sugar Plants for its energy efficient operation to bring down the Energy cost per ton of Sugar production. The other is the generation of 2ndand 3rd
line revenue through by products. Under lined paper has discussed the selection and application of efficient based plant machinery and equipments to achieve the success living in global Sugar Industry. Main focus of the paper is to save bagasse eitherdirect sale it to other consumer or utilize it for generation of surplus electrical energy for other purpose.
Email: [email protected]
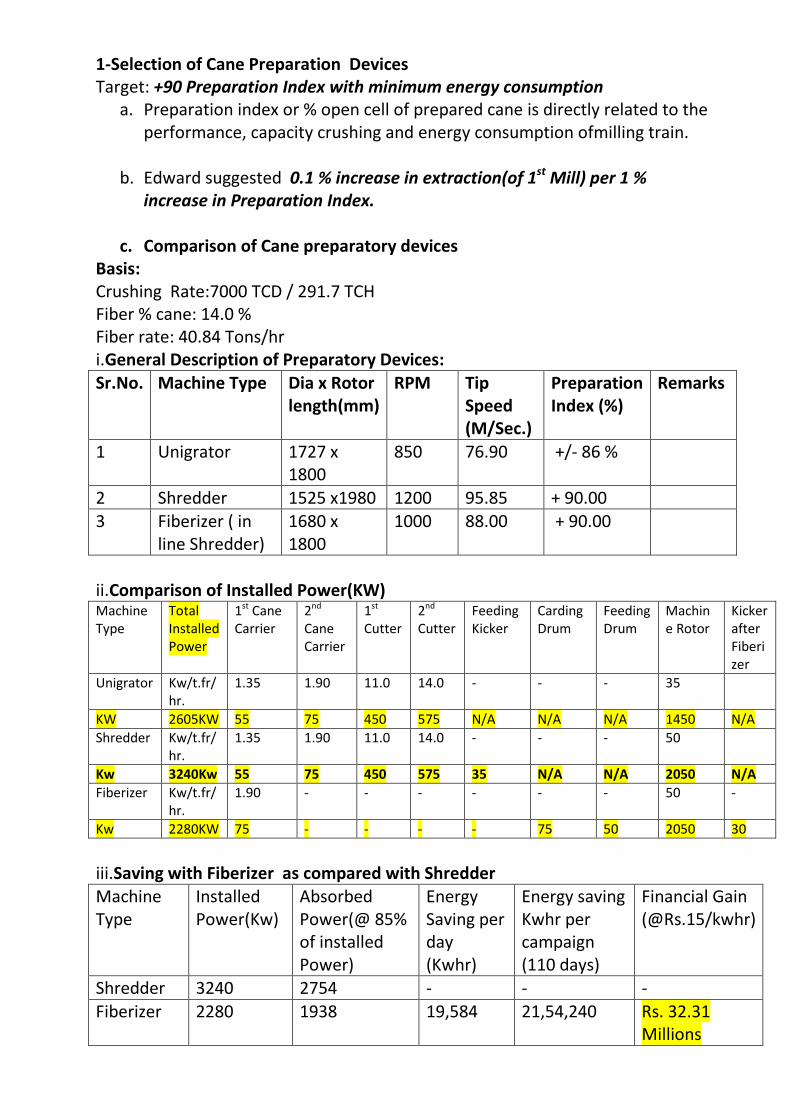
1-Selection of Cane Preparation Devices Target: +90 Preparation Index with minimum energy consumption
a. Preparation index or % open cell of prepared cane is directly related to the performance, capacity crushing and energy consumption ofmilling train.
b. Edward suggested 0.1 % increase in extraction(of 1st
Mill) per 1 % increase in Preparation Index.
c. Comparison of Cane preparatory devices Basis: Crushing Rate:7000 TCD / 291.7 TCH Fiber % cane: 14.0 % Fiber rate: 40.84 Tons/hr i.General Description of Preparatory Devices: Sr.No. Machine Type Dia x Rotor
length(mm) RPM Tip
Speed (M/Sec.)
Preparation Index (%)
Remarks
1 Unigrator 1727 x 1800
850 76.90 +/- 86 %
2 Shredder 1525 x1980 1200 95.85 + 90.00 3 Fiberizer ( in
line Shredder) 1680 x 1800
1000 88.00 + 90.00
ii.Comparison of Installed Power(KW) Machine Type
Total Installed Power
1st 2 Cane Carrier
nd 1 Cane Carrier
st 2 Cutter
nd Feeding Kicker
Cutter
Carding Drum
Feeding Drum
Machine Rotor
Kicker after Fiberizer
Unigrator Kw/t.fr/hr.
1.35 1.90 11.0 14.0 - - - 35
KW 2605KW 55 75 450 575 N/A N/A N/A 1450 N/A Shredder Kw/t.fr/
hr. 1.35 1.90 11.0 14.0 - - - 50
Kw 3240Kw 55 75 450 575 35 N/A N/A 2050 N/A Fiberizer Kw/t.fr/
hr. 1.90
- - - - - - 50 -
Kw 2280KW 75 - - - - 75 50 2050 30
iii.Saving with Fiberizer as compared with Shredder Machine Type
Installed Power(Kw)
Absorbed Power(@ 85% of installed Power)
Energy Saving per day (Kwhr)
Energy saving Kwhr per campaign (110 days)
Financial Gain (@Rs.15/kwhr)
Shredder 3240 2754 - - - Fiberizer 2280 1938 19,584 21,54,240 Rs. 32.31
Millions
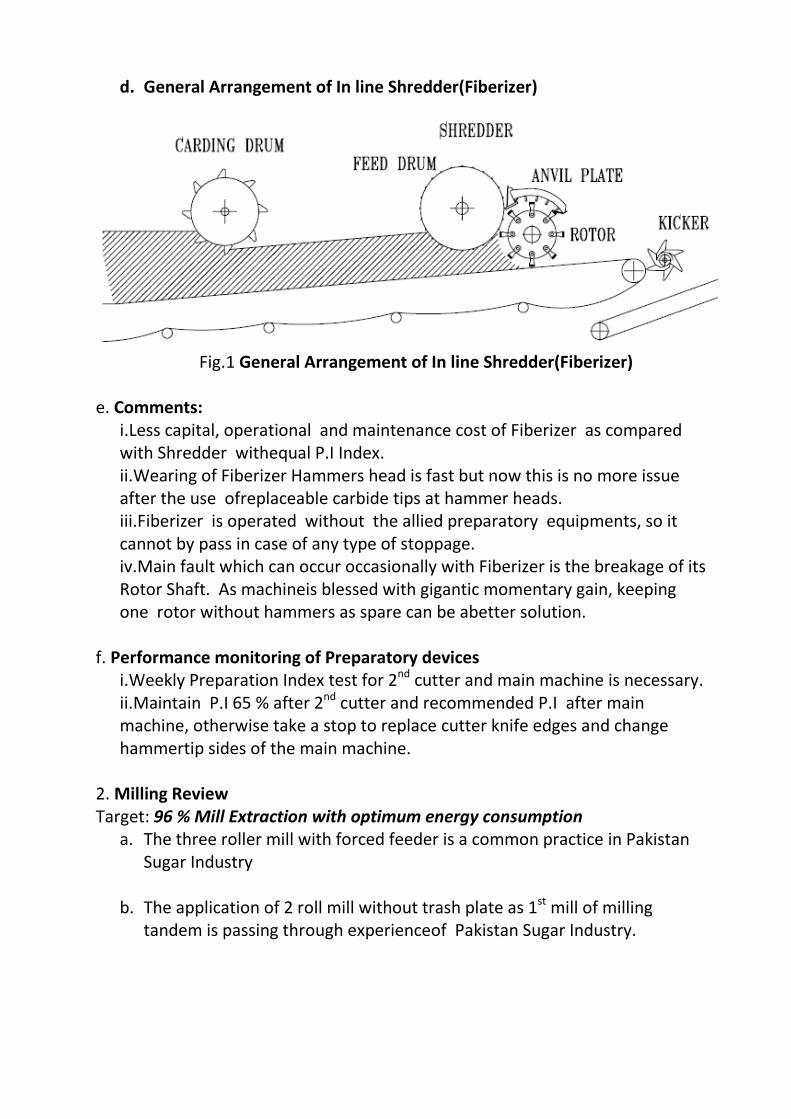
d. General Arrangement of In line Shredder(Fiberizer)
Fig.1 General Arrangement of In line Shredder(Fiberizer)
e. Comments:
i.Less capital, operational and maintenance cost of Fiberizer as compared with Shredder withequal P.I Index. ii.Wearing of Fiberizer Hammers head is fast but now this is no more issue after the use ofreplaceable carbide tips at hammer heads. iii.Fiberizer is operated without the allied preparatory equipments, so it cannot by pass in case of any type of stoppage. iv.Main fault which can occur occasionally with Fiberizer is the breakage of its Rotor Shaft. As machineis blessed with gigantic momentary gain, keeping one rotor without hammers as spare can be abetter solution.
f. Performance monitoring of Preparatory devices i.Weekly Preparation Index test for 2nd
ii.Maintain P.I 65 % after 2 cutter and main machine is necessary.
nd
machine, otherwise take a stop to replace cutter knife edges and change hammertip sides of the main machine.
cutter and recommended P.I after main
2. Milling Review Target: 96 % Mill Extraction with optimum energy consumption
a. The three roller mill with forced feeder is a common practice in Pakistan Sugar Industry
b. The application of 2 roll mill without trash plate as 1st
mill of milling tandem is passing through experienceof Pakistan Sugar Industry.
c. Shaft Power distribution at conventional three roller mills
Sr.# Description % Power Consumption
Remarks
1 Compression of Bagasse
64.0 Can be reduced with better P.I and making top and feed roller as lotus
2 Metal Bearing Loss
15.0 Can be minimized with application of anti-friction roller Bearings.
3 Trash Plate 14.0 Can be reduced with better mill setting, polishing surface of trash plate and eliminated 100% by replacing 3 roller mills with 2 roller mills.
4 Scrapper 2.0 Standard loss with all mills 5 Pinion Loss 5.0 Standard loss with all mills (Ref: http://old.shankaranaath.com)
d. Performance evaluation of 2 Roller mills as 1st
Target: + 70.0 % Mill Extraction and 55% Moisture content in bagasse Mill
HMC Pakistan claims:
i.30 % less power consumption with 2 roller mills with equal mill performance of three roller mills. ii.70 % Mill extraction and 60% Moisture content in bagasse is reported as feedback from client.
e. Comparison of 2 roller mills of different makes: Sr.# Description HMC, Pakistan ULKA, India 1 Mill Type 2 roll with Single
Feeder Compact Muti – Roller Mills(CMR)
2 Hydraulic load on Top Roller Top Roller 3 Mill Drive with Fixed Bottom Roller Fixed Bottom
Roller 4 Top Roller Lotus Type Lotus Type 5 Feeders Single Double 6 Mill Extraction( %)(Client
Feedback) 68 to 77 75 to 78
7 Moisture % Bagasse(Client Feedback)
60 to 62 52 to 54
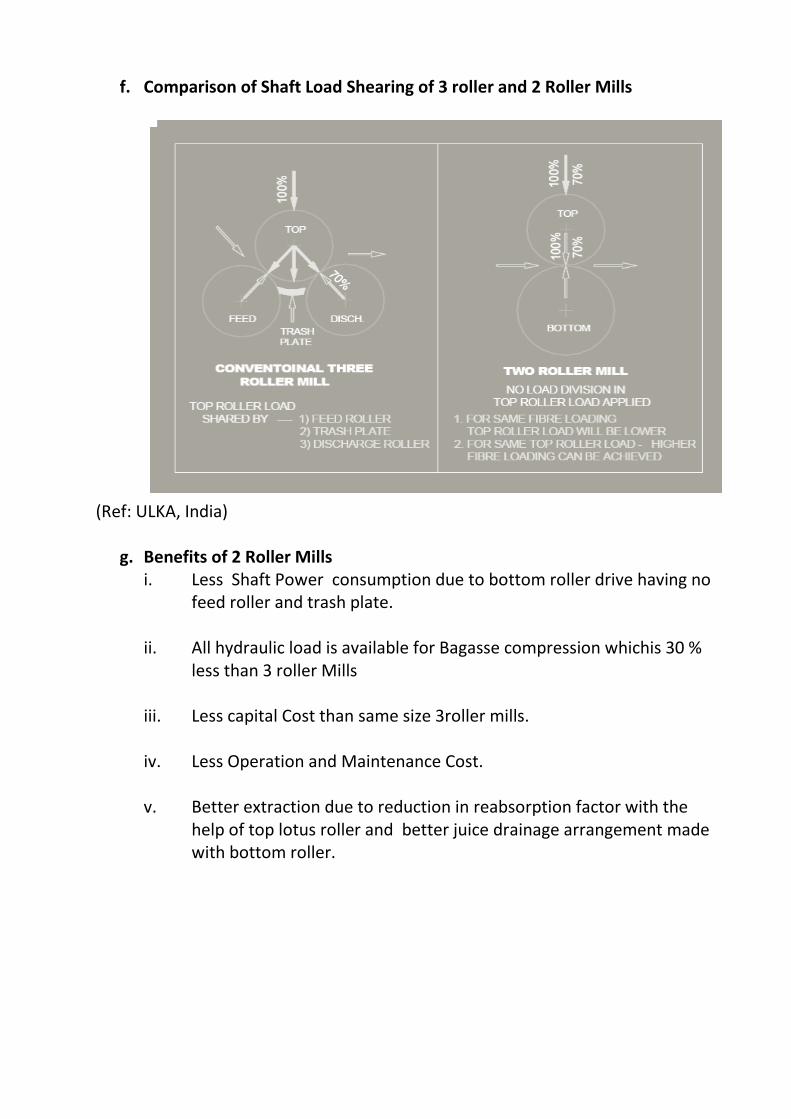
f. Comparison of Shaft Load Shearing of 3 roller and 2 Roller Mills
(Ref: ULKA, India)
g. Benefits of 2 Roller Mills i. Less Shaft Power consumption due to bottom roller drive having no
feed roller and trash plate.
ii. All hydraulic load is available for Bagasse compression whichis 30 % less than 3 roller Mills
iii. Less capital Cost than same size 3roller mills. iv. Less Operation and Maintenance Cost.
v. Better extraction due to reduction in reabsorption factor with the
help of top lotus roller and better juice drainage arrangement made with bottom roller.
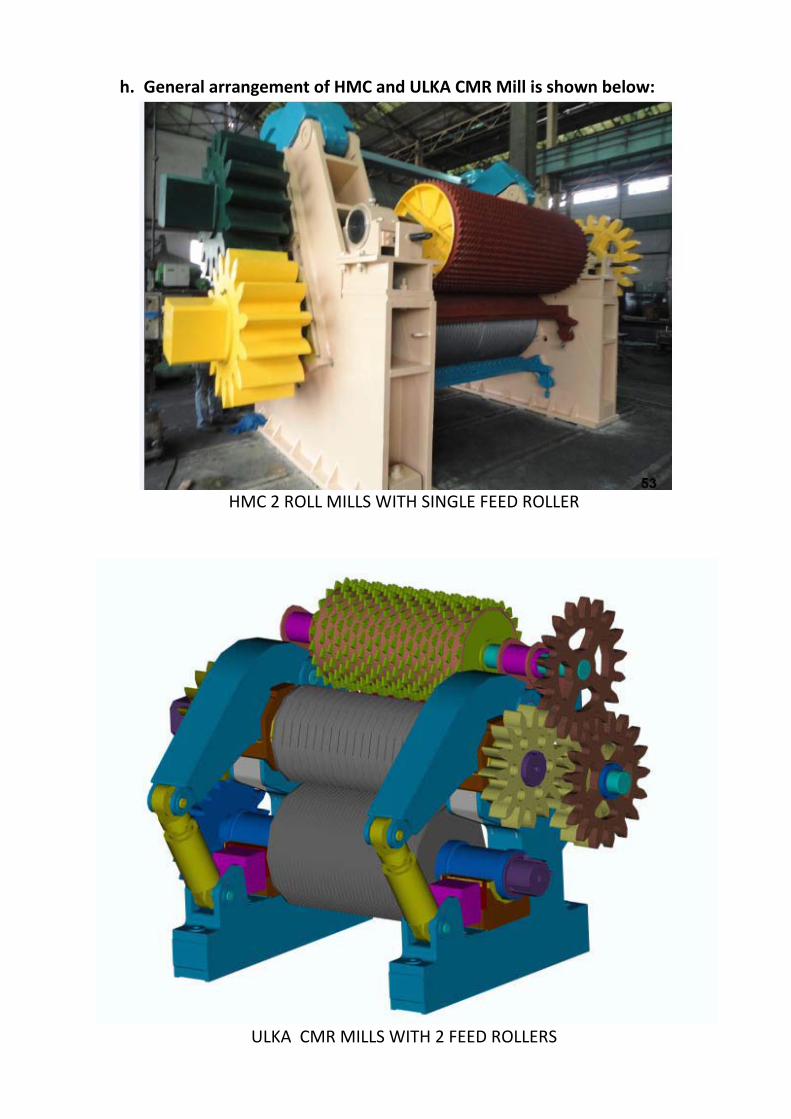
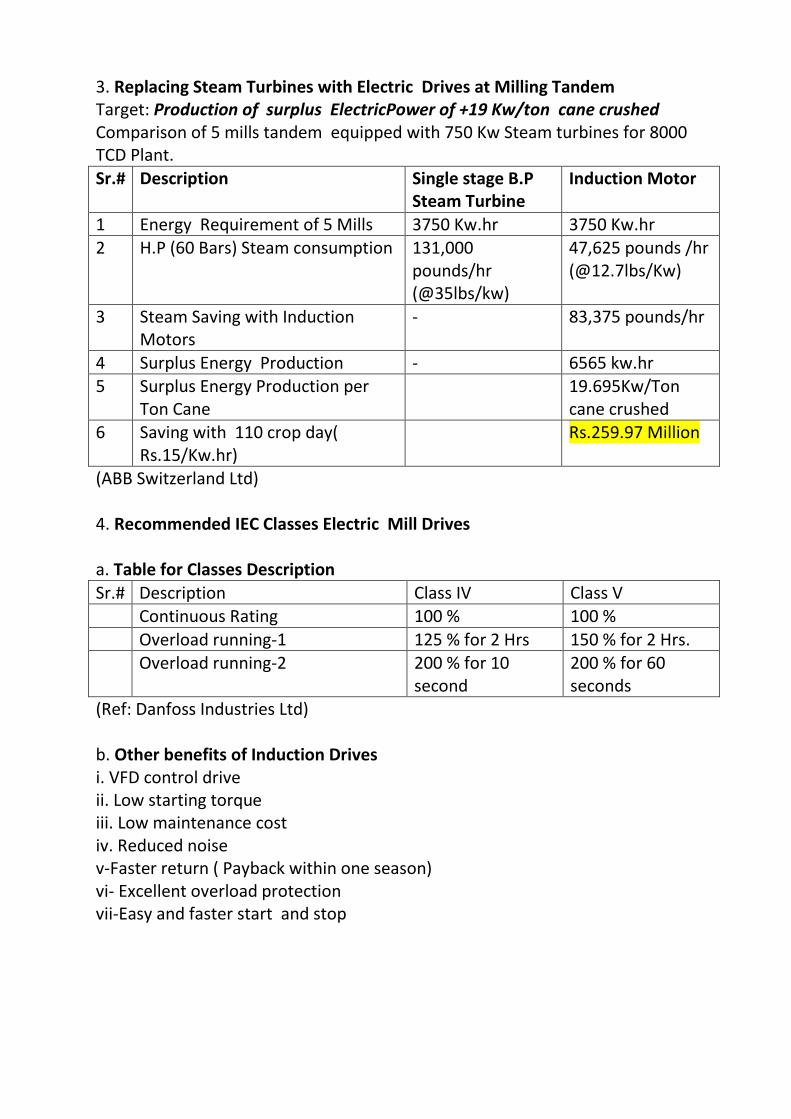
h. General arrangement of HMC and ULKA CMR Mill is shown below:
HMC 2 ROLL MILLS WITH SINGLE FEED ROLLER
ULKA CMR MILLS WITH 2 FEED ROLLERS
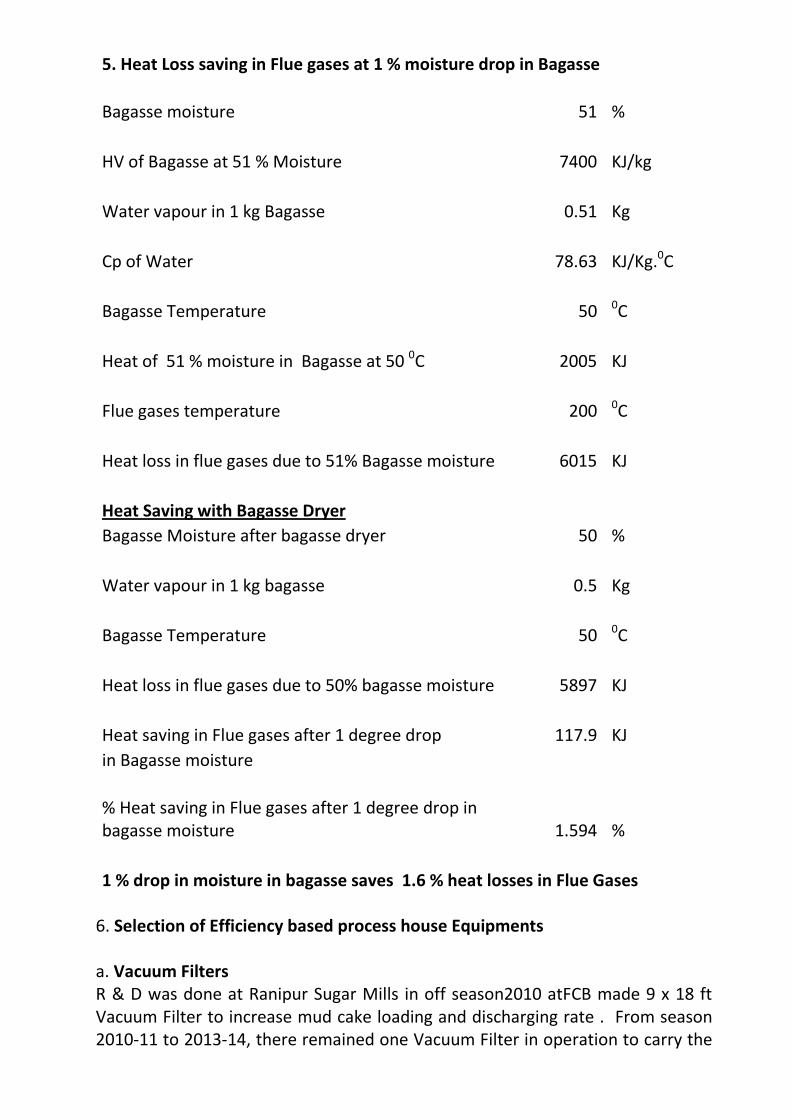
3. Replacing Steam Turbines with Electric Drives at Milling Tandem Target: Production of surplus ElectricPower of +19 Kw/ton cane crushed Comparison of 5 mills tandem equipped with 750 Kw Steam turbines for 8000 TCD Plant. Sr.# Description Single stage B.P
Steam Turbine Induction Motor
1 Energy Requirement of 5 Mills 3750 Kw.hr 3750 Kw.hr 2 H.P (60 Bars) Steam consumption 131,000
pounds/hr (@35lbs/kw)
47,625 pounds /hr (@12.7lbs/Kw)
3 Steam Saving with Induction Motors
- 83,375 pounds/hr
4 Surplus Energy Production - 6565 kw.hr 5 Surplus Energy Production per
Ton Cane 19.695Kw/Ton
cane crushed 6 Saving with 110 crop day(
Rs.15/Kw.hr) Rs.259.97 Million
(ABB Switzerland Ltd) 4. Recommended IEC Classes Electric Mill Drives a. Table for Classes Description Sr.# Description Class IV Class V Continuous Rating 100 % 100 % Overload running-1 125 % for 2 Hrs 150 % for 2 Hrs. Overload running-2 200 % for 10
second 200 % for 60 seconds
(Ref: Danfoss Industries Ltd) b. Other benefits of Induction Drives i. VFD control drive ii. Low starting torque iii. Low maintenance cost iv. Reduced noise v-Faster return ( Payback within one season) vi- Excellent overload protection vii-Easy and faster start and stop
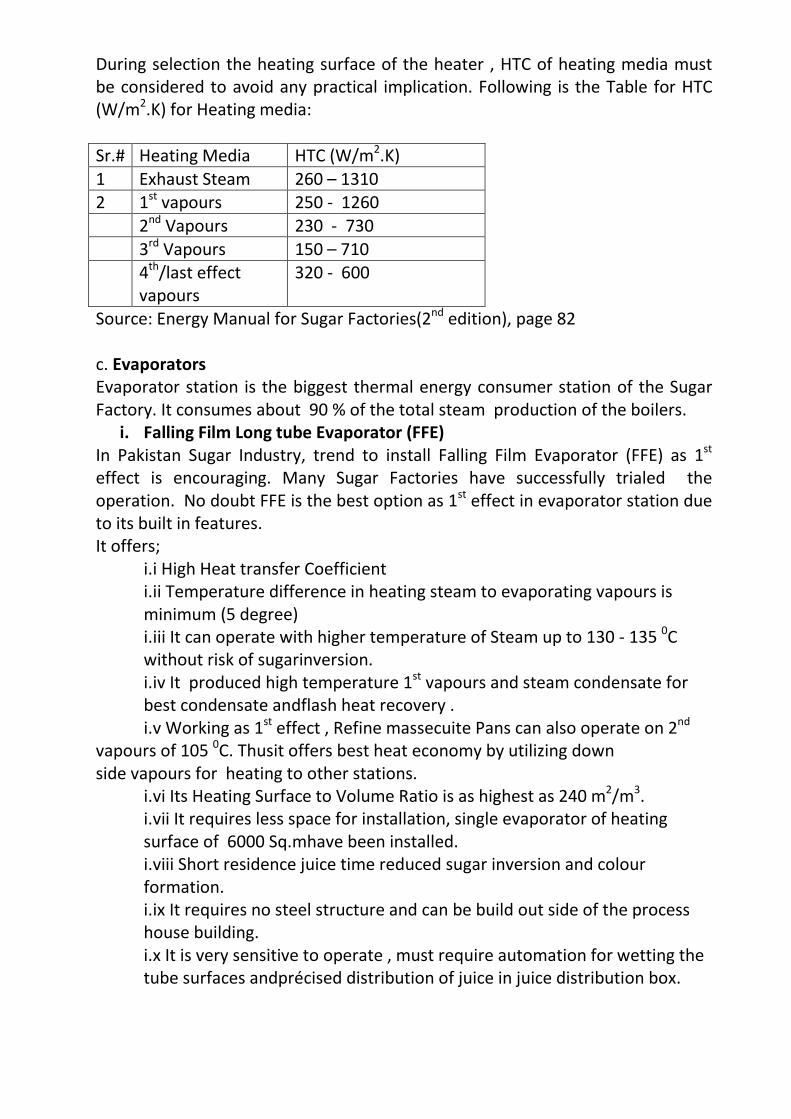
5. Heat Loss saving in Flue gases at 1 % moisture drop in Bagasse Bagasse moisture
51 %
HV of Bagasse at 51 % Moisture
7400 KJ/kg
Water vapour in 1 kg Bagasse
0.51 Kg
Cp of Water
78.63 KJ/Kg.0
C
Bagasse Temperature
50 0
C
Heat of 51 % moisture in Bagasse at 50 0 2005 C KJ
Flue gases temperature
200 0
C
Heat loss in flue gases due to 51% Bagasse moisture 6015 KJ
Heat Saving with Bagasse Dryer Bagasse Moisture after bagasse dryer 50 %
Water vapour in 1 kg bagasse
0.5 Kg
Bagasse Temperature
50 0
C
Heat loss in flue gases due to 50% bagasse moisture 5897 KJ
Heat saving in Flue gases after 1 degree drop 117.9 KJ in Bagasse moisture
% Heat saving in Flue gases after 1 degree drop in bagasse moisture 1.594 %
1 % drop in moisture in bagasse saves 1.6 % heat losses in Flue Gases 6. Selection of Efficiency based process house Equipments a. Vacuum Filters R & D was done at Ranipur Sugar Mills in off season2010 atFCB made 9 x 18 ft Vacuum Filter to increase mud cake loading and discharging rate . From season 2010-11 to 2013-14, there remained one Vacuum Filter in operation to carry the

mud load of average 5.25 tons per hr with optimum Mud Pol of 1.9 % and moisture content of 77.5 %. Before modification Ranipur operated 2 units of same size with 2 Vacuum pumps for same mud loading . Modified Vacuum Filter was operated with single Vacuum pump. There was saving of 75 Kw motor installed at 2nd
Saving with 110 Crop day season Vacuum Pump.
Electric Energy: 75 x 24x110 = 198000 Kwhrs Financial Gain : 198000 x 15 = Rs. 2.97 Million per annum Same designed Vacuum Filter is now available in local market of Pakistan b. Juice and Melt Heating Target: Heating the process liquid with Heater of highest HTC with the application of condensate or downstream vapours.
i. Selection of Heater Type Sr.# Process
Liquid Shell and Tube Heater
Wide gape Plate Type Heater with reverse flow
Direct Contact Heater
1 Primary juice
B A N
Defecated Juice
A B N
Clear Juice B A N Melt
Heating C B A
Condensate B A N A: 1ST Choice B: 2nd
C: 3 Choice
rd
N: Not recommended Choice
ii. Heat Transfer Coefficient (HTC) and Pressure drop HTC is proportional to Fluid velocity (V) and pressure drop is proportional to Square of Fluid velocity (V2
In all cases of Fluid flow,HTC of Plate type Heater is 1.5 to 3 times higher than tubular Heater.(Cane Sugar Engineering, page210)
), So Selection of Velocity is very critical to maintain fast flow through heater tubes or plates, normal recommended velocity range for condensate and juices is 1.5 to 2 m/sec. and for Syrup and Melt 1 to 1.5 m/sec.
During selection the heating surface of the heater , HTC of heating media must be considered to avoid any practical implication. Following is the Table for HTC (W/m2
.K) for Heating media:
Sr.# Heating Media HTC (W/m2.K) 1 Exhaust Steam 260 – 1310 2 1st 250 - 1260 vapours 2nd 230 - 730 Vapours 3rd 150 – 710 Vapours 4th 320 - 600 /last effect
vapours Source: Energy Manual for Sugar Factories(2nd
edition), page 82
c. Evaporators Evaporator station is the biggest thermal energy consumer station of the Sugar Factory. It consumes about 90 % of the total steam production of the boilers.
i. Falling Film Long tube Evaporator (FFE) In Pakistan Sugar Industry, trend to install Falling Film Evaporator (FFE) as 1st effect is encouraging. Many Sugar Factories have successfully trialed the operation. No doubt FFE is the best option as 1st
It offers;
effect in evaporator station due to its built in features.
i.i High Heat transfer Coefficient i.ii Temperature difference in heating steam to evaporating vapours is minimum (5 degree) i.iii It can operate with higher temperature of Steam up to 130 - 135 0
without risk of sugarinversion. C
i.iv It produced high temperature 1st
best condensate andflash heat recovery . vapours and steam condensate for
i.v Working as 1st effect , Refine massecuite Pans can also operate on 2vapours of 105
nd 0
side vapours for heating to other stations. C. Thusit offers best heat economy by utilizing down
i.vi Its Heating Surface to Volume Ratio is as highest as 240 m2/m3
i.vii It requires less space for installation, single evaporator of heating .
surface of 6000 Sq.mhave been installed. i.viii Short residence juice time reduced sugar inversion and colour formation. i.ix It requires no steel structure and can be build out side of the process house building. i.x It is very sensitive to operate , must require automation for wetting the tube surfaces andprécised distribution of juice in juice distribution box.
Hugot(1986) quotes “the use of FFE as 1st
effect of the evaporating station, equipped with vapour recompression together with the use of hot condensate for juice heating may reduce the steam requirement to 35 % on Cane”.
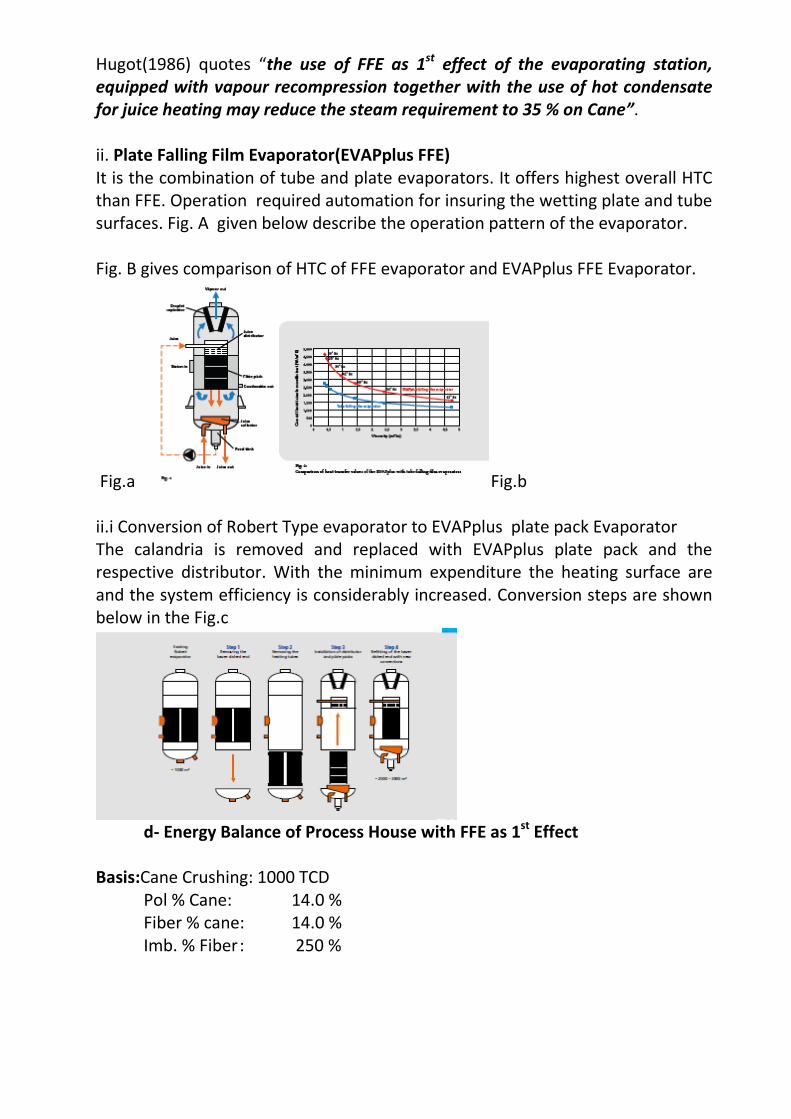
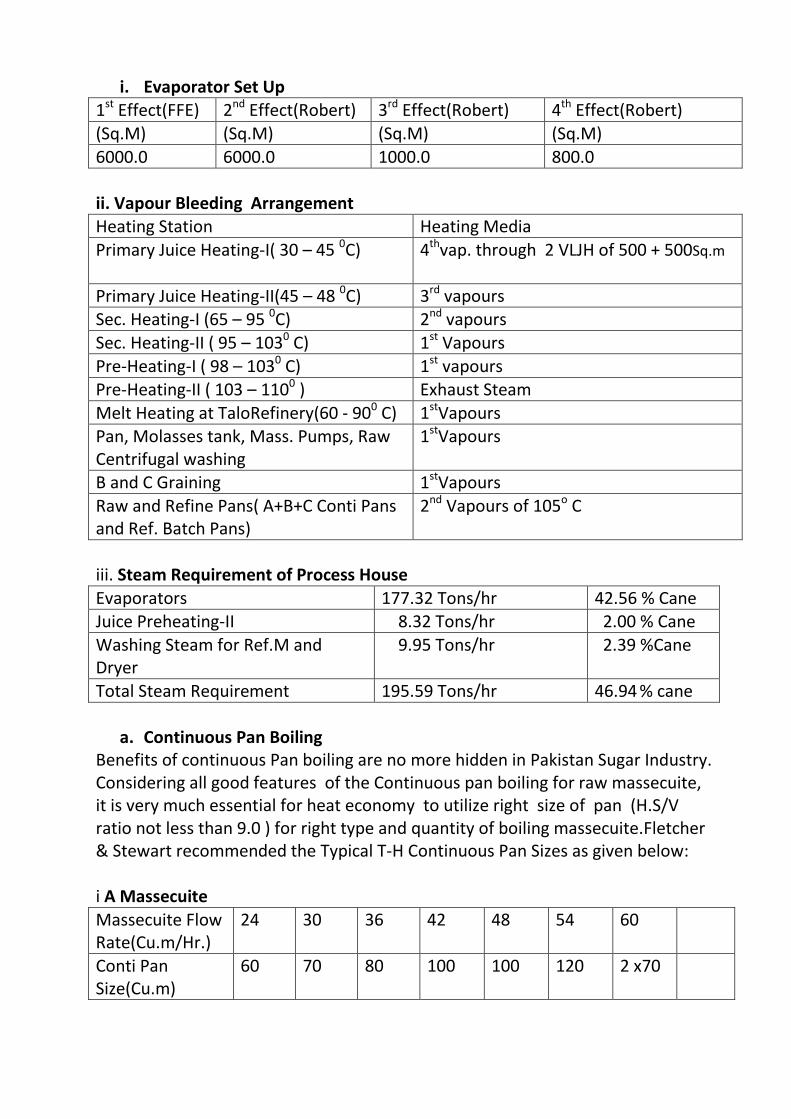
ii. Plate Falling Film Evaporator(EVAPplus FFE) It is the combination of tube and plate evaporators. It offers highest overall HTC than FFE. Operation required automation for insuring the wetting plate and tube surfaces. Fig. A given below describe the operation pattern of the evaporator. Fig. B gives comparison of HTC of FFE evaporator and EVAPplus FFE Evaporator.
Fig.a Fig.b ii.i Conversion of Robert Type evaporator to EVAPplus plate pack Evaporator The calandria is removed and replaced with EVAPplus plate pack and the respective distributor. With the minimum expenditure the heating surface are and the system efficiency is considerably increased. Conversion steps are shown below in the Fig.c
d- Energy Balance of Process House with FFE as 1st
Effect
Basis:Cane Crushing: 1000 TCD Pol % Cane: 14.0 % Fiber % cane: 14.0 % Imb. % Fiber : 250 %
i. Evaporator Set Up
1st 2 Effect(FFE) nd 3 Effect(Robert) rd 4 Effect(Robert) th Effect(Robert) (Sq.M) (Sq.M) (Sq.M) (Sq.M) 6000.0 6000.0 1000.0 800.0 ii. Vapour Bleeding Arrangement Heating Station Heating Media Primary Juice Heating-I( 30 – 45 0 4C) th
vap. through 2 VLJH of 500 + 500Sq.m
Primary Juice Heating-II(45 – 48 0 3C) rd vapours Sec. Heating-I (65 – 95 0 2C) nd vapours Sec. Heating-II ( 95 – 1030 1 C) st Vapours Pre-Heating-I ( 98 – 1030 1 C) st vapours Pre-Heating-II ( 103 – 1100 Exhaust Steam ) Melt Heating at TaloRefinery(60 - 900 1 C) stVapours Pan, Molasses tank, Mass. Pumps, Raw Centrifugal washing
1stVapours
B and C Graining 1stVapours Raw and Refine Pans( A+B+C Conti Pans and Ref. Batch Pans)
2nd Vapours of 105o C
iii. Steam Requirement of Process House Evaporators 177.32 Tons/hr 42.56 % Cane Juice Preheating-II 8.32 Tons/hr 2.00 % Cane Washing Steam for Ref.M and Dryer
9.95 Tons/hr 2.39 %Cane
Total Steam Requirement 195.59 Tons/hr 46.94 % cane
a. Continuous Pan Boiling Benefits of continuous Pan boiling are no more hidden in Pakistan Sugar Industry. Considering all good features of the Continuous pan boiling for raw massecuite, it is very much essential for heat economy to utilize right size of pan (H.S/V ratio not less than 9.0 ) for right type and quantity of boiling massecuite.Fletcher & Stewart recommended the Typical T-H Continuous Pan Sizes as given below: i A Massecuite Massecuite Flow Rate(Cu.m/Hr.)
24 30 36 42 48 54 60
Conti Pan Size(Cu.m)
60 70 80 100 100 120 2 x70
ii B Massecuite Massecuite Flow Rate(Cu.m/Hr.)
14 17.5 21 24.5 28 31.5 35
Conti Pan Size(Cu.m)
60 70 90 100 120 2x60 2 x70
iii C Massecuite Massecuite Flow Rate(Cu.m/Hr.)
8 10 12 14 16 18 20
Conti Pan Size(Cu.m)
50 60 70 80 100 100 120
d. Single Entry Vapour Condensers
Target: Reduction in tons of water required to condense ton of vapours Inefficient Multi jet condensers are being replaced with efficient vapor condenser of many makes and types. One type is Mist type S.S single entry condenser. Block Diagram is shown below: i Comparison of MREPL(Indian) make Mist Type Single entry condenser and Multi jet Condenser Sr. No.
Description Multi jet Condenser
Mist Type Single Entry Condenser
1 Vapour s to condensed 45 Tons per hr 45 Tons per hr 2 Condenser approach 15 0 8 C 0C 3 Condenser efficiency 40 to 50 % 80 % 4 Water to Vapour Ratio 65 to 70 40 to 45 5 Injection water flow (M3/Hr.) 3150 1800-2000 6 Power consumed at injection Station 195 Kw/Hr 115 Kwhr. 7 Power saved at Injection station - 80 Kwhr. 8 Power Saving at Spray station - 80 Kwhr. 9 Total Power Saving in system - 160 Kwhr.
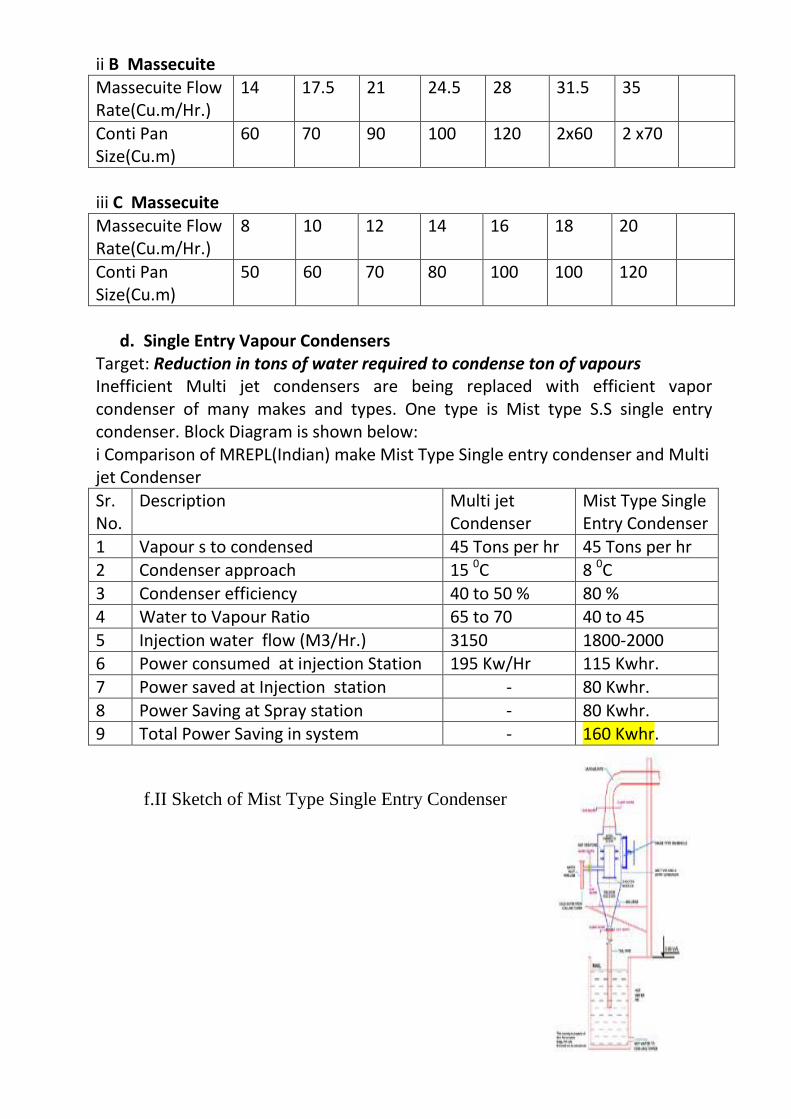
f.II Sketch of Mist Type Single Entry Condenser
g. Selection of Raw Centrifugal Machines
Target: Operating Machines at full rated capacity with good quality output Sugar
i- Selection Criteria Massecuite Type Mass. Feeding
Temperature(0Basket Angle/RPM
C ) Specific Power load (Kw/ton Mass cured)
A 60 30/(1400 – 1600) 3.0 B 55 34/(1600 – 1800) 4.5 C 52-54 34/ (1800 -2000) 4.6 This is experienced that at crushing rate of 4000 TCD, one machine of Type SK-1250 is enough on “B” , “C”and safely two on “A” massecuite pre-curing. h- Selection of Batch Refined Centrifuges Selection factors of Batch centrifugal.
a- Less power consumption b- High throughput c- Less operation and maintenance cost d- User to friendly. Application of Regenerative drives with sequential machine group operation with PLC control and DC-bus to transfer electrical power from machine running in regenerative (deceleration) mode to machine revamping up to monitoring(acceleration) mode or back to main supply station made this station very cost effective. This system development offers 20-25 % energy saving and 25-30 sec reduction in cycle time.Companies also made development to reduce the cycle time through faster discharging dry sugar from the machines. Development of different international companies is presented below:
i-Electrical Drives for Batch Centrifugal Machines
I.i-Non-regenerative Drives Fitted with a non-regenerative drives, centrifugal would have a very high energy consumption and, in addition, during braking would produce a lot of energy in the form of dissipated heat.
i.ii-Regenerative Drives These drives allowed the energy produced during braking fed back to the supply system, which means that the net energy consumption of the centrifugals is reduced by 80% or more. The problem of heat dissipation is also eliminated. i.iii- Broadbent Vacon AFE (Active Front End) Drives These are regenerative drives of special types that incorporate controllable solid-state switches in their input section. With conventional regenerative drives, loss of supply while the centrifugal is braking frequently leads to failure of the main fuses in the drive system, not only is this a major inconvenience, the fuses are also special semiconductor protection types that are expensive to replace. With the Vacon AFE drives, this problem does not occur (Broadbent spin energy saving with Vacon drives) i.iv- DanfossVLT Load Sharing System with the use of single speed AC motor Danfoss introduced low cost solution of VLT load sharing system against AFE drives. Donfoss required at least two machines to be operated in group for energy sharing to each other through bus bar with controlled mechanism, where two centrifugals operate alternately using the load sharing application of the drive. The energy released from motor running in regenerative(decelerating) mode is delivered to other drive which is running in motoring(accelerating) mode through common DC -bus. The 1st
motor will run at the pre-set time and after the process time is consumed, the second motor will then restart with the energy released of the 1st motor during decelerating.
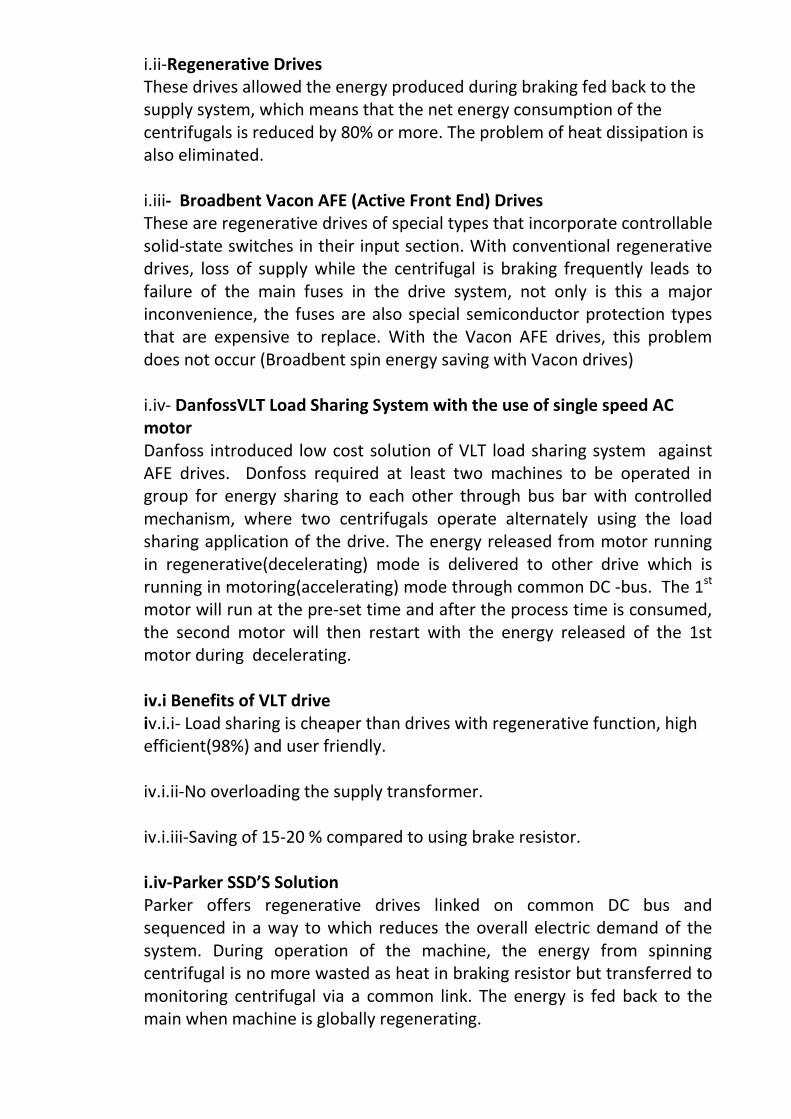
iv.i Benefits of VLT drive iv.i.i- Load sharing is cheaper than drives with regenerative function, high efficient(98%) and user friendly. iv.i.ii-No overloading the supply transformer. iv.i.iii-Saving of 15-20 % compared to using brake resistor. i.iv-Parker SSD’S Solution Parker offers regenerative drives linked on common DC bus and sequenced in a way to which reduces the overall electric demand of the system. During operation of the machine, the energy from spinning centrifugal is no more wasted as heat in braking resistor but transferred to monitoring centrifugal via a common link. The energy is fed back to the main when machine is globally regenerating.
The solution installed at SCISM(a Philippines Sugar Company). Where refined station included six Batch centrifugal machines of 1000 kg per charge and installed power of 180 Kw. Improvement resulted in reduction of cycle time from 180 sec to 150 sec to produce 4000 kg extra sugar per hr and about saving of 25 % of the overall power consumption from the main.
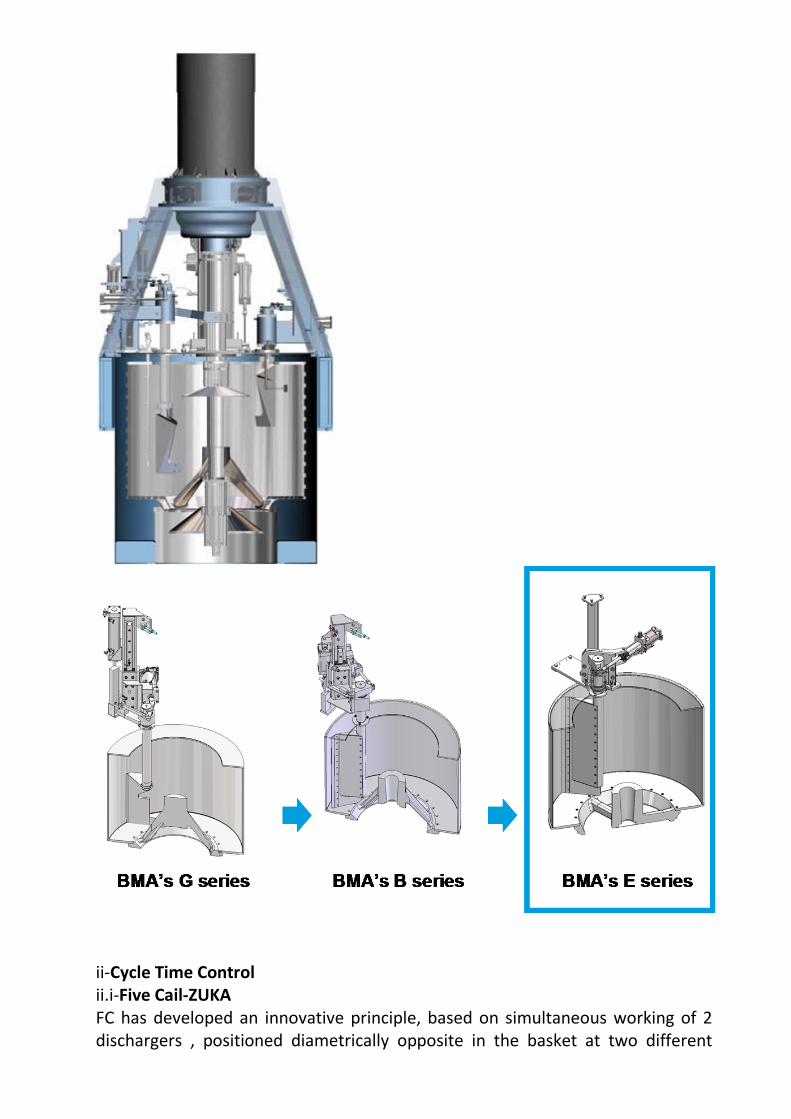
ii-Cycle Time Control ii.i-Five Cail-ZUKA FC has developed an innovative principle, based on simultaneous working of 2 dischargers , positioned diametrically opposite in the basket at two different
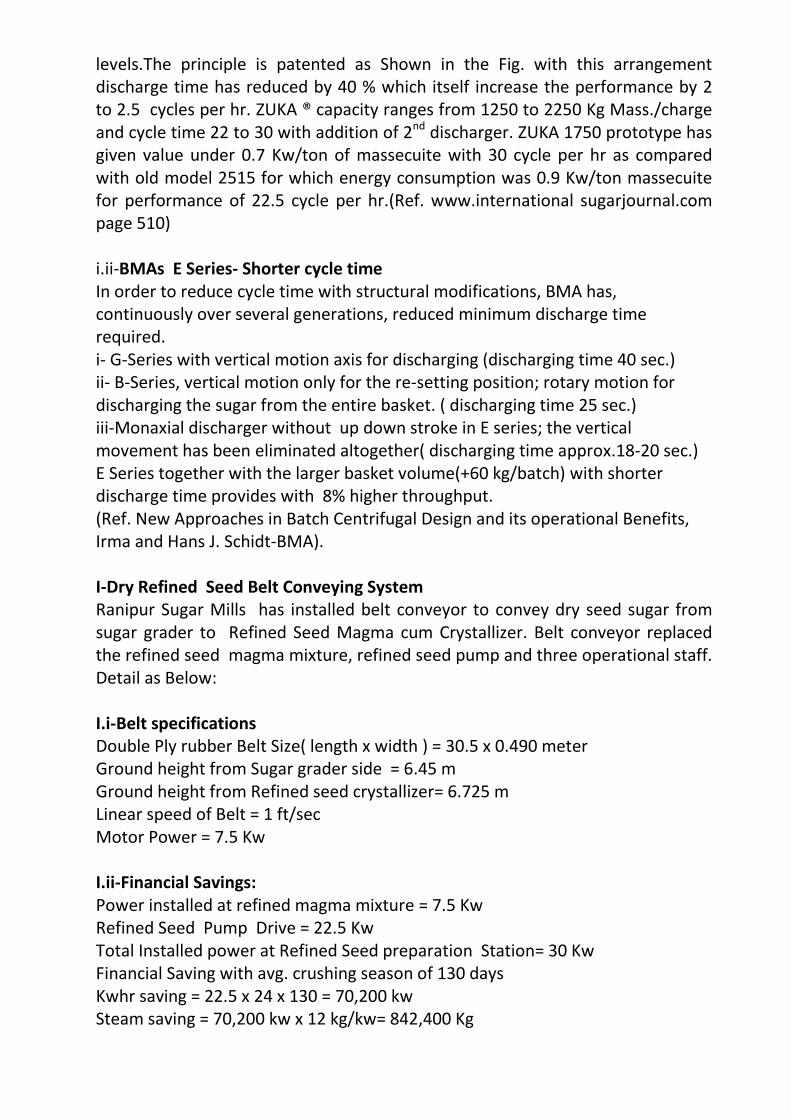
levels.The principle is patented as Shown in the Fig. with this arrangement discharge time has reduced by 40 % which itself increase the performance by 2 to 2.5 cycles per hr. ZUKA ® capacity ranges from 1250 to 2250 Kg Mass./charge and cycle time 22 to 30 with addition of 2nd
discharger. ZUKA 1750 prototype has given value under 0.7 Kw/ton of massecuite with 30 cycle per hr as compared with old model 2515 for which energy consumption was 0.9 Kw/ton massecuite for performance of 22.5 cycle per hr.(Ref. www.international sugarjournal.com page 510)
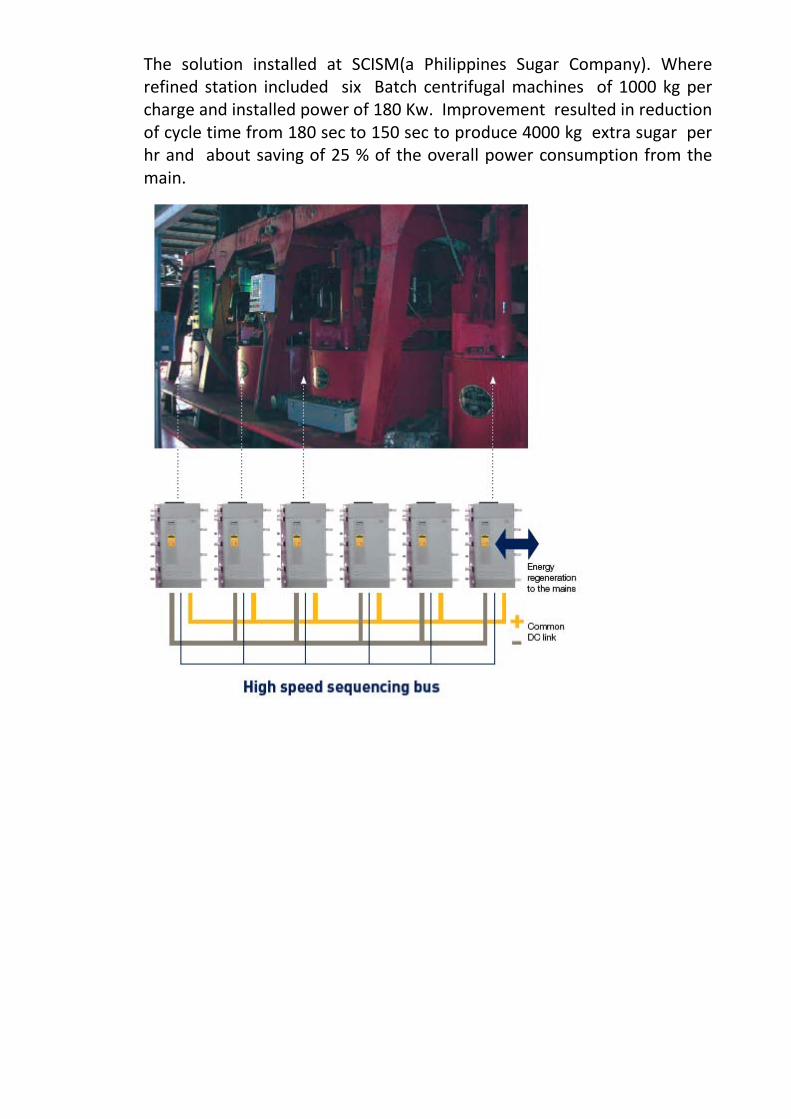
i.ii-BMAs E Series- Shorter cycle time In order to reduce cycle time with structural modifications, BMA has, continuously over several generations, reduced minimum discharge time required. i- G-Series with vertical motion axis for discharging (discharging time 40 sec.) ii- B-Series, vertical motion only for the re-setting position; rotary motion for discharging the sugar from the entire basket. ( discharging time 25 sec.) iii-Monaxial discharger without up down stroke in E series; the vertical movement has been eliminated altogether( discharging time approx.18-20 sec.) E Series together with the larger basket volume(+60 kg/batch) with shorter discharge time provides with 8% higher throughput. (Ref. New Approaches in Batch Centrifugal Design and its operational Benefits, Irma and Hans J. Schidt-BMA). I-Dry Refined Seed Belt Conveying System Ranipur Sugar Mills has installed belt conveyor to convey dry seed sugar from sugar grader to Refined Seed Magma cum Crystallizer. Belt conveyor replaced the refined seed magma mixture, refined seed pump and three operational staff. Detail as Below: I.i-Belt specifications Double Ply rubber Belt Size( length x width ) = 30.5 x 0.490 meter Ground height from Sugar grader side = 6.45 m Ground height from Refined seed crystallizer= 6.725 m Linear speed of Belt = 1 ft/sec Motor Power = 7.5 Kw I.ii-Financial Savings: Power installed at refined magma mixture = 7.5 Kw Refined Seed Pump Drive = 22.5 Kw Total Installed power at Refined Seed preparation Station= 30 Kw Financial Saving with avg. crushing season of 130 days Kwhr saving = 22.5 x 24 x 130 = 70,200 kw Steam saving = 70,200 kw x 12 kg/kw= 842,400 Kg
Bagasse saving = 842,400/ 2, (1 kg bag. Produces 2 kg steam) = 4,221,200 Kg. Financial Savings= 421200 x 2.2 Rs./kg bagasse = Rs.926,640 Financial Staff Saving= 3 x 12000 x 130/30 =Rs. 156,000 Total Financial Saving per season = 926,640 + 156,000 =Rs.1,082,640 7. Bagasse fired Boilers The thermal efficiency of the power plant rises with an increase in boiler pressure. This efficiency increase occurs up to maximum value around 160 bars. Beyond this pressure latent heat decreases drastically, resulting in less heat being transferred to the maximum cycle temperature . This aspect can be easily noted from temperature entropy diagram. In Pakistan Sugar Industry trend setting of High pressure Boilers Ranging from 60 to 100 Bar is encouraging. High Pressure boiler offers many advantages over low pressure boiler as listed below:
a. It produces more Kcal per ton of output steam for converting it to electrical energy through H.P Turbines .
b. Generally 1 kg of Bagasse produces 2.0 kg Steam of pressure 65 Bar and temperature of 450 o
C, and
i- Condensing turbine consumes 3.9 Kg steam to generate 1 kw power through alternator.
ii. Consumption of high pressure steam for Extraction turbine is different with different extraction steam temperature, pressure and flow.
c. Fuel consumption per Kcal of steam production is low due to high degree of control and breakage of thermal bounding of water molecules at high pressure and temperature.
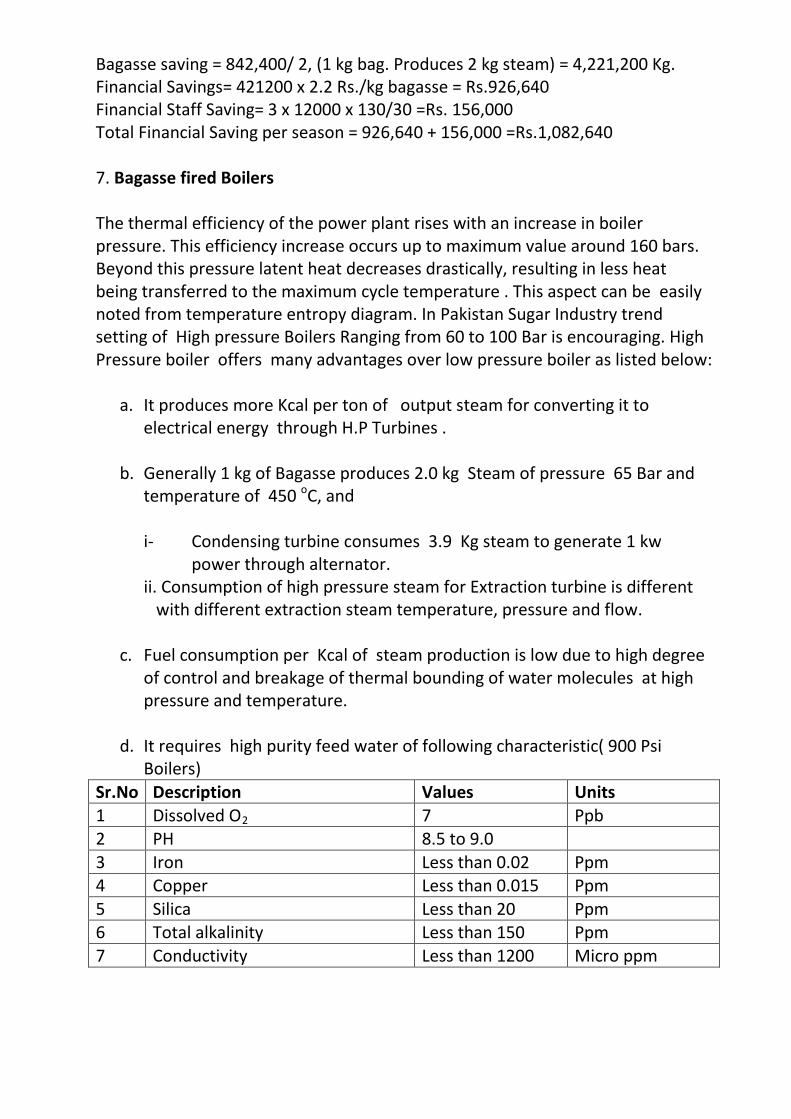
d. It requires high purity feed water of following characteristic( 900 Psi Boilers)
Sr.No Description Values Units 1 Dissolved O 7 2 Ppb 2 PH 8.5 to 9.0 3 Iron Less than 0.02 Ppm 4 Copper Less than 0.015 Ppm 5 Silica Less than 20 Ppm 6 Total alkalinity Less than 150 Ppm 7 Conductivity Less than 1200 Micro ppm
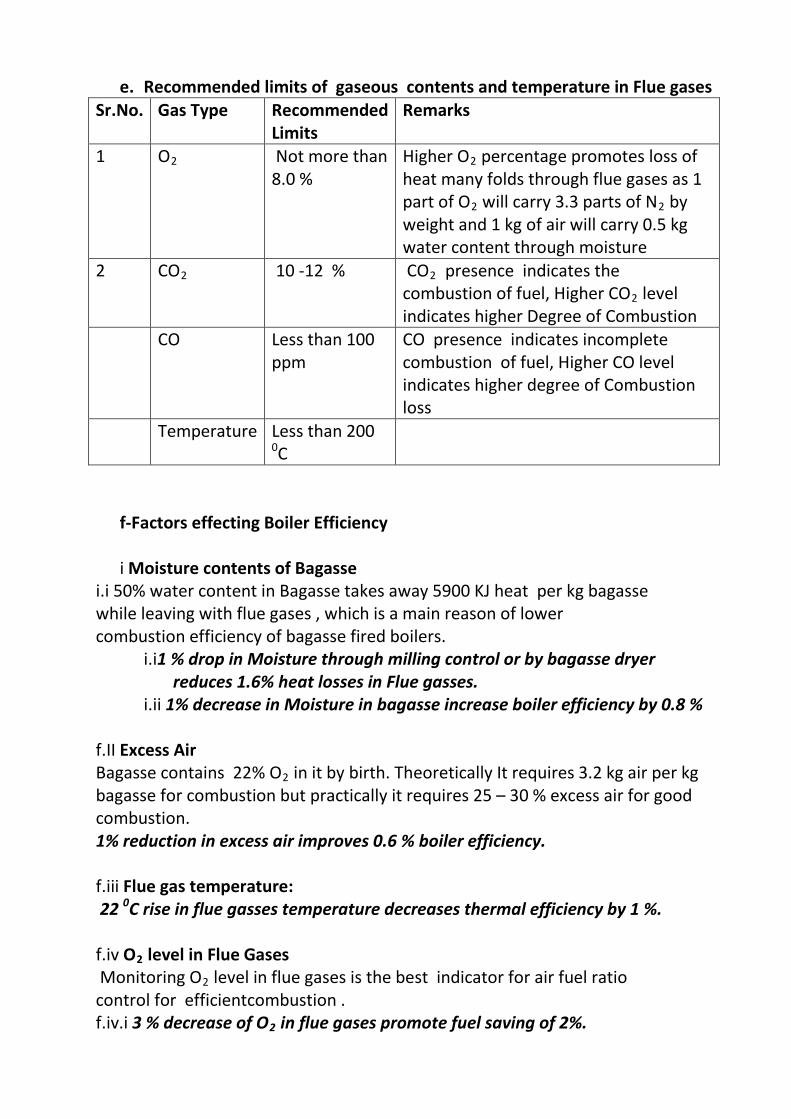
e. Recommended limits of gaseous contents and temperature in Flue gases
Sr.No. Gas Type Recommended Limits
Remarks
1 O Not more than 8.0 %
2 Higher O2 percentage promotes loss of heat many folds through flue gases as 1 part of O2 will carry 3.3 parts of N2 by weight and 1 kg of air will carry 0.5 kg water content through moisture
2 CO 10 -12 % 2 CO2 presence indicates the combustion of fuel, Higher CO2 level indicates higher Degree of Combustion
CO Less than 100 ppm
CO presence indicates incomplete combustion of fuel, Higher CO level indicates higher degree of Combustion loss
Temperature Less than 200 0
C
f-Factors effecting Boiler Efficiency i Moisture contents of Bagasse
i.i 50% water content in Bagasse takes away 5900 KJ heat per kg bagasse while leaving with flue gases , which is a main reason of lower combustion efficiency of bagasse fired boilers.
i.i1 % drop in Moisture through milling control or by bagasse dryer reduces 1.6% heat losses in Flue gasses. i.ii 1% decrease in Moisture in bagasse increase boiler efficiency by 0.8 %
f.II Excess Air Bagasse contains 22% O2
1% reduction in excess air improves 0.6 % boiler efficiency.
in it by birth. Theoretically It requires 3.2 kg air per kg bagasse for combustion but practically it requires 25 – 30 % excess air for good combustion.
f.iii Flue gas temperature: 22 0
C rise in flue gasses temperature decreases thermal efficiency by 1 %.
f.iv O2
Monitoring O level in Flue Gases
2
control for efficientcombustion . level in flue gases is the best indicator for air fuel ratio
f.iv.i 3 % decrease of O2 in flue gases promote fuel saving of 2%.
f.v Feed Water Temperature 15 0
C rise in feed water temperature rises thermal efficiency by 3 %.
f.iv Combustion Air Preheating 20 0
C rise in combustion air rises thermal efficiency by 1 %.
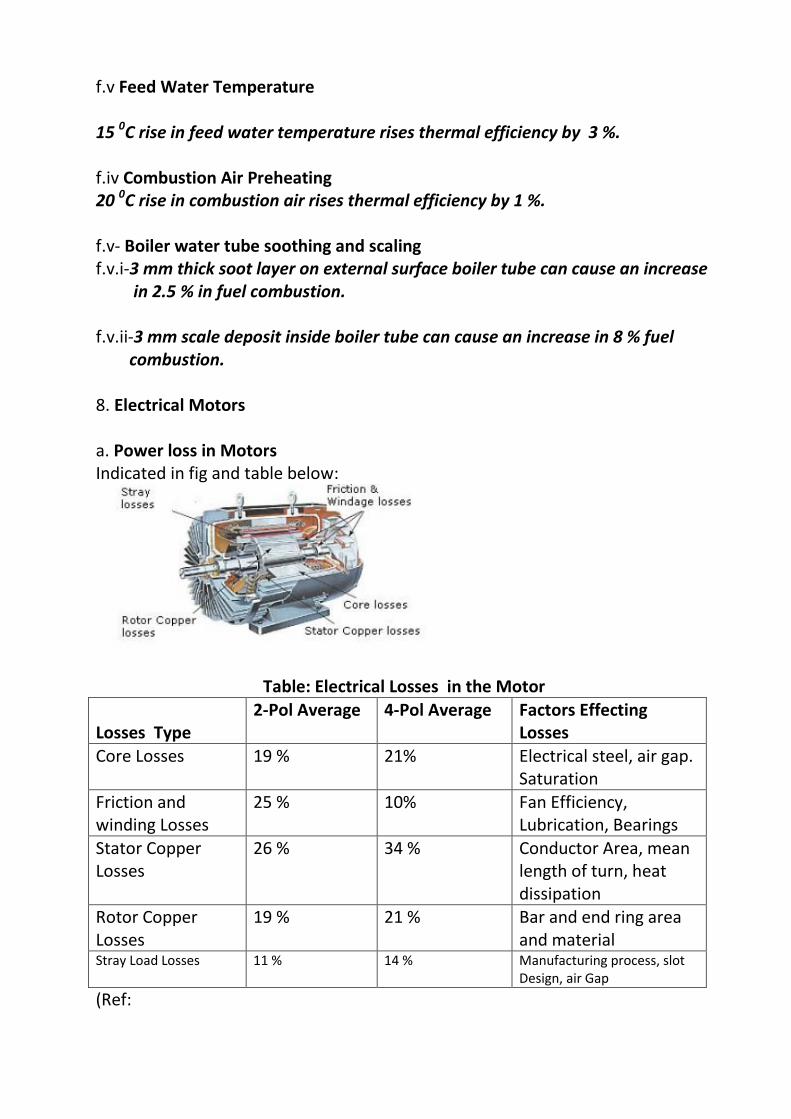
f.v- Boiler water tube soothing and scaling f.v.i-3 mm thick soot layer on external surface boiler tube can cause an increase in 2.5 % in fuel combustion. f.v.ii-3 mm scale deposit inside boiler tube can cause an increase in 8 % fuel combustion. 8. Electrical Motors a. Power loss in Motors Indicated in fig and table below:
Table: Electrical Losses in the Motor Losses Type
2-Pol Average 4-Pol Average Factors Effecting Losses
Core Losses 19 % 21% Electrical steel, air gap. Saturation
Friction and winding Losses
25 % 10% Fan Efficiency, Lubrication, Bearings
Stator Copper Losses
26 % 34 % Conductor Area, mean length of turn, heat dissipation
Rotor Copper Losses
19 % 21 % Bar and end ring area and material
Stray Load Losses 11 % 14 % Manufacturing process, slot Design, air Gap
(Ref:
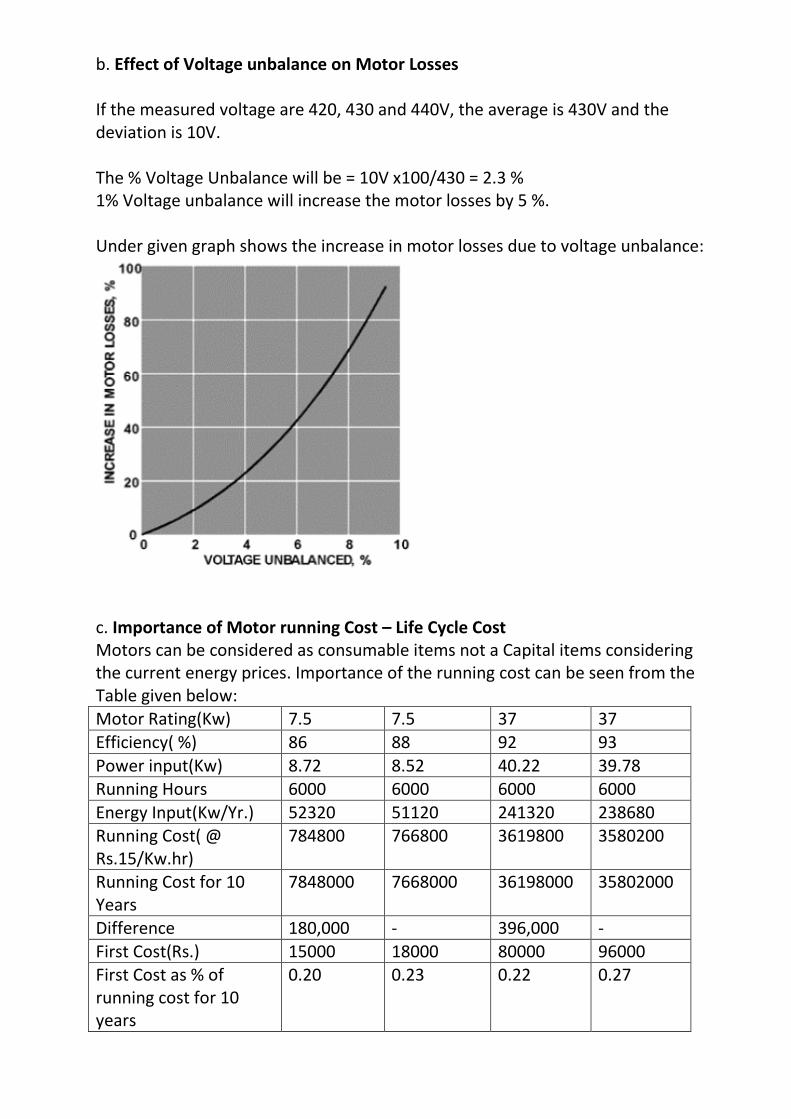
b. Effect of Voltage unbalance on Motor Losses If the measured voltage are 420, 430 and 440V, the average is 430V and the deviation is 10V. The % Voltage Unbalance will be = 10V x100/430 = 2.3 % 1% Voltage unbalance will increase the motor losses by 5 %. Under given graph shows the increase in motor losses due to voltage unbalance:
c. Importance of Motor running Cost – Life Cycle Cost Motors can be considered as consumable items not a Capital items considering the current energy prices. Importance of the running cost can be seen from the Table given below: Motor Rating(Kw) 7.5 7.5 37 37 Efficiency( %) 86 88 92 93 Power input(Kw) 8.72 8.52 40.22 39.78 Running Hours 6000 6000 6000 6000 Energy Input(Kw/Yr.) 52320 51120 241320 238680 Running Cost( @ Rs.15/Kw.hr)
784800 766800 3619800 3580200
Running Cost for 10 Years
7848000 7668000 36198000 35802000
Difference 180,000 - 396,000 - First Cost(Rs.) 15000 18000 80000 96000 First Cost as % of running cost for 10 years
0.20 0.23 0.22 0.27
c.i Remarks: c.i.i 7.5 Kw motor of 86 % efficiency consumes extra electricity of Rs.180,000/- in its life cycle which is 12 times higher than its purchased cost as compared with same rated motor of 88% efficiency.
c.i.ii 37 Kw motor of 92 % efficiency consumes extra electricity of Rs.396,000/-in its life cycle which is 4.95 time higher than its Purchased cost as compared with same rated motor of 92 % efficiency.
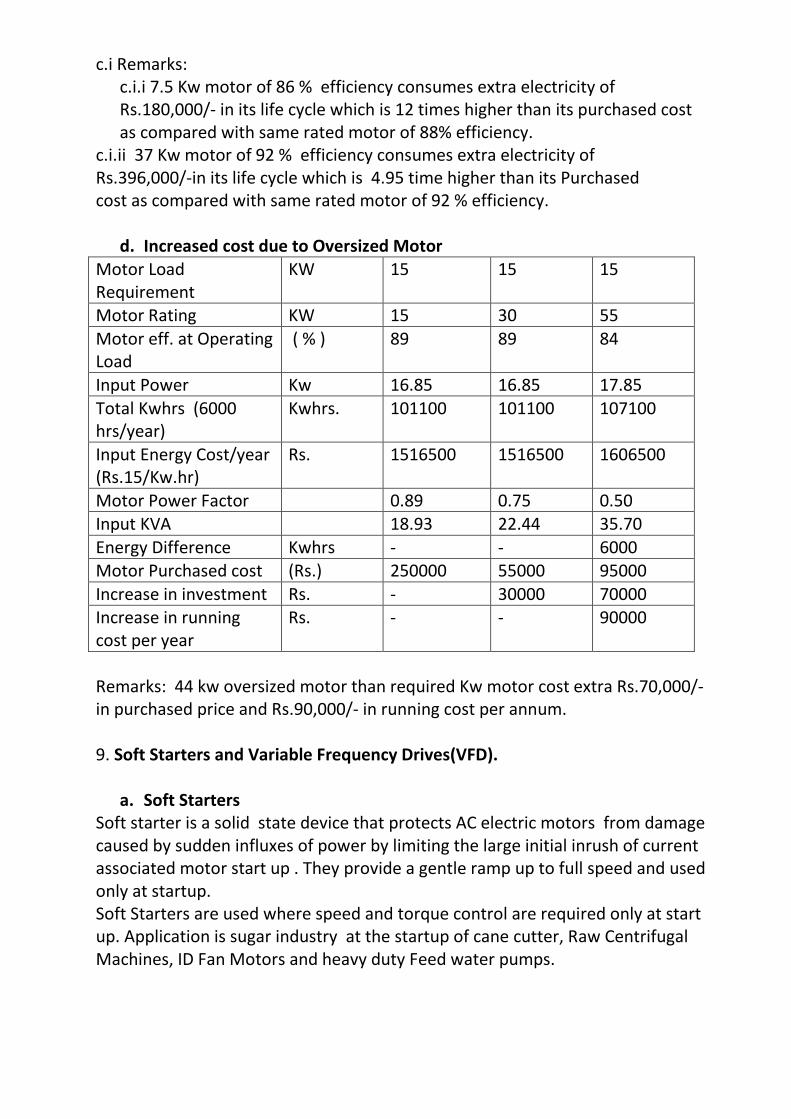
d. Increased cost due to Oversized Motor Motor Load Requirement
KW 15 15 15
Motor Rating KW 15 30 55 Motor eff. at Operating Load
( % ) 89 89 84
Input Power Kw 16.85 16.85 17.85 Total Kwhrs (6000 hrs/year)
Kwhrs. 101100 101100 107100
Input Energy Cost/year (Rs.15/Kw.hr)
Rs. 1516500 1516500 1606500
Motor Power Factor 0.89 0.75 0.50 Input KVA 18.93 22.44 35.70 Energy Difference Kwhrs - - 6000 Motor Purchased cost (Rs.) 250000 55000 95000 Increase in investment Rs. - 30000 70000 Increase in running cost per year
Rs. - - 90000
Remarks: 44 kw oversized motor than required Kw motor cost extra Rs.70,000/- in purchased price and Rs.90,000/- in running cost per annum. 9. Soft Starters and Variable Frequency Drives(VFD).
a. Soft Starters Soft starter is a solid state device that protects AC electric motors from damage caused by sudden influxes of power by limiting the large initial inrush of current associated motor start up . They provide a gentle ramp up to full speed and used only at startup. Soft Starters are used where speed and torque control are required only at start up. Application is sugar industry at the startup of cane cutter, Raw Centrifugal Machines, ID Fan Motors and heavy duty Feed water pumps.
b. Variable Frequency Drives The VFD is motor control device that protects and controls speed of an AC induction motor during start up, stop and running cycle. b.i. Energy saving with VFD VFDs offer greatest energy saving for fans and pumps. It regulates the speed of the mechanical equipment to control the flow by adjusting the driving motor speed. Energy saving with VFD is based on affinity law which states “Flow changes linear with speed , Pressure is proportional to the Square of speed and power is proportional to the cube of the speed”. It means, if we drop the speed of pump to 80% of its rated speed to control the flow rate the power will reduced to the half of its rated power. ( 0.8)3
For energy saving , throttling the output valve for centrifugal pumps and regulating pressure relief valve for high pressure Boiler water feed pumps to control flow and damping control to regulate boiler furnace pressure is not a solution but control of speed of pump or fan through VFD .
=.512= 51.2 percent.
Application places in sugar industry where flow or pressure regulating is required, like Centrifugal pumps, ID, FD Fans, Injection pumps and Boiler Feed pumps etc.