application of analytical chemistry and waste minimisation techniques in a
TRANSCRIPT

University of KwaZulu-Natal
APPLICATION OF ANALYTICAL CHEMISTRY
AND WASTE MINIMISATION TECHNIQUES IN A
PAINT DRIER PLANT
Muvhango Rasalanavho
July 2009

APPLICATION OF ANALYTICAL CHEMISTRY
AND WASTE MINIMISATION TECHNIQUES IN A
PAINT DRIER PLANT
Submitted in fulfilment of the academic requirements for the degree of
Master of Science
By
Muvhango Rasalanavho
July 2009
School of Chemistry
University of KwaZulu-Natal
Pietermaritzburg Campus

i
Abstract
Environmental sustainability, strict Municipal bylaws, ever-increasing waste disposal
costs and scarcity of natural resources e.g. freshwater, are but a few aspects that
necessitate companies to incorporate Waste Minimisation Techniques (WMT) and
Pollution Prevention Strategies (PPS) into industrial processes. In a chemical industry
expense alone is no longer the defining factor when it comes to cutting down the
amount of effluent wastes generated; it is now largely dictated by waste regulations.
Metallica Chemicals (Pty) Ltd (the company) like any other company engaged in the
production of speciality chemicals, is not immune to waste production. The company’s
core business is in the production of speciality textile products and metal soaps
known as Paint Driers (PD). During production of paint driers, (cobalt and
manganese processes in particular) it was established that the technology in use
results in a release of high quantities of wastewater that contain a high concentration
of sulfate ions and traces of these heavy metals, and the result is that the wastewater
generated is not useable in the same or other production processes.
The total amount of wastewater produced from these two processes is more than 435
tonnes per annum. The company spends substantial financial resources (an average
of more than R236 000 per year) for disposal only. The company management
decided to implement a waste management audit and waste minimization strategies
or techniques to solve the problem. This meant,
• a change to cleaner production processes and/or
• better ways to manage the waste at reduced costs.
In order to fully understand the extent of the situation, wastewater samples were
collected from the company for analysis. Analysis of wastewater samples was carried
out using appropriate analytical technique, namely inductively coupled plasma optical

Abstract
ii
emission spectrometry (ICP-OES), to establish the amount of heavy metals, sulfate
ions and any other metal traces. Results were used to make informed decisions for
the WMT to apply in order to eliminate/reduce the problems identified by the
company.
It was deduced that if WMT and PPS are applied to processes such as, water audit,
reuse and regenerative recycling of wastewater, pinch technology, turning waste
generated into commercialized product, etc, this could result in the company
achieving both financial and environmental goals.
Careful consideration of recommendations made will put the company’s
environmental standing on a far sounder footing. The rewards on the production
capacity, efficiency and financial savings will by far exceed the current volumes and
revenues.

iii
Declaration
I, Muvhango Rasalanavho, hereby certify that this research work was independently
carried out and written by me. It has not already been accepted in substance for any
degree or been submitted in candidature for any other degree. Unless otherwise
stated, figures, tables and pictures belong to me.
Signed: …..……………………..…...
Muvhango Rasalanavho
I hereby certify that this statement is true and correct.
Signed: …..……………………..…...
Dr. Colin Southway
Supervisor
School of Chemistry
University of KwaZulu-Natal
Pietermaritzburg Campus July 2009

iv
Acknowledgements
Firstly I would like to extend my sincere thanks to the management of Metallica
Chemicals Ltd who initiated the Waste Minimisation project. The company not only
provided a place where sampling took place but went the extra mile in assisting with
some financial support that helped to offset expenses incurred. I am indebted to the
production personnel, in particular the plant operators, who were willing to share their
extensive wealth of experience of working in a Paint Drier Plant. The laboratory
analysts were always willing to assist with trouble-shooting ideas on how to effectively
enhance the efficiency of the production process. Special thanks go to Mr Neville
Naicker, Mr Devan Pillay, Ms Bongekile Mbatha, Mrs Sheereta Ishmael, Mr
Nkosikona Mazendala, Mr Webster Hlengwa, Mr Benjamin Dlamini, Mr Goliatha
Majola and Mr Mcdonald Mchunu. Last but not least, the security personnel, Mr
Kidwell Cele, Mr Jabulani Mthembu and Godfrey Ngcongo for assisting with water
meter readings.
My sincere thanks also go to Mr Vernen Reddy at COMAR Chemicals, who not only
provided me with much needed literature on paint driers, but welcomed me at their
plant in Cape Town and shared valuable insights into the manufacturing processes of
paint driers.
I am grateful to my former supervisor, Dr Sally A. A. Spankie, for giving me an
opportunity to work under her wing, trusting and believing in my potential. You were
more than a mentor and colleague who never ceased to offer valuable guidance at
the beginning of the project while collecting samples and writing reports. It is
unfortunate that you had to leave before I finally completed this project.
To my co-supervisor who later became my supervisor, Dr Colin Southway, your in-
depth knowledge of Analytical instruments and inquisitive, probing questions all made
me realize that analysing samples is more than just getting results. One needs to
check several aspects while validating methods chosen. Your guidance, priceless

Acknowledgements
v
suggestions and sources of inspiration during the final part of this journey has been
humbling, to say the least. I thank you!
I am particularly thankful to Mrs. Gail Briggs, for her willingness to proof read all
chapters and work through the whole document at short notice, you are one in a
trillion! Your valuable suggestions were crucial in crafting and shaping this document
into what it now is. Words are just not enough to express my deepest appreciation.
You are a true friend indeed.
To the University of KwaZulu-Natal, thank you for providing fee remission. To the
faculty Science and Agriculture, Chemistry School in particular, I thank you for
providing me with the necessary equipment and office space to work on this project
quietly.
Finally, I am particularly grateful to my family:
My lovely wife, Charity Ntanganedzeni Mugivhi, for taking care of our children while I
was away collecting and analysing samples until the early hours of the morning, and
for spending most hours of the night alone while I was busy writing this thesis.
My two handsome sons, Ronewa Mashudu and Mutshidzi Unarine, thank you for
carrying my heavy files to and from the car and being a constant reminder that I
shouldn’t forget to have quality time with the family while pursuing my studies.
“Ndi a livhuwa”.

vi
Table of Contents
Abstract ..................................................................................................................... i
Declaration ................................................................................................................... iii
Acknowledgements ......................................................................................................... iv
List of Figures ................................................................................................................... x
List of Tables ................................................................................................................. xiii
List of Abbreviations ...................................................................................................... xvi
Chapter 1: 1. Thesis Structure ................................................................................................. 1
Chapter 2: 2. Introduction to Paint and Paint Driers .............................................................. 4 2.1 A short history of paint, South African perspective .................................... 4
2.2 Paint producers in South Africa ................................................................. 6
2.3 Paint formulation and ingredients/constituent of paints .............................. 8
2.4 Paint additives ......................................................................................... 10
2.4.1 Paint driers ...................................................................................... 12
2.4.2 Manufacturing methods .................................................................. 16
Chapter 3: 3. Industrial Processes and Paint Drier Production .......................................... 22 3.1 Waste minimisation and management at a paint drier plant .................... 23
3.2 What is waste and waste minimization? .................................................. 23
3.3 Waste Minimisation assessment techniques ........................................... 33
3.3.1 Scoping audit .................................................................................. 33
3.3.2 Mass balance for materials ............................................................. 36

Table of Contents
vii
3.3.3 True cost of waste .......................................................................... 37
3.3.4 Monitoring and targeting ................................................................. 39
3.4 Benefits of carrying out waste minimisation programme .......................... 39
3.5 Waste minimisation barriers .................................................................... 40
Chapter 4:
4. Company Profile and Process ......................................................................... 41
4.1 Company description ............................................................................... 41
4.2 Product description .................................................................................. 45
4.3 The manufacturing process ..................................................................... 47
4.3.1 Manufacturing process of cobalt octoate ........................................ 48
4.3.2 Manufacturing process of manganese octoate ............................... 54
4.3.3 Production modification .................................................................. 55
4.4 Process control ........................................................................................ 56
4.5 Packaging of product ............................................................................... 58
Chapter 5: 5. Scope and Aims ............................................................................................... 60
Chapter 6: 6. Monitoring Methodology .................................................................................. 62
6.1 Collection of existing data ........................................................................ 62
6.2 Development of a monitoring strategy for data collection ........................ 64
6.3 New data obtained by direct reading Instrument...................................... 68
6.4 Preparation of standards ......................................................................... 69
6.5 Preparation of samples ............................................................................ 70
6.6 Chemical analysis of samples using ICP–OES ....................................... 71
6.6.1 Operation principles of ICP-OES .................................................... 72
6.7 Instrument and parameters optimization .................................................. 76
Table of Contents
viii
Chapter 7: 7. Introduction ...................................................................................................... 77
7.1 Results from existing data ....................................................................... 77
7.2 Results from reading instruments and municipality water meter .............. 85
7.3 Results from chemical analysis ................................................................ 87
7.4 Sodium sulfate by-product purity ........................................................... 100
Chapter 8: 8. Introduction to Discussion ............................................................................ 103
8.1 Analysis of results from existing documents .......................................... 105
8.1.1 Major raw materials, other than water used in the drier plant ....... 105
8.1.2 Raw water usage and wastewater released ................................. 107
8.1.2.1 Water usage in the production site of the company .......... 108
8.1.2.2 Wastewater released at the end of production processes 112
8.2 Characterization of the solvent and wash wastewaters ......................... 115
8.3 Mass balance analysis ........................................................................... 119
8.4 Scoping audit ......................................................................................... 127
8.5 Production cost and true cost of waste .................................................. 131
8.6 New product formulation from waste ..................................................... 135
Chapter 9: 9. Conclusion and Proposed Measures ............................................................ 137
9.1 Conclusion ............................................................................................. 138
9.1.1 Freshwater intake and other raw material used ............................ 139
9.1.1.1 Company’s existing situation ............................................ 139
9.1.1.2 Proposed measures .......................................................... 140
9.1.2 Wastewater generated during production ..................................... 143
9.1.2.1 Company’s existing situation ............................................ 144

Table of Contents
ix
9.1.2.2 Proposed measures .......................................................... 144
9.1 Final Conclusion .................................................................................... 145
References ....................................................................................................... 146
Appendix A ....................................................................................................... 159
Appendix B ....................................................................................................... 163
Appendix C ....................................................................................................... 168
Appendix D ....................................................................................................... 172
Appendix E ....................................................................................................... 174
Appendix F ....................................................................................................... 194

x
List of Figures
Figure 2.1 The Bushman or San’s rock painting at Giant’s Castle, Ukhahlamba
Nature Reserve .......................................................................................... 5
Figure 2.2 Main ingredients of paint or surface coatings ............................................ 9
Figure 2.3 Structure of an alkyd resin formed from the reaction of linoleic acid,
glycerol and phthalic acid anhydride through monoglyceride process ..... 13
Figure 2.4 Structure A represents 1,10-phenanthroline and B is 2,2’-bipyridyl and
both are transition metal (e.g. Co and Mn) chelating ligands ................... 16
Figure 2.5 Synthetic acids used for drier production ................................................. 21
Figure 3.1 Waste generation sources at industrial production process ..................... 24
Figure 3.2 An organized and continuous systematic approach to WM ..................... 25
Figure 3.3 Integrated waste management practices hierarchy ................................. 28
Figure 3.4 Applicable waste minimization techniques for an industrial sector........... 31
Figure 3.5 General process flow diagram for a manufacturing company .................. 36
Figure 4.1 Site Plan of Metallica Chemicals (Pty) Ltd at Cato Ridge, South Africa ... 42
Figure 4.2 The organizational structure of Metallica Chemicals (Pty) Ltd ................. 44
Figure 4.3 Manufacturing process and source of waste during cobalt paint drier
production ................................................................................................ 49
Figure 4.4 Head of Reactor 6 .................................................................................... 50
Figure 4.5 The body of R6 as seen from the ground floor ........................................ 50
Figure 4.6 The inside of a reactor and blades-like shapes of an agitator .................. 51
Figure 4.7 Cobalt sulfate added to the reactor through the chute ............................. 52
Figure 4.8 Effluent collected into the flow bin from the reactor ................................. 53
Figure 4.9 Manufacturing process and source of wastewater during manganese
octoate paint drier production .................................................................. 54
Figure 4.10 Packaging process carried out while measuring the amount using a
manual mass scale .................................................................................. 59
Figure 4.11 Drum sizes used during packaging of product ......................................... 59
List of Figures
xi
Figure 6.1 The Crison micropH 2000 used when measuring sample pH .................. 68
Figure 6.2 Conductivity meter measuring the conductivity (mS/cm) of the sample ... 69
Figure 6.3 Samples reheat before analysis in order to redissolve sulfate crystals .... 71
Figure 6.4 The set up of the ICP-OES machine in the research laboratory .............. 72
Figure 6.5 Represent a 3 channel peristaltic pump used to pump in samples .......... 73
Figure 6.6 The Twister Cyclonic spray chamber connected to the nebulizer ............ 74
Figure 8.1 Amount of 2-ethyl hexanoic acid used by each metal paint drier per
annum .................................................................................................... 106
Figure 8.2 White Spirit used for metal paint drier Production per annum ................ 107
Figure 8.3 Percent of Total Fresh Water that was plant Consumed by each Metal
Paint Drier during Production per annum ............................................... 109
Figure 8.4 Comparison of water used in the Production sites with the PD Plant .... 110
Figure 8.5 Graphical representation of loss of water during production plant shut
down ...................................................................................................... 111
Figure 8.6a Comparison between freshwater intake and end-of-pipe wastewater
disposed per month ............................................................................... 112
Figure 8.6b Comparison of percent cost between freshwater intake and wastewater
collected per month .............................................................................. 114
Figure 8.7 Effect of dilution on the concentration for reaction and wash wastewater
from Co drier .......................................................................................... 116
Figure 8.8 Effect of dilution on the analyte concentration for treated and untreated
Co wastewater samples ......................................................................... 117
Figure 8.9 Effect of dilution on the analyte concentration for treated and untreated
Mn wastewater samples ........................................................................ 117
Figure 8.10 Acidified (1st and 3rd samples) and non-acidified (2nd and 4th samples) as
seen from left to right ............................................................................. 119
Figure 8.11 Comparison of the percent of Co lost during production according to
batch sheet information and analysis ..................................................... 125
Figure 8.12 Comparison of the percent of Mn lost during production according to
batch sheet information and analytical analysis ..................................... 126
Figure 8.13 Dried Na2SO4 crystals isolated from Co PD reaction wastewater .......... 136

List of Figures
xii
Figure 8.14 Dried Na2SO4 crystals isolated from Mn PD reaction wastewater .......... 136
Figure 9. 1 Freshwater intake minimization through re-use and regeneration
recycling on the Co drier process .......................................................... 141
Figure 9. 2 Freshwater minimization through regeneration recycling on the Mn
Drier process ......................................................................................... 142
Figure A1 The chemical structure of an epoxy resin .............................................. 160
Figure A2 Autoxidation and crosslinking reaction of the fatty acid part of an alkyd
resin ....................................................................................................... 161
Figure B1 Percent usage of fresh water at the PD plant excluding cleaning .......... 164
Figure B2 Percent usage of sodium hydroxide at the PD plant .............................. 165
Figure B3 Percent usage of 2-ethyl hexanoic acid at the PD plant ........................ 165
Figure B4 Percent usage of white spirit at the PD plant ......................................... 166
Figure B5 Percent usage of naphthenic acid at the PD plant ................................. 166
Figure B6 Percent usage of methanol at the PD plant ........................................... 167
Figure B7 Percent usage of Versatic acid at the PD plant ..................................... 167
Figure C1 Percent metal PD production per annum excluding drier blends ........... 169
Figure C2 Percent metal PD production per annum including drier blends ............ 170
Figure C3 Percent metal drier blends production per annum ................................. 171
Figure D1 Effluent amount collected and disposal costs per annum ...................... 173

xiii
List of Tables
Table 2.1 Some paint and paint related products manufacturing companies in
South Africa ............................................................................................... 7
Table 2.2 General composition of paint (surface coating) mixture ............................. 8
Table 2.3 Ingredients which are widely used during formulation of each paint
system ..................................................................................................... 10
Table 2.4 Some paint additives and their use on paint systems .............................. 11
Table 2.5 Metal type in each drier category ............................................................. 13
Table 2.6 Characteristics of some commercially available metal octoate driers ...... 17
Table 3.1 Waste minimisation scope to save for industrial production process ....... 35
Table 3.2 Mass balance for inputs and outputs for a production process ................ 37
Table 4.1 Composition of Mixed Drier Blends .......................................................... 46
Table 4.2 Cobalt and manganese based PD specifications manufactured by
the company ............................................................................................ 47
Table 6.1 Existing data collected for developing a monitoring strategy .................. 63
Table 6.2 Paint drier batches manufactured and sampled between January 2006
and March 2007 ....................................................................................... 64
Table 6.3 Samples collected during the manganese octoate manufacture in
Reactor 5 ................................................................................................. 65
Table 6.4 Samples collected during cobalt octoate manufacture in Reactor 6 ........ 67
Table 6.5 Mixed calibration standards used for traces analysis in wastewater ........ 70
Table 6.6 Features of the Varian 720-ES and their use ........................................... 72
Table 6.7 Used ICP-OES specifications and instrument operating conditions......... 75
Table 6.8 Selected wavelengths for each analyte ................................................... 75
Table 7.1 Total amounts and corresponding percent of raw materials used during
production of each Paint Driers in 2006 ................................................... 78
Table 7.2 Raw materials used during cobalt paint drier production in 2006............. 79
Table 7.3 Total consumption of raw material and amount spent during cobalt
driers production ...................................................................................... 80

List of Tables
xiv
Table 7.4 Raw materials used during manganese paint drier production by the
company .................................................................................................. 81
Table 7.5 Total consumption of raw material and amount spent during manganese
driers production ...................................................................................... 82
Table 7.6 Amount and charges for the use of eThekwini Municipality water ........... 83
Table 7.7 Production percents of Paint Driers produced by the company ............... 84
Table 7.8 Wastewater and payments percent for the removal, treatment and
disposal of sulfate effluent from the drier plant ........................................ 85
Table 7.9 General nature and characteristics of Co wastewater samples, pH and
conductivity (mS/cm) at the time of sampling .......................................... 86
Table 7.10 General nature and characteristics of Mn wastewater samples, pH and
conductivity (mS/cm) at the time of sampling .......................................... 86
Table 7.11 Amount of water lost during weekends when the plant is not in use ........ 86
Table 7.12 Average elemental concentrations (ppm) in acidified and non-acidified
samples of reference number 6 ............................................................... 88
Table 7.13 Average elemental concentrations (ppm) in acidified and non-acidified
samples of reference number 7 ............................................................... 88
Table 7.14 Average elemental concentrations (ppm) in acidified and non-acidified
samples of reference number 8 ............................................................... 89
Table 7.15 Average elemental concentrations (ppm) in acidified and non-acidified
samples of reference number 9 ............................................................... 89
Table 7.16 Average elemental concentrations (ppm) in acidified and non-acidified
samples of reference number 10 ............................................................. 90
Table 7.17 Average elemental concentrations (ppm) in acidified and non-acidified
samples of reference number 11 ............................................................. 90
Table 7.18 Average elemental concentrations (ppm) in acidified and non-acidified
samples of reference number 12 ............................................................. 90
Table 7.19 Average elemental concentrations (ppm) in acidified and non-acidified
samples of reference number 13 ............................................................. 91
Table 7.20 Average elemental concentrations (ppm) in acidified and non-acidified
samples of reference number 14 ............................................................. 92

List of Tables
xv
Table 7.21 Average elemental concentrations (ppm) in acidified and non-acidified
samples of reference number 15 ............................................................. 93
Table 7.22 Average elemental concentrations (ppm) in acidified and non-acidified
samples of reference number 16 ............................................................. 94
Table 7.23 Average elemental concentrations (ppm) in acidified and non-acidified
samples of reference number 1 ............................................................... 95
Table 7.24 Average elemental concentrations (ppm) in acidified and non-acidified
samples of reference number 2 ............................................................... 95
Table 7.25 Average elemental concentrations (ppm) in acidified and non-acidified
samples of reference number 3 ............................................................... 96
Table 7.26 Average elemental concentrations (ppm) in acidified and non-acidified
samples of reference number 4 ............................................................... 97
Table 7.27 Average elemental concentrations (ppm) in acidified and non-acidified
samples of reference number 5 ............................................................... 98
Table 7.28 Mass measurements for inputs raw materials and outputs (product and
wastewater) for Batch number N6JUN07 ................................................ 98
Table 7.29 Mass (kg) of cobalt lost during production in each batch sampled with
respect to instrumental analysis and SMFD information sheets .............. 99
Table 7.30 Mass (kg) of manganese lost during production in sampled batches with
respect to instrumental analysis and SMFD information sheets .............. 99
Table 7.31 Elemental composition from sulfate retrieved from Co wastewater ....... 102
Table 7.32 Elemental composition from sulfate retrieved from Mn wastewater ....... 102
Table 8.1 Sources of mass balance calculation errors for inputs and outputs for all
batches sampled ................................................................................... 123
Table 8.2 Waste minimisation scope to save for Co PD production process ......... 129
Table 8.3 Waste minimisation scope to save for Mn PD production process ........ 130
Table 8.4a Acceptable Concentration of Trade Effluent for discharge into the
sewage disposal system ........................................................................ 132
Table 8.4b Acceptable Concentration of Trade Effluent for discharge into the
sewage disposal system ........................................................................ 133
xvi
List of Abbreviations PD Paint driers
SAPMA South African Paint Manufacturers Association
VOCs volatile organic compounds
DMR Direct metal reaction process
2-EH 2-ethyl hexanoic acid
US EPA United States Environmental Protection Agency
DEAT Department of Environmental Affairs and Tourism
WM Waste Minimization
SEPA Scottish Environment Protection Agency
ROI Return on Investment
EA Environment Agency
SHE Safety, Health and Environmental
M&T Monitoring and targeting
W/S White spirit
SMFD Standard Manufacturing Formulation Document
R5 Reactor number 5
R6 Reactor number 6
EDTA ethylenediaminetetra-acetic acid
PAN 1-pyridyl-2-azonapthol(2)
SANS South African National Standards
ICP-OES Inductively Coupled Plasma Optical Emission Spectrometry
MSDS Material Safety Data Sheets
HDPE high density polyethylene
AAS absorption spectrometry
ETAAS electrothermal atomic absorption spectrometry
LEAFS laser-excited atomic fluorescence spectrometry
FAPES furnace atomization plasma excitation spectrometry
CCD Charge coupled device
USN ultrasonic nebulizer

List of Abbreviations
xvii
PHZ preheating zone
IRZ initial radiation zone
NAZ normal analytical zone
BOD biochemical oxygen demand
MDGs Millennium Development Goals
OHNP Occupational Health Nurse Practitioner

Chapter 1
Thesis structure Industrial manufacturing companies are now faced with a daunting task of taking care
of their employee’s health and the environment while striving to maintain their core
business. The current mushrooming of unions at each and every industry sector
makes it practically impossible for companies to carry on with their business as they
did 50 plus years ago. Unless the management of companies embodies clean
production in their business, they will always be prone to liabilities that can run into
millions of Rands and lose substantial amounts of the company’s financial resources.
Liabilities can either be initiated by unions on behalf of the employees’ or by
government while enforcing Municipal bylaws for incorrect disposal of waste
generated.
Metallica Chemicals initiated a waste minimization project for their paint drier (PD)
production section of the company. Their objective was to reduce both wastewater
generated as well as disposal costs. The project was more concerned with two
production processes of metal PD, cobalt and manganese.
Chapter 2 looks at the need for PD as an additive in the paint industry. Several PDs
which are currently available on the market and knowledge of how they interact with
the paint system or surface coating were explored. Production technologies practiced
by companies involved with manufacturing PD were looked at in detail.
Chapter 3 describes types of production processes available for Speciality
manufacturing companies. It was noted that each industrial company, one way or the
other, produces some form of waste while busy transforming raw material into useful
products. Wastes produced can pose a danger to those handling them, and in
Chapter 1 - 2 -
some cases can cause adverse, irreversible damage to the environment. This
calls for ways in which waste can be eliminated or reduced at source. It is
currently known that waste minimisation programmes can inevitably assist in
solving the problems of waste generated, while at the same time affording the
company many benefits.
Chapter 4 gives a description of the company where the project took place. Their
core production business was looked at in detail. Two waste streams, cobalt and
manganese, were investigated in order to identify points in the process where
waste minimisation could be targeted. Details of product formulation, from the
point of charging raw materials until packaging of final product is made were
closely scrutinized.
Information gathered from chapters 3 and 4 were used to determine the scope
and aims of the project. This was communicated to the company management in
a detailed report.
In chapter 6, the monitoring methodology of both old company data and new data
was carried out. Monitoring was done through sampling, measuring samples
using laboratory instruments and finally, characterizing samples collected.
Sampling and analytical methods were optimized in order to validate and
determine the reliability of all the results. A preliminary report was prepared and
sent to the company.
Results from old data and new data were all tabulated in chapter 7. Results were
extracted from company documents, utility invoices, private company invoices
and from analysis of samples
In chapter 8, all results were carefully discussed in order to see how the
information gathered fitted together. A comparison was made of results obtained
from company documents with analytical results based on sample analysis.

Chapter 1 - 3 -
Results were also used to formulate new possible commercialized products
derived from wastewater under investigation.
Finally, in chapter 9 conclusions and recommendations based on results were
made. A brief of current problem(s) followed by a series of recommendations
were made. The situations were based or raw material and wastewater
generated from both streams. It was demonstrated beyond reasonable doubt that
recommendations made will produce a number of benefits to the company.

Chapter 2
2. Introduction to Paint and Paint Driers Most items that we use daily are to a large extent coated with paint. The primary uses
of paint on surface of substances are to provide protection and also for decoration.
Other uses include reflection of lighting, safety promotion, electrical insulation and fire
retardation.[1, 2] Once applied to the surface of the substance, for it to serve its primary
purpose, it undergoes both physical and chemical changes from liquid form to solid
state. For the drying process to occur rapidly within hours of application, additives
called “Paint Driers” (PD) are added during paint formulation. The focus point of this
research project is on wastewater management and minimization during
manufacturing of two widely used paint driers, cobalt and manganese octoates.
2.1 Short History of Paint, South African Perspect ive Archeological excavation obtained from Zambia has so far revealed that paint was
used as far back as 350 000 to 400 000 years.[3, 4] Paintings on stones at caves
around the world are testimony enough that paint was used during nomadic times.[5-8]
There is a cave at Giant’s Castle in the Ukhahlamba Drakensberg Park in KwaZulu-
Natal which has great paintings depicting animals and people who once inhabited the
area. Figure 2.1 shows some of the beautiful pictures portrayed at the main cave of
Giant’s Castle.

Chapter 2 - 5 -
Figure 2.1 The Bushman or San’s rock painting at Giant’s Castle, Ukhahlamba
Drakensberg Park
According to the tour guide at Giant’s Castle, the paint was prepared using a mixture of
red or yellow ochre, clay and charcoal. The three ingredients were crushed into fine
powder before being mixed with water, egg yolk, animal blood and animal fats.
Egyptians are credited for their ingenious creation of a variety of pigments, such as
blue, lapis lazuli, azurite, malachite green, etc. between 3000 and 600 BC.[5-8, 12]
The word “Paint” or “Surface Coating” as it is sometimes referred to, can be described
as any fluid substance that will spread over a solid surface (substrate) and dry or
harden to an adherent (i.e. using a primer) skin or film.[4, 5] Nowadays it generally refers
to alkyd & water based paints, varnishes, enamels and lacquers. These fluids are
differentiated from each other in their composition. Alkyd or water based paint is an
inorganic pigment dispersed in three major components, namely, vehicle, filler and
additives. Varnish is a non-pigmented product based on oil and natural resin in a
solvent, whereas enamel is pigmented varnish. Unlike the preceding three types of
paint, lacquer represents a film that can be re-dissolved even after the solvent has
evaporated.[2, 5, 7, 8]

Chapter 2
- 6 -
2.2 Paint producers in South Africa With the advancement of technology and demands for paint, the formulation of paint
has greatly improved. This is largely influenced by
• methods of application (by spreading, spraying, flow coating or
electrodepositing)
• cure or dry (through atmospheric oxidation, evaporation of diluent, use of heat
or other forms of radiation
• nature of substrate (wood, household, metal, plastics etc.) and
• conditions of use (mechanical properties, durability and chemical properties.
Paint manufacturing is one of the largest industry sectors in the world and South Africa
(SA) has seen a major growth of this industry.[9] The South African Paint Manufacturers
Association (SAPMA), has in excess of 45 membership companies involved in the
manufacturing of paint or paint related products, and some of the well known
manufacturers and distributors are given in Table 2.1.

Chapter 2
- 7 -
Table 2.1 Some paint and paint related products manufacturing companies in South Africa [9]
Name of company Company’s business focus Main produ cts
Dulux (Pty) Ltd Decorative paint product sales to retailers,
wholesalers & contractors
Painting accessories and wood-care
products
Barloworld Plascon (Pty) Ltd Production, marketing and distribution of paint and
allied products
Paint, inks, solvents and allied
products
BASF Coatings (Pty) Ltd Manufacture and marketing of industrial and
automotive coatings
Colour matching, mixing, blending,
tinting, letting down and QC testing of
coatings
Duram Products (Pty) Ltd Manufacturer of specialized coatings Paint, sealants and waterproofing
Bio Schnell (Pty) Ltd T/A
Randcon Paint Centre
Manufacturer Water & solvent based coatings,
waterproofing compounds, cleaning
chemicals
Libra Paints (Pty) Ltd Manufacturer of putties & paint Industrial & decorative paint,
waterproofing compounds and glazing
putty
International Paint (Pty) Ltd Manufacturer of industrial coatings Marine, heavy duty and powder
coatings
Dekro Paints Manufacturer of automotive, decorative, hygiene,
industrial, marine, water proofing and other
specialist coatings
Automotive, decorative, hygiene,
industrial, marine, water proofing and
other specialist coatings

Chapter 2
- 8 -
2.3 Paint formulation and Ingredients/constituent o f paints
Contrary to the simple way nomadic people used to make paint, nowadays the
process is far more complicated and uses a variety of ingredients, each with a
specific, crucial purpose that takes into account important requirements described
below. Of the many ingredients used, some are potentially harmful [e.g. volatile
organic solvents (VOCs)]. With tight environmental laws and legislations, research is
constantly carried out to see the impact some of these ingredients pose to
manufactures, users and the environment.
Paint systems are grouped under two categories, liquid and powder paint systems.[2]
Liquid paint systems differ from powder systems in the sense that they contain
solvent, whereas the latter is prepared from dry ingredients only. Liquid systems are
further divided into two types, solvent and water based paint. Solvent based or non-
aqueous paints are flammable, have strong primary odours and exposure limits that
may not be exceeded in confined areas. On the one hand, water-based emulsion
paints are non-flammable, non-toxic but on the other hand they are susceptible to
freezing. There has been a gradual increase in the use of water-based emulsion
paints due to their being environmentally friendly.
During paint formulation, the four main ingredients given in Table 2.2 and Figure 2.2,
film formers, pigments, solvents and additives are mixed in different proportions by
mass. Table 2.2 gives a general composition of liquid paint system.
Table 2.2 General composition of paint (surface coating) mixture [1, 3, 6, 22, 45]
Component Weight Percent approximation Alkyd paint Water-based paint
Film former/binder* 30 – 60 30 – 55
Solvent 27 – 41
Pigment 19 – 30 25 – 37
Water 6 – 27
Additives 2 – 4 2 – 4
*In water-based paint the binder is called an alkyd emulsion.

Chapter 2
- 9 -
Film formers/binders
Pigments
Solvents
Additives
Raw material or ingredients of Paint (surfacecoatings)
Synthetic resins
Drying and semidrying oils
Natural resins
Inorganic
Organic
Oxygenated
Hydrocarbons
Other solvents
Surface-Active agentsPaints DriersThickenersAntifoam agentsFungicides/preservativesPlasticizersOther additives
Figure 2.2 Main ingredients of paint or surface coatings [2, 5, 47, 51]
The major constituent of all surface coatings (see Table 2.2) is the film former/binder
with an average weight percent of more than 30 %. Binders are mostly made of
natural or synthetic resins and they include acrylic, alkyd, amino epoxy, phenolic,
polurethane, vinyl, butyl acrylate and many more.[2] In solvent-based paints, alkyd
resins (see Figure 2.3) are the ones which are mostly used. Other ingredients are
added depending on various factors, hence not all these ingredients will be found in
all types of paint formulation. The most widely used component type for each main
ingredient of paint systems is given in Table 2.3.

Chapter 2
- 10 -
Table 2.3 Ingredients which are widely used during formulation of each paint system [1-2, 51]
Main ingredient Type of Paint system
Solvent-based Water-based Powder
Binder/Film former Alkyd resin* Epoxy resin emulsion Epoxy resin**
Pigment Titanium dioxide Titanium dioxide Titanium dioxide
Solvent Aliphatic Water None
Additives Driers Driers Calcium carbonate
*See example of an alkyd resin given in Figure 2.3
**See chemical structure given in Figure A1
2.4 Paint Additives
Although additives contribute a small percentage, (see Table 2.2) they nevertheless
play a crucial role in film formation after application of paint on a substrate. During
paint formulation the total level of all additives is usually less than 5% of the total paint
product.[1] A number of additives and the function they play in the paint are given in
Table 2.4. With the exception of paint driers, not all these additives are included in all
paint types; hence the choice depends entirely on a particular formulation and
purpose of paint. As mentioned earlier, the paint drier is of paramount importance to
this research project and hence a detailed description of this category of additives is
given in the Sub-sections 2.4.1 and 2.4.2. Sub-section 2.4.1 gives a description of
types of driers available and how they influence the drying of paint systems. A
detailed example illustrating the drying of alkyd resin (Figure 2.3) is shown in
Figure A2 under Appendix A. Technologies applied during driers manufacturing and
the final form of the drier product are dealt with under Sub-section 2.4.2.

Chapter 2
- 11 -
Table 2.4 Some paint additives and their use on paint systems [1, 5, 8]
Type of Paint Additives Function on the pa int Antifoams Reduce formation of foam by lowering surface tension on
adjacent bubbles during manufacturing, filling, tinting, shaking and application of the paint.
Antisettling agents They reduce the settling of pigments during storage, e.g. thixotropes.
Anti-corrosive pigment enhancers
Used to prevent corrosion on metal substrate. Examples include zinc dust, red lead, zinc chromate etc.
Antiskinning agents Prevention of skin formation while stored in the can e.g. methyl ethyl ketoxime, cyclohexanoneoxime, butyraldoxime and phenols.
Can-corrosion inhibitors To prevent aqueous paints corroding the can e.g. sodium nitrite and sodium benzoate.
Dehydrators/antigassing additives
To prevent formation of moisture from pigments at the dispersion stage
Dispersion aids They break down the pigment agglomerate so that particles can be wetted uniformly by the liquid vehicle
Driers For promoting oxygen intake and decomposition of hydroperoxides during oxidative cross-linking process
Floating and flooding additives
Reduce separation of pigments by using Ricinoleic acid, silicones etc.
Ultraviolet absorbers Reduce rate of degradation when exposed to sunlight Antistatic agents They are added mostly to paints used for painting
machine and this prevent the machine from gathering dust particles
Deodorants
Added in order to eliminate odours from some alkyd paints
Antilivering agents
Additives such as 2-amino-2-methylpropane are added to stabilize the paint components so that pigments will not react with the binder
Flatting agents Metallic soaps such as aluminum stearate, zinc stearate and zinc tungate are needed so that the surface of the film can be finely rough rather than smooth, so that it can reflect light diffusely rather than spectrally
Viscosity control agents Used to enhance the rheology or viscosity of paint system Anti-oxidants Used to prevent skinning or drying out of dispersion
during storage Preservatives such as Mildew inhibitors or fungicides
Prevent growth of and flourishing of microorganisms that can damage some components of paint, e.g. vehicle which is a source of food to most fungi
Emulsifiers
In order for stable mixtures of immiscible liquids like water and oil to be produced, surfactants are used. The surfactants used are mostly anionic, cationic or nonionic

Chapter 2
- 12 -
2.4.1 Paint Driers Paint driers fall under a category called additives, (see Table 2.4) which forms an
integral part of paint formulation. A paint drier, also called siccatives when in solution,
can be described as a metal soap/salt formed from the reaction of a long-chain fatty
acid with a metal (mostly transition metals) that accelerates the drying of the paint film
after being applied on the substrate. The acid portion of the drier gives solubility in the
oil medium. They speed up the oxidative cross-linking and/or polymerization of the
film formers or paint resins.[3, 10-34] Their main role in paint systems is two-fold:
• to catalyse the uptake of oxygen from the atmosphere and
• to enhance the decomposition of stable hydroperoxides to free radicals.
If the driers are not added to paint systems the resins/film undergo a slow
autoxidation process which is commercially unacceptable. Paint driers are generally
classified under three major categories,[26, 31, 35-37, 40-44] namely:
• Primary driers (or active driers) are sometimes referred to as catalytic,
oxidative, surface, top or skin driers. These names originate from the sense
that when used alone they accelerate the hardening of the film surface before
the underlying film reaches the state of oxidization. Primary driers contain
metal of variable valency and examples of this category are given in Table 2.5
below. Their main function in paint is to promote oxygen uptake and
breakdown of hydroperoxides (formed by the reaction of oxygen in the air with
the film/resin) to free radicals since most of them have two accessible valence
states that differ by one electron.
• Secondary driers (or through-driers) which are also called cross-linking,
polymerization or coordination driers. They provide a through dry of the paint
film by forming oxygen-metal-oxygen bridges or cross-links between polymers;
hence prevent surface wrinkling that occurs when primary driers are used
alone.
• Auxiliary driers or promoters enhance the appearance and quality of the
total paint film.

Chapter 2
- 13 -
Table 2.5 Metal type in each drier category [40, 44, 46]
Primary driers Secondary driers Auxiliary driers
Cobalt Lead Calcium
Manganese Zirconium Potassium
Vanadium Barium Lithium
Cerium Strontium Zinc
Iron Aluminum
Bismuth
Neodymium
Many studies on the action of paint driers in paint systems have been carried out.
Research papers on the action of paint driers are mostly based on alkyd resins shown
in Figure 2.3.
O
O
OO
OO Glycerol
Phthalic acidanhydride (PAA)
Linoleic acid chain
n
Figure 2.3 Structure of an alkyd resin formed from the reaction of linoleic acid,
glycerol and phthalic acid anhydride through monoglyceride process [29, 48]
Upon application on the substrate both physical and chemical changes takes place in
the paint. The solvent used {volatile organic compounds (VOCs) in the case of
Chapter 2
- 14 -
solvent paint or water in the case of water-based emulsion} evaporates upon
application. This leaves the binder which should ultimately change from liquid form to
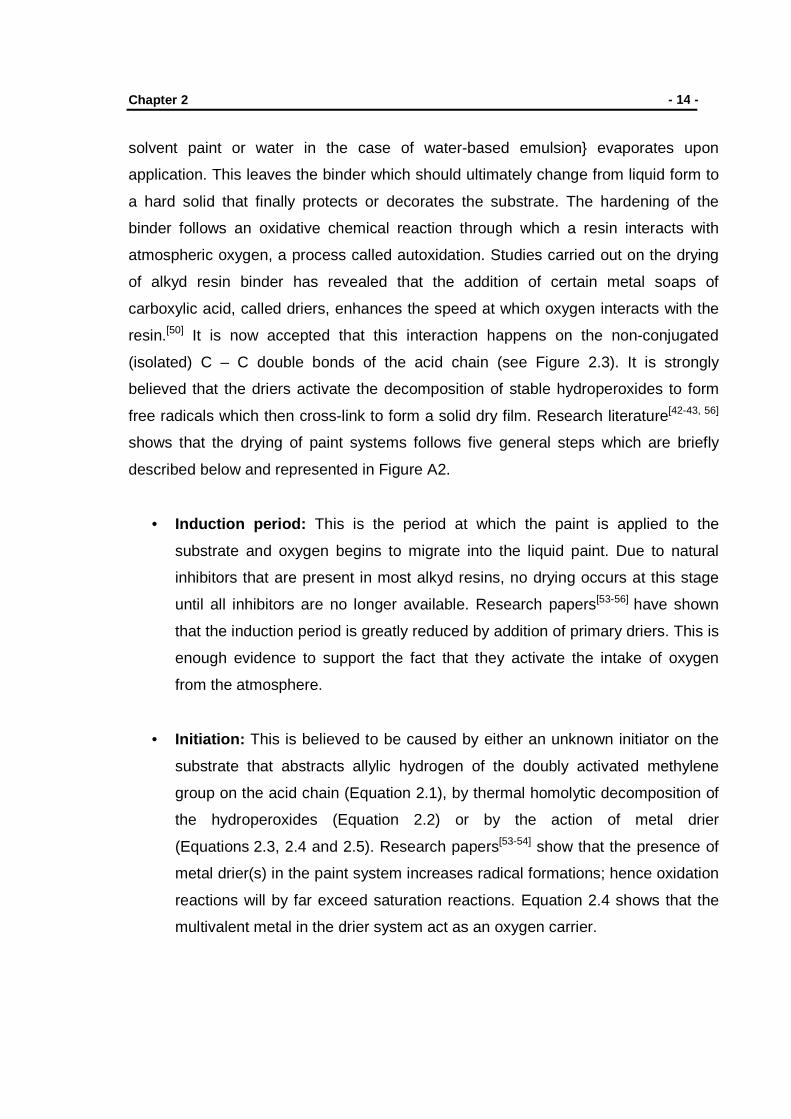
a hard solid that finally protects or decorates the substrate. The hardening of the
binder follows an oxidative chemical reaction through which a resin interacts with
atmospheric oxygen, a process called autoxidation. Studies carried out on the drying
of alkyd resin binder has revealed that the addition of certain metal soaps of
carboxylic acid, called driers, enhances the speed at which oxygen interacts with the
resin.[50] It is now accepted that this interaction happens on the non-conjugated
(isolated) C – C double bonds of the acid chain (see Figure 2.3). It is strongly
believed that the driers activate the decomposition of stable hydroperoxides to form
free radicals which then cross-link to form a solid dry film. Research literature[42-43, 56]
shows that the drying of paint systems follows five general steps which are briefly
described below and represented in Figure A2.
• Induction period: This is the period at which the paint is applied to the
substrate and oxygen begins to migrate into the liquid paint. Due to natural
inhibitors that are present in most alkyd resins, no drying occurs at this stage
until all inhibitors are no longer available. Research papers[53-56] have shown
that the induction period is greatly reduced by addition of primary driers. This is
enough evidence to support the fact that they activate the intake of oxygen
from the atmosphere.
• Initiation: This is believed to be caused by either an unknown initiator on the
substrate that abstracts allylic hydrogen of the doubly activated methylene
group on the acid chain (Equation 2.1), by thermal homolytic decomposition of
the hydroperoxides (Equation 2.2) or by the action of metal drier
(Equations 2.3, 2.4 and 2.5). Research papers[53-54] show that the presence of
metal drier(s) in the paint system increases radical formations; hence oxidation
reactions will by far exceed saturation reactions. Equation 2.4 shows that the
multivalent metal in the drier system act as an oxygen carrier.
Chapter 2
- 15 -
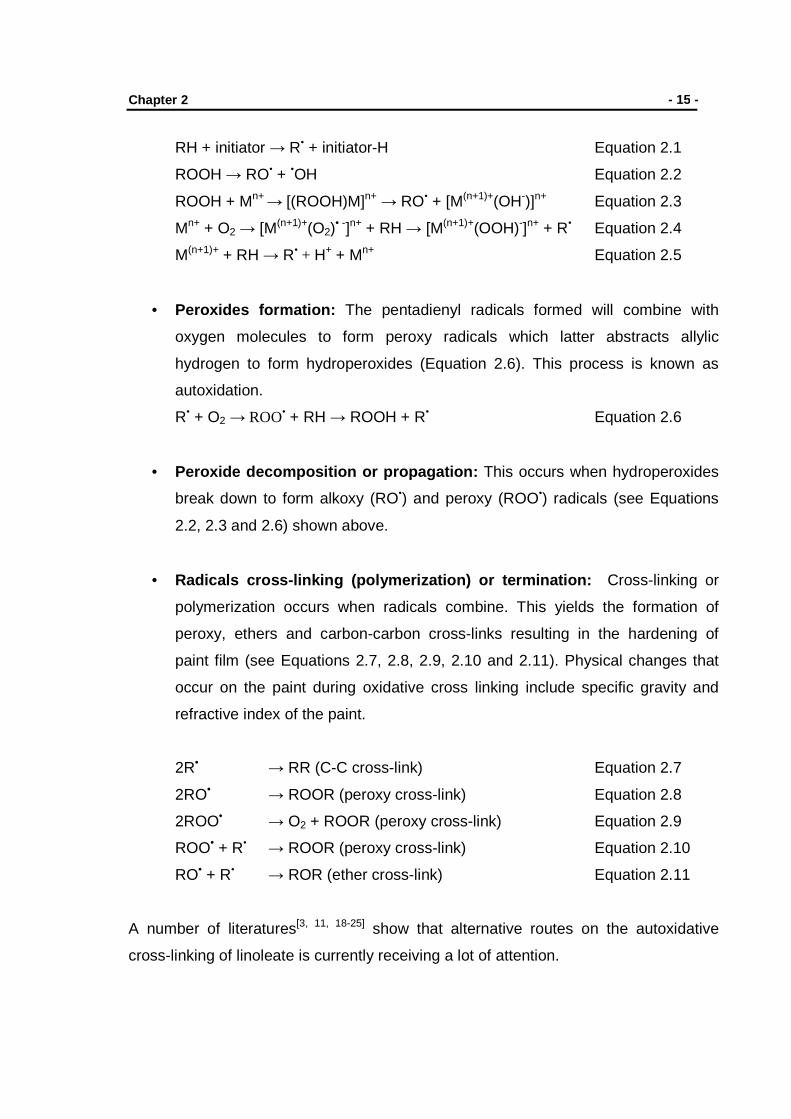
RH + initiator → R• + initiator-H Equation 2.1
ROOH → RO• + •OH Equation 2.2
ROOH + Mn+ → [(ROOH)M]n+ → RO• + [M(n+1)+(OH-)]n+ Equation 2.3
Mn+ + O2 → [M(n+1)+(O2)• -]n+ + RH → [M(n+1)+(OOH)-]n+ + R• Equation 2.4
M(n+1)+ + RH → R• + H+ + Mn+ Equation 2.5
• Peroxides formation: The pentadienyl radicals formed will combine with
oxygen molecules to form peroxy radicals which latter abstracts allylic
hydrogen to form hydroperoxides (Equation 2.6). This process is known as
autoxidation.
R• + O2 → ROO• + RH → ROOH + R• Equation 2.6
• Peroxide decomposition or propagation: This occurs when hydroperoxides
break down to form alkoxy (RO•) and peroxy (ROO•) radicals (see Equations
2.2, 2.3 and 2.6) shown above.
• Radicals cross-linking (polymerization) or terminat ion: Cross-linking or
polymerization occurs when radicals combine. This yields the formation of
peroxy, ethers and carbon-carbon cross-links resulting in the hardening of
paint film (see Equations 2.7, 2.8, 2.9, 2.10 and 2.11). Physical changes that
occur on the paint during oxidative cross linking include specific gravity and
refractive index of the paint.
2R• → RR (C-C cross-link) Equation 2.7
2RO• → ROOR (peroxy cross-link) Equation 2.8
2ROO• → O2 + ROOR (peroxy cross-link) Equation 2.9
ROO• + R• → ROOR (peroxy cross-link) Equation 2.10
RO• + R• → ROR (ether cross-link) Equation 2.11
A number of literatures[3, 11, 18-25] show that alternative routes on the autoxidative
cross-linking of linoleate is currently receiving a lot of attention.

Chapter 2
- 16 -
2.4.2 Manufacturing Methods
The amount of paint drier added during formulation is mostly less than 1 % by mass
of the total paint. Though it is an important component of paint systems, the relatively
minute amount required during formulation puts a limit on drier production quantities.
In most cases, driers are sold as blends (see Table 4.1) instead of a single type.
Three known companies in South Africa are actively involved in the manufacturing
and distribution of paint driers. These are Metallica Chemicals Ltd (where sampling
was carried out) and COMAR Chemicals (that supplied literature on the
manufacturing of paint driers) which is based in Cape Town. The third company
called Chemiphos is situated in Gauteng province but has its production sites at
PATCHAM Ltd which is located outside the country in United Arab Emirates (UAE).
Besides the use in paint formulation, other manufacturing industries [44, 52] such as
printing inks, automotive fuel additive, grease and gear oils, and rubber industry
utilize driers. They are commercially sold based on the metal concentration (content)
as shown in Table 2.6 and this is referred to as the metal specification of the paint
drier. The activity of and efficiency of driers in paint systems is a subject of many
studies in the field of coating technology.[36, 40, 42] It has been established that
chelating agents such as 1,10-phenanthroline (commercially known as ACTIV-8) or
2,2’-bipyridyl (Bipy) (see Figure 2.4. a and b) accelerates the activity of metal paint
drier. The complex formed is usually referred to as non-emulsifiable and are coded as
“FS”.
N N
A B
N N
Figure 2.4 Structure A represents 1,10-phenanthroline and B is 2,2’-bipyridyl and
both are transition metal (e.g. Co and Mn) chelating ligands

Chapter 2
- 17 -
Table 2.6 Characteristics of some commercially available metal octoate driers [57]
Metal Metal content %
Viscosity at 25 oC, cP
Specific Gravity at 25 oC, g/cm 3
Appearance
Cobalt 12 ± 0.2 500 1.020 Clear blue
violet liquid 10 ± 0.2 175 0.975
6 ± 0.2 50 0.870
3 ± 0.2 < 15 0.830
1 ± 0.2 <15 0.790
Manganese 10 ± 0.2 1000 1.000 Clear brown
liquid 6 ± 0.2 200 0.900
Calcium 10 ± 0.2 500 0.975 Clear liquid
5 ± 0.2 175 0.860
4 ± 0.2 50 0.840
Lead 36 ± 0.2 1300 1.380 Clear liquid
33 ± 0.2 300 1.280
30 ± 0.2 150 1.230
24 ± 0.2 50 1.110
Zinc 22 ± 0.2 Not
applicable
1.150 Clear liquid
12 ± 0.2 50 0.930
10 ± 0.2 30 0.890
8 ± 0.2 <15 0.870
Zirconium 18 ± 0.2 50 1.100 Clear liquid
12 ± 0.2 25 0.960
10 ± 0.2 25 0.940
6 ± 0.2 20 0.870
Barium 12.5 ± 0.2 100 0.960 Clear liquid

Chapter 2
- 18 -
Paint drier manufacturing processes or technologies are based on three basic
chemical reactions [17, 22], namely:
• Direct fusion (“dry”) process: This process utilizes a metal oxide (MeO),
carbonate or hydroxide which reacts with the carboxylic acid (between 150 and
200 oC) resulting in the formation of a neutral soap (see Equation 2.12). There
is no production of wastewater as a byproduct, hence this is mostly seen as an
advantage at this point where disposal costs and company liability is of major
concern to the industrial manufacturing sector. It is however important to use
raw materials of highest purity in order to get driers of good quality. In most
instances this tends to be a drawback to most companies as pure, raw
materials are very costly. Direct fusion process is the only process that can
produce both neutral and basic soap, as illustrated by Equations 2.12 and 2.13
respectively. For the reaction that yields a basic soap, there is less amount of
acid required which translates to financial savings.[52]
MeO + 2 RCOOH → (RCOO)2Me + H2O Equation 2.12 Neutral soap
(RCOO)2Me + MeO → RCOO Me–O–Me OOCR Equation 2.13 Basic soap
Where “Me” and “R” represent a metal and a alkyl group respectively.
• Precipitation process: The process is sometimes called a double
decomposition (“wet”) process which begins by alkali metal (sodium) soap
formation from carboxylic acid and sodium hydroxide. Salts of heavy metals
(e.g. cobalt sulfate, manganese sulfate, etc.) are then added under controlled
pH and temperature to the aqueous alkali metal soap. The desired product is
easily influenced by keeping the pH and temperature at optimal level. Hence,
compared to direct fusion process, the purity of the ingredients is of less
importance, implying that raw materials are often obtained at low cost. The
disadvantage of precipitation process is the amount of wastewater produced
with high level of sulfates. The product is dissolved in an organic solvent, white

Chapter 2
- 19 -
spirit, so that the wastewater layer is separated from the product. Depending
on the quantity manufactured per annum, disposal costs can run into millions
of rands. With current environmental legislations, companies spend valuable
time making certain that the wastewater generated is disposed of properly.
General equations that illustrate the precipitation process are given below.
RCOOH + NaOH → RCOONa (aq) + H2O Equation 2.14
MeSO4 + 2 RCOONa (aq) → (RCOO)2Me + Na2SO4 (aq) Equation 2.15 Neutral soap
• Direct metal reaction (DMR) process
The finely ground or melted metal reacts with the carboxylic acid directly to
form a metal soap of choice. The reaction takes place in the presence of a
catalyst that activates the intake of oxygen from the atmosphere. This method
produces an appreciable amount of wastewater as byproduct as shown in
Equation 2.16.
2 Me + 4 RCOOH + O2 2 (RCOO)2Me + 2 H2O Equation 2.16
The choice of carboxylate or organic acid is very important when manufacturing driers
that can efficiently meet the minimum drying requirements. [17, 22, 39] The properties will
in most cases include:
• Good solubility and high stability in various kinds of binders, hence branched
acids are used as they enhance solubility of metal soaps.
• Drier must not form skins, sediment and gel, or interact with pigment which
implies that it should have high stability.
• Its catalytic activity after paint application should be of high efficiency at
optimal metal content.
• Low viscosity to make the handling of driers easier.
• The size of the acid molecule is important as it will afford adequate metal
concentration
Catalyst
Chapter 2
- 20 -
Driers used in paint industry are mostly naphthenates, octoates or neo decanoates.[38]
These are salts of naphthenic acid, 2-ethyl hexanoic acid (2-EH) and neo-decanoic
acid respectively (see Figure 2.5). Refined tall oil fatty acids such as oleic acid and
linoleic acid are seldom used and are not favoured compared to the first three types.
Octoates are the ones which are mostly used because they yield driers of high metal
concentrations with low viscosity. The solubility and stability of drier soaps is to a
large extent influenced by the position of the substitute on the acid structure. Those
that have substitutes adjacent to the carbonyl group are frequently used, e.g. 2-EH
and neo- decanoic acid.
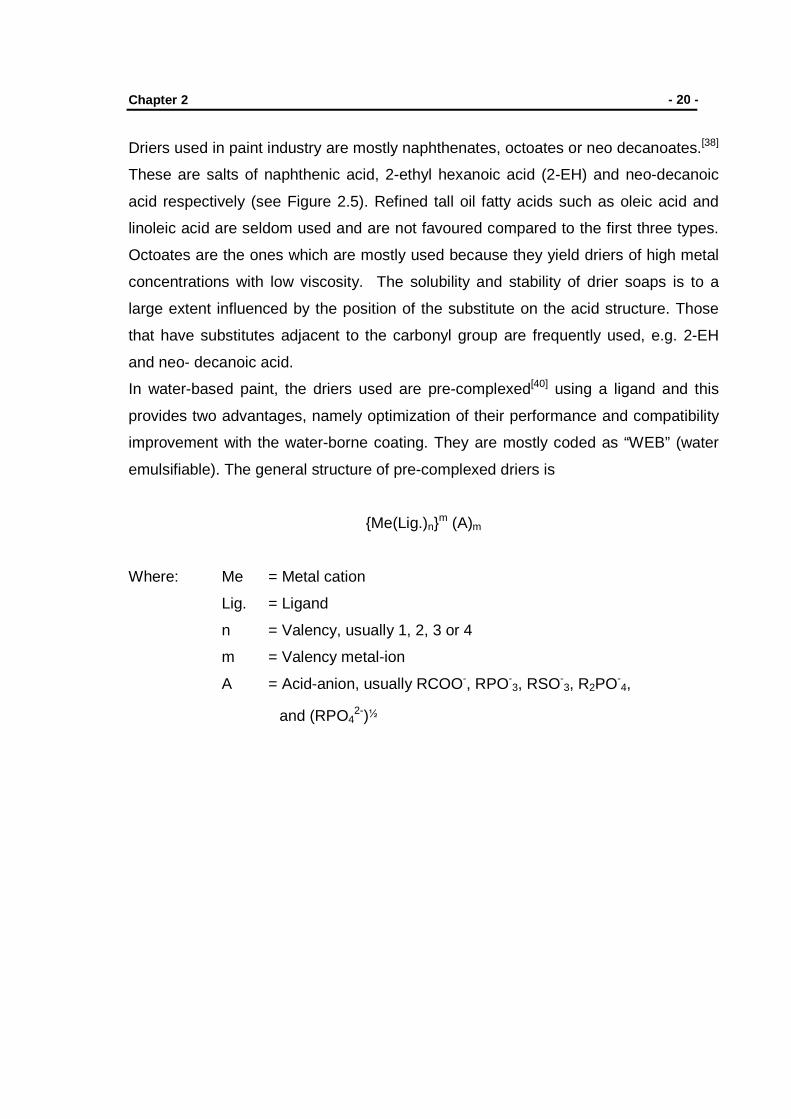
In water-based paint, the driers used are pre-complexed[40] using a ligand and this
provides two advantages, namely optimization of their performance and compatibility
improvement with the water-borne coating. They are mostly coded as “WEB” (water
emulsifiable). The general structure of pre-complexed driers is
{Me(Lig.)n}m (A)m
Where: Me = Metal cation
Lig. = Ligand
n = Valency, usually 1, 2, 3 or 4
m = Valency metal-ion
A = Acid-anion, usually RCOO-, RPO-3, RSO-
3, R2PO-4,
and (RPO42-)½

Chapter 2
- 21 -
CHCH
CH
CH
CH
R2
R3
R4
R1
CH2 COOHn
Naphthenic acid
R1, R2, R3 and R4 are short alkyl chains or hydrogensn = 1 to 3
C4H9 CH
C2H5
COOH
2-ethylhexanoic acid
C
R1
R3
COOHR2
Where
Where R1, R2 and R3 are alkyl chains with a total of eight carbons
Neo-decanoic acid
C17H33COOH
C17H31COOHBoth these acids are called tall oil fatty acids
Oleic and linoleic acid respectively
Figure 2.5 Examples of organic acids used for drier production[1]

Chapter 3
3. Industrial Processes and Paint Drier Production
It is public knowledge that industrial companies that are involved in manufacturing
specialty chemicals are faced with strict environmental regulations with regard to
managing waste generated during each production process. Community members,
environmental scientists, lawyers and organizations are constantly on the lookout as
to how companies conduct themselves when it comes to waste disposal.[58] In order
to adhere to acceptable legislation, chemical manufacturing companies find
themselves channeling more financial resources into waste disposal than they would
do if only they could eliminate generations of waste. Industrial chemical processes
are grouped under three categories [59] which are:
� Batch process: Raw materials (inputs) are added into a reactor and do not
leave the reactor until the end product (output) is formed. This shows that
they are time-dependent as they require proper planning of production
before manufacturing occurs. At the end of the process products and by-
products are removed from the reactor to enable it to be used again.
Between the start time, t = t0 and end time, t = tf nothing leaves the reactor
boundaries, so for these processes the general mass balance equation[59]
is derived from:
Accumulation = final output – initial input Equation 3.1
Accumulation = generation – consumption Equation 3.2
Equations 3.1 and 3.2 put together yields the following general equation for
a batch process.
Initial input + generation = final output + consumption Equation 3.3

Chapter 3 - 23 -
� Continuous process: Products and raw material are continuously moving
between the reacting vessels. For this type of process there is no
accumulation as nothing changes with time, and hence it is usually
represented by the following general equation:
Input + generation = output + consumption Equation 3.4
� Semibatch process: This is a process which is neither classified as a
batch process nor a continuous process.
As described under Sub-section 2.4.2, the three drier production processes follow the
batch process described above. The second production process, “precipitation
process” as described, generates large amounts of wastewater. With current stringent
environmental legislation & laws and disposal costs, it is important for an industry to
look at ways of minimizing and managing the production of waste that accompanies
this technology during paint drier production.
3.1 Waste minimisation and management at a Paint Dr ier Plant Literature that could shed light on waste minimization at a paint drier plant production
is unavailable in the public arena. Research carried out on paint driers is mostly
based on two areas, i.e. drier interaction with paint and new environmental friendly
drier types, rather than on waste minimisation during production processes. It was
important to look at other industrial processes that generate waste during production,
in order to mimic strategies employed by others when dealing with waste minimisation
and management.
3.2 What is Waste and Waste Minimization? Waste can be described as an unwanted substance or by-product that is produced
during the production of an important commercialized product. [60-63, 67] This usually
includes liquid or solid residues from a process, contaminated materials, off-
Chapter 3 - 24 -
specification products, accidental spillage, machine/finishing residues, fugitive
emissions and gaseous discharges. Waste can be grouped under three categories,
namely process wastes, utility wastes and other wastes. If left unattended these can
be a health hazard to humans and usually cause a long-lasting effect on the
environment, i.e. to both flora and fauna. Industrial waste should always be handled
with care as most are hazardous. Therefore, the type of waste, and harmful effects it
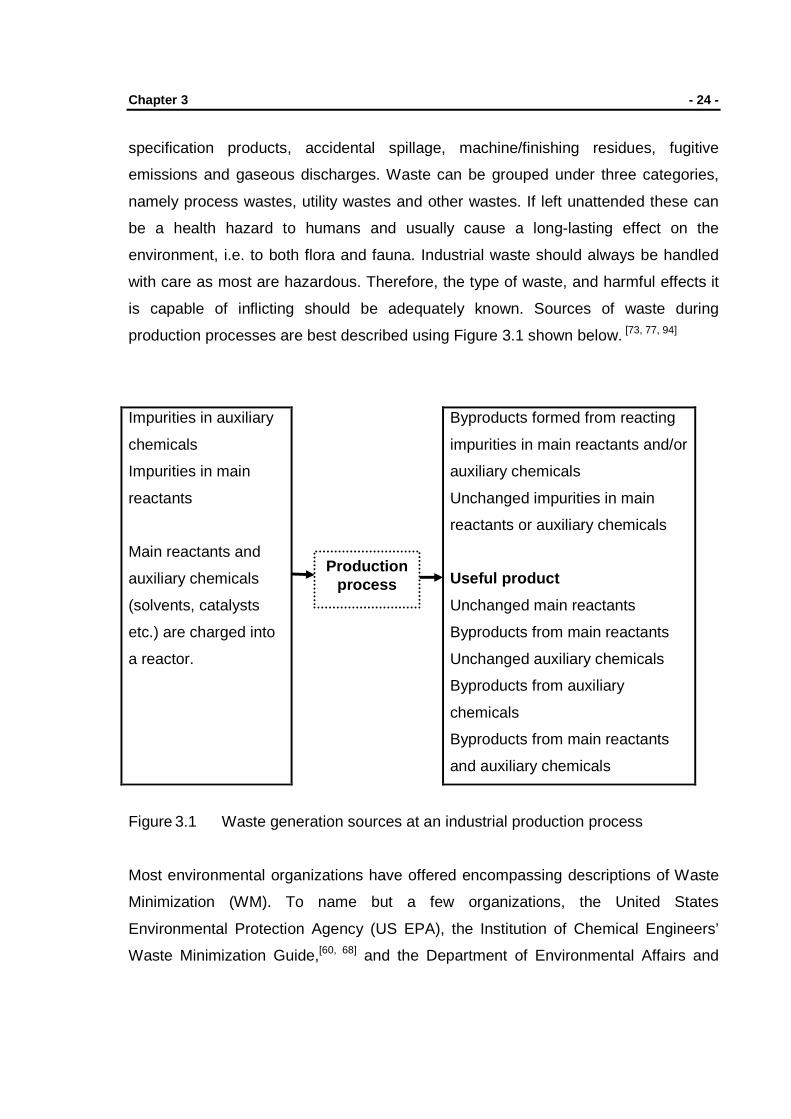
is capable of inflicting should be adequately known. Sources of waste during
production processes are best described using Figure 3.1 shown below. [73, 77, 94]
Impurities in auxiliary
chemicals
Impurities in main
reactants
Main reactants and
auxiliary chemicals
(solvents, catalysts
etc.) are charged into
a reactor.
Byproducts formed from reacting
impurities in main reactants and/or
auxiliary chemicals
Unchanged impurities in main
reactants or auxiliary chemicals
Useful product
Unchanged main reactants
Byproducts from main reactants
Unchanged auxiliary chemicals
Byproducts from auxiliary
chemicals
Byproducts from main reactants
and auxiliary chemicals
Figure 3.1 Waste generation sources at an industrial production process
Most environmental organizations have offered encompassing descriptions of Waste
Minimization (WM). To name but a few organizations, the United States
Environmental Protection Agency (US EPA), the Institution of Chemical Engineers’
Waste Minimization Guide,[60, 68] and the Department of Environmental Affairs and
Production process

Chapter 3 - 25 -
Tourism (DEAT) of South Africa [78, 84] describe WM as the reduction, to the extent
feasible, of hazardous waste that is generated or subsequently treated, sorted, or
disposed of at predetermined zoned sites.[77-83] Activities that are carried out with the
sole aim of avoiding waste creation or applying cleaner production technologies,
elimination or reduction of waste at its source, allowing reuse or recycling qualify to
be described as WM. The Scottish Environment Protection Agency (SEPA)[81] on
their website describes the procedures that need to be followed when carrying out
WM. Industrial manufacturing companies should follow preplanned procedures
(methodology of waste minimization) made up of stages or phases. These stages can
be revisited whenever the need arises and are described in Figure 3.2 below.
Commitment
Assessment Phase
Ranking of Options
Development of Action Plan
Carrying out Action Plan
Review and Audit
Feedback
Figure 3.2 An organized and continuous systematic approach to WM[16, 68-69, 87]
Chapter 3 - 26 -
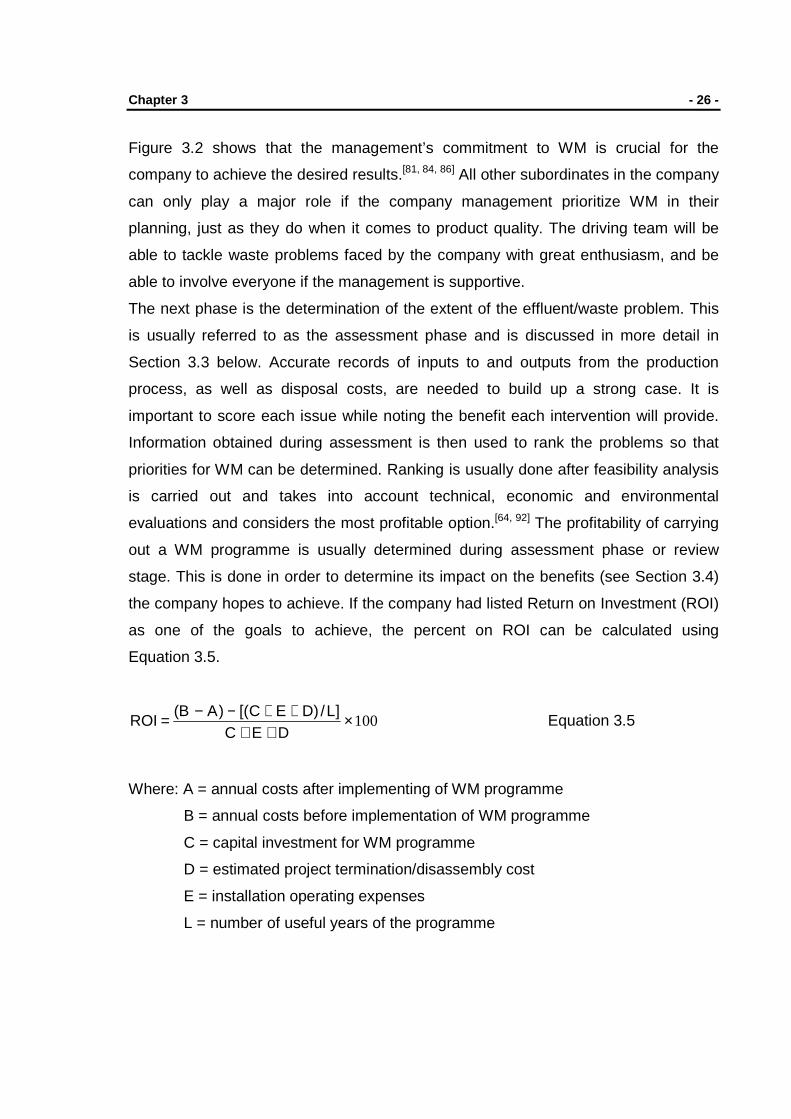
Figure 3.2 shows that the management’s commitment to WM is crucial for the
company to achieve the desired results.[81, 84, 86] All other subordinates in the company
can only play a major role if the company management prioritize WM in their
planning, just as they do when it comes to product quality. The driving team will be
able to tackle waste problems faced by the company with great enthusiasm, and be
able to involve everyone if the management is supportive.
The next phase is the determination of the extent of the effluent/waste problem. This
is usually referred to as the assessment phase and is discussed in more detail in
Section 3.3 below. Accurate records of inputs to and outputs from the production
process, as well as disposal costs, are needed to build up a strong case. It is
important to score each issue while noting the benefit each intervention will provide.
Information obtained during assessment is then used to rank the problems so that
priorities for WM can be determined. Ranking is usually done after feasibility analysis
is carried out and takes into account technical, economic and environmental
evaluations and considers the most profitable option.[64, 92] The profitability of carrying
out a WM programme is usually determined during assessment phase or review
stage. This is done in order to determine its impact on the benefits (see Section 3.4)
the company hopes to achieve. If the company had listed Return on Investment (ROI)
as one of the goals to achieve, the percent on ROI can be calculated using
Equation 3.5.
100×++
++−−=DEC
]L/)DEC[()AB(ROI Equation 3.5
Where: A = annual costs after implementing of WM programme
B = annual costs before implementation of WM programme
C = capital investment for WM programme
D = estimated project termination/disassembly cost
E = installation operating expenses
L = number of useful years of the programme

Chapter 3 - 27 -
Development of action should take into account the WM practices hierarchy shown in
Figure 3.3 shown below. Timeframes should be clearly stipulated at this stage. If a
private company is required to carry out the action plan, there should be someone to
liaise with the team who makes sure that timeframes are always adhered to.[16]
Though an “outsider” will bring in new ideas and be unbiased as to the production
processes, problems with employee openness should be attended to speedily, as
withholding vital information can impede the smooth running of the project. In the
case where waste streams are expected to be measured, installation of meters to all
outlet pipes should be made in order to accurately determine wastes generated. The
action should constantly be reviewed in order to identify or make improvements
where possible. The findings, improvements and actions or recommendations should
be communicated to both the management and employees.[81] As this is a crucial
stage to make everyone buy into the idea, all communications made should also take
production quality and quantity into consideration. All role players should receive
updates timeously on new findings through company newsletters, weekly meetings or
notices on the company notice boards.
Finally, all findings and recommendations should be consolidated in a report that
needs to be revisited at a predefined stage. This will help the company to determine
the impact of the WM programme on all expected benefits.

Chapter 3 - 28 -
Disposal
Treatment
Recycling
Reuse
Waste minimisation orsource reduction
Eliminationof waste
Lowest priority
Highest priority
Figure 3.3 Integrated waste management practices hierarchy [69-71, 117]
Traditionally, industries never bothered much on waste minimisation and hence
missed out on process improvement that could ultimately translate to high profit.[82] It
is currently accepted that while carrying out WM and management, a particular
hierarchy, shown in Figure 3.3, that emphasises certain priorities should be borne in
mind.
Figure 3.3 shows that elimination of waste should be given highest priority if possible.
If this is not possible to achieve, source reduction should be next priority on the line.
Source reduction will in most cases focus on the following aspects:[84, 85]
� Material substitution : Main reactants can be replaced, e.g. replacing
metal sulfate by metal hydroxide (see Sub-section 2.4.2).

Chapter 3 - 29 -
� Process substitution or elimination : With regard to the current case
study, it will mean changing from precipitation process to direct fusion
process or DMR process described under Sub-section 2.4.2.
� Good housekeeping and equipment maintenance : This is usually
achieved by keeping a proper record of meter reading of the resources
(electricity or water) utilized against production amount. Routine
maintenance of equipment will surely extend their lifespan, e.g. painting to
prevent rust formation.
� Water and energy conservation : Water and energy are scarce resources
and proper usage is vital.
� Pollution prevention in design and planning : Re-engineering process in
order to minimize pollution in design will help reduce costs.
� Training awareness : Personnel running the plant should be trained and
their voices should be heard, as they have more practical knowledge of
operation than management.
� Life-cycle analysis : This is sometimes referred to as “cradle-to-grave”
analysis as waste generators are required to trace the waste from the point
it was generated to the final site were it is properly disposed of. This shows
that a traceable track record should be made for each waste generated.
Therefore all individuals (vendors, customers and contractors) who are
directly involved should be co-opted into the pollution prevention team
� Inventory control : “Just-in-time” purchases [128, 16] of raw material could be
implemented for most local materials. Material usage can be traced using
barcodes, hence inventory in store is known at all times.
It should be mentioned that successful recycling is only achievable if the waste can
be used as a resource for starting materials.[154] For this to be implemented efficiently,
the effect and amounts of contaminants should be known so that production
quantities and quality are not compromised. Two recycling categories have been
identified as:

Chapter 3 - 30 -
� On-site recycling : This to a large extent includes in-process recycling, re-use
and regeneration re-use. During in-process recycling the starting material is
recycled back to the process without firstly collecting it, so this is sometimes
not regarded as waste. Reuse of waste is mostly carried out on collected,
stored waste that contains appreciable amounts of contaminants. The waste is
used as starting material for the same production process from where it
originated. Regeneration reuse can be described as using waste that has or
has not been treated (depending on the amount of contaminants) in other
production processes at the site.
� Off-site recycling : Once the purity of waste in hand has been established, the
waste can be used for other purposes rather than in production processes.
A summary of information provided above for source reduction and recycling of waste
is given in Figure 3.4 below. The figure shows that these two waste management
practices hierarchy are usually referred to as “Waste minimization techniques”.

Chapter 3 - 31 -
Waste Minimization Techniques (WMT)
Source Reduction Recycling
MaterialSubstitution
ProcessSubstitution
orElimination
Good Housekeeping
Water andEnergyConservation
PollutionPreventinin DesignandPlanning
Training andAwareness
Life-CycleAnalysis
InventoryControl
In-processrecycling
End-of-piperecycling
Figure 3.4 Applicable waste minimization techniques for an industrial sector [63, 64, 66]

Chapter 3 - 32 -
Treatment using a contractor is applied if the preceding measures cannot be
implemented. This will be cost effective if waste streams are segregated as it is easier
to treat few contaminants than will normally be the case for mixed waste stream.
Techniques used when treating waste[84, 95-97, 132] include:
• physical treatment (filtration, ash blending, evaporation, stabilization, and
flocculation),
• chemical treatment (oxidation, reduction, and precipitation),
• biological treatment,
• encapsulation,
• special burial,
• neutralization, and
• incineration.
The company’s detailed records of waste generated should be readily available and
properly archived.
Disposal is usually regarded as the last measure that should be carried out when all
other waste management practices cannot be implemented. It should be carried out
at designated sites while taking into consideration the impact this will have on the
environment if not properly done.[5, 58] This is usually carried out by a private
contractor and the management should ascertain that such an individual or company
is properly registered and has a valid permit.[88] It should be remembered that the
generator of waste is responsible throughout the life cycle of the waste and hence
should carry out an audit to verify the contractor’s compliance with environmental
legislations. As it is embodied in the Constitution of South Africa Act 108 of 1996,
“Everyone has the right to:[88]
� An environment that is not harmful to their health or well being; and
� To have the environment protected, for the benefit of present & future
generations.”

Chapter 3 - 33 -
Section 2 of the National Environment Management Act 107 of 1998 lists 18
principles which include; prevention principles, waste hierarchy, precautionary
principles, cradle-to-grave principle, and polluter pays principle, to mention just a
few.[88] The emphasis is placed on the generator of waste as opposed to the collector.
This means that once the waste leaves the company site, the company is still 100%
responsible for any unlawful disposal that can impact on the environment.
3.3 Waste Minimisation Assessment Techniques During the assessment phase (see Figure 3.2) several techniques can be applied to a
particular production process.[63, 65] Some of the known techniques might not be
applicable but the ones which are will surely provide valuable information.
Assessment phase is sometimes carried out under two broad categories which are
pre-assessment stage and assessment stage.[66, 74-77] In this project, the techniques
discussed below will just be grouped under the broad name “assessment phase”.
Waste minimization assessment techniques include:
3.3.1 Scoping Audit
The starting point of WM is looking at what goes into the production process and the
business operation.[65-67, 72] This means that a review of the process flow diagram for
each production process in the company should be made.[69] Identification of potential
and actual waste streams (both inputs and outputs) will make it easier for
measurements to be taken. The information obtained is then used to establish a WM
baseline for a particular process. Basic cost data are collected to determine the main
raw material and energy resources.[62] This is done using a list of all inputs and
outputs. This will mean going through company purchase records and invoices. It is
important to know that internal stock transfer records are mostly misleading and
should be avoided unless purchase and invoices are not available.[69] Material
suppliers could also help with data unavailable at the company. Energy, water and
effluent costs are easily obtainable from company invoices. If the required information
Chapter 3 - 34 -
is unavailable the service providers should be approached in order to obtain such
information. The information obtained can be collated in a table showing the scope to
save (see Table 3.1). The estimated scope to save is found by multiplying the
estimated cost/year by the scope to save percent. Using Table 3.1, each material is
then ranked and the one that shows highest saving margin is given the highest
priority. Note that percentages given in Table 3.1 were obtained from UK based
industries; they are however applicable globally and South African industries are no
exceptions.

Chapter 3 - 35 -
Table 3.1 Waste minimisation scope to save for industrial production process [65, 77]
Resources and Services
Quantity Cost/unit in
Rand
Estimate Cost/year
in Rand
Scope to
save %
Estimate of Scope to Save Priority Ranking
(1=highest) Minimum (R) Maximum (R)
Raw materials
First most used 1 to 5
Second most used 1 to 5
Third most used 1 to 5
All other materials 1 to 5
Packaging 10 to 90
Ancillary materials 5 to 20
Consumables 10 to 30
Energy:
Electricity 5 to 20
Heat for the process 10 to 30
Water 20 to 80
Wastewater or effluent 20 to 80
Solid waste 10 to 50
TOTAL

Chapter 3 - 36 -
3.3.2 Mass Balance for materials
Equations 3.1 through 3.4 give a summary of mass balance which is defined as a
“balance sheet” for material use.[76] This means that any losses or emissions that
were previously unaccounted for can be quantified.[62] Based on Equations 3.1 to 3.4
material balance is usually represented by the mass conservation principle:[64, 66]
Mass in = Mass out – Generation + Consumption + Mass accumulated
Equation 3.6
Using mass balance for material, the concentration of waste constituents can be
determined. This is mostly achievable by drawing a process diagram which shows the
system boundaries, streams entering and leaving the process as well as points at
which wastes are generated.[66] An example of a process flow diagram is given in
Figure 3.5 below.
Unpacking of raw materials
Production process
Final product packaging
Reactor and plant cleaning
Final product
Utilities
Packagingin drums
Cleaning materials
Consumerpackaging
Effluent
Effluent
Product losses
Supplier packaging
Figure 3.5 General process flow diagram for a manufacturing company [76, 77]

Chapter 3 - 37 -
Table 3.2 shows that using the mass balance, calculation of elemental balances in
the raw material and product for a particular process are possible. Any difference can
be tracked down in the wastewater produced. Information obtained from analytical
results can then be compared with calculations made. When preparing mass
balance, the following factors should be taken into account:[64]
� Precision of analytical data and flow measurements for wide inlet and
outlet waste streams
� The time span under which measurements are made
� Complexity of large processes where recycle streams are present
� Need to comply with certain emission regulations
Table 3.2 Mass balance for inputs and outputs for a production process Inputs to reactor Outputs from reactor
Substance Amount,
kg
Substance Amount,
kg
Metal in raw material Metal in the product made
Wasted part of raw
material
Reaction wastewater
Wash wastewater
Distillate water
Wasted part in reaction wastewater
Wasted part in wash wastewater
Wasted part in distillate water
TOTAL TOTAL
3.3.3 True Cost of Waste
According to the Environment Agency (EA), a UK based organization, “the cost of
your waste is not so much the cost of getting rid of it as the value of what you are
getting rid of”.[65] Most companies underestimate the true cost of waste because they

Chapter 3 - 38 -
only pay attention to the disposal cost.[62, 65] The true cost of waste should be based
on:
• Disposal costs: Vary from simple disposal to treatment, usually by a
private company, which then disposes to landfill.
• Purchase cost of unreacted raw materials and materials that constitute
waste: The purchase price will include the amount paid for anything that
ends up being thrown away resulting in a negative return on investment.
• Handling/processing costs: From the moment it is generated, labour and
storage facilities are all required to keep it safe.
• Management time: Useful time that could be spent on valuable product is
spared to deal with waste.
• Lost revenue: It is mostly regarded as something that produces a
negative return on investment.
• Any potential liabilities: Certain waste produced by the company will be
subject to Safety, Health and Environmental (SHE) regulations and as
such requires special disposal procedures. Companies could be required
to alter their production process, hence incur financial loss.
This shows that;
The true cost of waste = disposal costs + purchase cost of materials
+ handling/processing costs
+ Management time
+ lost revenue
+ any potential liabilities
= much more than the company realize!
Equation 3.7
Table 3.1 can only be utilized once the true cost of waste and potential savings have
been established. Equation 3.7 reveals the shocking truth of the cost of waste that
can range between 5 to 20 times that of disposal.[80, 93]

Chapter 3 - 39 -
3.3.4 Monitoring and Targeting Monitoring and targeting (M&T) is sometimes referred to as “measuring to manage”
(MtM) which is mostly used to compare consumption with production targets.[65, 77, 85]
In this project, monitoring and targeting will not be applied but is nevertheless worth
mentioning. This technique utilizes pictorial representations such as a trend analysis
graph, histogram, pie charts, Pareto charts, Sankey diagrams, etc. for data analysis.
Since this technique is less important in the current project, details regarding graphs
utilized will not be made.
3.4 Benefits of carrying out a Waste Minimisation Programme
The main objective of any industrial manufacturing sector is to make profit while
keeping expenses low. Company shareholders could be more than happy if the
process is 100% efficient and is able to convert all raw materials to product without
generating any waste. Unfortunately this is an ideal situation that is almost impossible
to achieve. Even a minor process that takes place in all household kitchens produces
waste in one way or the other. Having said this, it is important to seek ways in which
waste can be reduced at source. One such way is through implementation of WM at a
production facility. There are several benefits for carrying out WM programme[90, 91, 94-
97] and they include:
� Conservation of scarce resources : Practicing WM will conserve most
resources; including water, which are very scarce and nonrenewable raw
materials. Reduction of fresh water usage will affect the amount of waste
generated positively.
� Cost savings : Improved raw material use will impact positively on the
production cost for a particular product. The efficiency of the production
process, productivity and profitability will increase. The amount of raw
material turned into useful products will increase. Waste management,
energy costs and disposal costs will reduce.
Chapter 3 - 40 -
� Environmental Compliance : Chances of the company being litigated are
reduced and less impact on the environment is caused due to waste
reduction.
� Risk or liability reduction : Shareholder’s confidence will be enhanced and
the company will receive high accolades from the community it serves.
Employees will feel safer as soon as they realize that the management
cares about their safety.
� Company position in the market : Customer relations will increase once
they realize that they are dealing with an eco-friendly company. The image
and profile of the company and its competitiveness will strengthen.
3.5 Waste Minimisation Barriers The implementation of WM is without doubt derailed by many obstacles just as any
new programme to be implemented in a company for a particular purpose. Barriers
that are associated with WM fall into four categories: economic, technical, regulatory
and institutional.[68, 117] It is strongly believed that regulatory barriers pose more major
problems than the other three. This is usually observed while trying to keep within one
correct regulatory framework, only to find that the company is itself violating others.
Potential barriers will always be encountered while implementing WM techniques, but
the company shouldn’t be deterred by them as they are outweighed by benefits
mentioned above.

CHAPTER 4
4. COMPANY PROFILE AND PROCESS Metallica Chemicals (Pty) Ltd (the company) was formed on the 1 July 2000. The
company produces specialty chemicals for the paint and textile industries. In the case
of the paint industry they produce metal paint drier soaps (PD). The company’s
production site is situated in the Ebuhleni Industrial Park at Cato Ridge, KwaZulu–
Natal, South Africa. Acti-chem is the distribution wing of the organization. Its head
offices are situated in Westville, KwaZulu–Natal, South Africa. It operates as the sales
agent for both local and export markets of Metallica Chemicals (Pty) Ltd’s products.
This chapter consists of five sections. Section 4.1 gives a description of the company
structure and operations. In Section 4.2 the PD products manufactured by the
company are outlined. A detailed description of the production process for cobalt
octoate [cobalt 2-ethylhexanoate, Co(C7H15CO2)2] and manganese octoate
[manganese 2-ethylhexanoate, Mn(C7H15CO2)2] is given in Section 4.3. Quality
control and efficiency during the production process and the end product is described
in Section 4.4. Finally in Section 4.5 the packaging and storage of final product are
described.
4.1 Company Description The company’s factory at Cato Ridge consists of two production plants, one for textile
auxiliaries and one for paint driers. There is also an administrative department, a
laboratory, a workshop, two storage facilities and a clinic run by a full time
occupational health & nursing practitioner. The site plan for this factory is shown in
Figure 4.1.

Chapter 4 - 42 -
Figure 4.1 Site Plan of Metallica Chemicals (Pty) Ltd at Cato Ridge, South Africa
39
38
37
9
10
16
15
21
35
34 28 29
36 27
11
12
13
17
18
22
23
26
2
25
14
19
32
40
20
31
32
33
30
6
7
8
41 2
5
4
24
2
3
L
1

Chapter 4 - 43 -
Key to areas highlighted in Figure 4.1
1. Security Check Point
2. Main Administrative Offices
3. Canteen and Kitchen
4. Main Laboratory
5. Factory offices and Training Room
6. Factory Canteen
7. Clinic
8. Change Rooms
9. Mercury Warehouse No. 4
10. Mercury Warehouse No. 3
11. Workshop
12. Finished Goods Warehouse
13. Bonded Warehouse
14. Raw Material Warehouse
15. New/Reconditioned Drum Store
16. Mercury Warehouse Intermediate
17. Textile Production Plant (TPP)
18. Redundant Catalyst Plant
19. Metal Paint Drier Production Plant
(MPDPP)
20. Storage Shed
L. Boundary line beyond which eating is
prohibited.
21. Redundant Mercury Building
22. Compressor Room
23. Electrical Store
24. Water Cooling Tower (below 25)
25. Textile Effluent Storage Area
26. Boiler House
27. Mercury Laundry and Change
Rooms
28. Mercury Laboratory
29. Laundry
30. Effluent Treatment Plant
31. Disused Still Room
32. Bulk Tanks
33. Mercury Recovery Plant
34. Storm water Dam
35. Ash Dam
36. Outside Solvent Store
37. Covered Storage Pad
38. Covered Storage Pad Dam
39. Dam No. 3
40. Outside Solvent Store
41. Sweetwater Dam

Chapter 4 - 44 -
Managing Director (MD)
Site Manager
Production Manager
Supervisors 2 x (MPDPP &
TPP)
2 x Plant operators
Maintenance Manager
Process Supervisor
Maintenance Supervisor
Maintenance Staff
Safety Health and Environment
(SHE) Manager
OHNP Safety (SHE) Administrator
Technical Manager
Lab Controller Lab Analyst
Logistics Manager
Warehouse Manager
Assistance Logistics (Buyer)
Receptionist
Warehouse controller Warehouse store
Stock administrator Driver
PA/ HR
Figure 4.2 The organizational structure of Metallica Chemicals (Pty) Ltd
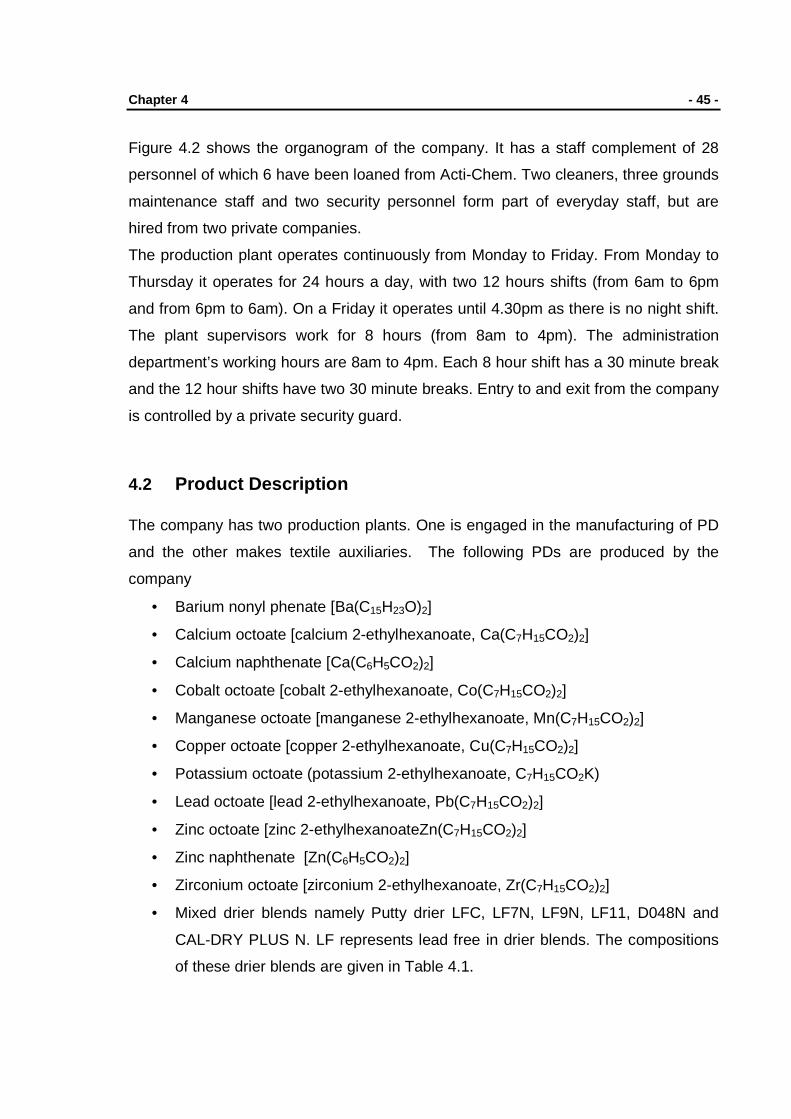
Chapter 4 - 45 -
Figure 4.2 shows the organogram of the company. It has a staff complement of 28
personnel of which 6 have been loaned from Acti-Chem. Two cleaners, three grounds
maintenance staff and two security personnel form part of everyday staff, but are
hired from two private companies.
The production plant operates continuously from Monday to Friday. From Monday to
Thursday it operates for 24 hours a day, with two 12 hours shifts (from 6am to 6pm
and from 6pm to 6am). On a Friday it operates until 4.30pm as there is no night shift.
The plant supervisors work for 8 hours (from 8am to 4pm). The administration
department’s working hours are 8am to 4pm. Each 8 hour shift has a 30 minute break
and the 12 hour shifts have two 30 minute breaks. Entry to and exit from the company
is controlled by a private security guard.
4.2 Product Description The company has two production plants. One is engaged in the manufacturing of PD
and the other makes textile auxiliaries. The following PDs are produced by the
company
• Barium nonyl phenate [Ba(C15H23O)2]
• Calcium octoate [calcium 2-ethylhexanoate, Ca(C7H15CO2)2]
• Calcium naphthenate [Ca(C6H5CO2)2]
• Cobalt octoate [cobalt 2-ethylhexanoate, Co(C7H15CO2)2]
• Manganese octoate [manganese 2-ethylhexanoate, Mn(C7H15CO2)2]
• Copper octoate [copper 2-ethylhexanoate, Cu(C7H15CO2)2]
• Potassium octoate (potassium 2-ethylhexanoate, C7H15CO2K)
• Lead octoate [lead 2-ethylhexanoate, Pb(C7H15CO2)2]
• Zinc octoate [zinc 2-ethylhexanoateZn(C7H15CO2)2]
• Zinc naphthenate [Zn(C6H5CO2)2]
• Zirconium octoate [zirconium 2-ethylhexanoate, Zr(C7H15CO2)2]
• Mixed drier blends namely Putty drier LFC, LF7N, LF9N, LF11, D048N and
CAL-DRY PLUS N. LF represents lead free in drier blends. The compositions
of these drier blends are given in Table 4.1.
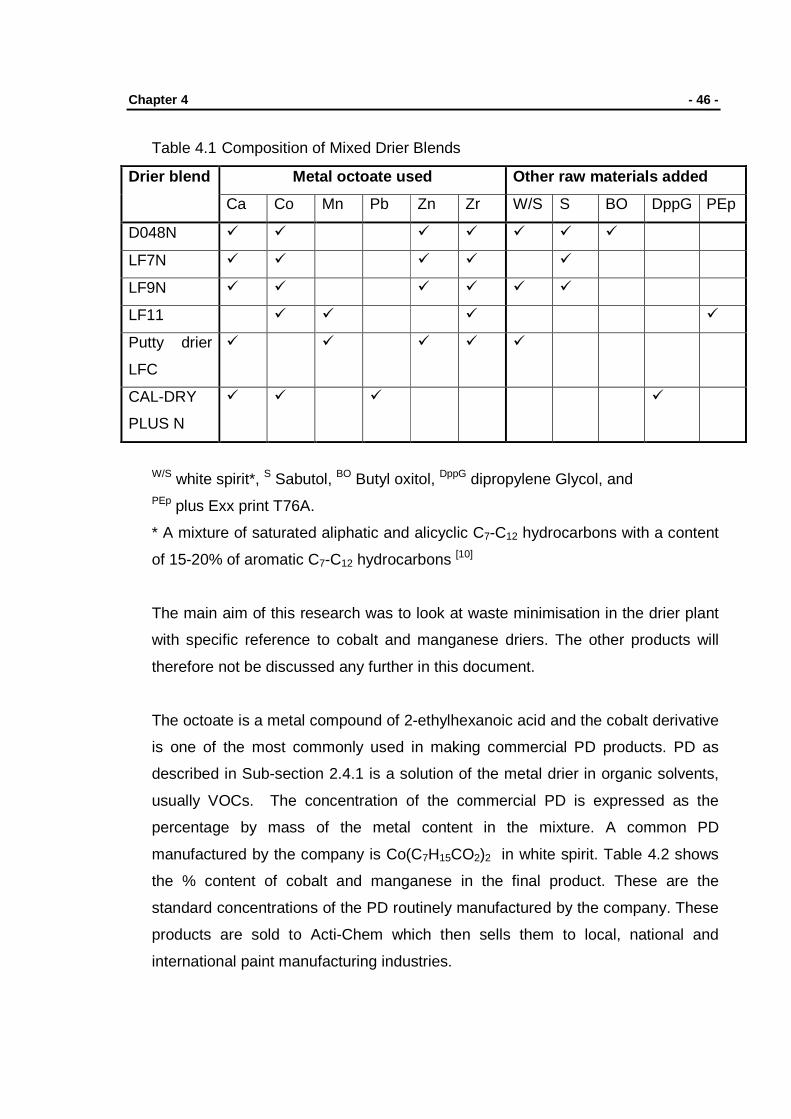
Chapter 4 - 46 -
Table 4.1 Composition of Mixed Drier Blends
Drier blend Metal octoate used Other raw materials added
Ca Co Mn Pb Zn Zr W/S S BO DppG PEp
D048N � � � � � � �
LF7N � � � � �
LF9N � � � � � �
LF11 � � � �
Putty drier
LFC
� � � � �
CAL-DRY
PLUS N
� � � �
W/S white spirit*, S Sabutol, BO Butyl oxitol, DppG dipropylene Glycol, and PEp plus Exx print T76A.
* A mixture of saturated aliphatic and alicyclic C7-C12 hydrocarbons with a content
of 15-20% of aromatic C7-C12 hydrocarbons [10]
The main aim of this research was to look at waste minimisation in the drier plant
with specific reference to cobalt and manganese driers. The other products will
therefore not be discussed any further in this document.
The octoate is a metal compound of 2-ethylhexanoic acid and the cobalt derivative
is one of the most commonly used in making commercial PD products. PD as
described in Sub-section 2.4.1 is a solution of the metal drier in organic solvents,
usually VOCs. The concentration of the commercial PD is expressed as the
percentage by mass of the metal content in the mixture. A common PD
manufactured by the company is Co(C7H15CO2)2 in white spirit. Table 4.2 shows
the % content of cobalt and manganese in the final product. These are the
standard concentrations of the PD routinely manufactured by the company. These
products are sold to Acti-Chem which then sells them to local, national and
international paint manufacturing industries.

Chapter 4 - 47 -
Table 4.2 Cobalt and manganese based PD specifications manufactured by the company
Metal of interest Percent content of metal Cobalt 6 % cobalt naphthenate
6 % cobalt heptanoate 6, 8, 10 or 12 % cobalt octoate
Manganese
6 % manganese naphthenate 8 , 9 or 10 % manganese octoate
However, products can be customized before selling to suit the customer’s PD metal
content specifications. The company also makes six multi-metal blended driers (see
Table 4.1) from a combination of some of the PD. In Section 4.3 the manufacturing
process involving the production of cobalt octoate and manganese octoate PD as well
as modifications made during the process are described. Each finished product is
packaged according the description given in Section 4.5.
4.3 The Manufacturing Process Cobalt products are usually manufactured once or twice per week while manganese
products are made less frequently (once a month or less often). Prior to production
starting on the plant, the plant operator collects a ten page Standard Manufacturing
Formulation Document (SMFD) which accompanies the batch from the start to the
finish of the production process. The contents of this document are described below.
The SMFD is prepared by the production manager for a particular batch to be
manufactured. Information contained on each page is:
• Page 1 gives the Standard Manufacturing Formulation (SMF). This shows the
percentages by mass of all the raw materials to be used and the mass of the
product to be made. This can be considered equivalent to a product
specification sheet.
• Page 2 gives a summary of the manufacturing method in a maximum of six
simple steps, a list of safety precautions to be taken and processing equipment
required. It also shows the operator assigned to this batch by their name and
signature.

Chapter 4 - 48 -
• Pages 3 to 5 give a detailed description of the manufacturing procedure. For
example it includes how and when each raw material should be added, safety
precautions which should be followed, drumming procedures to be followed
while packaging the finished product. The operator has to enter the time when
each step in the process has been completed, how much and the source of,
each substance which has been added to the batch. This involves having
available extensive information on raw material batches, wash wastewater
stored in the flow-bins, part drums of previously manufactured batches and
ullages (finished product used for flushing out delivery pipes).
• Page 6 is a quality control sheet for intermediate and final product testing. This
is completed by the laboratory technician.
• Page 7 is for container and labeling check.
• Page 8 is a batch control form for the operator to record any information on
changes made to the production process as instructed by the laboratory
analyst, and any problems encountered during production.
• Pages 9 to 10 contain the actual amount of raw and recycled (taken from
Pages 3 to 5) material used and products produced. Further, it details
packaging information, the yields and actual concentration of the product to
three significant figures.
4.3.1 Manufacturing process of cobalt octoate
The 12% cobalt PD makes up about 80% of the cobalt-based drier output from the
plant. It is produced as a 3.5 T batch only. The process flow diagram in Figure 4.3
describes the steps involved in the manufacture of cobalt PD at the plant. There are
five steps involved in the production of cobalt-based paint driers. The tasks involved
in each of the five steps of the process in Figure 4.3 will be discussed in this section
in terms of inputs to, output from, control measures in place and operating conditions
used in the production of the cobalt octoate. The whole process, from the moment the
reactor is charged through to the dilution of the final product (see Figure 4.3), takes
about 12 to 16 hours to complete.

Chapter 4 - 49 -
Water
Sodium hydroxide
2-ethylhexanoic acid
White Spirit
Cobalt sulfate heptahydrate
Water layer
Water layer Flow bin
Water
White spirit
Product
Water
White spirit
Mixing and
reacting
Washing
Distilling
Diluting
Separating
Energy
Effluentpit
Figure 4.3 Manufacturing process and source of waste during cobalt paint
drier production
The reaction takes place in a 4000 L reaction vessel Reactor 6 (R6) in the drier plant.
The inside lining of the reactor is stainless steel (see Figure 4.6). The head of this
reactor, shown in Figure 4.4 is accessed from the first floor of the PD‘s production
plant. The body and base lie between the first floor and ground level as shown in
Figure 4.5.

Chapter 4 - 50 -
Figure 4.4 Head of Reactor 6
The first step (mixing and reacting in Figure 4.3) involves charging the reactor with
the starting materials, sodium hydroxide (NaOH), cobalt sulfate heptahydrate
(CoSO4.7H2O), 2-ethyl hexanoic acid (2-EH) and the solvents, water and white spirit.
Figure 4.5 The body of R6 as seen from the ground floor
Water inlet
Condenser
Color coded pipes for steam (white) and cooling (green) water
Distillation collecting flask
SMFD Sheet
Electronic stirrer
Temperature gauge
Reactor jacket [102]

Chapter 4 - 51 -
In the first step a measured amount of water is added through an opening on the
reactor’s head via a hose which is attached to a metered standpipe on the first floor of
the building. If wastewater collected in flow-bins is to be used, this is sucked into the
reactor using a pressure suction pipe situated at the ground floor of the drier plant.
This is closed after additions are completed. This is followed by addition of a
measured amount of 2-EH, which is also sucked into the reactor using a pressure
suction pipe from metal drums. The reaction mixture is stirred using an agitator (see
Figure 4.6 for the cross section of the agitator), while sodium hydroxide is emptied
from 25 kg sacks into the reactor through a delivery chute located on the second floor
(see Figure 4.7). This transfers the NaOH into the reaction vessel where it reacts with
the acidic solution. The reaction is exothermic and the heat released from this
process causes the temperature of the reaction mixture to rise to between 80 oC and
90 oC. The temperature is monitored using the temperature gauge located on the first
floor adjacent to the reactor head. The temperature can be adjusted by opening the
steam or cold taps for heating or cooling the reactor respectively. The steam or cold
water circulates in the reactor jacket.[102] Fumes are also observed coming out
through the chute.
Figure 4.6 The inside of a reactor with blades-like shapes of an agitator
Monitoring of pH to between 7.5 and 8.0 is carried out using phenolphthalein
indicator. This is done by dipping a metal stick inside the reactor through the water
inlet opening. The metal stick is withdrawn with a few drops of the reaction mixture
Blades-like agitator

Chapter 4 - 52 -
which are put on a paper followed by addition of a few drops of phenolphthalein
indicator. Any deviation from the required pH is corrected by addition of acid or base
until the required pH is obtained. The mixture’s temperature is adjusted to 70 oC by
opening the cooling or steam water (see Figure 4.4). Once both the pH and
temperature have been corrected, a measured amount of fresh white spirit is pumped
into the reactor from the flow-bins using a pressure pump located at the ground floor
of the production plant. Before addition of cobalt sulfate (CoSO4.7H2O) a sample of
the mixture is drawn out of the reactor using a 100 ml sample bottle tied to a string.
The sample is taken to the analytical laboratory shown in Figure 4.1 Number 4 for pH
check using pH meter. Cobalt sulfate is then slowly added from 25 kg or 500 kg bags
to the basic reaction mixture through the chute (see Figure 4.7). The chute is located
at the top or second floor. The reaction mixture is stirred for at least 1½ hours after
charging with all raw materials. Then stirring is stopped and the organic (cobalt
octoate) layer in white spirit is left to separate out as the top layer above the lower
aqueous wastewater layer. The aqueous wastewater layer contains the byproduct
sodium sulfate (Na2SO4) and any unreacted starting material. This bottom layer is the
effluent or wastewater that is discharged to the effluent pit by opening the tap as
shown in Figure 4.8.
Figure 4.7 Cobalt sulfate added to the reactor through the chute
In the second step (separating in Figure 4.3), the effluent is drained off through a
manually operated tap in the base of the reactor. The tap is immediately closed when
the purple coloured organic layer containing the desired product is observed leaving

Chapter 4 - 53 -
the reactor (see Figure 4.8). This effluent is sent to the sump (effluent pit) situated at
the back of the production plant.
Figure 4.8 Effluent collected into the flow bin from the reactor
The organic layer containing the product is then washed (Step 3 in Figure 4.3).
A measured amount of mains water is then added into the reactor and stirred
together with the white spirit solution of the product for half an hour. Then
stirring is stopped and the aqueous and organic layers are left to separate. This
takes about one hour to complete. The bottom aqueous layer is then drained
off into the flow-bins (1000 L capacity) (see Figure 4.8).
The mixture is then heated to 140 oC (Step 4 in Figure 4.3) in order to distill off any
excess water remaining in the white spirit solution of the product. The distillate is
collected in a collecting flask adjacent to the head of the reactor (see Figure 4.4) and
later into a drum located on the ground floor of the plant. The top layer (white spirit)
collected during distillation is baled out and reused as a solvent.
In the final step measured fresh white spirit is added to the product in order to dilute it
to the required specification. A sample of the finished product is taken to the
laboratory for metal content check, according to the method described in Section 4.4.
The concentration can be adjusted to the required percent by adding or distilling white
spirit.
Flow-bin

Chapter 4 - 54 -
4.3.2 Manufacturing process of manganese octoate
The 10% manganese octoate product is produced in two batch sizes namely 2.5 T
and 1.8 T. The manganese reactor (R5) has a smaller volume than the cobalt reactor,
R6.
W ater
Versatic acid*
W hite Spirit
M anganese sulfate m onohydrate
W ater layer
W ater
W hite spirit
P roduct M ethanol
M ixing and reacting
D istilling
D iluting
Separating
Energy
E ffluentp it
Sodium hydroxide
2-ethylhexanoic acid
Prio lene acid**
Figure 4.9 Manufacturing process and source of wastewater during manganese octoate paint drier production
Note: *mixture of synthetic carboxylic acid and isomers derived from highly branched C9 and C13 structures
**saturated and unsaturated straight chain aliphatic monocarboxylic acids, Mainly oleic acid

Chapter 4 - 55 -
The production of the manganese octoate paint driers follows the same procedure as
that described for the cobalt octoate manufacturing process. However, there is no
washing of product. As seen from Figure 4.9 the separated product is distilled
immediately after draining the aqueous layer. During the final step which is shown in
Figure 4.9, methanol is added to the final product instead of white spirit which is
added during cobalt octoate production. The entire production process is completed
in 6 to 8 hours after which manganese octoate, a brown product is obtained.
4.3.3 Production modification The procedures described in Sub-sections 4.3.1 and 4.3.2 are basic manufacturing
processes which are stipulated on the SMFD. During production of each batch there
are certain modifications which are made. In some batches wash wastewater
collected in the flow-bins is added as a starting material. For example, the water used
in the reaction can be made up of one third wash wastewater taken from flow-bins
and the balance from mains water. The amount and the origin of the water used are
recorded on the specified page of the SMFD (see Section 4.3). Sometimes prior to
the wash-water being added to the cobalt octoate batch, there is addition of part
drums of products made and/or ullages (this is the term used in the company which
describes the first drawings used to flush out the pipe before packaging takes place)
from earlier batches manufactured. The amount and origin of the product and/or
ullages is recorded on the SMFD too.

Chapter 4 - 56 -
4.4 Process Control The chemistry of the PD production process is quite simple. However, the
manufacturing process used on the plant is quite complex. This arises from the
recycling and reuse of wash wastewater from the flow-bins, part drums and ullages.
Each one these enters the process at different times. For example in Figure 4.3 wash
wastewater from flow-bins is added in Step 1 as a solvent, ullages are also added in
Step 1 just before adding the cobalt sulfate and part drums are added between Step 2
and 3. Because of all these possible variations to the standard procedure formulated,
the process has to be monitored very carefully to ensure that the desired product
concentration is achieved. It becomes extremely tedious to follow up all these
additions while carrying out mass balance. Therefore a number of quality control tests
are run throughout the process.
The production of PDs is sensitive to pH and if this is not properly monitored and
adjusted the reaction cannot take place. Prior to adding the metal sulfate raw
material, the plant operators need to check the pH as well as the temperature of the
reaction mixture. After charging with NaOH, the mixture’s pH is usually around 13 to
14. This pH range is brought down by adding the 2-EH acid. Both the plant operator
and the laboratory carry out checks on the temperature as explained in Sub-
section 4.3.1. The value obtained while checking pH helps the controller/analyst to
determine the amount of acid that needs to be added to bring the pH to between 7.5
and 8.0. After the addition has been made, another sample is drawn from the mixture
and sent back to the laboratory. This is done to ascertain that the correct pH range
has been achieved. The plant operator can then continue with addition of the metal
sulfate. Sometimes, when the correct pH has not been achieved, the process can
warrant the laboratory analyst to carry out an acid/base titration, using 2-EH acid and
phenolphthalein according to Equation 4.1.
NaOH (aq) + C7H15CO2H (l) C7H15CO2Na (aq) + H2O (l) Equation 4.1
99.8 % assay

Chapter 4 - 57 -
The amount of acid required is then calculated based on the size of the batch being
manufactured and the average titration volume of the acid used according to
Equation 4.2.
)g(titrationforusedproductofAmountv)kg(sizeBatch
requiredacidofAmountρ××= Equation 4.2
Where: v is average titration volume (cm3)
ρ (density of 2-ethly hexanoic acid) = 0.91 g/cm3
If the reaction wastewater comes out pinkish, it is a problem that needs to be rectified
by laboratory analysis. This will mean that not all metal sulfates have reacted due to
the shortage of NaOH solution in the reaction mixture. To avoid wasting the sulfate
raw material, NaOH solution will need to be prepared outside the reactor and then
introduced into the reactor.
If the reaction goes to “completion” a sample of the finished product is drawn from the
reactor in a 100 ml bottle for metal specification check. The metal concentration for a
12% cobalt octoate should between 11.8 and 12.2% while that of 10% manganese
octoate is between 9.7 and 10.3%. The adjustment is made by adding more white
spirit or methanol for cobalt or manganese drier respectively. To avoid a situation
where customers will need to dilute the product, the company always keeps the
specification at the lower end 11.8% rather than upper end 12.2% in the case of
cobalt octoate.
The metal content in the final PD product is determined by using titration method
outlined in most literatures.[49, 98, 99, 101] A measured mass of the product is dissolved
in acetic acid. A measured amount of isopropyl alcohol, distilled water and sodium
acetate are added to the mixture. The mixture is subjected to heat until boiling. A
known excess of ethylenediaminetetra-acetic acid (EDTA) is added to the boiling
mixture in order to complex the cobalt metal. Using copper sulfate (CuSO4) titre in the

Chapter 4 - 58 -
presence of 1-pyridyl-2-azonapthol(2) [PAN] indicator back titration is then carried
out. This method is the most favoured because it takes little time to carry out and so
gives a rapid response which is ideal for production control analysis. It is more time
and cost effective than other methods that require decomposition of the PD. Based on
the titration results, the metal content is calculated using Equation 4.3.
1
2211
mDfMm)]VM()VM[(
metalPercent×
××−×= Equation 4.3
Where: M1 and V1 are the molarity and volume of EDTA respectively
M2 and V2 are the molarity and volume of CuSO4 respectively
m1 is the grams of metal octoate product used
Mm is the molar mass of the metal.
Df is the dilution factor used when diluting the final product with acetic acid
4.5 Packaging of product After a sample product has undergone a quality control check by the laboratory
analyst and passed the test, (see Section 4.4), it is ready for packaging. This is done
after it has cooled down to room temperature. The amount is measured using a
calibrated scale (see Figure 4.10). Each scale has a unique identification number
which is recorded on the SFMD. The product is packaged in 25 kg, 190 kg or 215 kg
drum metal or plastic containers. The drums are labeled with labeling that conforms to
South African National Standards (SANS)[88] and eThekwini Municipality Bylaws. The
label must show the extent of hazardous product it contains as shown by Figures 4.10
and 4.11.
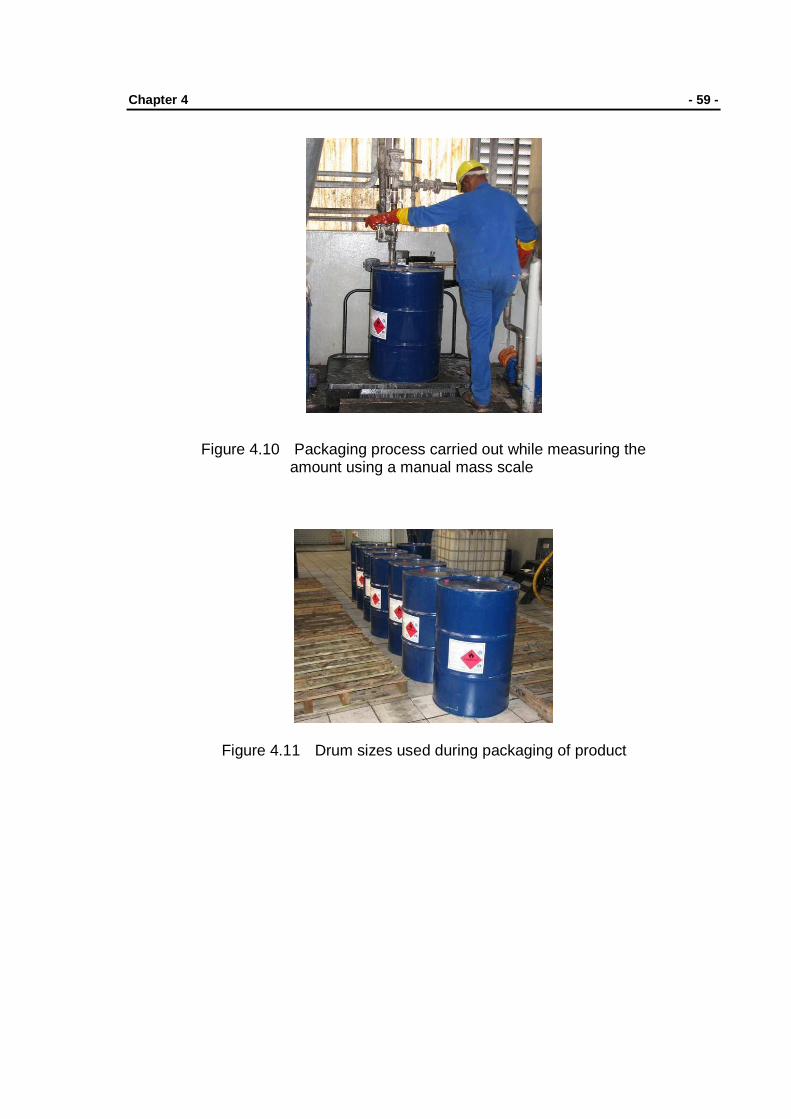
Chapter 4 - 59 -
Figure 4.10 Packaging process carried out while measuring the
amount using a manual mass scale
Figure 4.11 Drum sizes used during packaging of product

Chapter 5
5. Scope and Aims The management of the company decided to optimise the production of the paint
driers (PD) used for surface coatings (paint systems) through waste minimization and
management. This meant improving or replacing the existing manufacturing
technological processes currently being applied. The company’s core business is in
the production of textile chemical auxiliaries and paint driers. It has been found that
the process used for the former product runs relatively waste-free, and earns more
profit for the company than the process used to make paint driers. Consequently, the
company wished to look at ways in which to optimise the production of the paint
driers, making it more efficient and less wasteful. In doing so they expect to enhance
the company’s good image with regard to environmental standing, as well as
minimizing exorbitant disposal costs.
Two particular processes in the PD plant were identified as creating serious waste
problems. These are the production of cobalt and manganese metal driers.
The manganese and cobalt driers are produced according to the metal specification
(described under Sub-section 2.4.2). A fraction of the amount produced by the
company is used in the manufacture of their multi-metal blended driers shown in
Table 4.1.
The products listed in Table 4.2 are manufactured using one of the following methods
which are described in Sub-section 2.4.2.
• Double decomposition (Wet process)
• Fusion method (Dry process)
• Direct metal reaction

Chapter 5 - 61 -
The company is currently following the double decomposition process. This was
chosen after they conducted a comparison study between the wet process and dry
process that revealed that the former is cheaper than the latter. In order to achieve
objectives set by the company, wastewater samples from each production process
were randomly collected. The timing of the sampling was largely dictated by the
process and when it was operational. The objectives of the monitoring strategy
included:
• measurements of concentration of metals (Co and Mn) and sulfates
• determination of trace metals in wastewater
• checking that wastewater discharged conforms to Municipality bylaws
• provide basis for wastewater minimization.
Monitoring was carried out on mains water, reaction wastewater, wash wastewater,
and distillate wastewater. Analytical results were compared with figures calculated
based on the information provided on the SMFD described in Section 4.3. Results
were further subjected to waste minimization techniques described in Section 3.3
which are:
• scoping audit
• mass balance and
• true cost of waste
Information obtained from these three techniques was used to establish potential
environmental priorities and financial savings.
The second part of the project involves a literature study. This involves searching
scientific literature for papers, patents and product information on alternative cleaner
production processes which do not produce waste; looking at wastewater reuse with
or without purification and on reducing or commercialising the sulfate byproduct or
using the waste to formulate a new product.
Chapter 6
6. Monitoring Methodology The monitoring period for the waste minimisation audit carried out at the paint drier
(PD) plant ran from January 2006 to March 2007. The monitoring methodology used
for this audit is considered under two broad headings, namely “sampling” and
“analysis”. Sampling of the industrial process involves two tasks. Firstly it concerns
gathering data and information, both existing and new, about the process. Collection
of existing data is discussed in Section 6.1. Section 6.2 outlines the development of a
sampling strategy for the cobalt and manganese manufacturing processes. The
collection of new data is also discussed from this section onwards. Secondly, the
monitoring of the process using direct reading instruments to measure pH and
conductivity is discussed in Section 6.3. Sections 6.4 through 6.6 describe analysis
(preparation of standards, samples preparation and operation of the analytical
instrument) of samples of the industrial process for elemental concentrations. This
describes chemical analysis, using Inductively Coupled Plasma Optical Emission
Spectrometry (ICP-OES).
6.1 Collection of Existing Data
Data was collected by consulting archived company documents such as the monthly
Metro Bill from eThekweni Municipality and the annual Tax Invoice from EnviroServe.
eThekweni Municipality is the service provider of utilities (electricity and water supply,
and refuse collection). EnviroServe is a private contractor used by the company to
remove, transport and dispose wastewater from the effluent pit. Standard
Manufacturing Formulation Document (SMFD) and Material Safety Data Sheets
(MSDS) on the composition of raw materials and final products were

Chapter 6 - 63 -
obtained for all batches manufactured in the DP plant during the monitoring period.
Additional information was gathered through informal discussion with company
personnel (for example volume of wastewater removed) and by direct observation of
the process. Table 6.1 briefly describes information obtained from each document
used.
Table 6.1 Existing data collected for developing a monitoring strategy Documents consulted Information obtained Source
The Metro Bill (eThekweni Municipality
Water usage rate and cost Administration
Tax Invoice (Enviroserve) Effluent removal volume and cost
Administration
SMFD and MSDS
Raw material usage Product composition Standard control test methods Volume of wastewater removed Safety precautions of each raw material used as well as the products formed
PD plant
Certificates of analysis for raw material
Raw material composition Laboratory
The amounts of raw materials added and/or part drum or product ullages added were
extracted from the SMFD. The amount of reaction wastewater leaving the reactor was
only measured once as there is no meter attached to the outlet pipes. The reaction
wastewater was collected in flow bins (see Figure 4.8), weighed using a manual scale
and thereafter emptied into the effluent pit. This was required in order to ascertain
verbal communications made by the plant operators with regard to amount of
wastewater released per batch. This procedure was found to be counter productive
as it requires the production personnel to collect the wastewater into flow-bins and
thereafter measure the mass collected. In so doing they spend valuable time without
adding anything to the production quantities or efficiency of the processes. Hence the
procedure was only done once on batch number N6 JUN 07 (see Reference
Number 10 on Table 6.2).
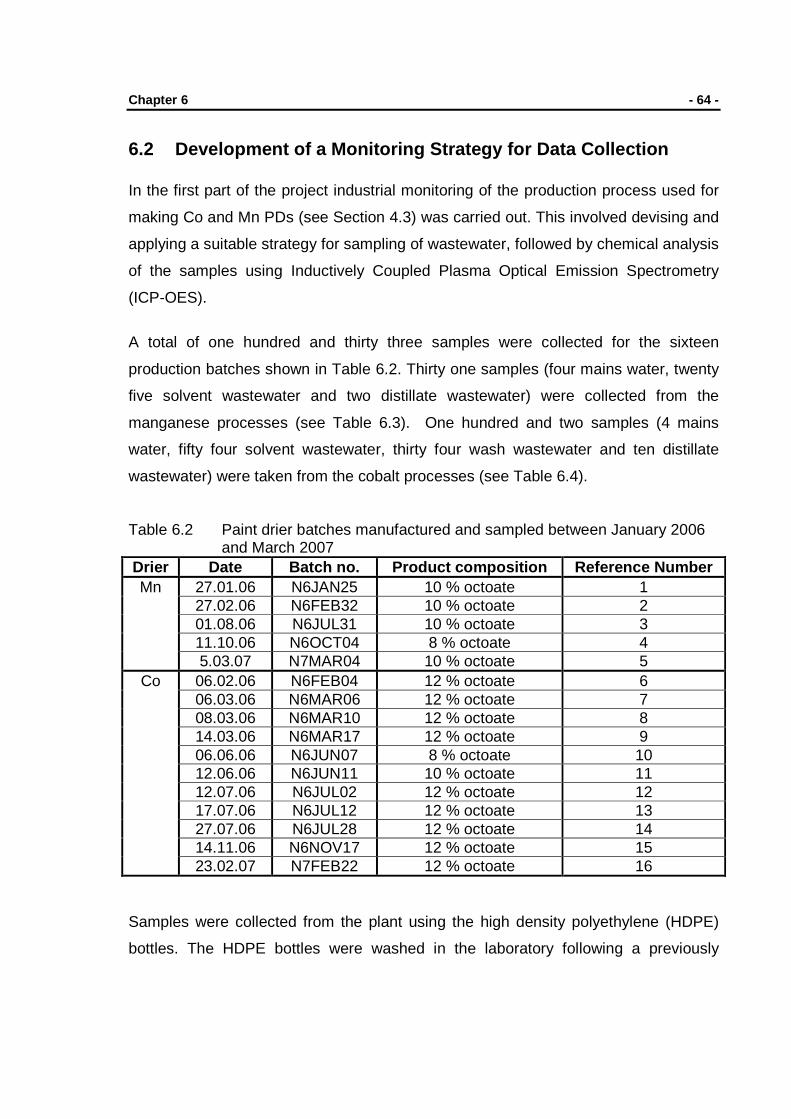
Chapter 6 - 64 -
6.2 Development of a Monitoring Strategy for Data Collection In the first part of the project industrial monitoring of the production process used for
making Co and Mn PDs (see Section 4.3) was carried out. This involved devising and
applying a suitable strategy for sampling of wastewater, followed by chemical analysis
of the samples using Inductively Coupled Plasma Optical Emission Spectrometry
(ICP-OES).
A total of one hundred and thirty three samples were collected for the sixteen
production batches shown in Table 6.2. Thirty one samples (four mains water, twenty
five solvent wastewater and two distillate wastewater) were collected from the
manganese processes (see Table 6.3). One hundred and two samples (4 mains
water, fifty four solvent wastewater, thirty four wash wastewater and ten distillate
wastewater) were taken from the cobalt processes (see Table 6.4).
Table 6.2 Paint drier batches manufactured and sampled between January 2006 and March 2007
Drier Date Batch no. Product composition Reference Number Mn 27.01.06 N6JAN25 10 % octoate 1
27.02.06 N6FEB32 10 % octoate 2 01.08.06 N6JUL31 10 % octoate 3 11.10.06 N6OCT04 8 % octoate 4 5.03.07 N7MAR04 10 % octoate 5
Co 06.02.06 N6FEB04 12 % octoate 6 06.03.06 N6MAR06 12 % octoate 7 08.03.06 N6MAR10 12 % octoate 8 14.03.06 N6MAR17 12 % octoate 9 06.06.06 N6JUN07 8 % octoate 10 12.06.06 N6JUN11 10 % octoate 11 12.07.06 N6JUL02 12 % octoate 12 17.07.06 N6JUL12 12 % octoate 13 27.07.06 N6JUL28 12 % octoate 14 14.11.06 N6NOV17 12 % octoate 15 23.02.07 N7FEB22 12 % octoate 16
Samples were collected from the plant using the high density polyethylene (HDPE)
bottles. The HDPE bottles were washed in the laboratory following a previously

Chapter 6 - 65 -
described procedure.[85, 111-115] At the production plant, each bottle was rinsed twice
with the hot (between 75 oC and 85 oC) aqueous wastewater solution being released
from the process prior to sampling. Besides samples taken from mains water, three
sampling points for cobalt octoate and two sampling points for manganese octoate
were identified. A number of samples were taken from each sampling point. The
sampling points from which the manganese and the cobalt samples were taken are
described in Tables 6.3 and 6.4 respectively.
Table 6.3 Samples collected during the manganese octoate manufacture in Reactor 5
Sample description
Source of Sample Date samples
taken
Number of samples
taken Utility outlet Fresh mains water from tap 27.01.06 1
01.08.06 1 11.10.06 1 5.03.07 1
Solvent wastewater
Manganese containing solvent wastewater discharged from reactor to effluent pit after reaction complete. Water layer after separation in Figure 4.9
27.01.06 1 27.02.06 3 01.08.06 9 11.10.06 7 5.03.07 5
Distillate wastewater
Mixture of wastewater and spirit discharged into a metal drum from reactor during distillation. water collected after distilling in Figure 4.9
27.1.06 1 27.2.06 1
At each specified sampling time for each sampling point, three samples were taken.
The sampling time refers to the time within the discharge period when samples were
taken. Each sample was differentiated from the other using a unique identification
number; the date and the sampling time. Samples were taken at each sampling point
at 15 minutes intervals while the wastewater was being released. About 3.00 ml of
concentrated nitric acid (HNO3) was added to one of the two 125 ml samples from
each sampling point. These samples are called “acidified samples” in this document.
The wastewater samples (see Tables 6.3 and 6.4) were taken as soon after it was
discharged from the reactor as possible, (see Figure 4.8) and immediately stored in a

Chapter 6 - 66 -
cooler box. The distillate for both processes was usually sampled only once. Samples
were then transported back to the laboratory for analysis. The conductivity and pH of
acidified and non-acidified sample solutions were measured. All samples were then
stored in a refrigerator set at 4 oC before further preparation and elemental analysis
were carried out.
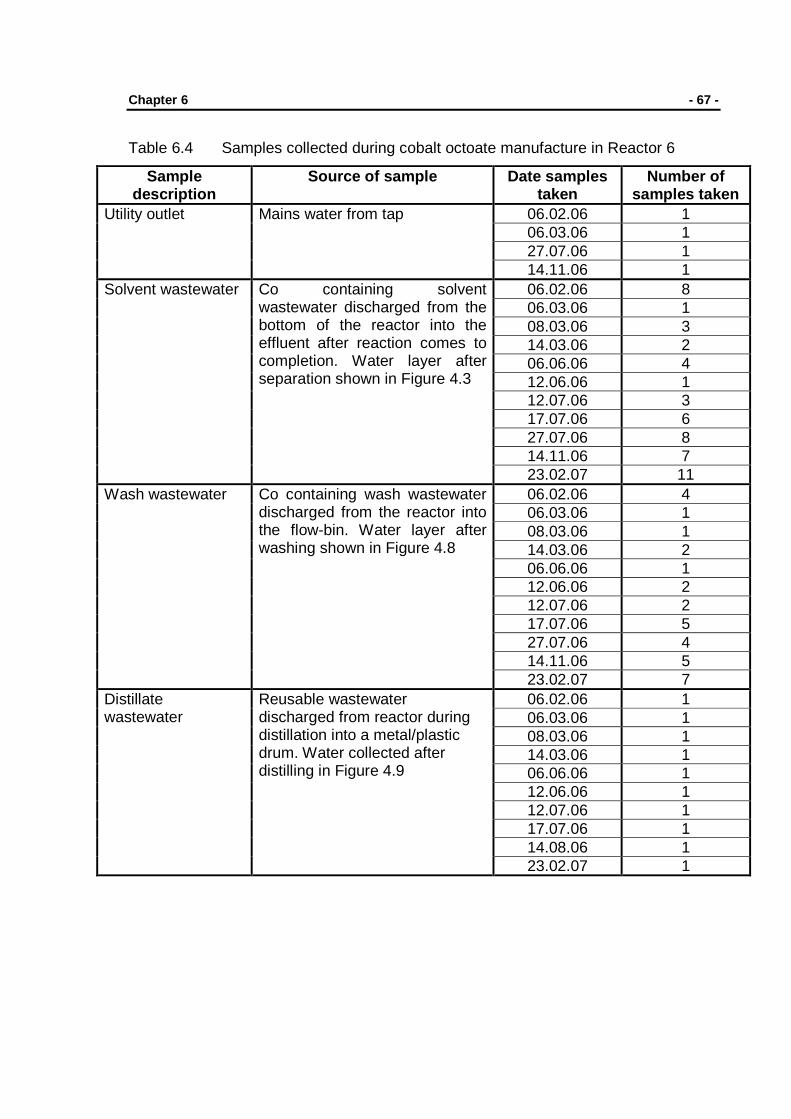
Chapter 6 - 67 -
Table 6.4 Samples collected during cobalt octoate manufacture in Reactor 6
Sample description
Source of sample Date samples taken
Number of samples taken
Utility outlet Mains water from tap 06.02.06 1 06.03.06 1 27.07.06 1 14.11.06 1
Solvent wastewater Co containing solvent wastewater discharged from the bottom of the reactor into the effluent after reaction comes to completion. Water layer after separation shown in Figure 4.3
06.02.06 8 06.03.06 1 08.03.06 3 14.03.06 2 06.06.06 4 12.06.06 1 12.07.06 3 17.07.06 6 27.07.06 8 14.11.06 7 23.02.07 11
Wash wastewater Co containing wash wastewater discharged from the reactor into the flow-bin. Water layer after washing shown in Figure 4.8
06.02.06 4 06.03.06 1 08.03.06 1 14.03.06 2 06.06.06 1 12.06.06 2 12.07.06 2 17.07.06 5 27.07.06 4 14.11.06 5 23.02.07 7
Distillate wastewater
Reusable wastewater discharged from reactor during distillation into a metal/plastic drum. Water collected after distilling in Figure 4.9
06.02.06 1 06.03.06 1 08.03.06 1 14.03.06 1 06.06.06 1 12.06.06 1 12.07.06 1 17.07.06 1 14.08.06 1 23.02.07 1

Chapter 6 - 68 -
6.3 New Data obtained by Direct Reading Instrument
The pH of samples was measured using a pH meter (Model CRISON micropH 2000)
shown in Figure 6.1. This pH meter was calibrated prior to making measurements
using buffer solution (borate) pH 10.00 ± 0.05 at 20 oC and buffer solutions
(phosphate) pH 7.00 ± 0.02 and pH 4.00 ± 0.02 at 20 oC. Thereafter the conductivity
of the samples was measured using Hanna Instrument HI 9033 multi-range
conductivity meter, shown in Figure 6.2. The meter was calibrated using
HIL 7030/500 conductivity calibration solution (potassium chloride) 12880 µS/cm at
25 oC.
Figure 6.1 The Crison micropH 2000 used when measuring sample pH
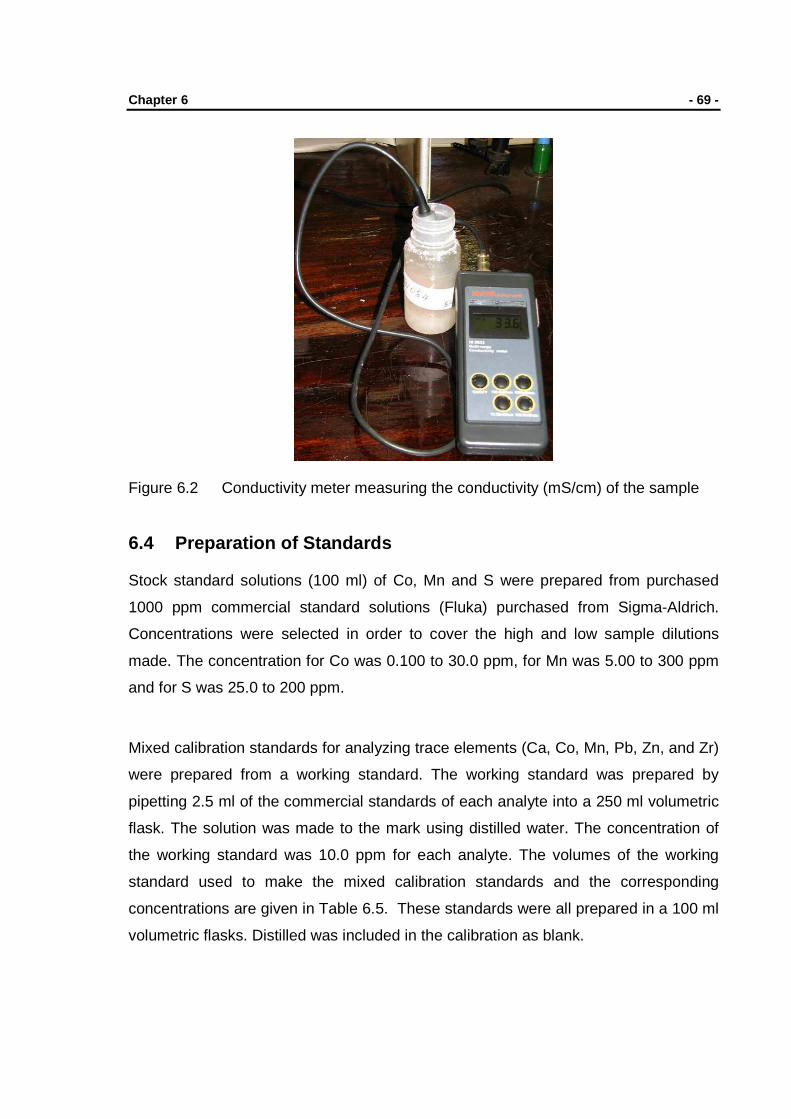
Chapter 6 - 69 -
Figure 6.2 Conductivity meter measuring the conductivity (mS/cm) of the sample
6.4 Preparation of Standards Stock standard solutions (100 ml) of Co, Mn and S were prepared from purchased
1000 ppm commercial standard solutions (Fluka) purchased from Sigma-Aldrich.
Concentrations were selected in order to cover the high and low sample dilutions
made. The concentration for Co was 0.100 to 30.0 ppm, for Mn was 5.00 to 300 ppm
and for S was 25.0 to 200 ppm.
Mixed calibration standards for analyzing trace elements (Ca, Co, Mn, Pb, Zn, and Zr)
were prepared from a working standard. The working standard was prepared by
pipetting 2.5 ml of the commercial standards of each analyte into a 250 ml volumetric
flask. The solution was made to the mark using distilled water. The concentration of
the working standard was 10.0 ppm for each analyte. The volumes of the working
standard used to make the mixed calibration standards and the corresponding
concentrations are given in Table 6.5. These standards were all prepared in a 100 ml
volumetric flasks. Distilled was included in the calibration as blank.

Chapter 6 - 70 -
Table 6.5 Mixed calibration standards used for traces analysis in wastewater Standard number
Concentration (ppm) of mixed calibration standards
Volume of mixed standard used
(ml) Ca Co Mn Pb Zn Zr
1 0.100 0.100 0.100 0.100 0.100 0.100 1.00
2 0.500 0.500 0.500 0.500 0.500 0.500 5.00
3 1.00 1.00 1.00 1.00 1.00 1.00 10.0
4 5.00 5.00 5.00 5.00 5.00 5.00 50.0
5 10.0 10.0 10.0 10.0 10.0 10.0 100
6.5 Preparation of Samples When the samples were released from the reactor and collected in the sampling
bottles they were hot, about 75 oC to 85 oC. On cooling, sodium sulfate crystallized
out. In order to re-dissolve the sodium sulfate crystals, all samples were reheated
prior to dilution on a warm bath as shown in Figure 6.3. This was necessary to
maintain the sample condition at the time of sampling. It was not necessary to filter
samples since the solutions were homogenous and had no solid particles that could
clog the nebulizer. The required sample volume was transferred into a 100 ml
volumetric flask using a calibrated Eppendorf pipette. The volume was made up to the
mark with distilled water. Few sets of sample dilutions were prepared. These had
dilution factors ranging from 4 to 1000.
In order to avoid the problem of the sulfate crystallizing when the samples cooled, an
investigation was made into the feasibility of diluting the wastewater samples at the
plant, before they cooled. However, this did not prove satisfactorily due to the
difficulty of accurately measuring the volume at the plant.

Chapter 6 - 71 -
Figure 6.3 Samples reheated before analysis in order to re-dissolve sulfate crystals
6.6 Chemical Analysis of Samples using ICP–OES Atomic spectrometric techniques[103] received a lot of attention in the early 20th
century through the use of electric arcs and sparks. Several spectrometers are
available nowadays and the analyst or researcher is faced with a wide choice to make
when analyzing samples. The choice of an instrumental analysis technique depends
on various factors, for example
• limitations associated with instrument and
• substance being analysed.
Some of the instruments that are widely used include atomic absorption spectrometry
(AAS), electrothermal atomic absorption spectrometry (ETAAS), inductively coupled
plasma optical emission spectrometry (ICP-OES), laser-excited atomic fluorescence
spectrometry (LEAFS), furnace atomization plasma excitation spectrometry (FAPES),
and many more.[103, 104, 107] All these techniques involve detecting and analyzing
electromagnetic radiation absorbed or emitted by ions or atoms in a sample.
Quantitative (amount or concentration) or qualitative (type of atoms or ions) properties
of samples can be determined. The former depends on the intensity of radiation used
to determine the concentration of analyte of interest in the sample. The latter depends
on the wavelength associated with a particular radiation from which identity of an
analyte is obtained. Analysis of samples in will be carried out using ICP-OES
instrument and hence it is important to describe its components and operation.

Chapter 6 - 72 -
6.6.1 Operation principles of ICP-OES
The ICP-OES instrument used throughout the entire research project was the Varian
720-ES series ICP Optical Emission spectrometer manufactured by Varian Australia
Pty Ltd. Important features of the Varian 720-ES are given in Table 6.6.
Table 6.6 Features of the Varian 720-ES and their use[105, 106] Component Its use Manual and auto sampler. For introducing the sample. 3 channel peristaltic pump. To pump in sample or rinsing solvent into
the instrument. Mass flow regulated glass pneumatic Nebulizer gas control.
It changes the liquid sample into aerosol or mist form.
Spray chamber For removing large droplets in the aerosol and to reduce signal pulsation caused the peristaltic pump
Torch consisting of three concentric tubes.
For delivering aerosol sample & carrier gas (Ar), coolant gas and auxiliary gas into the plasma
Axial plasma To separate solvent from solute, vaporize, atomize, ionize and excite the analyte(s) of interest
Optics (convex lens and concave mirror) For collecting emitted radiation Reflection diffraction grating and spectrometer
Receiving polychromatic radiation and sort it into a monochromatic light
Charge coupled device (CCD) detector It measures the intensity of the radiation
Figure 6.4 The set up of the ICP-OES instrument in the research laboratory
The Cooler
Argon gas tap
Waste collecting container
Auto sampler
The Computer
ICP-OES instrument
Extractor fan

Chapter 6 - 73 -
Samples were introduced into the ICP-OES instrument using an auto sampler. This
was done by pumping samples from the sample tube through a probe and the
connecting tube to the nebulizer by means of a 3 channel peristaltic pump shown in
Figure 6.5. The probe was rinsed after each sample intake using ultra pure water.
Figure 6.5 Represent a 3 channel peristaltic pump used to pump in samples
The region where the liquid sample is changed into an aerosol or mist-like spray
before being swept away by a high pressure flowing argon gas is called a nebulizer.
Two types of nebulizers used in ICP-OES instrument are pneumatic and ultrasonic
nebulizers (USN).[103, 118] Pneumatic nebulizers that are most commonly used, include
concentric, cross-flow, GMK system, flow focusing, a V-groove etc. The choice is
usually dependent on the type of samples being analyzed or one that can produce
high sensitivity and low level of matrix effects. The sea spray Cross-flow pneumatic
nebulizer was used during sample analysis for this research.
The aerosol-argon carrier gas mixture enters the spray chamber where the larger and
finer droplets are separated from each other. Two widely used spray chambers in
ICP-OES are the Twister Cyclonic and the Double pass Scott-type spray chamber.
For this research, the Twister Cyclonic spray chamber was used, see Figure 6.6.
Waste sample leaves the spray chamber through a drain opening at its bottom. The
wastes collect in a plastic bottle container that is emptied when full (see figure 6.4).

Chapter 6 - 74 -
Figure 6.9
Figure 6.6 The Twister Cyclonic spray chamber connected to the nebulizer
During ICP torch ignition stage, i.e. before sample introduction, the RF generator and
the copper coil produces “seed electrons” which ionize the argon gas as shown in
Equation 6.1. Electrons produced further ionize neutral argon atoms. An intense,
brilliant white plasma consisting of argon atoms, electrons and argon ions with
temperature ranging from 6 000 to 10 000 K is formed. The plasma discharge can be
radially viewed (“side-on”) or axially viewed (“end-on”). In this project, axial view of the
plasma was used when analyzing samples.
Ar Ar+ + e- Equation 6.1
On entering this high temperature region, the solvent on the aerosol-argon carrier gas
is evaporated, particles are vaporized and finally atomised. This is called the
preheating zone (PHZ). The atoms are excited and ionized in the region called initial
radiation zone (IRZ) and also in the normal analytical zone (NAZ).[103, 108, 127]
The excited atoms or ions emit energy on returning back to ground state electronic
level. The energy emitted is characteristic of the excited atom or ion. For each atom
Sample flow to the torch
Waste flow to the drain
Ar gas flow to the neubulizer
Pneumatic neubulizer
Twister cyclonic spray chamber

Chapter 6 - 75 -
or ion to be quantified separately, the radiation is dispersed by means of a grating so
that an emission spectrum can be obtained and individual wavelength selected. The
intensity of radiation was measured by the charge-coupled device (CCD) detector.
This is one of the most sensitive and high resolution detector used in spectroscopic
applications. The operating conditions under which samples were analysed by ICP-
OES are given in Table 6.7.
Table 6.7 Used ICP-OES specifications and instrument operating conditions
Specification Condition Rf/operating Power (kW) 1.00
Plasma flow(L/min) 15.0 Auxiliary flow(L/min) 1.50
Pump rate (rpm) 15.0 Pneumatic nebulizer (L/min) 0.75
Instrument stabilization time (s) 15 Rinse time (s) 45
Sample uptake delay (s) 30 Replicates read time (s) 1
Replicates 3 Table 6.8 Selected wavelengths for each analyte Element Major analyte in wastewater Traces
Co Mn S Zn Pb Zr Wavelength (nm)
228.62 230.79 231.16 236.38 237.86 238.89
279.83 293.30 293.93 294.92
178.16 180.67 181.97 182.56
206.20 207.91 213.86
168.15 266.32
267.86 349.62
Note: For each element, intensities at different wavelengths were used to obtain
several different estimates of the concentration. The average concentration (see
Tables 7.12 through 7.27) of the different estimates for each element used was based
on all wavelengths as there were no spectral interferences observed.

Chapter 6 - 76 -
6.7 Instrument and parameters optimization The accuracy and efficiency of any analytical method used while carrying out an
analysis depends on many factors. A review of the literature[108-110, 113, 116, 120-125]
shows that factors such as the concentration of the interfering species, instrument
variables, the presence of concomitants, the analyte line, sample introduction
systems, and many more can greatly compromise the outcomes of the chosen
method. It is for these and many other reasons that the instrument sensitivity and its
parameters had to be optimized. Preliminary analysis was carried out in order to
determine the effect of both instrument parameters and interfering ions on the
intensity of analyte of interest. Procedures followed included matrix matching
methods, standard addition methods and sample dilutions. [126, 127] Results from these
preliminary procedures showed that the interfering ions and matrix effect had a
measurable influence on the sensitivity of the instrument. In order to overcome the
matrix effects, samples were diluted in accordance with the description given in
Section 6.5.
Chapter 7 7. Introduction
This section deals with the results obtained during the entire period the research was
conducted. Results were obtained from two general sources, namely, existing
company documents described in Section 6.1 and new collected data sample
analysis described in Sections 6.2 through 6.7. Results from company documents are
given under Section 7.1 and graphically represented in Appendix B (see Figures B1
through B7). Sections 7.2 and 7.3 describe results obtained from new data. These
cover data from reading instruments, water meters and analytical analysis.
7.1 Results from Existing Data Results from existing data were obtained from the SMFD sheet, Metro Bills from
eThekwini Municipality and the Tax Invoices from EnviroServe. These documents are
described in Table 6.1 while a description of SMFD sheet is provided in Section 4.3.
Table 7.1 gives percent usage of raw materials for the production of each commercial
PDs. Graphic representations of the percent usage of raw materials are given under
Appendix B as well as in Figures 8.1 and 8.2. The percent values given in Table 7.1
were calculated using Equation 7.1.
7.1Equation%100driersallbyusedamountTotaldrierabyusedamountTotal
yearperused
materialrawofPercent×=
Raw materials and costs pertaining specifically to cobalt and manganese driers are
given in Tables 7.2 through 7.5. Water consumption costs provided in Tables 7.3 and
7.5 were calculated using the unit values obtained from the Metro Bill. The unit price
was not constant throughout the entire year and values shown in entries 1, 2 and 3 of
column 3 in Tables 7.3 and 7.5 reflects new rates made during the year. Financial
losses provided in Tables 7.3 and 7.5 were based on the relationship between metal
present in the wastewater and the composition of raw material.

Chapter 7 - 78 -
Table 7.1 Total amounts and corresponding percent of raw materials used during production of each Paint Driers in 2006 Type of metal
*Wat
er, m
3
% w
ater
usa
ge
*2-e
thyl
hexa
noic
aci
d,
kg
% 2
-EH
usa
ge
*Whi
te s
pirit
, L
% W
/S u
sage
*Sod
ium
hyd
roxi
de,
kg
% N
aOH
usa
ge
*Ver
satic
aci
d, L
% V
.A u
sage
*Nap
hthe
nic
acid
, L
% N
. A u
sage
*Met
hano
l, L
% M
etha
nol u
sage
drier
BARIUM 0.00 0.00 0.00 0.00 0.00 0.00 0.00 CALCIUM 0.00 31.31 35.17 0.00 31.10 0.68 15.2 COBALT 84.0 30.80 22.87 86.56 15.13 53.56 0.00 COPPER 3.74 0.66 1.39 1.85 0.00 16.57 0.00 LEAD 0.00 11.25 11.32 0.00 33.79 7.32 0.00 MANGANESE 8.16 3.50 2.41 10.17 3.56 1.86 52.5 POTASSIUM 1.13 2.93 1.15 0.00 1.03 0.00 32.3 SODIUM 2.81 0.62 0.15 1.42 0.14 0.00 0.00 ZINC 0.12 5.23 5.11 0.00 2.33 20.0 0.00 ZIRCONIUM 0.00 13.70 12.96 0.00 12.90 0.00 0.00 DRIER BLENDS 0.00 0.00 7.48 0.00 0.00 0.00 0.00 Total amount used per annum 100 100 100 100 100 100 100
*Amounts (values) used to calculate the percent are NOT shown in line with the confidential agreement signed between the researcher and the company where the project took place.

Chapter 7 - 79 -
Table 7.2 Raw materials used during cobalt paint drier production in 2006 Type of Raw material Amount of each raw material used and cobalt metal l ost per month Total
JAN
(4)
FE
B(5
)
MA
R(7
)
AP
R(3
)
MA
Y(1
2)
JUN
(6)
JUL (
7)
AU
G(8
)
SE
PT
(8)
OC
T(7
)
NO
V(6
)
DE
C(0
)
amount
per
year
Mains Reaction water, m3 9.28 11.4 12.8 5.83 19.6 11.9 10.6 13.5 14.5 8.74 9.48 0 127.6 Flow Bin recycled water, m3 0 0.804 1.95 0 3.06 0 1.33 0 2.78 3.18 2.56 0 15.7 White spirit, L 3673 5484 7420 3844 10468 9387 4505 7234 9078 7337 5588 0 74018 NaOH, kg 2124 2867 3424 1348 5235 2736 2799 3150 3750 2761 2689 0 32883 2-ethyl hexanoic acid, kg 7580 8951 11382 4236 18158 9809 10131 10997 14321 9319 9119 0 114003 Versatic acid, kg 0 959 888 453 786 170 1276 1316 666 444 444 0 7402 L.O.Kerosene, kg 0 0 0 0 7832 0 0 0 0 0 0 0 7832 Cobalt sulfate, kg 7000 9121 11000 4400 17086 9000 9000 10000 12000 9000 8700 0 106307 Cobalt metal used, kg 0 0 Co metal lost, kg 34 55 32 61 240 69 10 26 131 61 16 0 735 Naphthenic acid, kg 613 1021 674 605 570 613 646 0 613 613 613 0 6581
Enerflex 81, kg 1600 2200 1800 1500 1430 1800 1590 0 1500 1972 1780 0 17172 Note: Numbers in parenthesis next to each month represents the number of batches manufactured during that particular month.

Chapter 7 - 80 -
Table 7.3 Total consumption of raw material and amount spent during cobalt driers production Raw Material Total Unit Price, R Total amount Consumption Spent on cobalt drier, R Jan – Jul Aug Sept-Dec per year Mains/Fresh water for reaction, m3 127.6 5.83 5.903 6.27 759 Wastewater used for reaction , m3 15.7 (41.67) 0 (53.42) (95)*
White spirit, L 74018 6.24 461872 Caustic soda flakes (NaOH), kg 32883 3.65 120023 2-ethyl hexanoic acid, kg 114003 12.15 1385136 Versatic acid, kg 7402 9.26 68543 Low Order Kerosene, kg 7832 Not provided Cobalt sulfate, kg 106307 56.44 5999967 Cobalt metal lost, kg 735 [3500]** 56.44 [197540]** Naphthenic acid, kg 6581 Not provided Enerflex 81, kg 17172 Not provided
* Value in parenthesis represents the approximate amount (in Rands) the company saved by using the distillate.
** Value in brackets represents the corresponding amount of cobalt sulfate or the money (in Rands) lost.

Chapter 7 - 81 -
Table 7.4 Raw materials used during manganese paint drier production by the company Type of Raw material Amount of each raw material used and manganese meta l lost per month Total
JAN
(1)
FE
B(1
)
MA
R(3
)
AP
R(2
)
MA
Y(0
)
JUN
(2)
JUL (
2)
AU
G(1
)
SE
PT
(2)
OC
T(3
)
NO
V(0
)
DE
C(1
)
amount
used
per
year
Mains Reaction water, L 1200 937 250 1200 0 1612 2400 0 1200 3600 0 0 12399 White spirit 494 385 857 944 0 861 1057 122 693 2378 0 0 7791 NaOH, kg 375 300 60 375 0 511 742 0 375 1125 0 0 3863 2EH, kg 1069 1048 94 1072 0 1985 2547 0 1478 3674 0 0 12967 Versatic, kg 409 107 0 409 0 409 0 0 0 409 0 0 1743 Mn-sulfate, kg 800 625 125 800 0 1075 1600 0 800 2400 0 0 8225 Mn metal 244 190.63 38.125 244 0 327.88 488 0 244 732 0 0 2509 Mn metal lost 9 13 0.5 20 0 21 6 0 18 50 0 0 138 Methanol 220 172 0 220 0 137 220 0 220 660 0 0 1849 Priolene acid 148 116 0 148 0 201 296 0 148 444 0 0 1501 Naphthenic acid, kg 0 0 229 0 0 0 0 0 0 0 0 0 229
Illuminating paraffin 0 0 0 0 0 0 0 0 0 0 0 350 350 Note: Numbers in parenthesis next to each month represents the number of batches manufactured during that particular month

Chapter 7 - 82 -
Table 7.5 Total consumption of raw material and amount spent during manganese driers production Raw Material Total Unit Price, R Total amount Consumption Paid for manganese drier, R Jan – Jul Aug Sept-Dec per year Mains Reaction water, m3 12.4 5.83 5.903 6.27 74 White spirit, L 7791 6.24 48616 Caustic soda flakes (NaOH), kg 3863 3.65 14100 2-ethyl hexanoic acid, kg 12967 12.15 157549 Versatic acid, kg 1743 9.26 16140 Manganese sulfate, kg 8225 3.50 28788 Manganese metal lost, kg 138 [452]* [3.50] [1582]* Methanol 1849 3.16 5843 Priolene acid 1501 9.00 13509 Naphthenic acid, kg 229 Not provided Illuminating paraffin 350 Not provided
* Value in brackets represents the corresponding amount of manganese sulfate and the money (in Rands) lost.

Chapter 7 - 83 -
The company receives clean water from the eThekwini Municipality which is billed per
month according to the unit price used (see Table 7.3 & 7.5). Table 7.6 gives the
amount of water used by both the production section including the offices that housed
production staff. This information was extracted from the monthly statement the
company receives from the Municipality. Amounts of water used in May and June are
similar, though the charges differ by almost one hundred rands (R100). This was due
to reconnection charges which the company could have avoided by paying the
account timeously and also the fact that the fixed charge was lower in June than in
May. It was not easy to determine how the basic charge is worked out as it fluctuates
from month to month.
Table 7.6 Amount and charges for the use of eThekwini Municipality water
Month Meter reading (m 3)
Water Used (m 3) Amount Paid, R Initial Final JANUARY 37779 38144 365 2661 FEBRUARY
38144
39308
MARCH 1164 8420 APRIL MAY 39308 39717 409 3038 JUNE 39717 40126 409 2912 JULY 40126 40516 390 2835 AUGUST 40516 40984 468 3583 SEPTEMBER 40984 41393 409 3139 OCTOBER 41393 41815 422 3286 NOVEMBER 41815 42144 329 2550 DECEMBER 42144 42565 421 3217 TOTAL AMOUNT OF WATER USED PER YEAR 4786 35641
The percent production of each PD and the drier blends (as described in Table 4.1)
manufactured by the company are provided in Table 7.7. Appendix C gives graphic
representations of the production percentage per annum for each metal drier and
blends. Percent values were calculated based on equation 7.2.

Chapter 7 - 84 -
7.2Equation%100edmanufacturPDallofamountTotal
producedPDofamountTotalyearperproduced
driereachofPercent×=
Table 7.7 Production percents of Paint Driers produced by the company Metal Paint Drier *Amount % % manufactured
of drier blends with respect to
other drier blends
manufactured in manufactured year 2006, with respect kg to all driers Plus blends BARIUM 0.202 CALCIUM 22.4 MANGANESE 2.54 COBALT 17.9 COPPER 0.784 LEAD 11.2 POTASSIUM 1.48 SODIUM 0.388 ZINC 4.16 ZIRCONIUM 10.17 TOTAL AMOUNT OF DRIER BLENDS 28.8
D048N 6.09 21.10 LF7N 8.58 29.73 LF9N 13.1 45.42 LF11 0.292 1.01 CAL-DRY PLUS N 0.325 1.13 PUTTY DRIER LFC 0.467 1.62 TOTAL AMOUNT OF DRIERS PRODUCED PER ANNUM 100 100
*Actual amounts (masses) used to calculate the percent are NOT shown in line with
confidential agreement signed between the research institution and the company.
Total monthly amounts of freshwater used and wastewater removed from the PD
section of the company and percent disposal costs are given in Table 7.8. These
values were obtained from the SMFD documents and Tax Invoices provided by
EnviroServe (described in Table 6.1). A graphic representation of wastewater
collected and percent disposal cost is also shown by Figure D1 in Appendix D.

Chapter 7 - 85 -
Table 7.8 Freshwater used, wastewater disposed and percent of total cost in the drier plant
Month Freshwater Used
(tonnes)
Wastewater Collected (tonnes)
Percent Total Cost (%)
Freshwater Disposal JANUARY 11.18 10.45 0.03 2.23 FEBRUARY 13.57 33.05 0.03 6.87 MARCH 15.36 30.50 0.04 6.59 APRIL 7.23 43.00 0.02 9.04 MAY 21.39 18.45 0.05 4.19 JUNE 13.55 65.95 0.03 13.7 JULY 14.85 43.70 0.04 9.12 AUGUST 14.24 19.80 0.04 4.34 SEPTEMBER 15.70 20.90 0.04 4.46 OCTOBER 13.78 55.90 0.04 14.7 NOVEMBER 10.61 33.45 0.03 8.79 DECEMBER 0.03 60.60 0.00 15.6
*Amounts (values) used to calculate the percent are NOT shown in line with confidential
agreement signed between the research institution and the company.
7.2 Results from reading instruments and municipali ty water meter
Characteristics of Co and Mn samples were determined by measuring the pH and the
conductivity of the sample at the laboratory. Average pH and conductivity results
obtained using measuring instruments shown in Figures 6.1 and 6.2 are tabulated in
Tables 7.9 and 7.10.
A Municipal water meter is few meters away from the entrance to the facility and is
easily accessible without entering the company premises. Water readings were
collected during the first few weeks of the year during weekends when the company
was not in operation. Results from the findings are given in Table 7.11. From these
figures, it is clear that the company is losing a substantial amount of water during
shutdown. The question is, where is the loss occurring and how can it be eliminated?
If the amount is lost through leakage, the picture is even worse than is reflected here
as it means water is also lost during operation.

Chapter 7 - 86 -
Table 7.9 General nature and characteristics of Co wastewater samples, pH and conductivity (mS/cm) at the time of sampling
Parameters Reaction wastewater
Wash wastewater Distillate
Temperature (oC) 80 – 90 50 – 60 80 – 90
Colour Clear – pale pink Clear Clear mixed with white spirit
pH 7.10 – 8.05 7.20 – 7.55 7.00 – 7.10
Conductivity (mS/cm) 80.0 - 150 25.0 – 40.0 0
Co metal (ppm) 100 – 260 5.00 – 100 0
Sulfate (ppm) (1.00 – 11.5) x 104 (0.200 – 0.710) x 104 0
Table 7.10 General nature and characteristics of Mn wastewater samples, pH and
conductivity (mS/cm) at the time of sampling Parameters Reaction
wastewater Distillate
Temperature (oC) 80 – 90 80 – 90
Colour Clear – light brown Clear mixed with white spirit
pH 6.80 – 7.10 7.00 – 7.10
Conductivity (mS/cm) 90 – 150 0
Mn metal (ppm) (2.30 – 5.00) x 103 0
Sulfate (ppm) (0.900 – 1.20) x 105 0
Table 7.11 Amount of water lost during weekends when the plant is not in use Weekend of the year Initial reading, m 3 Final reading, m 3 Amount lost, m 3
18 - 21 January 48125 48136 11 25 - 28 January 48227 48241 14 1 - 4 February 48386 48393 08 15 - 18 February 48543 48551 08 22 - 25 February 48633 48638 05 7 - 10 March 48771 48777 06 16 - 19 May 49721 49730 09 TOTAL AMOUNT OF WATER LOST IN SEVEN WEEKENDS 61
AVERAGE AMOUNT OF WATER LOST PER WEEKEND 8.71

Chapter 7 - 87 -
7.3 Results from Chemical Analysis Tables 7.12 through 7.22 and Tables 7.23 through 7.27 give results obtained when
analysing cobalt and manganese wastewater respectively using ICP-OES instrument.
Instrument operating parameters applied and wavelength lines chosen for analytes
are given in Tables 6.7 and 6.8 respectively. Parts per million (ppm) units were used
to report the elemental concentration in the wastewater samples. Results for cobalt
and manganese wastewater are reported under several dilutions in accordance with
the description provided in Sections 6.5 and 6.7. At each sampling point, whilst the
wastewater was being discharged, several samples were collected in groups of three.
Each group of three was separated in time by 15 minutes. Occasionally, due to
operational reasons, a longer period between groups of samples was necessary.
Depending on the size of the batch being manufactured, the total time for complete
discharge of the reaction wastewater was typically about 2.5 hours. The sample
groupings are designated sequentially by T1, T2, etc. Group T1 being collected first,
followed (15 minutes later) by T2, etc. At least two set of results were recorded for
each sampling grouping, one for acidified (shaded in Tables 7.12 through 7.27) and
another for non-acidified (not shaded) samples. The amount of sulfate in the
wastewater from both processes was established through analysis of sulfur
concentration. Results for sulfur analyte are given in the last column of each table.
The Reference Numbers cited on the table headings for Tables 7.12 through 7.27
correspond to all the batches sampled described in Table 6.2. The abbreviations NM
for “not measured” and ND for “not detected” were used where applicable in
Tables 7.12 through 7.27. Analytical results given in Tables 7.12 through 7.27 are
average concentrations for all wavelengths lines selected which are given in
Table 6.8. The superscript “df” represents the dilution factor used when diluting
samples.
Trace elements described in Section 6.4 were not detected (see Tables 17 and 18 of
Appendix E) in the wastewater for either process and as such were not included when
compiling the results. Cobalt or manganese analyte were not detected in the mains
water and distillate from either process. Results from these sampling points were not
tabulated.

Chapter 7 - 88 -
Table 7.12 Average elemental concentrations (ppm) in non-acidified and acidified samples of reference number 6
Sample Sampling [Co] [S] x 10 4 Source Group 4df 20df 100df 200df 400df Solvent T1 61.7 NM 161 161 159 2.03
wastewater NM 77.5 107 NM NM NM
T2 64.6 NM 163 164 166 1.97 NM 89.1 122 NM NM NM
T3 69.5 NM 175 181 185 2.01 NM 103 138 NM NM NM
T4 68.0 NM 172 175 165 2.04 NM 103 139 NM NM NM
T5 69.0 NM 176 180 180 2.01 NM 104 142 NM NM NM
T6 NM 72.0 99.4 NM NM 2.16 NM 39.9 55.2 NM NM NM
T7 65.6 NM 170 168 170 2.25 NM NM NM NM NM NM
T8 67.2 NM 169 162 168 1.95 NM NM NM NM NM NM
Wash T9 56.3 NM 83.4 81.2 74.2 0.894 wastewater NM NM NM NM NM NM
T10 NM 57.8 62.5 52.3 NM 0.861 NM 34.6 39.1 18.3 NM 0.842
T11 NM 62.9 68.1 43.0 NM 0.824 NM NM 10.7 20.5 NM 0.903
T12 NM 56.8 62.7 52.6 NM 0.866 NM NM 11.4 13.5 NM 0.805
Table 7.13 Average elemental concentrations (ppm) in non-acidified and acidified
samples of reference number 7 Sample Sampling [Co] [S] x 10 4
source Group 4df 20df 100df 200df solvent T1 93.0 NM 233 241 2.01
wastewater NM 96.6 133 NM NM Wash T2 NM 85.3 49.2 47.1 0.852
wastewater NM 79.0 92.6 98.1 0.898

Chapter 7 - 89 -
Table 7.14 Average elemental concentrations (ppm) in non-acidified and acidified samples of reference number 8
Sample Sampling [Co] [S] x 10 4 source Group 4df 20df 100df 400df 800df 100df 800df
solvent wastewater
T1 NM 80.1 NM 107 NM NM NM 47.9 NM NM 119 132 NM 2.63 NM 72.3 NM 99.0 NM NM NM
T2 NM 83.4 NM 111 NM NM NM 48.0 NM NM 130 132 NM 2.66
NM 83.1 NM 110 NM NM NM T3 50.0 NM NM 129 144 NM 2.71
NM 86.1 NM 114 NM NM NM NM 92.3 NM 106 NM NM NM
Wash T4 NM 161 137 139 NM 0.100 NM wastewater NM 92.6 196 210 NM 0.104 NM Note that with the exception of wash wastewater, samples whose results are listed in Table 7.14 were not acidified Table 7.15 Average elemental concentrations (ppm) in non-acidified and acidified
samples of reference number 9
Sample Sampling [Co] [S] x 10 4 source Group 4df 20df 50df 100df 800df 100df 800df solvent T1 46.1 92.8 NM 121 133 NM 2.77
wastewater NM 86.8 NM 118 NM NM NM
T2 50.9 91.2 NM 132 146 NM 2.71
NM 149 NM 170 NM NM NM Wash T3 NM 37.7 151 155 NM 0.621 NM
wastewater NM 61.5 48.1 50.0 NM 0.680 NM T4 NM 65.5 75.5 76.8 NM 0.611 NM
NM 62.3 178 187 NM 0.622 NM
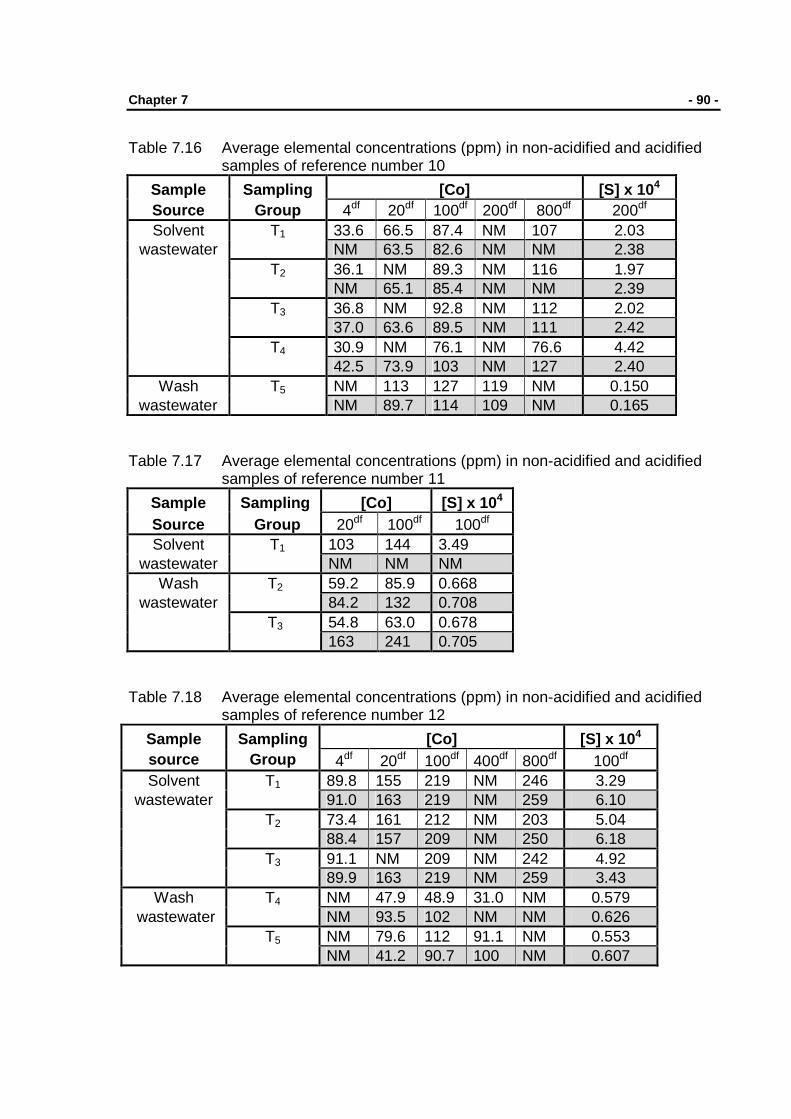
Chapter 7 - 90 -
Table 7.16 Average elemental concentrations (ppm) in non-acidified and acidified samples of reference number 10
Sample Sampling [Co] [S] x 10 4 Source Group 4df 20df 100df 200df 800df 200df Solvent T1 33.6 66.5 87.4 NM 107 2.03
wastewater NM 63.5 82.6 NM NM 2.38
T2 36.1 NM 89.3 NM 116 1.97 NM 65.1 85.4 NM NM 2.39
T3 36.8 NM 92.8 NM 112 2.02 37.0 63.6 89.5 NM 111 2.42
T4 30.9 NM 76.1 NM 76.6 4.42 42.5 73.9 103 NM 127 2.40
Wash T5 NM 113 127 119 NM 0.150 wastewater NM 89.7 114 109 NM 0.165
Table 7.17 Average elemental concentrations (ppm) in non-acidified and acidified
samples of reference number 11
Sample Sampling [Co] [S] x 10 4 Source Group 20df 100df 100df Solvent T1 103 144 3.49
wastewater NM NM NM Wash T2 59.2 85.9 0.668
wastewater 84.2 132 0.708
T3 54.8 63.0 0.678
163 241 0.705 Table 7.18 Average elemental concentrations (ppm) in non-acidified and acidified
samples of reference number 12
Sample Sampling [Co] [S] x 10 4 source Group 4df 20df 100df 400df 800df 100df
Solvent T1 89.8 155 219 NM 246 3.29 wastewater 91.0 163 219 NM 259 6.10
T2 73.4 161 212 NM 203 5.04 88.4 157 209 NM 250 6.18
T3 91.1 NM 209 NM 242 4.92 89.9 163 219 NM 259 3.43
Wash T4 NM 47.9 48.9 31.0 NM 0.579 wastewater NM 93.5 102 NM NM 0.626
T5 NM 79.6 112 91.1 NM 0.553 NM 41.2 90.7 100 NM 0.607

Chapter 7 - 91 -
Table 7.19 Average elemental concentrations (ppm) in non-acidified and acidified samples of reference number 13
Sam
ple
Sou
rce
Sam
plin
g G
roup
[Co] [S] x 10 4
4df 20df 100df 200df 800df 100df
Sol
vent
w
aste
wat
er
T1 75.0 171 225 NM 242 2.05 94.2 180 241 NM 291 6.07
T2 38.4 83.3 104 NM 131 1.89 41.7 79.8 104 NM 128 6.00
T3 33.4 82.0 109 NM 130 1.93 41.9 82.1 109 NM 133 2.34
T4 35.8 71.9 97.7 NM 137 2.02 38.9 75.7 99.9 NM 121 5.91
T5 38.2 74.2 105 NM 141 2.16 41.7 81.1 107 NM 136 3.67
T6 42.0 87.9 115 NM 148 1.97 42.4 81.0 107 NM 132 5.67
Was
h w
aste
wat
er
T7 NM 63.6 71.2 59.4 NM 0.284 NM 4.89 7.76 5.58 NM 0.293
T8 NM NM 38.1 39.7 NM 0.283 NM 2.14 6.92 6.43 NM 0.293 NM 71.9 80.6 52.4 NM 0.274
T9 NM 68.6 75.4 54.2 NM 0.282 NM 21.7 14.3 6.41 NM 0.293
T10 NM 49.9 55.4 46.3 NM 0.289 NM 15.5 16.4 4.23 NM 0.307
T11 NM 73.0 80.5 45.4 NM 0.293 NM 75.0 85.2 54.9 NM 0.299

Chapter 7 - 92 -
Table 7.20 Average elemental concentrations (ppm) in non-acidified and acidified samples of reference number 14
Sam
ple
so
urce
Sam
plin
g
Gro
up [Co] [S] x 10 4
4df 16df 20df 50df 100df 200df 400df 800df 1000
df 100df
Sol
vent
w
aste
wat
er
T1 28.8 52.7 73.6 75.0 84.8 88.6 91 83.8 102 1.81 53.9 98.8 90.8 117 132 139 150 160 165 6.25
T2 40.7 74.8 74.6 92.6 102 110 110 114 116 1.63 50.9 94.3 85.3 111 125 132 142 151 156 6.00
T3 42.8 81.4 75. 7 94.8 104 108 113 114 118 2.00 52.6 98.8 87. 9 114 126 136 145 156 161 5.61
T4 40.8 76.2 74.7 86.7 96.2 103 107 110 116 2.26 51.9 97.1 87.6 111 123 135 144 151 157 6.06
T5 37.2 69.1 73.5 80,0 86.9 73.1 70.7 73.3 73.8 1.66 69.7 130 114 149 162 160 176 189 190 4.98
T6 35.1 62.9 61.6 85.4 88.7 87.1 85.2 85.3 85.1 1.71 54.3 88.6 89.3 118 129 134 139 150 151 6.53
T7 39.0 66.3 68.1 81.7 92.9 84.5 82.5 80.7 82.9 2.25 48.5 77.8 81.6 116 117 121 128 134 142 6.67
T8 46.7 75.8 57.8 101 112 99.6 95.8 92.1 92.2 1.57 224 381 375 489 547 556 593 628 625 2.14
Was
h
was
tew
ater
T9 NM 133 150 143 169 82.6 NM NM NM 0.230 NM 18.9 13.0 23.4 18.0 15.0 NM NM NM 0.271
T10 NM 164 192 176 217 104 NM NM NM 0.273 NM 42.5 11.2 46.1 35.0 27.0 NM NM NM 0.267
T11 NM 137 NM 147 123 86.6 NM NM NM 0.231 NM 37.4 24.6 83.7 70.0 52.0 NM NM NM 0.251
T12 NM 206 228 223 272 144 NM NM NM 0.378 NM 53.9 12.5 109 96.8 70.9 NM NM NM 0.256

Chapter 7 - 93 -
Table 7.21 Average elemental concentrations (ppm) in non-acidified and acidified samples of reference number 15
Sam
ple
sour
ce
Sam
plin
g G
roup
[Co] [S] x 10 4
4df 20df 40df 100df 200df 400df 800df 200df 400df
Sol
vent
w
aste
wat
er
T1 66.2 143 NM 196 NM 203 185 NM 2.38 75.0 152 NM 221 NM 268 267 NM 3.63
T2 67.5 138 NM 199 NM 206 185 NM 2.38 81.5 160 NM 229 NM 263 259 NM 3.57 NM NM 177# 207# 228# 245# 258# NM 2.68#
T3 62.5 144 NM 188 NM 191 176 NM 2.36 76.4 148 NM 215 NM 246 243 NM 3.56 NM NM 176# 195# 185# 184# 186# NM 2.44#
T4 70.3 146 NM 196 NM 191 186 NM 2.36 78.1 148 NM 212 NM 235 241 NM 3.50 NM NM 184# 195# 195# 215# 179# NM 2.53#
T5 73.7 145 NM 194 NM 195 186 NM 2.35 77.7 148 NM 217 NM 229 238 NM 3.58 NM NM 176# 189# 196# 194# 181# NM 2.51#
T6 71.0 142 NM 196 NM 190 185 NM 2.35 79.8 147 NM 214 NM 227 251 NM 3.54 NM NM 180# 193# 190# 182# 167# NM 2.50#
T7 71.2 139 NM 189 NM 189 181 NM 2.32 192 349 NM 523 NM 557 576 NM 3.47 NM NM 167# 184# 185# 175# 176# NM 2.49#
Was
h
was
tew
ater
T8 62.2 84.4 NM 66.7 52.8 NM NM 0.453 NM 4.87 12.3 NM 12.2 9.56 NM NM 0.450 NM
T9 35.8 68.3 NM 39.2 31.6 NM NM 0.442 NM 5.85 9.07 NM 8.35 8.11 NM NM 0.457 NM
T10 62.4 76.4 NM 70.4 56.8 NM NM 0.456 NM 8.80 5.30 NM 16.6 18.2 NM NM 0.461 NM
T11 107 125 NM 133 109 NM NM 0.448 NM 11.6 3.66 NM 25.1 28.4 NM NM 0.459 NM
T12 145 221 NM 188 160 NM NM 0.457 NM 7.06 7.36 NM 6.96 6.32 NM NM 0.461 NM
# Samples diluted at the production plant. Note that results from these samples were not used as explained in Section 6.5.

Chapter 7 - 94 -
Table 7.22 Average elemental concentrations (ppm) in non-acidified and acidified samples of reference number 16
Sample Sampling [Co] [S] x 10 4 source Group 4df 100df 400df 800df 100df 800df
Solvent T1 31.1 68.2 69.6 74.1 NM 2.60 Wastewater NM NM NM NM NM NM
T2 47.4 119 122 124 NM 2.57 60.6 139 163 178 NM 3.91
T3 52.0 119 129 192 NM 2.56 55.9 134 147 171 NM 3.99
T4 53.5 122 127 128 NM 2.54 54.5 134 155 168 NM 3.95
T5 54.5 128 133 138 NM 2.58 56.4 140 162 178 NM 3.97
T6 53.4 125 130 133 NM 2.52 55.9 137 159 172 NM 3.95
T7 50.6 121 126 130 NM 2.57 54.1 135 156 169 NM 3.93
T8 56.7 139 145 211 NM 2.57 54.0 138 161 174 NM 3.97
T9 30.2 111 115 118 NM 2.56 50.4 128 151 179 NM 3.92
T10 49.9 121 128 131 NM 2.54 55.7 143 168 181 NM 3.93
T11 73.8 186 198 201 NM 2.56 NM NM NM NM NM NM
Wash T12 NM 95.3 NM NM 0.200 NM wastewater NM 44.8 NM NM 0.201 NM
T13 NM 89.7 NM NM 0.202 NM
NM 42.5 NM NM 0.202 NM T14 NM 94.5 NM NM 0.201 NM
NM 40.8 NM NM 0.200 NM T15 NM 259 NM NM 0.197 NM
NM 71.9 NM NM 0.202 NM T16 NM 137 NM NM 0.197 NM
NM 66.0 NM NM 0.200 NM T17 NM 196 NM NM 0.201 NM
NM 148 NM NM 0.200 NM T18 NM 341 NM NM 0.201 NM
NM 321 NM NM 0.202 NM

Chapter 7 - 95 -
Table 7.23 Average elemental concentrations (ppm) in non-acidified and acidified samples of reference number 1
Sample Sampling [Mn] x 10 3 [S] x 10 5 source Group 20df 100df 200df 400df 800df 1000df 800df 1000df
Solvent T1 3.12 3.61 4.91 4.92 4.94 4.87 1.08 1.11 wastewater 3.33 4.54 NM NM
4.06 5.88 NM NM Table 7.24 Average elemental concentrations (ppm) in non-acidified and acidified
samples of reference number 2 Sample Sampling [Mn] x 10 3 [S] x 10 5 source Group 20df 100df 200df 400df 800df 1000df 800df 1000df
Solvent T1 1.77 2.31 NM NM wastewater 1.99 2.16 2.87 2.89 2.87 2.86 1.07 1.09
1.61 1.70 2.26 2.27 2.27 2.29 1.08 1.11 T2 1.62 2.10 NM NM 2.07 2.26 2.98 2.96 3.01 2.95 1.04 1.08 1.68 2.20 NM NM T3 2.07 2.73 NM NM 1.84 1.98 2.61 2.62 2.63 2.60 1.04 1.08 1.66 2.13 NM NM

Chapter 7 - 96 -
Table 7.25 Average elemental concentrations (ppm) in non-acidified and acidified samples of reference number 3
Sample Sampling [Mn] x 10 3 [S] x 10 5 source Group 20df 100df 200df 400df 800df 1000df 800df 1000df
wastewater T1 2.15 2.80 NM NM 2.73 3.64 NM NM
T2 1.91 2.04 2.71 2.72 2.77 2.70 0.989 1.02 1.75 1.83 2.46 2.46 2.48 2.48 1.06 1.09 1.98 2.65 NM NM
T3 1.77 1.88 2.54 2.52 2.52 2.54 1.01 1.03 1.68 1.78 2.48 2.48 2.45 2.45 1.09 1.11
3.16 2.38 NM NM T4 1.79 1.90 2.57 2.57 2.57 2.56 1.02 1.04 1.72 1.84 2.45 2.45 2.45 2.43 1.06 1.08
1.74 1.83 2.45 2.45 2.49 2.49 1.10 1.14 T5 1.77 1.88 2.54 2.54 2.56 2.56 1.02 1.03
1.75 2.26 NM NM 1.85 2.40 NM NM
T6 1.77 1.88 2.52 2.52 2.54 2.54 1.03 1.04 1.72 1.85 2.44 2.44 2.45 2.43 1.04 1.05 1.76 1.84 2.51 2.51 2.55 2.54 1.06 1.09
T7 1.78 1.89 2.52 2.52 2.54 2.53 0.992 1.01 1.86 1.86 2.46 2.46 2.48 2.45 1.02 1.04 1.81 1.96 2.63 2.63 2.64 2.64 1.07 1.09
T8 1.91 1.88 2.48 2.48 2.50 2.50 1.02 1.03 T9 1.76 1.72 2.27 2.27 2.31 2.30 1.07 1.09
1.65 2.08 NM NM 1.82 2.37 NM NM

Chapter 7 - 97 -
Table 7.26 Average elemental concentrations (ppm) in non-acidified and acidified samples of reference number 4
Sample Sampling [Mn] x 10 3 [S] x 10 5 source Group 20df 100df 200df 400df 800df 1000df 800df 1000df
Mains water ND ND Solvent T1 3.12 3.16 4.24 4.24 4.27 4.27 1.07 1.11
wastewater 3.11# 3.16# 4.32# 4.32# 4.35# 4.42# 1.11# 1.12#
3.18 4.28 NM NM T2 3.05 3.16 4.20 4.21 4.21 4.23 1.06 1.07
3.16# 3.22# 4.32# 4.35# 4.37# 4.36# 1.07# 1.09#
3.10 3.18 4.29 4.29 4.37 4.40 1.08 1.09 T3 3.07 3.14 4.20 4.20 4.24 4.20 1.06 1.08
3.16# 4.25# NM NM 3.16 4.22 NM NM
T4 3.01 3.12 4.18 4.18 4.21 4.23 1.08 1.09 3.22# 4.34# NM NM 3.08 4.14 NM NM
T5 3.03 3.17 4.15 4.15 4.19 4.23 1.06 1.07 3.11# 4.23# NM NM
T6 3.04 3.16 4.20 4.22 4.27 4.23 1.09 1.09 3.16# 4.31# NM NM 3.08 4.14 NM NM
T7 3.06 3.12 4.10 4.11 NM 4.14 0.843 1.30 3.09# 4.19# NM NM 3.03 4.03 NM NM
# Samples diluted at the production plant. Note that results from these samples were not used as explained in Section 6.5.
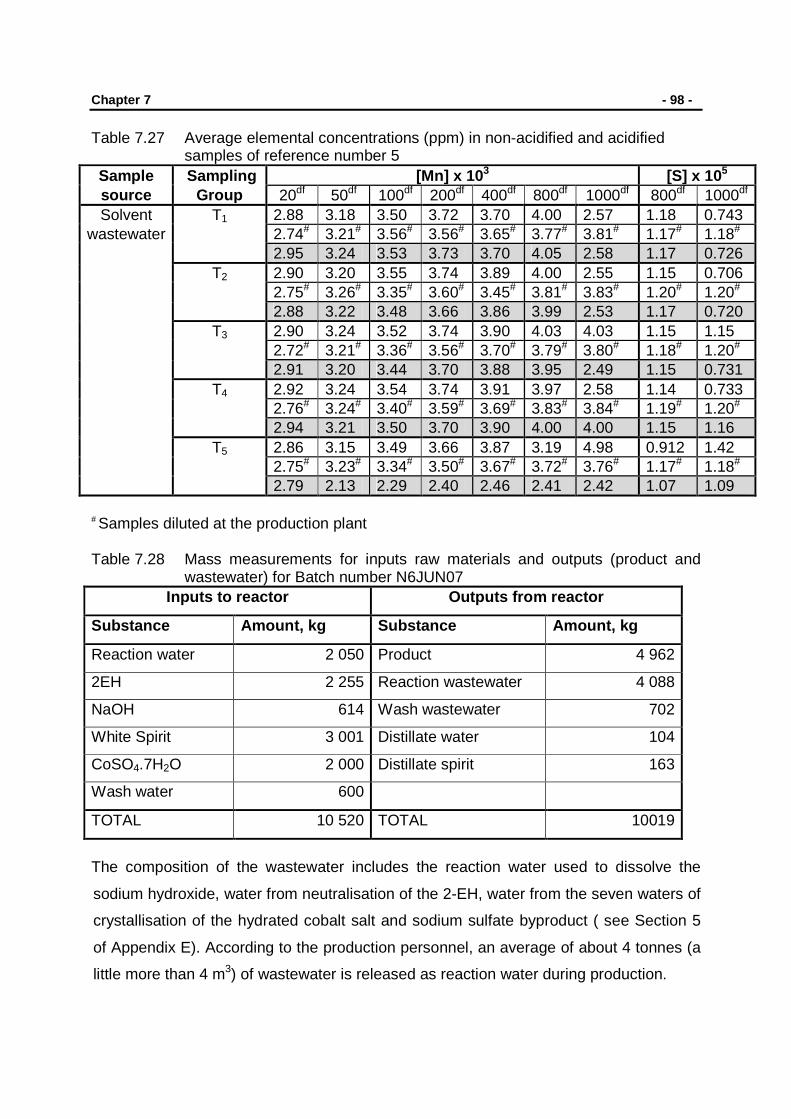
Chapter 7 - 98 -
Table 7.27 Average elemental concentrations (ppm) in non-acidified and acidified samples of reference number 5
Sample Sampling [Mn] x 10 3 [S] x 10 5 source Group 20df 50df 100df 200df 400df 800df 1000df 800df 1000df
Solvent T1 2.88 3.18 3.50 3.72 3.70 4.00 2.57 1.18 0.743 wastewater 2.74# 3.21# 3.56# 3.56# 3.65# 3.77# 3.81# 1.17# 1.18#
2.95 3.24 3.53 3.73 3.70 4.05 2.58 1.17 0.726 T2 2.90 3.20 3.55 3.74 3.89 4.00 2.55 1.15 0.706
2.75# 3.26# 3.35# 3.60# 3.45# 3.81# 3.83# 1.20# 1.20#
2.88 3.22 3.48 3.66 3.86 3.99 2.53 1.17 0.720 T3 2.90 3.24 3.52 3.74 3.90 4.03 4.03 1.15 1.15
2.72# 3.21# 3.36# 3.56# 3.70# 3.79# 3.80# 1.18# 1.20#
2.91 3.20 3.44 3.70 3.88 3.95 2.49 1.15 0.731 T4 2.92 3.24 3.54 3.74 3.91 3.97 2.58 1.14 0.733
2.76# 3.24# 3.40# 3.59# 3.69# 3.83# 3.84# 1.19# 1.20#
2.94 3.21 3.50 3.70 3.90 4.00 4.00 1.15 1.16 T5 2.86 3.15 3.49 3.66 3.87 3.19 4.98 0.912 1.42
2.75# 3.23# 3.34# 3.50# 3.67# 3.72# 3.76# 1.17# 1.18#
2.79 2.13 2.29 2.40 2.46 2.41 2.42 1.07 1.09 # Samples diluted at the production plant Table 7.28 Mass measurements for inputs raw materials and outputs (product and
wastewater) for Batch number N6JUN07 Inputs to reactor Outputs from reactor
Substance Amount, kg Substance Amount, kg
Reaction water 2 050 Product 4 962
2EH 2 255 Reaction wastewater 4 088
NaOH 614 Wash wastewater 702
White Spirit 3 001 Distillate water 104
CoSO4.7H2O 2 000 Distillate spirit 163
Wash water 600
TOTAL 10 520 TOTAL 10019
The composition of the wastewater includes the reaction water used to dissolve the
sodium hydroxide, water from neutralisation of the 2-EH, water from the seven waters of
crystallisation of the hydrated cobalt salt and sodium sulfate byproduct ( see Section 5
of Appendix E). According to the production personnel, an average of about 4 tonnes (a
little more than 4 m3) of wastewater is released as reaction water during production.
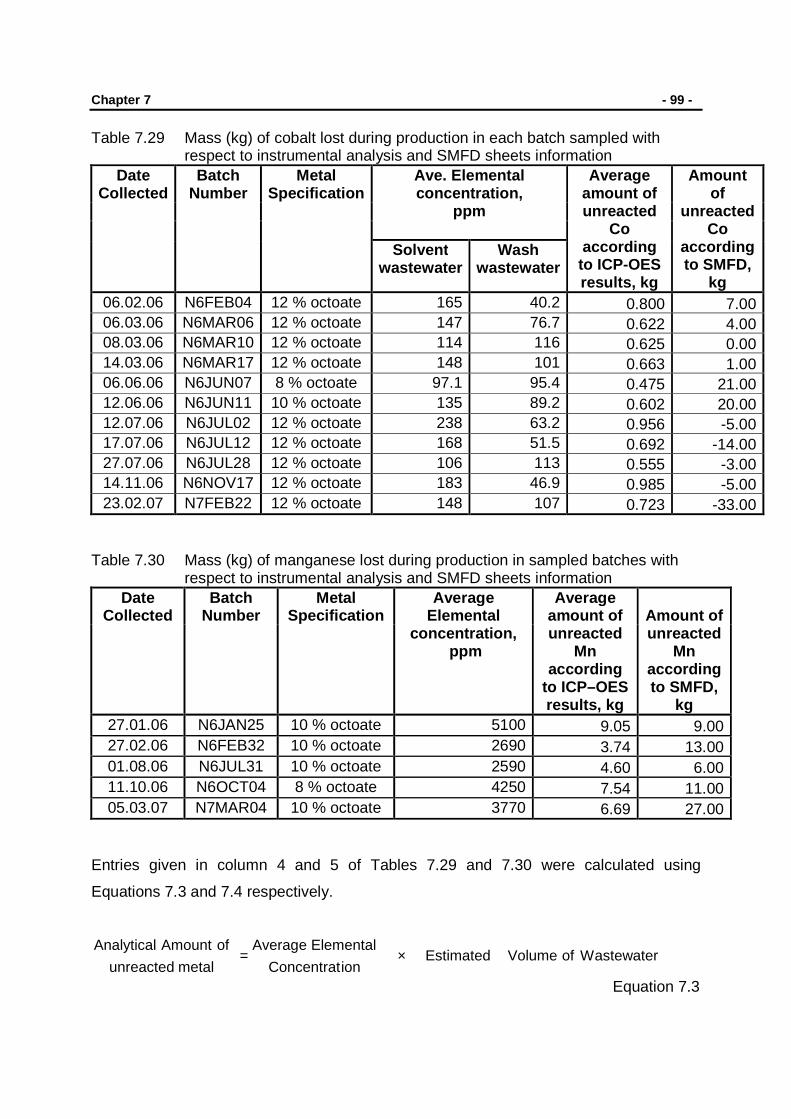
Chapter 7 - 99 -
Table 7.29 Mass (kg) of cobalt lost during production in each batch sampled with respect to instrumental analysis and SMFD sheets information
Date Collected
Batch Number
Metal Specification
Ave. Elemental concentration,
ppm
Average amount of unreacted
Co according to ICP-OES results, kg
Amount of
unreacted Co
according to SMFD,
kg
Solvent wastewater
Wash wastewater
06.02.06 N6FEB04 12 % octoate 165 40.2 0.800 7.00 06.03.06 N6MAR06 12 % octoate 147 76.7 0.622 4.00 08.03.06 N6MAR10 12 % octoate 114 116 0.625 0.00 14.03.06 N6MAR17 12 % octoate 148 101 0.663 1.00 06.06.06 N6JUN07 8 % octoate 97.1 95.4 0.475 21.00 12.06.06 N6JUN11 10 % octoate 135 89.2 0.602 20.00 12.07.06 N6JUL02 12 % octoate 238 63.2 0.956 -5.00 17.07.06 N6JUL12 12 % octoate 168 51.5 0.692 -14.00 27.07.06 N6JUL28 12 % octoate 106 113 0.555 -3.00 14.11.06 N6NOV17 12 % octoate 183 46.9 0.985 -5.00 23.02.07 N7FEB22 12 % octoate 148 107 0.723 -33.00
Table 7.30 Mass (kg) of manganese lost during production in sampled batches with
respect to instrumental analysis and SMFD sheets information Date
Collected Batch
Number Metal
Specification Average
Elemental concentration,
ppm
Average amount of unreacted
Mn according
to ICP–OES results, kg
Amount of unreacted
Mn according to SMFD,
kg 27.01.06 N6JAN25 10 % octoate 5100 9.05 9.00 27.02.06 N6FEB32 10 % octoate 2690 3.74 13.00 01.08.06 N6JUL31 10 % octoate 2590 4.60 6.00 11.10.06 N6OCT04 8 % octoate 4250 7.54 11.00 05.03.07 N7MAR04 10 % octoate 3770 6.69 27.00
Entries given in column 4 and 5 of Tables 7.29 and 7.30 were calculated using
Equations 7.3 and 7.4 respectively.
WastewaterofVolumeEstimatedionConcentrat
ElementalAverage
metalunreacted
ofAmountAnalytical×=
Equation 7.3
Chapter 7 - 100 -
oductPrtheinMetalofAmountusedMetalofAmountmetalunreacted
ofAmountlTheoretica−=
Equation 7.4 Since results for cobalt solvent wastewater between acidified and non-acidified samples
were significantly different (see Figure 8.8), the average elemental concentration was
based only on non-acidified samples. Non-acidified samples were considered to better
represent the original nature of the wastewater on the time of release than acidified ones
(see Figure 8.10). Observation made on the analytical results (see Tables 7.12 through
7.22) shows that suppression of analyte intensity was stable for solutions with dilution
factors ranging between 200 and 800 fold. Analytical results used when compiling
Table 7.29 were based on one of these dilutions. This was done in line with preliminary
investigations that revealed that at more than 100 fold dilutions there was less matrix
interference. On the other hand there was no significant difference in the results for
acidified and non-acidified for cobalt wash wastewater and for manganese reaction
wastewater. Hence, average elemental results reflected for cobalt wash wastewater and
manganese reaction wastewater (see Tables 7.29 and 7.30) were based on results for
both acidified and non-acidified samples. Results obtained from samples that were
diluted in the production plant were not used because of the uncertainty of the measured
volume of the hot solution.
7.4 Sodium sulfate by-product purity The research team was also mandated to identify alternative cleaner production
methods or ways to reduce the level of wastewater in the paint drier plant. In order to
address this problem, the water going into and leaving the reactor as wastewater was
characterized as shown by the results given in Tables 7.12 to 7.28. Another major
problem that was faced by the company was the hard labour time it took the wastewater
removal company while digging the sulfate that had crystallized out from the effluent pit.
This cleaning process, which takes long to complete, translated to more expenses that
the company is required to pay. The company wished to determine if they can
commercialize the wastewater in its usual state or use it to produce a valuable
commercial product. As a way of responding to this problem, the research team carried
out experimental tests on the wastewater with the hope of retrieving the sulfate from

Chapter 7 - 101 -
wastewater in the form of sodium sulfate. To do this, fourteen samples were randomly
selected from a total of hundred and thirty three.
Selected samples were removed from the refrigerator and left on the laboratory bench
overnight. This was necessarily in order to loosen the sulfate salt without reheating as
the process could re-dissolve most of the sodium sulfate. The mother liquor was
carefully decanted into a clean HDPE bottle. The remaining contents were vigorously
shaken up to loosen them up again. The contents were then poured onto a No. 1
qualitative filter paper (Whatman®) placed on a white porcelain Buchner funnel which
was attached to a vacuum pump set at 400 mmHg. The liquid was filtered and the white
crystals were washed three times with about 50.0 ml distilled water. Crystals were
carefully removed from the funnel and poured into a clean 250 ml beaker. The beaker
and its contents were placed in an oven set at 115 oC for 48 hours in order to remove
excess moisture. The dried salt, in its container was cooled and stored in a desiccator
until further investigations were carried out.
The salt was checked for its purity by dissolving a measured amount (see column 2 of
Tables 7.31 and 7.32) into a clean 100 ml volumetric flask with distilled water. Solutions
made from salt obtained from cobalt wastewater were clear whereas solution made
using salt from manganese wastewater had a brown-to-colourless like droplets floating.
These were separated from the clear solution using of a separating funnel. The solutions
were then analysed for the presence of cobalt and manganese from cobalt and
manganese wastewater respectively. Section 6.5 shows the need to dilute solutions with
high sulfate concentration. However diluting the solutions would have compromised the
ability of the instrument to detect the presence of cobalt or manganese at very low
concentrations. Therefore, solutions were not diluted in order to reduce analyte intensity
suppression by the amount of sulfate.
Analytical results obtained from these randomly selected samples are shown in
Tables 7.31 and 7.32. The emphasis of the results was on quality rather than quantity of
the sulfate salt obtained. Table 7.31 represents results from cobalt wastewater while
Table 7.32 represents results from manganese wastewater. Cobalt reaction wastewater
was used for trial purpose as it contains a “large amount” of unreacted metal compared
to wash wastewater. Results listed in column three of Tables 7.31 and 7.32 were
obtained through analysis using the ICP–OES instrument while values listed in column
four were calculated using Equation 7.5.

Chapter 7 - 102 -
%100used4SO2NaofMass
solutionofvolumeionConcentrat4SO2Naofamounttheinmetalof% ××=
Equation 7.5
Table 7.31 Elemental composition from sulfate retrieved from Co wastewater
Sample ID Mass of Na 2SO4 (g)
dissolved in 100 ml
[Co] ppm % of Co in
Na2SO4
Corrected % of
Co in Na 2SO4
MV 21 6 1.07 0.0018 0.0029 MV 29 6 0.624 0.0010 0.0017 MV 101 10 1.18 0.0012 0.0020 MV 172 10 0.849 0.00085 0.0014 MV 273 10 0.117 0.00012 0.00019 MV 292 10 0.430 0.00043 0.00071 MV 346 10 0.294 0.00029 0.00049 MV 352 10 0.286 0.00029 0.00047 MV 360 15 0.0632 0.00004 0.00007 Average 0.00067 0.0011
Table 7.32 Elemental composition from sulfate retrieved from Mn wastewater
Sample ID Mass of Na 2SO4 (g)
dissolved in 100 ml
[Mn] ppm % of Mn in
Na2SO4
Corrected % of
Mn in Na 2SO4
MV 276 10.0 15.3 0.015 0.019 MV 285 10.0 16.6 0.017 0.021 MV 393 10.0 2.68 0.0027 0.0034 MV 396 10.0 7.05 0.0071 0.0088 MV 402 10.0 4.89 0.0049 0.0061 Average 0.0093 0.012
Results given in Tables 7.12 through 7.22 shows that the cobalt concentrations differ by
65 % i.e. for 4 fold and 800 fold dilution factors. Taking this factor into account, the
correct analytical results which are given in Table 7.31 shows that the average
elemental percent in sodium sulfate from cobalt wastewater is 0.0011 %. On the other
hand, results given in Tables 7.23 through 7.27 shows that manganese concentration
differ by 25 %, i.e. for 20 fold and 800 fold dilution factors. The corrected percent of
manganese which are given in Table 7.32 shows that the average elemental percent in
sodium sulfate from manganese wastewater is 0.012 %.

Chapter 8
8. Introduction to discussion Every organization involved in a profit making business strives to achieve the
highest margin of revenue while keeping expenses at a low level. The aim is to
maximize profits. For a business to achieve maximum profits it should:
• Position itself in such a way that customers are kept satisfied through
provision of highly competitive products of high quality and standards.[119]
• Strive to keep financial overheads low.
Like any other profit making organization, in an Industrial environment, expenses
are kept at a low level by making sure that raw materials are used properly and
accounted for at all times. The proper use of raw materials includes, but is not
exclusive to, transforming them to valuable commercialized products and keeping
an up-to-date inventory of purchased, used, and available raw materials and
products at the company’s warehouse.[128]
Metallica Chemicals is a chemical manufacturing company producing specialty
chemicals for industries in South Africa and abroad. The company has two
production plants operating at its site in Ebuhleni Industrial Park at Cato Ridge.
These plants make raw materials for the textile and paint industries. The
production of textile chemical auxiliaries has been found to run relatively waste-
free, and waste disposal costs are fairly reasonable compared with costs incurred
for the process used to make PD. Consequently, the company wishes to look at
ways in which to optimise the production of the paint driers, making it more
efficient and less wasteful in terms of effluent production. In doing so the company
should easily achieve its primary goal and at the same time keep the environment
clean. The company is currently spending a substantial amount (financial
resource) on disposal of wastewater generated during PD production processes
shown by percent values in Table 7.8 and graphically described by Figure D1 in
Appendix D. Financial resources being wasted could either be used to expand the
production plants or to create community projects that can uplift the current
unacceptable low standard of living in nearby communities.

Chapter 8 - 104 -
Two particular processes in the paint drier (PD) plant (organometallic or metal
soap plant) have been identified as creating large effluent volumes. They are the
production of cobalt and manganese octoate driers (described in Section 4.3). The
process used to make cobalt octoate has been found to generate large volumes of
wastewater. Depending on the number of production batches they make, an
average of 35 m3 of this effluent can be generated per month. The effluent is
made up of a saturated solution of sodium sulfate, Na2SO4, together with metal
contamination from unreacted starting materials.
Cobalt makes up only 21% of the mass of cobalt sulfate (CoSO4.7H2O). Thus
79% by mass of the CoSO4.7H2O ends up in the wastewater when manufacturing
cobalt PD. In terms of masses, this means that for the production of a batch of
12% cobalt octoate, (which is their largest batch manufactured and requiring at
most 2000 kg of CoSO4.7H2O) at least 1580 kg of the starting material becomes
waste. On the other hand, during manganese PD production, 68% by mass of
manganese sulfate (MnSO4.H2O) is released into the wastewater stream. Because
of production quantity and the fact that the company rarely manufactures the
manganese drier (see Tables 7.4 and 7.7), relatively low waste of this drier is
collected per annum. Though the amount of waste is less compared to that
produced during cobalt production, it is nevertheless important to put in place
measures that can further reduce its current level.
This project’s aim was largely two-fold.
• Firstly, to characterize the wastewater discharged in the two production
processes. This should enable the research team to establish the extent of
contamination as perceived by the company and provide information on
whether the wastewater can be reused, or commercialized, or used to
manufacture a more valuable product.
• Secondly, to identify alternative, cleaner, cost effective production
methods/processes to the ones currently employed by the company. This
includes raw material changes, alternative technologies and improvement
of current production practices. Research done on several industrial
processes has shown that changing the way the business or process is run
can effectively enhance revenue and profits.[130]

Chapter 8 - 105 -
The data obtained from chemical analysis of the water inputs to and outputs from
the process were used to define the quality of water desirable for each step in the
process. Collectively the data could be used to:
• Determine the processing (e.g. dilution or blending) necessary to allow the
available waters (fresh water or mains, water from washing and water from
distilling the final product) to be used in selected steps of the process.
• Assess the potential waste minimisation practices, such as recycling,
segregating and reducing the concentration of the effluent which is
generated by the process (described by Figure 3.3).
• Suggest ways of commercializing the current waste through new product
formulation from the waste generated, which could be introduced to the
existing process in order to reduce waste.[130]
Section 8.1 looks at the results obtained from historical audit (existing data) while
Section 8.2 gives a description of experimental results obtained from new
collected data.
8.1 Analysis of Results from Existing Documents The documents consulted are fully described in Table 6.1 of Section 6.1. One
particular document, the Standard Manufacturing Formulation Document (SMFD)
was extensively scrutinized as it contains exact amounts of raw material used,
products formed and to some extent, wastewater released to the effluent stream or
flow-bin. The information was found to be properly archived by the company.
8.1.1 Major Raw Materials, other than water used in the Drier Plant
The company uses a range of raw material for the production of several metal PDs
(see Table 7.1). The commonest raw materials used during paint drier production
are 2-ethyl hexanoic acid (2-EH) and white spirit solvent.
With the exception of barium nonyl phenate and drier blends, all driers use 2-EH
as a reaction raw material (see Table 7.1). The PD plant uses in excess of 370
tonnes of 2-EH per year. This product is shipped from overseas and hence a lack

Chapter 8 - 106 -
of it in the plant can be a major blow to the production of PDs. Calcium paint drier,
the major ingredient of all drier blends, uses more of 2-EH as shown in Table 7.1
and Figure 8.1. This is followed by cobalt paint drier, which uses 0.5% less than
the amount used for calcium paint drier production.
All but barium nonyl phenate drier uses white spirit, a volatile organic compound
(VOC). Though mostly used in paint products, white spirit is also used as a solvent
in aerosols, wood preservatives, and asphalt products.[135] According to the
Material Safety Data Sheet (MSDS) provided by the company, white spirit is highly
toxic to aquatic organisms and the effect can cause long term damage to the
environment. Because of its low density and immiscibility with water, it easily forms
a thin layer on the surface of water resulting in poor oxygen transfer between the
atmosphere and water. Employees handling this raw material should take
reasonable precautions for themselves, their co-workers and the environment at
large. On average, the drier plant uses more than 323 m3 of white spirit per year
and this excludes the amount used for cleaning that is not easily accounted for.
Calcium paint drier uses 12% more white spirit than cobalt paint drier which uses
at least 23% of the total amount per year (see Table 7.1). The use of white spirit
per drier in the PD plant is illustrated by Figure 8.2 below.
Figure 8.1 2-ethyl hexanoic acid used by each metal paint drier per annum
Cu 0.66% Pb 11.25%Mn 3.50%
K 2.93%
Na 0.62%
Zn 5.23%
Zr 13.70%Co 30.80%
Ca 31.31%

Chapter 8 - 107 -
8.1.2 Raw Water Usage and Wastewater Released
Water, a natural resource, is vital to both living organisms and industrial
operations.[102] This shows that safe reliable water use in daily activities is
important. For this and other environmental reasons it is important to establish
water and wastewater services. [129, 132, 134] The development of such services can
be traced back more than 4000 years. The Romans, to name but one, had a well
developed piped water supply, latrines and services. Though these ancient
civilized nations showed knowledge and importance of clean water, little is known
about whether they ever treated the wastewater generated for reuse or recycling.
Without this knowledge, the civilized nations were prone to water-borne diseases
such as cholera and typhoid fever which can cause fatal consequences such as
the ones recorded in London (Broad Street Pump episode) and in Wheeling, West
Virginia.[129, 133] The 1993, 2005 and 2007 outbreaks of waterborne diseases in
Delmas, Mpumalanga, South Africa emphasise the need for clean, renewable
water. [149-153] The “Earth Summit” in Rio de Janeiro in 1992 and the biggest
gathering by 189 heads of state in 2000, which came up with the “Millennium
Development Goals” (MDGs) are some of the commitments shown by developed
and developing countries when it comes to distribution of clean water.[130, 137]
Figure 8.2 White Spirit used for metal paint drier Production per annum
Cu
1.39%
Mn 2.41%K 1.15%
Zn 5.11%
Drier Blends
7.48%
Pb 11.32%
Zr 12.96%
Ca 35.17%
Na 0.15%
Co 22.87%

Chapter 8 - 108 -
Though there is a large amount of water on the earth, 96.5% is saline seawater,
2.8% is part of polar icecaps and glaciers leaving only 0.7% fresh water in lakes,
rivers and the atmosphere. It is important to note that this freshwater is not evenly
distributed. According to the UN World Water Development Report 2, South Africa
is regarded as a water stressed country, compared to water rich countries, with
only less than 104 x 103 m3 water available per person per year.[129, 130]
8.1.2.1 Water usage in the production site of the c ompany
A review of literature[86] shows that the cooling system, starting raw material and
steam production uses more freshwater in an industrial manufacturing sector than
any other section of the company. The company uses Municipal water for product
manufacturing and in-house cleaning. A large amount of water from the
Municipality is used in the textile production plant, the boiler and the cooling tower.
For the latter two, no records were available to substantiate this fact. In the PD
plant water is mostly used as a reaction starting material and for washing the final
product. Apart from these two major uses, it is also used for steam production and
cooling the reaction mixture. All but barium, calcium, lead and zirconium PD
utilizes water as a starting material. The percent usage of water in the PD Plant is
provided in Table 7.1. Since this project was to a larger extent concerned with
wastewater minimization and management, water usage became a focus point.
From the percentages tabulated in Table 7.1 it was important to picture the usage
graphically as shown in Figure 8.3. The figure shows that Co drier consumes
almost 80% of freshwater (municipal water) that goes to the PD plant followed by
Mn drier that consumes a little less than 8%. Of paramount importance is the fact
that every drop of water used and formed as a by-product does not form part of
the end product as illustrated by Equations 2.14 and 2.15. This means that
whatever amount is used and generated as a by-product from auxiliary reactants
ends up in the effluent pit or flow-bin. Hence, limiting the amount of freshwater
intake will help to reduce the generation and accumulation of high volume of
wastewater.[133, 140, 141] Freshwater can easily be reduced without sacrificing the
quality and amount of product through application of four general approaches,
namely process changes, water reuse, regeneration reuse and regeneration
recycling.[129-136, 136]

Chapter 8 - 109 -
Although the project’s mandate was to look at Co and Mn driers production, in
order to get a clear picture of Municipal water usage by these two driers, it was
crucial to look at water usage by the two production plants (described in
Section 4.1). Table 7.6 gives a month-to-month usage of water in the two
production plants. The information provided in the table was extracted from the
Municipal Bill statement (described in Table 6.1). Comparing these figures with
what is actually used in the PD plant, it is evident that the average volume of water
used per month in the PD plant is less than 3.2% of the total amount of water paid
for by the company per month. This is clearly illustrated in Figure 8.4 below.
Figure 8.3 Percent of Total Fresh Water that was consumed by each Metal Paint Drier during Production per annum
Other use
4.76%
Co
80.03%
Mn
7.78%
Zn
0.12%
Cu
3.56%
K
1.07%
Na
2.68%

Chapter 8 - 110 -
0
200
400
600
800
1000
1200
Am
ount
of w
ater
, cub
ic m
eter
s
JAN
FEB - APRIL
MAYJU
NEJU
LYAUG
SEPTOCT
NOVDEC
Year 2006
Production Sites Water Usage Drier Plant water usage
Figure 8.4 Comparison of water used in the Production sites with that used in
the PD Plant
Figure 8.4 shows that only a fraction of water is used in the PD plant and a much
larger amount is used elsewhere in the production site. It is however important to
take note that the fractional amount (3.2%) that is utilized in the PD plant ends up
in the wastewater stream. Hence a further reduction on fresh water intake to the
PD plant can help when it comes to waste reduction.
It was established through verbal communication with the company management
and the plant operators that the textile plant uses a substantial amount of
freshwater. Since the water taken forms part of final product less wastewater is
generated.
Another portion is spent in the cooling tower and on steam production, which is
essential for heating during production processes. Steam and cooling amounts to
the PD plant were not easily measured.
Monitoring of Municipal water meters during production site shut-down revealed
that the plant was losing freshwater possibly through unnoticed leaks. The results
collected over the seven weekends monitoring period are given in Table 7.11 and

Chapter 8 - 111 -
graphically represented by Figure 8.5. The Municipality meter reading was taken
on each Friday, Saturday, Sunday and Monday morning before production
resumed. The results show that on average the company is losing 8.71 m3 per
weekend (60 hours), an amount equivalent to two thirds of what is spent in the
production of manganese drier per year. If the flow rate is constant each day and
the lost amount is extrapolated, this will mean that the company is losing almost
1271 m3 of fresh water per year. This according to Table 7.6 is equivalent to
26.6% of the total freshwater the company received from the eThekwini
Municipality in 2006. One seriously concerning fact is that this amount is
8.37 times the total amount (151.8 m3) spent on production in the PD plant per
year. This is quite significant for a water stressed country like South Africa.[130] The
lost amount is equivalent to what is received by at least seventeen poor families
per annum. These are families receiving free water (72 m3 per year) according to
the South African Free Basic Water Policy promulgated in September 2000.[147]
0
2
4
6
8
10
12
14
Lost
wat
er in
m3
18 - 21 Jan 25 - 28 Jan 1 - 4 Feb 15 - 18 Feb 22 - 25 F eb 7 - 10 Mar 16 - 19 May
Weekend of the year
Figure 8.5 Graphical representation of loss of water during production plant shut
down

Chapter 8 - 112 -
8.1.2.2 Wastewater released at the end of productio n processes
According to the Water Pollution Control Federation (a US organization)[139] it is
estimated that more than 120 million cubic meters of wastewater will be produced
in US alone, which emphasizes the need to limit wastewater generation through
wastewater management and minimization. Cost of disposal alone should never
be seen as more important than the impact the wastes have on the sustainable
environment.
The PD plant alone uses less amount of freshwater but generates vast amounts of
wastewater per month as shown in Table 7.8 and graphically represented below in
Figure 8.6a.
0
10
20
30
40
50
60
70
80
MONTHS
Mas
s A
mou
nt in
tonn
es
Wastewater disposal (tonnes) Freshwater Used (tonnes)
Figure 8.6a Comparison between freshwater intake and end-of-pipe wastewater
disposed per month
Figure 8.6a gives a comparison between the amounts of freshwater consumption
and the wastewater disposal on a month to month basis. It should be noted that
the “mass of wastewater” includes all the solutes (mostly sodium sulfate) in the
wastewater stream. There are some discrepancies with regard to the amount of

Chapter 8 - 113 -
wastewater recorded per month. This is due to instances where there is a roll-over
of effluent from previous months that were not completely removed; hence the
figures given in Table 7.8 are based on what was collected by the private
company, rather than what was generated in that particular month. For example,
Figure 8.6a shows almost equal amounts of freshwater intake and wastewater
removed in January and May. The most probable explanation is that not all
wastewater was collected and this is supported by high amount collected in
February and June respectively. In addition to this, there was large amount of
wastewater removed in December when there is virtually no production taking
place which indicates that the private company removed wastewater generated in
previous month(s). In general, the trend shows that the company’s effluent
disposal amount far exceeds the amount of freshwater used. This is consistent
with what was mentioned earlier on and also supported by values given in Table
7.28. What Figure 8.6a is telling us is that the wastewater is NOT only determined
by the amount of freshwater used in an operation (see Table 7.28). For these
processes the freshwater used only contributes 0.035% of the total wastewater
generated in the PD plant. This is because the wastewater will by nature contains
by-products from side reaction (i.e. both liquids and salts formation). Though it is
recommendable to reduce freshwater intake it should be noted that merely
reducing the use of freshwater will not necessarily translate to a substantial
decrease in wastewater as it is observable from Figure 8.6a. This is a strong
reason why it is important to measure the wastewater, characterize it and then
determine the species that can render a measurable reduction or total elimination
of waste in a stream.
Cost as a percent of the total costs shown in Table 7.8 and graphically
represented below in Figure 8.6b show that the disposal cost of wastewater is
more than 200 times the cost of freshwater intake per annum. Financially, this is a
strong reason companies engage on wastewater management and elimination.
Rewards for such an achievement will be felt by the company within a short period
of time.

Chapter 8 - 114 -
0.0
4.0
8.0
12.0
16.0
20.0
JAN FEB MAR APR MAY JUN JUL AUG SEP OCT NOV DEC
MONTH
PE
RC
EN
T C
OS
T% Wastewater Cost % freshwaster Cost
Figure 8.6b Comparison of percent cost between freshwater intake and
wastewater collected per month
The company is currently reusing wastewater (distillate), which is the by-product
from the zirconium (Zr) and wash wastewater from the Co drier production
process. According to the plant operators, at least 1.20 to 1.30 m3 of reusable
wastewater is generated during Zr drier production. Together with the wash
wastewater amount from Co drier production, both these wastewater streams are
reused during the Co drier process as reaction water. Of the thirteen batches that
utilized the wastewater as the starting material, the production yield was never
compromised. It was pleasing to notice that the company has saved 11% of
freshwater through reuse of wastewater from these two processes (see Table 7.3).
In terms of effluent disposal cost this is a major saving and according to the United
Nations World Water Development Report 2, each cubic meter of water reused or
recycled on-site represents one cubic meter that the company will not have to
purchase from the Municipality and not worry about disposal.[130]
Chapter 8 - 115 -
8.2 Characterization of the Solvent and Wash Wastew aters
Characteristics of wastewater samples are given in Tables 7.9 and 7.10. In
general the samples are slightly alkaline at the time of sampling. Due to high levels
of sulfate ions in reaction wastewater, the conductivity is high compared to that of
wash wastewater. The distillate from both processes had virtually zero
conductivity.
Quantitative and qualitative analysis were carried out on wastewater to determine
the extent of contaminants. Results were obtained from company data and
analytical results from ICP-OES analyses (see Table 7.12 to 7.27). The results
were used to determine whether the wastewater was reusable, recyclable or
needed treatment before it could be used.
Tables 7.12 to 7.27 shows elemental concentration obtained for dilutions made on
the original sample composition as described in Sections 6.5 and 6.7. Reaction
wastewater for both Co and Mn samples contains a high concentration of sodium
sulfate (Na2SO4) that precipitates on cooling, hence reheating of samples was
necessary (see Figure 6.3) before dilution. In order to have approximate chemical
nature to that of standards, samples were diluted several times to reduce the
effect of physical interference that could compromise the efficiency and proper
working condition of the ICP-OES instrument. The efficiency of the nebulizer was
greatly enhanced through reduction of original sample concentration. Figures 8.7
to 8.9 shows the effect high concentration of Na2SO4 have on the apparent analyte
concentration.

Chapter 8 - 116 -
0
20
40
60
80
100
120
140
160
180
4df 20df 100df 200df 400df
Dilution Factor
Ana
lyte
Con
cent
ratio
n in
pp
m
Reaction Water Wash Water
Figure 8.7 Effect of dilution on the concentration for reaction and wash
wastewater from Co drier

Chapter 8 - 117 -
0
20
40
60
80
100
120
140
160
180
4df 16df 20df 50df 100df 200df 400df 800df 1000df
Dilution Factor
Ana
lyte
con
cent
ratio
n in
ppm
Reaction Water Reaction water acidified
Figure 8.8 Effect of dilution on the analyte concentration for acidified and non-
acidified Co reaction wastewater samples
0
0.5
1
1.5
2
2.5
3
3.5
4
4.5
20df 50df 100df 200df 400df 800df 1000df
Dilution Factor
Con
cent
ratio
n x
103 p
pm
Non acidified Plant dilution Acidified
Figure 8.9 Effect of dilution on the analyte concentration for acidified and non-
acidified Mn reaction wastewater samples

Chapter 8 - 118 -
A sharp increase in the apparent analyte concentration with an increase in dilution
factor was observed. The concentration gap between consecutive high dilution
factors (e.g. 800 to 1000) was far lower than those at lower dilution factors (20 to
100). This observation was enough evidence to illustrate that the effect had been
lowered to acceptable levels and no further dilutions were made beyond 1000 fold.
Comparing concentration for lower and higher dilution factors, the difference was
enormous and this proved that the concentration of the analyte is heavily affected
by matrix interferences in the original sample solution.[108] The effect was more
noticeable in reaction wastewater for Co samples than in wash wastewater (see
Figure 8.7). It was noticed (see Figure 8.8) that the analyte concentration in
acidified samples appeared to be higher than in non-acidified samples, at least in
Co wastewater. However, for Mn wastewater, the analyte concentration appeared
to be higher in non-acidified solutions than in acidified ones (see Figure 8.9). This
difference was more evident at high dilution factors than at lower dilution factors. A
possible reason for the observations made could be due to the effect the high
concentration of sulfate have on the analyte’s intensity. At lower dilution the effect
was more noticeable resulting in concentration of analyte being almost identical. At
high dilution factor when suppression was negligible, the intensity of analyte was
higher in acidified than in non-acidified samples. One striking observation was the
sudden formation of purple-bluish layer-like in Co samples on addition of acid. This
showed that the acid was facilitating separation of product like layer from the
“homogenous” aqueous layer resulting in a two layered mixture seen here in
Figure 8.10. Looking at the first and third samples of Figure 8.10, the top layer
resembles the cobalt octoate (the organic layer) while the bottom one is the
aqueous layer. On the other hand, the non-acidified, second and fourth samples
were homogenous. For acidified samples the mixture was more heterogeneous,
meaning that physical and chemical properties of the mixture were different at any
given point. After shaking to mix the solution it would rapidly separates out while
pipetting out the required volume. This means that it was not possible to
thoroughly mix the solution and sampling errors were large. Thus explaining why
acidified samples gave rise to high concentration of analyte than non-acidified
solutions which were more homogeneous.

Chapter 8 - 119 -
Figure 8.10 Acidified (1st and 3rd samples) and non-acidified (2nd and 4th
samples) as seen from left to right
8.3 Mass Balance Analysis According to the SMFD, there is a measurable amount of the major ingredient for
these two driers in the wastewater. This is, however, not supported by the
production yield at the end of the process whose values range between 90% and
110%. It was therefore necessary to carry out an analysis of the wastewater to
determine the validity of the information provided in the SMFD which was
subsequently used to calculate unreacted amounts of raw materials.
There are four sets of factory and analytical data on the masses (kg) of Co, Mn
and sulfate used and produced in drier production that will be used in mass
balance analyses. These are shown in Equations 8.1 to 8.4
These equations show that there is only one input stream in each case. The mass
of this stream is obtained from the data contained in the company’s SMFD sheet.
The mass of the species of interest can be calculated from this using Equation 8.1
Total mass of the
species of interest
introduced into
the reactor
=
Amount of
Co or Mn
sulfate used
x
percent of Co
or Mn based
on COA*
+
Amount of Co or Mn
from parts added to
the final product
Equation 8.1
* Represents certificate of analysis indicated on packaging container of the raw material
Acidified Non-acidified

Chapter 8 - 120 -
The output streams are all solutions and the concentrations of the aqueous
streams have been determined using ICP-OES instrument. The measured
concentration can be used to calculate the mass of the species of interest as
shown in Equation 8.2 and 8.3 for cobalt.
Mass of Co/Mn in the solvent water (kg)
= Concentration (kg/L) x Volume of solution L
Equation 8.2
Mass of Co in the rinse water (kg) = Concentration (kg/L) x Volume of solution L
Equation 8.3
Where: Concentration (kg/L) is the calculated value based on analytical
concentration of Co/Mn obtained using ICP–OES
Volume of solution is the total volume of aqueous solution released to the effluent
pit or flow-bin as indicated in Figure 4.3 and 4.9.
I = P + R + S + W Equation 8.4
I = Mass of Co in the solid CoSO4.7H2O starting material added to
reactor
P = Mass of Co in Co(C7H15CO2)2 in the white spirit stream or finished
product
R = Mass of unreacted Co in aqueous solution of the solvent water
S = Mass of unreacted Co in aqueous solution of the wash water
W = Mass of unreacted Co in aqueous solution of distillate water
H = M + N + V Equation 8.5 H = Mass of Mn in the solid MnSO4.H2O starting material added to
reactor
M = Mass of Mn in Mn(C7H15CO2)2 in the white spirit stream or finished
product
N = Mass of unreacted Mn in aqueous solution of the solvent water
V = Mass of unreacted Mn in aqueous solution of distillate water

Chapter 8 - 121 -
J = F + Q + T Equation 8.6 J = Mass of SO4 in the solid CoSO4.7H2O starting material added to
reactor
F = Mass of SO4 in aqueous solution of the solvent water
Q = Mass of SO4 in aqueous solution of the wash water
T = Mass of SO4 in aqueous solution of the distillate water
X = Y + Z Equation 8.7 X = Mass of SO4 in the solid MnSO4.H2O starting material added to
reactor
Y = Mass of SO4 in aqueous solution of the solvent water
Z = Mass of SO4 in aqueous solution of the distillate water
Due to time and manpower required to measure the amount of wastewater
generated, it was only carried out once. The measurements could only be carried
out by firstly transferring the wastewater into flow-bins followed by weighing using
a manual scale as shown in Figures 4.8 and 4.10 respectively. The complications
created by this shortcoming when it comes to carrying out proper mass balance
calculation were enormous. The mass measurement collected while conducting
this project were taken during the production of Batch number N6JUN07 (see
Table 7.28). Apart from verbal communication from the production personnel,
volumes for wastewater released were never measured.
An attempt was made to carry out mass balance calculations using the information
provided in Table 7.28 and sulfur concentration given in Tables 7.12 through 7.27.
Using the SMFD records and analytical results (see Table 7.29), a comparison of
inputs and outputs masses of Co and sulfate were then made. The sulfate
amounts, which were based on the measured concentration of sulfur showed
some discrepancies in the sense that the input/output values differ significantly
with each other within the same batch. This is attributed to the fact that there was
no reliable information to carry out proper mass balance calculations.
Apart from this shortcoming, while still stored in the refrigerator, it was observed
that in all samples (acidified and non-acidified) the sodium sulfate precipitate was

Chapter 8 - 122 -
spreading out of the sample bottle through the process called “crystal creeping”.
This was more evident in non-acidified reaction wastewater samples. This
phenomenon was not observed in the wash wastewater for both acidified and non-
acidified samples. There was also a noticeable amount of sodium sulfate that had
crystallized on the disposable tip of the Eppendorf micropipette after dispensing
the required volume for dilution. All these could explain the low amount of sulfate
found in the wastewater after an attempted mass balance calculation was carried
out.
From the mass balance calculation attempt made, the amount of cobalt that was
present in the product at the end of the production process was significantly lower
than the total amount at the start of the reaction. However, the calculated cobalt
outputs values (from wastewater) obtained at each sampling point tells a different
story. These values show that about 0.12% cobalt was actually lost during the
production process. The conclusion made was that the big difference in the
amount is attributed to errors of measurements in the SMFD documents. The
significant loss could easily lead one to conclude that the process is inefficient.
Apart from the records of effluent collected and disposed of by the private
company, no definite records of wastewater generated from each batch are
available. This makes it difficult to compare the actual amount of wastewater
generated with what was anticipated from each batch process, or with what the
private company disposed of. Of paramount importance, any abnormality on the
volume of wastewater generated against product yields obtained could not be
speedily and easily checked. The information is crucial during instances where low
yields are perceived to have occurred.
From the SMFD, amounts of unreacted metal of interest (Co or Mn) were
calculated using Equation 8.1 and these were based on the amount added and the
actual product yield. Calculated results are given on the last column of Tables 7.29
and 7.30. These values were compared with experimentally determined values
(see second column from last of Tables 7.29 and 7.30) calculated using
Equations 8.2 and 8.3 for Co and Equation 8.2 for Mn respectively. It should be
made clear that the calculations were based on an estimated average volume of
wastewater generated, because exact volumes generated from each batch were

Chapter 8 - 123 -
unavailable. The estimated volume used was verbally communicated to the
research team by the plant operators and this value was verified using
measurements from a single batch. The values depend solely on the
measurements carried out by the production plant personnel and the accuracy of
the analysis carried out by the laboratory analyst (see information on Table 8.1).
Table 8.1 Sources of mass balance calculation errors for inputs and outputs for all
batches sampled
Source of cobalt in the reactor Total
amount of
cobalt
used (4)
Product
yield
(5)
Percent
element in
the
product
(6)
Amount
of cobalt
in the
final
product
(7)
Cobalt
lost (8) Amount of
cobalt from
cobalt
sulfate (1)
Amount
of cobalt
from
ullages
(2)
Amount
of cobalt
from part
drum (3)
Source value (1)+(2)+(3) Measured/experime
ntal measurement
(5) x (6) (4) – (7)
Note that:
(1) depends on the specification indicated by the manufacturer (20.6% to 21.3%),
this was randomly checked by the laboratory analyst for each consignment
received. For all calculation in this project the value used was 21%.
(2) depends on the specification errors of the ullage and the amount used.
(3) depends on the specification errors of the part drum and amount used.
(4) will incorporate errors mentioned above
(5) depends on errors of parallax on the scale’s pointer since measurement is
made using a manual scale
(6) depends on titration errors which can happen while determining the metal
content in the finished product
(7) will incorporate errors mentioned in (5) and (6)
(8) all errors mentioned above will form part of the final value.

Chapter 8 - 124 -
Due to the complexity of the production process, no estimation of errors was made
on the calculated values that were used when producing Figure 8.11, hence it was
based solely on reported measurements reflected on the SMFD documents.
It is highly likely that significant errors could have occurred in the SMFD values,
hence compromising the validity of results. Comparison of the results (without
taking errors into account) is given by Figures 8.11 and 8.12 for Co and Mn paint
driers respectively. The ICP–OES instrument results given in Table 7.29 show that
on average about 0.200% cobalt metal was lost during production from each
batch. This is probably attributed to the fact that this is a batch production process
(described in Section 3) that is constantly monitored from the start as soon as raw
materials are added to the reactor. Any deviations (i.e. in terms of pH) from well
documented reaction procedures and conditions are adjusted after the laboratory
analysts have carried out required analyses. On the other hand, results from
SMFD sheets were not consistent with the experimental results and Equation 8.1.
The last five batches in Figure 8.11 show an increase on the output to input mass
percent, which is inconsistent with the Law of Conservation of Mass. The last
batch shows an increase of 8% output to input made, which was a serious cause
for concern. This shows possibility of calculations flaws which were carried out on
the SMFD by the production team. On the basis of the suspected errors,
experimentally determined results were accepted and further interrogation and
recommendation made depends solely on them.

Chapter 8 - 125 -
-8.00
-6.00
-4.00
-2.00
0.00
2.00
4.00
6.00
Per
cent
lost
N6FEB04
N6MAR06
N6MAR10
N6MAR17
N6JUN07
N6JUN11
N6JUL0
2
N6JUL1
2
N6JUL2
8
N6NOV17
N7FEB22
Batch Number
ICP-OES SMFD
Figure 8.11 Comparison of the percent of cobalt lost during production according
to batch sheet information and analytical results
Contrary to the observation made on the cobalt results that were used to generate
Figure 8.11, both results (ICP-OES and SMFD) for Mn drier were to some extent
comparable even though some SMFD values far exceeded those obtained
experimentally (see Figure 8.12). In general, SMFD values imply that a large
amount of Mn is lost during production. This difference is again attributed to the
way in which product yield or amounts are calculated by the company. ICP-OES
results were considered to be more reliable and further investigations were made
based on them.

Chapter 8 - 126 -
0.00
2.00
4.00
6.00
8.00
10.00
12.00
Per
cent
Mn
Lost
N6JAN25
N6FEB32
N6JUL3
1
N6OCT04
N7MAR04
Batch Number
ICP-OES SMFD
Figure 8.12 Comparison of the mass percent of Mn lost during production
according to batch sheet information and analytical results
Figures, 8.11 and 8.12 show that there is a measurable loss of Co and Mn metals
respectively with a larger amount lost from Mn drier. It was experimentally
deduced that though a loss was indeed occurring, the amount was far less
compared to what is predicted by the SFMD, (at least in the Co drier). The
average amount of unreacted raw material was less than 0.700 kg (about 0.167%
of the amount used) per production batch (see second column from last of
Table 7.29). This loss does not warrant treatment for its retrieval as this might turn
out to be a costly exercise. On the other hand, the amount of unreacted raw
material incurred during Mn drier production was more substantial. This was at an
average of 6.32 kg (about 2.63% of the amount used) per production batch (see
Table 7.30). The Mn metal lost represents a substantial amount that the company
should retrieve from the wastewater.
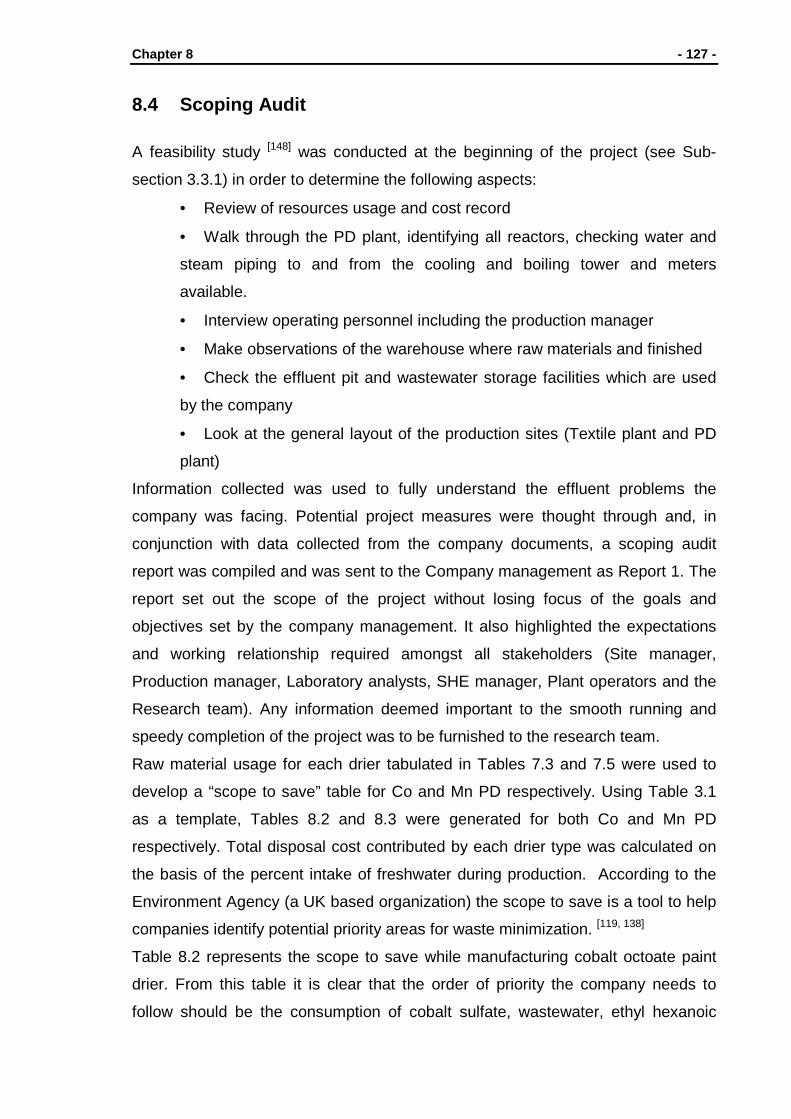
Chapter 8 - 127 -
8.4 Scoping Audit
A feasibility study [148] was conducted at the beginning of the project (see Sub-
section 3.3.1) in order to determine the following aspects:
• Review of resources usage and cost record
• Walk through the PD plant, identifying all reactors, checking water and
steam piping to and from the cooling and boiling tower and meters
available.
• Interview operating personnel including the production manager
• Make observations of the warehouse where raw materials and finished
• Check the effluent pit and wastewater storage facilities which are used
by the company
• Look at the general layout of the production sites (Textile plant and PD
plant)
Information collected was used to fully understand the effluent problems the
company was facing. Potential project measures were thought through and, in
conjunction with data collected from the company documents, a scoping audit
report was compiled and was sent to the Company management as Report 1. The
report set out the scope of the project without losing focus of the goals and
objectives set by the company management. It also highlighted the expectations
and working relationship required amongst all stakeholders (Site manager,
Production manager, Laboratory analysts, SHE manager, Plant operators and the
Research team). Any information deemed important to the smooth running and
speedy completion of the project was to be furnished to the research team.
Raw material usage for each drier tabulated in Tables 7.3 and 7.5 were used to
develop a “scope to save” table for Co and Mn PD respectively. Using Table 3.1
as a template, Tables 8.2 and 8.3 were generated for both Co and Mn PD
respectively. Total disposal cost contributed by each drier type was calculated on
the basis of the percent intake of freshwater during production. According to the
Environment Agency (a UK based organization) the scope to save is a tool to help
companies identify potential priority areas for waste minimization. [119, 138]
Table 8.2 represents the scope to save while manufacturing cobalt octoate paint
drier. From this table it is clear that the order of priority the company needs to
follow should be the consumption of cobalt sulfate, wastewater, ethyl hexanoic

Chapter 8 - 128 -
acid, white spirit and finally caustic soda flakes. An estimated saving of between
R123 000 to R572 000 can be achieved and this will in turn reduce the total
consumption of freshwater. According to the company records there is a lot of Co
that is needed to be saved in order to make substantial saving on the amount
spent (see Table 8.2). However, laboratory analysis carried out on wastewater
generated show that the amount of Co in wastewater is non-significant and hence
it will be pointless to spend valuable financial and human resources trying to
obtain it from the effluent stream.
Contrary to Co process, Table 8.3 shows that wastewater generated during Mn
production should be given highest priority. This is followed by ethyl hexanoic acid
which is heavily used by both Co and Mn PD. A total saving ranging between
R7 590 and R33 210 can be realized from this process.
For both processes, if WM is implemented and forms part of day-to-day activity of
the company, potential benefits listed under Section 3.4 could be realized.

Chapter 8 - 129 -
Table 8.2 Waste minimisation scope to save for Co PD production process
Resources and
Services
Quantity Cost/unit
(R)
Estimate
Cost/year
(R)
Scope to
save
%
Estimate of Scope to Save Priority
Ranking
(1=highest)
Minimum (R) Maximum (R)
Raw materials
2-ethyl hexanoic
acid, kg 114 003
12.15 1 385 130 1 to 5 13 850 69 250 3
Cobalt sulfate, kg 106 307 56.44 5 999 960 1 to 5 60 000 300 000 1
White spirit, L 74 018 6.24 461 870 1 to 5 4 620 23 090 4
Caustic soda flakes
(NaOH), kg 32 883
3.65 120 020 1 to 5 1 200 6 000 5
Versatic acid, kg 7 402 9.26 68 540 1 to 5 680 3 420
Water, m3 127.6 6.27 800 20 to 80 160 640
Wastewater , m3 392 175 N/A 212 590 20 to 80 42 520 170 070 2
TOTAL 123 030 572 470

Chapter 8 - 130 -
Table 8.3 Waste minimisation scope to save for Mn PD production process
Resources and
Services
Quantity Cost/unit
in Rand
Estimate
Cost/year
in Rand
Scope to
save
%
Estimate of Scope to Save Priority
Ranking
(1=highest)
Minimum (R) Maximum (R)
Raw materials
2-ethyl hexanoic acid,
kg 12 967
12.15 157 550 1 to 5 1 575 7 880 2
White spirit, L 7 791 6.24 48 615 1 to 5 490 2 430 3
Manganese sulfate, kg 8 225 3.50 28 780 1 to 5 290 1 450 4
Versatic acid, kg 1 743 9.26 16 140 1 to 5 160 810 5
Caustic soda flakes
(NaOH), kg 3 863
3.65 14 000 1 to 5 140 700
Priolene acid, L 1 501 9.00 13 510 1 to 5 135 680
Methanol, L 1 849 3.16 5 840 1 to 5 60 300
Water, m3 12.4 6.27 80 20 to 80 16 64
Wastewater , m3 43 575 N/A 23 620 20 to 80 4 720 18 900 1
TOTAL 7 590 33 210

Chapter 8 - 131 -
8.5 Production Cost and True Cost of Waste
According to the eThekweni Municipality Bylaws, disposal limits for two types of
industrial works which are described by the amount of effluent they produce per
day are given in Tables 8.4a and 8.4b. Since the company produces less than
25 ML/day waste, according to the Bylaws, it is classified as a small works
industrial manufacturing company. The quality of the wastewater and the high
concentration of unreacted metal deemed it unsuitable for disposal in the sewage
stream.[146, 154] The problem is exacerbated by the fact that the wastewater
generated during production contains traces of white spirit which is harmful to
aquatic animals as described in Sub-section 8.1.1. Table 8.4a and 8.3b, extracted
from eThekweni Municipality Bylaws gives guidelines limits on what can and
cannot be disposed of into the sewage system.
Results tabulated under Section 7.3 show that Co, Mn and sulfate ions
concentration are too high for the company to use sewage disposal. Average
cobalt concentration for each batch listed in Table 7.29 shows that the reaction
water contains 32 times more Co whereas wash water contains 16 times more Co
than the recommended sewage disposal limit of 5 mg/L. With regard to Mn drier,
results in Table 7.30 shows that the reaction water contains 736 times more Mn
than the prescribed limit allowed by the Municipality.

Chapter 8 - 132 -
Table 8.4a Acceptable Concentration of Trade Effluent for discharge into the
sewage disposal system[146]
General Quality Limits Large Works
>25 ML/d
Small Works
<25 ML/d
Units
1. Temperature <44 oC <44 oC Degree
Celcius
2. pH 6 < pH < 10 6.5 < pH < 10 pH units
3. Oils, greases, waxes of mineral
origin
50 50 mg/l
4. Vegetable Oils, greases waxes 250 250 mg/l
5.Total sugar and starch (as
glucose)
1 000 500 mg/l
6. Sulfates in solution (as SO42-) 250 250 mg/l
7. Sulfides, hydrosulfides and
polysulfides (as S2-)
1 1 mg/l
8. Chlorides (as Cl-) 1 000 500 mg/l
9. Fluoride (as F-) 5 5 mg/l
10. Phenols (as phenols) 10 5 mg/l
11. Cyanides 20 10 mg/l
12. Settleable solids Charge Charge mg/l
13. Suspended Solids 2 000 1 000 mg/l
14. Total dissolved solids 1 000 500 mg/l
15. Electrical conductivity - 400 mS/m
16. Anionic Surfactants - 500 mg/l
17. C.O.D Charge Charge mg/l

Chapter 8 - 133 -
Table 8.4b Acceptable Concentration of Trade Effluent for discharge into the
sewage disposal system[146]
General Quality Limits Large Works
>25 ML/d
Small Works
<25 ML/d
Units
Heavy Metal and other elements
18. Copper (Cu) 50 5 mg/l
19. Nickel (Ni) 50 5 mg/l
20. Zinc (Zn) 50 5 mg/l
21. Iron (Fe) 50 5 mg/l
22. Boron (B) 50 5 mg/l
23. Selenium (Se) 50 5 mg/l
24. Manganese (Mn) 50 5 mg/l
25. Lead (Pb) 20 5 mg/l
26. Cadmium (Cd) 20 5 mg/l
27. Mercury (Hg) 1 1 mg/l
28. Total Chromium (Cr) 20 5 mg/l
29. Arsenic (As) 20 5 mg/l
30. Titanium (Ti) 20 5 mg/l
31. Cobalt (Co) 20 5 mg/l
TOTAL METALS 100 20 mg/l
Special Limitations
1. No calcium carbide, radio active or isotopes
2. No yeast & yeast wastes, molasses spent or unspent
3. No cyanides or related compound capable of liberating HCN gas or cyanogens
4. No degreasing solvents, petroleum spirit, volatile flammable solvents or any
substance which yields a flammable vapour at 21 oC
Guideline limits tabulated above shows that the company can only get rid of waste
after treatment with chemicals before landfill at appropriate sites. Proper
procedures should be followed in accordance with the South African National
Standards document (SANS 10228) put in place in 2006.[88] The treated waste is
then disposed of at designated areas through the use of private waste

Chapter 8 - 134 -
management and disposal companies. One big mistake that companies make is to
look at disposal costs without carrying analysis on the “True Cost of Waste”.
Waste disposal cost is just a fraction of the overall cost incurred by the company
(see Sub-section 3.3.3). As mentioned earlier, true cost includes the following:
• Raw material cost
• Treatment cost
• Effect waste has on the productivity
• Time for managing and monitoring the waste
• Environmental liabilities that may arise while storing and disposing the
waste.
True cost can be calculated by looking at how much the company spent on
acquiring the raw material which forms part of the waste plus disposal costs. The
true cost of waste incurred by this company can be calculated using the equation:
WastewaterinMaterialRawofCostTotalCostsDisposalCostWasteTrue +=
Equation 8.8
The total cost of raw material is calculated based on the amount a particular raw
material contributes to the waste multiplied by the unit cost of the raw material.
Communication with EnviroServe (see Section 6.1), revealed that the company is
charged for transportation, treatment and disposal of waste. The disposal costs
obtained from company records are given in Table 7.8. Using the data collected, a
trend curve comparing waste generated to freshwater intake (see Figure 8.6a)
shows that the volume of wastewater far exceeds that of freshwater from January
to December. Figures 4.3 and 4.9 gives raw materials used during the production
of Co and Mn driers manufacturing processes respectively. As mentioned earlier,
most of these materials, namely, water, NaOH and sulfates make up the total
amount of wastewater generated and do NOT form part of the end product.

Chapter 8 - 135 -
8.6 New Product Formulation from Waste Industrial manufacturing sectors that still consider Waste management and
minimization as a problem are probably missing out on cashing in on a possible
product waiting to be discovered. This can only be achieved by knowing exactly
the quantity and the composition of what is considered to be waste. History [63] tells
us that important products like phenol, benzene and the dyestuffs were all
discovered from the waste generated from the production of coke from coal. It is
possible that before these products were discovered, many companies lost on the
possibility of turning what would have been considered a nuisance to production
until very late. This means that it is crucial to evaluate the waste generated to find
out hidden useful commercialized product(s) which can ultimately render a
reduction in waste generation. In its 2nd Report, The United Nations World Water
Development encouraged countries to follow innovations like the one taking place
at an Industrial Park in Cape Town, South Africa.[130, 155] It is an innovation where
companies search through the industrial park website database for any waste that
has been registered that fits their raw material specification.
Wastewater generated during Co and Mn PD production contains minor amounts
of Co metal and Mn metal respectively. The salt in solution is Na2SO4 which
crystallizes on cooling. Two possible products that the company can formulate
from this wastewater are sodium sulfate and calcium sulfate (gypsum). If a market
is available for one of these products, the company could commercialize instead of
disposing of the wastewater as is happening at the moment. Benefits the company
could realize include financial resources (from sales made on the new product and
savings on disposal costs) and environmental good standing by saving the limited
space they would normally use at a landfill site while disposing the wastewater.
Sodium sulfate was evaluated and found to be the wiser choice the company
could invest in as it has advantages that includes:
• Less energy required to get the byproduct from the wastewater
• No other raw materials required for its production
• Requires less amount of water for washing
• Depending on the quality of separation, wastewater generated can be
reused for drier production as reaction water, hence solving the problem of
retrieving the un-reacted metal.

Chapter 8 - 136 -
On the other hand, calcium sulfate requires purchase of raw material which the
company has or might need, extra storage facilities, feasibility studies on the
expected reaction and disposal cost for the waste generated
In order to demonstrate the quality of solid Na2SO4 that can be retrieved from the
wastewater a laboratory test (see Section 7.4) was carried out. The results of the
test were astonishingly positive as they yielded the salt of high purity, at least from
Co wastewater. Results obtained from Co and Mn reaction wastewater are
tabulated in Tables 7.31 and 7.32 respectively. Traces of Co in the isolated sulfate
crystals contributed an average of less than 0.0011% of sample used. Figure 8.13
shows Na2SO4 crystals that were isolated from Co reaction wastewater. The
crystals are soft and easily ground into powder.
Figure 8.13 Dried Na2SO4 crystals isolated from Co PD reaction wastewater
Na2SO4 crystals that were isolated from the Mn wastewater were of lower purity,
with manganese contributing an average of about 0.01% by mass. They contained
visible traces of manganese octoate drier. The crystals were hard and could not be
easily ground into powder as shown in Figure 8.14. It is strongly suggested that if
the company wishes to follow this route they should segregate the cobalt and
manganese wastewater streams in order to isolate the sulfate for each easily.
Figure 8.14 Dried Na2SO4 crystals isolated from Mn PD reaction wastewater
Manganese octoate drier

Chapter 9
9. Conclusion and Proposed Measures Environmental sustainability impacts, strict Municipal bylaws, ever increasing waste
disposal costs and scarcity of resources e.g. freshwater, are but a few aspects that
force companies to incorporate waste management and prevention strategies into
industrial processes.[130, 157-160] In a chemical industry, expense alone is no longer the
defining factor in cutting down the amount of effluent wastes generated. Traditionally,
end-of-pipe treatment was considered to be the best option when it came to
controlling wastes. This is no longer the case and hence cleaner production and eco-
efficiency methods are receiving a lot of attention. Reduction or total elimination of
environmental hazardous substances can be achieved through:
• Technology modification
• Inputs substitution
• Products modification
• In plant reuse
• Recycling waste or by-products
• New product formulation based on waste
• Treatment of waste and reuse or recycle
• Treatment of waste and the dispose at designated sites
Not only is the reduction or total elimination helping companies to reduce disposal
costs and meet acceptable effluent waste levels, the financial position is
strengthened, production processes are improved, companies becomes more
efficient and profitable.[161] Since most wastes are contained in the solvent water
medium, the reduction or total elimination of pollution also helps to reduce water

Chapter 9 - 138 -
consumption. South Africa’s industrial sector accounts for 11% of the total water
usage and a reduction can assist in attaining the MDGs by 2015.[130] According to the
United Nations World Water Development Report 2, strategies that can save water
and increase industrial water productivity include
• water auditing, which shows where the water supplied to the plant is being
used, how much is used in each process, and where it ends up
• matching water quality to use requirement which indicates the quality of water
that can be used, so that low quality water is utilized in a process rather than
high quality water from Municipality
• water recycling and on-site reuse in order to minimize freshwater consumption
by maximizing water reuse and recycling, which ultimately lowers/eliminates
the production of wastewater
• stream separation which can reduce treatment cost that will not normally be
achieved from wastewater containing a variety of contaminants
• raw material and energy recovery from waste which can help recover all
unconverted raw material in the wastewater for reuse
• reuse of waste by other companies that might need to utilize the waste for
their processes, e.g. forming an Industrial park like that of Cape Town that
registers all wastes from local industry[130]
• wastewater treatment technologies e.g. physical/chemical treatment (settling,
filtration, reverse osmosis, adsorption, flocculation, chlorination), biological
treatment (aerobic or anaerobic treatment and other specialized processes
such as phosphate reduction and sulfate removal)[130]
• Water Pinch Technology and mathematical programming techniques that can
help companies reduce freshwater intake through re-use, regenerative reuse
and regenerative recycling.[142, 143, 145, 146]
9.1 Conclusion The company produces speciality textile products and organometallic soaps known
as paint driers. The production of paint driers produces high volumes of wastewater
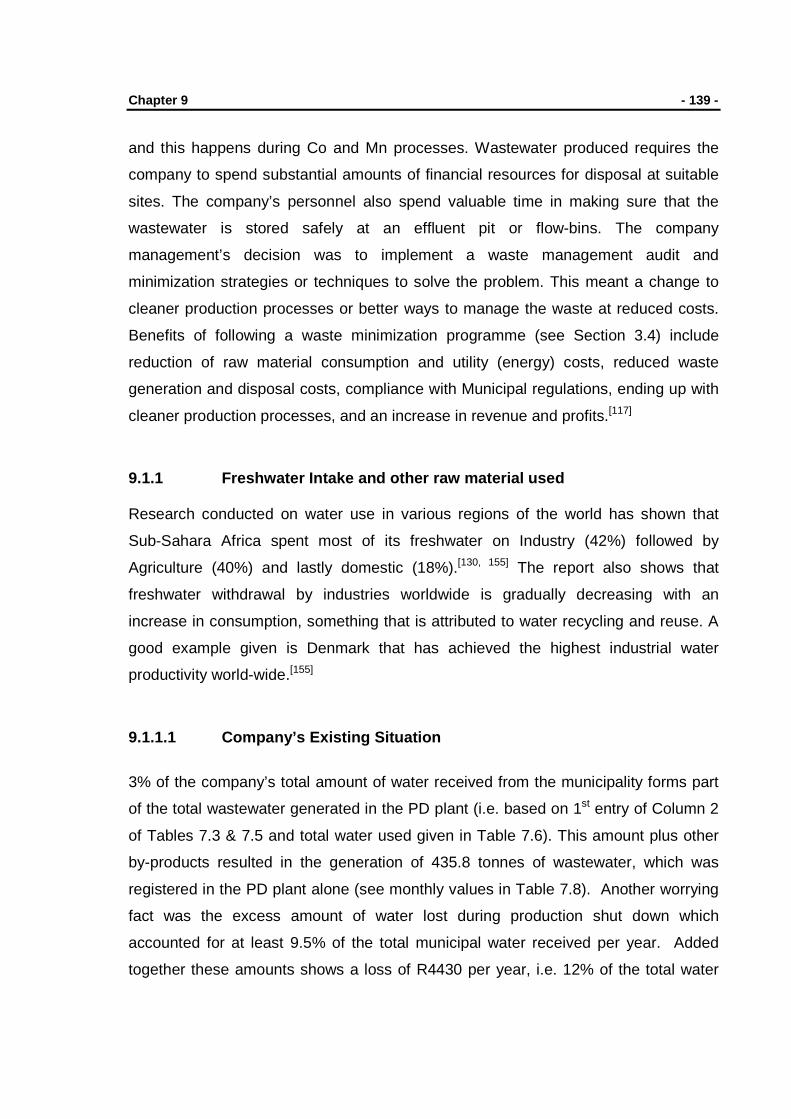
Chapter 9 - 139 -
and this happens during Co and Mn processes. Wastewater produced requires the
company to spend substantial amounts of financial resources for disposal at suitable
sites. The company’s personnel also spend valuable time in making sure that the
wastewater is stored safely at an effluent pit or flow-bins. The company
management’s decision was to implement a waste management audit and
minimization strategies or techniques to solve the problem. This meant a change to
cleaner production processes or better ways to manage the waste at reduced costs.
Benefits of following a waste minimization programme (see Section 3.4) include
reduction of raw material consumption and utility (energy) costs, reduced waste
generation and disposal costs, compliance with Municipal regulations, ending up with
cleaner production processes, and an increase in revenue and profits.[117]
9.1.1 Freshwater Intake and other raw material use d Research conducted on water use in various regions of the world has shown that
Sub-Sahara Africa spent most of its freshwater on Industry (42%) followed by
Agriculture (40%) and lastly domestic (18%).[130, 155] The report also shows that
freshwater withdrawal by industries worldwide is gradually decreasing with an
increase in consumption, something that is attributed to water recycling and reuse. A
good example given is Denmark that has achieved the highest industrial water
productivity world-wide.[155]
9.1.1.1 Company’s Existing Situation
3% of the company’s total amount of water received from the municipality forms part
of the total wastewater generated in the PD plant (i.e. based on 1st entry of Column 2
of Tables 7.3 & 7.5 and total water used given in Table 7.6). This amount plus other
by-products resulted in the generation of 435.8 tonnes of wastewater, which was
registered in the PD plant alone (see monthly values in Table 7.8). Another worrying
fact was the excess amount of water lost during production shut down which
accounted for at least 9.5% of the total municipal water received per year. Added
together these amounts shows a loss of R4430 per year, i.e. 12% of the total water

Chapter 9 - 140 -
expense (see Table 7.6). The practical ways in which raw materials other than water
are charged into the reactor pose a health risk to the plant operators and solid
material loss were also observed.
9.1.1.2. Proposed Measures Water Audit should be carried out in order to determine where the input water is
being used. This will help the company to identify the amount of water spent at each
area and where possible, if there is an area where it is being unnecessarily
wasted.[130, 155] For water audit to be carried out efficiently and appropriately,
installation and use of water metering at each point where municipal water is used
should be fitted and should be given the highest priority. This will mean investing in a
number of meters for each sectional plant process, including boiler and cooling tower,
offices and housekeeping areas. Plant operators or a dedicated employee should be
trained to record and analyse meter readings daily or weekly. Workshops or water
management meetings should be held weekly or monthly so that everyone is made
aware of what the company has embarked on to enable everyone to be involved. To
make it formal, a report on the use of water at each section should be compiled and
circulated to all employees monthly. Once the report has been disseminated to all
employees, a request for inputs and recommendations should be encouraged. Total
amounts recorded at each subsection should be checked against the amount
registered by the municipal meter. Any deviations, which might reveal leakages,
should be attended to speedily. The management should use the results to make
correlations between water usage and operating costs/production yield, make any
adjustments deemed necessary to alleviate detected problems or modify production
processes. Remember “If it can’t be measured, it can’t be managed”.[87]
Charging of solid raw materials into the reactor during production should be revised
by the SHE manager in consultation with Occupational Health Nurse Practitioner
(OHNP). A system should be developed whereby the plant operators will have no
direct contact with raw material, either in the form of inhalation or skin contact.
Ongoing research shows that cobalt/cobalt compound dust poses health risks to

Chapter 9 - 141 -
workers.[100] The company needs to be proactive and invest in machinery that can
protect their employees and enhance production capacity.
Re-use and regenerative recycling of water will be beneficial to the company since
the levels of contaminants are currently known from results given in Tables 7.12
through 7.27 and moreover, the wastewater contains a single contaminant . The
company should enhance the re-use of wastewater generated from the zirconium PD
into the Co process that is currently being practiced (reflected in Table 7.3). If
properly implemented, the current savings of 11 % on water can easily be improved.
The commitment should be demonstrated through the establishment of dedicated
storage facilities which are currently not available.
Proposed measure mentioned in this section (wastewater treatment technologies)
should be followed as a way of reducing the current levels of the major contaminants
(Na2SO4). Once the levels have been reduced, the wastewater from both Co and Mn
PD can be used as solvent water for the production of Co and Mn driers respectively.
This will again yield another saving on both the amount of freshwater withdrawn and
the wastewater to be disposed. The schematic diagram illustrating re-use and
regeneration recycling[144, 145] that the company can utilize and modified depending on
the level of contaminant for the process is shown below in Figure 9.1.
Zr reactor
Co reactor REGENERATEWastewaterFreshwater
Figure 9. 1 Freshwater intake minimization through re-use and regeneration
recycling on the Co drier process [139]

Chapter 9 - 142 -
Mn reactor REGENERATEWastewaterFreshwater
Figure 9. 2 Freshwater minimization through regeneration recycling on the Mn drier
process [139]
Depending on the level of contaminants on the distillate from Zr drier process, its
water can be utilized during Mn process. Hence Figure 9.1 can be applied to both
processes.
Change of production process should be explored in order to reduce the amount of
wastewater produced. As explained in Subsection 2.4.2, direct fusion process and
direct metal reaction process do not produce any appreciable wastewater. A
feasibility study (see Appendix F) was conducted few years back by the company
comparing total production costs and production time taken while following the direct
fusion process against the precipitation process. Direct fusion process was found to
be 60% shorter in terms of production time and a cleaner process. It was established
that the precipitation reaction was R3.01 less expensive to produce a kilogram of
cobalt octoate than the direct fusion process. This was largely attributed to pure raw
materials required for direct fusion process. The cost difference takes into account all
factors including labour, energy, costs for both raw materials and waste disposal (see
Appendix F). Taking into account current strict environmental legislations and
exorbitant disposal costs (see Figure 8.6b), the company should carry out another
study in order to determine if the findings made a few years back still hold.
Water Pinch Technology came into existence in 1978 through the work done by
Linnhoff and Flower for the optimization of heat exchanger networks.[144, 145] The
technology has recently been extended to freshwater management and
optimization.[141] To date, research investigations on Pinch Technology has been
conducted at several industries in South Africa, namely the Sasol Polymers Chlor-

Chapter 9 - 143 -
Alkali plant, the Sanachem Agro-Chemicals, the Lethabo Power Station, SA Tioxide,
AECI Bioproducts Lysine Plant at Umbogintwini, Ceres Fruit Juices and Mondi
Merebank Paper Mill at Merebank[144, 145] Work carried out at the Sanchem Agro-
Chemicals relates much to the company’s waste minimization and water
management problems. Although pinch technology literature is based on continuous
processes, it was easily applied to production that follows batch processes just like
that of the company. The implementation of research conducted at Sanchem Agro-
chemical was successful in the sense that they were able to reduce freshwater intake
by 40% and production capacity increased by 25%.[145] Application of the technology
can also assist the company in determining the amount of water utilized by the
cooling tower and the boiler. Instead of allowing steam to evaporate, this can be
channeled back into the storage facilities and used as reaction water. Since the
research team’s expertise does not go beyond Chemistry, the technology mentioned
here will require the know-how of a Chemical Engineer and it will be in the company’s
best interest to initiate such a project.
9.1.2. Wastewater generated during production Many industrial companies in South Africa are faced with challenges brought about by
new environmental legislations requiring everyone to be vigilant when it comes to
waste generation and disposal. Most of these companies are beginning to pay more
attention to what they are throwing away in the hope of commercializing some or all of
the by-products. Sappi Saiccor, the world’s largest producer of chemical cellulose is
but one good example.[162] The company generates 5000 m3 effluent per hour, which
is then pumped into the sea. The company initiated a research project that looked at
characterisation of the wastewater with the hope of obtaining compounds that could
be commercialised, while at the same time reducing the impact wastewater generated
has on the environment.
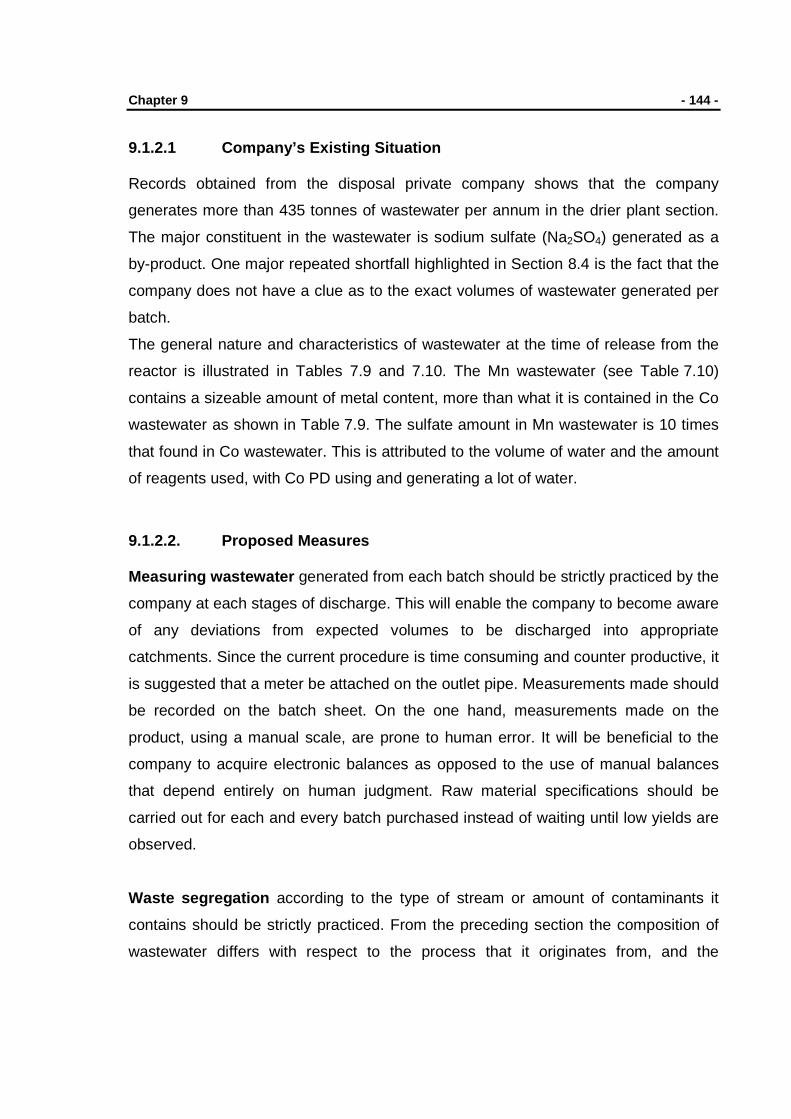
Chapter 9 - 144 -
9.1.2.1 Company’s Existing Situation Records obtained from the disposal private company shows that the company
generates more than 435 tonnes of wastewater per annum in the drier plant section.
The major constituent in the wastewater is sodium sulfate (Na2SO4) generated as a
by-product. One major repeated shortfall highlighted in Section 8.4 is the fact that the
company does not have a clue as to the exact volumes of wastewater generated per
batch.
The general nature and characteristics of wastewater at the time of release from the
reactor is illustrated in Tables 7.9 and 7.10. The Mn wastewater (see Table 7.10)
contains a sizeable amount of metal content, more than what it is contained in the Co
wastewater as shown in Table 7.9. The sulfate amount in Mn wastewater is 10 times
that found in Co wastewater. This is attributed to the volume of water and the amount
of reagents used, with Co PD using and generating a lot of water.
9.1.2.2. Proposed Measures Measuring wastewater generated from each batch should be strictly practiced by the
company at each stages of discharge. This will enable the company to become aware
of any deviations from expected volumes to be discharged into appropriate
catchments. Since the current procedure is time consuming and counter productive, it
is suggested that a meter be attached on the outlet pipe. Measurements made should
be recorded on the batch sheet. On the one hand, measurements made on the
product, using a manual scale, are prone to human error. It will be beneficial to the
company to acquire electronic balances as opposed to the use of manual balances
that depend entirely on human judgment. Raw material specifications should be
carried out for each and every batch purchased instead of waiting until low yields are
observed.
Waste segregation according to the type of stream or amount of contaminants it
contains should be strictly practiced. From the preceding section the composition of
wastewater differs with respect to the process that it originates from, and the

Chapter 9 - 145 -
efficiency of treatment will depend on the degree of contamination. Wastewater
generated from Mn is on average more concentrated with Na2SO4 than the one
coming from Co process. Because of low volumes of Mn wastewater generated per
year, i.e. based on the freshwater intake, small size batches and number of batches
made, it will be less costly to treat it alone than when mixed with Co wastewater. As
illustrated in Section 8.6, Co wastewater alone results in pure Na2SO4 solid crystals.
The purity can be compromised if another stream (other than Co) is combined with
wastewater from Co production process.
Turning waste into new product(s) [65, 79] should be made the second priority after
segregation of streams. Not only will the company achieve reduction in disposal
costs, it will generate revenue through commercializing such a by-product. The
research team has suggested a potential product in the wastewater that the company
might want to explore in the near future (see Section 8.6). The company is fully aware
of the amount of heavy metal in each stream. They could also conduct market
research to find out whether industries exist that could utilize the current wastewater
with its contaminant for other processes.
Wastewater treatment technologies available that the company can implement
includes reverse osmosis and biological treatment.[130-132, 134] The good thing about
them is their applicability to wastewater earmarked for recycling or as a form of
treatment prior to disposal. Since the idea is the reduction or total elimination of
wastewater, the company should apply wastewater treatment technologies for re-use
or recycling.
9.2 Final Conclusion Careful consideration of most of the recommendations made will inevitably put the
company’s environmental standing on a far sounder footing. The rewards on the
production capacity and efficiency will by far exceed the current volumes. Financial
rewards in terms of revenue will exceed half a million rand as illustrated in Tables 8.1
and 8.2.

REFERENCES
1. Federation Series on Coatings Technology. Unit 1 “Introduction to Coatings Technology” and Unit 11 “Paint Driers and Additives”. 1973 & 1969. Federation of Societies for Paints Technology. USA
2. Burgess W A. Recognition of Health Hazards in Industry: a review of
materials and processes. 1995. John Wiley & Sons. Inc. USA 3. Bouwman E and van Gorkum R. The oxidative drying of alkyd paint
catalysed by metal complexes, Coordination Chemistry Reviews, 2005, (249), p1709 – 1728
4. Morgans W M and Taylor J R. Introduction to Paint Technology. Fourth
Edition. Wartford Printers Ltd, UK, 1976 5. Lambourne R and Strivens T A. Paint and Surface Coatings: Theory and
Practice. Second Edition. Woodhead Publishing Ltd. England, 1999 6. http://www.theartofafrica.co.za/serv/rockart.jsp accessed on the 11th
February 2007 7. http://en.wikipedia.org/wiki/paint accessed on the 24th October 2006 8. Seymour R B and Mark H F. Handbook of Organic Coatings: A
comprehensive Guide for the Coatings Industry. Elsevier Science Publishing Co. Inc. 1990
9. http://www.sapma.org.za accessed on the 27th February 2007 10. Chatfield H W, Varnish Constituents. The University Press, Great Britain.
1947 11. Miccichè F. The Combination of Ascorbic Acid Derivatives/Iron Salts as
Catalyst for the Oxidative Drying of Alkyd-based Paints: A Biomimetic Approach, CIP-Data Library Technische Universiteit Eindhoven, 2005, PhD Thesis.
12. http://www.realpaints.com/history.htm accessed on the 27th February 2007

References - 147 -
13. Micciche F. Oostveen E, van Haveren J and van der Linde R, The combination of reducing agents/iron as environmentally friendlier alternatives for Co-based driers in the drying of alkyd paints, Progress in Organic Coatings, 2005, (53), p99 – 105
14. http://www.patchamltd.com/paintdriers.html accessed on the 22nd
November 2006 15. Micciche F, van Straten M A, Ming W, Oostveen E, van Haveren J,
van der Linde R and Reedijk J. Identification of mixed-valence metal clusters in drier solutions for alkyd-based paints by electrospray ionization mass spectrometry (ESI-MS), International Journal of Mass Spectrometry, 2005, (246), p80 – 83
16. Crampton N J. Preventing Waste at the Source. Lewis Publishers, 1999.
17. Skalsky J. Preparation and application of drying agents in paints. Progress
in Organic Coatings. 1976, (4), issue 2 p137 – 160 18. Warzeska S T, Zonneveld M, Gorkum R, Muizebelt W J, Bouwman and
Reedijk J. The influence of bipyridine on the drying of alkyd paints: a model study, Progress in Organic Coatings, 2002, (44), p243 – 248
19. Oyman Z O, Ming W and van der Linde R. Oxidation of model compound
emulsions for alkyd paints under the influence of cobalt drier, Progress in Organic Coatings, 2003, (48), p80 – 91
20. Sailer R A and Soucek M D. Investigation of cobalt drier retardation.
European Polymer Journal, 2000, (36), p803 – 811 21. van Gorkum R, Bouwman E and Reedijk. Fast Autoxidation of Ethyl
Linoleate Catalyzed by [Mn(acac)3] and Bipyridine: A Possible Drying Catalyst for Alkyd Paints, Inorganic Chemistry, 2004, (43), p2456 – 2458
22. Bieleman J H. Driers. Chimia, 2002, (56), number 5, p184 – 190 23. Marton B, van der Ven L G J, Otto C, Uzunbajakava N, Hempenius M A,
and Vancso G J. A depth-resolved look at the network development in alkyd coatings by confocal Raman microspectroscopy, Polymer, 2005, (46), p11330 – 11339
24. Sailer R. A, Wegner J. R, Hurtt G. J, Janson J. E and Soucek M. D.
Linseed and sunflower oil alkyd ceramers. Progress in Organic Coatings. 1998, (33), p117 – 125

References - 148 -
25. Tanase S, Hierso J, Bouwman E, Reedijk J, ter Borg J, Bieleman J H and Schut A R. New insights on the anti-skinning effect of methyl ethyl ketoxime in alkyd paints. New Journal of Chemistry, 2003, (27), p854 – 859
26. Mallégol J, Barry A M, Ciampi E, Glover P M, McDonald P J, Keddie J L,
Wallin M, Motiejauskaite A and Weissenborn P K. Influence of drier combination on through-drying in waterborne alkyd emulsion coatings observed with magnetic resonance profiling. The Journal of Coatings Technology, October 2002, (74), p113
27. Wu J, Bouwman E and Reedijk. Chelating ligands as powerful additives to
manganeses driers for solvent-borne and water-borne alkyd paints, Progress in Organic Coatings, 2004, (49), p103 – 108
28. Weissenborn P K and Motiejauskaite A. Drying of Alkyd Emulsion Paints.
Journal of Coatings Technology. 2000, (72), number 906, p65 – 74 29. Lewin I. Product, paint and curing method-the essential components of an
integrated coating system, Pigment & Resin Technology, 1999, 3(28), www.emerald-library.com, Accessed on the 25th January 2006-01-26
30. Tanase S, Bouwman E, and Reedijk J. Role of additives in cobalt-mediated
oxidative crosslinking of alkyd resins, Applied Catalysis A: General, 2004, (259), p101 – 107
31. Hein R W. Driers for High-Solids Coatings. Journal of Coatings Technology.
1999 (71), number 898, p21 – 25 32. Hein R W. Driers for Waterborne Coatings. Journal of Coatings
Technology. 1998 (70), number 886, p19 – 22 33. Beetsma J. Alkyd emulsion paints: properties, challenges and solutions,
Pigment and Resin Technology, 1998, 1(27), p12 – 19 34. DuLaney D C and Lindsay R H. Drier catalyst for coating compositions:
United States Patent: 4,595,415. http://patft.uspto.gov accessed on the 1st November 2006
35. Nomura M, Nishiyama K, Kasai M and Ishii H. Drier for printing ink and
printing ink containing drier: United States Patent: 6,899,756. http://patft.uspto.gov accessed on the 1st November 2006
36. Anderson J. Activ-8® Drier Accelerator for Paints and Coatings.
http://www.rtvanderbilt.com accessed on the 10th January 2008 37. Anon. Driers: What do we really know about them? Journal of paint
Technology. 1969, (41), issue 538, p623 – 634

References - 149 -
38. Flick E W. Handbook of Paint Raw Materials. Noyes Publications, United States 1989
39. Cells. P L. Drier promoter compositions: United states Patent: 5,141,562.
http://patft.uspto.gov accessed on the 1st November 2006 40. Bieleman J H. Driers and their influence in water-borne, oxidatively drying
surface coantings. Servo Delden BV, The Netherlands, pA-114 to A-132 41. Rakoff H, Kwolek W F and Gast L E. Drier composition and Yellowing of
Linseed Oil Films. Journal of Coatings Technology. 1978, (50), number 637, p51 – 55
42. Wheeler G K, Canty W H and Myers R R. Drier Catalyst Activity of 1,10-
Pheanthroline in Organic Coatings, I & EC Product Research & Development, March, 1962, (1)
43. Heaton N. Outlines of Paint Technology, Third Edition. Butler & Tanner
Limited. Great Britain. 1974 44. http://comarchem.com accessed on the 23rd September 2008 45. http://www.occa.org.za/paintopedia/glossary.htm accessed on the 13th June
2007 46. http://www.borchers.com accessed on the 10th January 2008 47. van Alphen M. Paint Film Components, National Environmental Health
Forum Monographs-General Series No.2, National Environmental Health Forum, 1998
48. Fisher L A. and Hayward G R. The Basics of … Resin Technology. OCCA
student monograph No. 10. The Oil & Colour Chemists’ Association, UK. 1998
49. Lopez-Molinero A, Cebrian M A and Castillo J R. FAAS Determination of
Metals in Complex Paint Driers Using Microwave Sample Mineralization. Atomic Spectroscopy, 2004, (25) number 1, p44 – 51
50. Bruice P A. Organic Chemistry. Prentice-Hall, Inc. New Jersey, 1995 51. Satas D and Tracton A A. Coatings Technology Handbook, second edition.
New York Marcel Dekker Inc, 2001 52. S’Jegers K. Overbased zirconium salts. Index meeting, March 17 1995,
95282.doc:cvdb

References - 150 -
53. Mallégol J, Lemaire J and Gardette J. Drier influence on the curing of linseed oil. Progress in Organic Coatings, 2000, (39), p107 – 113
54. Larock R C. and Kundu P P. Effect of drying catalysts on the properties of
thermal copolymers from conjugated linseed oil-styrene-divinylbenzene. Progress in Organic Coatings, 2008. (available through www.elsevier.com)
55. Kalenda P, Holeček J, Veselý D and Erben Milan. Influence of methyl
groups on ferrocene on rate of drying of oxidizable paints by using model compounds. Progress in Organic Coatings, 2006, (56), p111 – 113
56. Tuman S J, Chamberlain D, Scholsky K. M and Soucek M D. Differential
scanning calorimetry study of linseed oil cured with metal catalysts. Progress in Organic Coatings, 1996, (28), p251 – 258
57. Fisher L A. Lesson 4 – Modifiers to film polymerization. South African Paint
Industry Training Institute, Durban, South Africa (personal communicated) 58. Sherriffs P. Cries of a dying waterway. Environment. The Natal Witness,
Tuesday, February 5, 2002 59. Felder R M. and Rousseau R. W. Elementary Principles of Chemical
Processes, 3rd Ed. John Wiley & Sons, Inc. New York. 2000 60. Clark J H. Chemistry of Waste Minimization. Blackie Academic &
Professional. Glasgow. 1995 61. Majozi T. Wastewater minimisation using central reusable water storage in
batch plants. Computers and Chemical Engineering, 2005, (29), p1631 – 1646
62. Brown N J and Dempster H J. Waste Minimization Techniques and Options
for the Wet and Pretreatment Sections of Coil Coatings. Environmental Progress, October 2004, (23), 3, p185 – 193
63. Crittenden B and Kolaczkowski S. Waste Minimization: A Practical Guide,
Institution of Chemical Engineers, Eastbourne, 1995 64. U.S Environmental Agency, Waste Minimization Opportunity Assessment
Manual, Office of Research and Development, National Risk Management Research Laboratory, EPA 625/7-88/003, Washington, July, 1988
65. Environment Agency, Waste Minimisation – An Environmental Good
Practice Guide For Industry, April, UK, 2001

References - 151 -
66. U.S Environmental Protection Agency, Facility Pollution Prevention Guide, Office of Research and Development, EPA 600/R-92/088, Washington, DC, May 1992
67. Garcia V, Pongrácz E and Keiski R. Waste Minimization in the Chemical
Industry: From Theory to Practice. Accessed in 2002 http://www.oulu.fi/report/wasmm/garcia.pdf
68. Freeman H, Harten T, Springer J, Randall P, Curran M A, and Stone K.
Industrial Pollution Prevention: A Critical Review. J. Air Waste Management Association. 1992, (42), 5, p618 – 56
69. Holt C P, Phillips P S and Bates M P. Effectiveness of Waste Minimization
Projects in Reducing Water Demand in UK Industry. J. of the American Water Resources Association. October 2000, (36), 5, p1013 – 1022
70. Moeletsi J M and Novella P H. Waste Avoidance: Key to Sustainability.
Proceedings of the Biennial Congress of the Institute of Waste Management of Southern Africa, Sun City, 11 – 15th October 2004, p71 – 78
71. Petek J and Glavic P. An integral approach to waste minimization in
process industries. Resources Conservation and Recycling, 1996, (17), 3, p169 – 188
72. Dehab M F, Montag D L and Parr J M. Pollution Prevention and Waste
Minimization at a Galvanizing and Electroplating Facility. Was. Sci. Tech, 1994, (30), 5, p243 – 250
73. Halim I and Srinivasan R. Systematic Waste Minimization in Chemical
Processes. 1. Methodology. Ind. Eng. Chem. Res, 2002, (41), p196 – 207
74. Hawkey S A. An Algorithm for Setting Priorities and Selecting Target Wastes for Minimization. Am. Ind. Hyg. Assoc. J, February 1992, (53), 2, p154 – 156
75. Phillips P S, Barnes R, Bates M P and Coskeran T. A critical appraisal of
an UK county waste minimization programme: The requirement for regional facilitated development of industrial symbiosis/ecology. Resources Conservation & Recycling, Elsevier B. V. UK. 2005
76. Envirowise. Saving money through waste minimization: Raw material use.
March 1996, GG25 (available through: http//www.envirowise.gov.uk)
77. Blomquist P A. Waste Minimisation at an Air-Conditioning Company. MSc. Thesis June 2003. University of Natal, Pietermaritzburg

References - 152 -
78. Draft Bill on Waste Management. Version 3. March 2002, WGII/027/2001 79. Gourlay K A. World of Waste: Dilemmas of Industrial Development. Zed
Books Ltd. London, 1992 80. Waste and Waste Minimisation. Accessed on the 17th May 2001.
http://www.northampton.ac.uk/aps/env/waste_min.htm 81. SEPA. Waste Minimisation. Accessed on the 10th May 2001.
http://www.sepa.org.uk/wastemin/index.htm 82. Mulholland K L and Dyer J A. Process Analysis via Waste Minimization:
Using DuPont’s Methodology to Identify Process Improvement Opportunities. Environmental Progress, 2001, (20), 2, p75 – 79
83. Halim I and Srinivasan R. Systematic Waste Minimization in Chemical
Processes. 2. Intelligent Decision Support System. Ind. Eng. Chem. Res, 2002, (41), p208 – 219
84. Ghassemi A. Handbook of Pollution Control and Waste Minimization.
Marcel Dekker Inc, New York, 2002
85. Moodley K. Application of Analytical Chemistry to Waste Minimisation in the Powder Coating Industry. MSc Thesis 2005, University of KwaZulu-Natal, Pietermaritzburg
86. Environmental Technology Best Practice Programme. Water use in the
Manufacture of Speciality Chemicals. 1997, EG105 guide (available through: http//www.envirowise.gov.uk)
87. ETBPP/ Envirowise. An Environmental Performance Guide. Water Use in
the Manufacture of Speciality Chemicals. Environmental Technology Best Practice Programme. EG105 Guide (available through: http//www.envirowise.gov.uk)
88. Oosthuizen N. Short Course: Waste Classification. The Institute of Waste
Management. La Lucia. South Africa 2007 89. Zbontar L and Glavic P. Total site: Wastewater minimization, wastewater
reuse and regeneration reuse. Resources, Conservation and Recycling, 2000, (30), p261 – 275
90. Environmental Technology Best Practice Programme. Reducing water and
effluent costs in red meat Abattoirs. August 2000, GG234 guide (available through: http//www.envirowise.gov.uk)
References - 153 -
91. Environmental Technology Best Practice Programme. Waste Minimisation Pays: Five business reasons for reducing waste. July 1998, GG125 Presenter’s Guide (available through: http//www.envirowise.gov.uk)
92. Barclay S and Buckley C. A Waste Minimisation Guide for the Textile
Industry, The Pollution Research Group, Water Research Commission, WRC Report No. TT 139/00, 2000
93. Environmental Technology Best Practice Programme. Finding Hidden
Profit: 200 Tips for Reducing Waste. June 1996, ET30 Guide (available through: http//www.envirowise.gov.uk)
94. Bierma T J and Waterstraat Jr. F L. Chemical Management: Reducing
Wastes and Cost though Innovative Supply Strategies. John Wiley & Sons, Inc. USA, 2000
95. United Nations Environment Programme (UNEP). Water and Wastewater
Reuse, An Environmentally Sound Approach for Sustainable Urban Water Management. http://www.unep.or.jp. Accessed on the 6th November 2008
96. Envirowise: Practical Environmental Advice for Business. Cleaner Product
Design: A Practical Approach. September 2001. GG296 (available through: http//www.envirowise.gov.uk)
97. Envirowise: Practical Environmental Advice for Business. Cleaner Product
Design: A Practical Approach. GG294 (available through: http//www.envirowise.gov.uk)
98. Lucchesi C A, Hirn C F. Determination of the metal content of paint driers
EDTA titration in alcohol-benzene solutions. Analytical Chemistry. 1958. (30), No. 11, p1877-1879
99. Anon. Driers for paints and varnishes – Part II. Paintindia. 1993, p43 – 48 100. De Boeck M, Kirsch-Volders M and Lison D. Cobalt and antimony:
genotoxicity and carcinogenicity. Mutation Research, 2003 (533), p135 -152
101. Exxon Chemicals. Synthetic carboxylic acids, determination of metal
content. Based on ISO 4619–1980 102. White H L. Introduction to Industrial Chemistry. John Wiley & Sons, USA,
1986
103. Cazes J. Ewing’s Analytical Instrumentation Handbook. Third edition. Marcel Dekker, Inc., New York, 2005

References - 154 -
104. Evans E H, Day J A, Palmer C, Price W J, Smith C M M, Tyson J F. Atomic spectrometry update. Advances in atomic emission, absorption and fluorescence spectrometry, and related techniques. Journal of Analytical Atomic Spectrometry. 2007, (22), Issue 6, p633 – 696
105. Varian Australia. Varian 720-ES Series ICP Optical Emission
Spectrometers Operational Manual. 2006, Varian Australia Pty Ltd 106. 720-ES and 730-ES ICP Optical Emission Spectrometers Series.
http://www.varianinc.com Accessed on the 16th November 2007
107. Butler O T, Cook J M, Harrington C F, Hill S J, Rieuwerts J, Miles D L. Atomic spectrometry update, Environmental analysis. Journal of Analytical Atomic Spectrometry. 2006, (21), p217 – 243
108. Todoli J L, Gras L, Hernandis V, Mora J. Elemental matrix effects in ICP-
AES. Journal of Analytical Atomic Spectrometry. 2002, (17), p142 – 169
109. Maldonado D, Chirinos J, Benzo Z, Gomez C, Marcano E. Analytical evaluation of a dual micronebulizer sample introduction system for inductively coupled plasma spectrometry. Journal of Analytical Atomic Spectrometry. 2006, (21), p743 – 749
110. Moyano S, Polla G, Smichowski P, Gasquez J A, Martinez L D. On-line
preconcentration and determination of vanadium in tap and river water samples by flow injection-inductively coupled plasma-optical emission spectrometry (FI-ICP-OES). Journal of Analytical Atomic Spectrometry. 2006, (21), p422 – 426
111. Telliard W A. Method 200.7: Trace elements in water, solids, and biosolids
by inductively coupled plasma-atomic emission spectrometry. EPA-821-R-01-010
112. Santos M C, Nobrega J A. Direct analysis of clay and refractory materials
slurries by inductively coupled plasma optical emission spectrometry with axial viewing using the simplified generalized standard additions method. Journal of Analytical Atomic Spectrometry. 2007, (22), p93 – 96
113. Grindlay G, Maestre S, Gras L, Mora J. Introduction of organic solvent
solutions into inductively coupled plasma-atomic emission spectrometry using a microwave assisted sample introduction system. Journal of Analytical Atomic Spectrometry. 2006, (21), p1403 – 1411
114. eThekwini Water Services Laboratory. Analytical test method number
CM096: Determination of 33 elements in raw, potable and waste water by inductively coupled plasma atomic emission spectroscopy. 2002

References - 155 -
115. Ghebregziabher K F. Chemical monitoring and waste minimisation audit in the electroplating industry. MSc. Thesis 2004. University of KwaZulu-Natal, Pietermaritzburg
116. Moreno I M, Gonzalez-Weller D, Gutierrez V, Marino M, Camean A M,
Gonzalez A G, Hardisson A. Differentiation of two DO red wines according to their metal content from inductively coupled plasma optical emission spectrometry and graphite furnace atomic absorption spectrometry by using Probabilistic Neural Networks. Talanta. 2007. (72), p263 – 268
117. Dempster H J. An Assessment of the Pietermaritzburg Waste Minimisation
Club and the Waste Minimisation Opportunities on a coil coating plant. MSc. Thesis July 2002. University of Natal, Pietermaritzburg
118. Haile BT. An Assessment of Heavy Metal and Pesticide Pollution at a
Commercial Airport. MSc Thesis 2004, University of KwaZulu-Natal, Pietermaritzburg
119. Van Eeden G A A. Quality Management System for the Namibia Water
Corporation Limited. MSc Thesis 2004, University of KwaZulu-Natal, Pietermaritzburg
120. Khorrami, A R, Hashempur T, Mahmoudi A, and Karimi A. R,
Determination of ultra trace amounts of cobalt and nickel in water samples by Inductively Coupled Plasma-Optical Emission Spectrometry after preconcentration on modified C18-silica extraction disks, Microchemical Journal, 2006, (84), Issue 1-2, p75 – 79
121. Skoog D A, West D M, Holler F J and Crouch S R. Fundamentals of
Analytical Chemistry, Eighth Edition. 2004, Brooks/Cole – Thomson Learning, Inc. USA
122. de Sousa R A, Silva J C J, Baccan N and Cadore S. Determination of
metals in bottled coconut water using an inductively coupled plasma optical emission spectrometer. Journal of Food Composition and Analysis, 2005, (18), p399 – 408
123. Peña-Vázquez E, Villanueva-Alonso J and Bermejo-Barrera P.
Optimization of a vapour generation method for metal determination using ICP-OES. Journal of Analytical Atomic Spectrometry, 2007, (22), p642 – 649
124. Chan G C Y and Hieftje G M. Warning indicators for the presence of
plasma-related matrix effects in Inductively Coupled Plasma-Atomic Emission Spectrometry. Journal of Analytical Atomic Spectrometry 2008, (23), p181 – 192
References - 156 -
125. de Souza R M, Saraceno A L, da Silveira C L P and Aucélio R Q. Determination of trace elements in crude oil by ICP-OES using ultrasound-assisted acid extraction. Journal of Analytical Atomic Spectrometry, 2006, (21), p1345 – 1349
126. Mendham J, Denney R C, Barnes J D and Thomas M J K. VOGEL’S
Textbook of Quantitative Chemical Analysis, 6th Ed. Pearson Education Limited, UK, 2000
127. Willard H H, Merrit, Jr. L L, Dean J A and Settle, Jr. F A. Instrumental
Methods of Analysis, 7th Ed. 1988, Wadsworth, Inc. USA 128. de J Cronje G J, du Toit G S, Motlatla M D C and de K Marais A.
Introduction to Business Management, Second Edition. Oxford University Press South Africa, Cape Town. 2003
129. Tebbutt T H Y. Principles of Water Quality control, Fifth Edition.
Butterworth- Heinemann. Oxford. 1998 130. The United Nations World Water Development Report 2. Water a shared
responsibility: United Nations Educational, Scientific and Cultural Organization (UNESCO). France. 2006
131. Stephenson R L and Blackburn, Jr J B. The Industrial Wastewater Systems
Handbook. CRC Press LLC. USA. 1998 132. Kirov N Y. Solid Waste Treatment and Disposal, Papers 1, 2 and 28. Ann
Arbor Science Publishers, Inc. USA. 1972 133. HMSO. Analysis of Raw, Potable and Waste Waters. Crown, UK. 1972 134. Benjes, Jr H H. Handbook of Public Water Systems, Second Edition. John
Wiley and Sons, Inc. USA. 2001 135. http://en.wikipedia.org/wiki/white_spirit, accessed on the 3rd of April 2008 136. Gleick P H. Water in Crisis: Paths to Sustainable Water Use. Ecological
Applications, 1998, (8), no. 3, p571 – 579 137. Haines A and Cassels A. Education and debate: Can the millennium
development goals be attained? BMJ. 2004, (329), p394 – 397
138. Young B. Waste Minimisation: An Environmental Good Practice Guide for Industry. Environment Agency. UK, 2001
139. Mann J G and Liu Y A. Industrial water reuse and wastewater minimization.
The McGraw-Hill Companies, Inc. USA. 1999

References - 157 -
140. Yoo C K, Lee T Y, Il M, Jung J H, Han C H, and Lee I. Water reuse Network Design in Process Industries: State of the Art. Monograph (Eco-Industrial Park Workshop. Korea
(Accessed from http://www.kiche.or.kr/files/2006SS2.pdf 18/07/2008)
141. Yee F C, Manan Z A, Yunus R M and Aziz R A. Maximising Water Recovery through Water Pinch Technology – The Use of Water Cascade Table. Malaysia. (Accessed from http://kolmetz.com/pdf/Foo/Environment2003_WCT.pdf on 18/07/2008)
142. Richardson D and Steensgard G. Process Water Reduction Using Water
Pinch Technology. Electric Power Research Institute (EPRI), Inc. USA 1999
143. Strauss K J. Application of Pinch Technology in Water resource
Management to Reduce Water Use and Wastewater Generation for an Area. Water Research Commission Report no. 1241/1/06. CSIR M & Mtek South Africa. 2006
144. Brouckaert C J, Gianadda P, Schneider J P Z, Naylor G M and Buckley C
A. The Application of Pinch Analysis for Water and Effluent Management. Report to the Water Research Commission. Report No 1158/1/05. University of Natal, Durban 2005
145. Brouckaert C J, Gianadda P, Schneider J P Z, Naylor G M and Buckley C
A. The Application of Pinch Analysis for the Rational Management of Water and Effluent in an Industrial Complex. Report to the Water Research Commission. Report No 851/1/03. University of Natal, Durban 2003
146. eThekwini Municipality Bylaws: Sewage Disposal Bylaws. Durban 1999
147. Hlope T V. An Evaluation of the success of the Vulindlela Water supply
Scheme. MSc Thesis 2004, University of KwaZulu-Natal, Pietermaritzburg
148. Petchers N. Combined Heating, Cooling & Power Handbook: Technologies & Applications. An Integrated Approach to Energy Resource Optimization. The Fairmont Press. 2003
149. Griesel M, Kühn A, Kempster P, Mamabolo M and Silberbauer M. Report
on an Integrated Water Quality Monitoring Programme Conducted in the Town of Delmas, November 2005 to June 2006. Department of Water Affairs and Forestry, Pretoria, South Africa. 2006
150. http://www.mg.co.za/article/2005-09-07-delmas-water-supply-blamed-for-
typhoid-outbreak. Accessed on the 15/7/2008
References - 158 -
151. http://www.mg.co.za/article/2005-11-21-delmas-water-investigation-focuses-on-chlorine-levels. Accessed on the 15/7/2008
152. http://www.iol.co.za/general/news/newsprint.php. Accessed on the
15/7/2008
153. http://www.sabcnews.com. News headlines of the (18, 19, 22, & 28) September, (6 & 31) October 2005 and (7, 9, 12, 15, 16) November 2007. Accessed on the 15/7/2008
154. Palmer Development Group. Evaluations of Solid Waste Practice in
Developing Urban Areas of South Africa. WRC Report No 629/1/96
155. Grobicki A. The future of water use in industry. Accessed on the 18/7/2008 http://tf-wpii.cybertest.cz/dokums_pres/water_plenary_grobicka_16.pdf
156. De Boeck M, Kirsch-Volders M and Lison D. Cobalt and antimony:
genotoxicity and carcinogenicity. Mutation Research, 2003, (533), p135 – 152
157. Howgrave-Graham A and van Berkel R. Assessment of Cleaner
Production Uptake: Method Development and Trial with Small Businesses in Western Australia. Journal of Cleaner Production, 2007, (15), p787 –797
158. Abou-Elela S I, Haleem H A, Abou-Taleb E and Ibrahim H S. Application of
Cleaner Production Technology in Chemical Industry: a near zero emission. Journal of Cleaner Production, 2007, (15), p1852 – 1858
159. Foo D C Y, Manan Z A and Tan Y L. Synthesis of maximum water recovery
network for batch process systems. Journal of Cleaner Production, 2005, (13), p1381 – 1394
160. Abou-Elela S I, Nasr F A, Ibrahim H S, Badr N M, and Askalany A R M.
Pollution Prevention pays off in a Board Paper Mill. Journal of Cleaner Production, 2008, (16), p330 – 334
161. Envirowise. Cleaner Product Design: A practical Approach. GG296 Guide (available through: http//www.envirowise.gov.uk)
162. Ismail F, Mulholland D A and Marsh J J. An Analysis of the Water soluble
Components of Sappi Saiccor’s Effluent Streams. Water SA, 2005 (31), 4, p569 – 574

Appendix A
This section gives the structure of epoxy resin as well as the description of the drying
and cross-linking of the binder with special reference to an alkyd resin.

Appendix A - 160 -
C
CH3
CH3
O CH2 C
O
OCH2C
H
H2C
O
CH2
Hn
Figure A1 The chemical structure of an epoxy resin
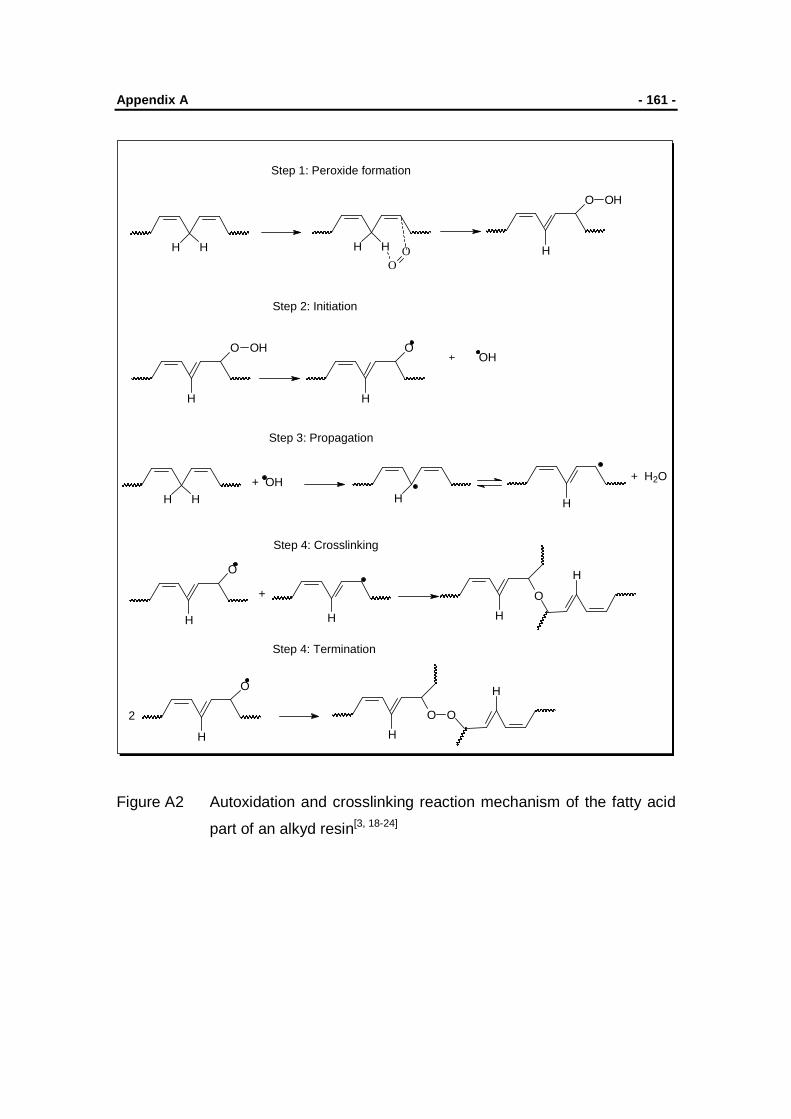
Appendix A - 161 -
H H H H OO
O OH
H
Step 1: Peroxide formation
O OH
H
O
H
OH
Step 2: Initiation
H H H H
+ H2O
Step 3: Propagation
O
H
+
H
O
H
H
Step 4: Crosslinking
O
H
2
H
O O
H
Step 4: Termination
+ OH
Figure A2 Autoxidation and crosslinking reaction mechanism of the fatty acid
part of an alkyd resin[3, 18-24]

Appendix B
This section gives graphic representations of raw material usage in PD plant. The
percent values were calculated from the figures extracted from the SMFD sheets.

Appendix B - 163 -
Figure B1 Percent usage of fresh water at the PD plant excluding cleaning
Co
84%
K 1%
Mn
8%
Cu
4%
Na
3%

Appendix B - 164 -
Figure B2 Percent usage of sodium hydroxide at the PD plant
Figure B3 Percent usage of 2-ethyl hexanoic acid at the PD plant
Co 87%
Mn 10%
Na 1%
Cu
2%
Ca30%
Co 31%
Cu 1%
Pb 11%
K 3%Mn 4%
Na 1%
Zr 14%
Zn5%

Appendix B - 165 -
Figure B4 Percent usage of white spirit at the PD plant
Figure B5 Percent usage of naphthenic acid at the PD plant
Ca 36%
Co24%
Cu1%
Pb 11%
Zr
13%
DRIER BLENDS7%
Mn 2%
Zn
5%K
1%
Co
53%
Cu17%
Pb
7% Mn 2% Zn
20%
Ca
1%

Appendix B - 166 -
Figure B6 Percent usage of methanol at the PD plant
Figure B7 Percent usage of Versatic acid at the PD plant
Ca 15%
Mn 53%
K
32%
Ca 31%
Co
15%
Pb
34%
Mn
4%
K
1%
Zn 2% Zr
13%

Appendix C
Three graphic representations of percent production are given in this section. The first
graph describes the production of single driers only. Single driers and total blends
production per annum are illustrated by the second graph. The final graph represents
product percent of drier blends only.

Appendix C - 168 -
Figure C1 Percent metal PD production per annum excluding drier blends
BARIUM 0.3%
CALCIUM 31.4%
MANGANESE3.6%
COBALT 25.1%
COPPER 1.1%
LEAD 15.7%
ZINC 5.9%
ZIRCONIUM14.3%
POTASSIUM 2.1%
SODIUM 0.5%

Appendix C - 169 -
Figure C2 Percent Production including drier blends
0
5
10
15
20
25
30
Per
cent
age
Ba Ca Mn Co Cu Pb K Na Zn Zr
Metal Drier BLE
ND
S

Appendix C - 170 -
Figure C3 Percent metal drier blends production per annum
0
5
10
15
20
25
30
35
40
45
50
D048N LF7N LF9N LF11 CAL-DRY PUTTY
PLUS N
Drier Blends
Per
cent
DRIER LFC

Appendix D
Graphic representation of amount of wastewater collected and the disposal costs for
each month are given in this section.

Appendix D - 172 -
14.73
8.83
15.64
4.21
2.24
6.90
9.08
6.62
9.15
13.77
4.474.36
0.0
2.0
4.0
6.0
8.0
10.0
12.0
14.0
16.0
18.0
Jan Feb Mar Apr May Jun Jul Aug Sep Oct Nov Dec
Year 2006
Per
cent
Percent Wastewater Collected Percent Amount Paid
Figure D1 Effluent amount collected and respective disposal costs per month

Appendix E
Two reports and a final presentation were made to the company during the lifespan of
this project. The first report, which is not included in this dissertation, looked at the two
processes of interest taking place in the paint drier production site. The second report,
which is Appendix E in this document, looked at preliminary investigations that were
made during the project. The final report, also not part of this dissertation, was in the
form of a presentation to the company management personnel. It was during the
presentation meeting wherein purified salts from the two streams were also presented.
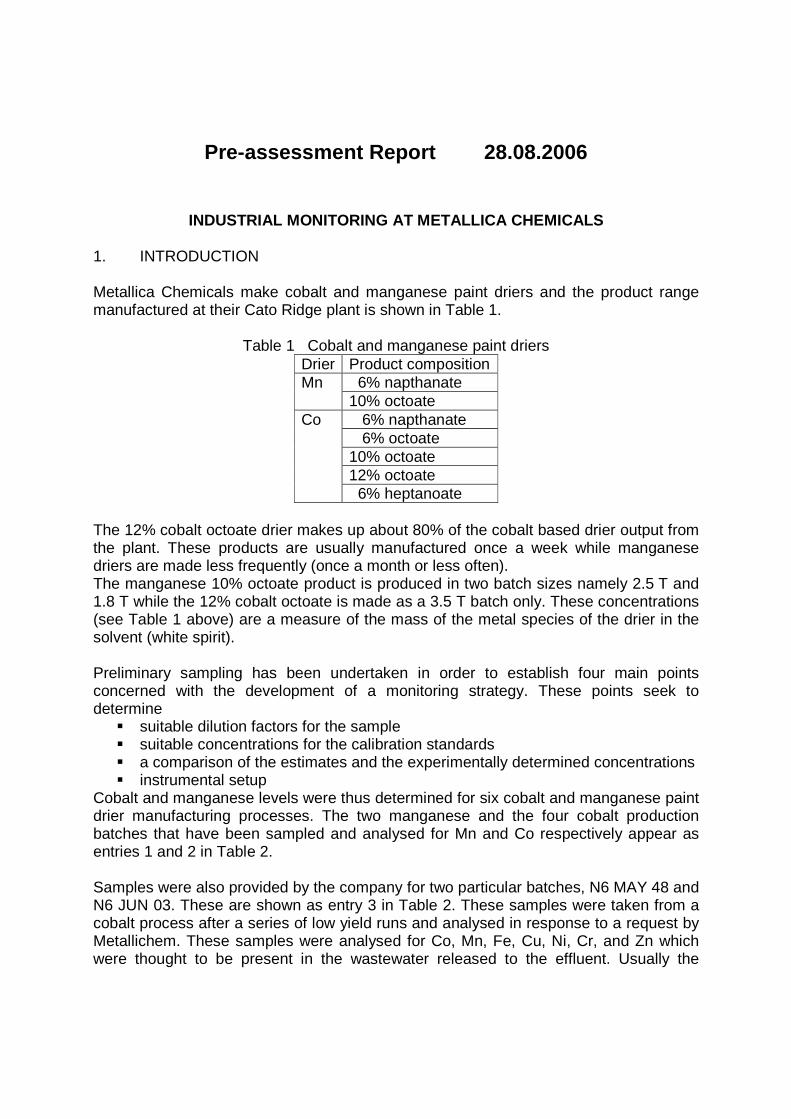
Pre-assessment Report 28.08.2006
INDUSTRIAL MONITORING AT METALLICA CHEMICALS
1. INTRODUCTION
Metallica Chemicals make cobalt and manganese paint driers and the product range manufactured at their Cato Ridge plant is shown in Table 1.
Table 1 Cobalt and manganese paint driers Drier Product composition Mn 6% napthanate
10% octoate Co 6% napthanate
6% octoate 10% octoate 12% octoate 6% heptanoate
The 12% cobalt octoate drier makes up about 80% of the cobalt based drier output from the plant. These products are usually manufactured once a week while manganese driers are made less frequently (once a month or less often). The manganese 10% octoate product is produced in two batch sizes namely 2.5 T and 1.8 T while the 12% cobalt octoate is made as a 3.5 T batch only. These concentrations (see Table 1 above) are a measure of the mass of the metal species of the drier in the solvent (white spirit). Preliminary sampling has been undertaken in order to establish four main points concerned with the development of a monitoring strategy. These points seek to determine
� suitable dilution factors for the sample � suitable concentrations for the calibration standards � a comparison of the estimates and the experimentally determined concentrations � instrumental setup
Cobalt and manganese levels were thus determined for six cobalt and manganese paint drier manufacturing processes. The two manganese and the four cobalt production batches that have been sampled and analysed for Mn and Co respectively appear as entries 1 and 2 in Table 2. Samples were also provided by the company for two particular batches, N6 MAY 48 and N6 JUN 03. These are shown as entry 3 in Table 2. These samples were taken from a cobalt process after a series of low yield runs and analysed in response to a request by Metallichem. These samples were analysed for Co, Mn, Fe, Cu, Ni, Cr, and Zn which were thought to be present in the wastewater released to the effluent. Usually the

Appendix E - 175 -
solvent wastewater is sent to the effluent pit while the wash wastewater is stored in flow bins for reuse. It was expected that the levels of Co and Mn present, determined from the wastewater analyses, would be significantly higher than those of the trace metal measured during the multi-metal analysis for Fe, Ni, Zn, Cu and Cr. This is because Co is present in the unreacted raw material CoSO4.7H2O while Fe, Ni, Zn, Cu and Cr are thought to be trace impurities in this compound. Table 2 Paint drier processes sampled during preliminary monitoring
Drier Entries Date Batch no. Product composition
Amount of Product (kg)
Mn 1 27.01.06 N6 JAN 25 10 % octoate 2345 27.02.06 N6 FEB 32 10 % octoate 1802
Co 2 6.02.06 N6 FEB 04 12 % octoate 3395 6.03.06 N6 MAR 06 12 % octoate 3459 8.03.06 N6 MAR 10 12 % octoate 3876 14.03.06 N6 MAR 17 12 % octoate 3598
3 31.05.06 N6 MAY 48 12 % octoate 3314 2.06.06 N6 JUN 03 6% napthanate Unknown
The sampling procedure used is discussed in Section 2. Cobalt and manganese analysis using inductively coupled plasma optical emission spectroscopy (ICP - OES) has been carried out on all the samples taken during the six processes shown in entries 1 and 2 of Table 2. A multi-element analysis was carried out using samples provided in entry 3 of Table 2. The analytical procedure is discussed in Section 3 and the results and discussion are presented in Section 4 and Section 5 respectively. In conclusion, Section 6 presents a proposed monitoring strategy based on the findings presented in Sections 4 and 5. 2. SAMPLING PROCEDURE 2.1 PRE- AND POST- SAMPLING Cleaned and labelled (with a unique identification number) sampling bottles (125 ml and 500 ml volume) were taken on-site in a cooler box. Two 125 ml and one 500 ml samples were taken at each sampling point. The solvent wastewater (see Table 3) sample was taken as soon after it was discharged from the reactor as possible. The samples were then immediately stored in the cooler box. Samples were then randomly taken at 15 to 30 minutes intervals while the solvent wastewater was being released. The wash wastewater (see Table 3) was similarly sampled as it was released from the reactor. On the occasions where site personnel took the sample, only one sample was obtained for discharging spent solvents and washings. The distillate (see Table 3) for both processes was sampled only once. Samples were then taken back to the Analytical Chemistry Laboratory at UKZN in Pietermaritzburg. The conductivity of each

Appendix E - 176 -
solution was measured and one of the two 125 ml samples from each sampling point was acidified with about 5 ml of concentrated nitric acid before storing prior to chemical and gravimetric analyses. 2.2 SAMPLING STRATEGY FOR MONITORING COBALT AND MANGANESE
LEVELS A total of thirty nine samples have been collected for the six processes shown in Table 2 (entries 1 and 2). Nine samples have been collected from the manganese processes and thirty samples have been taken from the cobalt processes. The sampling points from which the manganese and the cobalt samples were taken are described in Tables 3 and 4 respectively. Three samples were collected at each sampling point, two 125 ml samples (one treated with nitric acid and the other one untreated) for ICP-OES analysis and a 500 ml sample for gravimetric analysis. The conductivity of the samples was measured, recorded and all samples were then stored in the refrigerator. Table 3 Samples taken during the manganese octoate manufacture in Reactor 5
Sample description
Source of Sample Date samples
taken
Number of samples
taken Raw materials
Manganese sulfate from the suppliers packaging
27.1.06 0 27.2.06 2
Utility outlet Fresh mains water from tap 27.1.06 1 27.2.06 0
Solvent wastewater
Manganese containing solvent wastewater discharged from reactor to effluent pit after reaction complete
27.1.06 1 27.2.06 3
Distillate wastewater
Mixture of wastewater and spirit discharged into a metal drum from reactor during distillation.
27.1.06 1 27.2.06 1

Appendix E - 177 -
Table 4 Samples taken during cobalt octoate manufacture in Reactor 6 Sample
description Source of sample Date
samples taken
Number of samples
taken Solid raw materials
Cobalt sulfate & Caustic soda flakes from the supplier’s packaging
6.2.06 1 6.3.06 1 8.3.06 1 14.3.06 0
Fresh solvent water
Water added to reactor before any chemical additions were made
6.2.06 1 6.3.06 0 8.3.06 0 14.3.06 0
Utility outlet Mains water from tap 6.2.06 1 6.3.06 1 8.3.06 0 14.3.06 0
Solvent wastewater
Co containing solvent wastewater discharged from the bottom of the reactor into the effluent after reaction comes to completion
6.2.06 6 6.3.06 1 8.3.06 3 14.3.06 2
Wash wastewater
Co containing wash wastewater discharged from the reactor into the flow bin
6.2.06 4 6.3.06 1 8.3.06 1 14.3.06 2
Distillate wastewater
Reusable wastewater discharged from reactor during distillation into a metal/plastic drum
6.2.06 1 6.3.06 1 8.3.06 1 14.3.06 1
2.3 SAMPLING FOR THE MULTI-ELEMENTAL ANALYSIS Samples from N6 MAY 48 and N6 JUN 03 batches (entry 3 in Table 2) were taken by the staff at Metallichem. They were kept in 100 ml glass bottles. These samples were labelled 1) with a date, 2) batch number and 3) with an indication of whether is the solvent wastewater, wash wastewater or distillate wastewater. Where more than one sample was taken from solvent, wash or distillate wastewater, these were differentiated by numbers (1, 2, 3 and 4) or volume of wastewater which had been released (e.g. 1 L, 800 L or 2000 L). None of the samples collected by the employees of Metallichem had been preserved with nitric acid and all were submitted in glass bottles.

Appendix E - 178 -
3. SAMPLE ANALYSIS Section 3.1 describes how samples were prepared for cobalt and manganese analyses, these elements being present as unreacted starting material. Section 3.2 describes the sample preparation used when analysing for impurities in the metal containing raw material.
3.1 PREPARING SAMPLES FOR COBALT AND MANGANESE ANALYSIS Both acidified and non-acidified samples were filtered and diluted for ICP-OES analysis. About 5 ml of the sample was drawn up into a disposable syringe. It was then released from the syringe, through a 30 mm diameter filter (0.45 µm pore size) fitted to the syringe tip, into a clean 100 ml beaker. Then 200 µl of the filtered sample was pipetted, using an Eppendorf pipette, into a 100 ml volumetric flask and diluted with distilled water up to the mark. 3.2 PREPARING SAMPLES FOR MULTI-ELEMENTS ANALYSIS About 10 ml of each sample from both batches (N6 MAY 48 and N6 JUN 03) was drawn up into a disposable syringe and filtered into a clean 100 ml beaker using a 30 mm diameter nylon syringe filter (0.45 µm) pore size for ICP-OES analysis. 1.0 ml of the filtered sample was pipetted, using an Eppendorf pipette, into a 50 ml volumetric flask and diluted with distilled water up to the mark and it was then analysed using ICP-OES instrument. 3.3 PREPARATION OF CALIBRATION STANDARDS Stock standard solutions (100 ml) of Co and of Mn were prepared from purchased 1000 ppm commercial standard solutions (Fluka). The concentrations chosen for these standard solutions (numbered 1 to 6) are given in column 2 of Table 5. These concentrations were selected based on trial and error because no process data was able to be made available by the company at that time. The volume of the commercial standard solution used to prepare these standards was calculated using the dilution factor (see Equations 1 and 2) and is given in column 3 of Table 5.
1EquationdardtansstockofionConcentrat
dardtanscommercialofionConcentratfactorDilution =
2EquationfactorDilution
dardtansstockofVolumedardtanscommercialofVolume =

Appendix E - 179 -
Table 5 Stock standards prepared from 1000 ppm Co & Mn Standard solution number
Concentration (ppm) of Co & Mn stock standards
Dilution factor
Volume (ml) taken from
1000 ppm solution 1 25 40 2.50 2 50 20 5.00 3 100 10 10.00 4 200 5 20.00 5 400 2.5 40.00 6 800 1.25 80.00
Preliminary results obtained after analysing few samples using standard solutions given in Table 5 showed that the concentration of the samples were too low compared to the chosen stock standard. A set of cobalt and manganese mixed calibration standards with concentration ranging from 0.20 ppm to 5.0 ppm and 2.0 ppm to 50 ppm respectively were then prepared. These standards were prepared by further dilution of standard 2 (for cobalt) and standard 3 (for manganese) (see Table 5 above). The volumes of these standards, which were taken to make the calibration standards, (see columns 4 and 5 of Table 6) were calculated using Equations 1 and 2. Table 6 Mixed calibration standards prepared from 50 ppm Co & 100 ppm Mn
Standard number
Concentration (ppm) of calibration standards
Volume (ml) taken of Co
solution
Volume (ml) taken of Mn
solution Co Mn 1 5.0 50.0 10.0 50.0 2 2.0 20.0 4.0 20.0 3 1.0 10.0 2.0 10.0 4 0.50 5.0 1.0 5.0 5 0.20 2.0 0.50 2.0
Two series of multi-elemental calibration standards, one containing Co, Mn, Fe, Zn, Cu, & Ni and another containing Co, Mn, & Cr, were prepared. For the first multi-element analysis, a series of Co, Mn, Fe, Zn, Cu and Ni mixed calibration standards were then prepared. The concentration of the five calibration solutions containing Co and Mn and the four trace elements are given in Table 7. A second series of calibration standards containing Co, Mn and Cr, shown in Table 8, were prepared in order to analyse for low levels of chromium.

Appendix E - 180 -
Table 7 Mixed calibration standards for Co, Mn, Fe, Zn, Cu and Ni analysis Standard number
Concentration (ppm) of calibration standards
Co Mn Fe Zn Cu Ni
1 0.50 0.80 0.30 0.20 0.40 0.60 2 1.0 2.0 0.50 0.40 0.80 1.2 3 5.0 10 1.0 0.80 1.2 2.0 4 10 20 5.0 1.5 2.0 2.5 5 20 30 10 2.0 2.5 3.0
Table 8 Mixed calibration standards for Co, Mn and Cr analysis
Standard number Concentration (ppm) of calibration standards
Co Mn Cr
1 0.50 0.60 0.20 2 1.0 1.2 0.50 3 5.0 12 1.0 4 10 20 2.0 5 15 25 10 6 20 30 15
3.4 SAMPLE ANALYSIS The ICP-OES instrument was calibrated using standards given in Tables 6, 7 and 8. A good correlation for each of the Co, Mn, Fe, Zn, Cu, Ni and Cr standards was obtained for calibration of the ICP-OES instrument. The conditions under which samples were analysed by ICP-OES are given in Table 9. Table 9 ICP-OES specifications and operating conditions
Power 1.00 kW Plasma 15.0 L/min Auxiliary 1.50 L/min
Pump speed 15.0 rpm Nebulizer 200 kPa for pneumatic
240 kPa for ultrasonic Stabilization time 15 s
Rinse time 10 s Sample delay 30 s
Replicates 3 The wavelength used for each metal and theoretical detection limit of the instrument for the metal ions whose concentrations was being determined is given in Table 10.

Appendix E - 181 -
Table 10 Selected wavelengths and instrument detection limit Element Co Mn Fe Zn Cu Ni Cr Wavelength (nm)
237.862 260.569 259.94 213.856 324.754 231.604 267.716
Theoretical detection limit (mg/L)
0.050 to 2500
0.004 to 200
0.015 to 750
0.009 to 450
0.020 to 1000
0.060 to 3000
0.040 to 2000
4. RESULTS The Co and Mn concentrations obtained from ICP-OES analysis of acidified and non-acidified solution samples (entries 1 and 2 of Table 2) are given in Tables 11 to 16 below. Tables 17 and 18 provide results obtained when carrying out the multi-elements analyses on samples presented as entry 3 in Table 2. Measured concentrations for the analytical samples are given in columns 5 and the calculated concentration values for the original samples appear in column 6 of Tables 11 to 16. With the exception of samples MV002, MV009 and MV069, which were not diluted, the concentration of the original sample, i.e. before dilution, was calculated using Equations 3 and 4. Conductivity (referred to as Cond in Tables 11 to 16) values for the non-acidified samples are also presented in these tables. In Tables 11, 12 and 14 the sampling time is also recorded because more than one solvent and/or wash wastewater samples were taken. The abbreviation “ND” has been used to represent the measured concentration when it was observed to be below the concentration of the lowest calibration standard.
3EquationusedsampleoriginalofVolume
sampledilutedofVolumefactorDilution =
sampledilute
EquationfactorDilutionofionConcentratsampleoriginalofionConcentrat 4×=

Appendix E - 182 -
Table 11 Average metal concentration (ppm) and solution conductivity (mS/cm) in manganese drier samples collected from Reactor 6 on 27.1.06
Source of Sample
Cond Sample number
Sample treatment
Analytical sample Original sample [Co] [Mn] [Co]
[Mn]
Mains 0.37 MV002 None ND 0.56 ND 0.56
Solvent wastewater
126 MV003 Acidified ND 15.0 ND 7.50x10³
MV004 None ND 14.5 ND 7.26x10³
Distillate wastewater
0.95 MV005 None 0.49 ND 245 ND MV006 Acidified 0.27 ND 136 ND
Table 12 Average metal concentration (ppm) and solution conductivity (mS/cm) in manganese drier samples collected from Reactor 5 on 27.2.06
Sample source Cond Sample number
Sample treatment
Analytical sample
Original sample
[Co] [Mn] [Co] [Mn] Solvent wastewater taken at 16:10 131
MV051 None ND 5.57 ND 2 .78 x103
MV057 Acidified ND 5.25 ND 2 .62 x103 Solvent wastewater taken at 16:20 134
MV055 None ND 6.81 ND 3. 41 x103 MV056 Acidified ND 6.35 ND 3.18 x10³
Solvent wastewater taken at 16:40
130
MV060 None ND 5.50 ND 2.75 x10³ MV061 Acidified ND 5.36 ND 2.68 x10³ MV062 None ND 5.27 ND 2.63 x10³
Distillate wastewater taken at 10:35 0.15
MV066 None ND ND ND ND MV067 Acidified ND ND ND ND

Appendix E - 183 -
Table 13 Average metal concentration (ppm) and solution conductivity (mS/cm) in cobalt drier samples collected from Reactor 6 on 6.2.06 Source of sample
Cond Sample number
Sample treatment
Analytical sample
Original sample
[Co] [Mn] [Co] [Mn] Water inside tank MV008 None 0.226 ND 0.226 ND Mains water MV009 None ND ND ND ND Solvent wastewater sampled at 15:15
125
MV015 None 0.365 ND 183 ND MV016 Acidified 0.433 0.115 217 57.6 MV018 Acidified 0.353 ND 176 ND MV019 Acidified 0.428 ND 214 ND
Solvent wastewater sampled at 15:30
125 MV022 None 0.435 ND 218 ND MV023 None 0.427 ND 214 ND
Solvent wastewater sampled at 15:45
125 MV025 Acidified 0.432 ND 216 ND MV026 None 0.494 ND 247 ND
Solvent wastewater sampled at 16:05
126 MV028 Acidified 0.461 ND 230 ND MV030 None 0.458 ND 229 ND
Solvent wastewater sampled at 16:20
125 MV031 Acidified 0.455 ND 228 ND MV032 None 0.448 ND 224 ND
Solvent wastewater sampled at 16:50
125 MV034 None 0.469 ND 235 ND
MV035 Acidified 0.503 ND 252 ND
Wash wastewater sampled at 17:45
35 MV040 None 0.311 ND 156 ND MV041 Acidified 0.3899 ND 195 ND
Wash wastewater sampled at 17:55
34.7 MV043 None 0.0817 ND 40.8 ND MV044 Acidified 0.0894 ND 44.7 ND
Wash wastewater sampled at 18:05
34.8
MV046 None 0.140 ND 70.2 ND MV047 Acidified ND ND ND ND
Wash wastewater sampled at 18:17
35 MV049 None ND ND ND ND MV050 Acidified ND ND ND ND
Distillate wastewater
MV D1 None 0.208 ND 104 ND MVD2 Acidified 0.121 ND 60.4 ND

Appendix E - 184 -
Table 14 Average metal concentration (ppm) and solution conductivity (mS/cm) in cobalt drier samples collected from Reactor 6 on 6.3.06
Source of sample Cond Sample number
Sample treatment
Analytical sample Original sample
[Co] [Mn] [Co] [Mn]
Mains water MV069 None 0.206 0.914 0.206 0.914 Solvent wastewater 123 MV073 Acidified 0.348 ND 174 ND
MV074 None 0.468 ND 234. ND Wash wastewater 36.9 MV077 None 0.118 ND 59 ND
MV078 Acidified ND 0.127 ND 63.4 Distillate wastewater 0.74 MV080 None ND ND ND ND
MV081 Acidified ND ND ND ND Table 15 Average metal concentration (ppm) and solution conductivity (mS/cm) in cobalt drier samples collected from Reactor 6 on 6.3.06
Source of sample Cond Sample number
Sample treatment
Analytical sample Original sample [Co] [Mn] [Co] [Mn]
Solvent wastewater sampled at 18:55
128 MV083 None 0.208 ND 104 ND MV085 None 0.171 ND 85.5 ND
Solvent wastewater sampled at 19:25
102 MV086 None 0.203 ND 101.5 ND MV088 None 0.173 ND 86.5 ND
Solvent wastewater sampled at 20:25
111 MV090 None 0.193 ND 96.5 ND MV091 None 0.234 ND 117 ND
Wash wastewater 40.8
MV093 None ND ND ND ND MV094 Acidified 0.132 ND 66 ND
Distillate wastewater ND
MV095 None ND ND ND ND MV097 Acidified ND ND ND ND
Table 16 Average metal concentration (ppm) and solution conductivity (mS/cm) in cobalt drier samples collected from Reactor 6 on 14.3.06
Source of sample Cond Sample number
Sample treatment
Analytical sample Original sample [Co] [Mn] [Co] [Mn]
Solvent wastewater
128 MV099 Acidified 0.435 ND 217.5 ND MV100 None 0.548 ND 274 ND
126 MV102 None 0.569 ND 284.5 ND MV103 Acidified 0.427 ND 213.5 ND
Wash wastewater
38
MV104 None 0.277 ND 138.5 ND MV106 Acidified 0.126 ND 63 ND MV108 None 0.201 ND 100.5 ND MV109 Acidified 0.412 ND 206 ND MV110 None 0.205 ND 102.5 ND
Distillate wastewater ND
MV115 None ND ND ND ND MV116 Acidified ND ND ND ND

Appendix E - 185 -
Table 17 Average metal concentration (ppm) in cobalt drier samples, (N6 May 48) collected on 31st May 2006.
Sample source
Sampling point
Analytical sample Original sample
[Co] [Mn] [Fe] [Zn] [Ni] [Cu] [Cr] [Co] [Mn] [Fe] [Zn] [Ni] [Cu] [Cr]
Solvent wastewater
1 L 1.86 ND ND ND ND ND ND 93.1 ND ND ND ND ND ND
800 L ND ND ND ND ND ND ND ND ND ND ND ND ND ND
2000 L 1.75 ND ND ND ND ND ND 87.3 ND ND ND ND ND ND
Wash wastewater
1 2.37 ND ND ND ND ND ND 118 ND ND ND ND ND ND
2 2.33 ND ND ND ND ND ND 117 ND ND ND ND ND ND
3 1.93 ND ND ND ND ND ND 96.4 ND ND ND ND ND ND
4 5.55 ND ND ND ND ND ND 277 ND ND ND ND ND ND
Distillate wastewater
1 ND ND ND ND ND ND ND ND ND ND ND ND ND ND 2 0.196 ND ND 0.019 ND ND ND 9.81 ND ND 0.971 ND ND ND
Table 18 Average metal concentration (ppm) in cobalt drier samples, (N6 JUN 03) collected on 2nd June 2006
Sample source
Sampling point
Analytical sample Original sample
[Co] [Mn] [Fe] [Zn] [Ni] [Cu] [Cr] [Co] [Mn] [Fe] [Zn] [Ni] [Cu] [Cr]
Solvent
wastewater
1 0.632 ND ND ND ND ND ND 31.6 ND ND ND ND ND ND 2 1.31 ND ND ND ND ND ND 65.5 ND ND ND ND ND ND
3 2.84 ND ND ND ND ND ND 142 ND ND ND ND ND ND
Wash wastewater
Fast 2.50 ND ND ND ND ND ND 125 ND ND ND ND ND ND
Slow 1.47 ND ND ND ND ND ND 73.5 ND ND ND ND ND ND
1L 2.35 ND ND ND ND ND ND 117 ND ND ND ND ND ND
No number
2.53 ND ND ND ND ND ND 126 ND ND ND ND ND ND
The entries in the second column of Tables 17 and 18 are described in section 2.3 above.

Appendix E - 186 -
5. DISCUSSION In this section the levels of cobalt, manganese, sodium and sulfate in the solvent water are estimated from the specified quantities. These estimated concentrations are then compared to those measured in solvent wastewater, wash wastewater and distillate wastewater solution and the results expressed as dilution factors where appropriate. The company produces (an untitled) document that prescribes the specification as the percentage composition of the reaction mixture which goes into the reactor. It also gives a batch size for the output {cobalt octoate in white spirit (w/s)} mass. A second instruction-type document goes out to the operator who is making the batch on the plant. It is entitled the “Standard Manufacturing Formulation”, SMF. This quotes the percentage composition (as given in the formulation specification of the first document) and the actual masses (kg) of each raw material which will be used in that particular batch. A rough estimate of the cobalt, sodium and sulfate levels in the solvent wastewater can be obtained from the figures quoted in the SFM. Table 19 shows the masses and moles of three reactants, namely cobalt sulfate heptahydrate (CoSO4.7H2O), ethyl hexanoic acid (2-EH) and sodium hydroxide (NaOH) as well as the solvent which was added to the reactor for the production of 12% cobalt octoate. Water was used to dissolve the solid starting materials and white spirit to extract the cobalt octoate product from the aqueous layer. There follows an example of the calculation of the cobalt, sodium and sulfate levels in the spent solvent water using the SMF data available on-site for the cobalt octoate drier. Table 19 Quantities of raw materials used to produce 3395 kg cobalt octoate
Substance added to reactor Mass (kg) Moles CoSO4.7H2O prescribed 2000 7.12 x10³ Co in 2000 kg in CoSO47H2O 419 7.12 x10³ SO4 in 2000 kg in CoSO47H2O 684 7.12 x10³ Ethyl hexanoic acid prescribed 2256 1.56 x 10⁴
NaOH prescribed 615 1.54 x 10⁴
Na in 615 kg NaOH 353 1.54 x 10⁴ Solvent water prescribed 2050 White spirit prescribed 900 Co(C7H15CO2)2 formed 2459 7.12 x10³ Co in 2459 kg Co(C7H15CO2)2 419
Table 19 shows that NaOH and 2-EH are present in a 1:1 mole ratio in the reaction mixture with 2-EH slight excess. This reaction ratio is consistent with that shown in the balanced equation for the conversion of the acid to the sodium salt (see Equation 5). This means that a similar number of moles of water will be formed which is equivalent to a volume of 0.277 m3.
NaOH(aq) + C7H15COOH(aq) → C7H15COONa(aq) + H2O(l) Equation 5
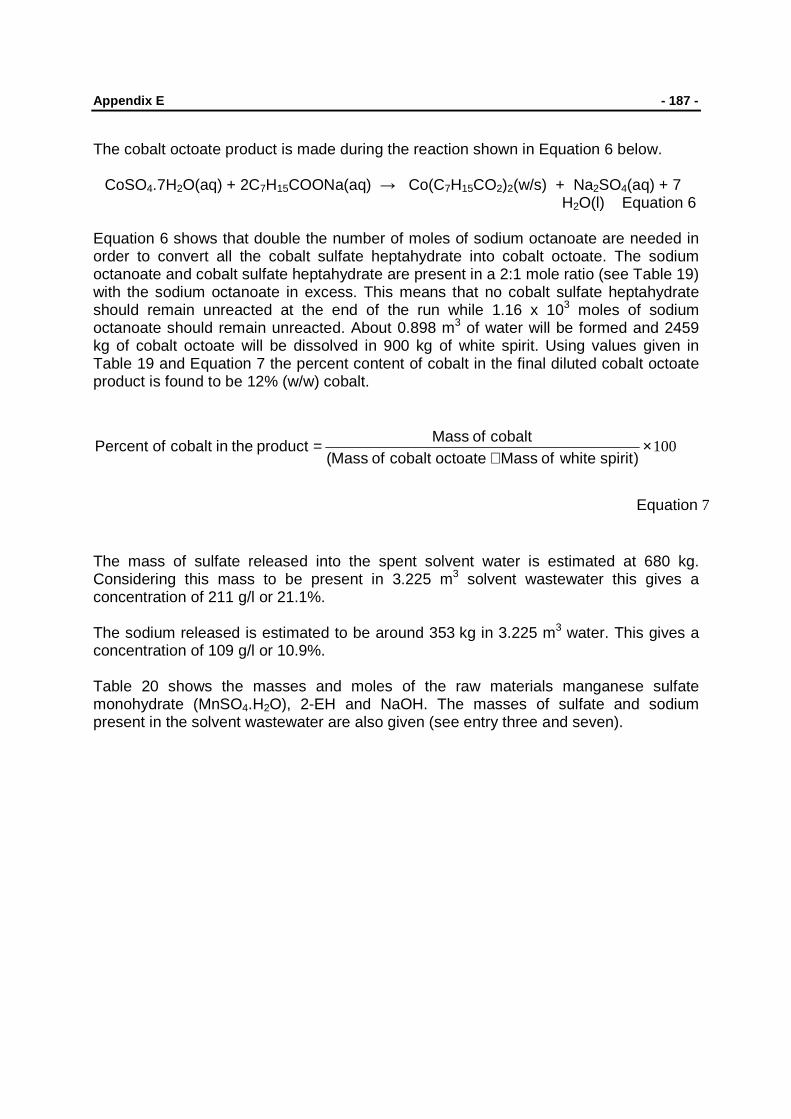
Appendix E - 187 -
The cobalt octoate product is made during the reaction shown in Equation 6 below.
CoSO4.7H2O(aq) + 2C7H15COONa(aq) → Co(C7H15CO2)2(w/s) + Na2SO4(aq) + 7 H2O(l) Equation 6
Equation 6 shows that double the number of moles of sodium octanoate are needed in order to convert all the cobalt sulfate heptahydrate into cobalt octoate. The sodium octanoate and cobalt sulfate heptahydrate are present in a 2:1 mole ratio (see Table 19) with the sodium octanoate in excess. This means that no cobalt sulfate heptahydrate should remain unreacted at the end of the run while 1.16 x 10³ moles of sodium octanoate should remain unreacted. About 0.898 m3 of water will be formed and 2459 kg of cobalt octoate will be dissolved in 900 kg of white spirit. Using values given in Table 19 and Equation 7 the percent content of cobalt in the final diluted cobalt octoate product is found to be 12% (w/w) cobalt.
7
100
Equation
)spiritwhiteofMassoctoatecobaltofMass(cobaltofMass
producttheincobaltofPercent ×+
=
The mass of sulfate released into the spent solvent water is estimated at 680 kg. Considering this mass to be present in 3.225 m3 solvent wastewater this gives a concentration of 211 g/l or 21.1%. The sodium released is estimated to be around 353 kg in 3.225 m3 water. This gives a concentration of 109 g/l or 10.9%. Table 20 shows the masses and moles of the raw materials manganese sulfate monohydrate (MnSO4.H2O), 2-EH and NaOH. The masses of sulfate and sodium present in the solvent wastewater are also given (see entry three and seven).

Appendix E - 188 -
Table 20 Quantities of raw materials used to produce manganese octoate
Substance added to reactor 1.8 T Batch size 2.5 T Batch size Mass (kg) Moles Mass (kg) Moles
MnSO4.H2O prescribed 576 3.41 x 10³ 800 4.73 x 10³
Mn in prescribed MnSO4.H2O 187 3.41 x 10³ 260 4.73 x 10³ SO4 in prescribed MnSO4.H2O 327 3.41 x 10³ 451 4.73 x 10³ Ethyl hexanoic acid prescribed 1063 7.37 x 10³ 1478 10.25 x 10³ Priolene acid 106 0.375 x 10³ 148 0.524 x 10³ NaOH prescribed 270 6.75 x 10³ 375 9.37 x 10³ Na in NaOH 155 6.75 x 10³ 215 9.37 x 10³ Solvent water prescribed 863 1200 White spirit prescribed 273 380 Methanol 158 220 Mn(C7H15CO2)2 1164 3.41 x 10³ 1615 4.73 x 10³ Mn in mass of Mn(C7H15CO2)2 187 260
As in the manufacture of cobalt octoate, the specification data shows that NaOH and 2-EH are present in a 1:1 mole ratio for the production of manganese octoate (see Table 20) in this reaction mixture. This is consistent with the balanced equation for the conversion of the acid to the sodium salt as shown in Equation 5. This means that a similar number of moles of water will be formed equivalent to a volume of 0.122 m3 or 0.169 m3 (see Table 20) for 1.8 T and 2.5 T of product respectively. The manganate octoate product is made during the reaction shown in Equation 8 below.
MnSO4.H2O(aq) + 2C7H15COONa(aq) → Mn(C7H15CO2)2(w/s) + Na2SO4(aq) + H2O(l) Equation 8
Equation 8 shows that double the number of moles of sodium octanoate are needed in order to convert all the manganese sulfate monohydrate into manganese octoate. The sodium octanoate and manganese sulfate monohydrate are present in a 2:1 mole ratio (see Table 20) with the sodium octanoate in excess. This means that no manganese sulfate monohydrate should remain unreacted at the end of the run. About 0.0614 m3 and 0.0852 m3 of water for 1.8 T and 2.5 T batch respectively will be formed. The mass of sulfate released into the spent solvent water is estimated at 327 kg and 451 kg for 1.8 T and 2.5 T of product respectively. Considering this mass to be present in 1.046 m3 and 1.454 m3 water gives a concentration of 313 g/l or 31.3% and 310g/l or 31.0% for 1.8 T and 2.5 T of product respectively. The sodium released is estimated to be around 155 kg and 215 kg in 1.046 m3 and 1.454 m3 water respectively. This gives a concentration of 148 g/l or 14.8% for both 1.8 T and 2.5 T of product. A comparison of the analytical results from the acidified and non-acidified sample of all the samples taken showed very similar results for both driers. Some of the results

Appendix E - 189 -
(about 46%) had the concentrations measured in the acidified sample showing slightly lower values. This has lead to the introduction of closer monitoring of the solution samples’ pH during sampling. The levels of manganese leaving the reactor in the wastewater were found to be far greater than those of cobalt. On average, levels of manganese in wastewaters were 27 times greater than those of cobalt. Results given in Tables 13-16 show that the average cobalt concentration levels in the solvent wastewater are higher than those of the wash wastewater. The approximate average level of cobalt in the solvent wastewater is 192 ppm (0.019%) (see Tables 13 to 16) and in the wash wastewater is 87 ppm (0.0087%). The concentration of the Co in the solvent water of the reaction mixture is estimated at 2.04 × 10⁵ ppm for the start of the process. This means that after the chemical reaction has taken place, the Co levels in the solvent have been reduced by over 1000 fold. After the product had been washed, the Co levels have been lowered by just over half. This gives a 2 fold dilution of the wastewater by washing the spent solvent. Some results had been rejected because they were thought to be unreliable and not fully representative of the situation being sampled. Such samples have been rejected on one of two counts. These are 1) the likely contamination of the sample during sampling or when storing the sample and 2) taking an insufficient number of samples from a run. In both these cases the result for the measured concentration of the discharged wastewaters would be considered unreliable. Possible contamination of the distillate sample during taking samples MVD1 MVD2 could have occurred (see Table 13). This could have been so because the distillate was scooped from the bottom of the collecting drum that may not have been thoroughly cleaned. Manganese levels recorded for two different runs (see Tables 11 and 12) were found to differ by a factor of 3. The average level of manganese in the solvent wastewater for the batch collected on 27.1.06 was 7.38x10³ ppm (see Tables 11) whereas those of batch collected on the 27.2.06 was 2.86x10³ ppm (see Tables 12). The latter value was obtained from seven samples taken at three different times during the solvent wastewater release from the reactor. The data in Table 20 show that 2.17x10⁵ ppm of Mn was present in both reaction mixtures at the start of each reaction. This means there was about 75 fold decrease in the Mn levels at the end for the batch run on 27.2.06. Only two samples were taken from the batch collected on 27.1.06, both at the same time, during solvent wastewater discharge. The average concentration of manganese was found to be 7.38x10³ ppm which indicates a 29 fold decrease in manganese levels compared to the starting mixture concentration. However other samples would need to have been taken to make any sensible interpretation of this. The different results form of the two different batch sizes is surprising as the reaction ratios were the same. There may have been a production issue unbeknown to us which could have affected either of the results. The batch collected on 27.1.06 showed traces of cobalt whereas batch collected on the 27.2.06 showed nothing in the distillate water. This distillate was

Appendix E - 190 -
collected by the company’s employees and was thought to have been scooped from the collecting drum as explained before.
Results obtained from Mn, Fe, Zn, Ni, Cu and Cr analyses of samples provided by the company showed that none of these trace elements (see Tables 17 and 18) were present at or above respective concentrations 0.80 ppm, 0.30 ppm, 0.20ppm, 0.60 ppm, 0.40 ppm and 0.20ppm. In the 4 cobalt drier processes analysed (see Table 2 entries 2) the solvent wastewater had a higher (about double) concentration than the wash wastewater. The opposite trend is observed with these two batches (see Table 2 entries 3). The average cobalt concentration in the solvent wastewater was lower than that of the wash wastewater by a difference of 35%. The levels were low however so this trend may not be significant. There is no information on the solution pH or how the manufacture of the drier was being carried out to help understand these findings. 6 CONCLUSION In this section the proposed sampling protocol and analytical procedures which will be used to monitor the Co and Mn drier solutions will be presented. Sampling will be discussed first, then sample and calibration standards preparation. Sampling would be best done by the researchers. This means that Metallica Chemicals must inform the research team as far in advance as possible as to when they are making batches. On occasions where it is impossible for the research team to get on-site, company staff may take samples. Buckets containing HDPE bottles will be left on site for company personnel to use. It must be insured that at least four samples are taken in 500 ml bottles from the solvent wastewater coming off (the spent reaction solution) with about 15 minutes between each sample and one being taken close to the end of the discharge. The date and time of sampling, the batch number, the wastewater type must be recorded. It would be most helpful if a Standard Manufacturing Formulation sheet used at the processing plant is made available to the research team for each batch samples collected. Samples have to be diluted prior to measuring their concentrations by ICP-OES. However not all species being measured require dilution by the same factor. Therefore four sets of standards will be prepared and used in the analyses. These are
• cobalt (see Table 21) • manganese (see Table 22) • sodium and sulfur (see Table 23) and • trace elements (see Table 24)
The calibration standards will be prepared in a 100 ml volumetric flask according the information provided in Tables 21, 22, 23 and 24. Exactly 1.0 ml of sample will be diluted to 100 ml in order to make the analytical sample for the ICP-OES analyses of cobalt, manganese and trace elements.

Appendix E - 191 -
Based on the calculations mentioned under Section 5, the concentration of the sulfate and sodium ions in the cobalt solvent wastewater is estimated to be slightly lower than 2.10 × 10⁵ ppm and 1.10 × 10⁵ ppm respectively. This shows that the resulting diluted sample will have concentrations slightly lower than 2100 ppm and 1100 ppm for sulfate and sodium ions respectively. The wash wastewater is assumed to have sulfate and sodium concentration of about 1000 ppm and 500 ppm respectively based on the cobalt dilution factor for washing wastewater. The sulfur concentration in the cobalt solvent wastewater is estimated at 700 ppm and so the wash wastewater would be expected to be approximately half that value. For manganese drier, the sulfate and sodium levels in the diluted solvent wastewater sample are estimated to be lower than 3150 ppm and 1500 ppm for both batch sizes respectively. The sulfur concentration will be about 900 ppm. The sodium concentrations mentioned above are acceptable in that they should not damage the ICP-OES lamp but are too high to allow preparation of suitable calibration standards (see Table 23). Hence, when measuring the sulfur and the sodium elements, the sample will be diluted by a factor of 1000. This will give a solution with sulfur and sodium concentrations of 70 or 90 ppm and 110 or 150 ppm for cobalt and manganese driers respectively. Table 21 Calibration standards for Co analysis
Standard number
Concentration (ppm) of
cobalt standard
Volume of Co (25 ppm) standard
(ml) 1 0.050 0.20 2 0.10 0.40 3 0.20 0.80 4 0.50 2.0 5 1.0 4.0 6 5.0 20 7 10 40 8 15 60

Appendix E - 192 -
Table 22 Calibration standards for Mn analysis
Standard number
Concentration (ppm)
manganese standard
Volume of Mn (50 ppm) standard
(ml)
1 0.010 0.020 2 0.10 0.20 3 0.50 1.0 4 5.0 10 5 10 20 6 20 40 7 30 60 8 35 70
Table 23 Mixed calibration standards for Na and S analysis
Standard number
Concentration (ppm) sodium
standard
Concentration (ppm) sulfur
standard
Volume of mixed Na (400 ppm) and S
(300 ppm) standard (ml)
1 10 7.5 2.5 2 20 15 5.0 3 40 30 10 4 80 60 20 5 120 90 30 6 160 120 40 7 200 150 50 8 240 180 60
The mixed standard (see column 3 Table 23) of Na (400 ppm) and S (300 ppm) will be prepared by pipeting 100.0 ml and 75.00 ml respectively of the commercial standards (1000 ppm) in a 250.0 ml flask. A set of calibration mixed standard for trace elements will be prepared containing the Fe, Zn, Cu, Ni and Cr and separate standard of Co and Mn. Note that when analysing wastewater from a cobalt drier batch, manganese will be treated as a trace element. The opposite will hold when analysing wastewater from manganese drier and so cobalt will be treated as a trace element. Calibration standards for major element, i.e. cobalt and manganese will not be mixed with those for other elements and will be run as a separate standard solution. The lowest calibration standard of Fe, Zn, Cu, Ni and Cr will be 0.005 ppm (see Table 24). This will be used in establishing the detection limit of the instrument.
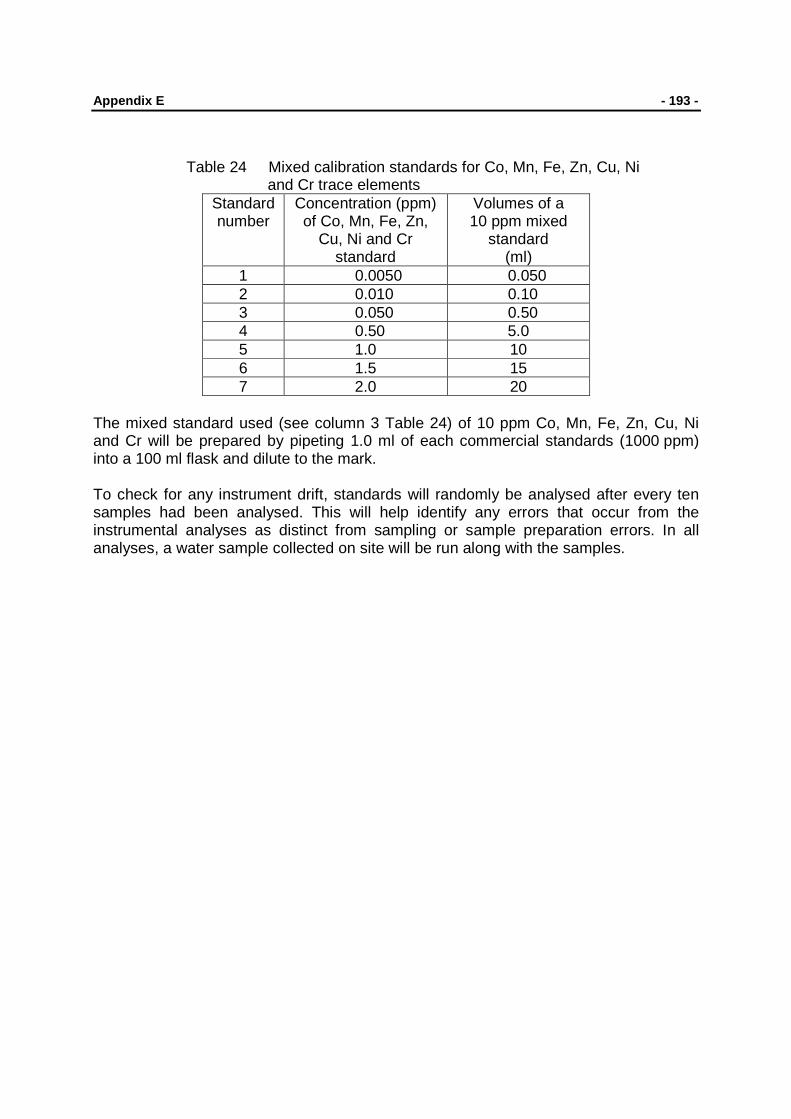
Appendix E - 193 -
Table 24 Mixed calibration standards for Co, Mn, Fe, Zn, Cu, Ni
and Cr trace elements Standard number
Concentration (ppm) of Co, Mn, Fe, Zn,
Cu, Ni and Cr standard
Volumes of a 10 ppm mixed
standard (ml)
1 0.0050 0.050 2 0.010 0.10 3 0.050 0.50 4 0.50 5.0 5 1.0 10 6 1.5 15 7 2.0 20
The mixed standard used (see column 3 Table 24) of 10 ppm Co, Mn, Fe, Zn, Cu, Ni and Cr will be prepared by pipeting 1.0 ml of each commercial standards (1000 ppm) into a 100 ml flask and dilute to the mark. To check for any instrument drift, standards will randomly be analysed after every ten samples had been analysed. This will help identify any errors that occur from the instrumental analyses as distinct from sampling or sample preparation errors. In all analyses, a water sample collected on site will be run along with the samples.

Appendix F
Feasibility study on cobalt paint drier production routes: Hydroxide versus Sulfate
route.


