application of base isolation systems to reinforced concrete frame buildings · ·...
TRANSCRIPT

1
APPLICATION OF BASE ISOLATION
SYSTEMS TO REINFORCED CONCRETE
FRAME BUILDINGS
By
Mengyu Han
A thesis submitted to the University of Ottawa
in partial fulfillment of the requirements for
Masters of Applied Science in Civil Engineering
Department of Civil Engineering
Faculty of Engineering
University of Ottawa
© Mengyu Han, Ottawa, Canada, 2017

ii
Acknowledgements
I would have never been able to complete my thesis without the guidance of my supervisors Dr.
Murat Saatcioglu. I would like to express my deepest appreciations to Dr. Murat Saatcioglu, for
his excellent guidance, profound expertise and patience. Those meetings we had in the last one
year would be my greatest and most valuable experience in my student career.
I would also like to thank my family for their support and encouragement throughout my whole
life. Thanks also go to my fiancé Cheng Zeng who helped review my thesis paper and kept me
company on all these nights as I was working on the project.
In addition, I want to thank my cat, Marshmallow, for her cuteness that pleased me greatly at
times of frustration when I got stuck with my research work.

iii
Abstract
Seismic isolation systems are widely used to protect reinforced concrete (RC) structures
against the effects of strong ground motions. After a magnitude 6.6 earthquake, the
outpatient building of Lushan People’s hospital in China remained in good condition due
to the seismic isolation technology, while the non-isolated older outpatient building
nearby experienced major damage. The building provides a good opportunity to study
and assess the contribution of isolation systems to seismic performance of RC structures.
In the current research project, the isolated outpatient building was modelled and
analyzed using computer software SAP2000. The post-yield behaviour of the structure
was modelled by assigning multi-linear plastic links to frame objects. The rubber
isolators were represented by rubber isolator link elements, assigned as a single joint
element between the ground and the superstructure. The isolated structure was subjected
to four earthquake records with increasing intensity. The performances of the isolated
structure were compared with those of the fixed-base structures in terms of lateral inter-
storey drifts, peak absolute floor accelerations, and residual drifts. The laminated rubber
bearings, the high damping isolation devices, composed of rubber bearings and viscous
dampers, and the hybrid isolation system of rubber bearings and friction pendulum
bearings were analysed. The effectiveness of the three base isolation systems considered
in enhancing structural performance was investigated. The results show the level of
improvement attained in seismic response by each system. They also illustrate that the
rubber bearings coupled with friction pendulum bearings produce best drift control
without causing excessive horizontal displacements at the base level and without
adversely affecting floor accelerations.

iv
Table of Contents
Acknowledgements ........................................................................................................................ ii
Abstract ......................................................................................................................................... iii
Table of Contents .......................................................................................................................... iv
List of Tables ................................................................................................................................. vi
List of Figures .............................................................................................................................. vii
Chapter 1 .........................................................................................................................................1
Introduction ....................................................................................................................................1
1.1 General ............................................................................................................................1
1.2 Objectives ........................................................................................................................4
1.3 Scope ................................................................................................................................4
1.4 Literature Review on Seismic Isolation System ...........................................................5
Chapter 2 .......................................................................................................................................10
Prototype Building........................................................................................................................10
2.1 General ..........................................................................................................................10
2.2 Structural Layout and Member Properties ...............................................................11
2.3 Performance of the Prototype Building during the 2013 Lushan Earthquake .......13
Chapter 3 .......................................................................................................................................17
Structural Modelling and Computer Software Employed ........................................................17
3.1 General ..........................................................................................................................17
3.2 SAP2000 Software ........................................................................................................18
3.3 Modeling of the Superstructure ..................................................................................19
3.3.1 Modeling of the Frames .......................................................................................19
3.3.2 Modeling of the Post-yield Behaviour of the Frame System .............................23
3.3.3 Modeling of the Masonry Walls ..........................................................................26
3.4 Modeling of the Rubber Bearing System ...................................................................27
3.5 Modeling of the friction pendulum bearing system ...................................................31
3.6 Modeling of the supplemental viscous damper system .............................................34
3.7 Load Cases ....................................................................................................................36
3.8 Earthquake Records .....................................................................................................39
Chapter 4 .......................................................................................................................................42
Results of Dynamic Analysis and Performance of Base Isolation Systems .............................42
4.1 General ..........................................................................................................................42
4.2 Seismic Performance Criteria .....................................................................................43
4.3 Performance of Building without Base Isolation .......................................................44
4.3.1 Fundamental Period .............................................................................................44
4.3.2 Peak Inter-storey Drift .........................................................................................45
4.3.3 Residual Drift ........................................................................................................49

v
4.3.4 Peak Absolute Horizontal Acceleration ..............................................................53
4.3.5 Axial Forces in the Diagonal Struts ....................................................................57
4.3.6 Base Shear .............................................................................................................57
4.4 Performance of Building with Rubber Bearings .......................................................61
4.4.1 Bearing Configuration I .......................................................................................61
4.4.2 Bearing Configuration II .....................................................................................73
4.4.3 Bearing Configuration III ....................................................................................83
4.5 Performance of Building with Rubber Bearings and Viscous Dampers .................90
4.6 Performance of Building with Friction Pendulum Bearings ....................................97
Chapter 5 .....................................................................................................................................110
Summary and Conclusion ..........................................................................................................110
5.1 Summary and Conclusions ........................................................................................110
5.2 Recommendations for Further Investigation ...........................................................113
References ...................................................................................................................................114

vi
List of Tables
Table 2.1: Design Parameters of the Isolators ...........................................................................12
Table 3.1: Seismic Force at Each Floor Level ............................................................................23
Table 3.2: Reinforcement Details of the Frames........................................................................23
Table 3.3: Effective Stiffness for Multi-linear Plastic Links in the Six Principal Directions 25
Table 3.4: Properties of the Autoclaved Aerated Concrete Masonry ......................................26
Table 3.5: Parameters Assign to the Rubber Isolator Links ....................................................28
Table 3.6: Formulas for the Key Parameters in the Design of the Rubber Bearings .............29
Table 3.7: Parameters Assign to the Friction Isolator Links....................................................33
Table 3.8: Parameters Assign to the Damper Links ..................................................................35
Table 4.1: First Six Periods of the Infilled and Bare Frame Models (sec)...............................45
Table 4.2: Maximum Inter-storey Drifts of the Infilled and Bare Structural Models ...........49
Table 4.3: Maximum Residual Drifts of the Infilled and Bare Structural Models .................49
Table 4.4: Maximum Floor Accelerations of the Infilled and Bare Structural Models .........57
Table 4.5: Number of Columns Experienced Yielding at the First Floor Levels....................61
Table 4.6: First Six Periods of the Infilled Building with and without Base Isolation ...........62
Table 4.7: Maximum Inter-storey Drifts of Isolated and Non-isolated Infilled Models ........65
Table 4.8: Maximum Residual Drifts of Isolated and Non-isolated Infilled Models ..............65
Table 4.9: Maximum Peak Floor Accelerations of Isolated and Non-isolated Infilled Models
........................................................................................................................................................70
Table 4.10: Number of Columns Experienced at the First Storey Levels ...............................73
Table 4.11: Maximum Isolator Displacements under Four Different Intensities of
Earthuakes (mm) ..........................................................................................................................73
Table 4.12: Parameters of the Modified Isolation System for Bearing Configuration II ......83
Table 4.13: Maximum Isolator Displacements under Four Different Intensities of
Earthquakes (mm) ........................................................................................................................83
Table 4.14: Inter-storey Drifts of Isolated Structure with Different Lead Plug Diameters ...86
Table 4.15: Floor Accelerations of Isolated Structure with Different Lead Plug Diameters 88
Table 4.16: Viscous Damping Coefficients for Five Designs of Viscous Dampers ..................90
Table 4.17: Inter-storey Drifts of Isolated Structure with Various Supplemental Damping 92
Table 4.18: Floor Accelerations of Isolated Structure with Various Supplemental Viscous
Damping ........................................................................................................................................95
Table 4.19: Maximum Isolator Displacements (mm) ................................................................98
Table 4.20: Structural Base Shears (kN) ..................................................................................101
Table 4.21: Structural Weight in Three Analysis Cases .........................................................104
Table 4.22: Maximum Base Displacements as Affected by Building Weight (mm) .............104
Table 4.23: Base Shear Force in the Analysis cases of Various Structural Weights (kN) ...109

vii
List of Figures
Figure 2.1: Building Plan of the Outpatient Building of Lushan People’s Hospital ..............12
Figure 2.2: Location of the Seismic Isolation System ................................................................12
Figure 2.3: Isolated Outpatient Building of Lushan People’s Hospital after the 2013
earthquake ....................................................................................................................................14
Figure 2.4: Isolated Outpatient Building of Lushan People’s Hospital after the 2013
Earthquake ....................................................................................................................................15
Figure 2.5: The Non-isolated Old Outpatient Building and the New Isolated Outpatient
Building .........................................................................................................................................15
Figure 2.6: Non-isolated Outpatient Building of Lushan People’s Hospital after the 2013
Earthquake ....................................................................................................................................16
Figure 3.1: Modeling of the Superstructure in SAP2000 ..........................................................20
Figure 3.2: SD Section of a Square Column ...............................................................................21
Figure 3.3: Stress-strain Relationships of Unconfined C30 Concrete and HRB335 Steel .....24
Figure 3.4: Placement of Plastic Links in Frame Objects .........................................................25
Figure 3.5: Modeling Details of Multi-linear Plastic Links ......................................................25
Figure 3.6: Placement of the Grouted Wall ...............................................................................26
Figure 3.7: Definition of Axial Hinge ..........................................................................................27
Figure 3.8: Hysteretic Property for the Shear Deformation of the Rubber Isolator Links ...30
Figure 3.9: Hysteretic Property for the Shear Deformation of the Friction Isolator Links ..34
Figure 3.10: Maxwell Damper Model .........................................................................................35
Figure 3.11: Spectral Displacement of the Modeled Structure with Different Damping
Levels .............................................................................................................................................36
Figure 3.12: Definition of the Load Cases in SAP2000 .............................................................37
Figure 3.13: Ramp Time-history Function .................................................................................38
Figure 3.14: Acceleration Time-history of Four Input Motions ...............................................39
Figure 3.15: Displacement and Acceleration Response Spectra of Four Input Motions ......40
Figure 4.1: Inter-storey Drift Envelopes for Non-isolated Frame Building with and without
Infill Walls under Four Ground Motion Intensities ..................................................................46
Figure 4.2: Residual Drift Envelopes for for Non-isolated Frame Building with and without
Infill Walls under Four Ground Motion Intensities ..................................................................50
Figure 4.3: Floor Acceleration Envelopes for for Non-isolated Frame Building with and
without Infill Walls under Four Ground Motion Intensities ....................................................54
Figure 4.4: Axial Force Time History for the Hinge Element at the First-storey Strut under
Earthquake La11-005#3 ...............................................................................................................58
Figure 4.5: Base Shear Time Histories for Non-isolated Frame Building with and without
Infill Walls under Four Ground Motion Intensities ..................................................................59
Figure 4.6: Inter-storey Drift Envelopes for Isolated and Non-isolated Infilled Structures
under the Four Ground Motion Intensities ................................................................................63

viii
Figure 4.7: Residual Drift Envelopes for Isolated and Non-isolated Infilled Structures under
the Four Ground Motion Intensities ...........................................................................................66
Figure 4.8: Floor Acceleration Envelopes for Isolated and Non-isolated Infilled Structures
under the Four Ground Motion Intensities ................................................................................68
Figure 4.9: Base Shear Time Histories for Isolated and Non-isolated Infilled Structures
under the Four Ground Motion Intensities ................................................................................71
Figure 4.10: Inter-storey Drift Envelopes for Isolated Structures with Configuration I
(Isolator Diameter R=500mm) and Configuration II (Isolator Diamter R=600mm) .............75
Figure 4.11: Residual Drift Envelopes for Isolated Structures with Configuration I (Isolator
Diameter R=500mm) and Configuration II (Isolator Diamter R=600mm) ............................77
Figure 4.12: Acceleration Envelopes for Isolated Structures with Configuration I (Isolator
Diameter R=500mm) and Configuration II (Isolator Diamter R=600mm) ............................79
Figure 4.13: Base Shear Time Histories for Isolated Structures with Configuration I
(Isolator Diameter R=500mm) and Configuration II (Isolator Diamter R=600mm) .............81
Figure 4.14: Variation of the Maximum Base Displacement of Isolated Structure with
Increasing Lead Plug Diameter ...................................................................................................84
Figure 4.15: Vibration of the Maximum Inter-storey Drift of Isolated Structure with
Increasing Lead Plug Diameter ...................................................................................................85
Figure 4.16: Vibration of the Maximum Inter-storey Drift of Isolated Structure with
Increasing Lead Plug Diameter ...................................................................................................87
Figure 4.17: Variation of the Maximum Base Shear of Isolated Structure with Increasing
Lead Plug Diameter ......................................................................................................................89
Figure 4.18: Variation of the Maximum Base Displacement of Isolated Structure with
Increasing Supplemental Viscous Damping ...............................................................................90
Figure 4.19: Vibration of the Maximum Inter-story Drift of Isolated Structure with
Increasing Supplemental Viscous Damping ...............................................................................93
Figure 4.20: Variation of the Peak Top Floor Acceleration of Isolated Structure with
Increasing Supplemental Viscous Damping ...............................................................................93
Figure 4.21: Variation of the Peak Base Acceleration of Isolated Structure with Increasing
Supplemental Viscous Damping ..................................................................................................94
Figure 4.22: Variation of the Maximum Base Shear of Isolated Structure with Increasing
Supplemental Viscous Damping ..................................................................................................96
Figure 4.23: Placement of Friction Pendulum Bearings (FPB) and Rubber Bearings ..........97
Figure 4.24: Peak Inter-storey Drifts of Fixed-base Structure and Three Isolated Structures
under Selected Earthquake Records...........................................................................................99
Figure 4.25: Maximum Floor Accelerations of Fixed-base Structure and Three Isolated
Structures under Selected Earthquake Records ......................................................................102
Figure 4.26: Maximum Inter-storey Drifts as Affected by Building Weight ........................105
Figure 4.27: Maximum Floor Accelerations as Affected by Building Weight ......................107

1
Chapter 1
Introduction
1.1 General
Strong earthquakes in the past have resulted in significant property damage and loss of
lives. Earthquake damage is mainly associated with damage to seismically deficient
buildings, often designed prior to the enactment of modern building codes. Therefore,
researchers have focused their efforts to developing new and effective seismic risk
mitigation strategies for such buildings. Conventional seismic protection methods, such
as enlarging structural elements or adding new strengthening and stiffening elements (i.e.
bracing systems) focus on improving the capacity of buildings to meet likely demands.
However, stiffening buildings results in shorter vibration periods and higher floor
accelerations, resulting in higher structural damage. Therefore, a preferred approach for
seismic retrofitting buildings may be to decrease demands rather than to increase
capacities. This can be achieved by introducing flexible devices to buildings at their
ground levels to isolate them from the transfer of seismic energy.
The seismic isolation is used extensively for strategically important post-disaster
buildings, such as hospitals, schools and critical facilities to protect them against the
effects of strong ground motions. The isolation systems consist of isolators and auxiliary
devices [1]. The isolators, having low horizontal stiffness or low friction, provide lateral
flexibility at the base and separate the main structure from ground motions. By increasing
the flexibility of the isolated building, the isolators shift the fundamental period of the
structure beyond the range where the maximum effect of ground motions occurs. Hence,
they limit the seismic energy transfer to the superstructure so that inter-storey drifts and
floor accelerations are reduced significantly [2]. Also, the auxiliary devices dissipate the

2
residual seismic energy in damping, controlling lateral deformations of isolators.
Additionally, the devices can provide horizontal resistance against non-seismic loads like
service loads and lateral wind loads [1].
Various seismic isolation systems can be implemented for structural retrofits. They
include rubber bearing systems, sliding bearing systems, the combination of different
isolation systems, and a system of hybrid devices composed of isolators and external
dampers. The laminated rubber bearings (LRB), consisting of elastomeric rubber layers
and steel plates, are one of the most commonly adopted isolation systems. The rubber
layers provide lateral flexibility to the isolator while the steel plates are responsible for
vertical and horizontal stability [2]. However, LRB systems have poor energy dissipation
capacity associated with low damping characteristics of the rubber material, which may
not be effective for strong earthquakes [3]. One way to improve isolator damping is to
insert lead cores into the center of rubber layers, resulting in a lead-rubber bearing (LLRB)
system. The LLRB dissipates larger quantity of seismic energy as the lead plugs
experience large hysteresis deformation after their yield [4]. In addition, the lead plug has
a much higher lateral stiffness compared to rubber layers prior to yielding. This means
that the incorporation of lead plugs can contribute towards lateral resistance to non-
seismic loads, thereby controlling base displacements during strong earthquakes. On the
other hand, heat caused by plastic deformations of the lead core can degrade its strength,
changing the hysteretic behaviour of the LLRB system [5].
The sliding isolation systems are widely used in recent years due to the physical stability
of bearings. Similar to the rubber isolator, the sliding bearing integrates the functions of
supporting the building weight and decoupling the superstructure from the ground in one
device. One of the highly developed sliding bearing systems is the fiction pendulum
bearing (FPB). The FPB is a friction-type sliding isolation system that consists of an
articulated slider and a low-friction spherical sliding surface [2]. This system can produce
a high energy dissipation capacity by dissipating residual seismic energy through
overheating of contact surfaces, and the uplift of the superstructure [6]. Better than the
rubber bearing, the FPB system has a larger horizontal displacement allowance. It also
possesses self-centring capacity to limit residual displacements owing to the restoring

3
force provided by gravity [7]. Moreover, The FPB system can mitigate the torsional
response of the building, because the lateral stiffness of the FPB is proportional to the
weight of the main structure, and the centre of stiffness of the isolation system coincides
with the centre of mass. Remarkably, the period of the FPB system is irrelevant to the
mass of the superstructure, only controlled by the radius of sliding surface [8].
In practise, external damping device can be installed in combination with either rubber
bearings or sliding bearings to create an additional source of viscous damping. [9]. In the
case of near-fault ground motions, which are characterized by long periods and large
intensities, lateral displacements of conventional isolators could be high, leading to
system instability. Thus, the isolators require a large dimension to keep the stability of the
structure, which may not to be practical. Moreover, the large size of bearing can be costly,
which defeats the purpose of selecting seismic isolation system as a retrofit method. In
this situation, viscous dampers with appropriate damping levels can be implemented to
restrain the isolator displacements. These external viscous dampers, placed in parallel
with conventional isolators, can work as supplementary energy dissipation devices as
they develop compression, tension and shear deformations of the viscoelastic material
[10,11]. During strong ground motions, the combination of isolators and viscous dampers
works effectively to reduce dynamic responses of the isolated structure, as well as to
ensure an acceptable lateral displacement at the isolator level.
In the current investigation, the effectiveness of rubber bearings (LRBs and LLRBs),
friction pendulum bearings and supplemental viscous dampers was investigated through a
case study, using the outpatient building of Lushan People’s Hospital in China. The new
wing (outpatient building) of this hospital was equipped with base isolation devices and
was subjected to the magnitude 6.6 earthquake of 2013. The outpatient building remained
in good condition because of the seismic isolation technology, while the non-isolated
older wing nearby experienced significant damage. This building was modeled in
SAP2000 software, and was studied as a typical reinforced concrete frame building that
benefitted from a base isolation system to assess the applicability and performance of
different types of base isolation system. Nonlinear behaviour of the superstructure and the
isolators was modelled using appropriate link/support elements. Dynamic analyses of the

4
building were conducted with and without the isolation systems. Four input motions were
applied in the horizontal Y-direction with the same frequency content but with increasing
levels of intensity. The record selected was the EI Centro earthquake excitation (La11-
005), and the record was scaled to four different levels. The effects of isolator properties
on seismic behaviour of buildings were studied through a parametric investigation. The
parameters considered pertained to the analytical building model, ground motion intensity
and types of isolators having different characteristics. In addition, the building behaviour
was assessed without any isolation system, and comparisons are made with the
performance of buildings with different isolation systems. Results are compared in terms
of lateral drift, peak absolute acceleration and residual drift, providing information for the
effectiveness of the three isolation systems considered both under near-field and far-field
earthquakes.
1.2 Objectives
The objective of the current investigation is to assess the performance of different types
of base isolation systems for seismic protection of reinforced concrete frame buildings,
through dynamic inelastic response history analysis of a selected prototype building. The
isolation systems considered include, i) rubber isolators (LRBs &LLRBs), ii) rubber
isolators with energy dissipation systems, and iii) rubber isolators coupled with friction
pendulum isolators.
1.3 Scope
The following forms the scope of the research project:
Literature review and overview of existing base isolation systems available in the
construction industry.
Selection of a prototype building (The outpatient building of Lushan City
People’s Hospital in China) for investigation.
Structural and hysteretic modelling of the prototype building for dynamic inelastic
analysis.
Dynamic inelastic response history analyses of the selected building without base
isolation, with and without infill masonry walls.

5
Dynamic inelastic response history analyses of the selected building with three
types of base isolation systems, each having varying characteristics.
Comparisons of building performance and the three types of base isolation
systems considered.
Discussion and presentation of results.
1.4 Literature Review on Seismic Isolation System
Several research programs were conducted in the past to assess the effectiveness of base
isolation systems for seismic protection. Yi and Bijan [12] studied the effectiveness of a
rubber isolation system under different earthquake excitations. In their research, a five-
storey steel frame was analysed under four ground motions of variable intensity and
frequency content through numerical analysis and shake table tests. Results confirmed the
efficiency of rubber bearing system for seismic retrofitting, but the benefits gained from
this type of bearing system were highly dependent on the type and nature of the ground
motion. It was noted that the lateral displacements in the isolators were dependent on the
intensity and frequency contents of the seismic records, while the floor accelerations were
significantly reduced regardless of the ground motion.
Bong and Yang [13] investigated the effects of damping on seismic performance of
laminated rubber bearings and lead rubber bearings. The LLRBs studied in this research
project had different diameter of lead plugs, and thus had variable damping levels. In
spite of the significant reduction in seismic response of the isolated model structure, the
lateral displacements were found to be excessive, exceeding the deformation capacity of
the LLRB isolator especially under near-field ground motions. The diameter of the lead
plugs was enlarged for the purpose of generating increased level of damping. This
enlargement increased the stiffness of the isolation system and consequently intensified
the floor acceleration response, causing more damage to the secondary systems and the
internal components attached to the primary structures. Results showed a slight
amplification in floor acceleration response spectra as the isolation damping reached 8%,
and it became considerably large when the damping in the isolators exceeded 24%,
resulting in adverse effects on non-structural elements.

6
A series of shake table tests were conducted by Mauro and Donatello [1] to investigate
the beneficial effects of four isolation systems on seismic response, including the rubber
bearing system. The implementation of the rubber isolation system provided outstanding
structural enhancement in terms of reducing inter-storey drifts, floor accelerations and
shear forces even under strong earthquakes. Results of their study showed that the rubber
isolation system produced the smallest floor acceleration in comparison with other
systems, but at the expense of base displacement and base shear coefficient. Moreover,
the seismic performance of base isolated structures with and without the masonry infill
walls were compared. The results showed that the installation of infills had significant
influence on base shear, base displacement and inter-storey drifts of the superstructure
due to the stiffening provided by the masonry walls. The results also showed that the
presence of infills affected the effectiveness of rubber bearing system minimally, as
compared with the effects on other systems, especially when the structure was subjected
to strong earthquakes.
Briseghella and Zordan [14] confirmed the contribution of FPB isolation system to
seismic retrofit through a case study. An existing building that was heavily damaged in
the 2009 L’Aquila earthquake was retrofitted by an FPB system, and its performance was
studied through response spectrum analysis, the linear dynamic analysis and nonlinear
dynamic analysis. The FPB system was shown to be effective in restraining the storey
shear and inter-storey drifts of the building model. It also presented a significant energy
dissipation capacity attributed to the strong non-linear behaviour of FPBs.
The influence of isolator properties (i.e. friction coefficient) and the earthquake
characteristics on seismic reliability of building isolation with FPBs were analysed by
Castaldo and Palazzo [15]. The factors affecting structural response were considered as
random variables; and the monovariate and multivariate probability density and
cumulative distribution functions were computed. Also, assuming limit state thresholds
and domains (performance objectives), the monovariate and bivariate exceeding
probabilities (structural performances) were evaluated. The structural performance (SP)
curves were compared with the performance objectives (PO) curves. The researchers
showed that, employing FPBs with lower friction coefficients could improve seismic

7
structural performances. Additionally, the SP curves of the isolation level or the proposed
equations could be used to calculate the plane dimension of the isolators in terms of
reliability levels.
Shih and Nicos [16] studied the behaviour of hybrid isolation system that composed of
either LLRBs or FPBs supplemented with fluid viscous dampers. An extensive
programme of shake table tests was conducted to investigate the effectiveness of the
hybrid system with different damping levels that was provided by bearings and dampers.
Results showed that viscous dampers were effective in restraining base displacements.
However, redundant viscous damping may cause unexpected large inter-storey drifts.
When viscous damping was synchronized with friction damping, the latter became more
efficient than the former in controlling spectral displacements, which would be amplified
as the isolation periods increased. For long-isolation periods (like prototype isolation
period, T=3 sec), neither the installation of viscous damping nor the increase of friction
damping could largely change the acceleration and displacement response. When the
isolation period exceeded 3 sec, further lengthening the period had minor effects on the
acceleration, displacement, and velocity spectra; meaning that it was needless to pursue
extremely large isolation periods to realize the benefits of seismic isolation. As to the lead
rubber bearings, the energy dissipation capacity of LLRBs that were evaluated by the
plastic performance of lead plugs was found to be over-estimated, leading to the under-
estimation of spectra displacements.
Providakis [17] examined seismic performance of LLRBs with external damping devices,
as they affected base and superstructure drift when subjected to near-field and far field
ground excitations. It was found that the supplemental viscous damping could remarkably
reduce large isolator displacements excited by near field excitations with large velocity
pulses. However, this high level of additional damping that was required for near-field
ground motions might become superfluous if the structure experienced ground motions
coming from the far fault sites. As a result, it might restrain the movements of isolators
and thus, impair the efficiency of the seismic isolation. Besides, the provision of
supplemental damping limited the base drift and enhanced the stiffness of the isolated
building by creating higher-mode effects, and thereby increasing superstructure drifts,

8
especially in the case of far-field excitations. Also, in another paper of Providakis [18],
the author accounted for the effects of supplemental damping on floor accelerations of the
isolated buildings (supported on LLRB and FPS systems). This additional consideration
proved that viscous damping sufficient to control the absolute floor acceleration for both
the LLRB and FPB systems under near-field ground motions, but generated adverse
effects for the acceleration response when subjected to far-field excitations.
Dolce and Cardone [19] demonstrated advantages and disadvantages of base isolation
systems through their research when the isolators were used for seismic protection of
light, secondary systems. The effectiveness of seismic isolation on protecting internal
contents and equipment was also evaluated by the researchers based on the acceleration
response spectra of modeled buildings from shake table tests. It was reported that, seismic
isolation systems could significantly reduce dynamic response on the secondary systems.
However different isolation systems could perform differently due to the differences in
their hysteretic behaviour. For instance, the isolation system that has strong nonlinear
behaviour (such as the SMA system) tends to produce high frequency vibrations in the
superstructure, bringing out a high acceleration on components whose frequencies were
close to the 2nd
and 3rd
mode frequency of the isolated structure, causing severe damages
on those components. On the contrary, the quasi-elastic isolation system, such as the
rubber bearing isolation system, concentrates a significant amount of energy in a narrow
low-frequency range, which may include the natural frequencies of some internal
contents. This may result in tuning effects on these components. The authors emphasized
that the design of isolation system should account for the protection of light secondary
systems. This is especially true for the period of quasi-linear isolation systems and the
threshold force levels of strongly non-linear systems, which could largely influence the
performances of secondary systems.
Yu and Goodarz [20] studied the wind load sensitivity of base-isolated structures with
rubber bearings and sliding bearings. The structure was considered as a rigid block and
the variation of wind velocity along the structure height was neglected. Both the mean
and random conditions of wind loads were accounted for in the research program. A
stationary random model for wind velocity was selected, and the displacement response

9
of the modeled structure was studied through the equivalent linearization method. The
researchers concluded that the isolated structure was insensitive to wind excitations
subjected to common storms for both the rubber bearings and sliding bearings. However,
with regard to extreme wind conditions, like hurricanes, the isolated structure installed
with rubber bearings experienced a few centimeters base displacement. The sliding
bearing isolation system showed better performance to resisting wind loads. The
experiments showed that the base displacement of sliding bearing isolation system was
relatively small under hurricanes. Also, it showed that the increase in isolation damping
could help restrain displacements in the isolator, and thus, detuning the sensitivity to
wind effects.

10
Chapter 2
Prototype Building
2.1 General
The outpatient building of Lushan People’s hospital in China was selected as the
prototype building in the current research project, and used to investigate the contribution
of base isolation systems to seismic response of reinforced concrete frame buildings. The
outpatient building is a reinforced concrete moment resisting frame, located in Lushan
County of Ya’an City in the Sichuan Province of southwest China. According to the latest
Chinese design code (GB 50011-2001, 2010 edition), Lushan County is categorized as an
area with VII fortification intensity (the required construction standard for individual
structures), on the basis of the soil type and topographic conditions of the site. The design
spectral acceleration for Lushan county is equal to 0.15g regarding VII fortification
intensity [ 21 ]. Surprisingly, the outpatient building of Lushan People’s hospital,
seismically isolation, remained in good conditions and only experienced slight damage to
non-structural elements even though it was subjected to a magnitude 6.6 earthquake
(Lushan Earthquake). On the contrary, the adjacent non-isolated building suffered major
damage to both structural and non-structural elements. Due to its excellent structural
performance during the earthquake, the isolated outpatient building was selected as a
good example to study the effectiveness of different base isolation systems on reinforced
concrete frame buildings.

11
2.2 Structural Layout and Member Properties
The outpatient building of the Lushan City People’s Hospital in China was selected as the
prototype building. The building is a seven-story reinforced concrete frame structure with
a total seismic mass of 9137 tons. It has an average inter-storey height of 4.2m, resulting
in a total building height of 23.4 m above the ground level. Figure 2.1 provides a typical
plan view of the building. Each storey of the building has a floor area of approximately
1256 m2 with plan dimensions of 67.4 m by 19.5 m. The structural frame system
comprises of 600 mm square columns and main beams having cross-sectional dimensions
of 300 mm x 500 mm and 300 mm x 700 mm in the long direction (X direction), and 300
mm x 600 mm in the short direction (Y direction). The secondary beams are attached to
the main beams, with cross sectional dimensions of 200 mm x 500 mm or 200 mm x 600
mm. The building also features flexible slabs with 120 mm thickness at each floor and the
roof. The structural components of this building were built with C30 (30 MPa) concrete.
The external frames had infill masonry walls. The walls around the elevator shaft and
staircases were grouted. This resulted in somewhat higher stiffness as compared to other
walls. The external infill walls had large window openings, whereas some of the walls in
the short direction had small openings.
Seismic isolation layer was placed between the foundation and the first storey of the
building. A total of 79 isolation devices were installed at individual isolated footings. The
isolators consisted of 47 laminated rubber bearings (LRBs) and 32 lead laminated rubber
bearings (LLRBs). The design properties of the isolators used in the structural system are
listed in Table 2.1. The diameter of the bearings was determined as 500 mm and 600 mm
depending on vertical load, wind loading, and the required isolator displacement control.
Figure 2.2 shows the layout of the isolation system. The LLRBs were placed under the
external columns to help resist wind loading and the LRBs were placed beneath the other
columns. Also, an extra isolator was installed under the columns subjected to high
vertical loads (shown as 2LRB500) to support the structural weight. A separation gap was
set around the building to allow movements of the isolation system during earthquake.
The structural plan is symmetric in the “y” direction, as showed in Figure 2.1, while the
placement of the infill walls and seismic isolators could generate an eccentricity between

12
the centre of mass and the centre of stiffness, causing torsional response of the isolated
building during earthquakes.
Figure 2.1: Building Plan of the Outpatient Building of Lushan People’s Hospital
Figure 2.2: Locations of the Seismic Isolation System
Table 2.1: Design Parameters of the Isolators
Design Properties LLRB LRB#1 LRB#2
Thickness of the Rubber Layer ( mm ) 86.4 86.4 100
Diameter of the Isolator ( mm ) 500 500 600
Area (2cm ) 1963 1963 2827
Vertical Load Capacity ( kN ) 2466 2356 3392
Vertical Stiffness ( kN mm ) 2044 1694 2517
Elastic Stiffness ( kN mm ) 7.591 0.876 1.091
Post-yield Stiffness ( kN mm ) 1.354 None None
Yield Strength ( kN ) 40.1 None None

13
2.3 Performance of the Prototype Building during the 2013 Lushan Earthquake
A strong earthquake occurred near Lushan County, Ya’an City, Sichuan Province on
April 20, 2013. The earthquake’s epicenter was located at 30o17’02’’N and 102
o57’22” E.
The focal depth was 12.3 km. The magnitude of was determined as M7.0 by the China
Earthquake Networks Center (CENC). The United States Geological Survey (USGS)
determined the magnitude to be M6.6 [22]. The PGA of 0.4g to 0.5g recorded (according
to CENC) during the earthquake caused thousands of buildings to be damaged and
partially or fully collapsed, while the outpatient building of the Lushan People’s Hospital,
which is located within a 10-kilometer radius from the epicenter, remained intact during
and after the earthquake. This was attributed to the installation of an isolation system
whose protection made the outpatient building more resilient to the Lushan Earthquake.
The structural members of the building stayed unharmed without any visible cracks, as
depicted in Fig. 2.3. The non-structural elements such as infill walls, ceiling tiles and
light fixtures, experienced minor damage. Moreover, there was little impact on the
internal contents and equipment attached to the main structure, enabling the hospital to be
fully functional, providing medical services during and after the earthquake.
In spite of the excellent seismic performance of this isolated building, the isolation
system experienced large horizontal deformations that damaged the cover on some of the
isolators; and a residual lateral displacement of 30 to 50 mm was observed at the isolation
level. Also, the connected bolts of the isolators were corroded, indicating that the
isolators were inadequately protected. This poor condition may influence the efficiency
of the isolation system. Moreover, insufficient space was left between the superstructure
and the surrounding ground for the movement of the isolation system during the
earthquake. In the short direction of the structure, the smallest width of the separation gap
was only 50 mm and no separation gap was left at the main entrance and at the back of
the building. This consequently caused damage to the surrounding concrete floor and the
staircase at the first storey level due to the impact from the superstructure. Furthermore,
the plumping system was damaged because of lack of flexible connections at the isolation
interface, which hampered the normal operation of the building. The damage associated
with the above is illustrated in Fig. 2.4.

14
(a) Outside of the Building (b) Inside of the Building
(c) Ceilings (d) Infill Walls
Figure 2.3: Isolated Outpatient Building of the Lushan People’s Hospital after the 2013 earthquake
Another building of the Lushan People’s Hospital that was not seismically isolated, was
located nearby, connected to the isolated outpatient building by staircases, as shown in
Figure 2.5. The non-isolated building (left wing) was built in 2004 before the 2008
Wenchuan Earthquake, while the base isolated building (right wing) was built after the
Earthquake. In contrast with the superior performance of the new outpatient building, the
old building became highly vulnerable to the strong ground motion. Although no serious
damage was detected in structural elements, non-structural elements were severely
damaged and mostly destroyed during the earthquake. Figure 2.6 illustrates damage to
suspended ceilings, which fell on the floor. Some infill walls experienced significant
diagonal tension cracking, while others experienced partial failures. Damage during the
earthquake paralyzed the normal operation of the hospital. The falling debris destroyed
the hospital equipment, putting them out of commission. Due to the significant damage,

15
the old building was evacuated after the earthquake and emergency operations were
forced to be conduct in temporary tents to maintain medical services.
(a) Isolators (b) Separation Gap around the Superstructure
(c) Damage on the Staircase at First Floor (d) Pipeline at the Isolation Interface
Figure 2.4: Isolated Outpatient Building of Lushan People’s Hospital after the 2013 Earthquake
Figure 2.5: The Non-isolated Outpatient Building and the New Isolated Outpatient Building
16
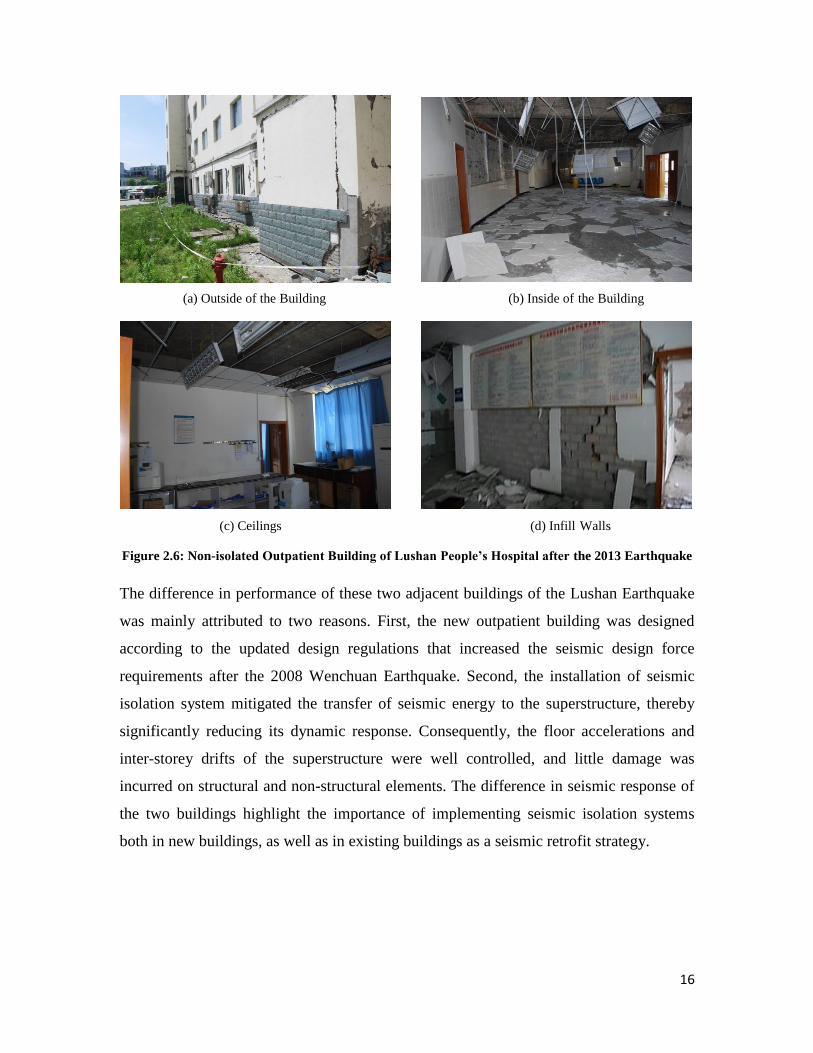
(a) Outside of the Building (b) Inside of the Building
(c) Ceilings (d) Infill Walls
Figure 2.6: Non-isolated Outpatient Building of Lushan People’s Hospital after the 2013 Earthquake
The difference in performance of these two adjacent buildings of the Lushan Earthquake
was mainly attributed to two reasons. First, the new outpatient building was designed
according to the updated design regulations that increased the seismic design force
requirements after the 2008 Wenchuan Earthquake. Second, the installation of seismic
isolation system mitigated the transfer of seismic energy to the superstructure, thereby
significantly reducing its dynamic response. Consequently, the floor accelerations and
inter-storey drifts of the superstructure were well controlled, and little damage was
incurred on structural and non-structural elements. The difference in seismic response of
the two buildings highlight the importance of implementing seismic isolation systems
both in new buildings, as well as in existing buildings as a seismic retrofit strategy.

17
Chapter 3
Structural Modelling and Computer Software
3.1 General
Computer software SAP2000 was used to conduct dynamic inelastic response history
analysis of the selected prototype building. The program incorporates features for
nonlinear modelling of structural components, as well as base isolators, making it a
suitable choice of software for the project. The beams and columns of the prototype
building (outpatient wing of the Lushan City Hospital) was modeled by frame elements
with non-linear material properties for concrete and reinforcement. Multi-linear plastic
links were assigned to the ends of the frame members to simulate post-yield behaviour.
The isolation systems, such as the rubber bearing system and the friction pendulum
bearing system, were simulated by the rubber isolator links and the friction isolator links,
respectively, with appropriate design properties. Also, the external viscous dampers that
were attached to the isolators were modeled by the damper link element.
The outpatient building was modelled both as a fixed structure, and as a base-isolated
structure to investigate the effectiveness of the seismic isolation system. Four input
ground motions with the same frequency content but with different levels of intensity
were applied in the short direction of the structure. Gravity (dead and live) loads and
wind loads were determined based on the Chinese building code. The analytical models
of the building represented the actual building structure as closely as possible, and hence
are believed to give accurate results for the linear and non-linear dynamic response of the
building under seismic loading.

18
3.2 SAP2000 Software
The software SAP2000 was developed by Computers and Structures, Inc. It is a general
purpose finite element program that has been widely used in recent years. The program is
ideal for design and analysis of structures, such as buildings, bridges, and industrial
plants. 2D and 3D structural models with simple to complex geometry can be easily
modeled and analysed through a relatively simple engineering process, owing to its
practical and intuitive object-based modeling environment. Additionally, SAP2000
handles a wide variety of structural analysis procedures, including static and dynamic
analysis, linear and nonlinear analysis, pushover analysis, seismic analysis under ground
excitations, response spectra analysis, as well as others types of dynamic analyses under
time varying forcing functions. Three different levels of sophistication are available for
structural analysis, namely the SAP2000 Basic, the SAP2000 PLUS and the SAP2000
Advanced. The SAP2000 Advance option employed in the current project extends the
basic capacities by introducing nonlinear hinge elements and the multi-linear plastic link
elements that make it possible to capture inelastic response of frame elements. All
options of the SAP2000 programs support various design codes, including ACI, CSA and
AISC building codes.
The SAP2000 elements that were used in this research program are listed below.
Frame Element:
Frame elements are used to model beams, columns, braces, and truss members in both 2D
and 3D systems. The geometry and the reinforcement details of concrete elements are
determined in Frame Section Properties (database tables). Elements that have
nonstandard or composite sections of arbitrary geometry can be modeled in Section
Designer that allows for custom-defined cross sections. The frame behaviour is
characterized based on a three-dimensional beam-column formulation (Bathe and Wilson,
1976) that accounts for the coupled effects of biaxial bending, torsion, axial deformation
and biaxial shear deformation. The nonlinear material properties of the frame are
incorporated by assigning nonlinear hinge and link elements.

19
Link/Support Element:
The link element is used for connecting two joints, and the support element is used for
connecting a joint to the ground. Various behaviours, specified as linear, nonlinear and
frequency-dependent, can be assigned to different degrees of freedom (DOF), consisting
of axial, shear, torsion and bending components in a single link/support element. For all
six DOF, regardless of the properties assigned, linear effective stiffness and damping are
required for the purpose of calculating the natural period of vibration for the structure. If
a DOF is defined as nonlinear, the nonlinear force-deformation relationship must be
specified. Various types of nonlinear properties are available for the link/support element,
including the multi-linear plastic property, hysteretic (rubber) isolator property, friction-
pendulum isolator property and damper property. When the multi-linear plastic link is
used to simulate the material nonlinear behaviour, the direct-integration time-
history analysis should be selected instead of the fast nonlinear analysis (FNA) which
will be applicable only if the nonlinearity is limited to the nonlinear links.
Hinge Element:
Uncoupled moment, torsion, axial force and shear hinges, and coupled P-M2-M3 hinges
are available in SAP2000. A hinge element with a specific length can be assigned to the
frame or the tendon member to simulate yielding and post-yielding behaviour. The plastic
behaviour only occurs within the hinges and the elastic behaviour occurs over the
member length. A series of hinges can be assigned at discrete locations along the member
length to capture distributed plasticity. Also, more than one type of hinge can be placed at
the same location to simulate different nonlinear behaviour for each DOF. The hinge
element could affect structural performance in nonlinear static and nonlinear time-history
analysis, but it wouldn’t be active in the FNA analysis.
3.3 Modeling of the Superstructure
3.3.1 Modeling of Frames
A 3D model of the selected building was created using SAP2000 as shown in Figure 3.1.
The same model was used for both fixed base buildings (without base isolation) and base-

20
isolated buildings having different base isolation systems. The superstructure elements of
the building model were modelled using the frame elements in SAP2000, and the sections
of beams and columns were defined in the Section Designer (SD) as shown in Figure 3.2.
These sections were then assigned to frame objects. The unconfined concrete used was of
C30 based on the Chinese practice with 2400 kg/m3 mass density and 30 MPa
compressive strength. Confined concrete was used for the core and unconfined concrete
was used for the cover concrete for both beams and columns. The reinforcement for the
beams and columns was determined by SAP2000 through Concrete Frame Design option.
The reinforcing steel used was of HRB 335 type.
(a) Plan
(b) Elevation
Figure 3.1: Modeling of the Superstructure in SAP2000

21
(c) 3D View
Figure 3.1: Modeling of the Superstructure in SAP2000
Figure 3.2: SD Section of a Square Column
The actual design details for the building were not available. Therefore, the National
Building Code of Canada (NBCC-2010) seismic provisions were used to design the
buildings. The building was assumed to be a conventional reinforced concrete frame
building, without the special seismic detailing for ductile or nominally ductile buildings.
22
Equivalent static force approach was used for seismic design based on first mode
response. The design base shear was computed as described below.
( )a V E
d o
S T M I WV
R R
(3.1)
Where dR and oR are the ductility related force modification factor and overstrength
raleted force modification factor for the moment-resisting frames, selected as 1.5 and 1.3
respectively. aT in the base shear equation is the empirical fundamental period for the
concrete moment frames, given by 3 40.075( ) 0.72a nT h s ; EI is the building importance
factor for the hospital and is equal to 1.5; VM is the higher mode factor, specified as 1 for
the moment-resisting frames for 1.0aT and (0.2) (2.0) 8.0a aS S ; W is the structural
weight contributing to inertia forces, computed using the following load combination.
0.25 0.6 223712.5sW D L L kN
(3.2)
The design spectral acceleration ( )aS T is related to the building fundamental period aT
and the peak acceleration max . According to the Chinese design code, the design spectral
acceleration was computed by Eq. 3.3.
2 maxg aT T
(3.3)
where max is specified as 0.12g for Lushan county, gT is the characteristic site period,
specified as 0.35s; 2 is the damping adjustment coefficient, determined as 1; and is
equal to 0.9. Thus, ( )aS T is calculated as 0.063g and the equivalent static force is
obtained as 10789.22 kN.
Inverted triangular distribution of lateral seismic forces was used. The seismic force at
each floor level (shown in Table 3.1) was calculated according to:
( - )i i ti
i i
W h V FF
W h
(3.4)

23
Where V is the seismic base shear, iF is seismic force distribution factor at i floor, iW is
the structural weight at the i floor, ih is the height from the base to the i floor.
Table 3.1: Seismic Force at Each Floor Level
No. of Floor ( )ih m ( )iW kN ( . )i iWh kN m ( )iF kN
1st 27.9 9746.17 271918.2 803.73
2nd
23.4 35743.81 836405.1 2472.24
3rd
19.8 35743.81 707727.4 2091.89
4th
15.6 35743.81 557603.4 1648.16
5th
11.4 35743.81 407479.4 1204.42
6th
7.8 35743.81 278801.7 824.08
7th
4.2 35743.81 150124 443.73
The above seismic forces were applied to the model structure for static lateral load
analysis, from which the frame members were designed. The reinforcement details of the
frame elements are presented in Table 3.2.
Table 3.2: Reinforcement Details of the Frames
No. of Floor Column(600*600) Beam1 (300*500) Beam2 (300*700) Beam4 (300*600)
1st 1.04% (12#20d) 1.25% (6#20d) 1.05% (7#20d) 0.82% (6#25d)
2nd
1.04% (12#20d) 1.25% (6#20d) 1.05% (7#20d) 0.82% (6#25d)
3rd
1.04% (12#20d) 1.25% (6#20d) 1.05% (7#20d) 0.82% (6#25d)
4th
1.04% (12#20d) 1.25% (6#20d) 0.9% (6#20d) 0.82% (6#25d)
5th
1.04% (12#20d) 0.67% (5#16d) 0.57% (6#20d) 0.82% (6#25d)
6th
1.04% (12#20d) 0.67% (5#16d) 0.57% (6#20d) 0.68% (5#20d)
7th
1.04% (12#20d) 0.67% (5#16d) 0.57% (6#20d) 0.68% (5#20d)
3.3.2 Modeling of Post-yield Behaviour of Frame Elements
Under sufficiently high lateral forces the frame members yield when they reach their
yield moments. When the yield moment is reached, plastic hinge starts forming near the
ends of frame members, developing large rotations. To capture inelastic behaviour of
frame members, nonlinear material stress-strain relationships shown in Figure 3.3 are
assigned to concrete and reinforcing steel. The plastic behaviour in SAP 2000 is
simulated by assigning concentrated plastic hinges or the multilinear plastic links to the
frame objects. When the frame member deformation exceeds the elastic limit, the
expected plastic behaviour occurs entirely within the plastic hinge or link, while the
elastic behaviour taking place over the member length.

24
In this project, the nonlinearity of the frame system was modeled by using the multilinear
plastic link rather than the concentrated hinge because the hysteretic behaviour could be
specified for multiple DOF within a single link, which is not possible for concentrated
hinges. The multilinear plastic links with selected lengths were inserted at both ends of
beams and columns as shown in Figure 3.4. The link length was specified as being equal
to the equivalent plastic hinge length ( pl ), calculated as 0.5 0.05pl d z (Mattock method),
where z is the shear span of the frame objects and d is the effective depth. The beam-
column joints (the overlap of beams and columns, depicted as shadow areas in Figure 3.4)
were made rigid to eliminate the rotation of the connection. Moreover, the behaviour of
plastic link was defined as nonlinear in two horizontal directions ( 2R and 3R directions)
and linear in the other four directions. The effective stiffness of the multilinear plastic
link in the six principal directions was calculated using the formulae given in Table 3.3,
where L is the link length and A is the area of the frame member. Also, the weight of
plastic links was calculated as the weight per unit length of reinforced concrete times the
link length. Figure 3.5 shows nonlinear force-deformation characteristics of plastic links.
The multilinear force-deformation data were obtained from the moment-curvature
relationship of RC frame members though sectional analysis. The hysteresis model
proposed by Takeda et al. (1972) was adopted to describe the hysteretic behaviour of
plastic links. In this degrading hysteretic model, the reloading stiffness is lower than the
initial loading stiffness because of stiffness degradation associated with cracking of
concrete and yielding of reinforcing steel.
(a) Unconfined C30 Reinforced Concrete (b) HRB335 Steel
Figure 3.3: Stress-strain Relationships of Unconfined C30 Concrete and HRB335 Steel

25
Figure 3.4: Placement of Plastic Links in Frame Elements
(a) Force-Deformation Definition of Links (b) Moment-Curvature Relationship of Reinforced Concrete
(c) Takeda’s Hysteretic Model
Figure 3.5: Modeling Details of Multi-linear Plastic Links
Table 3.3: Effective Stiffness for Multi-linear Plastic Links in Six Principal Directions
Stiffness Coefficient Formula
1k - Axial ( 1U ) EA L
2 3,k k - Translation ( 2 3,U U ) 3
12EA L
4k - Torsion ( 1R ) GJ L
5 6,k k - Flexure ( 2 3,R R ) EI L

26
Figure 3.6: Placement of Grouted Walls
Table 3. 4: Properties of the Autoclaved Aerated Concrete Masonry
Dry Density (3kg m ) Compressive Strength ( Mpa ) Tensile Strength ( Mpa ) Elastic Modulus( Mpa )
500.00 3.00 0.30 1.50
3.3.3 Modeling of Masonry Walls
Part of the external walls and the walls forming the elevator shaft and stairwells at every
floor of the building (shown as red lines in Figure 3.6) were grouted to enhance the lateral
stiffness of the superstructure. Because the precise properties of the concrete masonry
units used in the building could not be found, the autoclaved aerated concrete (AAC)
masonry units that are widely used in China was assumed. Their properties are shown in
Table 3.4. It is noteworthy that the density of the AAC masonry (5003kg m ) was quiet
low compared with the density of regular concrete masonry (1700 to 20003kg m ). The
low density of masonry reduced the self-weight of the building, consequently lowering
the bearing loads on the isolators and the initial forces caused by the ground excitation.
The infill wall was modeled in SAP2000 by two diagonal struts having the same
thickness as the infill panel. The equivalent width of the strut ( w ) was calculated as
0.4
inf inf0.175 ( )hw d H , where ( infH ) is the height and ( infd ) is the diagonal length of the
infill wall [23,24]. Approximately, the strut width could be taken as equal to one-fourth
of the diagonal wall length. The properties of the AAC masonry were assigned to the
struts, except that the density was specified as zero, because the weight of the infill walls
was incorporated as equivalent distributed loads on the beams. Because the struts were
27
intended to simulate diagonal compressive forces developing in infill walls, the joints
connecting the struts to the beam-column joint was defined as pin connections to release
the moments ( , ,x y zM M M ) at the strut ends. Also, the tension capacity was set to zero as
struts could not resist tensile forces associated with diagonal tension in unreinforced
masonry infills. At any given time during earthquake response, one of the two diagonal
struts modelling an infill panel would be under compression while the other would
experience zero tension, i.e., only one strut would be effective. Axial hinges were
assigned at both ends of struts to simulate strength degradation of concrete masonry
beyond crushing. The plasticity of axial hinges was modelled with the force-displacement
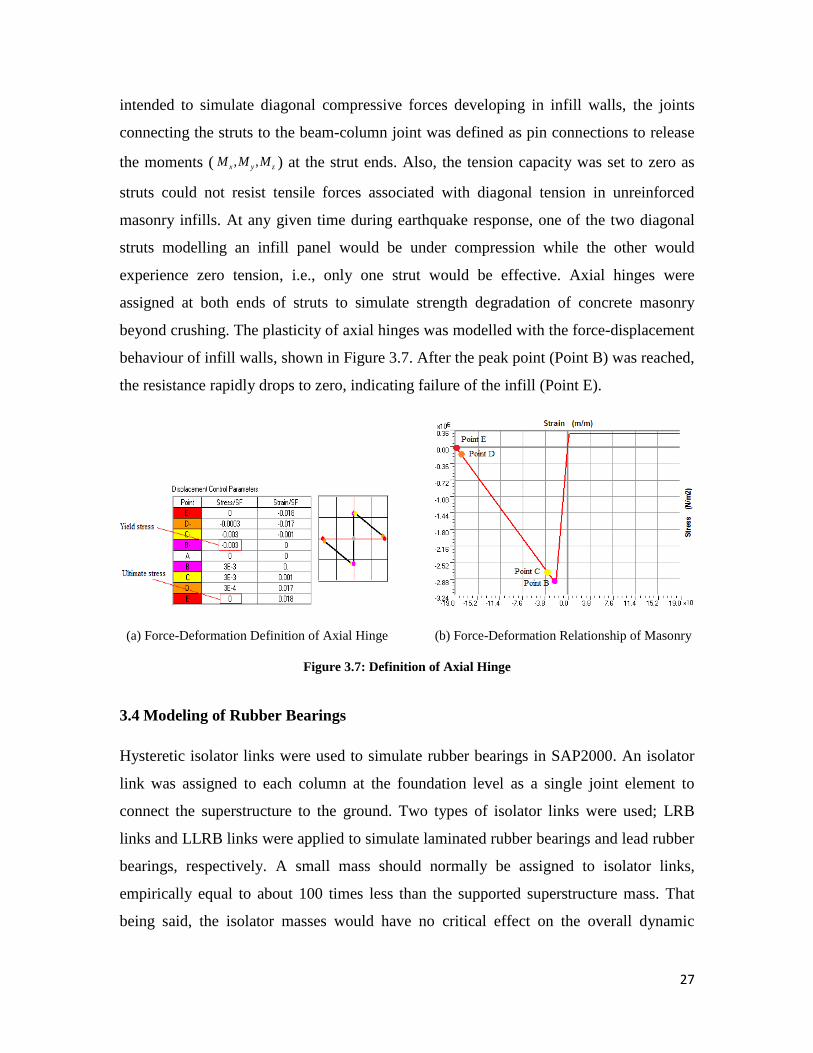
behaviour of infill walls, shown in Figure 3.7. After the peak point (Point B) was reached,
the resistance rapidly drops to zero, indicating failure of the infill (Point E).
(a) Force-Deformation Definition of Axial Hinge (b) Force-Deformation Relationship of Masonry
Figure 3.7: Definition of Axial Hinge
3.4 Modeling of Rubber Bearings
Hysteretic isolator links were used to simulate rubber bearings in SAP2000. An isolator
link was assigned to each column at the foundation level as a single joint element to
connect the superstructure to the ground. Two types of isolator links were used; LRB
links and LLRB links were applied to simulate laminated rubber bearings and lead rubber
bearings, respectively. A small mass should normally be assigned to isolator links,
empirically equal to about 100 times less than the supported superstructure mass. That
being said, the isolator masses would have no critical effect on the overall dynamic
28
performance of the structure, though it might slightly influence the convergence of the
modal analysis. In the current project, mass and rotational inertia properties of LBR and
LLRB link elements were set to zero to reduce the complexity of calculations.
The behaviour of link elements in SAP2000 is defined in the Link/Support Property.
Only the properties for axial deformation ( 1U ), shear deformations ( 2U , 3U ) and torsional
deformation ( 1R ) were specified. All internal deformations of the isolator links are
assumed to be independent of each other. The LRB and LLRB links had linear effective-
stiffness properties for axial and torsional deformations. For shear deformations, the LRB
links used elastic properties owing to the strong elasticity of the rubber material while the
LLRB links had coupled plasticity properties associated with the hysteretic lateral
performance of the lead plugs. Although the shear deformation of the LLRB links was
defined as nonlinear, the linear properties such as the effective stiffness and the effective
damping were still needed. This is because the model analysis that starts from zero initial
condition uses the effective stiffness rather than the actual nonlinear stiffness to calculate
the natural period of structural models.
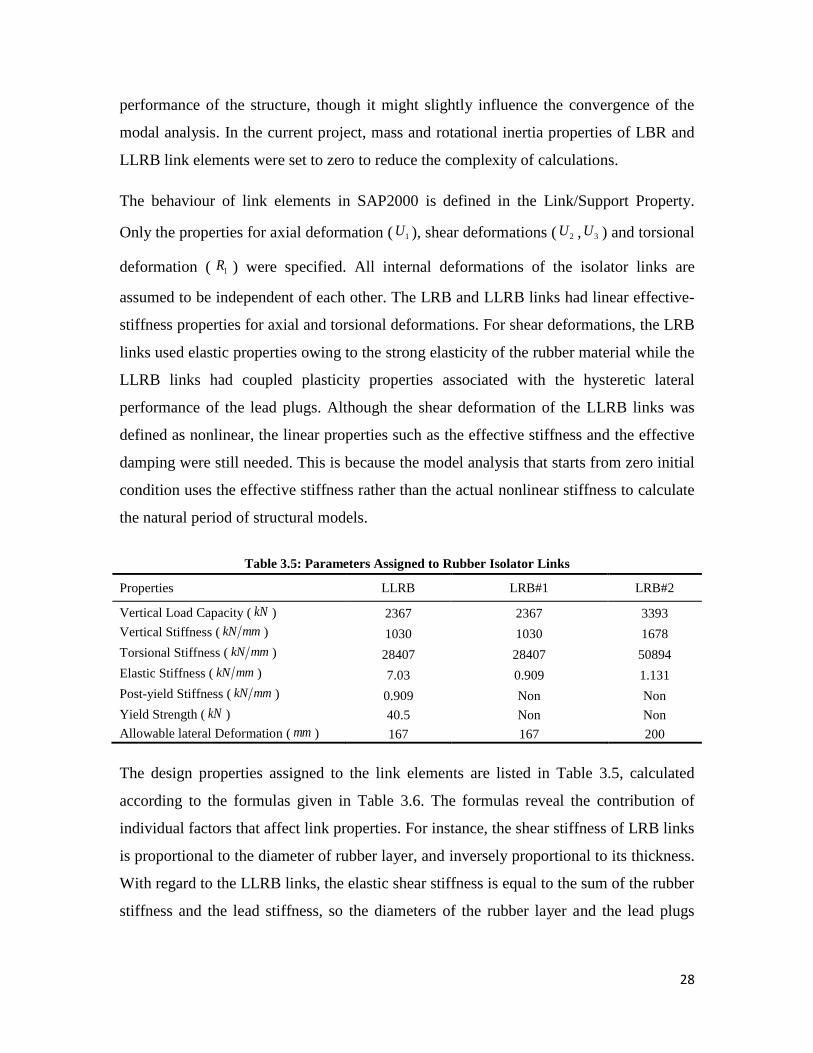
Table 3.5: Parameters Assigned to Rubber Isolator Links
Properties LLRB LRB#1 LRB#2
Vertical Load Capacity ( kN ) 2367 2367 3393
Vertical Stiffness ( kN mm ) 1030 1030 1678
Torsional Stiffness ( kN mm ) 28407 28407 50894
Elastic Stiffness ( kN mm ) 7.03 0.909 1.131
Post-yield Stiffness ( kN mm ) 0.909 Non Non
Yield Strength ( kN ) 40.5 Non Non
Allowable lateral Deformation ( mm ) 167 167 200
The design properties assigned to the link elements are listed in Table 3.5, calculated
according to the formulas given in Table 3.6. The formulas reveal the contribution of
individual factors that affect link properties. For instance, the shear stiffness of LRB links
is proportional to the diameter of rubber layer, and inversely proportional to its thickness.
With regard to the LLRB links, the elastic shear stiffness is equal to the sum of the rubber
stiffness and the lead stiffness, so the diameters of the rubber layer and the lead plugs

29
both matter, while the post-yield stiffness is solely dependent on the dimension of the
rubber layer because after yielding of the lead plug only the rubber perform elastically.
Table 3. 6: Formulas for the Key Parameters in the Design of the Rubber Bearings
Key Parameters Formula Description
Vertical load Carrying
Capacity
'
r wAG S 'A : The area between the top and bottom faces of the
bearings;
rG : The shear modulus of the rubber ;
w : The allowable shear strain under vertical load;
S : The shape factor of the rubber layer;
Vertical Stiffness 2
2
6
(6 )
r r r
r r r
G S A
h G S
rA : The rubber layer area;
rh : The total rubber height;
rG : The shear modulus of the rubber ;
r : The compression modulus of the rubber;
S : The shape factor of the rubber layer;
Torsional Stiffness GJ l rG : The shear modulus of the rubber ;
J : The torsional constant of the isolator ;
l : The link length;
Lateral Stiffness for LRBs
r r rG A h rG : The shear modulus of the rubber ;
rA : The rubber layer area;
rh : The total rubber height;
Elastic Stiffness for LLRBs
( )r r p p rG A G A h
rG : The shear modulus of the rubber ;
rA : The rubber layer area;
pG : The shear modulus of the lead ;
pA : The lead corn area;
rh : The total rubber height;
Post-yield Stiffness for
LLRBs r r rG A h
rG : The shear modulus of the rubber ;
rA : The rubber layer area;
rh : The total rubber height;
Yield Strength (1 )p p r r p pA G A G A
rG : The shear modulus of the rubber ;
rA : The rubber layer area;
pG : The shear modulus of the lead ;
pA : The lead corn area;
p : The shear yield strength of the lead;
Allowable Isolator
Deformation
'0.8 (1 )r
D A A
D : The area between the top and bottom faces of the
bearings; '
rA A : The overlap factor ;

30
Furthermore, in terms of behaviour under vertical loads, the vertical stiffness and the
allowable lateral deformation for both LBR and LLBR links are highly related to the
isolator diameter. The isolator properties calculated based on the formulas from Table 3.6
are compared with those obtained from tests, shown earlier in Table 2.1, indicating
excellent correlations.
Figure 3.8 shows biaxial hysteretic properties of shear deformation for the LLRB links.
Upon reaching the yield force ( yF ) the lateral stiffness of the link element is instantly
dropped to one tenth of the initial stiffness and remain the same until reaching the
maximum lateral displacement ( maxX ). The energy dissipation capacity of the LLRB links
was determined by the area of the hysteresis loops, which is highly dependent on the
yield force and the elastic stiffness. Normally, the hysteresis loop area is proportional to
the yield strength of the links, but a considerably large yield force may cause adverse
effects on energy dissipation. A possible reason is that, the yield force might be so high
that it could hardly be reached especially under small ground motions. As a result, plastic
deformations would hardly occur, leading to a lower damping in the isolator links that
barely dissipate energy. Since both the shear deformations of the LLRB links were
defined to be nonlinear, a coupled force-deformation relationship for these shear
deformations was obtained. This is shown below:
2 2 2 2 2 2 2
3 3 3 3 3 3 3
(1 )
(1 )
u u
u u
f ratio k d ratio yield z
f ratio k d ratio yield z
(3.5)
Where 2k and 3k are the elastic stiffness, 2yield and 3yield are the yield force, 2ratio and
3ratio are the ratio of the post-yield stiffness to the elastic stiffness, and 2z and 3z are the
internal hysteretic variables.
Figure 3.8: Hysteretic Property for the Shear Deformation of Rubber Isolator Links

31
These variables should satisfy 2 2
2 3 1z z with the yield surface represented by2 2
2 3 1z z .
The initial values of 2z and 3z are zero. Subsequently, they can be determined according to the
following equations:
.2
. 22
22 2 2 3 3 3
2. .22 2 3 3 3
33
2
1
1
u
u
kd
yieldz a z a z z
ka z z a zz d
yield
(3.6)
Where:
(3.7)
3.5 Modeling of the friction pendulum bearing system
The friction isolator links simulate the friction pendulum bearings in SAP2000. The mass
and rotational deformation of the isolator links are set to be zero initially. Similarly as in
the case of modeling of the rubber bearing system, only the link properties for axial
deformation, two shear deformations and the torsional deformation are specified. The
friction isolator link has nonlinear behaviour for the axial deformation; coupled friction
properties for the two shear deformations; and linear effective-stiffness properties for the
torsional deformation. As for the axial behaviour, a high stiffness is required to support
the weight of the structure. This is determined as the isolator’s length divided by its cross
sectional area times the elastic modulus. The vertical stiffness of the friction isolator link
must be positive and the axial force must be negative (compression). This is because the
friction isolator links can only take axial compression for the purpose of generating shear
forces. In addition, a damping coefficient is defined in order to reduce the numerical
scatter that might happen during nonlinear analysis. The damping coefficient is calculated
based on the formula 2c r km , where r is the damping ratio, which was assumed to be 5%
in the current simulation and m is the tributary mass of the isolators estimated as the
supported vertical loads divided by the acceleration of gravity. Since the additional
.
2 22
.
3 33
1 0
0
1 0
0
u
u
if d zaotherwise
if d zaotherwise

32
damping coefficient was specified, the total axial force was equal to the sum of the
stiffness force and the damping force. However, only the stiffness force acted on the
sliding surface and contributed to shear resistance; the damping force did not generate
shear forces.
The friction isolator links had nonlinear behaviour in two shear deformation directions.
The nonlinear shear forces in the link elements consist of friction forces and pendulum
forces, which are both directly proportional to the axial compression in elements. The
frictional force displacement relationship for each shear deformation was determined as
2,3 2,3 2,3u f uf p z , where p is the axial force acted on the bearing surface, 2,3u is the
friction coefficient and 2,3z is the internal hysteretic variable. The friction coefficient is
related to the sliding velocity determined as 2,3 2,3 2,3 2,3( )u fast fast slow e , where 2,3slow
and 2,3fast are friction coefficients at zero velocities and at high velocities, which are
directly specified in SAP2000. is the resultant velocity of sliding, defined as
2 2
2 3u ud d ; and is the effective inverse velocity given by. .
2 2 2
2 2 3 3( )u urate d rate d .
Also, the internal hysteretic variables were determined as:
.2
. 22
22 2 2 3 3 3
2. .22 2 3 3 3
33
2
1
1
u
u
u
u
kd
pz a z a z z
ka z z a zz d
p
(3.8)
Where 2k and 3k are the initial shear stiffness of the FP isolator before sliding, and
.
2 22
.
3 33
1 0
0
1 0
0
u
u
if d zaotherwise
if d zaotherwise
SAP 2000 allows certain sliding before the shear forces in the link elements exceeds the
maximum static friction ( p ). To minimize sliding at lower shear forces, a large value of
elastic shear stiffness was required, and specified as ep d , where ed is the lateral

33
displacement of the FPBs occurred before the static friction is overcome, normally with
an order of magnitude of 410 m to 310 m .
The pendulum force deformation relationship of the friction isolator links was obtained
by 2,3 2,3 2,3u p uf pd radius , where p is the axial compression force in the isolator links and
2,3radius is the effective pendulum length, equal to the radius of the sliding surface minus
the distance from the bearing surface to the articulation point of the isolators. The total
shear force in the friction isolator links equals to the sum of the friction force and the
pendulums force. It is computed by equation 3.9.
,3 2,3
2,3 2,3
2,3 2,3
1( )
u
u u
u
zf p d
radius d
(3.9)
Obviously, the lateral stiffness of the friction isolator links is proportional to the axial
force in the element. As a result, the period of the friction isolation system becomes
unrelated to the weight of the modeled structures as per max
12 2 ( )
WT g
radius dgk
.
The properties assigned to the friction isolator links are shown in Table 3.7.
Table 3.7: Parameters Assign to the Friction Isolator Links
Supported Weight ( kN ) 1571
Radius of Sliding Surface ( mm ) 2300
Friction Coefficient, slow 0.04
Friction Coefficient, fast 0.06
Initial Stiffness ( kN mm ) 942.6
Post-yield Stiffness ( kN mm ) 0.683
Effective Stiffness ( kN mm ) 1.154
Radius of Sliding Surface ( mm ) 2300
Figure 3.9 shows the hysteretic properties of shear deformations for friction pendulum
isolators. The FP system has a large initial stiffness ( ek ) and the system is near rigid until
the shear force reaches the yield value of p . Then, the force increase is proportional to
the yield stiffness of the FPBs ( k ), specified as p radius . Also, an effective stiffness ( effk )
is given by max(1 )P radius d , where maxd is the maximum lateral displacement. The
hysteresis loop area can be used to estimate the energy dissipation capacity of the FP

34
system. Usually, the FP system with a high friction coefficient would produce a large
hysteresis loop and thus dissipates a great value of seismic energy. Also, the energy
dissipation capacity of the FPB system is directly proportional to the structural weight
supported by bearings, since a large axial force in the isolator could generate a high yield
force, creating a large area under the hysteresis loop.
Figure 3.9: Hysteretic Property for the Shear Deformation of the Friction Isolator Links
3.6 Modeling of the supplemental viscous damper system
The damper links were used to model the supplemental viscous dampers in SAP2000,
attached to the isolator links to provide additional viscous damping. Only the link
properties for two shear deformations were specified. The behaviour of the damper link
followed the Maxwell model of viscoelasticity (Malvern, 1969), which has an exponent
viscous damper in series with a linear spring, as shown in Figure 3.10. The force
deformation relationship of the damper link was determined asexpc
kf kd cv , where k is
the spring constant, kd is the deformation in the spring, c is the damping coefficient, expc
is the damping exponent and v is the velocity of the damper. The practical range of the
damping exponent is 0.2 to 2.0; a small value of the damping exponent is recommended
for the purpose of avoiding immense damping force at large velocities. It is importan to
note that the damper links use linear damping properties if the damping exponent is set to
be 1.0. Otherwise, nonlinear damping properties are to be specified.

35
Figure 3.10: Maxwell Damper Model
Table 3.8 lists the damper link element properties. The damping exponent was set equal
to 1.0; hence the force deformation relationship was linear. The main reason for using
linear damping is that it introduces little interaction between linear damping forces and
structural forces in the model. Also, linear damping is easy to model and unlikely to
excite higher modes of the structure. The critical damping coefficient of the modeled
structure was obtained by 4 m T , where m is the structural mass and T is the natural
period of the modeled structure. The damping coefficient of the damper link was
specified as 30% of critical damping according to the displacement response spectra of
the modeled structure. The displacement threshold of the isolated structure could dictate
the estimation of the required viscous damping. Figure 3.11 indicates that, with the
viscous damping of 30% of critical damping, the spectral displacement is reduced to the
allowable isolator displacement, which is approximately equal to one-third of the isolator
diameter.
Table 3.8: Parameters Assign to the Damper Links
Structural Mass ( kg ) 9137506
Natural Period of Structure ( s ) 2.09
Critical Damping Coefficient ( .kN s m ) 54940.3
Viscous Damping Coefficient ( .kN s m ) 16482.1
Damping Exponent 1

36
Figure 3.11: Spectral Displacements of Modeled Structure with Different Damping Levels
3.7 Load Cases
The load case defines how the loads are applied and how the structure responds to the
loading. Several load cases were specified including the dead load case, live load case,
modal load case, gravity load case and acceleration load case, as introduced in the
followings.
Modal Load Case
The modal analysis is used to determine the vibration modes and the fundamental period
of the modeled structure. The modal load case may use the structural stiffness from the
initial conditions or at the end of a previous nonlinear analysis. In the current project, the
modal load case was based on the stiffness of the full unstressed structure (using initial
conditions). Thus, the modal analysis used linear properties only, regardless of whether
nonlinear properties were specified or not. Moreover, the Ritz-vector analysis was
selected, rather than the Eigenvector analysis, to create a basis for the subsequent time
history analysis. The Eigenvector analysis is used for determining the undamped free-
vibration mode shapes; the Ritz-vector analysis is used to find modes that are excited by a
particular loading. Previous research showed that for the same number of modes, the
dynamic analyses based on a set of Ritz vectors could generate better results than that

37
based on the natural mode shapes. This is because the Ritz-vector analysis account for the
spatial distribution of dynamic loading, which is neglected by the Eigenvector analysis.
The definition of the modal load case in SAP2000 is shown in Figure 3.12(a).
(a) Modal Load Case
(b) Gravity Load Case (c) Acceleration Load Case
Figure 3.12: Definition of Load Cases in SAP2000
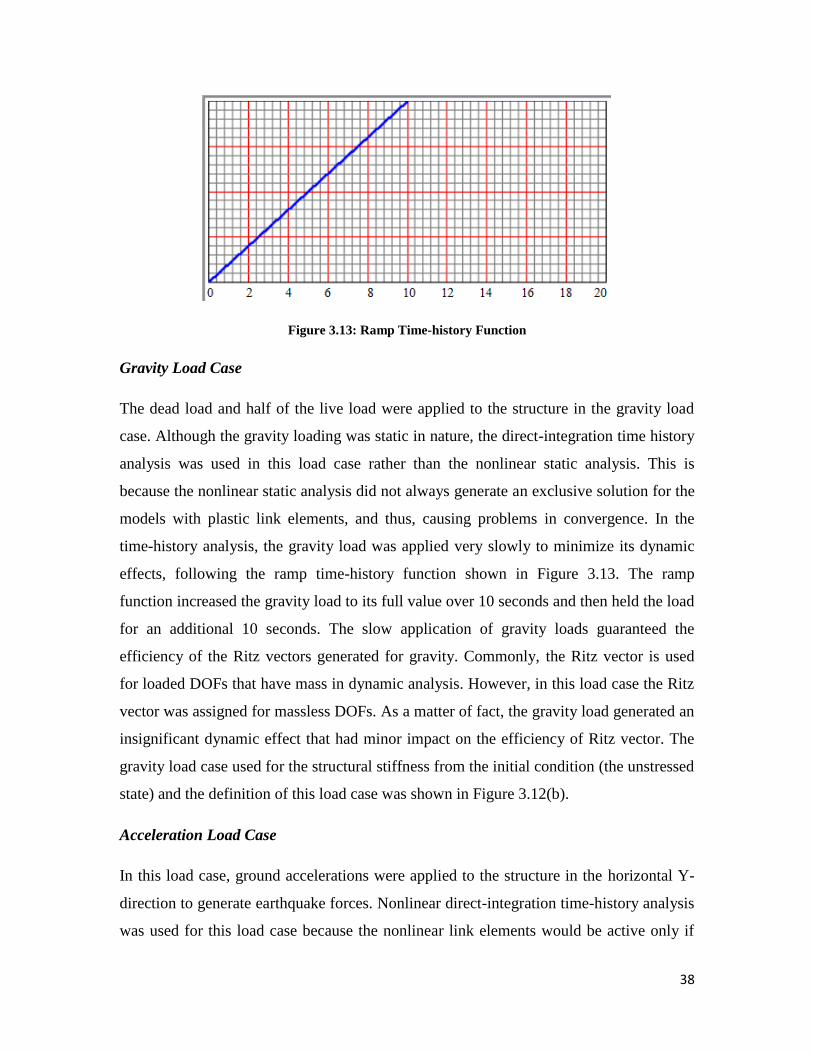
38
Figure 3.13: Ramp Time-history Function
Gravity Load Case
The dead load and half of the live load were applied to the structure in the gravity load
case. Although the gravity loading was static in nature, the direct-integration time history
analysis was used in this load case rather than the nonlinear static analysis. This is
because the nonlinear static analysis did not always generate an exclusive solution for the
models with plastic link elements, and thus, causing problems in convergence. In the
time-history analysis, the gravity load was applied very slowly to minimize its dynamic
effects, following the ramp time-history function shown in Figure 3.13. The ramp
function increased the gravity load to its full value over 10 seconds and then held the load
for an additional 10 seconds. The slow application of gravity loads guaranteed the
efficiency of the Ritz vectors generated for gravity. Commonly, the Ritz vector is used
for loaded DOFs that have mass in dynamic analysis. However, in this load case the Ritz
vector was assigned for massless DOFs. As a matter of fact, the gravity load generated an
insignificant dynamic effect that had minor impact on the efficiency of Ritz vector. The
gravity load case used for the structural stiffness from the initial condition (the unstressed
state) and the definition of this load case was shown in Figure 3.12(b).
Acceleration Load Case
In this load case, ground accelerations were applied to the structure in the horizontal Y-
direction to generate earthquake forces. Nonlinear direct-integration time-history analysis
was used for this load case because the nonlinear link elements would be active only if

39
the structural response was solved with the direct integration method. Also, the output
time step size of the analysis was set to be 0.005s. The number of output time steps was
set at 8000, which corresponded to input ground motion records that have a time-step of
0.005s and a total duration of 40s. The structural stiffness at the end of the gravity load
case was used for the acceleration load case to combine the gravity load effects with the
effects of ground excitation when computing structural response. This approach of load
combination generated the most accurate results since both the loading sequence and the
nonlinearity from factored loading (1D+0.5L+1Q) were accounted for. The definition of
the acceleration load case in SAP2000 is presented in Figure 3.12(c).
3.8 Earthquake Records
Four ground motions, labelled as La11-005#1, La11-005#2, La11-005#3 and La11-005#4,
were used in the horizontal Y-direction. The four earthquake records with the same
frequency content but with an increasing intensity were selected to eliminate ground
motion frequency content as a parameter. The earthquake record selected was the original
1940 Imperial Valley Earthquake (EI Centro) record (La11-005) specified in fractions of
g, with a time-step of 0.005s and a total duration of 40s. The peak ground accelerations
(PGA) of the four input motions were scaled to match 0.5g, 0.67g, 0.9g and 1.2g. These
records were labelled as La11-005#1 to La11-005#4, respectively. The acceleration time-
history of these records are presented in Figure 3.14 and their displacement and
acceleration response spectra based on 15% structural damping are shown in Figure 3.15.
Figure 3.14: Acceleration Time-history of Four Input Motions

40
(a) Ground motion record: La11-005#1 (PGA=0.5g)
(b) Ground motion record: La11-005#2 (PGA=0.67g)
(c) Ground motion record: La11-005#3 (PGA=0.9g)
Figure 3.15: Displacement and Acceleration Response Spectra for Four Input Motions
(The input unit for spectra displacement is 410 m)
0 0.5 1 1.5 2 2.5 3 3.5 40
0.005
0.01
0.015
0.02
0.025
0.03
0.035Spectral Displacement
Period (s)
SD
(in
pu
t u
nits)
0 0.5 1 1.5 2 2.5 3 3.5 40
0.2
0.4
0.6
0.8
1
1.2
1.4Spectral and Pseudo-Spectral Acceleration
Period (s)
SA
or
PS
A (
g)
SA
PSA
0 0.5 1 1.5 2 2.5 3 3.5 40
0.005
0.01
0.015
0.02
0.025
0.03
0.035
0.04
0.045Spectral Displacement
Period (s)
SD
(in
pu
t u
nits)
0 0.5 1 1.5 2 2.5 3 3.5 40
0.5
1
1.5Spectral and Pseudo-Spectral Acceleration
Period (s)
SA
or
PS
A (
g)
SA
PSA
0 0.5 1 1.5 2 2.5 3 3.5 40
0.005
0.01
0.015
0.02
0.025
0.03
0.035
0.04
0.045
0.05Spectral Displacement
Period (s)
SD
(in
pu
t u
nits)
0 0.5 1 1.5 2 2.5 3 3.5 40
0.2
0.4
0.6
0.8
1
1.2
1.4
1.6
1.8Spectral and Pseudo-Spectral Acceleration
Period (s)
SA
or
PS
A (
g)
SA
PSA

41
(d) La11-005#4 (PGA=1.2g)
Figure 3.15: Displacement and Acceleration Response Spectra of Four Input Motions
(The input unit for spectra displacement is 410 m)
0 0.5 1 1.5 2 2.5 3 3.5 40
0.01
0.02
0.03
0.04
0.05
0.06
0.07
0.08Spectral Displacement
Period (s)
SD
(in
pu
t u
nits)
0 0.5 1 1.5 2 2.5 3 3.5 40
0.5
1
1.5
2
2.5
3Spectral and Pseudo-Spectral Acceleration
Period (s)
SA
or
PS
A (
g)
SA
PSA

42
Chapter 4
Results of Dynamic Analysis and Performance of Base
Isolation Systems
4.1 General
The structural models (for both the base-isolated and the fixed base buildings) were
analyzed using SAP2000 under different intensities of earthquake record. The seismic
performance of the building without the isolation system was first conducted. The mode
shapes and the fundamental period of the non-isolated model with and without the infill
walls were obtained based on modal analysis and responses history analysis. The results
showed that the masonry infill walls significantly affected structural performance. The
dynamic inelastic response history analysis was conducted on isolated buildings to
evaluate the effectiveness of different isolation systems (the rubber isolation system, the
friction pendulum isolation system and the hybrid isolation system composed of bearings
and dampers). The performances of the isolated structure were compared with that of the
fixed-base structure in terms of lateral drift ratios, peak absolute accelerations and
residual drifts. The influence of the isolator properties (such as the lead plug diameter for
the LLRBs, the friction coefficient for the FPBs and the damping level for the viscous
dampers) on the efficiency of the isolation system was assessed through a parametric
study. In addition, the modeling and ground motion aspects, like the earthquake intensity,
large isolator displacements and the contribution of vertical loading to isolator stiffness
were also investigated. Particular attention was given to the high level damped LLRB
system and viscous damper supplemented isolator systems, especially when the isolated
structure was subjected to far-field excitations. The results for all three seismic isolation

43
systems were collected, analyzed and compared to provide insight into the design and use
of the isolation systems considered in practice.
4.2 Seismic Performance Criteria
The primary focus of the current research is to investigate the effectiveness of the seismic
isolation system in enhancing structural performance during earthquake. As such, the
peak inter-storey drifts, the residual drifts and the peak absolute horizontal accelerations
were used as the performance criteria, introduced subsequently.
Peak Inter-storey Drifts:
The peak inter-storey drift, defined as the maximum relative lateral displacement at each
floor level divided by the floor height, is an indicator of both structural and non-structural
damage. Normally, the building experiencing a drift ratio between 0.0% to 0.5%
practically develops no damage in structural and non-structural elements. A drift ratio
ranging between 0.5% and 1.0% is indicative of minor non-structural damage, but no
structural damage. If drift ratio is 1.0% to 2.0%, major non-structural damage as well as
minor to moderate structural damage is expected. The building is considered seriously
damaged when the drift ratio is over 2.0%, and likely experience partial collapse when
the drift ratio is in excess of 4%.
Residual Drifts:
The residual drift, caused by inelastic response, reflects the suitability of the building for
occupancy and potential repair. Previous studies suggest that the building with a residual
drift between 0.0% and 0.6% is likely usable from an occupancy perspective. Building
that sustains a residual drift over 0.6%, structural repairs may be necessary for safety
considerations. However, residual drifts beyond a certain level are perceivable and may
justify the repair cost even though the main structure remains robust. Buildings that have
over 1% residual drift could be considered as a total loss, and a complete rebuilding may
be required.

44
Peak Absolute Horizontal Acceleration:
Peak absolute horizontal acceleration could significantly affect the performance of non-
structural elements, such as suspended ceilings, light fixtures and mechanical equipment,
because horizontal inertia forces at each floor level are proportional to the absolute
acceleration of the building. Accelerations that are less than 0.5g cause little damage to
non-structural elements. Accelerations between 0.5g to 1.0g may cause some damage to
internal building components. If accelerations increase beyond 1.0g, the interior building
space may be completely in shamble, and severe damage of sensitive equipment is
expected.
The horizontal displacement at the isolator level is also critical. Several isolated buildings
subjected to earthquakes revealed that the horizontal isolator displacement could become
considerably large when the building was subjected to strong ground excitations. A large
isolator deformation could severely damage the bearings, and may cause the collapse of
the isolated structure even if the superstructure remains otherwise sound. Therefore, the
allowable lateral displacement of the bearing should be kept in mind in selecting and
designing the isolation system, especially if the building is expected to experience strong
earthquake motions.
4.3 Performance of Buildings without Base Isolation
4.3.1 Fundamental Period
Two building models were considered to investigate the performance of the prototype
frame building. These consist of a bare frame without the infill walls, and the building as
designed with infill walls interacting with the frames. The first six periods of the infilled
and bare frame models are listed in Table 4.1. The presence of infill walls resulted in a
considerable stiffness increase, reducing the first mode period by approximately 50%;
from 1.295sec to 0.635sec. The acceleration response spectra of the earthquake records
showed higher spectral accelerations for reduced periods, as expected. As a result, the
infilled frame was expected to experience higher seismic forces.

45
Table 4.1: First Six Periods of the Infilled and Bare Frame Models (sec)
Infilled Model Bare Model
Mode1 0.635 1.295
Mode2 0.623 1.184
Mode3 0.551 0.415
Mode4 0.213 0.388
Mode5 0.210 0.243
Mode6 0.189 0.237
4.3.2 Peak Inter-storey Drift
Figure 4.1 show the comparison of maximum inter-storey drifts at each floor level for the
two non-isolated structural models, with and without the infill walls under the four
ground motions considered. Figures 4.1(a) through 4.1(d) include the comparison of bare
and infilled frames under gradually increasing levels of ground motion intensity. Figures
4.1 (e) and (f) show the effect of earthquake intensity on bare and infilled frames,
respectively. The maximum peak inter-storey drifts occurred at the first two storey levels
in both buildings, as also tabulated in Table 4.2. The inter-storey drifts were larger under
higher earthquake intensity, as expected. Under the La11-005#1 record with the lowest
intensity (PGA=0.5g), the maximum peak inter-storey drifts of infilled and bare frame
models varied between 0.5% and 1%, suggesting a slight damage to non-structural
elements. When the structures were subjected to La11-005#2 and La11-005#3 records
with higher intensities (PGA of 0.67g and 0.9g) the maximum peak inter-storey drifts
increased to 1.2% to 1.8%, indicating possible damage in structural elements. Earthquake
record La11-005#4 with the highest intensity (PGA=1.2g) resulted in considerably large
inter-storey drifts, approaching 3% to 4% for infilled and bare frames, respectively. The
large drifts were indicative of severe damage to structural and non-structural systems
with a potential for building collapse. It is noteworthy that the inter-storey drifts for the
infilled frame were much less than those for the bare frame because of the stiffening
effects of masonry infill walls. The frame building, even with grouted masonry walls
experienced high inter-storey drifts, indicating potential damage and needs for seismic
isolation.

46
(a) Ground motion record: La11-005#1
(b) Ground motion record: La11-005#2
Figure 4.1: Inter-storey Drift Envelopes for Non-isolated Frame Building with and without Infill
Walls under Four Ground Motion Intensities
0.00% 0.20% 0.40% 0.60% 0.80% 1.00% 1.20% 1.40%1
2
3
4
5
6
7
INTERSTOREY DRIFT(%)
FLO
OR
0.687% 1.117%
0.791% 1.226%
0.716% 1.061%
0.622% 0.885%
0.435% 0.567%
0.278% 0.299%
0.17% 0.224%INFILLED FRAME
BARE FRAME
0.00% 0.20% 0.40% 0.60% 0.80% 1.00% 1.20% 1.40% 1.60% 1.80% 2.00%1
2
3
4
5
6
7
INTERSTOREY DRIFT(%)
FLO
OR
1.187% 1.667%
1.233% 1.802%
0.997% 1.54%
0.761% 1.243%
0.457% 0.759%
0.266%0.352%
0.157% 0.241%
INFILLED FRAME
BARE FRAME

47
(c) Ground motion record:La11-005#3
(d) Ground motion record: La11-005#4
Figure 4.1: Inter-storey Drift Envelopes for Non-isolated Frame Building with and without Infill
Walls under Four Ground Motion Intensities
0.00% 0.50% 1.00% 1.50% 2.00% 2.50%1
2
3
4
5
6
7
INTERSTOREY DRIFT(%)
FLO
OR
1.46% 1.934%
1.489% 2.062%
1.172% 1.779%
0.864% 1.453%
0.864%0.861%
0.247% 0.384%
0.147% 0.26%INFILLED FRAME
BARE FRAME
0.00% 0.50% 1.00% 1.50% 2.00% 2.50% 3.00% 3.50% 4.00%1
2
3
4
5
6
7
INTERSTOREY DRIFT(%)
FLO
OR
2.921% 3.763%
2.918% 3.896%
2.286% 3.266%
1.747% 2.879%
0.796% 1.591%
0.321% 0.535%
0.166% 0.346%INFILLED FRAME
BARE FRAME

48
(e) Infilled structure subjected to the four ground motions
(f) Bare structure subjected to the four ground motions
Figure 4.1: Inter-storey Drift Envelopes for Non-isolated Frame Building with and without Infill
Walls under Four Ground Motion Intensities
0.00% 0.50% 1.00% 1.50% 2.00% 2.50% 3.00%1
2
3
4
5
6
7
RESIDUAL DRIFT(%)
FLO
OR
0.687% 1.187% 1.46% 2.921%
0.791% 1.233% 1.489% 2.918%
0.716%0.997%
1.172% 2.286%
0.622%0.761%
0.864% 1.747%
0.435%
0.457%
0.864%0.796%
0.278%
0.266%
0.247%
0.321%
0.17%0.157%
0.147% 0.166%PGA=0.5g
PGA=0.67g
PGA=0.9g
PGA=1.2g
0.00% 0.50% 1.00% 1.50% 2.00% 2.50% 3.00% 3.50% 4.00%1
2
3
4
5
6
7
INTERSTOREY DRIFT(%)
FLO
OR
1.117% 1.667% 1.934% 3.763%
1.226% 1.802% 2.062% 3.896%
1.061% 1.54% 1.779% 3.266%
0.885% 1.243% 1.453% 2.879%
0.567%0.759%
0.861% 1.591%
0.299%0.352%0.384%
0.535%
0.224%
0.241%0.26%0.346% PGA=0.5g
PGA=0.67g
PGA=0.9g
PGA=1.2g

49
Table 4.2: Maximum Inter-storey Drifts of the Infilled and Bare Structural Models
Infilled Model Bare Model
PGA=0.5g 0.791% 1.226%
PGA=0.67g 1.187% 1.667%
PGA=0.9g 1.460% 1.934%
PGA=1.2g 2.921% 3.763%
4.3.3 Residual Drift
The maximum residual storey drifts, recorded during response, are shown in Fig. 4.3 for
both frame buildings, with and without the infill walls. The results indicate less than 0.6%
drift ratio in both buildings, suggesting the survival of the buildings without a significant
effect on the operational capacity during seismic response. While these results are
meaningful when the structural components do not develop strength decay because of
limited ductility demands, or when they are well-designed and detailed with structural
elements not experiencing strength decay. The hysteretic model used for the members
had stiffness degradation capabilities, but not strength decay. Therefore, the results under
high intensity ground motions, exhibiting low residual drifts may not reliable. These
buildings may have experienced significant damage when their ductility capacities are
exceeded beyond 2% lateral drift, hence also expected to develop excessive residual drift.
Another reason for obtaining small residual drift is because the dynamic analysis
continued beyond the maximum lateral drift, and recovered the excessively high value
that may have occurred earlier. Therefore, even though the lateral drift may be over 2%,
indicating structural damage, the dynamic analysis will still continue until the end of the
earthquake input, often recovering previously experienced large drifts, resulting in small
residual drifts.
Figure 4.3 indicates that the presence of infill walls reduced residual drifts slightly. It
further indicates that residual drift demands were highest at the first floor level.
Table 4.3: Maximum Residual Drifts of the Infilled and Bare Structural Models
Infilled Model Bare Model
PGA=0.5g 0.098% 0.119%
PGA=0.67g 0.141% 0.148%
PGA=0.9g 0.161% 0.172%
PGA=1.2g 0.501% 0.505%
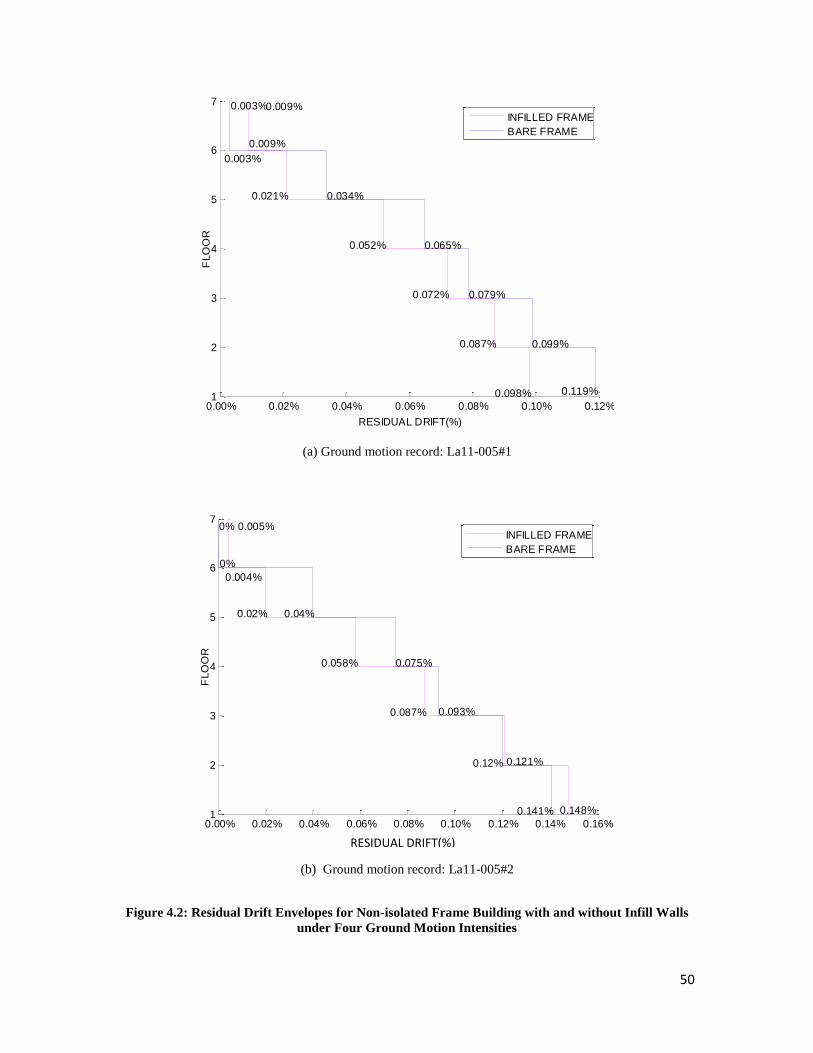
50
(a) Ground motion record: La11-005#1
(b) Ground motion record: La11-005#2
Figure 4.2: Residual Drift Envelopes for Non-isolated Frame Building with and without Infill Walls
under Four Ground Motion Intensities
0.00% 0.02% 0.04% 0.06% 0.08% 0.10% 0.12%1
2
3
4
5
6
7
RESIDUAL DRIFT(%)
FLO
OR
0.098% 0.119%
0.087% 0.099%
0.072% 0.079%
0.052% 0.065%
0.021% 0.034%
0.009%
0.003%
0.009%0.003%INFILLED FRAME
BARE FRAME
0.00% 0.02% 0.04% 0.06% 0.08% 0.10% 0.12% 0.14% 0.16%1
2
3
4
5
6
7
INTERSTOREY DRIFT(%)
FLO
OR
0.148%0.141%
0.121%0.12%
0.087% 0.093%
0.058% 0.075%
0.02% 0.04%
0.004%
0%
0.005%0%INFILLED FRAME
BARE FRAME
RESIDUAL DRIFT(%)

51
(c) Ground motion record: La11-005#3
(d) Ground motion record: La11-005#4
Figure 4.2: Residual Drift Envelopes for Non-isolated Frame Building with and without Infill Walls
under Four Ground Motion Intensities
0.00% 0.02% 0.04% 0.06% 0.08% 0.10% 0.12% 0.14% 0.16% 0.18%1
2
3
4
5
6
7
RESIDUAL DRIFT(%)
FLO
OR
0.172%0.161%
0.138% 0.14%
0.092% 0.113%
0.058% 0.099%
0.019% 0.043%
0%
0.002%
0.003%0.002% INFILLED FRAME
BARE FRAME
0.00% 0.10% 0.20% 0.30% 0.40% 0.50% 0.60% 0.70%1
2
3
4
5
6
7
RESIDUAL DRIFT(%)
FLO
OR
0.505%0.501%
0.442% 0.453%
0.275% 0.29%
0.284% 0.309%
0.12% 0.13%
0.004%
0.003%
0%0%INFILLED FRAME
BARE FRAME

52
(e) Infilled structure subjected to the four ground motions
(f) Bare structure subjected to the four ground motions
Figure 4.2 : Residual Drift Envelopes for Non-isolated Frame Building with and without Infill Walls
under Four Ground Motion Intensities
0.00% 0.10% 0.20% 0.30% 0.40% 0.50% 0.60%1
2
3
4
5
6
7
INTERSTOREY DRIFT(%)
FLO
OR
0.098%0.148% 0.172% 0.505%
0.087%0.121%
0.138% 0.442%
0.072%0.087%0.092% 0.275%
0.052%0.058% 0.058% 0.284%
0.021%
0.02%
0.019% 0.12%
0.009%
0.004%
0%
0.004%
0.009%
0.005%
0.003%0%
PGA=0.5g
PGA=0.67g
PGA=0.9g
PGA=1.2g
0.00% 0.10% 0.20% 0.30% 0.40% 0.50% 0.60% 0.70%1
2
3
4
5
6
7
RESIDUAL DRIFT(%)
FLO
OR
0.119%0.141% 0.161% 0.501%
0.099%0.12%
0.14% 0.453%
0.079%0.093% 0.113% 0.29%
0.065%0.075% 0.099% 0.309%
0.034%0.04% 0.043% 0.13%
0.003%0%
0.002%0.003%
0.003%0%0.002%0%
PGA=0.5g
PGA=0.67g
PGA=0.9g
PGA=1.2g
RESIDUAL DRIFT(%)

53
4.3.4 Peak Absolute Horizontal Acceleration
Peak absolute horizontal accelerations at each floor of the non-isolated buildings, with
and without masonry infill walls, are illustrated in Figure 4.3. The peak floor
accelerations at lower storeys decreased with building height up to about mid-height (4th
floor), and then increased quite substantially towards the top of the building. This
observation was true for both buildings with and without the infill walls. The maximum
peak accelerations are summarized in Table 4.4. They ranged between 0.5g and 1.0g for
bare frame building and building with infill walls, respectively. This suggests that
building contents, as well as operational and functional components are potentially
subjected to severe accelerations with serious potentials for damage. The expected
damage to building content and non-structural elements of a similar fixed base building
was validated by the observation of serious destruction of non-structural elements of the
old outpatient building of the Lushan People Hospital, which was not base isolated. This
is shown in Figure 2.6.
It is important to note that the frame building with infill walls experienced higher floor
accelerations as compared with the companion building with bare frames. Figure 4.3
shows that the frame model with infill walls developed larger floor accelerations than the
bare frame model. This can be explained by the change of building period that is resulted
from the presence of infill walls as stiffening elements. The increased structural stiffness
translated into a reduction in structural period and consequent increase in building
response as indicated by the acceleration response spectra. This increase in floor
accelerations could generate higher inertia forces at each floor level, resulting in diagonal
tension cracking in masonry infill walls. Also, the increased spectral acceleration would
increase shear forces in the frame elements, such as columns. Hence, the presence of
infill walls on one hand reduces inter-storey drift and controls damage associated with
excessive deformations, but at the same time increases seismic forces on structural
elements and may pose vulnerability associated with force capacities.

54
(a) Ground motion record: La11-005#1
(b) Ground motion record: La11-005#2
Figure 4.3: Floor Acceleration Envelopes for Non-isolated Frame Building with and without Infill
Walls under Four Ground Motion Intensities
0.35 0.4 0.45 0.5 0.55 0.6 0.65 0.70
1
2
3
4
5
6
7
ACCELERATION(g)
FLO
OR
0.447g0.447g
0.441g0.415g
0.425g0.403g
0.419g0.412g
0.409g0.395g
0.469g0.412g
0.571g0.445g
0.661g0.636g
INFILLED FRAME
BARE FRAME
0.4 0.45 0.5 0.55 0.6 0.65 0.7 0.750
1
2
3
4
5
6
7
ACCELERATION(g)
FLO
OR
0.596g0.596g
0.551g0.494g
0.505g0.469g
0.498g0.468g
0.483g0.441g
0.527g0.452g
0.625g0.489g
0.743g0.687g
INFILLED FRAME
BARE FRAME
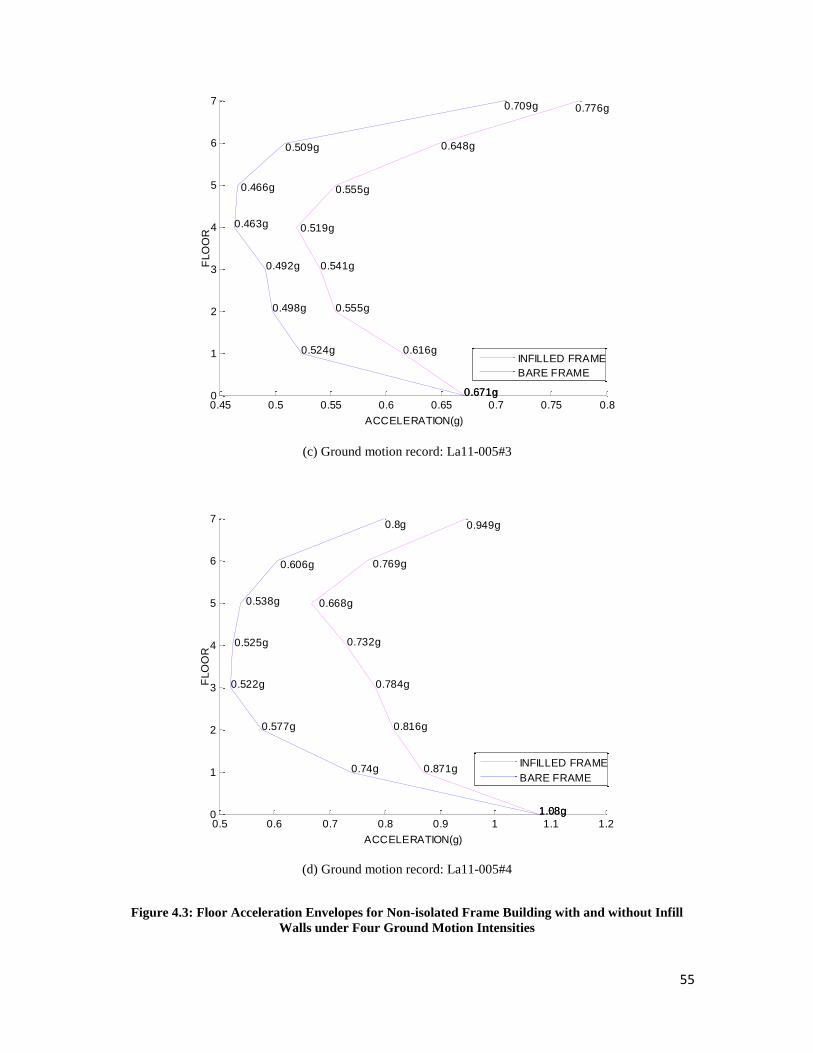
55
(c) Ground motion record: La11-005#3
(d) Ground motion record: La11-005#4
Figure 4.3: Floor Acceleration Envelopes for Non-isolated Frame Building with and without Infill
Walls under Four Ground Motion Intensities
0.45 0.5 0.55 0.6 0.65 0.7 0.75 0.80
1
2
3
4
5
6
7
ACCELERATION(g)
FLO
OR
0.671g0.671g
0.616g0.524g
0.555g0.498g
0.541g0.492g
0.519g0.463g
0.555g0.466g
0.648g0.509g
0.776g0.709g
INFILLED FRAME
BARE FRAME
0.5 0.6 0.7 0.8 0.9 1 1.1 1.20
1
2
3
4
5
6
7
ACCELERATION(g)
FLO
OR
1.08g1.08g
0.871g0.74g
0.816g0.577g
0.784g0.522g
0.732g0.525g
0.668g0.538g
0.769g0.606g
0.949g0.8g
INFILLED FRAME
BARE FRAME

56
(e) Infilled structure subjected to the four ground motions
(f) Bare structure under the four ground motions
Figure 4.3: Floor Acceleration Envelopes for Non-isolated Frame Building with and without Infill
Walls under Four Ground Motion Intensities
0.4 0.5 0.6 0.7 0.8 0.9 1 1.10
1
2
3
4
5
6
7
ACCELERATION(g)
FLO
OR
0.447g 0.596g 0.671g 1.08g
0.441g0.551g 0.616g 0.871g
0.425g
0.505g 0.555g 0.816g
0.419g0.498g 0.541g 0.784g
0.409g0.483g 0.519g 0.732g
0.469g 0.527g0.555g 0.668g
0.571g 0.625g0.648g 0.769g
0.661g 0.743g 0.776g 0.949g
PGA=0.5g
PGA=0.67g
PGA=0.9g
PGA=1.2g
0.4 0.5 0.6 0.7 0.8 0.9 1 1.10
1
2
3
4
5
6
7
ACCELERATION(g)
FLO
OR
0.447g 0.596g 0.671g 1.08g
0.415g 0.494g 0.524g 0.74g
0.403g 0.469g 0.498g 0.577g
0.412g 0.468g 0.492g 0.522g
0.395g0.441g
0.463g 0.525g
0.412g0.452g 0.466g 0.538g
0.445g0.489g 0.509g 0.606g
0.636g 0.687g 0.709g 0.8gPGA=0.5g
PGA=0.67g
PGA=0.9g
PGA=1.2g

57
Table 4.4: Maximum Floor Accelerations of the Infilled and Bare Structural Models
Infilled Model Bare Model
PGA=0.5g 0.661g 0.636g
PGA=0.67g 0.743g 0.687g
PGA=0.9g 0.776g 0.709g
PGA=1.2g 0.800g 0.909g
4.3.5 Axial Forces in Diagonal Struts
The axial forces of the plastic hinge elements at the ends of the diagonal struts were
examined to estimate the crushing of masonry infill walls during seismic response. Figure
4.4 presents the time history of axial forces at hinge No. 23 under Earthquake Record
La11-005#3, where a compression strut, with a dimension of 2100 240mm mm is connected
at the first storey level. As previously mentioned, the compressive strength of the
concrete masonry used in this project is 3.0Mpa. Therefore, the maximum axial force
(specified as the yield force for the purpose of modelling) for the diagonal strut is
1512kN, computed as the compressive strength times the strut area. No tensile force was
resisted by the strut because the tension limit of the strut objects was set to zero. This can
be observed in Fig. 4.4. The strut carried a large compressive force that exceeded the
crushing strength of the masonry. The compression force resulted in the crushing of
masonry infill wall, leading to sudden strength degradation (point A in Figure 4.4).
However, the onset of crushing did not completely destroy the infill wall, and the wall
continued to resist compression but with a lower compression resistance. The overall
building response indicated that only a few wall struts were found to reach the crushing
strength. This observation is consistent with the infill wall behaviour of the non-isolated
old outpatient building whose infill walls partially crushed and also developed diagonal
tension cracking.
4.3.6 Base Shear
Figure 4.5 depicts response time histories for base shear under the four earthquake
intensities considered. The responses of both frame buildings, with and without infill
walls, are shown. The results indicated that the base shear of the structure was higher for

58
the building that was stiffened by infill walls by 19.1%, 27.0%, 31.4% and 26.3%,
respectively under the Earthquake Records La11-005#1, La11-005#2, La11-005#3 and
La11-005#4. The increase in base shear was attributed to increased floor inertia forces
associated with higher spectral accelerations attracted by more rigid building. As the total
base shear is essentially equal to the summation of the inertia forces at each floor, the
increased floor inertia forces in turn led to a larger structural base shear. Under the
Earthquake Record La11-005#4 with the highest PGA of 1.2g, the dynamic analysis of
the analytical model had convergence problems 12 seconds after the beginning of the
analysis, possibly due to the excessive structural base shear (50976.93 kN ) or the very
large diagonal compression forces in some of the wall struts.
Figure 4.4: Axial Force Time History for the Hinge Element at the First-storey Strut under
Earthquake La11-005#3
The presence of infill walls affected the performance of the frame elements. Two effects
have become pronounced in terms of column response; i) increase in shear forces
associated with increased spectral accelerations for the more rigid infilled building, and ii)
the increase in column axial load and related increase in column bending moment
capacity because of the vertical component of diagonal strut forces acting on the columns.
To assess the significance of these changes in column behaviour, maximum shear forces
in critical columns were reviewed. The results indicated that shear forces slightly

59
(a) Ground motion record: La11-005#1
(b) Ground motion record: La11-005#2
Figure 4.5: Base Shear Time Histories for Non-isolated Frame Building with and without Infill Walls
under Four Ground Motion Intensities
0 5 10 15 20 25 30 35 40 -3
-2
-1
0
1
2
3
4 x 10 4
BA
SE
SH
EA
R(k
N)
TIME(s)
The maximum base shear of infilled frame=31558.5kN
The maximum base shear of bare frame=26485.9kN
INFILLED FRAME BARE FRAME
0 5 10 15 20 25 30 35 40 -3
-2
-1
0
1
2
3
4 x 10 4
TIME(s)
BA
SE
SH
EA
R(k
N)
The maximum base shear of infilled
frame=37931.4kN The maximum base shear of bare
frame=29860.7kN
INFILLED FRAME BARE FRAME

60
(c) Ground motion record: La11-005#3
(d) Ground motion record: La11-005#4
Figure 4.5 : Base Shear Time Histories for Non-isolated Infilled and Bare Structures under Four
Ground Motions Records
0 5 10 15 20 25 30 35 40-6
-4
-2
0
2
4
6x 10
4
BA
SE
SH
EA
R(k
N)
TIME(s)
The maximum base shear of infilled frame=50976.93kN
The maximum base shear of bare frame=40685.43kN
INFILLED FRAME
BARE FRAME
0 5 10 15 20 25 30 35 40 -3
-2
-1
0
1
2
3
4
5 x 10 4
BA
SE
SH
EA
R(k
N)
TIME(s)
The maximum base shear of infilled frame=40685.4kN
The maximum base shear of bare frame=30960.7kN
INFILLED FRAME BARE FRAME

61
increased in some columns. This raised concerns that the increase in column shear forces
might offset the beneficial effects of infill walls reducing inter-storey drifts. However, the
adverse effects of increase column shear forces was found to be negligible, considering
the significant improvement achieved on structural behaviour by reducing inter-storey
drifts. The comparison of post-yield behaviour of the first-storey columns between bare
frame and infilled frame structures showed that fewer columns were found to yield in the
infilled frame model than those in the bare frame model. This is shown in Table 4.5. In
conclusion, although the column shear forces were slightly increased, the use of the infill
walls indeed contributed to a better overall structural performance.
Table 4.5: Number of Columns Experienced Yielding at the First Floor Level
(Total number of columns at the first storey: 57)
Infilled Model Bare Model
PGA=0.5g 0 17
PGA=0.67g 33 80
PGA=0.9g 40 42
PGA=1.2g 51 56
4.4 Performance of Building with Rubber Bearings
4.4.1 Bearing Configuration I
In this section, the structure with infills was equipped with rubber bearing isolators for
seismic protection. The actual parameters of the rubber bearings used in the reference
buildings (Lushan City Hospital outpatient building), shown in Table 2.1, were assigned
to the isolators used for the building as “Bearing Configuration I.” The structural
performance of isolated infilled frame model under the selected earthquake records were
analysed and compared with the behaviour of non-isolated infilled model. The
comparison was made in terms of structural period, peak inter-storey drifts, residual drifts,
peak floor accelerations and base shear.
Fundamental Period:
The first six periods of vibration for the infilled frame models with and without the
rubber bearings are listed in Table 4.6. Because of the increased flexibility offered by the
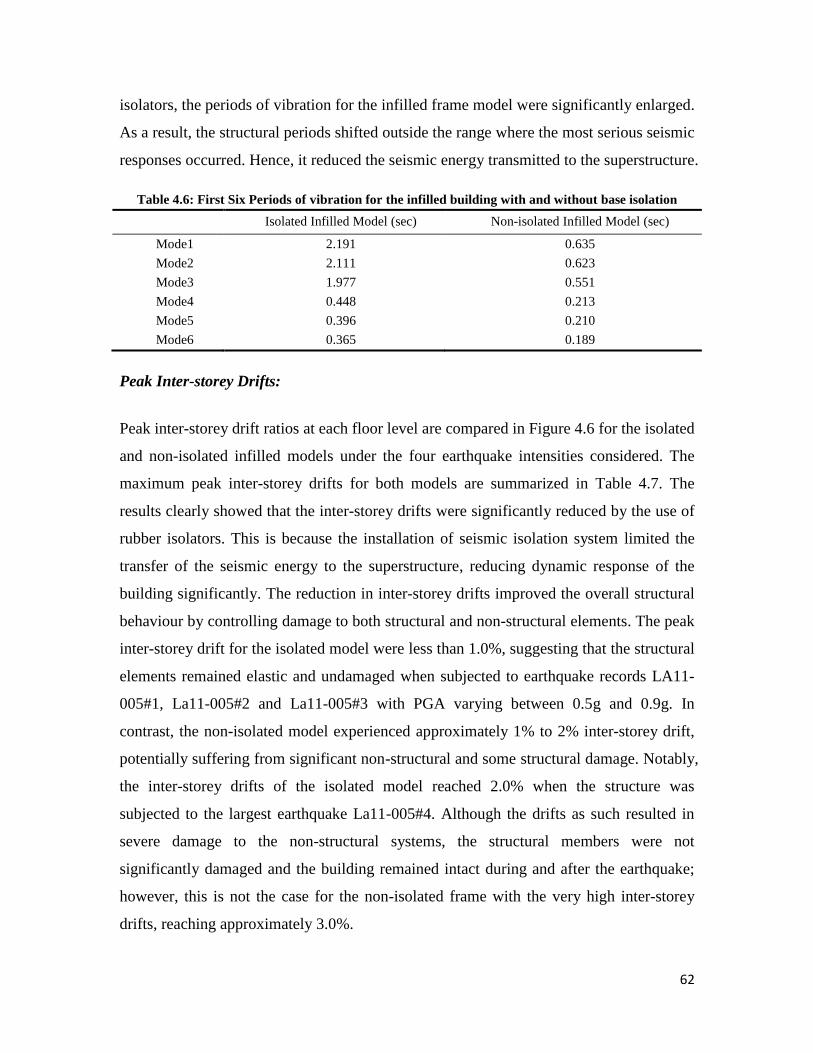
62
isolators, the periods of vibration for the infilled frame model were significantly enlarged.
As a result, the structural periods shifted outside the range where the most serious seismic
responses occurred. Hence, it reduced the seismic energy transmitted to the superstructure.
Table 4.6: First Six Periods of vibration for the infilled building with and without base isolation
Isolated Infilled Model (sec) Non-isolated Infilled Model (sec)
Mode1 2.191 0.635
Mode2 2.111 0.623
Mode3 1.977 0.551
Mode4 0.448 0.213
Mode5 0.396 0.210
Mode6 0.365 0.189
Peak Inter-storey Drifts:
Peak inter-storey drift ratios at each floor level are compared in Figure 4.6 for the isolated
and non-isolated infilled models under the four earthquake intensities considered. The
maximum peak inter-storey drifts for both models are summarized in Table 4.7. The
results clearly showed that the inter-storey drifts were significantly reduced by the use of
rubber isolators. This is because the installation of seismic isolation system limited the
transfer of the seismic energy to the superstructure, reducing dynamic response of the
building significantly. The reduction in inter-storey drifts improved the overall structural
behaviour by controlling damage to both structural and non-structural elements. The peak
inter-storey drift for the isolated model were less than 1.0%, suggesting that the structural
elements remained elastic and undamaged when subjected to earthquake records LA11-
005#1, La11-005#2 and La11-005#3 with PGA varying between 0.5g and 0.9g. In
contrast, the non-isolated model experienced approximately 1% to 2% inter-storey drift,
potentially suffering from significant non-structural and some structural damage. Notably,
the inter-storey drifts of the isolated model reached 2.0% when the structure was
subjected to the largest earthquake La11-005#4. Although the drifts as such resulted in
severe damage to the non-structural systems, the structural members were not
significantly damaged and the building remained intact during and after the earthquake;
however, this is not the case for the non-isolated frame with the very high inter-storey
drifts, reaching approximately 3.0%.

63
(a) Ground motion: La11-005#1
(b) Ground motion: La11-005#2
Figure 4.6: Inter-storey Drift Envelopes for Isolated and Non-isolated Infilled Structures under Four
Ground Motion Intensities
0.10% 0.20% 0.30% 0.40% 0.50% 0.60% 0.70% 0.80%1
2
3
4
5
6
7
INTERSTOREY DRIFT(%)
FLO
OR
0.362% 0.687%
0.337% 0.791%
0.291% 0.716%
0.274% 0.622%
0.216% 0.435%
0.142% 0.278%
0.128% 0.17%ISOLATED FRAME
NON-ISOLATED FRAME
0.00% 0.20% 0.40% 0.60% 0.80% 1.00% 1.20% 1.40%1
2
3
4
5
6
7
INTERSTOREY DRIFT(%)
FLO
OR
0.609% 1.187%
0.531% 1.233%
0.41% 0.997%
0.357% 0.761%
0.274% 0.457%
0.179% 0.266%
0.164% 0.157%ISOLATED FRAME
NON-ISOLATED FRAME

64
(c) Ground motion record: La11-005#3
(d) Ground motion record: La11-005#4
Figure 4.6: Inter-storey Drift Envelopes for Isolated and Non-isolated Infilled Structures under Four
Ground Motion Intensities
0.00% 0.50% 1.00% 1.50%1
2
3
4
5
6
7
INTERSTOREY DRIFT(%)
FLO
OR
0.764% 1.46%
0.655% 1.489%
0.485% 1.172%
0.398% 0.864%
0.298% 0.864%
0.194% 0.247%
0.179% 0.147%ISOLATED FRAME
NON-ISOLATED FRAME
0.00% 0.50% 1.00% 1.50% 2.00% 2.50% 3.00%1
2
3
4
5
6
7
INTERSTOREY DRIFT(%)
FLO
OR
1.973% 2.921%
1.628% 2.918%
1.097% 2.286%
0.701% 1.747%
0.395% 0.796%
0.243% 0.321%
0.225% 0.166%ISOLATED FRAME
NON-ISOLATED FRAME

65
Table 4.7: Maximum Inter-storey Drifts of Isolated and Non-isolated Infilled Models
Isolated Model Non-isolated Model
PGA=0.5g 0.362% 0.791%
PGA=0.67g 0.609% 1.187%
PGA=0.9g 0.764% 1.460%
PGA=1.2g 1.973% 2.921%
Table 4.8: Maximum Residual Drifts of Isolated and Non-isolated Infilled Models
Isolated Model Non-isolated Model
PGA=0.5g 0.019% 0.098%
PGA=0.67g 0033% 0.141%
PGA=0.9g 0.026% 0.161%
PGA=1.2g 0.033% 0.501%
Residual Drifts:
The residual drift ratios at each floor level of the isolated and non-isolated infilled models
are compared in Figure 4.7. The application of the rubber isolation system reduced the
seismic loading experienced by the structure, resulting residual inter-storey drifts that are
remarkably reduced. The residual inter-storey drift ratios for the superstructure remained
below 0.1% as shown in Table 4.8, indicating no expected damage in the building.
Peak Absolute Horizontal Accelerations:
The peak absolute horizontal accelerations at each floor of the isolated and non-isolated
structures with infills are presented in Figure 4.8 under different levels of earthquake
intensity. The incorporation of the rubber isolation system played an important role in
limiting the absolute horizontal accelerations. The flexible isolators shifted structural
period to a higher value, which reduced the magnitude of floor acceleration response
spectra. The reduction in structural accelerations controlled seismic damage to non-
structural elements and building contents. The maximum peak floor accelerations for
both isolated and non-isolated buildings are tabulated in Table 4.9. Base isolation resulted
in a reduction of about 0.2g to 0.4g in floor accelerations, with the difference in reduction
being higher under lower intensity earthquakes. Hence, it is expected that damage to
operational and functional components in buildings would be reduced significantly due to
base isolation.
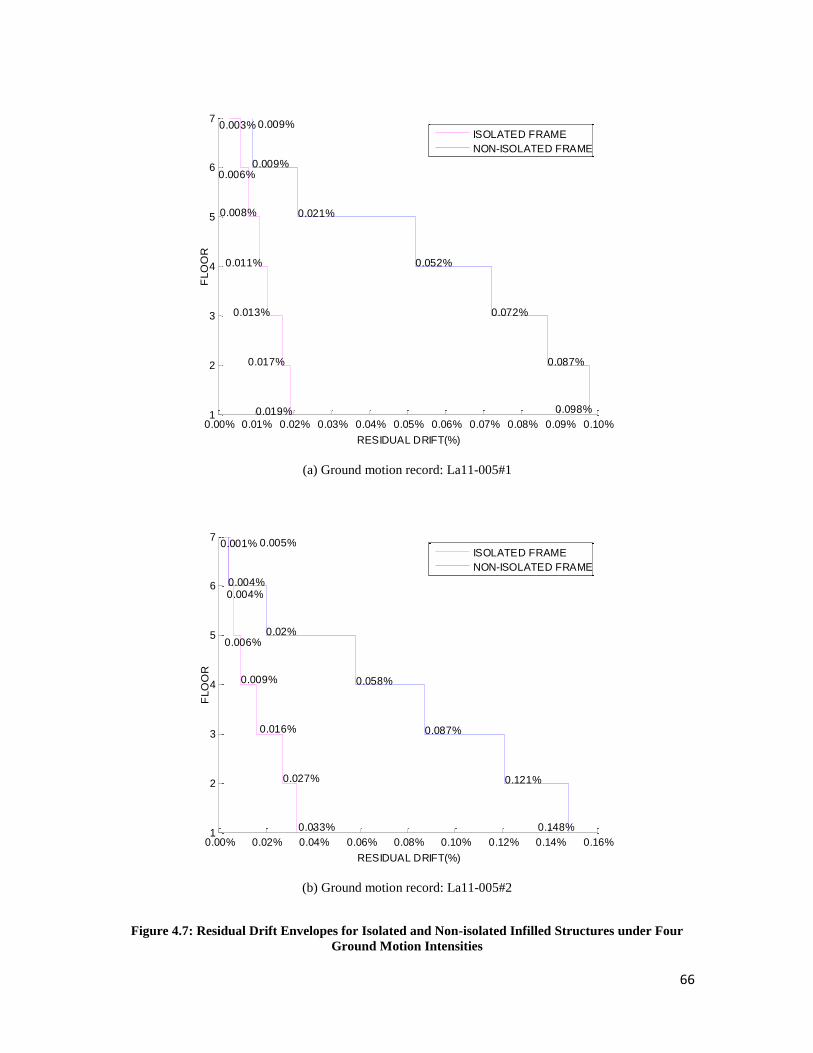
66
(a) Ground motion record: La11-005#1
(b) Ground motion record: La11-005#2
Figure 4.7: Residual Drift Envelopes for Isolated and Non-isolated Infilled Structures under Four
Ground Motion Intensities
0.00% 0.01% 0.02% 0.03% 0.04% 0.05% 0.06% 0.07% 0.08% 0.09% 0.10%1
2
3
4
5
6
7
RESIDUAL DRIFT(%)
FLO
OR
0.019% 0.098%
0.017% 0.087%
0.013% 0.072%
0.011% 0.052%
0.008% 0.021%
0.006%0.009%
0.003% 0.009%ISOLATED FRAME
NON-ISOLATED FRAME
0.00% 0.02% 0.04% 0.06% 0.08% 0.10% 0.12% 0.14% 0.16%1
2
3
4
5
6
7
RESIDUAL DRIFT(%)
FLO
OR
0.033% 0.148%
0.027% 0.121%
0.016% 0.087%
0.009% 0.058%
0.006%0.02%
0.004%0.004%
0.001% 0.005%ISOLATED FRAME
NON-ISOLATED FRAME

67
(c) Ground motion record: La11-005#3
(d) Ground motion record: La11-005#4
Figure 4.7: Residual Drift Envelopes for Isolated and Non-isolated Infilled Structures under Four
Ground Motion Intensities
0.00% 0.02% 0.04% 0.06% 0.08% 0.10% 0.12% 0.14% 0.16% 0.18%1
2
3
4
5
6
7
RESIDUAL DRIFT(%)
FLO
OR
0.026% 0.172%
0.019% 0.138%
0.015% 0.092%
0.01% 0.058%
0.005%0.019%
0.004%0%
0.001%0.003%
ISOLATED FRAME
NON-ISOLATED FRAME
0.00% 0.10% 0.20% 0.30% 0.40% 0.50% 0.60% 0.70%1
2
3
4
5
6
7
RESIDUAL DRIFT(%)
FLO
OR
0.089% 0.505%
0.075% 0.442%
0.051% 0.275%
0.039% 0.284%
0.021% 0.12%
0.015%
0.004%
0.006%0% ISOLATED FRAME
NON-ISOLATED FRAME

68
(a) Ground motion record: La11-005#1
(b) Ground motion record: La11-005#2
Figure 4.8: Floor Acceleration Envelopes for Isolated and Non-isolated Infilled Structures under
Four Ground Motion Intensities
0.25 0.3 0.35 0.4 0.45 0.5 0.55 0.6 0.65 0.70
1
2
3
4
5
6
7
ACCELERATION(g)
FLO
OR
0.259g 0.447g
0.258g 0.441g
0.255g 0.425g
0.256g 0.419g
0.275g 0.409g
0.293g 0.469g
0.304g 0.571g
0.316g 0.661g
ISOLATED FRAME
NON-ISOLATED FRAME
0.35 0.4 0.45 0.5 0.55 0.6 0.65 0.7 0.750
1
2
3
4
5
6
7
ACCELERATION(g)
FLO
OR
0.361g 0.596g
0.343g 0.551g
0.331g 0.505g
0.336g 0.498g
0.35g 0.483g
0.367g 0.527g
0.379g 0.625g
0.392g0.743gISOLATED FRAME
NON-ISOLATED FRAME

69
(c) Ground motion record: La11-005#3
(d) Ground motion record: La11-005#4
Figure 4.8: Floor Acceleration Envelopes for Isolated and Non-isolated Infilled Structures under the
Four Ground Motion Intensities
0.35 0.4 0.45 0.5 0.55 0.6 0.65 0.7 0.75 0.80
1
2
3
4
5
6
7
ACCELERATION(g)
FLO
OR
0.419g 0.671g
0.392g 0.616g
0.372g 0.555g
0.367g 0.541g
0.382g 0.519g
0.396g0.555g
0.406g0.648g
0.418g0.776gISOLATED FRAME
NON-ISOLATED FRAME
0.4 0.5 0.6 0.7 0.8 0.9 1 1.10
1
2
3
4
5
6
7
ACCELERATION(g)
FLO
OR
0.604g1.08g
0.567g 0.871g
0.54g 0.816g
0.513g 0.784g
0.48g 0.732g
0.498g 0.668g
0.511g0.769g
0.526g 0.949g
ISOLATED FRAME
NON-ISOLATED FRAME

70
Table 4.9: Maximum Peak Floor Accelerations of Isolated and Non-isolated Infilled Models
Isolated Model Non-isolated Model
PGA=0.5g 0.259g 0.661g
PGA=0.67g 0.361 0.743g
PGA=0.9g 0.419g 0.776g
PGA=1.2g 0.604g 0.800g
Base Shear:
Base shear time histories of isolated and non-isolated buildings are shown in Figure 4.9.
The building with infill walls, isolated by rubber bearings, experienced significant
reductions in base shear forces. The reductions in base shear was 54%, 41%, 37% and
26%, respectively under the earthquake records La11-005#1, La11-005#2, La11-005#3
and La11-005#4. The decrease in base shear was directly related to reduced floor
accelerations, which produced lower inertia forces at each floor level. A reduction in
column shear was also observed because the decrease in base shear would translate
directly to the reduction in column shears that make up the total base shear. This resulted
in the yielding of fewer columns in the isolated structure, as summarized in Table 4.10.
Assessment of Bearing Configuration I
It was previously indicated that the rubber isolation system applied in the new outpatient
building of the Lushan City Hospital (the prototype building) was very effective in
controlling structural vibrations and seismic shear forces during the 2013 Lushan City
Earthquake. Therefore, as the first bearing configuration the same type and size of
isolators were adopted first, as presented in the preceding sections, with properties listed
in Table 2.1. However, some bearings showed less than desirable performance during the
earthquake. The rubber bearings must have sufficient vertical load carrying capacity to
support the vertical loads transferred from the superstructure. The vertical load capacity
of the rubber isolators used in the outpatient building was calculated to be 2466kN and
was justified to be sufficient if the bearings solely supporting the structural weight.
However, when the structure was subjected to earthquake, the vertical forces acting on
the isolators became much larger than the structural weight due to the impact caused by
the ground excitation. Considering this, the designed vertical load capacity of the
isolation system was judged to be inadequate. The bearings might be damaged under

71
(a) Ground motion record: La11-005#1
(b) Ground motion record: La11-005#2
Figure 4.9: Base Shear Time Histories for Isolated and Non-isolated Infilled Structures under Four
Ground Motion Intensities
0 5 10 15 20 25 30 35 40-3
-2
-1
0
1
2
3
4x 10
4
BA
SE
SH
EA
R(k
N)
TIME(s)
The maximum base shear of non-isolated frame=31558.56kN
The maximum base shear of isolated frame=20456.71kN
ISOLATED FRAME
NON-ISOLATED FRAME
0 5 10 15 20 25 30 35 40-3
-2
-1
0
1
2
3
4x 10
4
BA
SE
SH
EA
R(k
N)
TIME(s)
The maximum base shear of the non-isolated frame=37931.36kN
The maximum base shear of the isolated frame=26951.36kN
ISOLATED FRAME
NON-ISOLATED FRAME

72
(c) Ground motion record: La11-005#3
(d) Ground motion record: La11-005#4
Figure 4.9: Base Shear Time History for Isolated and Non-isolated Infilled Structures under Four
Ground Motion Intensities
0 5 10 15 20 25 30 35 40-3
-2
-1
0
1
2
3
4
5x 10
4
BA
SE
SH
EA
R(k
N)
TIME(s)
The maximum base shear of the non-isolated frame=40685.43kN
The maximum base shear of the isolated frame=29751.3kN
ISOLATED FRAME
NON-ISOLATED FRAME
0 5 10 15 20 25 30 35 40-6
-4
-2
0
2
4
6x 10
4
BA
SE
SH
EA
R(k
N)
TIME(s)
The maximum base shear of the non-isolated frame=50976.93kN
The maximum base shear of the isolated frame=40272.9kN
ISOLATED FRAME
NON-ISOLATED FRAME

73
Table 4.10: Number of Columns Experienced Yielding at the First Storey Level
(Total number of columns at the first storey: 57)
Isolated Model Non-isolated Model
PGA=0.5g 0 0
PGA=0.67g 14 33
PGA=0.9g 20 40
PGA=1.2g 50 51
Table 4.11: Maximum Isolator Displacements under Four Different Intensities of Earthquakes (mm)
PGA=0.5g PGA=0.67g PGA=0.9g PGA=1.2g
Maximum Displacemnt (mm) 308 402 442 597
heavy axial forces and may not be able to support the superstructure in a stable manner.
Another limitation for this rubber isolation system is the relatively large lateral
displacements that they may experience. Table 4.11 indicates that lateral displacements at
the isolator level reached 308mm under the smallest intensity earthquake, and increased
to 597mm under the largest intensity earthquake. These isolator displacements greatly
exceed the allowable displacement threshold (167mm), indicating severe damage in the
rubber isolators. Hence, Bearing Configuration I was deemed to be unsatisfactory, likely
leading to failures of the isolation system, even if the superstructure remains intact.
4.4.2 Bearing Configuration II
Bearing Configuration II consists of larger diameter isolators to overcome some of the
shortcomings of Bearing Configuration I. In this configuration the diameter of isolator
LLRB and LRB#1was enlarged from 500mm to 600mm to obtain the required vertical
load capacity as the load carrying capacity is directly proportional to the isolator cross-
section area. The modified isolator parameters were computed based on the formulas
from Table 3.6. They are listed in Table 4.12 and represent enhancements relative to
those listed in Table 2.1. With the new diameter the vertical load carrying capacity of
isolators LLRB and LRB#1 were increased from 2367kN to 3927kN. The increased load
capacity was verified to be adequate for the vertical loads experienced by bearings under
the selected intensities of earthquake record. However, the increase in the isolator
diameter in turn increased the elastic stiffness and post-yield stiffness of the isolation
system. The increase in post-yield stiffness of isolators could intensify dynamic response

74
by attracting higher seismic forces to the structure. This might create an undesirable
response in the modified isolated structure with Bearing Configuration II.
Table 4.12: Parameters of the Modified Isolation System for Bearing Configuration II
Design Properties LLRB LRB#1 LRB#2
Thickness of the Rubber Layer (mm) 86.4 86.4 100
Diameter of the Isolator (mm) 600 600 600
Area (cm2) 2827 2827 2827
Vertical Load Capacity (kN) 3927 3927 3393
Vertical Stiffness (kN/mm) 2761 2761 2517
Elastic Stiffness (kN/mm) 7.430 1.309 1.131
Post-yield Stiffness (kN/mm) 1.309 Non Non
Yield Strength (kN) 42.8 Non Non
Allowable Lateral Deformation (mm) 200 200 200
Figures 4.10 to 4.13 compare inter-storey drifts, residual drifts, floor accelerations and
base shear for the two isolated structural models having Bearing Configurations I and II
with two different isolator diameters. As expected, the increase in isolator dimension
resulted in larger deformations of the superstructure. The inter-storey drifts and residual
drifts for the structure with Bearing Configuration II increased by approximately 25%,
yet remained sufficiently low to ensure that the structure remained intact. Similarly,
structural floor accelerations of the modified model increased by 9.4%, 8.9%, 16.7% and
14.1% respectively under the four intensities of ground excitations considered. The
increased floor accelerations, although in the allowable range, could cause more damage
in the non-structural elements attached to the main structure. As for the base shear, the
modified structure experienced larger shear forces at the base due to increased inertia
forces. This could potentially lead to shear damage in critical columns. The lateral
displacements in isolators were slightly reduced due to the increased elastic stiffness of
the isolation system. Despite this reduction they remained out of the acceptable range.
The maximum isolator displacements of the two isolated structural models with Bearing
Configurations I and II having 500 mm and 600 mm isolators, respectively are compared
in Table 4.13.
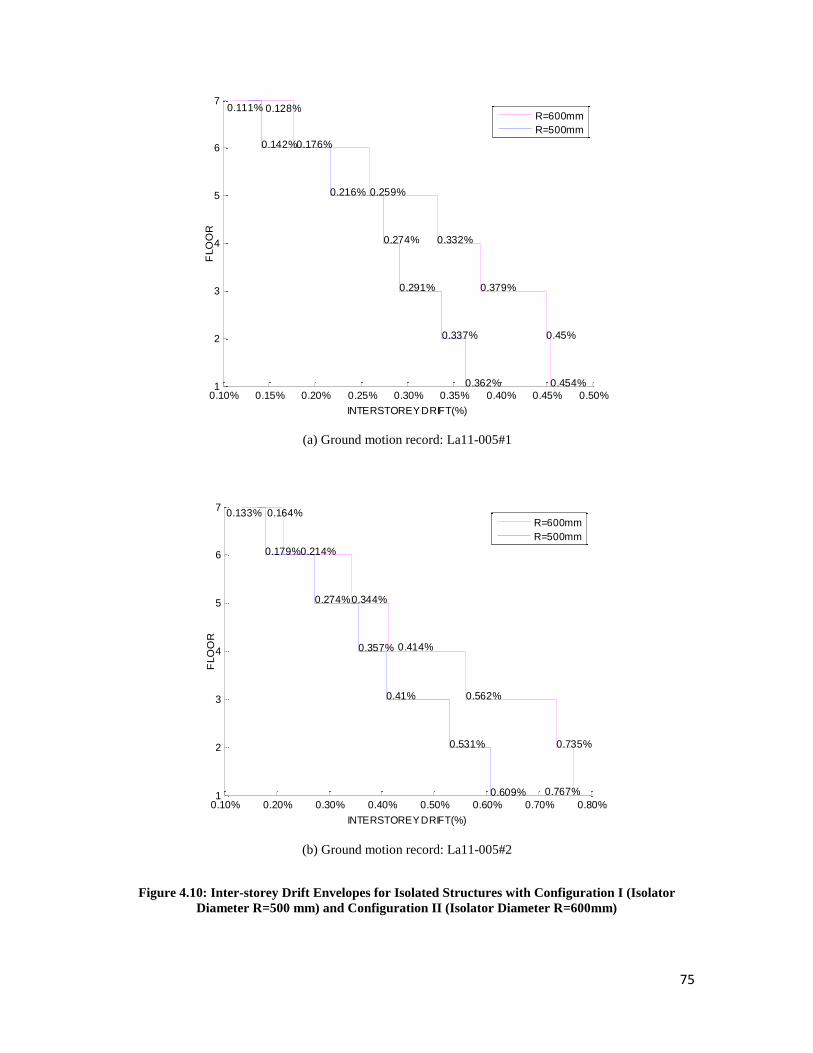
75
(a) Ground motion record: La11-005#1
(b) Ground motion record: La11-005#2
Figure 4.10: Inter-storey Drift Envelopes for Isolated Structures with Configuration I (Isolator
Diameter R=500 mm) and Configuration II (Isolator Diameter R=600mm)
0.10% 0.15% 0.20% 0.25% 0.30% 0.35% 0.40% 0.45% 0.50%1
2
3
4
5
6
7
INTERSTOREY DRIFT(%)
FLO
OR
0.454%0.362%
0.45%0.337%
0.379%0.291%
0.332%0.274%
0.259%0.216%
0.176%0.142%
0.111% 0.128%R=600mm
R=500mm
0.10% 0.20% 0.30% 0.40% 0.50% 0.60% 0.70% 0.80%1
2
3
4
5
6
7
INTERSTOREY DRIFT(%)
FLO
OR
0.767%0.609%
0.735%0.531%
0.562%0.41%
0.414%0.357%
0.344%0.274%
0.214%0.179%
0.133% 0.164%R=600mm
R=500mm

76
(c) Ground motion record: La11-005#3
(d) Ground motion record: La11-005#4
Figure 4.10 : Inter-storey Drift Envelopes for Isolated Structures with Configuration I (Isolator
Diameter R=500 mm) and Configuration II (Isolator Diameter R=600mm)
0.10% 0.20% 0.30% 0.40% 0.50% 0.60% 0.70% 0.80% 0.90% 1.00%1
2
3
4
5
6
7
INTERSTOREY DRIFT(%)
FLO
OR
0.975%0.764%
0.93%0.655%
0.687%0.485%
0.5%0.398%
0.348%0.298%
0.229%0.194%
0.142% 0.179%R=600mm
R=500mm
0.00% 0.50% 1.00% 1.50% 2.00% 2.50% 3.00%1
2
3
4
5
6
7
INTERSTOREY DRIFT(%)
FLO
OR
2.687%1.973%
2.481%1.628%
1.541%1.097%
0.983%0.701%
0.513%0.395%
0.301%0.243%
0.181%0.225%R=600mm
R=500mm

77
(a) Ground motion record: La11-005#1
(b) Ground motion record: La11-005#2
Figure 4.11: Residual Drift Envelopes for Isolated Structures with Configuration I (Isolator
Diameter R=500 mm) and Configuration II (Isolator Diameter R=600mm)
0.00% 0.01% 0.01% 0.01% 0.02% % 0.00% 0.01% 0.01% 0.01% 0.02%1
2
3
4
5
6
7
RESIDUAL DRIFT(%)
FLO
OR
0.016% 0.019%
0.015% 0.017%
0.014%0.013%
0.013%0.011%
0.01%0.008%
0.006%0.006%
0.001% 0.003%R=600mm
R=500mm
0.00% 0.01% 0.01% 0.01% 0.02% 0.03% 0.03% 0.04% 0.04% 0.04%1
2
3
4
5
6
7
RESIDUAL DRIFT(%)
FLO
OR
0.041%0.033%
0.031%0.027%
0.021%0.016%
0.015%0.009%
0.012%0.006%
0.007%0.004%
0.002%0.001%R=600mm
R=500mm

78
(c) Ground motion record: La11-005#3
(d) Ground motion record: La11-005#4
Figure 4.11 : Residual Drift Envelopes for Isolated Structures with Configuration I (Isolator
Diameter R=500 mm) and Configuration II (Isolator Diameter R=600mm)
0.00% 0.01% 0.02% 0.03% 0.04% 0.05% 0.06%1
2
3
4
5
6
7
RESIDUAL DRIFT(%)
FLO
OR
0.054%0.026%
0.046%0.019%
0.032%0.015%
0.021%0.01%
0.015%0.005%
0.008%0.004%
0.003%0.001%R=600mm
R=500mm
0.00% 0.02% 0.04% 0.06% 0.08% 0.10% 0.12%1
2
3
4
5
6
7
RESIDUAL DRIFT(%)
FLO
OR
0.102%0.089%
0.095%0.075%
0.061%0.051%
0.042%0.039%
0.025%0.021%
0.018%0.015%
0.009%0.006%R=600mm
R=500mm

79
(a) Ground motion record: La11-005#1
(b) Ground motion record: La11-005#2
Figure 4.12: Acceleration Envelopes for Isolated Structures with Configuration I (Isolator Diameter
R=500 mm) and Configuration II (Isolator Diameter R=600mm)
0.25 0.26 0.27 0.28 0.29 0.3 0.31 0.32 0.33 0.34 0.350
1
2
3
4
5
6
7
ACCELERATION(g)
FLO
OR
0.303g0.259g
0.304g0.258g
0.303g0.255g
0.298g0.256g
0.3g0.275g
0.317g0.293g
0.329g0.304g
0.346g0.316g
R=600mm
R=500mm
0.32 0.34 0.36 0.38 0.4 0.42 0.440
1
2
3
4
5
6
7
ACCELERATION(g)
FLO
OR
0.423g0.361g
0.41g0.343g
0.389g0.331g
0.368g0.336g
0.374g0.35g
0.394g0.367g
0.408g0.379g
0.427g0.392g
R=600mm
R=500mm

80
(c) Ground motion record: La11-005#3
(d) Ground motion record: La11-005#4
Figure 4.12: Acceleration Envelopes for Isolated Structures with Configuration I (Isolator Diameter
R=500 mm) and Configuration II (Isolator Diameter R=600mm)
0.36 0.38 0.4 0.42 0.44 0.46 0.48 0.50
1
2
3
4
5
6
7
ACCELERATION(g)
FLO
OR
0.473g0.419g
0.45g0.392g
0.422g0.372g
0.395g0.367g
0.394g0.382g
0.413g0.396g
0.441g0.406g
0.488g0.418g
R=600mm
R=500mm
0.48 0.5 0.52 0.54 0.56 0.58 0.6 0.62 0.64 0.66 0.680
1
2
3
4
5
6
7
ACCELERATION(g)
FLO
OR
0.674g0.604g
0.62g0.567g
0.592g0.54g
0.579g0.513g
0.538g0.48g
0.556g0.498g
0.574g0.511g
0.6g0.526gR=600mm
R=500mm

81
(a) Ground motion record: La11-005#1
(b) Ground motion record: La11-005#2
Figure 4.13: Base Shear Time Histories for Isolated Infilled Structures with Configuration I (Isolator
Diameter R=500 mm) and Configuration II (Isolator Diameter R=600mm)
0 5 10 15 20 25 30 35 40-2.5
-2
-1.5
-1
-0.5
0
0.5
1
1.5
2
2.5x 10
4
BA
SE
SH
EA
R(k
N)
TIME(s)
The maximum base shear=24013.2kN (R=600mm)
The maximum base shear=20457.7kN (R=500mm)
R=500mm
R=600mm
0 5 10 15 20 25 30 35 40-3
-2
-1
0
1
2
3
4x 10
4
BA
SE
SH
EA
R(k
N)
TIME(s)
The maximum base shear=30899.1kN (R=600mm)
The maximum base shear=26951.3kN (R=500mm)
R=500mm
R=600mm

82
(c) Ground motion record: La11-005#3
(d) Ground motion record: La11-005#4
Figure 4.13: Base Shear Time Histories for Isolated Infilled Structures with Configuration I
(Isolator Diameter R=500 mm) and Configuration II (Isolator Diameter R=600mm)
0 5 10 15 20 25 30 35 40-4
-3
-2
-1
0
1
2
3
4x 10
4
BA
SE
SH
EA
R(k
N)
TIME(s)
The maximum base shear=34013.8kN (R=600mm)
The maximum base shear=29751.3kN (R=500mm)
R=500mm
R=600mm
0 5 10 15 20 25 30 35 40-5
-4
-3
-2
-1
0
1
2
3
4
5x 10
4
BA
SE
SH
EA
R(k
N)
TIME(s)
The maximum base shear=46149.3kN (R=600mm)
The maximum base shear=40272.9kN (R=500mm)
R=500mm
R=600mm

83
Table 4.13: Maximum Isolator Displacements under Four Different Intensities of Earthquakes (mm)
PGA=0.5g PGA=0.67g PGA=0.9g PGA=1.2g
Configuration I (R=500mm) 308 402 442 597
Configuration II (R=600mm) 281 357 386 534
In conclusion, increasing the isolator diameter, as was done in Bearing Configuration II,
could provide larger vertical load capacity for the isolation system, but it also amplifies
the dynamic response of the superstructure. To obtain an optimum base isolation system
further refinements have to be made on the isolation system for controlling structural
response and isolator lateral displacements. This is done below as Bearing Configuration
III.
4.4.3 Bearing Configuration III
Bearing Configuration III is intended to restrict the isolator displacement by either
increasing the diameter of rubber layers and/or increasing the diameter of the lead plug in
LLRBs. Increasing the isolator diameter would also enhance the post yield stiffness of
isolators, which might increase the seismic responses. Therefore, it was deemed to be a
superior approach to increase the diameter of the lead plug. This could increase the initial
stiffness of the LLRBs for lateral displacement control, but more importantly, this would
not affect the isolation efficiency as the lead plug would have already yielded and would
provide no lateral resistance during response to ground excitations. Furthermore, previous
studies showed that if the lead plug diameter was enlarged in a proper way, it could help
restrict structural vibrations during response, although it might affect structural
acceleration response to certain extent. It can be concluded that increasing the size of the
lead plug is an optimum approach to simultaneously control both structural deformations
and isolator displacements. Accordingly, in Configuration III, the diameter of the lead
plug was enlarged from 67mm to 100mm first, and then to 170mm in increments of
100mm to establish the relationship between the lead plugs size and the isolator
performance.
Figure 4.14 illustrates that lateral isolator displacements reduce significantly with
increasing initial stiffness and damping of the isolators by increasing lead plug diameter.
The results show that the maximum isolator displacement decreased by approximately 16%

84
to 19% under increasing earthquake intensities when the lead plug diameter increased
from 67mm to 170mm. Despite the great reduction in the isolator displacement, the
displacement under the ground motion La11-005#4 with PGA=1.2g exceeded the
allowable displacement even with the highest diameter (170 mm) lead plug considered.
This implies that changing only the size of the lead plug in LLRBs is impractical to
control base displacement. Thus additional damping devices may be needed to reduce
displacement demands for isolators.
Figure 4.14: Variation of Maximum Base Displacement of Isolated Structure with Increasing Lead
Plug Diameter
Table 4.14 and Figure 4.15 compare the inter-storey drifts of the isolated structure
obtained from different analyses with different lead plug diameters. As expected, the
superstructure drifts were significantly reduced due to the increase in lead plug diameter,
which resulted in greater hysteretic damping, providing a higher energy dissipation
capacity. By enlarging the diameter of the lead plug, a significant amount of seismic
energy was dissipated in the isolation system rather than being transmitted to the
superstructure. However, the effectiveness of lead plug diameter increase was lost after a
certain diameter size. Beyond the lead plug diameter of 150 mm the inter-storey drift
remained essentially unchanged and even slightly increased (cells with blue background
67 100 110 120 130 140 150 160 170200
250
300
350
400
450
500
550
LEAD PLUG DIAMETER(mm)
MA
XIM
UM
IS
OL
AT
OR
�D
ISP
LA
CE
ME
NT
(mm
)
281
357
386
534
260
337
372
517
256
330
366
510
251
323
356
503
245
317
351
495
241
309
341
487
238
299
331
476
235
295
320
463
229
292
313
450
PGA=0.5g
PGA=0.67g
PGA=0.9g
PGA=1.2g

85
in Table 4.14). This can be attributed to two reasons. First, a sizable lead plug in the
LLRBs could generate an unnecessary high level of hysteretic damping that would
inappropriately restrain the isolator movement during earthquakes. This might stiffen the
isolated structure, increasing inter-storey drifts for the superstructure. Second, the LLRBs
with a large size lead plug would have high yield strength which could be hardly attained
during response especially under low intensity ground motions. In this case, the LLRBs
would act elastically most of the time, making the structure more rigid. This would
reduce the effectiveness of the isolation system. In the current research, it was observed
that the first reason dominated the behaviour.
Figure 4.15: Vibration of Maximum Inter-storey Drift of Isolated Structure with Increasing Lead
Plug Diameter
67 100 110 120 130 140 150 160 1700.00%
0.50%
1.00%
1.50%
2.00%
2.50%
3.00%
LEAD PLUG DIAMETER(mm)
INT
ER
ST
OR
EY
DR
IFT
(%)
0.445%
0.77%
0.975%
2.68%
0.391%
0.64%
0.835%
2.45%
0.369%
0.597%
0.786%
2.4%
0.346%
0.533%
0.735%
2.3%
0.323%
0.508%
0.684%
1.89%
0.324%
0.469%
0.638%
1.86%
0.331%
0.445%
0.59%
1.84%
0.338%
0.466%
0.568%
1.82%
0.391%
0.478%
0.617%
1.83%
PGA=0.5g
PGA=0.67g
PGA=0.9g
PGA=1.2g

86
Table 4.14: Inter-storey Drifts of Isolated Structure with Different Lead Plug Diameters
(a) Ground motion record: La11-005#1(PGA=0.5g)
Lead plug
diameter
Structure Floor 67mm 100mm 110mm 120mm 130mm 140mm 150mm 160mm 170mm
7th
floor 0.111% 0.092% 0.097% 0.093% 0.088% 0.078% 0.070% 0.071% 0.102%
6th
floor 0.176% 0.160% 0.154% 0.147% 0.140% 0.121% 0.109% 0.110% 0.142%
5th
floor 0.259% 0.234% 0.225% 0.215% 0.204% 0.177% 0.164% 0.161% 0.210%
4th
floor 0.332% 0.297% 0.284% 0.270% 0.255% 0.229% 0.220% 0.220% 0.257%
3rd
floor 0.379% 0.332% 0.315% 0.297% 0.279% 0.263% 0.261% 0.264% 0.312%
2nd
floor 0.450% 0.388% 0.366% 0.342% 0.319% 0.315% 0.319% 0.326% 0.345%
1st floor 0.454% 0.391% 0.369% 0.346% 0.323% 0.324% 0.331% 0.338% 0.390%
(b) Ground motion record: La11-005#2(PGA=0.67g)
Lead plug
diameter
Structure Floor 67mm 100mm 110mm 120mm 130mm 140mm 150mm 160mm 170mm
7th
floor 0.133% 0.125% 0.123% 0.119% 0.115% 0.111% 0.107% 0.094% 0.101%
6th
floor 0.214% 0.201% 0.196% 0.191% 0.185% 0.178% 0.169% 0.149% 0.152%
5th
floor 0.344% 0.297% 0.290% 0.281% 0.271% 0261% 0.245% 0.223% 0.229%
4th
floor 0.414% 0.392% 0.379% 0.365% 0.349% 0.332% 0.312% 0.299% 0.311%
3rd
floor 0.562% 0.476% 0.455% 0.432% 0.407% 0.383% 0.363% 0.362% 0.370%
2nd
floor 0.735% 0.602% 0.566% 0.531% 0.497% 0.463% 0.444% 0.455% 0.461%
1st floor 0.767% 0.641% 0.597% 0.553% 0.508% 0.469% 0.445% 0.466% 0.482%
(c) Ground motion record: La11-005#3(PGA=0.9g)
Lead plug
diameter
Structure Floor 67mm 100mm 110mm 120mm 130mm 140mm 150mm 160mm 170mm
7th
floor 0.142% 0.134% 0.131% 0.128% 0.125% 0.122% 0.119% 0.113% 0.101%
6th
floor 0.229% 0.215% 0.211% 0.206% 0.200% 0.195% 0.190% 0.180% 0.162%
5th
floor 0.348% 0.322% 0.314% 0.306% 0.297% 0.288% 0.280% 0.264% 0.246%
4th
floor 0.500% 0.442% 0.426% 0.410% 0.394% 0.378% 0.363% 0.347% 0.342%
3rd
floor 0.687% 0.571% 0.543% 0.516% 0.487% 0.459% 0.433% 0.422% 0.432%
2nd
floor 0.930% 0.761% 0.720% 0.675% 0.631% 0.587% 0.547% 0.541% 0.568%
1st floor 0.975% 0.835% 0.786% 0.735% 0.684% 0.635% 0.590% 0.568% 0.617%
(d) Ground motion record: La11-005#4(PGA=1.2g)
Lead plug
diameter
Structure Floor 67mm 100mm 110mm 120mm 130mm 140mm 150mm 160mm 170mm
7th
floor 0.181% 0.171% 0.168% 0.180% 0.161% 0.158% 0.155% 0.153% 0.151%
6th
floor 0.301% 0.284% 0.278% 0.226% 0.266% 0.260% 0.255% 0.251% 0.248%
5th
floor 0.513% 0.476% 0.464% 0.473% 0.439% 0.423% 0.411% 0.402% 0.399%
4th
floor 0.983% 0.884% 0.850% 0.818% 0.783% 0.736% 0.706% 0.689% 0.682%
3rd
floor 1.541% 1.349% 1.301% 1.252% 1.167% 1.112% 1.093% 1.076% 1.070%
2nd
floor 2.481% 2.076% 2.007% 1.887% 1.652% 1.629% 1.598% 1.580% 1.578%
1st floor 2.687% 2.456% 2.402% 2.303% 1.894% 1.864% 1.839% 1.826% 1.829%

87
Tests showed that increasing the diameter of the lead plug in LLRBs would control the
base displacement, but inevitably amplify the floor accelerations of the isolated structure.
The same observation was made in the analyses conducted in the current investigation.
Figure 4.16 shows the variation of maximum floor accelerations of modeled structures
with lead plug diameter. The floor accelerations were first reduced as the lead plug
diameter went from 67mm to 100mm, but started increasing thereafter. It should be
pointed out that the magnitude of accelerations in the structure was affected by damping
in the isolators, which depended on the diameter of the lead pug. At a low level of
isolation damping, the slight increase in damping created by the enlarged lead plug
diameter could dissipate more seismic energy, thereby reducing floor accelerations.
However, as the lead plug diameter went up, the isolation damping became too much for
the earthquakes considered and the high damping generated stiffened the isolation system
at a certain degree, which could amplify the acceleration response of the isolated
structure. The intensified structural acceleration would cause adverse effects on internal
components and the equipment attached to the primary structure. This could have
contradictory effects on base isolation because the main purpose of applying the isolation
system is to protect the building and its contents.
Figure 4.16: Variation of Maximum Floor Acceleration of Isolated Structure with Increasing Lead
Plug Diameter
67 100 110 120 130 140 150 160 1700.25
0.3
0.35
0.4
0.45
0.5
0.55
0.6
0.65
0.7
LEAD PLUG DIAMETER(mm)
FLO
OR
AC
CE
LE
RA
TIO
N(g
)
0.346g
0.427g
0.488g
0.674g
0.286g
0.344g
0.386g
0.542g
0.306g
0.349g
0.391g
0.554g
0.331g
0.397g
0.423g
0.568g
0.36g
0.445g
0.465g
0.579g
0.391g
0.473g
0.508g
0.591g
0.425g
0.508g
0.557g
0.611g
0.457g
0.547g
0.602g
0.634g
0.487g
0.598g
0.644g
0.679g
PGA=0.5g
PGA=0.67g
PGA=0.9g
PGA=1.2g

88
Table 4.15: Floor Accelerations of Isolated Structure with Different Lead Plug Diameters
(a) Ground motion record: La11-005#1(PGA=0.5g)
Diameter
Structure Floor 67mm 100mm 110mm 120mm 130mm 140mm 150mm 160mm 170mm
7th
floor 0.346g 0.273g 0.260g 0.327g 0.360g 0.391g 0.425g 0.457g 0.487g
6th
floor 0.329g 0.249g 0.235g 0.289g 0.318g 0.346g 0.375g 0.403g 0.428g
5th
floor 0.316g 0.219g 0.204g 0.247g 0.268g 0.291g 0.315g 0.337g 0.357g
4th
floor 0.300g 0.186g 0.176g 0.235g 0.236g 0.240g 0.251g 0.265g 0.292g
3rd
floor 0.297g 0.191g 0.186g 0.258g 0.263g 0.268g 0.275g 0.280g 0.286g
2nd
floor 0.302g 0.216g 0.215g 0.269g 0.275g 0.282g 0.288g 0.294g 0.299g
1st floor 0.304g 0.242g 0.248g 0.273g 0.276g 0.289g 0.300g 0.313g 0.330g
Base 0.303g 0.286g 0.306g 0.331g 0.359g 0.389g 0.414g 0.430g 0.452g
(b) Ground motion record: La11-005#2(PGA=0.67g)
Diameter
Structure Floor 67mm 100mm 110mm 120mm 130mm 140mm 150mm 160mm 170mm
7th
floor 0.427g 0.342g 0.349g 0.376g 0.417g 0.461g 0.505g 0.547g 0.591g
6th
floor 0.408g 0.315g 0.334g 0.336g 0.370g 0.405g 0.460g 0.515g 0.572g
5th
floor 0.393g 0.282g 0.320g 0.325g 0.334g 0.341g 0.363g 0.384g 0.410g
4th
floor 0.373g 0.246g 0.308g 0.317g 0.321g 0.324g 0.331g 0.343g 0.364g
3rd
floor 0.368g 0.262g 0.327g 0.331g 0.336g 0.342g 0.348g 0.358g 0.395g
2nd
floor 0.389g 0.283g 0.338g 0.343g 0.349g 0.354g 0.357g 0.362g 0.409g
1st floor 0.410g 0.307g 0.342g 0.346g 0.351g 0.361g 0.417g 0.453g 0.486g
Base 0.423g 0.344g 0.341g 0.397g 0.445g 0.473g 0.508g 0.543g 0.598g
(c) Ground motion record: La11-005#3(PGA=0.9g)
Diameter
Structure Floor 67mm 100mm 110mm 120mm 130mm 140mm 150mm 160mm 170mm
7th
floor 0.488g 0.386g 0.375g 0.398g 0.442g 0.485g 0.530g 0.571g 0.609g
6th
floor 0.441g 0.374g 0.363g 0.358g 0.395g 0.432g 0.470g 0.503g 0.534g
5th
floor 0.413g 0.362g 0.350g 0.337g 0.344g 0.368g 0.395g 0.420g 0.444g
4th
floor 0.393g 0.350g 0.339g 0.339g 0.340g 0.341g 0.344g 0.351g 0.365g
3rd
floor 0.395g 0.354g 0.358g 0.363g 0.369g 0.374g 0.378g 0.384g 0.391g
2nd
floor 0.421g 0.365g 0.371g 0.377g 0.383g 0.387g 0.393g 0.401g 0.410g
1st floor 0.450g 0.370g 0.377g 0.383g 0.385g 0.399g 0.426g 0.452g 0.478g
Base 0.473g 0.377g 0.391g 0.423g 0.465g 0.508g 0.557g 0.602g 0.644g
(d) Ground motion record: La11-005#4(PGA=1.2g)
Diameter
Structure Floor 67mm 100mm 110mm 120mm 130mm 140mm 150mm 160mm 170mm
7th
floor 0.599g 0.482g 0.485g 0.489g 0.487g 0.532g 0.588g 0.649g 0.713g
6th
floor 0.574g 0.465g 0.470g 0.473g 0.477g 0.514g 0.555g 0.601g 0.647g
5th
floor 0.556g 0.448g 0.469g 0.460g 0.463g 0.486g 0.513g 0.542g 0.569g
4th
floor 0.535g 0.452g 0.474g 0.459g 0.463g 0.470g 0.479g 0.486g 0.492g
3rd
floor 0.578g 0.473g 0.491g 0.477g 0.485g 0.503g 0.515g 0.526g 0.531g
2nd
floor 0.591g 0.476g 0.492g 0.501g 0.511g 0.526g 0.536g 0.544g 0.555g
1st floor 0.619g 0.497g 0.516g 0.531g 0.540g 0.547g 0.544g 0.587g 0.610g
Base 0.674g 0.542g 0.554g 0.568g 0.579g 0.591g 0.611g 0.634g 0.679g

89
The variation of maximum base shear force in isolated structure with lead plug diameter
is shown in Figure 4.17. In contract to the amplification of floor accelerations, shear
forces at the structure base slowly but steadily reduced as the diameter of the lead plug
increased. This can be explained by the contributions of different modes of response,
which result in a descending trend in base shear while maximum floor accelerations may
increase after the optimum lead plug diameter shown in Fig. 4.16.
Figure 4.17: Variation of Maximum Base Shear of Isolated Structure with Increasing Lead Plug
Diameter
In summary, increasing the diameter of the lead plug could effectively control
displacements in isolators. If the choice of the lead plug diameter is properly made,
sufficient reductions in structural drifts can be attained in the superstructure. Nonetheless,
there is a trade-off between reducing structural response while controlling base
displacements and an increase in floor accelerations, which would intensify seismic
damage to non-structural elements and building contents. As a result, it is important to
balance out the reduction of isolator displacements and the reduction of floor
accelerations when deciding on the optimal size for isolators.
67 100 110 120 130 140 150 160 1701.5
2
2.5
3
3.5
4
4.5
5x 10
4
LEAD PLUG DIAMETER(mm)
MA
XIM
UM
BA
SE
SH
EA
R(m
m)
24013
30899
34014
46149
22147
28881
31898
45012
21535
28206
31175
43062
20881
27512
30439
42261
20188
26985
29707
41710
19410
25404
28967
40848
18569
24987
28236
39961
18368
24467
27421
39118
18382
23984
26539
38324
PGA=0.5g
PGA=0.67g
PGA=0.9g
PGA=1.2g

90
4.5 Performance of Buildings with Rubber Bearings and Viscous Dampers
The application of supplemental damping devices was investigated as a means of
controlling excessive horizontal displacements at the base isolation level, under high
intensity earthquakes. This mitigation technique was considered in place of enlarging the
isolator dimension. Supplemental viscous dampers were implemented for additional
damping, over and above those provided by rubber isolators. Five different designs of
viscous damper were implemented in addition to the use of 600 mm diameter isolators
and 100 mm diameter lead plugs. The designs varied in damping values, which varied
from 10% to 50% of critical damping, as shown in Table 4.16.
Table 4.16: Viscous Damping Coefficients for Five Designs of Viscous Dampers
10% Critical 20% Critical 30% Critical 40% Critical 50% Critical
Viscous Damping
Coefficient (kN.s/m) 5494 10988 16482 21976 27470
Figure 4.18: Variation of Maximum Base Displacement of Isolated Structure with Increasing
Supplemental Viscous Damping
The results of dynamic analyses of isolated buildings with different viscous dampers are
shown in Figure 4.18. The figure compares base displacements of buildings with different
0 % 10% 20% 30% 40% 50%100
150
200
250
300
350
400
450
500
550
SUPPLEMENTAL DAMPING/CRITICAL DAMPING(%)
MA
XIM
UM
BA
SE
DIS
PLA
CE
ME
NT
(mm
)
260
337
372
517
225
281
315
452
179
245
280
379
153
220
240
331
134
181
205
293
118
134
159
222
PGA=0.5g
PGA=0.67g
PGA=0.9g
PGA=1.2g

91
supplemental viscous dampers. It was observed that base displacement was significantly
reduced due to the implementation of supplemental damping. The trend for the reduction
tended to be almost linear with the increase in damping coefficient. By adding viscous
dampers with 50% of critical damping, the isolator displacements were successfully
restrained within the allowable displacement threshold under all the four earthquake
intensities considered. This therefore validated the effectiveness of viscous dampers in
controlling isolator displacements. Nonetheless, such combination of large viscous
damping might undesirably intensify structural response, amplifying the superstructure
drifts and floor accelerations. To verify this, further investigation was undertaken to study
the effects of adding supplemental dampers on structural response. Figure 4.19 and Table
4.17 show that the supplemental damping could effectively limit inter-storey drifts, but
excessive damping could have an adverse effect. As an example, the maximum
superstructure storey drift was reduced by approximately 20% to 30% when viscous
damping was 30% of critical, and the earthquake PGA ranged between 0.5g and 1.2g.
However, inter-storey drift remained approximately the same beyond a damping ratio of
30% of critical. This range is shown in blue in Table 4.17. Clearly, a proper level of
supplemental damping helped reduce the energy transfer to the superstructure. On the
other hand, large supplemental damping might severely stiffen the isolation system,
resulting in the amplification of storey-drifts. It was observed, as depicted in Table 4.17,
that this undesirable effect of highly damped supplementary device was prominent in the
case of low intensity earthquakes (such as La11-005#1 and La11-005#2). This is because
a relatively small ground excitation may be inadequate to trigger the isolators when the
supplemental damping is high. One may then conclude from this observation that
supplemental isolation damping is not always ideal for small earthquakes. Therefore,
supplemental damping must be properly selected with due considerations given to design
hazard spectra.

92
Table 4.17: Inter-storey Drifts of Isolated Structure with Various Levels of Supplemental Damping
(a) Ground motion record: La11-005#1(PGA=0.5g)
Viscous Damping
Structure Floor
No
Damping
10%
Critical
20%
Critical
30%
Critical
40%
Critical
50%
Critical
7th
floor 0.092% 0.087% 0.085% 0.077% 0.069% 0.081%
6th
floor 0.160% 0.154% 0.134% 0.121% 0.117% 0.125%
5th
floor 0.234% 0.212% 0.195% 0.179% 0.171% 0.180%
4th
floor 0.297% 0.256% 0.247% 0.231% 0.210% 0.226%
3rd
floor 0.332% 0.298% 0.274% 0.227% 0.233% 0.252%
2nd
floor 0.388% 0.345% 0.318% 0.260% 0.277% 0.296%
1st floor 0.391% 0.357% 0.325% 0.266% 0.284% 0.303%
(b) Ground motion record: La11-005#2(PGA=0.67g)
Viscous Damping
Structure Floor
No
Damping
10%
Critical
20%
Critical
30%
Critical
40%
Critical
50%
Critical
7th
floor 0.125% 0.117% 0.111% 0.100% 0.098% 0.100%
6th
floor 0.201% 0.187% 0.175% 0.153% 0.148% 0.150%
5th
floor 0.297% 0.271% 0.258% 0.222% 0.210% 0.213%
4th
floor 0.392% 0.356% 0.333% 0.292% 0.274% 0.281%
3rd
floor 0.476% 0.423% 0.390% 0.304% 0.333% 0.342%
2nd
floor 0.602% 0.532% 0.477% 0.422% 0.426% 0.433%
1st floor 0.641% 0.568% 0.488% 0.452% 0.461% 0.473%
(c) Ground motion record: La11-005#3(PGA=0.9g)
Viscous Damping
Structure Floor
No
Damping
10%
Critical
20%
Critical
30%
Critical
40%
Critical
50%
Critical
7th
floor 0.134% 0.127% 0.121% 0.116% 0.111% 0.109%
6th
floor 0.215% 0.204% 0.192% 0.184% 0.173% 0.166%
5th
floor 0.322% 0.299% 0.284% 0.270% 0.254% 0.242%
4th
floor 0.442% 0.401% 0.377% 0.355% 0.336% 0.338%
3rd
floor 0.571% 0.504% 0.466% 0.433% 0.428% 0.431%
2nd
floor 0.761% 0.682% 0.603% 0.553% 0.556% 0.564%
1st floor 0.835% 0.710% 0.658% 0.607% 0.613% 0.615%
(d) Ground motion record: La11-005#4(PGA=1.2g)
Viscous Damping
Structure Floor
No
Damping
10%
Critical
20%
Critical
30%
Critical
40%
Critical
50%
Critical
7th
floor 0.171% 0.166% 0.160% 0.157% 0.156% 0.155%
6th
floor 0.284% 0.271% 0.264% 0.257% 0.236% 0.254%
5th
floor 0.476% 0.454% 0.433% 0.419% 0.417% 0.416%
4th
floor 0.884% 0.812% 0.778% 0.746% 0.734% 0.761%
3rd
floor 1.349% 1.269% 1.204% 1.149% 1.153% 1.179%
2nd
floor 2.076% 1.964% 1.855% 1.668% 1.682% 1.718%
1st floor 2.456% 2.371% 2.293% 1.954% 1.974% 2.013%

93
Figure 4.19: Variation of Maximum Inter-story Drift of Isolated Structure with Increasing
Supplemental Viscous Damping
Figure 4.20: Variation of Maximum Accelerations at the Top Floor of Isolated Building with
Increasing Supplemental Viscous Damping
0% 10% 20% 30% 40% 50%0.0%
0.5%
1.0%
1.5%
2.0%
2.5%
SUPPLEMENTAL DAMPING/CRITICAL DAMPING(%)
INT
ER
ST
OR
EY
DR
IFT
(%)
0.391%
0.641%
0.835%
2.456%
0.357%
0.568%
0.71%
2.371%
0.325%
0.488%
0.658%
2.293%
0.266%
0.452%
0.607%
1.954%
0.284%
0.456%
0.613%
1.974%
0.303%
0.459%
0.615%
2.013%
PGA=0.5g
PGA=0.67g
PGA=0.9g
PGA=1.2g
0 % 10% 20% 30% 40% 50%0.25
0.3
0.35
0.4
0.45
0.5
0.55
0.6
0.65
0.7
0.75
SUPPLEMENTAL DAMPING/CRITICAL DAMPING(%)
FLO
OR
AC
CE
LE
RA
TIO
N(g
)
0.273g
0.342g
0.386g
0.482g
0.298g
0.354g
0.391g
0.485g
0.335g
0.404g
0.438g
0.554g
0.366g
0.449g
0.49g
0.594g
0.394g
0.489g
0.533g
0.661g
0.42g
0.522g
0.571g
0.709gPGA=0.5g
PGA=0.67g
PGA=0.9g
PGA=1.2g

94
Table 4.18, Figure 4.20 and Figure 4.21 present the effects of supplemental viscous
damping on floor accelerations. The supplemental damping increased floor acceleration
response. The top floor acceleration increased by about 50% as the supplemental
damping increased to 50% of critical damping. This effect became more pronounced
under less intense earthquake motions. The pattern changed in base floor accelerations
completely, as illustrated in Figure 4.21, showing reductions in floor accelerations. This
reduction is attributed to the reduction in horizontal displacements of the isolation system.
The supplemental damping would stiffen the isolation system, and more importantly,
create higher mode effects. This would amplify upper floor accelerations. In some cases,
however, the supplemental damping would increase floor accelerations to a degree such
that the acceleration values become higher than those obtained from the undamped
structural model under more intense earthquakes. In this respect, the level of
supplemental damping should be carefully chosen in order to control isolator
displacements, without adversely affecting (excessively increasing) floor accelerations.
Figure 4.21: Variation of Maximum Accelerations at the Base Floor Level of Isolated Structure with
Increasing Supplemental Viscous Damping
0 % 10% 20% 30% 40% 50%0.2
0.25
0.3
0.35
0.4
0.45
0.5
0.55
SUPPLEMENTAL DAMPING/CRITICAL DAMPING(%)
FLO
OR
AC
CE
LE
RA
TIO
N(g
)
0.286g
0.344g
0.377g
0.542g
0.254g
0.327g
0.371g
0.539g
0.247g
0.318g
0.361g
0.513g
0.24g
0.304g
0.338g
0.509g
0.234g
0.295g
0.335g
0.508g
0.231g
0.291g
0.333g
0.506g
PGA=0.5g
PGA=0.67g
PGA=0.9g
PGA=1.2g

95
Table 4.18: Floor Accelerations of Isolated Structure with Supplemental Viscous Damping
(a) Ground motion level: La11-005#1(PGA=0.5g)
Viscous Damping
Structure Floor
No
Damping
10%
Critical
20%
Critical
30%
Critical
40%
Critical
50%
Critical
7th
floor 0.273g 0.298g 0.335g 0.366g 0.394g 0.420g
6th
floor 0.249g 0.265g 0.297g 0.324g 0.348g 0.371g
5th
floor 0.219g 0.234g 0.255g 0.275g 0.292g 0.308g
4th
floor 0.186g 0.239g 0.245g 0.252g 0.260g 0.267g
3rd
floor 0.191g 0.257g 0.266g 0.276g 0.285g 0.294g
2nd
floor 0.216g 0.264g 0.270g 0.278g 0.287g 0.293g
1st floor 0.242g 0.259g 0.261g 0.262g 0.263g 0.267g
Base 0.286g 0.254g 0.247g 0.240g 0.234g 0.231g
(b) Ground motion level: La11-005#2(PGA=0.67g)
Viscous Damping
Structure Floor
No
Damping
10%
Critical
20%
Critical
30%
Critical
40%
Critical
50%
Critical
7th
floor 0.342g 0.354g 0.404g 0.449g 0.489g 0.522g
6th
floor 0.315g 0.326g 0.361g 0.399g 0.460g 0.498g
5th
floor 0.282g 0.311g 0.317g 0.340g 0.381g 0.418g
4th
floor 0.246g 0.310g 0.318g 0.326g 0.360g 0.399g
3rd
floor 0.262g 0.331g 0.343g 0.354g 0.366g 0.371g
2nd
floor 0.283g 0.338g 0.346g 0.355g 0.363g 0.372g
1st floor 0.307g 0.329g 0.334g 0.335g 0.336g 0.339g
Base 0.344g 0.327g 0.318g 0.304g 0.295g 0.291g
(c) Ground motion level: La11-005#3(PGA=0.9g)
Viscous Damping
Structure Floor
No
Damping
10%
Critical
20%
Critical
30%
Critical
40%
Critical
50%
Critical
7th
floor 0.386g 0.391g 0.438g 0.490g 0.533g 0.571g
6th
floor 0.374g 0.381g 0.392g 0.435g 0.469g 0.497g
5th
floor 0.362g 0.364g 0.369g 0.371g 0.392g 0.412g
4th
floor 0.343g 0.350g 0.351g 0.357g 0.360g 0.368g
3rd
floor 0.354g 0.363g 0.374g 0.384g 0.394g 0.407g
2nd
floor 0.365g 0.372g 0.375g 0.387g 0.398g 0.409g
1st floor 0.370g 0.369g 0.368g 0.371g 0.372g 0.373g
Base 0.377g 0.371g 0.361g 0.338g 0.335g 0.333g
(d) Ground motion level: La11-005#4(PGA=1.2g)
Viscous Damping
Structure Floor
No
Damping
10%
Critical
20%
Critical
30%
Critical
40%
Critical
50%
Critical
7th
floor 0.482g 0.485g 0.554g 0.594g 0.661g 0.709g
6th
floor 0.465g 0.470g 0.523g 0.555g 0.592g 0.629g
5th
floor 0.448g 0.462g 0.480g 0.505g 0.520g 0.533g
4th
floor 0.452g 0.463g 0.475g 0.495g 0.510g 0.521g
3rd
floor 0.473g 0.477g 0.502g 0.527g 0.536g 0.544g
2nd
floor 0.476g 0.491g 0.518g 0.521g 0.523g 0.525g
1st floor 0.497g 0.513g 0.511g 0.500g 0.486g 0.472g
Base 0.542g 0.539g 0.513g 0.509g 0.508g 0.506g

96
Further assessment of the effects of supplemental damping is assessed by examining the
variation of base shear. Figure 4.22 compares the variation of base shear with increasing
level of viscous damping. The pattern observed resembles to that observed under
increasing isolator lead plug diameter (shown in Figure 4.16). The shear force is reduced
to 17.1%, 18.3%, 17.4% and 19.4% respectively from the earthquake ground motions
La11-005#1 to La11-005#4 as the supplemental damping value increased up to 50% of
critical damping. The trend in base shear variation appears to change, and decrease
beyond 20% of critical damping. Despite the reduction in base shear, the application of
viscous dampers generates higher inertial forces at floor levels, because of increased floor
accelerations. The contradiction between reduced base shear and increased seismic forces
at floor levels can be attributed to the supplemental damping, which could excite higher
modes, generating inertial forces in the opposite direction. Thus, although the floor
inertial forces were increased, it was possible to create a reduced total base shear.
Figure 4.22: Variation of Maximum Base Shear of Isolated Building with Increasing level of
Supplemental Damping
In summary, the incorporation of viscous dampers in the isolation system effectively
controls the horizontal displacement of the base isolation system, provided the
supplemental damping value which is carefully selected according to the expected
0 % 10% 20% 30% 40% 50%
2
3
4
5x 10
4
SUPPLEMENTAL DAMPING/CRITICAL DAMPING(%)
MA
XIM
UM
BA
SE
SH
EA
R(k
N)
22147
28881
31898
45012
20137
26324
29080
40411
18753
24692
27361
38496
18735
24352
26775
37521
18720
23959
26573
36268
18359
23587
26329
36251
PGA=0.5g
PGA=0.67g
PGA=0.9g
PGA=1.2g

97
seismic hazard spectra of the region. Care should be exercised in adjusting the level of
damping so that the floor accelerations and the superstructure inter-storey drifts remain
low to realize full benefits of the isolation system.
4.6 Performance of Buildings with Friction Pendulum Bearings
Previous sections presented the results of dynamic analyses to assess the effectiveness of
rubber bearing base isolation systems of different sizes and properties, with and without
supplemental damping. Some of the shortcomings of the system were identified,
especially under high-intensity ground motions. It was concluded that, while the rubber
bearing systems can be used effectively as base isolation systems, excessive movements
of the isolation system may occur under strong earthquakes. Increasing the diameter of
the lead plug in LLRBs or introducing supplemental viscous damping to overcome this
problem could trigger undesirable effects on structural response, especially as it affects
floor accelerations. High levels of floor accelerations increase the risk of damage to non-
structural elements and building contents. To overcome some of these shortcomings, the
feasibility of using friction pendulum bearings (FPB) with rubber bearings was
investigated in this section. The FPB bearings could provide high initial isolator stiffness
and adequate energy dissipation. The FPBs were placed under the external columns of the
reference buildings, while the rubber bearings were placed underneath the internal
columns, as illustrated in Figure 4.23. The analysis results obtained from the use of FPB
are compared with previously obtained results from the use of rubber bearing only, with
rubber bearing isolator diameters of 600 mm and lead plug diameter of 100 mm, with and
without the supplemental viscous damping of 30% of critical damping.
Figure 4.23: Placement of Friction Pendulum Bearings (FPB) and Rubber Bearings

98
Table 4.19 summarizes the cases considered in the comparison, while providing a
summary of maximum lateral displacements obtained at the isolator level. The
incorporation of FPB bearings remarkably restricted lateral displacements at the isolator
level without the need for supplementary damping. The base displacement was reduced
by 43.8%, 39.7%, 37.1% and 28.4% respectively for the earthquake motions La11-005#1
to La11-005#4 with increasing intensity. The improvement obtained was similar to that
obtained from the use of supplemental damping at 30% of critical damping. The FPB
bearings have the additional advantages of large allowance on the isolator horizontal
displacement and self-centring capacity to control residual displacements, thereby
improving the stability of the rubber isolation system during large movements.
Figure 4.24 provides comparisons for superstructure inter-storey drift between the fixed-
base structure and the isolated structures with three isolation systems (rubber bearings,
rubber bearings with the dampers and rubber bearings with the FPBs). All the isolation
systems were able to attenuate structural vibrations. Among them, the friction pendulum
bearings coupled with rubber bearings resulted in the best drift control, successfully
limiting inter-storey drifts to 1.0%, under the four earthquake intensities considered. This
led to significant improvements in structural performance and produced elastic response
in the superstructure. This favourable performance was attributed to the outstanding
energy dissipation capacity provided by FPB bearings, as the FPBs could convert seismic
energy into heat and potential energy, which are more efficient than consuming the
energy through plastic deformations of isolators and viscous damping.
Table 4.19: Maximum Isolator Displacements (mm)
Rubber bearings Solely Rubber Bearings & Dampers Rubber Bearings & FPBs
PGA=0.5g 260 154 146
PGA=0.67g 337 204 203
PGA=0.9g 372 229 234
PGA=1.2g 517 331 370

99
(a) Ground motion record: La11-005#1
(b) Ground motion record: La11-005#2
Figure 4.24: Peak Inter-storey Drifts of Fixed-base Structures and Three Isolated Structures under
Selected Earthquake Record
0.00% 0.10% 0.20% 0.30% 0.40% 0.50% 0.60% 0.70% 0.80%1
2
3
4
5
6
7
INTERSTOREY DRIFT(%)
FLO
OR
0.687%0.391%0.266%0.236%
0.791%0.388%0.26%0.234%
0.716%0.332%0.227%0.21%
0.622%0.297%0.231%
0.192%
0.435%0.234%0.179%
0.155%
0.278%0.16%0.121%
0.11%
0.17%0.092%0.077%0.078%
FIXED BASE STRUCTURE
RUBBER BEARINGS
RUBBER BEARINGS WITH DAMPERS
RUBBER BEARINGS WITH FPBs
0.00% 0.20% 0.40% 0.60% 0.80% 1.00% 1.20% 1.40%1
2
3
4
5
6
7
INTERSTOREY DRIFT(%)
FLO
OR
1.187%0.641%0.452%0.324%
1.233%0.602%0.422%0.32%
0.997%0.477%0.304%0.28%
0.761%0.393%0.292%
0.254%
0.457%0.297%0.222%
0.205%
0.266%0.201%0.153%
0.148%
0.157%0.126%
0.1%0.106%
FIXED BASE STRUCTURE
RUBBER BEARINGS
RUBBER BEARINGS WITH DAMPERS
RUBBER BEARINGS WITH FPBs

100
(c) Ground motion record: La11-005#3
(d) Ground motion record: La11-005#4
Figure 4.24: Peak Inter-storey Drifts of Fixed-base Structures and Three Isolated Structures under
Selected Earthquake Record
0.00% 0.50% 1.00% 1.50%1
2
3
4
5
6
7
INTERSTOREY DRIFT(%)
FLO
OR
1.46%0.835%0.607%0.385%
1.489%0.761%0.553%0.378%
1.172%0.571%0.433%0.327%
0.864%0.442%0.355%0.293%
0.47%0.322%
0.27%0.237%
0.247%
0.215%0.184%0.171%
0.147%0.134%0.116%
0.125% FIXED BASE STRUCTURE
RUBBER BEARINGS
RUBBER BEARINGS WITH DAMPERS
RUBBER BEARINGS WITH FPBs
0.00% 0.50% 1.00% 1.50% 2.00% 2.50% 3.00%1
2
3
4
5
6
7
INTERSTOREY DRIFT(%)
FLO
OR
2.921%2.458%1.954%1.099%
2.918%2.076%1.668%0.981%
2.286%1.349%1.149%
0.754%
1.747%0.884%
0.746%0.593%
0.796%0.477%0.419%0.433%
0.321%0.284%
0.257%0.3%
0.166% 0.171%0.157% 0.23%
FIXED BASE STRUCTURE
RUBBER BEARINGS
RUBBER BEARINGS WITH DAMPERS
RUBBER BEARINGS WITH FPBs

101
The results showed that the combination of fiction pendulum bearings and rubber
bearings was effective in reducing floor accelerations. This hybrid isolation system
produced the smallest floor accelerations, promoting superior performance of non-
structural elements, as well as operational and functional components of buildings during
seismic excitations. The significant control in structural accelerations was attributed to
the small post-yield stiffness of the FPBs, which decreased the natural period of the
rubber isolation system, thereby reducing the acceleration response spectra. Also, as can
be seen in Figure 4.24, the floor accelerations of the structure with FPBs did not change
along the building height, indicating that the superstructure almost rigidly moved during
seismic response. This indirectly reflected the effectiveness of FPB bearings on
supressing structural deformations, by isolating the superstructure from seismic effects
efficiently. The hybrid isolation system also resulted in minimum structural base shear as
shown in Table 4.20.
Table 4.20: Structural Base Shears (kN)
Fixed Base
Structure
Rubber bearings
Solely
Rubber Bearings &
Dampers
Rubber Bearings &
FPBs
PGA=0.5g 31558 22147 18720 12185
PGA=0.67g 37931 28881 24352 16141
PGA=0.9g 40685 31898 26775 18158
PGA=1.2g 50977 45012 37521 28073
One of the parameters that may play an important role on the performance of FPB is axial
load. The superstructure weight may influence the seismic behavior of this hybrid
isolation system, because the lateral stiffness of the FPB bearings is directly proportional
to the vertical loads on bearings. While the building selected was analyzed with its
appropriate weight to compare the behaviours of three different types of base isolation
systems, a parametric investigation was carried out to assess the significance and the
sensitivity of axial load on FPB performance. This was done by keeping the building
geometry and structural properties the same, but reducing floor weights. A convenient
way of doing this was to reduce the density of the concrete in the analytical model. The
density of concrete was reduced down to 70% and 50% of the original value, to change
the weight supported by the bearings. The reduced concrete density and the
corresponding building weight are tabulated in Table 4.21.

102
(a) Ground motion record: La11-005#1
(b) Ground motion record: La11-005#2
Figure 4.25: Maximum Floor Accelerations of Fixed-base Structure and Three Isolated Structures
under Selected Earthquakes Records
0.1 0.2 0.3 0.4 0.5 0.6 0.7 0.80
1
2
3
4
5
6
7
ACCELERATION(g)
FLO
OR
0.447g0.268g0.24g0.206g
0.441g0.242g 0.262g0.196g
0.425g0.216g 0.278g0.19g
0.419g0.191g 0.276g0.192g
0.409g0.186g 0.252g0.187g
0.469g0.219g 0.275g0.199g
0.571g0.249g 0.324g0.215g
0.661g0.273g 0.366g0.229g
FIXED BASE STRUCTURE
RUBBER BEARINGS
RUBBER BEARINGS WITH DAMPERS
RUBBER BEARINGS WITH FPBs
0.2 0.3 0.4 0.5 0.6 0.7 0.8 0.90
1
2
3
4
5
6
7
ACCELERATION(g)
FLO
OR
0.596g0.344g0.304g0.283g
0.551g0.307g 0.335g0.262g
0.505g0.283g 0.355g0.252g
0.498g0.262g 0.354g0.25g
0.483g0.246g 0.326g0.242g
0.527g0.282g0.34g0.248g
0.625g0.315g 0.399g0.269g
0.743g0.342g 0.449g0.284g
FIXED BASE STRUCTURE
RUBBER BEARINGS
RUBBER BEARINGS WITH DAMPERS
RUBBER BEARINGS WITH FPBs

103
(c) Ground motion record: La11-005#3
(d) Ground motion record: La11-005#4
Figure 4.25: Maximum Floor Accelerations of Fixed-base Structure and Three Isolated Structures
under Selected Earthquakes Records
0.2 0.3 0.4 0.5 0.6 0.7 0.8 0.90
1
2
3
4
5
6
7
ACCELERATION(g)
FLO
OR
0.671g0.378g0.338g0.275g
0.616g0.371g0.371g0.275g
0.555g0.365g0.387g0.279g
0.541g0.354g 0.384g0.28g
0.519g0.351g0.357g0.273g
0.555g0.362g 0.371g0.272g
0.648g0.374g 0.435g0.287g
0.776g0.386g 0.49g0.30g
FIXED BASE STRUCTURE
RUBBER BEARINGS
RUBBER BEARINGS WITH DAMPERS
RUBBER BEARINGS WITH FPBs
0.4 0.5 0.6 0.7 0.8 0.9 1 1.10
1
2
3
4
5
6
7
ACCELERATION(g)
FLO
OR
1.08g0.542g0.509g0.458g
0.871g0.497g 0.5g0.421g
0.816g0.476g0.521g0.413g
0.784g0.473g0.527g0.415g
0.732g0.452g0.495g0.417g
0.668g0.448g 0.505g0.415g
0.769g0.465g 0.555g
0.431g
0.949g0.482g 0.594g0.456g
FIXED BASE STRUCTURE
RUBBER BEARINGS
RUBBER BEARINGS WITH DAMPERS
RUBBER BEARINGS WITH FPBs

104
Table 4.21: Structural Weight in Three Analysis Cases
100% Concrete Density 70% Concrete Density 50% Concrete Density
Density (kN/m3) 23.56 16.49 11.78
Structural Weight(kN) 89547.56 70311.1886 57486.941
The decrease in the structural weight would influence the performance of isolated
structure in multiple ways. First, the reduced weight could generate lower inertial forces
at each floor of the superstructure, therefore fundamentally alleviating the structural
dynamic response. Second, the reduced vertical loads could lessen the lateral stiffness of
the FPBs, shifting the isolation period to a higher range and consequently resulting in
lower floor acceleration response spectra. On the other hand, the reduction in lateral
stiffness would reduce the area under hysteresis loops of FPBs, also reducing the
isolation energy dissipation capacity.
A small superstructure weight resulted in reduced horizontal deformations. The
horizontal movement of the base isolation system, as well as inter-storey drifts were
reduced as the superstructure weight went down. This is shown in Table 4.22 and Figure
4.26. Surprisingly, the effect of weight reduction was an increase in floor accelerations.
The maximum floor acceleration increased by 2.4%, 3.6%, 11.7% and 16.6% respectively
for the four earthquake intensities considered when the building weight by reduced by 36%
(50% reduction in concrete mass density). This unexpected increase may be explained by
the reduction in isolation energy dissipation capacity. Further investigation is required for
complete assessment of this parameter.
Variation in base shear with building weight is shown in Table 4.23, The base shear
decreased with decreasing weight, as expected, because the reduced superstructure mass
attracted smaller seismic forces.
Table 4.22: Maximum Horizontal Base Displacement as Affected by Building Weight (mm)
100% Concrete Density 70% Concrete Density 50% Concrete Density
PGA=0.5g 146 135 128
PGA=0.67g 203 192 337
PGA=0.9g 234 220 201
PGA=1.2g 370 354 332

105
(a) Ground motion record: La11-005#1
(b) Ground motion record: La11-005#2
Figure 4.26: Maximum Inter-storey Drifts as Affected by Building Weight
0% 0.04% 0.08% 0.12% 0.16% 0.20% 0.24%1
2
3
4
5
6
7
INTERSTOREY DRIFT(%)
FLO
OR
0.236%0.209%0.181%
0.234%0.205%0.178%
0.21%0.181%0.156%
0.192%0.162%0.139%
0.155%0.128%0.11%
0.11%0.091%
0.078%
0.078%0.065%0.056%
100% CONCRETE DENSITY
70% CONCRETE DENSITY
50% CONCRETE DENSITY
0.05% 0.10% 0.15% 0.20% 0.25% 0.30% 0.35% 0.40%1
2
3
4
5
6
7
INTERSTOREY DRIFT(%)
FLO
OR
0.324%0.279%0.247%
0.32%0.275%0.241%
0.28%0.243%0.212%
0.254%0.218%0.19%
0.205%0.175%0.152%
0.148%0.125%
0.109%
0.106%0.09%
0.078%
100% CONCRETE DENSITY
70% CONCRETE DENSITY
50% CONCRETE DENSITY

106
(c) Ground motion record: La11-005#3
(d) Ground motion record: La11-005#4
Figure 4.26: Maximum Inter-storey Drifts as Affected by Building Weight
0.05% 0.10% 0.15% 0.20% 0.25% 0.30% 0.35% 0.40%1
2
3
4
5
6
7
INTERSTOREY DRIFT(%)
FLO
OR
0.385%0.315%0.285%
0.378%0.315%0.279%
0.327%0.278%0.244%
0.293%0.251%0.219%
0.237%0.201%0.174%
0.171%0.145%
0.125%
0.125%0.105%0.091%
100% CONCRETE DENSITY
70% CONCRETE DENSITY
50% CONCRETE DENSITY
0.00% 0.20% 0.40% 0.60% 0.80% 1.00% 1.20% 1.40% % 0.00% 0.20%1
2
3
4
5
6
7
INTERSTOREY DRIFT(%)
FLO
OR
1.099%0.831%0.752%
0.981%0.765%0.701%
0.754%0.615%0.554%
0.593%0.506%0.435%
0.433%0.384%
0.334%
0.3%0.274%0.249%
0.23%0.213%
0.195%
100% CONCRETE DENSITY
70% CONCRETE DENSITY
50% CONCRETE DENSITY

107
(a) Ground motion record: La11-005#1
(b) Ground motion record: La11-005#2
Figure 4.27: Maximum Floor Accelerations as Affected by Building Weight
0.185 0.19 0.195 0.2 0.205 0.21 0.215 0.22 0.225 0.23 0.2350
1
2
3
4
5
6
7
ACCELERATION(g)
FLO
OR
0.206g 0.217g 0.219g
0.196g 0.215g 0.216g
0.19g 0.209g0.212g
0.192g 0.203g 0.205g
0.187g 0.195g 0.198g
0.199g0.213g
0.211g
0.215g0.225g
0.222g
0.229g0.235g
0.234g
100% CONCRETE DENSITY
70% CONCRETE DENSITY
50% CONCRETE DENSITY
0.24 0.25 0.26 0.27 0.28 0.29 0.30
1
2
3
4
5
6
7
ACCELERATION(g)
FLO
OR
0.283g0.269g 0.275g
0.262g0.265g0.269g
0.252g 0.261g 0.267g
0.25g 0.258g 0.26g
0.242g0.246g 0.26g
0.248g 0.261g 0.276g
0.269g 0.272g 0.288g
0.284g0.279g 0.294g
100% CONCRETE DENSITY
70% CONCRETE DENSITY
50% CONCRETE DENSITY
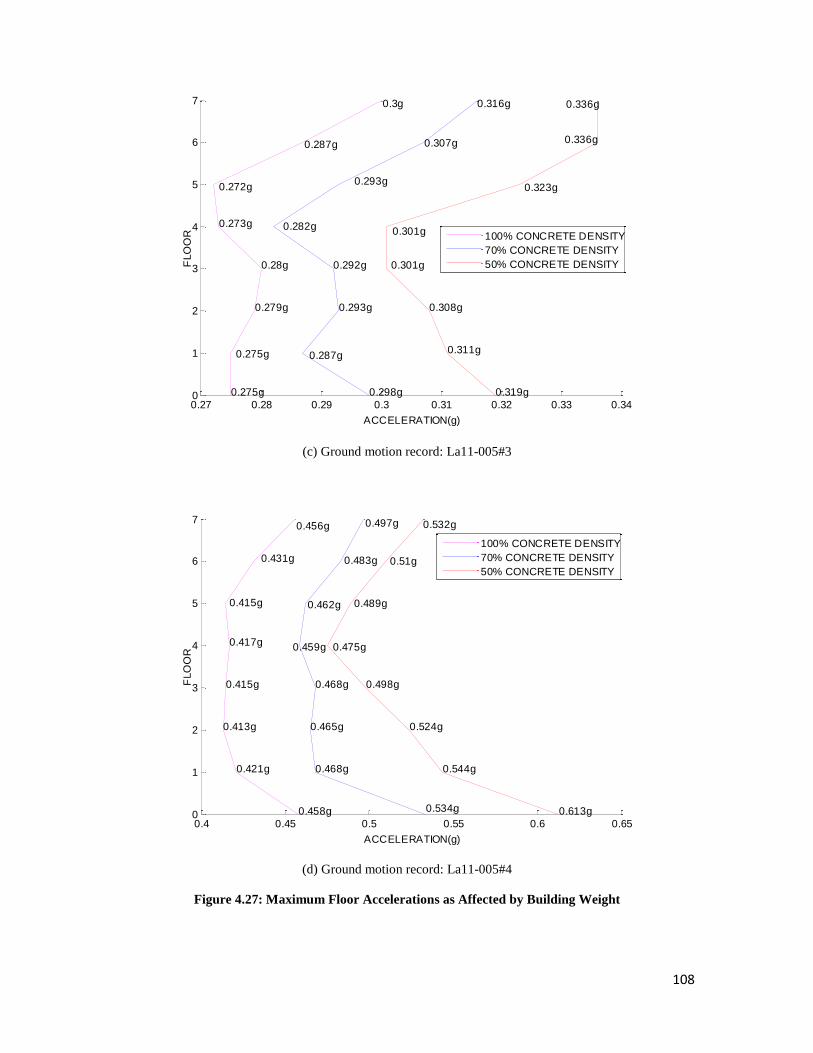
108
(c) Ground motion record: La11-005#3
(d) Ground motion record: La11-005#4
Figure 4.27: Maximum Floor Accelerations as Affected by Building Weight
0.27 0.28 0.29 0.3 0.31 0.32 0.33 0.340
1
2
3
4
5
6
7
ACCELERATION(g)
FLO
OR
0.275g 0.298g 0.319g
0.275g 0.287g0.311g
0.279g 0.293g 0.308g
0.28g 0.292g 0.301g
0.273g 0.282g 0.301g
0.272g0.293g
0.323g
0.287g 0.307g 0.336g
0.3g 0.316g 0.336g
100% CONCRETE DENSITY
70% CONCRETE DENSITY
50% CONCRETE DENSITY
0.4 0.45 0.5 0.55 0.6 0.650
1
2
3
4
5
6
7
ACCELERATION(g)
FLO
OR
0.458g 0.534g 0.613g
0.421g 0.468g 0.544g
0.413g 0.465g 0.524g
0.415g 0.468g 0.498g
0.417g 0.459g 0.475g
0.415g 0.462g 0.489g
0.431g 0.483g 0.51g
0.456g 0.497g 0.532g
100% CONCRETE DENSITY
70% CONCRETE DENSITY
50% CONCRETE DENSITY

109
Table 4.23: Base Shear Force as Affected by Building Weights ( kN )
100% Concrete Density 70% Concrete Density 50% Concrete Density
PGA=0.5g 12185 10514 9305
PGA=0.67g 16141 13974 12413
PGA=0.9g 18158 15697 14023
PGA=1.2g 28073 25746 22134
In conclusion, implementing the friction pendulum bearings as part of the overall base
isolation system provided the optimal approach. The hybrid isolation system, consisting
of FPBs and rubber isolation systems provided effective displacement control in the
superstructure with minimum horizontal movement at the isolation level. The system also
resulted in low floor accelerations and base shear.

110
Chapter 5
Summary and Conclusion
5.1 Summary and Conclusions
Base isolation systems are widely used to improve seismic performance of reinforced
concrete structures. It is based on the concept of decoupling superstructure from ground
shaking, thereby limiting the transfer of seismic induced energy to the structure.
Three different types of base isolation systems were investigated in the current research
project, consisting of a rubber isolation system, high damping isolation devices that are
composed of rubber isolators and viscous dampers, and a hybrid isolation system
consisting of rubber bearings and friction pendulum bearings. The effectiveness of these
isolation systems on seismic performance of reinforced concrete frame buildings were
assessed through a case study involving the outpatient building of Lushan People’s
Hospital in China. The building was base isolated using rubber bearings, and was
subjected to the 2013 Lushan Earthquake with a Magnitude of 6.6. The building showed
excellent behaviour of the superstructure, with some damage to the isolators, and higher
than expected lateral movements at the base isolation level.
The prototype building was modelled as a fixed base structure first to assess its
performance without the base isolation. It was subsequently analyzed with the three
different base isolation systems indicated above. Structural performances were compared
between the isolated and non-isolated structural buildings in terms of superstructure
storey-drifts, floor accelerations, base horizontal displacements and base shears.
Moreover, modeling parameters, such as the application of infill walls, isolator

111
characteristics, earthquake characteristics and structural weight were investigated. The
following conclusions were drawn:
The presence of masonry infill walls has significant influences on seismic
response of non-isolated building. The walls provide lateral stiffness, which
controls inter-storey drift ratios. However, the increased structural stiffness results
in shorter period, attracting higher seismic forces and resulting in increased floor
accelerations, as well as higher base shears. However, the presence of infill walls
reduces inelasticity in frame members until they suffer diagonal compression
failures. The overall effect of masonry infill walls on seismic response has to be
assessed carefully. The walls help frame buildings until their elastic limit is
exceeded. Under high-intensity earthquake loading, especially if the duration of
the earthquake is long, the frames may suffer damage upon the failure of the walls.
The application of seismic isolation can effectively improve structural
performance of reinforced concrete frame buildings. It reduces dynamic forces
experienced by the superstructure, controlling inter-storey drifts, floor
accelerations and structural base shear. The level of improvement attained in the
base isolated structure depends on the type and characteristics of the base isolation
system implemented. The most optimum isolation system for a given frame
building can only be determined after conducting dynamic response history
analysis of the overall system with due considerations given to the interaction of
the superstructure and the base isolation system.
The rubber isolation system, consisting of LRBs and LLRBs, is effective in
reducing seismic response of frame buildings under small or moderate intensity
earthquakes. However, when the isolated building is subjected to strong
earthquakes, the rubber isolators may experience cumulative lateral displacement,
damaging bearings and causing instability in the superstructure. An increase in
lead plug diameter has a positive effect on controlling and reducing lateral
movements of the isolation system. However, the increase in initial stiffness and
isolation damping, resulting from the use of a larger size isolator may amplify
floor acceleration response. Therefore, the trade-off between reducing isolator

112
displacements and increasing floor accelerations should be carefully assessed for
optimal use of rubber isolations systems.
In some cases, it may be impractical to control isolator displacements by only
enlarging lead plug diameters. In such cases, supplemental viscous dampers may
have to be installed in combination with rubber isolators to provide additional
damping. The implementation of supplemental damping reduces large isolator
displacements. However, the additional damping in turn increases floor
accelerations by amplifying higher mode effects. This may counteract the positive
contributions towards reducing isolator displacements, and may intensify damage
to non-structural systems and building contents. To ensure the effectiveness of
using supplemental damping devices, the level of damping has to be carefully
selected on the basis of the design hazard spectra of the region. For the building
considered in the current investigation, supplemental damping of less than 30% of
critical damping resulted in desired performance.
The friction pendulum bearings (FPB) coupled with rubber isolators may produce
the best base isolation system. The use of FPB provides high initial stiffness and
self-centring capacity, thereby reducing lateral displacements at the isolator level
without increasing dynamic response of the superstructure excessively. The latter
is achieved because of adequate energy dissipation of FPBs. The hybrid isolation
system, consisting of FPBs and LRBs generates an excellent structural
performance in terms of minimizing inter-storey drift, floor accelerations, base
shears and base displacements.
Building weight influences the performance of isolated structure when the hybrid
isolation system is used, consisting of FPBs and LRBs. This is because the inertia
forces acting on the superstructure is proportional to the structure mass, but more
importantly, the structure weight affects lateral stiffness of the FPBs. In general,
the reduction in structural weight improves seismic performance. A small
superstructure weight reduces inter-storey drifts, base displacements and base
shear, although it slightly increases floor accelerations.

113
5.2 Recommendations for Future Research
The current research project, though covered a significant number of parameters and
three different types of base isolation systems, it was limited to the performance of a
single prototype buildings selected. It was also limited to the use of the same frequency
content of earthquake excitation, though the earthquake intensity was varied. A more
comprehensive research program is recommended in the future on different reinforced
concrete frame buildings with different structural configurations, buildings height,
structural mass and earthquake ground motion records. The variation of these structural
and ground motion parameters will result in the generation of more extensive data, which
will help expand some of the observations made at the end of the current investigation.
Furthermore, the prototype building used in current research is a moment-frame structure
without shear walls. This type of building may not be an optimum choice for base
isolation due to its relatively flexible behaviour, although the masonry infill walls used
stiffen the superstructure. It is recommended to investigate the effectiveness of the base
isolation systems considered on frame shear wall structures.

114
References
[1] Dolce M, Cardone D, Ponzo FC. Shaking-table tests on reinforced concrete frames
with different isolation systems. Earthquake Engineering and Structural Dynamics 2007;
36(5):573-596
[2] Christopoulos, C., Filiatrault A. Principles of Passive Supplemental Damping and
Seismic Isolation. Pavia, Italy: IUSS Press, 2006.
[3] Matsuda A. Evaluation for mechanical properties of laminated rubber bearing using
finite element analysis. Journal of Pressure Vessel Technology 2004; 126(2):134-140
[4] Robinson WH. Lead-rubber hysteretic bearings suitable for protecting structures
during earthquakes. Earthquake Engineering and Structural Dynamics 1982; 10(4):593-
604
[5] Kalpakidis IV, Constantinos MC, Whittaker AS. Modeling strength degradation in
lead-rubber bearings under earthquake shaking. Earthquake Engineering and Structural
Dynamics 2010; 39:1533-1549
[6] Luca L, Cianluca G, Pier PD. Comparison of different models for friction pendulum
isolators in structures subjected to horizontal and vertical ground motions. Soil Dynamic
and Earthquake Engineering 2016; 81:75-83
[7] Cardone D, Gesualdi G, Brancato P. Restoring capability of friction pendulum
seismic isolation systems. Building of Earthquake Engineering 2015; 13(8):2449-2480
[8] Mokha A, Constantinou MC, Reinhorn AM, Zayas VA. Experimental study of
friction-pendulum isolation system. ASCE Journal of Structural Engineering 1991;
117(4): 1207-1217
[9] Asher JW, Young RP, Ewing RD. Seismic isolation design of the San Bernardino
Country medical center replacement project. Structural Design of Tall Buildings 1996;
5:265-279
[10] Macrae GA, Morrow DV, Roeder CW. Near-fault ground motion effects on simple
structures. ASCE Journal of Structural Engineering 2001; 127(9): 996-1004
[11] Zhao DX, Shao AW, Chao W. Experimental and numerical study on long-span
reticulate structure with multidimensional high-damping earthquake isolation devices.
Journal of sound and vibration 2014; 333:3044-3057
115
[12] Yi MW, Bijan S. Shake table testing of a base isolated model. Earthquake
Engineering 2002; 24:1203-1215
[13] Yoo B, Kim Y-H. Study on effects of damping in laminated rubber bearings on
seismic response for a 1/8 scale isolated test structure. Earthquake Engineering and
Structural Dynamics 2002; 31:1777-1792
[14] Briseghella B, Zordan T, Liu T, Mazzarolo E. Friction pendulum system as a retrofit
technique for existing reinforced concrete building. Structural Engineering International
2013; 23:219-224
[15] Castaldo P, Palazzo B, Della VP. Seismic reliability of base-isolated structures with
friction pendulum bearings. Engineering Structures 2015; 95:80-93
[16] Chang S, Makris N, Whittaker E, Thompson A. Experimental and analytical studies
on the performance of hybrid isolation system. Earthquake Engineering and Structural
Dynamics 2002; 31:421-443
[17] Providakis CP. Effect of LRB isolators and supplemental viscous dampers on
seismic isolated building under near-fault excitations. Engineering Structures 2008;
30:1187-1198
[18] Providakis CP. Effect of supplemental damping on LRB and FPS seismic isolators
under near-fault ground motions. Soil Dynamics and Earthquake Engineering 2009;
29:80-90
[19] Dolce M, Cardone D. Seismic protection of light secondary systems through
different base isolation systems. Journal of Earthquake Engineering 2003; 7:223-250
[20] Yu C, Goodarz A. Wind effects on base-isolated structures. ASCE Journal of
Engineering Mechanics 1992; 118(8): 1708-1727
[21] Elisabeth K, Ana MC, Bastien A. The impact of the 12 May 2008 Wenchuan
Earthquake on industrial facilities. Journal of Loss Prevention in the Process Industries
2010; 23:242-248
[22] Marshall L. Observations from the April 20, 2013 Lushan county, Ya'an city,
Sichuan province, China earthquake. SMIP13 Seminar on Utilization of Strong-Motion
Data 2013; 25 - 44.
[23] Mainstone RJ. Supplementary notes on the stiffness and strength of infilled frames.
Current Paper CP 13/74, Building Research Station, Garston Watford, U.K. 1974

116
[24] Mainstone RJ, Weeks GA. The influence of bounding frame on the racking stiffness
and strength of brick walls. Proceedings of the 2nd International Brick Masonry
Conference, Building Research Establishment, Watford, England 1974; 165-171