application of blade-tip sensors to blade-vibration...
TRANSCRIPT

8
Application of Blade-Tip Sensors to Blade-Vibration Monitoring in Gas Turbines
Ryszard Szczepanik, Radosław Przysowa, Jarosław Spychała, Edward Rokicki, Krzysztof Kagmierczak and Paweł Majewski
Instytut Techniczny Wojsk Lotniczych (ITWL, Air Force Institute of Technology) Poland
1. Introduction
Non-contact blade vibration measurement in turbomachinery is performed during
development phase to verify design quality of bladed disk and its structural integrity
(Zielinski & Ziller, 2005). The method, referred as blade tip-timing (BTT) or Non-contact
Stress Measurement System (NSMS) is applied by mostly all manufacturers as a
complement of strain gauges, traditionally used to measure stress levels and blade vibration
parameters (Roberts, 2007). Measurement results are usually presented in the function of
rotational speed in Campbell diagram, showing vibration modes excited by particular
engine orders. Operational stress levels and accumulated fatigue cycles should not exceed
material endurance limits.
High Cycle Fatigue, occurring at low stress and high vibration frequency is a common
reason for blade damage in turbomachinery. HCF has been identified as factor limiting
development of more efficient blade designs, affecting safe operation of turbomachinery and
causing considerable losses (Nicholas, 2006). US Air Forces initiated HCF Science and
technology program in late 1990’s, which launched and supported multidisciplinary efforts
for HCF mitigation, continued recently as Engine Prognosis Program. Development of tip-
timing instrumentation both for supporting design of fatigue-resistant components and also
for online blade crack detection has been one of research priorities and provided new
sensors and advanced data analysis methods. NSMS technologies are also developed and
successfully applied in power industry (Ross, 2007).
Nowadays Blade Tip-Timing using optical sensors is considered as mature technology able
to replace strain gauges in development process of fans or compressors (Rushard, 2010;
Courtney, 2011). Current research activities concentrate on turbines, which are more
demanding environment for tip-timing instrumentation due to high temperature,
contamination and lower amplitude of vibration. Development of alternative tip sensors is
considered as another priority. Optical sensors despite providing the highest available
resolution, require cleaning and ensure quite limited life, which makes them unusable in
embedded systems for blade health monitoring.
This chapter describes development and application of inductive, eddy-current and
microwave tip-timing sensors for gas-turbine blades, carried out in ITWL in last five years.
Other sensors’ applications, like measurement of tip-clearance, blade twist and disk
www.intechopen.com

Thermal Power Plants
146
vibration are also discussed here. The sensors’ performance has been verified during engine
bench tests and in spin facility. They has been used in prototype onboard system for health
monitoring of turbofan engine (Przysowa, Spychała, 2008). Similar research efforts have
been reported lately by some other leading research centers (Madden, 2010; Hayes et al.
2011; Millar, 2011), revealing not many details. Tip-timing technology is still sensitive area
for involved companies and very few journal papers and books are available. State of the art
is presented on technical conferences and in patent applications.
More and more interest in blade health monitoring is observed recently, as it allows to
maintain legacy turbines, which blades were designed before implementation of CAD
systems. It is usually safe and efficient to start monitoring poorly designed blades, instead of
canceling or redesigning the machine. In aero-engines fan blades vibration monitoring is
performed also to early detect foreign object damage (Gilboy et al. 2009) and to mitigate
FOD-initiated HCF cracks.
Online health monitoring may be a method for damage-tolerance maintenance (ENSIP
2004) also for modern blade designs, ensuring turbine operation up to material endurance
limits.
This chapter is devoted to problems including sensor design, blade pulse generation and
triggering, time-of-arrival measurement, which form only low-level but fundamental part of
NSMS. They are common for all applications of BTT, like health monitoring or component
testing for design verification or engine certification. Details of TOA data processing, crucial
for estimating stress or identification of vibration mode parameters are only mentioned here
and are further discussed by other authors (Heath, 2000; Zielinski & Ziller, 2005; Witos,
2007; Loftus, 2010).
2. Parameters of signals received from inductive sensors
Inductive sensors (known also as speed pickups or Variable Reluctance sensors) were
primarily used for blade tip-timing in steam turbines (Zablockij et al., 1977). They were
successfully employed in monitoring system for blade vibration, which was developed in
Poland for turbojet training aircrafts (Szczepanik & Witoś, 1998; Witoś & Szczepanik, 2005).
It is the first airborne tip-timing system implemented worldwide and is still in use by Polish
Air Forces.
Inductive sensors are optimal for embedded systems due to simple design, low cost and
very long life (even several years). The only disadvantage is ability to sense only
ferromagnetic materials, which are rarely used in modern gas turbines.
Authors’ efforts focused on magnetic field modeling, optimizing amplifier and coil design
and selection of strong permanent magnets resulted in development of the sensors usable
for non-magnetic metal blades (titan, nickel based super-alloys etc.). Sensors of this type are
often called “passive eddy-current”. Temperature resistant designs of the inductive sensor
for blade tip-timing in gas-turbines have also been demonstrated (Przysowa, Spychała,
2008), able to operate in contact with exhaust gases of temperature even as high as 1200 K.
The following subchapters (2-6) review features and applications of advanced inductive
sensors, aimed at their implementation in onboard monitoring system.
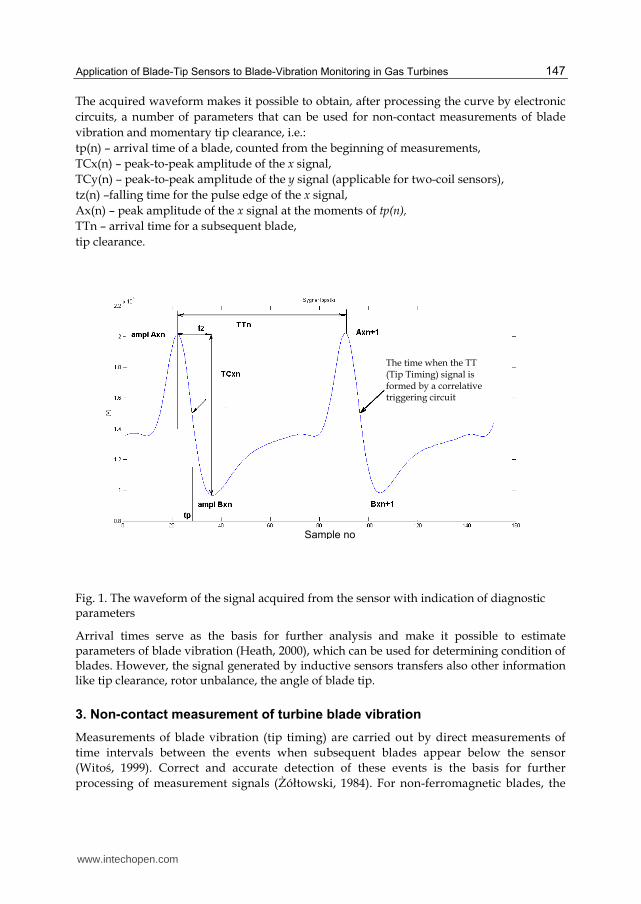
The signal received from an inductive sensor installed in the area of blade rotation and measured at the output of the conditioning circuit may be like the waveform shown in Fig. 1.
www.intechopen.com
Application of Blade-Tip Sensors to Blade-Vibration Monitoring in Gas Turbines
147
The acquired waveform makes it possible to obtain, after processing the curve by electronic
circuits, a number of parameters that can be used for non-contact measurements of blade
vibration and momentary tip clearance, i.e.:
tp(n) – arrival time of a blade, counted from the beginning of measurements,
TCx(n) – peak-to-peak amplitude of the x signal,
TCy(n) – peak-to-peak amplitude of the y signal (applicable for two-coil sensors),
tz(n) –falling time for the pulse edge of the x signal,
Ax(n) – peak amplitude of the x signal at the moments of tp(n),
TTn – arrival time for a subsequent blade,
tip clearance.
Fig. 1. The waveform of the signal acquired from the sensor with indication of diagnostic parameters
Arrival times serve as the basis for further analysis and make it possible to estimate parameters of blade vibration (Heath, 2000), which can be used for determining condition of blades. However, the signal generated by inductive sensors transfers also other information like tip clearance, rotor unbalance, the angle of blade tip.
3. Non-contact measurement of turbine blade vibration
Measurements of blade vibration (tip timing) are carried out by direct measurements of
time intervals between the events when subsequent blades appear below the sensor
(Witoś, 1999). Correct and accurate detection of these events is the basis for further
processing of measurement signals (hółtowski, 1984). For non-ferromagnetic blades, the
The time when the TT (Tip Timing) signal is formed by a correlative triggering circuit
Sample no
www.intechopen.com

Thermal Power Plants
148
blade is just below the sensor at the moment of the maximum slope for the basic signal. It
corresponds to the maximum of the first derivative or the zeroed value of the second
derivative.
The sequence of pulse waveforms produced by the sensor is the sensor response to a
sequence of events when blades cross the area just below the sensor. That is why we speak
about the event time having in mind the initial moment when formation of the sensor
response is started. The primary carrier of information about the event time is always the
signal produced by the sensor or, in more details, the information is contained in the
invariable parameters of the waveform shape. Then the signal is transferred to the triggering
circuit via appropriate signal conditioning modules that provide the most favourable
conditions for extraction of required parameters. The nature of the conditioning process and
type of the conditioning technology applied depend on the type of a specific sensor and the
collaborating blade. To minimize indeterminacy of the moment when the signal level
exceeds the reference threshold, the maximum possible slope of the signal waveform is
required at the detection point with the minimum possible noise dispersion. It is the
requirement that needs maximization of the signal slope with respect to the noise and is
referred to as the acronym (slope-to-noise ratio).
( )[ ]
K
idef T
N
dV t
dtSLNR (1)
The task of the triggering circuit that is meant for extraction of time-related information is to
produce a standard logic pulse (so-called Tip Timing – TT) with the edge that remains in a
defined, fixed relationship to the time coordinate of the event. To detect the moment when a
blade appears below the sensor one can use threshold discriminators or comparators.
Depending on the adopted measurement methods, these devices are operated in a
conventional way, with the non-zero reference level or as zero crossing detectors. The
produced logic pulse (the TT signal) is delayed against the event of a blade arrival. Thus, the
time necessary to produce the pulse shall be referred to as the instrumental time. For single-
channel measurement, the delay is not very important provided that it maintains its fixed
duration, in spite of waveform variations for the sensor signal. In case of multi-channel
measurements, the instrumental time may vary, despite identical configuration of electronic
components in the channel. That inequality may be caused by parameter dispersion of
components of the amplifier or the sensor.
Fig. 2 and Fig. 3 present waveforms of turbine blade vibration recorded during ground tests
of a turbojet.
The estimated vibration of turbine blades feature the low amplitude at the level of 0.1mm,
but application of the constant fraction detection made it possible to achieve a very high
resolution that enabled measurements of vibrations with the accuracy as high as up to
0.01%.
Fig. 4 shows the normalized amplitude of resonance vibrations for a single turbine blade.
The relationship presented in Fig. 4 serves as the basis to plot the Campbell diagram. It
allows to determine the excitation orders for the vibration synchronous with the rotational
speed. The observed vibration in the first bending mode is excited by the fifth and higher
engine orders (Fig. 5).
www.intechopen.com

Application of Blade-Tip Sensors to Blade-Vibration Monitoring in Gas Turbines
149
Fig. 2. Blade vibration amplitude and rotor speed in subsequent rotations of the turbine
Fig. 3. The relation between blade vibration amplitude and rotor speed
www.intechopen.com

Thermal Power Plants
150
Fig. 4. The relation between the vibration amplitude of a selected blade and rotor speed
4. Measurement of tip clearance for blades
Additionally, it was evaluated whether the applied measurement chain is suitable for
determining the tip clearance above turbine blades rotating in turbojet engine. The tip
clearance of a selected blade measured with an inductive sensor for the entire range of rotor
speed is shown in Fig. 6. Design properties of that sensor are different from the ones
demonstrated by the sensor that is used for the tip timing method.
During rotor acceleration and deceleration the measurement results indicate clearance
variations characteristic for turbomachinery (Fig. 7) caused by different parameters
of thermal expansion for blading and casing.
www.intechopen.com

Application of Blade-Tip Sensors to Blade-Vibration Monitoring in Gas Turbines
151
Fig. 5. The relationship between the frequency of a turbine blade vibration and the rotation speed – the Campbell diagram
Fig. 6. The relationship between variations of the turbine rotation speed and variations of the tip clearance
Tip clearance of a selected turbine blade
RPM
www.intechopen.com

Thermal Power Plants
152
Fig. 7. Average tip clearance of turbine blades for an example test profile
5. Measurements of twist angles for blades
The section 2 reports the possibility of determination of additional diagnostic parameters on
the basis of the measured signals. For that purpose a software detector of the signal peak
values was developed by means of procedures embedded in the Matlab software tools. The
peak detector was provided with components of the constant fraction detection of signals,
which improves insensitivity of the determined parameters to amplitude variations of the
signal obtained from the inductive sensor. The signal from the peak detector served as the
basis for determination of arrival moments of blades. In turn, the knowledge of arrival times
makes it possible to calculate twist angles of blades at the moments of arrival.
It should be mentioned that the concept of measurement of angles between blades and the
measurement plane is based on the formula for mutual induction (Rokicki et al. 2009). The
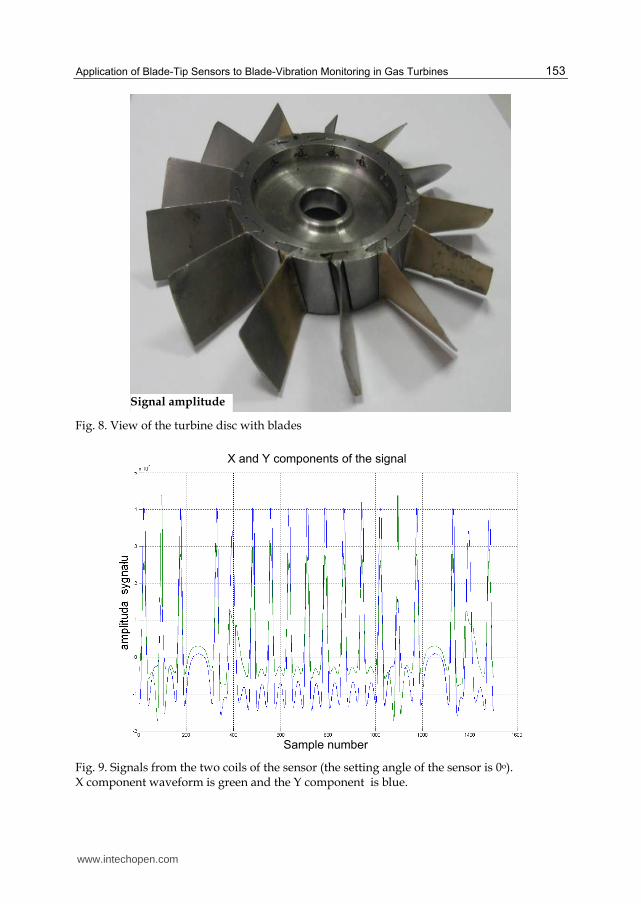
initial laboratory tests were carried out with use of a sensor with two coils. At first the disk
with blades was prepared in such a way that the disk has 1 titan blade and two blades with
different twist angles (Fig. 8). Then the sensor signal was recorded (Fig. 9) for three different
angles of the sensor position (0°, 45° and 90°).
Fig. 9 and 10 present signals for various twist angles of blades. Low amplitude and half-
round pulses are the sensor response to arrival of a titan blade.
The amplitudes of pulses collected from both coils of the sensor as well as arrival angles for
individual blades are shown in Fig. 11. Therefore, the possibility of determination of angular
positions (twist angles) for blades was confirmed.
The newly developed methodical approach and algorithms were subsequently used to find
out arrival angles of blades during turbojet bench test (Fig. 12).
Tip clearance of turbine blades
Sample number
www.intechopen.com
Application of Blade-Tip Sensors to Blade-Vibration Monitoring in Gas Turbines
153
Fig. 8. View of the turbine disc with blades
Fig. 9. Signals from the two coils of the sensor (the setting angle of the sensor is 0o). X component waveform is green and the Y component is blue.
X and Y components of the signal
Signal amplitude
Sample number
www.intechopen.com

Thermal Power Plants
154
Fig. 10. The graph for arrival angles of blades of the disk as shown in Fig. 8
Fig. 11. Component amplitudes of signals and the blade arrival angle
www.intechopen.com

Application of Blade-Tip Sensors to Blade-Vibration Monitoring in Gas Turbines
155
Fig. 12. Calculated tangent of the arrival angle for a selected blade of turbojet as the function of the rotational speed
6. Estimation of rotor unbalance
The following paragraphs comprise results of concept developments, where the signal received from the inductive sensor would be used for measuring the unbalance. Two inductive sensors with the transverse field were installed in the rotation area of blades with the initial clearance of 1 mm. Then, a series of tests was carried out when controlled unbalance was introduced to the 7th stage of the compressor. The signals received from both sensors were conditioned with use of the same circuits and then recorded (Fig. 13 and Fig. 14). One of the sensors was dedicated for the tip timing method whilst the second one was
Fig. 13. Signal from the tip clearance (TC) sensor for blades of the engine turbine when the setting for the tip clearance at rest was 1 mm.
www.intechopen.com

Thermal Power Plants
156
meant to measure tip clearance. Measurements of the turbine unbalance were carried out by means of the signal from the second sensor.
Fig. 14. Signal from the tip timing (TT) sensor for blades of the engine turbine when the setting for the tip clearance at rest was 1 mm.
Fig. 15. Effect of the compressor out-of-balance onto total out-of-balance of the turbine
The self-developed algorithms implemented within the Matlab software tool were used to find out how the compressor out-of-balance affects the total out-of-balance of the turbine (Fig. 15). Before tests the compressor was balanced with use of the Schenck balancer. The best balance was achieved when no additional weight was used. Then the appearing out-of-balance of the compressor was measured for the other weights (m1 < m2 < m3).
www.intechopen.com

Application of Blade-Tip Sensors to Blade-Vibration Monitoring in Gas Turbines
157
On the basis of the tests one may conclude that the compressor out-of-balance increases in pace with the growth of the add-on weight. The completed measurements made it possible to find out that for the best balance of the compressor (no additional weight) the turbine suffers from nearly three times higher vibrations than for all the other cases. The effect of insufficient load to the bearings onto the turbine operation is manifested here. For the largest weight m3, the maximum level of vibrations permitted for that type of engine was not exceeded.
7. Application of microwave sensors
Following subchapters present prototype microwave sensors that are developed in the Air
Force Institute of Technology (ITWL) as well as results and conclusions obtained from their
testing. These devices represent radars of a very short range, needing special designs of
antennas and dedicated methods for signal processing. Particular attention is paid to
analysis of the way in which the engine environment and the selected sensor design affect
waveforms and parameters of the signal acquired from turbine blades.
The major advantage of microwave sensors is their resistance to contamination by combustion products, relatively good propagation of microwave radiation, both in wet air and in the environment of hot exhaust gases and good reflection of the microwaves by metals. On the other hand, the drawbacks include (Nyfors, 2000): expensive manufacturing process of the microwave devices, in particular those that are meant to operate at high temperatures and frequencies (above 12 GHz), the need to tune operation frequency to match dimensions of the equipment and the resulting infeasibility to develop a universal design, the sensor signal is usually a function of several variables, therefore the sensors need calibration, advanced processing of signals or application of a reference sensor, limited spatial resolution resulting from quite a considerable wavelength (as compared to optical sensors). Microwave sensors were already applied to turbine engines for various applications, i.e. to measure the content of wear products in oil inside the gearbox or to monitor operation of the fuel pump (Błachnio et al., 1985). Microwave sensors intended for measurements of motion parameters of turbine blades have several common features with capacitance sensors based on frequency modulation (Forgale, 2006) and may be considered as an alternative solution.
8. Microwave sensors developed by the Air Force Institute of Technology (ITWL)
Research studies have led to the development of several design solutions dedicated to microwave sensors of blade motion. All the designs are based on the concept of a homodyne detection of microwaves reflected on blade tips. Such a concept was for the first time applied to MUH sensors (Dzięcioł, 2003, 2004). The microwave homodyne device (MUH - Fig. 16) is made up of a steel and ceramic antenna that is resistant to high pressures and temperatures as well as a generator and detector. The sensor is installed on an engine by means of the antenna screwed onto the socket provided on the engine body. The blades that pass in front of the sensor trip cause retuning of the resonance circuit of the antenna. Consequently, the sensor produces the measurable signal that is the fast-varying component of the output voltage U provided by the microwave detector.
www.intechopen.com

Thermal Power Plants
158
The design that is more suitable for tests of engines is the microwave sensor in the form of a compact homodyne generator and detector (GDH) that can be screwed onto the existing antenna (Fig. 17).
Fig. 16. The MUH microwave motion sensor – the laboratory version made up of coaxial subassemblies connected by means of a tee piece with N-type connectors
Fig. 17. The MUH microwave motion sensor (the version with the GDH module )
Fig. 18. Model waveforms for the voltage signal acquired from turbine blades with use of the MUH sensor
U
t Uśr
www.intechopen.com

Application of Blade-Tip Sensors to Blade-Vibration Monitoring in Gas Turbines
159
The following research efforts resulted in the design of a differential antenna (Fig. 19, Rokicki et al., 2007) with the aperture that is made up of two open waveguides, which interact to generate the output signal.
Fig. 19. The ITWL differential antenna installed in the turbine casing and the model signal waveform acquired at the maximum engine speed
9. Overview of exiting solutions for microwave sensors
The issue concerning the ways of employing microwaves for measurements of the blade motion was investigated by several research centres, mostly located in the USA. The device developed by United Technology Corporation (Grzybowski, 1998) operates with the frequency of 20 GHz and is intended for tip-clearance measurement. The sensor from Daimler-Benz (Wegner, 1997) is also dedicated to measure tip clearance and operates with the frequency of 22-24 GHz. It is made up of a metallic and ceramic antenna and an electronic module incorporating microwave monolithic integrated circuits (MMIC) based of gallium arsenide (GaAs). The device of Siemens (Wagner, 1998) is intended for monitoring of vibrations of steam turbine blades, The generator operates at the frequency of about 24GHz that can be adjusted by its control circuit according to the actual distance to the blades. Pulses generated by passing blades are initially processed by the DSP circuit and then analyzed by a computer with the appropriate software for the discrete phase method. The solution from Radatec (Geisheimer et al., 2002; Holst, 2005) (f = 5.8 GHz) is distinguished by application of two detectors with the mutual phase shift of 90º, which makes it possible to measure both the in-phase and the quadrature components of the wave vector. Comparison between the both signals makes it possible to unambiguously measure the tip clearance by elimination of the effect of received microwaves on the amplitude. The EHDUR device of BAE Systems is dedicated to detect foreign bodies in the engine inlet and to identify the objects that may damage the engine. Initially the motion of blades was considered by the designers as disturbance and filtered out of the input signal (Shephard et al., 2000). More recently the studies were initiated to analyze blade vibration of fan blades on the basis of the signal generated by a sensor installed at the inlet. The prototype device developed at the Industrial Telecommunication Institute (PIT) (Fig. 20) developed in collaboration with ITWL offers excellent parameters of both the generator and
www.intechopen.com

Thermal Power Plants
160
the antenna circuits. The antenna and generator /detector modules are detached and connected by means of a semi-rigid cable.
Fig. 20. The antenna for the PIT microwave sensor
10. Operation principle of the microwave sensor
Non-contact measurement of blade vibration requires the sensor providing electric pulses in
the moments when blades cross the measuring point of the antenna (Zablockij et al., 1977).
Microwaves, emitted by the antenna, return to the circuit after having been reflected by tips
of rotating turbine blades. The resulting signal, obtained as a result of the phase-sensitive
detection of microwaves, represents the momentary location of blades (Fig. 21). The way in
which the signal from the MUH sensor is generated, is outlined in the thesis (Dzięcioł, 2003).
Under real working conditions of the turbine, operation of the microwave circuit is affected
by a number of factors that are hard to describe in quantitative terms. The detailed analysis
of the sensor operation principle is not within the scope of this study, but understanding of
the specific features is necessary to analyze the received signals.
Modelling of the sensor operation requires the solution of the Maxwell equation, which is
carried out with use of numerical methods by means of the dedicated software. It is really
difficult to achieve exact results of simulation due to the fact that some parameters that are
necessary for calculations cannot be determined with sufficient accuracy, especially, when
operation of the sensor at high temperatures, typical for gas turbines, is anticipated.
Specific operation of the sensor during engine tests can be analysed by means of simple
models that are known from physics and electrical engineering, such as a transmission line,
a dipole, interference of waves, etc., Application of such models is limited due to the fact
that dimensions of the circuit and the measured distances are comparable with the
wavelength or they are even shorter. The optimum method for development of the
microwave sensor for turbine environment must incorporate intense aid of the computer
simulation methods to the experiments.
www.intechopen.com

Application of Blade-Tip Sensors to Blade-Vibration Monitoring in Gas Turbines
161
Fig. 21. The principle for pulse generation by the MUH motion sensor. For antennas with low spatial resolution with the range that covers signals from 2 – 3 blades the pulses may interfere.
The structure of the employed microwave circuit is made up of two major parts:
closed – waveguides that are included inside the sensor,
open – turbine gas path with blades rotating inside. The closed part (except for the sensor antenna) is located in the cold area that enables steady operation of the incorporated components, as the temperature alters their parameters only slightly. On the other hand, electromagnetic parameters of exhaust gases that fill the turbine channel may vary depending on locations and changes of the engine operation range.
10.1 Operation principle of the antenna
To enable the radiation to reach the blades, the steel-ceramic antenna must perform as the component that matches the microwave circuit to the space when motion of the rotating parts takes place. Due to the temperature effect onto the antenna, its actual parameters, when it is mounted on the engine, are different from calculated ones. The level of usable signal is lower for higher rotation speed values, as a significant deal of the generator power is already reflected and cannot be emitted. Microwaves are reflected not only by blade tips, but also by other metal components. It is difficult to limit the sensitivity of conventional antennas exclusively to the objects of selected type (shape). Generally, it is only possible to set up the antenna polarity and provide the directional characteristics. In the case of the sensor intended for monitoring the motion of blades, the distance to the object (tip clearance) is low as compared to the wavelength. The examined object is no longer passive with respect to the antenna, but begins to interact with it. In the case of the
www.intechopen.com

Thermal Power Plants
162
MUH sensor, the blade is a part of the antenna resonance circuit and arriving of the blade to the antenna field retunes the circuit, which is reflected in the signal received from the detector (Dzięcioł, 2003). The effect was also observed in the tested PIT sensor. The differential antenna (Rokicki et al., 2007) emits nearly no waves into the surrounding space, but reacts to the presence of objects right in front of it (1-2 mm). Consequently, a very high spatial resolution is achieved, which is confirmed by the signal with a very short fall time and low duty factor of the pulses.
10.2 Amplitude of pulses
The sensor employs the homodyne (synchronous) detection of microwaves, therefore the output voltage Uwy depends on the phase shift φ between the received and reference signals:
Uwy = a A cos φ, (2) where: A – amplitide of the received wave, a – proportionaliy constant. As the wavelength is about 3 cm, the differences in the tip clearance for individual waves (typically less than 1 mm) result in only insignificant changes of the phase, which can be observed in the received signal. In fact, besides the phase relationships, amplitude of the obtained pulses is also affected by the power of the received signal (Dzięcioł, 2003). The pulse amplitude not only depends on the tip clearance, but also on the cross section area of the blade and on local phenomena that may attenuate propagation of microwaves. Exact separation of all these factors is impossible in the existing circuit. Variations in the distance between the antenna and the blades (tip clearance) due to changes
of the engine operation range are insignificant as compared to the wavelength and should
not significantly attenuate the signal level. When the tip clearance is altered by 0.5mm, the
distance covered by the wave is doubled:
x = 2 · 0,5 mm = 1 mm (3) From the equation for the stationary wave, the following can be calculated (under the
assumption that the wave length is = 3 cm, just as in the air):
A = cos(2 x / ) = 0,978 (4) The voltage output signal from the microwave detector (after elimination of the constant component) is proportional to the amplitude A of the received wave, so the relative alteration of the output signal is:
U = 2,2 % (5) For real turbine channels the wavelength may vary from one location to another or in time, in pace with the electric permittivity of gases due to pressure and temperature variations.
10.3 Wave effects
Propagation of radiation takes place in the field near the antenna, so wave effects, such as
diffraction, interference, the Doppler effect, as well as reflections from other objects, not only
from blade tips, substantially influence the received signal. All the effects deteriorate
operational parameters of the sensor, chiefly the spatial resolution and the level of usable
signal.
www.intechopen.com

Application of Blade-Tip Sensors to Blade-Vibration Monitoring in Gas Turbines
163
In the case of the simplest antennas (open waveguides) one can assume that points that belong to the antenna aperture can be considered as sources of spherical waves (Fig. 22). The field that is generated in the channel of an immobile turbine constitutes the system of stationary waves that resembles interference images. The resulting signal that is received by the antenna is the superposition of signals reflected on blade tips, but also on vanes, blade side surfaces or disk surfaces, in particular when blades are short and densely spaced. The wave that is reflected on the area between the blades (unless it comes with the phase opposite to the generator) is also received and must be considered as the parasite component of the usable signal – increases the background level and reduces the signal/noise ratio of blade pulses. To avoid undesired reflections the antenna design must guarantee a possible short range, not much exceeding the values of the tip clearance (below 5 mm). The aperture diameter should be comparable with the thickness of the blade leaf and much shorter than the distance between two neighbouring blades. In practice, it is very difficult to meet all these requirements. Development of a miniature and selective antenna requires different design approach and the application of untypical components and expensive technologies.
Fig. 22. The antenna with excessively large range. The area is marked where reflections may possibly interfere with the output signal of the sensor. The proportions are maintained between the antenna diameter on one side and dimensions and layout of turbine blades on the other side.
Influence of the Doppler effect can be neglected under the assumption that blades move perpendicularly to the probing wave. In practice that assumption may not be fulfilled and the effect of the blade velocity onto the output signal from the sensor is observed. The lack of possibilities of separating the effects of various factors and physical phenomena (location, speed, attenuation) on the output signal of the device restricts its usefulness and applications.
www.intechopen.com

Thermal Power Plants
164
11. Processing of signals received from blades
11.1 Introduction
All measuring systems that have been in use so far employ magnetic or capacitance sensors
combined with analog triggering circuits. Such systems, even after updating, are incapable
of providing the appropriate values of parameters, necessary to measure vibrations of gas
turbine blades. Signals from dedicated microwave sensors as well as from capacitance ones
with frequency modulation can guarantee that the desired resolution and reliability are
achievable. Due to the shapes of received pulses, such sensors require application of
dedicated methods for signal processing. In this study the method that enables
determination of amplitudes and frequencies of turbine blade vibrations as well as the tip
clearance by analysis of the digital signal received from sensors is proposed.
The newly developed algorithms, in spite of the fact that they are chiefly dedicated to
signals from microwave sensors, were also successfully tested for signals received from
compressor blades by inductive and eddy current sensors.
12. The concept of signal processing
Information about movements of individual blades is obtained in the form of a series of
samples that make up the blade timings with resolution (quantization) defined by
parameters of the analog-to-digital (A/D) converter (Fig. 23). Shapes of the received pulses
depend on the sensor type and geometrical parameters of the blade row. Tip deflection is
reproduced for each blade in the measurement waveform received from the microwave
sensor, primarily by shifting the pulse down the time scale with regard to the expected
location. Extraction of that information from the sampled waveforms with the required
resolution makes it possible to measure blade vibration.
Fig. 23. Parameters of subsequent pulses acquired from turbine blades with use of a microwave sensor: amplitudes of peaks hi and background level li (with regard to the
reference voltage), pulse width wi and time gaps i between the moments of signal reception from subsequent blades.
w1 w2 w3
h2
h3
l1 l2 l3
1
h1
t
U
www.intechopen.com

Application of Blade-Tip Sensors to Blade-Vibration Monitoring in Gas Turbines
165
To determine momentary deflections of the selected blade, it is necessary to unambiguously
identify fragments that are associated solely with the blade movements and to extract that
information from the sampled waveform in order to obtain the corresponding pulses. Then
these pulses can be described by means of such parameters as the amplitude, phase and
width (Fig. 23) that are measured against the selected reference voltage. After these values
are determined for all pulses and assigned to specific blades, it is possible to convert the
measurement waveform (in the form of samples) into a sequence of ordered matrixes of real
numbers that correspond to location of blades (radial and angular coordinates) for
subsequent revolutions (Fig. 24). These numbers serve as the input data for further
vibrations analysis of blades and the rotor unit.
Fig. 24. Procedure for processing of signals acquired from blades
13. Conditioning and recording of signals
The voltage signal from a microwave sensor has usually a constant component that
corresponds to the working point of the detector. That constant component is usually much
higher than the fast-changing signal received from blades. Prior to amplification of the
output signal, it is necessary to eliminate the constant component or the compensate it. The
gain value must be appropriately adjusted so that the dynamic range of the converter would
be utilized in the best possible way and signal cropping could be avoided.
To locate pulse peaks with sufficient accuracy the sensor signal must be sampled with high
frequency, preferably a dozen times higher than the maximum frequency of blade arriving.
This recommendation results from the fact that the pulse peak usually takes less than 30%
time assigned to a single blade and at least several samples are necessary to reproduce the
peak shape. Only the high oversampling degree of the input signal makes it possible to
measure blade vibrations, lower sampling frequencies enable merely to measure the turbine
rotation speed.
identification of blades
amplitudetime
of arrival
Blade pulses
sensor signal
conditioning
analysis of vibrations
Blade row geometry
amplitude and frequency
of blade vibrations
Blade positions…
…
reference signal (phase marker)
…
visualization of results
estimation of pulse
parameters \\ tip clearance
analysis
www.intechopen.com

Thermal Power Plants
166
Results obtained by continuous sampling of the input signal with the constant frequency of fs were recorded on a hard disk, which was possible owing to relatively high capacities of mass storage memory units of contemporary computers. In the target on-board measurement system the hardware resources must be used economically, thus sampling shall cover only those fragments of pulses that convey information about momentary positions of blades.
14. Measurements of pulse parameters
The basic principle of non-contact measurements of blade vibrations is determination of the
moments when subsequent blades arrive to the measuring point of the sensor. The
fundamental precondition to carry out measurements correctly is to reproduce such
moments accurately by the output signal of the sensor (by the conventional phase of pulses).
To determine that phase, it is mandatory to maintain unaltered shapes of pulses provided
by the sensor, whilst the pulse amplitude and width may be altered proportionally.
Due to the aerodynamic shape of the blade tip and sophisticated principle of the sensor
operation, accurate indication of the point that belongs to the measurement waveform and
that corresponds to the conventional moment of the blade arrival (Witoś, 2007) is a really
non-trivial task. For inductive sensors, the presence of a blade at the measuring point is
associated with transition of the falling edge of the pulse via the voltage level of 0V (Fig. 25).
In the case of microwave sensors it is assumed that the presence of a blade at the measuring
point of the sensor corresponds to the pulse peak, i.e. the local extreme for the voltage
waveform (Fig. 26). Depending on the signal polarization it can be either the signal
minimum or maximum.
Voltage
Sample no
Fig. 25. Measurement of the blade arrival moments with use of digital processing of signals
from an inductive sensor. Data acquired from 15 blades of the 3rd compressor stage of a
helicopter engine. Localization of transition moments when falling edges of pulses acquired
from blades cross the voltage level of 0V (with the hysteresis U = 100 normalized units)
was carried out in the domain of sample numbers (the integer variable). Resolution for time
measurements is directly associated with the sampling frequency fs = 300 kHz.
www.intechopen.com

Application of Blade-Tip Sensors to Blade-Vibration Monitoring in Gas Turbines
167
The sampled signal received from the sensor is quantized in the domain of amplitude and time. Typical algorithms for processing digital signals are based on samples in the domain of time units for the clock series that synchronizes the sampling process. If no interpolation is applied, the achieved resolution for time intervals is equal to the sampling period. It is really expensive to increase the sampling frequency up to the value that guarantees that the desired resolution necessary to measure vibrations of blades is achieved, in particular when the sampling results are entirely recorded on a mass storage unit for further analysis. The data acquisition module NI DAQPad 6070E enables sampling with the maximum
possible frequency of 1,25 MHz. The achieved resolution in time domain (t = 0,8 µs) is many times lower than the one for measurements of digital sequences with use of counters and the dedicated PCB module NI 6602 with the clock frequency of 80 MHz as well as for the SPŁ-2b recorder (10 MHz).
In order to achieve the time resolution exceeding the sampling period t and avoid quantization, it is necessary to convert a sequence of samples into a continuous representation, at least within the vicinity of local extremes (pulse peaks). The linear interpolation, although much simpler for implementation, poorly reproduces the nature of the sensor waveform. It is why the walking adjustment of a sample clusters was applied, where the clusters included several measurement points and the waveform was approximated with the third degree polynomials with use of the least square method (Fig. 26). The obtained sequence of polynomials appears very similar to the original analog signal.
1
2
3
4
5
6
7
8
22.273; -0.476-0.5
-0.4
-0.3
-0.2
-0.1
0
0.1
0.2
0.3
0.4
0 5 10 15 20 25 30 35 40 45 50
t [µs]
U [V
]
Fig. 26. The polynomial approximation result of a model pulse acquired from blades with use of a microwave sensor. Sampling frequency fs = 1 MHz; window width w = 9. Exclusively the derivative of the polynomial no. 4 has zero points, where one of the extremes determines coordinates of the pulse peak, marked with the ‘X’ sign.
www.intechopen.com

Thermal Power Plants
168
The least square method is commonly used to match the finite set of measurement points to
a theoretical curve. The presented procedure analyzes the data one sample after another and
calculates coefficients of the third degree polynomials. Such a procedure is beneficial due to
the possibility of implementing it in a real time mode. There are other algorithms available
that are meant for similar tasks (e.g. spline interpolation), but they all require the
preparation of a finite set of data and determination of boundary values with further
awaiting until the data processing is completed.
Determination of the polynomial coefficients makes it possible to calculate the first and
second derivatives and to check whether the condition of a local extreme is fulfilled. It is
possible to speed up the data processing procedure when the analysis is limited exclusively
to the points with amplitudes that fall within the predefined limits (threshold voltages).
Accurate determination of arrival times of blades substantially depends on correct selection
of the sampling frequency and the width of the window that defines number of samples that
are selected for the single approximation. When four samples are selected, the obtained
curve must incorporate these points, i.e. the polynomial interpolation shall be applied.
When more than four samples are used the applied approximation is a form of the signal
filtration. The window width is adjusted to the noise content in the sensor signal (signal to
noise ratio) and the number of points used to reproduce the blade waveform.
The outlined method makes it possible to determine location of pulse peaks (Fig. 27) with
the resolution that is several times higher than the sampling frequency. Times of blade
arrivals obtained with use of the proposed method have the form that is appropriate to
determine amplitudes and frequencies of blade vibrations by means of the discrete-phase
method (tip-timing) and also its differential version, used when no one-per-revolution
signal is available (Witos, 1994).
Fig. 27. The example that explains how to determine pulse peaks by means of the newly developed method. The signal from the GDH sensor was used for the rotation speed of n = 15500 rpm. One blade generates the pulse with lower amplitude since its tip had been already trimmed.
www.intechopen.com

Application of Blade-Tip Sensors to Blade-Vibration Monitoring in Gas Turbines
169
15. Vibration measurements for turbine blades
Below there is an example of the application of the proposed method to the signal from the ITWL sensor, where the signal was recorded with the sampling frequency of fs = 1 MHz. Then a fragment of the signal recorded for deceleration of the engine (Fig. 28) was subjected to the analysis with use of the discrete-differential method. The results obtained for the spacing error should be considered as trustworthy since the positions of blades are recognized on the basis of waveforms with high fidelity (exceeding 90%). Blade vibration alter blade spacing by no more than 1-2%. Deviations of the blade spacing in relation to average positions, resulting from non-uniform deployment of blades on the blade row, are of the same range. In order to illustrate blade vibration on the cumulative graph, the spacing error is magnified by several dozen of times with elimination of its constant value (Fig. 31). Consequently, it was found out that the vibration level of blades usually fits within the boundaries A < 0.4 mm. For the rotation speed of n ≈ 8600 rpm the static displacement of blades was observed for the entire blade row. The phenomenon took about a half of a second and affected the amplitude of received pulses (Fig. 32). It resembled synchronous vibrations of blades with the amplitude 2A < 0.6 mm, but it rather was an effect of a radial or axial movement of the entire turbine. No symptoms of similar turbine behaviour could have been observed for other recorded signals.
n [rpm]
7000
8000
9000
10000
11000
12000
13000
14000
15000
16000
0 2 4 6 8 10 12 14 16 18 20 22 24 26 28
t [s]
Fig. 28. Recorded deceleration of the tested engine for which vibration measurement of turbine blades is demonstrated.
For most of blades the response of a blade to the input function for the basic form of transverse vibration is visible for the 6th synchronous rotation speed for the rotation speed range from 12,000 to 13,000 rpm. For blades with higher frequencies of free vibrations, the response to the 5th synchronous speed is not visible as it falls outside the range of maximum permissible speed values. The responses for the seventh and eighth synchronous speed have insufficient amplitudes and cannot be identified for all blades. The responses for higher synchronous speeds occur for the rpm values below the idle run.
www.intechopen.com

Thermal Power Plants
170
Fig. 29. The relationship between vibration amplitude of turbine blades and rotational speed during the engine deceleration. The image presents differential deflections for even blades
For selected blades the method proposed by (Zablockij et al., 1977) was used to determine
frequencies of synchronous vibrations enforced by the 7th, 6th and 5th multiplicity of the
rotation speed (Fig. 31, Fig. 32). Then the obtained frequencies were applied to plot the
www.intechopen.com

Application of Blade-Tip Sensors to Blade-Vibration Monitoring in Gas Turbines
171
8200
8300
8400
8500
8600
8700
8800
8900
9000
9100
9200
8 8.5 9 9.5 10 10.5 11 11.5 12
t [s]
n [obr/
min
]
425
430
435
440
445
450
455
460
465
470
475
A [j.u.]
Fig. 30. Amplitude of pulses acquired for the blade no. 1 in the function of time. The graph
presents also the trend line (the moving average for the window width of 20) and variation
of the rotational speed.
Fig. 31. The relationship between the spacing error and the rotational speed for the blade no.
36 and 6. The image presents the resonance effect for the 7th, 6th and 5th engine order.
www.intechopen.com

Thermal Power Plants
172
Campbell graph (Fig. 33). The achieved relationship between the frequencies of blade vibrations and the rotation speed is quite similar to the results obtained by manufacturer of the blades.
Fig. 32. The relationship between the spacing error and the rotational speed for blade no. 60 and 37. The image presents the resonance effect for the 7th, 6th and 5th engine order.
1180
1200
1220
1240
1260
1280
1300
1320
10000 11000 12000 13000 14000 15000 16000
n [obr/min]
f [H
z]
6
36
60
74
nr łopatki
Fig. 33. The relationship between the vibration frequency for selected turbine blades and the rotational speed – Campbell diagram.
n [rpm]
blade number
www.intechopen.com

Application of Blade-Tip Sensors to Blade-Vibration Monitoring in Gas Turbines
173
The equipment limits for the available instruments (chiefly insufficient spatial resolution
and the need to measure very short time intervals dt < 1 µs), are the reasons that the results
from measurements of the vibration amplitudes are burdened by a wide bandwidth noise. It
makes the spectral analysis of the spacing error with use of the FFT method as well as the
analysis of asynchronous vibrations difficult. Nevertheless the achieved results make it
possible to find out blades with vibration frequencies that fail to meet technical
requirements and to monitor decrease of free vibration frequency as a result of fatigue crack
development.
16. Conclusions
The high-temperature inductive and microwave sensors along with algorithms for data
processing developed by the researchers of the Air Force Institute of Technology (ITWL)
enable diagnostics of gas turbines. The sensors are suitable for a long-term operation at
temperatures typical for gas turbines and can withstand vibrations that occur during
operation of jet engines.
The measurement results show that blade vibrations of a turbine in a jet engine achieve the
amplitude near 0.1mm for typical input functions and usually not exceeding 0.4 mm under
resonance conditions. For the start-up ranges of the engine the circle sections of such a
length correspond to the rotation time less than 1 s. Therefore, the uncertainty related to
the determination of time moments for vibration measurements system dedicated to turbine
blades should never exceed the value of several dozens of nanoseconds. On the other hand,
not only is the signal processing system the source of deviations, but also the microwave
sensor itself. The best spatial resolution was achieved for sensors that produce waveforms
with a low duty factor of output pulses.
Application of the newly developed method for signal processing enabled, for the first time,
to measure vibrations of turbine blades for the aircraft engine with use of the discrete
differential method on the basis of signals acquired from prototype microwave sensors. It
required a long series of tests with the engine running until the signal was acquired that met
the imposed requirements. Alongside, a numerous numerical experiments with the
recorded measurement data had to be carried out.
Anyway, non-contact vibration measurements for turbine blades in an aircraft engine are
really difficult due to a very low level of vibration amplitudes and unfavourable working
environment for the sensor. The conditioning methods developed, supported by
technologically advanced circuits for triggering and data acquisition, made it possible to
achieve the accuracy better than 0.01% for the tip deflection measurement. The available
resolution is sufficient to estimate blade vibration frequency and identify the vibration
mode. Developed methods are capable to warn about the excessive level of blade vibrations
as well as about frequency change of the synchronous blade vibrations caused by fatigue
cracks.
17. References
Błachnio, J.; Preckajło, S.; Dzięcioł, E. & Sypnik, R. (1985) A non-contact microwave method for measurements of mechanical motion inside hermetically sealed chambers with flow of stuff under variable pressure (in Polish), Patent application nr P-259221
www.intechopen.com

Thermal Power Plants
174
Courtney, S. (2011) A Robust Process for the Certification of Rotating Components Using
Blade Tip Timing Measurements. Proceedings of ISA International Instrumentation
Symposium, June 2011, St. Louis, MO USA
Dzięcioł, E. (2003). A Microwave Homodyne System for Condition Monitoring of a Turbine Blade
in an Aircraft engine. PhD Thesis (in Polish), Air Force Institute of Technology
(ITWL), Warsaw
Dzięcioł, E. (2004). Method of a Continuous Determination of an Instantaneous Position of an Blade
Tip in a Rotor Turbine Machine. US Patent 6,833,793
ENSIP (2004). Engine Structural Integrity Program. MIL-HDBK-1783B, Department Of
Defense, USA. Available from: www.everyspec.com
Fogale nanotech (2011). Capacitive Blade Tip Clearance & Tip Timing measurement system.
In: http://www.fogale.fr/media/blade/DS_TUR_UK_V02_WEB.pdf
Geisheimer, J.; Greneker, G. & Billington, S. (2002). Phase-based sensing system. US Patent
6,489,917
Gilboy, M.T.; Cardwell, D.N.; Chana, K.S. (2009). Autonomous foreign object impact
detection using eddy current sensors. Proceedings of 4th EVI-GTI International Gas
Turbine Instrumentation Conference, September, 2009, Norrköping, Sweden
Grzybowski, R. (1998). Microwave recess distance and air-path clearance sensor. US Patent
5,818,242
Hayes, T.; Hayes, B.; Bynum K. (2011). Utilizing Non-Contact Stress Measurement System
(NSMS) as a Health Monitor. Proceedings of 57th International Instrumentation
Symposium, June 2011, St. Louis, Mo USA
Heath, S. (2000). A New Technique for Identifying Synchronous Resonances Using Tip-
Timing. ASME Journal of Engineering for Gas Turbines and Power. Vol. 122, No.
2
Holst, T.A. (2005). Analysis of Spatial Filtering In Phase-Based Microwave Measurements
of Turbine Blade Tips. Georgia Institute of Technology Master Thesis. Atlanta
USA
Loftus, P. (2010). Determination of blade vibration frequencies and/or amplitudes. US Patent
application no. 20100179775
Madden, R. (2010). UK Blade Tip Timing. A customer perspective. Proceedings of ISA
International Instrumentation Symposium, May 2010, Rochester, NY USA
Millar, R.C. (2011). Turbo-Machinery Monitoring Measures for Propulsion Safety and
Affordable Readiness. Proceedings of 57th International Instrumentation Symposium,
June 2011, St. Louis, Mo USA
Nicholas, T. (2006). High cycle fatigue: a mechanics of materials perspective, Elsevier, ISBN 978-
0080446912, Oxford, UK
Nyfors, E. (2000). Industrial Microwave Sensors – A Review. Subsurface Sensing Technologies
and Applications, Vol. 1, No. 1
Poznańska, A. (2000). Lifetime of Turbojet Blades Made up of the EI-867 Alloy with Consideration
of Non-Uniform Deflections and Structural Changes. PhD Thesis (in Polish). Technical
University of Rzeszów
www.intechopen.com

Application of Blade-Tip Sensors to Blade-Vibration Monitoring in Gas Turbines
175
Przysowa, R.; Spychała J. (2008). Health Monitoring of Turbomachinery Based on Blade Tip-
Timing and Tip-Clearance. RTO-MP-AVT-157-P14. In: Ensured Military Platform
Availability. Available from: www.rta.nato.int
Roberts J.P. (2007). Comparison of Tip Timing with strain gauges for rotor blade vibration
measurement. In: Proceedings of Lecture Series on Tip Timing and Tip Clearance
Problems in Turbomachines. Von Karman Institute. Belgium
Rokicki, E.; Weryński, P.; Szczepanik, R.; Spychała, J.; Michalak, S.; Perz, M. & Przysowa, R.
(2007). A differential antenna (in Polish). Patent application no. P381806
Ross, M.M. (2007). The Potentials Of Tip Timing / Tip Clearance Measurements. The Land
Based Power Plant Perspective. In: Tip Timing and Tip Clearance Problems in
Turbomachines. 2007. VKI LS 2007-03, von Karman Institute, Belgium.
Rushard, P. (2010) A Process for the Application of Blade Tip Timing Measurements on a
Gas Turbine. Proceedings of ISA International Instrumentation Symposium, May 2010,
Rochester, NY USA
Shephard, D.; Tait, P. & King, R. (2000). Foreign Object Detection Using Radar. In: Aerospace
Conference Proceedings, IEEE, Volume: 6, pp. 43-48
Szczepanik, R. & Witoś, M. (1998). A computer diagnostic system for turbojet engines based
on the discrete phase method for measurement of blade vibration (in Polish). In:
Output of Aviation Institute, No. 1 (152), p. 135-149.
Wagner, M. (1998). Novel microwave vibration monitoring system for industrial power
generating turbines. Proceedings of Microwave Symposium Digest, IEEE MTT-S
International, pp.1211-1214 vol.3
Wenger, J. (1997). An MMIC-based microwave sensor for accurate clearance measurements
in aircraft engines. Proceedings of 27th European Microwave Conference and Exhibition.
Vol. 2, pp. 1122-1126
Witoś, M. (1994). A Non-Contact Technique of Vibration Measurement Applied to Health
Monitoring of Compressor Blades in a Turbine Engine (in Polish), PhD Thesis, Air
Force Institute of Technology (ITWL), Warsaw
Witoś, M. (1999). Blade vibration as a symptom for condition monitoring of aircraft engines.
In: Issues of testing and operation of avionic equipment. Air Force Institute of
Technology (ITWL), Warsaw, vol. 4, pp. 297-315
Witoś, M. & Szczepanik, R. (2005). Turbine Engine Health/Maintenance Status
Monitoring with Use of Phase-Discrete Method of Blade Vibration Monitoring,
Proceedings of Symposium on "Evaluation, Control and Prevention of High Cycle
Fatigue in Gas Turbine Engines for Land, Sea and Air Vehicles. RTO-MP-AVT-121-
02. Granada, October 2005
Witoś, M. (2007). Theoretical Foundations of Tip Timing Measurements. Proceedings of
Lecture Series on Tip Timing and Tip Clearance Problems in Turbomachines. Von
Karman Institute. Belgium
Zablockij, I. E.; Korostiliew, J.A. & Szipow, R.A. (1977). Non-contact blade vibration
measurement in turbomachinery (in Russian). Maszinostrojenije. Moscow
Zielinski, M. & Ziller, G. (2005). Noncontact Blade Vibration Measurement System for Aero
Engine Application. Proceedings of 17th International Symposium on Airbreathing
Engines, September, 2005. Munich, Germany, Paper No. ISABE-2005-1220
www.intechopen.com

Thermal Power Plants
176
hółtowski, B. (1984). Design of experiments in machinery diagnostics (in Polish), In: Scentific
dissertations, WSO Toruń, Vol. No. 1, pp. 61-64, Toruń
www.intechopen.com

Thermal Power PlantsEdited by Dr. Mohammad Rasul
ISBN 978-953-307-952-3Hard cover, 266 pagesPublisher InTechPublished online 13, January, 2012Published in print edition January, 2012
InTech EuropeUniversity Campus STeP Ri Slavka Krautzeka 83/A 51000 Rijeka, Croatia Phone: +385 (51) 770 447 Fax: +385 (51) 686 166www.intechopen.com
InTech ChinaUnit 405, Office Block, Hotel Equatorial Shanghai No.65, Yan An Road (West), Shanghai, 200040, China
Phone: +86-21-62489820 Fax: +86-21-62489821
Thermal power plants are one of the most important process industries for engineering professionals. Over thepast few decades, the power sector has been facing a number of critical issues. However, the mostfundamental challenge is meeting the growing power demand in sustainable and efficient ways. Practicingpower plant engineers not only look after operation and maintenance of the plant, but also look after a rangeof activities, including research and development, starting from power generation, to environmentalassessment of power plants. The book Thermal Power Plants covers features, operational issues, advantages,and limitations of power plants, as well as benefits of renewable power generation. It also introduces thermalperformance analysis, fuel combustion issues, performance monitoring and modelling, plants healthmonitoring, including component fault diagnosis and prognosis, functional analysis, economics of plantoperation and maintenance, and environmental aspects. This book addresses several issues related to bothcoal fired and gas turbine power plants. The book is suitable for both undergraduate and research for higherdegree students, and of course, for practicing power plant engineers.
How to referenceIn order to correctly reference this scholarly work, feel free to copy and paste the following:
Ryszard Szczepanik, Radosław Przysowa, Jarosław Spychała, Edward Rokicki, Krzysztof Kaz ́mierczak andPaweł Majewski (2012). Application of Blade-Tip Sensors to Blade-Vibration Monitoring in Gas Turbines,Thermal Power Plants, Dr. Mohammad Rasul (Ed.), ISBN: 978-953-307-952-3, InTech, Available from:http://www.intechopen.com/books/thermal-power-plants/application-of-blade-tip-sensors-to-blade-vibration-monitoring-in-gas-turbines

© 2012 The Author(s). Licensee IntechOpen. This is an open access articledistributed under the terms of the Creative Commons Attribution 3.0License, which permits unrestricted use, distribution, and reproduction inany medium, provided the original work is properly cited.