application of elastic-wave tomography to repair
TRANSCRIPT
Hashimoto, K. et al.
Paper:
Application of Elastic-Wave Tomography to Repair Inspectionin Deteriorated Concrete Structures
Katsufumi Hashimoto†, Tomoki Shiotani, Takahiro Nishida, and Toyoaki MiyagawaGraduate School of Engineering, Kyoto University
Nishikyo-ku, Kyoto 615-8540, Japan†Corresponding author, E-mail: [email protected]
[Received September 12, 2016; accepted May 2, 2017]
Currently, it is highly important to establish economi-cal and efficient management systems for existing con-crete infrastructures, in order to fulfil their service de-sign lives and even to extend them. Severe deteriora-tion in aging infrastructure is currently found to bea critical issue. For repairing deteriorated and dam-aged structures, large budgets are necessary, but bud-getary restrictions are often imposed. As a result, pre-ventive and proactive maintenance of infrastructureis desired, and inspections by non-destructive testing(NDT) methods must be applied. In terms of damageassessment and estimation of repair and retrofit recov-ery in concrete structures, in addition to current NDT,innovative methods must be established. For crackrepair methods applied to the existing structures, in-spection techniques to assess repair installations havenot yet been practically developed. There are manyreports that improper repair efforts have resulted inre-deterioration. Although epoxy injection and patchrepair methods are widely implemented to refill inter-nal cracks from the concrete surface, it is found inmost cases that internal defects remain unknown andpotentially could lead to the re-deterioration. There-fore, inspection methods to visualize internal defectsin concrete must be readily implemented as a counter-measure for repair works. In the present study, theevaluation of repair effectiveness was performed in areinforced concrete (RC) pier and a concrete wall inan existing structure. As an innovative NDT method,elastic-wave tomography is applied to evaluate three-dimensional (3D) velocity distribution before and af-ter the repair. Penetration of the repair material andthe increase in velocity due to the repair effect arevisually and quantitatively identified. Additionally, a3D tomography technique for one-side access is newlyproposed, using drill-hammring to generate an elasticwave. Accordingly, the internal quality of concrete af-ter patch repair is successfully visualized by the elasticwave velocity distribution.
Keywords: elastic wave, wave velocity distribution, to-mography, repair method
1. Introduction
It is generally recognized that preventive and proac-tive maintenance works are necessary for such infrastruc-ture as bridges and tunnels. For reinforced concrete (RC)members, essential issues include establishing a mainte-nance system with the appropriate measures prior to ex-tensive damage and failure. In order to repair and re-strengthen RC members, epoxy injection and patch re-pair methods have been widely and practically employed.However, because inspection techniques to estimate thequality of repair and recovery are still under develop-ment, insufficient repair works are often reported, andthese works have potentially resulted in re-deterioration.
To quantify or assure the repair and retrofit recovery, itis necessary to develop non-destructive testing (NDT) andevaluation (NDE) methods for concrete structures. There-fore, a technical committee on innovative NDT for repairand retrofit recovery was established by the InternationalUnion of Laboratories and Experts in Construction Ma-terials, Systems, and Structures (RILEM) [1]. In asso-ciation with the committee’s activities, we are studyingtomography techniques based on elastic-wave and acous-tic emission (AE) to visualize, in three dimensions, inter-nal defects in concrete. The applicability of these tech-niques has already been reported as elastic-wave tomog-raphy [2, 3] and AE tomography [4–6].
Through the tomography technique, internal distribu-tions are obtained using elastic-wave parameters such asamplitudes and elastic-wave velocities. In this study,elastic-wave velocity is used as a parameter. In elastic-wave tomography, both the location of the excitation andthe excitation time are known, whereas they are unknownfor AE tomography. Specifically, tomography can evalu-ate the elastic-wave velocity in each set-element over thestructure, which is theoretically associated with the mod-ulus of elasticity. Because of the presence of such inter-nal defects as cracks and voids, the values of the moduliwould vary as low-velocity zones.
Theoretically, the elastic waves are reflected, diffracted,and scattered inside media with defects such as voids andcracks. The effect results in a decrease in elastic-wavevelocity. Thus, it can reasonably be assumed that thezones of lower elastic-wave velocity correspond to thoseof heavier deterioration. Accordingly, the distribution of
496 Journal of Disaster Research Vol.12 No.3, 2017
https://doi.org/10.20965/jdr.2017.p0496
© Fuji Technology Press Ltd. Creative Commons CC BY-ND: This is an Open Access article distributed under the terms of the Creative Commons Attribution-NoDerivatives 4.0 International License (http://creativecommons.org/licenses/by-nd/4.0/).

Application of Elastic-Wave Tomography to Repair Inspectionin Deteriorated Concrete Structures
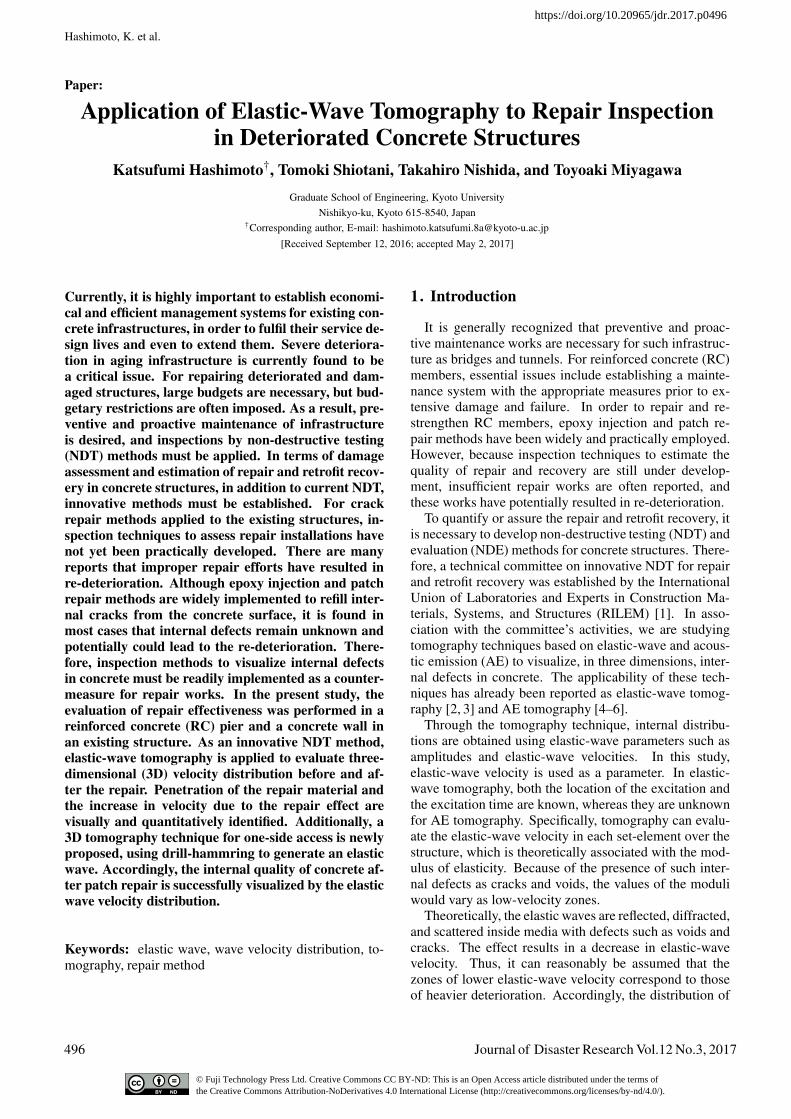
Fig. 1. Overview of concrete pier.
wave velocities can be referred to as a good indicator ofthe internal condition of a concrete structure.
In the present study, the effects of repairs in concretewere evaluated by means of innovative NDT with three-dimensional (3D) elastic-wave tomography. The effec-tiveness of the repair works with the epoxy injection andpatch repair methods was visually identified. 3D tomog-raphy was applied to a 50-year-old concrete pier, in whichcracks were epoxy-injected with the inside-pressure hard-ening system, as well as to a 53-year-old concrete wall,which was repaired by the patch repair method.
As described here, although the epoxy injection andpatch repair methods are major repair methods even with-out corrosion of the reinforcing bars, there are many re-ports indicating re-deterioration with insufficient repairs.This study aims to validate the 3D elastic-wave tomog-raphy technique for inspection of the internal quality ofconcrete after repair.
1.1. Concrete PierFigure 1 shows a concrete pier specimen with di-
mensions of 600-mm width, 1200-mm height, and 300-mm thickness. For epoxy injection, 93 components ofsyringe-type caulking guns were applied into pots for in-jection. AE sensors with 50-kHz resonance were arrangedto record elastic waves, immediately before the injectionand 7 days after injection, corresponding to the epoxy-resin hardening period.
AE sensors were attached to all four sides of the pier.Twelve sensors were arranged on sides A and B in a600 mm×1200 mm area as shown in Fig. 2. Four sensorswere installed on the other sides as shown in the figure.
Fig. 2. Sensor arrangement.
A steel ball, 25 mm in diameter, was used for excitation.Each excitation point was selected at the closest sensorlocation to identify the impact time.
1.2. Concrete WallFor the concrete wall of dimensions 600 mm×600 mm
shown in Fig. 3, the patch repair method was applied.Surface cracks with water leakage were observed in thetunnel-lining concrete so that V-shaped removal of theconcrete lining was first performed, with 80-mm depthand 120-mm width. Then, the crack was filled with poly-mer cement mortar with a water-to-cement ratio W/C =25%. One-sided access measurement of elastic waves wasperformed to detect signals generated inside the concrete,which was driven by means of micro-core drilling andhammering. Specifically, micro-coring of 12-mm diam-eter was performed up to 200-mm depth in the tunnel-lining concrete so as to create a bit hole. A steel bar of6-mm diameter with a curved edge was inserted into thehole, and at the head, the steel bar was hit by a spher-ical steel ball of 25-mm diameter. Because hammeringthe steel bar was performed so as not to touch the wallof the hole, elastic waves could only be generated at theend of the hole in the direction of the depth. AE sen-sors with 60-kHz resonance were employed to record theelastic waves. Fig. 4 shows the sensor arrangements andexcitation points.
2. Data Analysis
In order to determine the velocity distributions by to-mography, the following analytical steps are taken.
First, the arrival time at each sensor was determinedwith an Akaike Information Criterion (AIC) picker [7, 8].
Journal of Disaster Research Vol.12 No.3, 2017 497

Hashimoto, K. et al.
Fig. 3. Overview of concrete wall.
Fig. 4. Locations of drilling and sensor arrangement.
For the digitized wave record xk of length N, the AICvalue is defined as
AIC(k) = k× log{
var(x[1,k]
)}+(N − k−1)∗ log
{var
([k +1,N]
)}, (1)
where var(x[1, k]) indicates the variance between x1 andxk, and var(x[k, N]) is the variance between xk and xN .
The point where the AIC value is minimized with theleast-square method corresponds to the optimal separationpoint of two stationary time series, and thus the arrivaltime is reasonably determined as the phase onset by theAIC picker. This is because noise could be represented bylower AIC values, whereas wave signals generally showhigher AIC values.
Next, from the determined arrival time, the velocity ofthe elastic wave is calculated. The observed propagation
Fig. 5. Slowness for calculation of propagation time.
time Tobs is obtained by [9]
Tobs = To −Ts, . . . . . . . . . . . . . (2)
where Ts is the time of excitation and To is the arrival time.In the elastic-wave tomography algorithm, the recipro-
cal of the velocity is referred to as the “slowness,” whichis given as an initial parameter into each element as shownin Fig. 5. The theoretical propagation time Tcal is de-rived from the total of the propagation time calculated bythe slowness and the distance in each element (refer toEq. (3)). The difference between the observed propaga-tion time (Tobs) and the theoretical propagation time (Tcal)is obtained by Eq. (4).
Tcal = ∑j
s j ∗ l j. . . . . . . . . . . . (3)
ΔT = Tobs −Tcal , . . . . . . . . . . . (4)
where l j is the length crossing each element and s j is theslowness of each element.
Then, the slowness in each element is revised in orderto reduce the difference between the observed propagationtime and the theoretical propagation time. The amount ofthe slowness correction is calculated by Eq. (5). Conse-quently, the revised slowness is obtained by Eq. (6).
⎡⎢⎢⎣
Δs1Δs2
...Δs j
⎤⎥⎥⎦ =
⎡⎢⎢⎢⎢⎢⎢⎢⎢⎢⎢⎢⎢⎣
∑i
ΔTi ∗ li1Li
/∑
ili1
∑i
ΔTi ∗ li2Li
/∑
ili2
...
∑i
ΔTi ∗ li j
Li
/∑
ili j
⎤⎥⎥⎥⎥⎥⎥⎥⎥⎥⎥⎥⎥⎦
. . . . (5)
s′j = s j +Δs j, . . . . . . . . . . . . . (6)
where Li is the total distance of wave propagation throughthe i-element.
The iteration procedure in Fig. 6 based on Eq. (5) andEq. (6) is used to determine the optimal slowness andeventually the velocity in each element corresponding tothe observed propagation times of multiple paths over thestructure. Thus, the velocity distribution is determined.
In order to determine the ray path more accurately, theray-trace algorithm is applied, taking into account detoursof elastic waves due to reflection and diffraction. In par-
498 Journal of Disaster Research Vol.12 No.3, 2017

Application of Elastic-Wave Tomography to Repair Inspectionin Deteriorated Concrete Structures
Fig. 6. Analytical procedure for 3D tomography.
ticular, the arrival time of each wave is obtained by usinga 3D ray-trace algorithm extended from a 2D ray-trace,which was proposed in previous research [10]. The slow-ness of each element is corrected from the difference be-tween the first travel time observed and that computed inthe 3D element, because the algorithm enables the use of3D finite elements for meshing the target space.
For the tomography results, wave velocities of2000 m/s to 4500 m/s are given, as referred in the au-thors’ previously published research. Although the elasticwave velocity in intact concrete is assumed to be 4000 m/s(original value), it is little wonder that the velocity in dete-riorated (cracked) concrete is reduced to 2000 m/s, at leastwhen considering the velocity in air (approx. 300 m/s)and water (approx. 1500 m/s).
3. Results and Discussion
3.1. Concrete Pier
3.1.1. Observation of Epoxy Injection Results
First, to confirm the epoxy-injected situation, blacklight (ultraviolet light) was irradiated on the cored sam-ple so that the injected material (epoxy resin) appeared inblue as shown in Fig. 7. These photographs show thatepoxy resin was successfully injected into the concretecover (10 cm) and over the depth of the reinforcing bars(10 to 15 cm). In addition, it is known that this mate-rial with the injection method can penetrate cracks evensmaller than 0.1 mm in width [11].
(a) Cored sample A under black light irradiation
(b) Cored sample B under black light irradiation
Fig. 7. Observation of injected epoxy resin.
3.1.2. 3D Elastic Wave TomographyThe results of elastic-wave tomography before and af-
ter epoxy injection are shown in Fig. 8. The methodfor injection repair is shown in Fig. 9. As can be seen,the wave velocities after the repair are clearly higherthan those before. The velocities of the whole area arehigher than approximately 3000 m/s. This implies thatthe epoxy injected from the surface of the pier could befilled and hardened inside cracks. However, wave ve-locities at the central portions of the concrete pier arestill lower than 2500 m/s. Thus, it is found that the re-pair by epoxy injection strengthens only the shallow zone.With 3D elastic-wave tomography, the velocity distribu-tion shows the conditions inside the concrete, in particu-lar, whether the epoxy is penetrated completely into theinternal cracks. It is noted that the tomography techniquecould assess the quality of the repair, which is not esti-mated or visible on the exterior.
A histogram of the wave velocities before and after therepair is shown in Fig. 10. It is clearly observed that themean value after the repair is higher than that before, andthe variation becomes smaller. After the repair, concretein the pier is surely re-strengthened, because velocitieslower than 2500 m/s are rarely observed in the histogram.
Journal of Disaster Research Vol.12 No.3, 2017 499

Hashimoto, K. et al.
Fig. 8. Results of elastic-wave tomography in 3D.
3.1.3. Amount of Epoxy Injection and Shift of WaveVelocities
Out of the 93 pots where syringe-type caulking gunswere applied, the results at Side A (the front surface inFig. 8) and those at Side B (the back surface in Fig. 8)are shown in Fig. 11 and Fig. 12, respectively. Note thatonly the tomograms of wave velocities before and afterthe repair at the surface layer are shown, to compare withthe amount of epoxy injection. In the figures, because thecaulking guns were replaced and refilled with epoxy un-til the injection was automatically stopped in this method,pots where additional syringe refilling were applied arecolored in red. In addition, the total amount of epoxy in-jection is presented with contour lines with the minimumcurvature approximation.
Fig. 9. Repair by epoxy injection.
Fig. 10. Histogram of wave velocities.
From Figs. 11 and 12, it is found that a shift inthe velocity distribution reasonably indicates the amountof epoxy injection. The improvement of the concreteproperty estimated by the velocity recovery is surelyconfirmed according to the amount of epoxy injection.In particular, relatively high-velocity areas improved inFigs. 11(d) and 12(d) are observed in the areas where ad-ditional injection was performed because of heavy dete-rioration (colored in red in Figs. 11(d) and 12(d)). Itis noted that less improvement in areas of low wave ve-locities are observed even after the repair at the bottom-right corner of side A (see Fig. 11), where the epoxy resinprobably did not penetrate sufficiently into the concretebecause of lower internal crack connectivity.
500 Journal of Disaster Research Vol.12 No.3, 2017

Application of Elastic-Wave Tomography to Repair Inspectionin Deteriorated Concrete Structures
Fig. 11. Results of wave velocities and amount of epoxyinjection (Side A).
3.2. Concrete WallThe above-mentioned 3D elastic wave tomography
technique was challengingly applied to confirm the effectof a patch repair on an existing concrete wall structure.In this study, the technique was introduced as a methodto evaluate the retrofit recovery because there is no NDTtechnique applicable in-situ for the case targeted in thepresent study.
3.2.1. Procedures of Drilling and ExcitationWith the aid of micro-core drilling, excitation was
driven inside the concrete. The technique applied is de-signed to be useful in one-side access inspection cases.
Fig. 12. Wave velocity and epoxy injection result (Side B).
The test procedure is schematically illustrated in Fig. 13.In a concrete wall with a surface crack (a), a V-cut is per-formed (b). Then, a patch repair is made with grouting(c). At the concrete surface, a bit hole of 200-mm depthand 12-mm diameter is drilled by micro-coring (d). Fol-lowing the sensor arrangement at the surface (e), a steelbar with 6 mm diameter is inserted into the bit hole, andthe head of the steel bar is hit by a steel ball of 25-mmdiameter.
Because careful hammering was performed at the headof the steel bar to prevent the bar from contacting thewall of the hole, the excited elastic waves propagated onlyfrom the bottom of the bit hole into the lining concrete.The excited signals were finally detected by sensors in-stalled on the concrete surface.
Journal of Disaster Research Vol.12 No.3, 2017 501

Hashimoto, K. et al.
Fig. 13. Procedures of drilling and excitation.
Fig. 14. Measurement method of travel time in the steel bar.
3.2.2. Propagation of Waves in the BarThe travel time in the steel bar was monitored by means
of two sensors, as shown in Fig. 14. The excitation timeat the head by using a steel ball of 15-mm diameter wasrecorded by an AE sensor at A, and the travel time of thebar is obtained by the arrival time of the wave at AE sen-sor B. As shown in Fig. 15, the difference of arrival timesis observed as 69 μs, which is applied as the correction ofthe arrival time of each elastic wave at the concrete sur-face.
According to [12], the dominant frequency of excita-tion by a steel ball of 15-mm diameter is obtained as
Fig. 15. Waveforms at excitation and receiver.
19.4 kHz. To consider the effect of using a steel baras a wave guide, a frequency analysis was conducted onthe waveforms detected at A and B. The frequency spec-tra are shown in Fig. 16. Because guided waves are tobe detected for the 38-mm steel bar of the setting, thedominant frequency from detection at A was observedat 22.5 kHz, instead of 19.4 kHz. In the case of detec-tion at B, the dominant frequency was 16.6 kHz. Becausethis frequency is higher than the resonant frequencies ofthe first flexural mode, the second flexural mode, and thethird flexural mode of 1.1 kHz, 3.2 kHz, and 5.4 kHz, re-spectively, as a cantilever, the principal components of thewaveform were to be generated by the compression waveexcited by the tapping.
3.2.3. 3D Elastic-Wave TomographyThe distributions of wave velocities in the concrete wall
were evaluated by the tomography technique mentionedpreviously. Fig. 17 shows the distribution of wave ve-locities in three dimensions, Fig. 18 shows them at crosssection A.
Although the triangle-shaped repair area has high ve-locity on the surface, the V-shaped low-velocity area isconfirmed toward the bottom. Interestingly, at the left
502 Journal of Disaster Research Vol.12 No.3, 2017

Application of Elastic-Wave Tomography to Repair Inspectionin Deteriorated Concrete Structures
Fig. 16. Frequency spectra of waveforms at A and B.
side of the specimen, highvelocity zones exist. This maycorrespond to the intact condition of the original concretewall, because the zones are enough far from the repairedarea.
In Fig. 18, the repaired area is denoted as a high-velocity area, whereas the original concrete area outsidethe patched part remarkably shows a low-velocity distri-bution. The V-shaped area with low velocity could becaused by the chipping work for concrete removal, whichis also noted in a guideline for concrete surface treatmentprior to repairs and overlays [13, 14]. This suggests fur-ther investigation of the influence of the hammer-drill im-pact on damage to the concrete behind the removal zone.
4. Conclusion
The concrete pier and the concrete wall were tested toinvestigate the internal damage and assess the repairedcondition by applying elastic-wave tomography. By der-mining the 3D velocity distribution before and after therepair, the effects of the epoxy injection method and thepatch repair method were quantitatively evauated. Fromthe results, the following conclusions can be drawn in thisstudy:
1) It is confirmed that the 3D elastic-wave tomography
Fig. 17. Distribution of wave velocities in 3D.
Fig. 18. Distribution of wave velocities at cross section A.
technique enables evaluation of the repair materialpenetration and qualifies the repair effect.
2) The one-side access 3D tomography technique withdrill-hammring could successfully visualize the inte-nal quality of concrete after the patch repair methodby the distribution of elastic-wave velocities.
As mentioned previously, the RILEM committee waslaunched because innovative non-destructive inspectiontesting to qualify repair works is strongly required world-wide. We plan to continue studies based on the evaluationmethod using elastic-wave tomography and accelerate itsstandardization.
Journal of Disaster Research Vol.12 No.3, 2017 503

Hashimoto, K. et al.
AcknowledgementsWe would like express our sincere appreciation and deep gratitudeto Dr. Masayasu Ohtsu, Professor Emeritus of Kyoto University,for his insightful suggestions in interpreting the significance of theresults of this study.
References:[1] “Damage assessment in Consideration of Repair/ Retrofit-
Recovery in Concrete and Masonry Structures by Meansof Innovative NDT,” Technical Committee IAM, RILEM,http://www.rilem.org/gene/main.php?base=8750&gp id=347 [ac-cessed August 26, 2016]
[2] Y. Kobayashi, T. Shiotani, and H. Shiojiri, “Damage identifica-tion using seismic travel time tomography on the basis of evolu-tional wave velocity distribution model,” Structural Faults and Re-pair 2006 (CD-ROM), 2006.
[3] Y. Kobayashi, T. Shiotani, D. G. Aggelis, and H. Shiojiri, “Three-Dimensional Seismic Tomography for Existing Concrete Struc-tures,” Proc. of Second Int. Operational Analysis Conf., Vol.2,pp. 595-600, 2007.
[4] Y. Kobayashi and T. Shiotani, “Seismic tomography with estima-tion of source location for concrete structure,” Structural Faults andRepair 2012, CD-ROM, 2012.
[5] T. Shiotani, N. Okude, S. Momoki, and Y. Kobayashi, “Proposalof assessment method for infrastructures by AE tomography,” Proc.of 2011 National Conf. on Acoustic Emission, pp. 39-42, 2011 (inJapanese).
[6] H. Asuae, T. Shiotani, T. Nishida, K. Watabe, and H. Miyata,“Applicability of AE Tomography for Accurate Damage Evalua-tion in Actual RC Bridge Deck,” Structural Faults & Repair Conf.,No.1743, 2016.
[7] H. Akaike, “Markovian representation of stochastic processes andits application to the analysis of autoregressive moving average pro-cesses,” Annals of the Institute of Statistical Mathematics, Vol.26,No.1, pp. 363-387, 1974.
[8] H. Zhang, C. Thurber, and C. Rowe, “Automatic P-Wave ArrivalDetection and Picking with Multiscale Wavelet Analysis for Single-Component Recordings,” Bulletin of the Seismological Society ofAmerica, Vol.93, No.5, pp. 1904-1912, 2003.
[9] S. Osawa, T. Shiotani, H. Kitora, and Y. Momiyama, “Dam-age Visualization of Imperfectly-Grouted Sheath in PC Struc-tures,” 31st Conf. of the European Working Group on AcousticEmission, German Society for Non-Destructive, 2014, http://www.ewgae2014.com/portals/131/bb/fr1b3.pdf [accessed August 26,2016]
[10] K. Sassa, Y. Ashida, T. Kozawa, and M. Yamada, “Improvement inthe Accuracy of Seismic Tomography by use of an Effective Ray-Tracing Algorithm,” MMIJ/IMM Joint Symposium Volume Papers,pp. 129-136, 1989.
[11] Kikusui Chemical Industries Co., Ltd., Inside Pressure Hardening,http://www.kikusui-chem.co.jp/pdf/products/catalog/cat iph 3.pdf[in Japanese, accessed August 26, 2016]
[12] M. J. Sansalone and W. B. Streett, “Impact-Echo, CNondestructiveEvaluation of Concrete and Masonry,” Bullbrier Press Ithaca, N.Y.,pp. 29-46, 1997.
[13] “Best Practices for Preparing Concrete Surfaces Prior to Repars andOverlays,” U.S. Department of the Interior Bureau of Reclamationtechnical Service Center, 2012.
[14] Concrete Paving Technlogy, “Guideline for Partial-Depth Spall Re-pair,” American Concrete Pavement Association, 1998.
Name:Katsufumi Hashimoto
Affiliation:Lecturer, Department of Civil and Earth Re-sources Engineering Graduate school of Engi-neering, Kyoto University
Address:Katsura Canpus, Kyoto University, Nishikyo, Kyoto 615-8540, JapanBrief Career:2011-2016 Assistant Professor, Graduate School of Eng., HokkaidoUniversity2012-2013 Visiting researcher, Department of Materials Science andEngineering, The University of Sheffield, UK2016-Present Lecturer, Graduate School of Eng., Kyoto UniversitySelected Publications:• K. Hashimoto, N. Otsuki, T. Saito, and H. Yokota, “Application ofElectrical Treatment to Alteration of Cementitious Material due toLeaching,” Advanced Concrete Technology, Vol.11, pp. 108-118, 2013.Academic Societies & Scientific Organizations:• Japan Society of Civil Engineering (JSCE)• Japan Concrete Institute (JCI)• Japan Society for Non-Destructive Inspection (JSNDI)• RILEM
Name:Tomoki Shiotani
Affiliation:Professor, Department of Civil and Earth Re-sources Engineering, Graduate School of Engi-neering, Kyoto University
Address:Katsura Canpus, Kyoto University, Nishikyo, Kyoto 615-8540, JapanBrief Career:2007-Assoc. Professor, Graduate School of Eng., Kyoto University2014-Professor, Graduate School of Eng., Kyoto UniversitySelected Publications:• T. Shiotani, “Recent advances of AE technology for damage assessmentof infrastructures,” J. of Acoustic Emission, Vol.30, pp. 76-99, 2013.Academic Societies & Scientific Organizations:• Chairman of AE Division, Japanese Society of Non-Destructive Testing• Past-Chairman and Award Committee Chairman of Acoustic EmissionWorking Group, USA• A Founder and Secretary General, International Institute of InnovativeAcoustic Emission• Chairman, RILEM TC-IAM “Damage assessment in Consideration ofRepair/ Retrofit-Recovery in Concrete and Masonry Structures by Meansof Innovative NDT”• Secretary, RILEM 239TC-MCM (-2015), RILEM 212-TC-ACD(-2010)• Convener, ISO/TC-135/SC9/WG4• Editorial Board, Journal of Acoustic Emission
504 Journal of Disaster Research Vol.12 No.3, 2017

Application of Elastic-Wave Tomography to Repair Inspectionin Deteriorated Concrete Structures
Name:Takahiro Nishida
Affiliation:Associate Professor, Department of Civil andEarth Resources Engineering, Graduate Schoolof Engineering, Kyoto University
Address:Katsura Canpus, Kyoto University, Nishikyo, Kyoto 615-8540, JapanBrief Career:2002-2007 Assistant professor, Tokyo Institute of Technology2007-2011 Central Research Institute of Electric Power Industry2011-2012 Port and Airport Research Institute2012-2015 Assistant professor, Tokyo Institute of Technology2015- Associate professor, Kyoto UniversitySelected Publications:• T. Nishida, N. Otsuki, H. Ohara, Z. Garba-Say, and T. Nagata, “SomeConsiderations for the Applicability of Seawater as Mixing Water inConcrete,” ASCE J. of Materials in Civil Engineering, Vol.27, Issue 7,July, 2015.Academic Societies & Scientific Organizations:• International Union of Laboratories and Experts in ConstructionMaterials, Systems and Structures (RILEM)• Japan Society of Civil Engineers (JSCE)• Japan Concrete Institute (JCI)• Japanese Society for Non-Destructive Inspection (JSNDI)• Society of Materials Science, Japan (JSMS)
Name:Toyoaki Miyagawa
Affiliation:Professor Emeritus, Center for the Promotion ofInterdisciplinary Education and Research, KyotoUniversity
Address:Katsura Canpus, Kyoto University, Nishikyo, Kyoto 615-8540, JapanBrief Career:1991-1998 Associate Professor, Graduate School of Eng., KyotoUniversity1998-2015 Professor, Graduate School of Eng., Kyoto University2016-Present Professor Emeritus, Center for the Promotion ofInterdisciplinary Education and Research, Kyoto UniversitySelected Publications:• T. Miyagawa, K. Seto, K. Sasaki, Y. Mikata, and K. Kuzume, “Fractureof reinforcing steels in concrete structures damaged by alkali-silicareaction – Field survey, mechanism and maintenance,” Advanced ConcreteTechnology, Vol.4, pp. 339-355, 2006.Academic Societies & Scientific Organizations:• Japan Society of Civil Engineering (JSCE)• Japan Concrete Institute (JCI)• Japan Society of Materials Science (JSMS)• Japan Cement Association (JCA)• Architectural Institute of Japan (AIJ)• Japan Society of Corrosion Engineering• Japan Prestressed Concrete Engineering Association
Journal of Disaster Research Vol.12 No.3, 2017 505
Powered by TCPDF (www.tcpdf.org)