application of fracture mechanics to concrete : summary of
TRANSCRIPT
LUND UNIVERSITY
PO Box 117221 00 Lund+46 46-222 00 00
Application of fracture mechanics to concrete : summary of a series of lectures 1988
Hillerborg, Arne
1988
Link to publication
Citation for published version (APA):Hillerborg, A. (1988). Application of fracture mechanics to concrete : summary of a series of lectures 1988.(Report TVBM; Vol. 3030). Division of Building Materials, LTH, Lund University.
Total number of authors:1
General rightsUnless other specific re-use rights are stated the following general rights apply:Copyright and moral rights for the publications made accessible in the public portal are retained by the authorsand/or other copyright owners and it is a condition of accessing publications that users recognise and abide by thelegal requirements associated with these rights. • Users may download and print one copy of any publication from the public portal for the purpose of private studyor research. • You may not further distribute the material or use it for any profit-making activity or commercial gain • You may freely distribute the URL identifying the publication in the public portal
Read more about Creative commons licenses: https://creativecommons.org/licenses/Take down policyIf you believe that this document breaches copyright please contact us providing details, and we will removeaccess to the work immediately and investigate your claim.
Download date: 19. Feb. 2022

DIVISION OF BUILDING MATERIALS LUND INSTITUTE OF TECHNOLOGY
APPLICATION OF FRACTURE MECHANICS TO CONCRETE Summary of a series of lectures 1988
Arne Hillerborg
REPORT TVBM - 3030 LUND SWEDEN 1988

GODEN: LUTYDG/(TYBM-3030)/1-28/(1988)
APPLICATION OF FRACTURE MECHANICS TO CONCRETE Summary of a series of lectures 1988
Arne Hillerborg
ISSN 0348-7911
REPORT TYBM-3030 LUND SWEDEN 1988

APPLICATION OF FRACTURE MECHANICS TO CONCRETE
with emphasis on the work performed at Lund Inst. of Tech.
Arne Hillerborg, Div. of Building Materials, Lund Inst. of Tech.,
Lund, Sweden.
Abstract
Different approaches to the application of fracture mechanics to
concrete are discussed, with an emphasis on the models based on
strain softening and strain localization, particularly the ficti
tious crack model. Examples of results of the theoretical analyses
are demonstrated, and some practical conclusions are drawn. Future
research is also commented.
Introduction
Conventional fracture mechanics is mainly based on the theory of
elasticity and it is used for studying the stability and propagation
of existing cracks. The modern form of application of fracture
mechanics to concrete, which was first developed in Lund, differs
from the conventional fracture mechanics in both these respects.
In the basic form of conventional fracture mechanics it is assumed
that the stresses and strains tend towards infinit y at a crack tip,
Fig. 1. This is of cours e not realistic. In spite of this the
theoretical results based on this assumption in many cases lead to
realistic conclusions. In other cases this is not the case. This has
since long b~en recognized, and in conventional fracture mechanics
many methods have been advised to overcome this problem. Some of
these methods are similar to the methods now applied to concrete,
even though the re are fundamental differences.
The most important practical difference between conventional
fracture mechanics and the modern application to concrete is that
conventional fracture mechanics has never been applied to structures

2
without any initial crack, whereas the modern mode l can also be
applied to this case. It is now possible not only to study the
stability and propagation of a crack, but also its formation. Thus
the complete development of fracture can be analysed by means of one
model as a continuous process. This is an expansion of fracture
mechanics, which opens quite new possibilities to analyse fracture
of real structures, as will be demonstrated by means of examples.
This circumstance has been emphasized here, because it has not
always been fully appreciated. Thus for example the new approach is
sometimes described as a variant of the so called Dugdale-Barenblatt
model. Dugdale and Barenblatt never realised the possibility to use
this type of model for the analyses of uncracked structures. They
only intended their models as explanations of the stress situation
in the vicinity of the tip of an existing crack.
Conventional fracture mechanics
As a background for the understanding of the new model a short
description will be given of conventional fracture mechanics, parti
cularly linear elatic fracture mechanics, of ten written LEFM for
short.
If a stress is applied perpendicular to a crack with a sharp tip,
the linear elastic solution shows that a stress concentration will
appear at the tip, such that the stress approaches infinit y, Fig. 1.
Close to the crack tip the stress distribution is approximately
described by the equation
K a =
y /27rx
In this equation x is the distance from the crack tip and K is cal
led the stress intensity factor. This factor can be calculated from
the equation
K = Ya/a

3
O" - K / y - V2Ttx·
x
Fig. 1 stress distribution according to the theory of elasticity.
where a is the crack length (for a crack at an edge, or half the
crack length for an interior crack), G is the stress which would
have acted if there had been no crack, and Y is a dimensionless fac
tor, which depends on the type of structure, the loading conditions,
and to some extent to the crack length. The value of Y is of ten
approximately 2.
According to this formal stress distribution the stress within a
distance Xl exceeds the tensile strength f t . The stress distribution
cannot be valid within this part. The larger the value is of Xl'
the less accurate are the conclusions drawn by means of LEFM.
As the stress approaches infinit y, the analys is of crack stability
and crack propagation cannot be based on a comparison with the
strength of the material. Instead it is necessary to introduce a new
criterion, which says that the crack will start propagating when the
stress intensity factor K reaches a critical value, the critical
stress intensity Kc ' which is assumed to be a material property.
It can be noticed that conventional fracture mechanics can only
treat problems concerned with an existing crack, as Kbecomes zero
when the crack length a is zero. For uncracked material the ordinary
theory of strength of materials has to be used, with a comparison

4
between a stress and a strength as fracture criterion. This means
that different models have to be used for cracked and uncracked
material, with different fracture criteria and two different
material properties, Kc and strength. This lack of continuity is a
drawback, at least for materials like concrete.
An alternative treatment according to LEFM is based on the stress
release rate when a crack propagates, i e the amount of energy which
is released in the structure per unit crack area when the crack pro
pagates. An energy release rate G is theoretically calculated. The
crack i assumed to propagate if G reaches a critical value, the cri
tical energy release rate Gc ' which is equal to the amount of energy
that is absorbed in the fracture zone per unit area when the crack
grows. It can be demonstrated that the approaches by means of stress
intensity factors and energy release rates are equivalent, and that
they are coupled by means of the following relation for the case of
plane stress conditions.
It has long been recognised that the unrealistic assumption that the
stress and strain approaches infinit y can lead to erroneous results.
Many methods are used to make corrections in order to take into ac
count the limited strength of the material. These methods will not
be discussed here, as theyas a rule give results, which are not ac
curate enough for concrete structures of normal sizes.
The basis of the new approach.
The basic idea of the new approach is best demonstrated by means of
a discussion of the stress-deformation behaviour of a specimen in a
tension test, Fig. 2. It is assumed that complete stress-deformation
curves are recorded simultaneously by means of four gauges. Gauges
B, C, and D are of the same length and situated immediately af ter
each other, whereas gauge A has a length which is equal to the sum
of gauges B, C, and D.

5 A
~.-r..: ======'l==;;='.'i, = .. _ =:J=====~2 ~ c D
Fig. 2. Deformations along diffe
rent gauge lengths in atensile
test.
w
Fig. 3. General deformation
properties.
The test is assumed to be performed in deformation control, which
means that the deformation is slowly increased. During the first
phase of the test, the stress increases as the deformation increa
ses. This is said to be the ascending branch in the stress-deforma
tion diagram. If the specimen is assumed to be homogenuous, the
relative elongation during this phase is the same along the whole
specimen. This means that the deformation can be described by means
of a strain E, defined as the deformation divided by the gauge
length. The same stress-strain diagram is valid for the whole speci
men at this stage.
Af ter the peak stress has been reached, the post-peak stage, a fur
ther increase in deformation means that the stress decreases. We are
now on the descending branch in the diagram. The cause for the de
creasing stress is that the damage (microcracks) somewhere along the
bar has become so high, that any increase in deformation leadsto a
decreasing ability to transfer stresses. Within this damage zone or
fracture zone an increase in deformation takes place, at the same
time as the damage increases and the transferred stress decreases.
As the stress decreases due to the increasing damage within the
fracture zone, the parts outside this zone are unIoaded, and they

6
thus contract. At the post-peak stage an increase in the total
deformation corresponds to a decrease in deformation for most parts
of the specimen, but an increase in the deformation within the frac
ture zone. The term strain localization is of ten used to characteri
ze this behaviour. The increase in deformation is localized to the
fracture zone, whereas no further increase in strain takes part out
side this zone.
Another term, which is of ten used to describe the stress-deformation
at the post-peak stage is strain sOftening, which means that the
stress decreases as the average strain (or rather the deformation)
increases.
In Fig. 2 the stress-deformation curves from the fou~ gauges are
shown on the assumption that the fracture zone is situated within
gauge-length C. The sum of the deformations in gauges B, C and D is
equal to the deformation in gauge A.
From the figure it is evident that the curves from the different
gauges are different, with the exception of gauges B" and D, which
are equal. Thus the stress-deformation relation cannot be expressed
by a single curve, as this relation depends on the gauge-length and
on the position of the gauge with respect to the fracture zone. It
isthus not possible to find a general stress-strain curve for a
material, including the descending branch. This fact is of ten ne
glected. Many examples can be found in the litterature, where equa
tions for such stress-strain curves for concrete have been proposed.
A general description of the stress-deformation properties can be
given by means of two curves according to Fig. 3, one stress-strain
(G-E) curve for strains smaller than the stress at the peak point,
and one stress-deformation (G-w) curve for the additional deforma
tion w within the fracture zone, caused by the damage within this
zone. The general equation for the deformation 81 on a gauge length
l is then given by
~l = El + w

7
where E is taken from the ~-E-curve and w from the rr-w-curve. The
latter value is on ly used where there is a fracture zone within the
gauge length in question. In other cases it equals zero. In the
post-peak region the value of E is taken from the unIoading branch.
One essentiaI propert y of the ~-w-curve is the area below the curve,
as this area is a measure of the energy which is absorbed per unit
area of the fracture zone during a test to failure. This value is
usually called the fracture energy (more correct fracture energy per
unit area), and is denoted by GF .
For the behaviour of a specimen it is of importance how much of the
deformation that is due to the rr-E-curve, and how much that is due
to the G-w-curve. In other words it is important how these curves
are related to each other. One way of defining this relation is by
taking the ratio between a deformation equal to GF/ft from the G-w
curve and a .deformatio~ f t/E from the rr-E-curve. This yields a value
which is called the characteristic length Ich of the material
GF/ft corresponds to the maximum deformation w if the shape of the
curve had been a rectangle, whereas f t/E is the maximum strain if
the rr-E-curve were a straight line, see Fig. 4. The characteristic
length Ich is a material property,which cannot be directly measu
red, but which is calculated from the measured values of E, GF and
f t .
rr
Fig. 4.

8
The fracture zone.
The development of the fracture zone starts by the formation of
microcracks, which make this zone weaker. At this first stage the
zone may comprise a certain length in the stress direction, and the
additional deformation corresponds to the the sum of the additional
deformations within these microcracks.
As the deformation increases, it gets more and more localized, and
in reality practicallyall the additional deformation happens within
a narrow zone, which may best be described as an irregular crack,
which changes direction, bifurcates etc, depending on the inhomoge
nities of the material. Thus the width of the fracture zone (the
size in the stress direction) can be assumed to be practically zero.
One way of expressing this is simply to assume as a formal model
that the fracture zone is a crack with the width w and with the abi
lit Y to transfer stresses according to the IT-w-curve. A crack with
the ability to transfer stresses is of course no real crack, but
just a hypothetical model. It can therefore be said that the crack
is "fictitious". This model has been called the "fictitious crack
model". The model was first published by Hillerborg et al (1976),
and it has later been further developed and applied in many pUblica
tions, e g by Petersson (1981) and Gustafsson (1985).
However from the point of view of practical application it does not
matter whether the additional deformation in the fracture zone is
assumed to take part in a "fictitious crack" or if it is assumed to
be distributed on a certain length, as long as this length is small
in comparison with other dimensions of the structure. Thus there is
hardly any practical difference between the "fictitious crack
model", and the "crack band model" proposed by Bazant and Oh (1983),
where they assume a distribution on a length equal to 3 times the
maximum aggregat e size. These models are of ten implemented into a
finite element scheme in different ways, but this is another ques
tion, which will be commented upon later.

9
The concentration of the fracture zone to a thin band or a single
crack is typical for tensile fracture of concrete. It is not accom
panied by any significant lateral deformations or stresses, and thus
it corresponds to a very simple one-dimensional stress and deforma
tion state. Therefore the a-w-curve can be assumed to be a material
propert y, which is rather insensitive to the shape of the structure
and the general stress state, as long as all other stresses (e g a
possible perpendicular compressive stress) are low compared to the
strength.
For metals the stress state is much more complicated, as the yiel
ding of metals gives rise to a complicated three-dimensional stress
state and lateral deformations. Fracture mechanics of metals cannot
be treated with the same mode l that is used for concrete.
For concrete in compression the fracture zone also develops in
another way than in tension, as crushing is accompanied by lateral
deformations. The compression fracture is much more complicated than
tensile fracture. Some kind of descending rr-w-curve exists, but
probably it cannot be regarded to be a weIl defined material pro
perty. The maximum stress as weIl as the shape of the curve can be
expected to depend on e g confinement through stirrups or strain
gradients. The application of the fracture mechanics ideas to com
pressive fracture is still an unexplored but interesting domain. It
will only be very shortly commented upon at the end of this paper.
Material properties.
The stress-strain curve in tension for ordinary concrete deviates
rather little from a straight line. Thus for most practical applica
tions this relation can be assumed to be a straight line. All appli
cations so far seem to have been based on this assumption.
The stress-deformation curve corresponding to the descending branch
can be measured by means of modern test equipment. The shape of this
curve is now relatively weIl known. It has the general shape shown
in Fig. 5. One important parameter of the curve is the enclosed

Fig. 5. Ordinary shape
of the ~-w-curve for
concrete.
10
o 50 100 150 w[pml
area, which equals the fracture energy GF • Another important proper
ty may be the initial slope of the curve. This propert y and its
practical significance has not hitherto been studied in detail.
The fracture energy GF can suitably be determined by me ans of a
simple bending test on a notched beam according to a RILEM recommen
dation, Fig. 6. The load-deformation curve is recorded in the test.
The total energy, that is absorbed during the test, is equal to the
sum of the areas Al' A2 and A3 . Al is measured in the diagram, A2 is
calculated as F1·S0 , where Fl is a central force giving the same
bending moment as the weight of the beam and the loading equipment.
A3 is assumed to be equal to A2 . This total energy is divided by the
area b(h-a), that has been fractured, in order to get the value of
GF ·
Fig. 6. Test for the
determination of the
fracture energy GF according to RILEM
Recommendation (1985).
F

1 1
For normal concrete qualities the material parameters are within the
following ranges:
E = 20 - 40 GPa
GF = 65 -200 N/m
f t = 2 - 4 MPa
Ich = 0.1 - 1 m
The value of Ich can be expected to be lower for high strength conc
rete and for light weight concrete than for ordinary concrete, which
means that these materials are more brittle.
For fibre reinforced concrete the shapes of the IT-E- and IT-w-curves
may differ much from those for plain concrete. These curves then
have to be determined and introduced into the analyses for the
particular materials in question.
Application, principles.
Wherever tensile strains appear, which tend to pass the strain
corresponding to the peak point in the tensile stress-deformation
curve, a fracture zone starts to develop. Then the model outlined
above can be applied, which means that the IT-w-curve is applied to
the additional deformation in the fracture zone.
Let us as an example look at the bent beam in Fig. 7. At low loads
the simple beam theory can be used, which me ans that the strains and
stresses vary linearlyacross the section, with a 'maximum stress
equal to
where M is the acting moment, b the width and d the depth of the
beame When the maximum stress reaches the tensile strength f t a
fracture zone starts developing if the deflection of the beam is
increased. As the deflection increases, the fracture zone grows into

12
2
3
6M
2 bd2
ff-t--~t--..
f t-
Fracture zone depth. af
Fig. 7. stress development in an unnotched beame
the beame At the same time the stress across this zone decreases, as
the additional deformation increases. At the upper end of the frac
ture zone the stress is equal to f t •
By means of a suitable numerical analysis the development of the
stress distribution in the beam can be followed as the fracture zone
grows. The corresponding development of the bending moment can be
calculated, as it is shown in Fig. 7, as weIl as the deflection.
Exactly the same procedure can be followed also if the beam contains
a crack from the beginning, Fig. 8, which is the case treated by
conventionaI fracture mechanics. In that case the fracture zone
start to grow already as soon as a load is applied, due to the
stress concentration at the crack tip. The growth is however slow in
the beginning. It can be shown that the depth of the fracture zone
at low loads in this case is approximately proportional to the
square of the moment.

13
Fig. 8. stress development in a notched beame
In more complicated cases it is possible that the fracture zone
starts inside a structure and grows in two directions. This may for
instance happen with some she ar cracks in reinforced beams or with
splitting cracks under concentrated forces, like end anchors for
prestressing tendons.
size parameters. Brittleness number.
The characteristic length lch is a material property. If a characte
ristic size of a structure is divided by lch' this gives a dimensionless ratio, which relates a propert y of the structure to a pro
perty of the material. Fora beam the depth d is of ten chosen as the
characteristic size, and the ratio then is d/lch . This ratio is
sometimes called brittleness number, as it gives an indication of
the brittleness of the structure. The higher the brittleness number,
the more brittle the structure.
As will be demonstrated later, the relative strength of a structure,
expressed as aratio between a formal stress at maximum load and f t,
is a function of d/lch . In this way many results of the theoretical
analyses can be given in dimensionless general diagrams.

14
Application by means of finite element analysis.
The application by means of the finite element method (FEM) is rat
her straightforward if the fracture zone follows the direc.tion of
the element boundaries. The fracture zone then can be modelled eit
her as a separation between elements (the fictitious crack model) or
as a change in stress-strain properties of a row of elements (the
crack band model).
In the fictitious crack model it may for instance be suitable to
calculate the forces in the node points between the elements. When
such a force reaches a value corresponding to the tensile strength,
a separation between the elements is assumed, Fig. 9. Forces are
introduced between the separated node points. The values of these
forces depend on the separation distances w according to the
a-w-curve for the material, see Fig. 3. In this way the development
of the fracture zone and the corresponding force s and deformations
can be followed.
In the crack band model the formal stress-strain-curve for an ele
ment, where the fracture zone passes, is simply determined according
to the general formula
Fig. 9. The formation
and growth of a
fracture zone, modelIed
by means of a successive
separation of node points.

15
where El is the formal average strain in the element, E and w are in
accordance with the properties of the material, and l is the size of
the element in the direction of the tensile stress.
In the types of analyses described above, the fracture zones and the
cracks propagate along discrete cracks or bands. Therefore this type
of approach is called the discrete crack approach. This approach is
more difficult to apply when the fracture zone does not follow along
the direction of the element boundaries, but crosses the elements at
skew angles. certain possibilities exist for the application of the
discrete crack approach to such cases, but these are complicated,
and will not be discussed here.
When the direction of the fracture zone does not follow along the
element boundaries it is easier to apply the smeared crack approach.
In this approach a formal stress-strain relation is assumed for the
material, just like in the crack band model described above. Even
though this approach may be formally easier to apply, it involves
some problems and risks of misinterpretations.
When the formal stress-strain relation shall be calculated the value
of the length l is not weIl defined when the direction of the tensi
le stress forms a skew angle with the element directions. This leads
to an uncertainty in the determination of this relation, which gives
rise to an uncertainty in the results.
still worse, however, is that the properties of many types of finite
elements are not suitable for describing the growth of a fracture
zone in arealistic way. When the strain in an element reaches the
descending branch in the stress-strain curve, this corresponds to a
negative modulus of elasticity for further deformations. Such an
element may then be coupled more or less in parallell with an adjoi
ning element with a positive modulus of elasticity. The result may
be very discontinuous stress and strain distributions, which are un
realistic. In order to avoid large mi stakes it is necessary to be
very careful when the smeared crack approach is used. An uncritical
application may lead to quite unreliable results. Af ter this warning

16
has been given, the smeared approach will not be discussed any fur
ther in this paper.
Application to the bending of beams.
All the results which will be shown beolw are based on the applica
tion of the fictitious crack model. The assumed rr-E-relation is al
ways a straight line, whereas two different relations have been used
for the G-w-relation according to Fig. 10. The single straight line,
denoted "SL", is the simplest possible assumption for the numerical
analyses, whereas the bilinear relation is meant to be a good app
roximation for the real shape. It is denoted "C" for concrete.
E w w
Fig. 10. Simplified assumptions regarding material properties.
A simple example is the bent unreinforced beam, without or with a
notch (crack) on the tensile side. Figs. 11-14 show results of such
analyses. The strength of the beam is expressed as a formal bending
stress at failure, for the unnotched beam
and for the notched beam
f net = 6Mjb(d-a)2
where M is the maximum moment and a is the notch depth.

17
The value of the ratio ff/ft can be taken from diagrams of the type
shown in Fig. 7, and the ratio fnet/ft from Fig. 8.
Fig. 11 shows the variation of the flexural strength (modulus of
rupture, MOR) with d/Ich' From this diagram it can e g be seen that
the ratio between flexural strength and tensile strength for a 100
mm deep beam with Ich = 400 mm can be expected to be about 1.6,
which is in a reasonable agreement with experience.
with the model it is also possible to study the influence of shrin
kage stresses. Fig. 12 shows an example of this, where the shrinkage
strains have been assumed to have values of an order which can be
expected in a normal interior structure.
Fig. 11. Ratio between
flexural strength and
tensile strength.
Fig. 12. Influence of
shrinkage stresses on
the ratio between
flexural strength and
tensile strength.
3
2
0.01
trift
2.5
2.0
1.5
1.0
0.5
O 0.01
plastic
elastic brittle
0.1
!)M ff~Mu/(bd2/6) 1----l1
Initial stress at mid-span:
d/Ich 10
0.1 10

'3 f net f t 2.5
2
1.S
1
\\ lEFM Q.:0.6\ \ d \\0.2
I (J-w. (el I
\ \ \ \ \ \ \ \ \\
0.1 L-rrrrr--r--r-r-.,.....,.öT'T"-~~Y----O.OS 0.1 02 0.5 2
Fig. 13. Ratio between
net bending strength
of a notched beam and
the tensile strength.
18
1.01.----
l
4.0
a.o
100-w:(CJI
o OL-L-L-L-L-~'-'-'-.l-.l-_ 0.5 1.0
old
Fig. 14. InfIuence of the
notch depth on the net
bending strength.
Fig. 13 shows the variation of the strength of a notched beam with
d/Ich. In this case the strength is very sensitive to the depth for
deep beams. As a matter of fact the strength for deep beams approa
ches values which are predicted by linear elastic fracture mecha
nies, which means that they are inversely proportional to the square
root of the beam depth.
Fig. 14 shows how the depth of the notch influences the net bending
strength of a notched beame For a low value of d/Ich the notch has
practically no influence on the net bending strength f net , which is
nearly the same as the bending strength ff of an unnotched beame
These beams are said to be notch insensitive. For high values of
d/Ich the value of f net decreases as soon as there is a notch, which
means that these beams are notch sensitive. It can be not ed that the
notch sensitivity is not a material propert y , but a propert y that
depends on the beam depth d as weIl as on the material propert y Ich.

1 9
In all the figures it can be seen that the strength depends on the
size d of the beame Thus there is a size effect, which is explained
by means of the fracture mechanics approach. The size effect is
greater for notched beams than for unnotched, particularly for deep
notched beams. For unnotched beams this size effect increases when
shrinkage or temperature stresses are acting.
In Figs. 11 and 13 it can be seen that the strength approaches the
value predicted by the theory of plasticity for small beams, and
that it approaches the value predicted by the theory of elasticity
for large beams. The analysis covers all cases between these
extremes for unnotched as weIl as notched beams. It thus has a
general applicability. A small value of the "brittleness number"
d/Ich gives a more plastic-tough behaviour, whereas a high value
gives a more elastic-brittle behaviour.
Sensitivity analysis.
The formal strength according to the above results depends on the
value of d/Ich' where Ich in its turn depends on E, GF snd f t accor
ding to the relation Ich = EGF/ft 2 • The diagrams are given in loga
ritmic scales (except Fig. 12). For a small change in d/Ich the
relation can approximately be written
lnff = A + (1-2B)lnft - BInd + BlnE + BlnGF
where A and B are constants, with B showing the negative slope in
the diagram at the studied part of the curve.
A differentiation gives
df f dft dd dE dGF ~ = (1-2B) f t - Ber + BIf + B GF
20
This expression shows the relative change in the formal strength ff
for a small relative ch ange in one of the parameters. This can be
called the sensitivity, and it is determinded from the slope -B in
the diagrams. It must be not ed that the diagrams are given with the
scale on the vertical axes 4 times as large as the scale on the
horizontal axis. Therefore the slopes, which are measured in the
figures, must be divided by 4. If for example the measured slope is
-0.6, the value of B is 0.15, which means that the sensitivity with
regard to Gp is 0.15 and with regard to f t 0.7. In this case an
increase in f t with 10 percent increases ff with 7 percent, whereas
an increase in Gp with 10 percent increases ff with 1.5 percent. In
the same case an increase in the beam depth d with 10 percent
decreases ff with 1.5 percent.
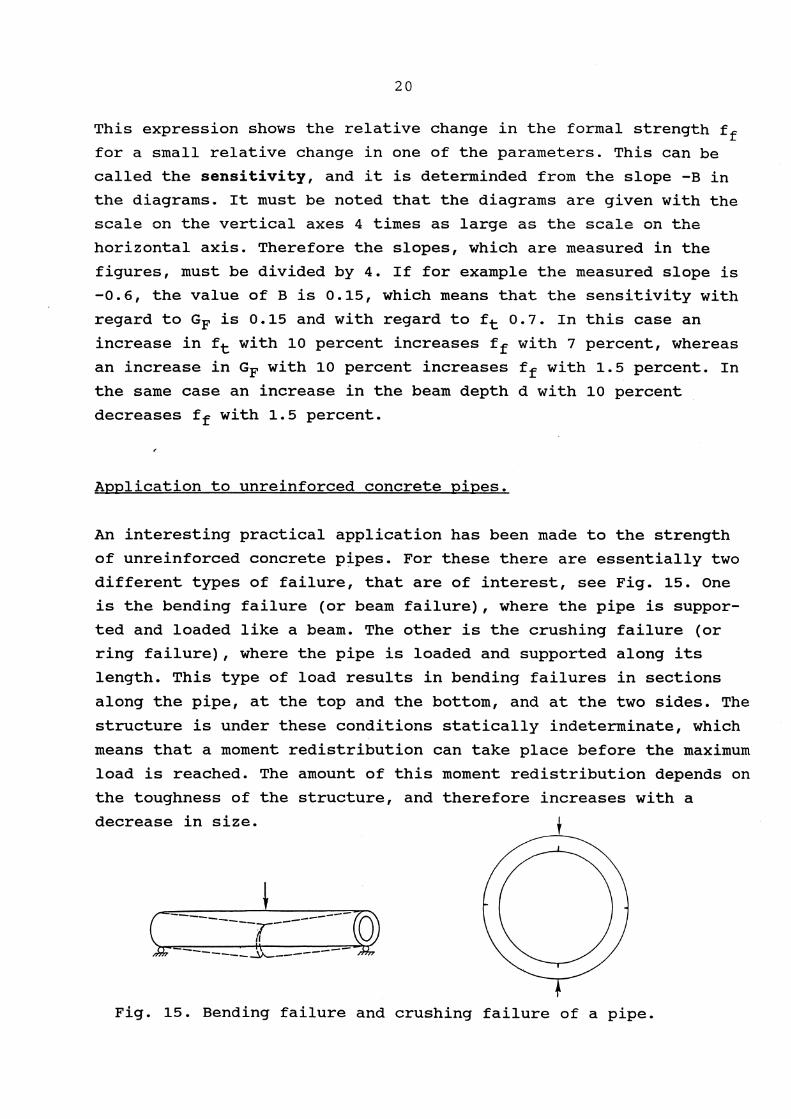
Application to unreinforced concrete pipes.
An interesting practical application has been made to the strength
of unreinforced concrete pipes. Por these there are essentially two
different types of failure, that are of interest, see Pig. 15. One
is the bending failure (or beam failure), where the pipe is suppor
ted and loaded like a beame The other is the crushing failure (or
ring failure), where the pipe is loaded and supported along its
length. This type of load results in bending failures in sections
along the pipe, at the top and the bottom, and at the two sides. The
structure is under these conditions statically indeterminate, which
means that a moment redistribution can take place before the maximum
load is reached. The amount of this moment redistribution depends on
the toughness of the structure, and therefore increases with a
decrease in size.
-------~-------- ~cr l' ~)
----~----
Pig. 15. Bending failure and crushing failure of a pipe.

Fig. 16. Yariation
of formal bending
strength of a pipe.
21
ffi f t
3.5
3
2.5
2
1.5
0.1 0.2 0.5
C rushing failure
2 5 10 dj/lch
In Fig. 16 the variation in the formal bending strength with the
size of the pipe is shownfor these two loading situations. The for
mal strength ff is the maximum stress at maximum load, calculated
according to the theory of elasticity.
From the figure it is evident that the formal strength is much
higher for the crushing failure than for the beam failure. The size
dependence is also much higher for the crushing failure. The reason
for the difference in strength is that the section depth for the
acting moment is much lower for the crushing failure (the wall
thickness) than for the beam failure (the diameter of the pipe). The
reason for the higher size dependence for the crushing failure is
that this structure is statically indeterminate.
The values according to Fig. 16 are in a good agreement with test
results. They have found a practical application for redesign of
certain pipes.

22
Application to shear failure of beams.
The shear strength of reinforced beams without shear reinforcement
has also been analysed by means of the fictitious crack model. This
is a very complicated case, as it depends not only on the concrete
properties in tension, but also on concrete properties in compres
sion and shear, on the steel properties, on the bond behaviour bet
ween concrete and steel, and on many other factors. The fracture
zone and the resulting cracks are curved, and they can appear in
many different positions.
Due to the complexity of the she ar fracture the analysis which has
been performed so far has had to be performed on the basis of many
approximations and simplifications. Thus only one crack at a time
has been studied, but this crack has been varied in order to find
the most dangerous situation. The shape and position of the crack
has been assumed in advance for each calculation, but afterwards it
has been checked that the crack is nearly perpendicular to the prin
cipal tensile stress. Dowel action has not been taken into account,
nor aggregat e interlock. The properties of the reinforcement, bond
properties, and failure in the concrete compression zone have been
taken into account.
Fig. 17. Theoretical ratio
between formal shear strength
and tensile strength for
a beam with longitudinal
reinforcement.
0.6
0.5
0.4
0.3
0.2
0.15
0.1
~ ~ 1.5%
o ~ 1% 0.5%
~.1% L/d-6
S-l% Lld-9
0.2 la 5.0 d Ilch
23
The results of the analyses are shown in Fig. 17. The variables have
been the depth (expressed as d/Ich)' the span to depth ratio, and
the reinforcement ratio 9. Of a special interest is the influence of
the beam depth, which is wellknown from tests, but which has not
earlier had any rationaI explanation.
A very large number of tests have been performed regarding the shear
strength of beams, and as a matter of fact all our knowledge, as ex
pressed in building codes and text books, is based on these tests.
As we now for the first time have a pure theoretical analysis of the
shear failure, it is interesting to compare this with test results
and with the code formulas. Such comparisons are shown in Figs. 18
20. As all the material parameters in the tests are not known, par
ticularly not the fracture enegy GF , it has on ly been possible to
make relative comparisons, which means that all curves in a diagram
have been drawn through one common point.
From all the figures it is evident that the theoretical results are
in a good agreement with the test results. Regarding the influence
of beam depth and reinforcement ratio they are also in a good agree
ment with the CEB Model Code, which is mainly based on the same test
results. The ACI code does not show any good agreement with the
theoretical results or the test results.
In Japan (Iguro et al, 1984) a test series has been performed, where
the beam depth has been varied between 0.1 m and 3 m, i e by a
factor of 30. From these tests it was concluded that the shear
strength is inversely proportional to the fourth root of the depth.
This corresponds to a 450 slope in Fig. 17, and it is thus in a good
agreement with the theoretical results.
Based on the theoretical analysis and the test results it can app
roximately be assumed that the following equation is valid for a
beam with a constant span to depth ratio and a constant re in force
ment ratio:

~ /Vu. d =O.2m
1.4
1.2
1.0
0.8
0.6
0.4
0.2
ACI
CES ............ --_____ ...... 0 ,- " b c
al Experimental results. Survey by Kennedy/Taylor / bl Experimental results by Leonhardt/Leonhardtl ej Present coleulations.leh"O.25m. r = 1.0%, l/d =3
0.2 0.4 0.6 0.8 1.0 1.2
24
Seam depth, d(m)
Fig. 18. Influence of
beam depth.
1.6 ~-CEB
1.4 ACI
1.2
1.0 f~=3000 psi
0.8 --- Survey of 150 tests lHedmon et 011
o Colcul'otions lid = 3, d/lch=O.6 ond 2:4
o O 0.5 lO 1.5 2.0 2.5
2
1
---Survey of 479 tests/Hedman et all
El Coleulatlons l) = 1.0 %, d/Ich = 0.6 and 2.4
fe .. 3000psi
o O 3 6 9 lid
Fig. 19. Influence of span
to depth ratio.
Figs. 18 - 20. Comparisons
between theoretical values,
test va lues and code values
regarding the influence of
different factors on the
shear strength of reinfor
ced beams.
Percentage reinforcement, 9 (%)
Fig. 20. Influence of
reinforcement ratio

25
where Vu is the formal shear strength (shear force divided by the
cross section area) and k a constant. This expression can be rear
rang ed by inserting the definition Ich = EGF/ft 2 :
From this expression it can be seen that the shear strength depends
as much on GF as on'ft 2 • It is generally accepted that the tensile
strength f t is approximately proportional to the square root of the
compressive strength. Thus f t 2 can be assumed to be proportional to
the compressive strength. The conclusion from this is that the shear
strength of a beam depends as much on the fracture energy of the
concrete in the beam as on its compressive strength.
When a laboratory test is performed on a concrete structure, the
compressive strength is traditionally always measured and reported.
From the above it follows that the fracture energy should also be
measured and reported where shear tests are performed, as this pro
perty is as important as the compressive strength. The same may hold
also for many other types of structural tests.
AIso in code formulas for shear strength the fracture energy ought
to be taken into account in some way or other. How this should be
done is too earl y to specify, but one possibility could be to give
some type of correction factor, depending on the type of concrete,
for example reduction factors for light weight concrete and for high
strength concrete.
Direction of future research.
It has been demonstrated above that the application of fracture me
chanics to concrete structures can give important contributions to
the understanding of the behaviour of structures in cases where our
knowledge earlier has been mainly based on empirical studies, like
the ratio between flexural and tensile strength, the influence of
shrinkage on the flexural strength and the shear strength of beams.

26
still we are however only in the beginning of a development. If we
for example look on the application to shear fracture, the results
which were demonstrated are based on analyses where many rather
rough approximations have been made. These were partly due to a lack
of knowledge, e g regarding the aggregat e interlock and the dowel
action, and part ly on the complexity of the problem, which made it
too difficult to take all factor into account with the existing
finite element program.
Thus one important type of research is to find more adequate materi
al properties to be inserted into the finite element analyses. One
example of such a research work is mentioned below.
An other important type of research is to develop finite element
programs, which are better adopted to handle this type of fracture
mechanics, with localization of fracture zones and strain softening.
It is also important to apply the mode l in a systematic way to real
structures in order to achieve a better understanding of different
types of behaviour, e g as a background for better design rules and
codes. The results of such systematic analyses can preferrably be
given in dimensionless general diagrams of the types shown above.
Present research in Lund (spring 1988).
A large test program is going on regarding the behaviour of a frac
ture zone in mixed mode, i e with shear deformations and stresses in
a fracture zone af ter it has started in tension. Some results were
presented in 1987. More systematic results will be presented at a
conference in vienna in July 1988, and the final complete report is
expected to appear in 1989. One example of a test result is presen
ted in Fig. 21.
A first attempt has also been made to apply the model with localiza
tion and strain hardening to the fracture in the compression zone of
27
a reinforced beame These first results indicate that the stress
strain relation to be used for the practical design should prefer
rably have an ultimate strain equal to kl/x, instead of the normally
assumed 3.5 permille, where kl is a material propert y and x is the
depth of the compression zone. If this conclusion is correct, it
will have a significant influence in many practical situations.
Further research is needed before the result is sufficiently confir
med.
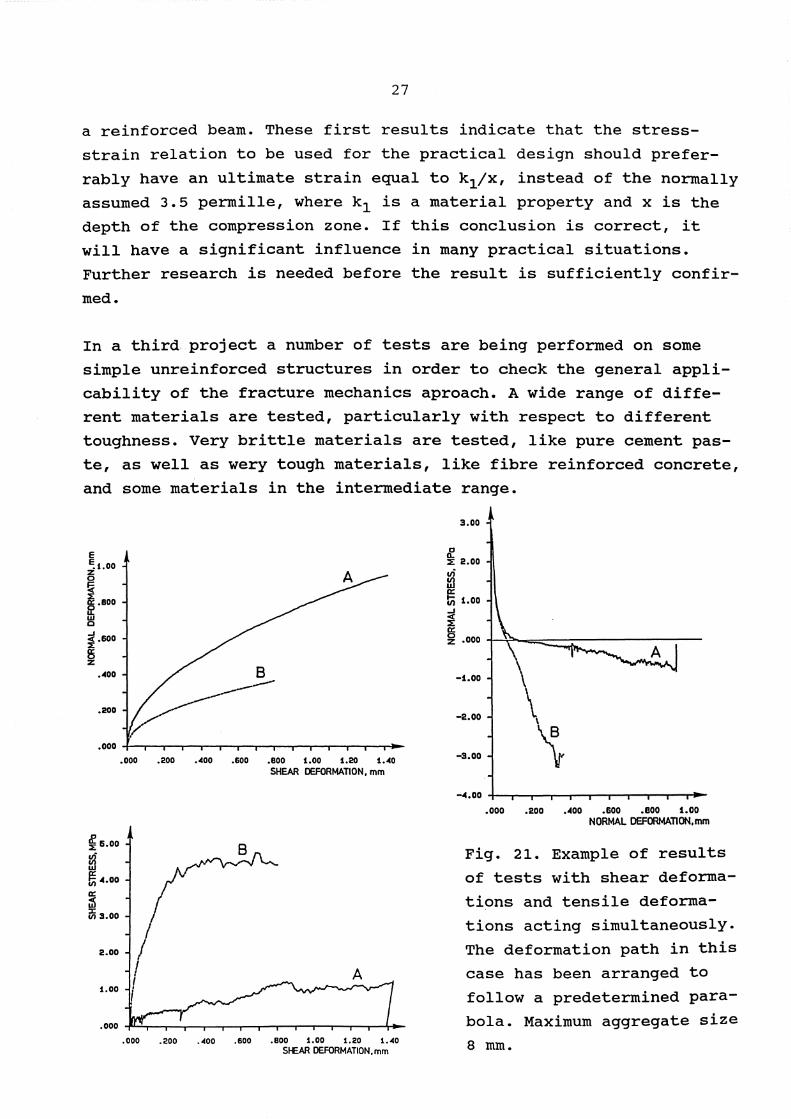
In a third project a number of tests are being performed on some
simple unreinforced structures in order to check the general appli
cability of the fracture mechanics aproach. A wide range of diffe
rent materials are tested, particularly with respect to different
toughness. Very brittle materials are tested, like pure cement pas
te, as weIl as wery tough materials, like fibre reinforced concrete,
and some materials in the intermediate range.
E ~1.00 Z o ~ ;.BOO
..J ~.600
Z
.~oo
.200
~ 6.00
~ ~MO er ~ ~ 3.00
2.00
1.00
.000 .200 .~OO .600 .BOO i.OO i.2O i.~O
SHEAR DEFORMATION. mm
r I I I A I I
.000 .200 .0400 .600 .BOO 1..00 1.20 1..040 Sf-EAR DEFORMATION. mm
3.00
~ 2.00
vi ffi ~ 1.00 ..J < ~
~ z .000
-1.00
-2.00 \ -3.00
.000 .200 .~OO .600 .BOO 1.00 NORMAL DEFORMATlON.mm
Fig. 21. Example of results
of tests with shear deforma
tions and tensile deforma
tions acting simultaneously.
The deformation path in this
case has been arranged to
follow a predetermined para
bola. Maximum aggregate size
8 mm.
28
References
American Concrete Institute (1983) Building code requirements for
reinforced concrete, ACI 318-83.
Bazant, Z.P. and Oh. B.H. (1983) Crack band theory for fracture of
concrete. RILEM, Materials and Structures, Vol 16, No 93, 155-177.
CEB/FIP Model Code for Concrete Structures (1978). CEB Bulletin
124/125-E.
Hillerborg, A., Modeer, M. and Petersson, P.E. (1976) Analysis of
crack formation and crack growth in concrete by means of fracture
mechanics and finite elements. Cem. and Concre. Res., 6, 773-782.
Iguro, M., Shioya, T., Nojiri, Y. and Akiyama, H. (1984) Experimen
tal studies on shear strength of large reinforced concrete beams
under uniformly distributed load (in Japanese), Proceedings, Japan
Society of civil Engineers (Tokyo), No. 348/V-1, Aug. 1984,
175-184. Also Concrete Library International, JSCE, No. 5, Aug.
1985, 137-154 (in English).
Gustafsson, P.J. (1985) Fracture mechanics studies of non-yielding
materials like concrete. Report TVBM-1007, Div. of Building Materi
als, Lund Inst. of Technology, Sweden.
Petersson, P.E. (1981) Crack growth and development of fracture
zones in plain concrete and similar materials. Report TVBM-1006,
Div. of Building Materials, Lund Inst. of Technology, Sweden.
RILEM (1985) Determination of the fracture energy of mortar and
concrete by means of three-point bend tests on notched beams, RILEM,
Materials and Structures, Vol 18, No 106, 185-290.