application of functional genomic information to … and molecular research 11 (2): 1558-1574 (2012)...
TRANSCRIPT

©FUNPEC-RP www.funpecrp.com.brGenetics and Molecular Research 11 (2): 1558-1574 (2012)
Application of functional genomic information to develop efficient EST-SSRs for the chicken (Gallus gallus)
M.R. Bakhtiarizadeh1, B. Arefnejad1, E. Ebrahimie2,3 and M. Ebrahimi4
1Department of Animal Science, University College of Agriculture and Natural Resources, University of Tehran, Tehran, Iran2School of Molecular and Biomedical Science, University of Adelaide, Adelaide, Australia3Department of Crop Production & Plant Breeding, College of Agriculture, Shiraz University, Shiraz, Iran4Department of Biology and Bioinformatics Research Group, GRC, University of Qom, Qom, Iran
Corresponding author: E. EbrahimieE-mail: [email protected]
Genet. Mol. Res. 11 (2): 1558-1574 (2012)Received January 13, 2012Accepted February 25, 2012Published May 21, 2012DOI http://dx.doi.org/10.4238/2012.May.21.12
ABSTRACT. Many years of domestication and breeding have given rise to the wide range of chicken breeds that exist today; however, an increasing number of local chicken breeds are under threat of extinction. A comprehensive characterization of chicken markers (especially type I markers) is needed to monitor and conserve genetic diversity in this species. The explosion of genomics and functional genomics information in recent years has opened new possibilities for the generation of molecular markers. We analyzed a large number of expressed sequence tags (ESTs) to test the possibility of using EST-derived microsatellite markers for investigating the Gallus gallus genome. Chromosomal locations for the majority of these SSRs were predicted. Of the 31,576 unigenes assembled from the 544,150 redundant EST sequences, 1757
1559
©FUNPEC-RP www.funpecrp.com.brGenetics and Molecular Research 11 (2): 1558-1574 (2012)
Functional genome analysis for efficient EST-SSRs in chicken
SSR markers were discovered on 1544 ESTs, using the SSRLocator software, with an average density of 28.7 kb per SSR. The dimer motifs were the most frequent (46.38%), followed by trimeric (38.58%), tetrameric (10.19%), pentameric (4.5%), and hexameric (<1%) markers. Different from the case for cattle and sheep, AT/TA was the most abundant dimeric repeat, accounting for 41.71% of all dimeric repeats in the chicken ESTs. The EST-SSR distribution was not uniform among the chromosomes; the majority of the EST-SSRs were located on chromosomes GGA2 and GGA10. We found that most of the EST-SSRs are involved in positive regulation of cellular and metabolic processes. This is the first time that EST sequences have been mined to find chicken microsatellites. On average, 3.8% of the G. gallus UniGene sequences could be exploited for development of EST-SSRs, indicating a good source for molecular markers as well as for functional genome analysis.
Key words: EST; SSR; Microsatellites; Genomics; Gallus gallus; Chicken
INTRODUCTION
Intensive selection in breeding programs has caused a reduction in the genetic diver-sity of the chicken genome. In other words, the development of high-performance, specialized chickens has led to the replacement of local chicken populations and caused a reduction in the specie’s overall genetic variation (Blackburn, 2006). Based on analysis using DNA from widely distributed populations, the genetic diversity in chicken breeds appears to be lower than in other domesticated species. As a result, it is crucial to find reliable and frequent genetic markers to monitor the genetic diversity of the chicken germplasm.
DNA-based molecular markers have been used as efficient tools for a large number of applications, including phylogenetic analysis, the assessment of genetic diversity for acceler-ated breeding, the selection of hybrid parents, studying population structure, marker-assisted selection (MAS) and mapping and tagging genes and quantitative trait loci (QTLs) (Collard et al., 2005). Accordingly, several DNA marker systems have been expanded in recent times, including restriction fragment length polymorphism (RFLP), random amplified polymorphic DNA (RAPD), inter-simple sequence repeats (ISSRs), simple sequence repeats (SSRs), ampli-fied fragment length polymorphism (AFLP), and their variants, to analyze gross and specific DNA sequence variations in different species (Joshi et al., 2011).
Microsatellites are randomly distributed within eukaryotic genomes. They are called SSRs and are short, 1-8-bp long monomer sequences that are randomly repeated in the genom- and are short, 1-8-bp long monomer sequences that are randomly repeated in the genom-and are short, 1-8-bp long monomer sequences that are randomly repeated in the genom- that are randomly repeated in the genom-that are randomly repeated in the genom-ic sequence (Mittal and Dubey, 2009). The usefulness of the microsatellite system has been verified; it is capable of effectively improving genetic diversity and has beneficial applications in breeding in many species. This approach is also effective for detecting polymorphisms as-sociated with a low level of intraspecific diversity (Mittal and Dubey, 2009). SSR markers are likely candidates for developing invaluable genetic markers because of their codominant method of inheritance, locus-specificity, relative abundance in the genome, high degree of reproducibility, and polymorphisms (due to their multi-allelic nature), high rates of interspe-cific transferability across species/genera, and ability to be associated with many phenotypes. These factors make them a powerful tool for a number of applications. Accordingly, SSRs

1560
©FUNPEC-RP www.funpecrp.com.brGenetics and Molecular Research 11 (2): 1558-1574 (2012)
M.R. Bakhtiarizadeh et al.
have become valued genetic markers for linkage and comparative genomic studies, QTL, as-sociation mapping, and diversity analyses (Victoria et al., 2011).
The massive explosion of genomics and gene expression information in recent years has provided an opportunity to invent a new generation of molecular markers by using the newly available sequences. The deposition of large numbers of expressed sequence tags (ESTs) in a public database has resulted in the development of a new class of functional ge-nomic markers called EST-derived SSR (EST-SSR) markers, via data mining. This has led to a new, alternative source of microsatellites through data mining sequence information from publicly available EST databases for species (Adams et al., 1991). In mammals, the proportion of ESTs containing SSRs depends on the species and covers a very broad range, from 2% in sheep to 15% in mice. Approximately 3.8% of chicken and 3.7% of zebra finch UniGenes are thought to contain SSRs (Slate et al., 2007).
Most markers used to study genetic diversity occur in non-coding regions of the genome that are poorly conserved (Brown et al., 2001). Therefore, the genetic diversity de-tected by these markers may not accurately represent genetic diversity. In contrast, functional markers such as EST-SSRs or cDNA-SSRs should detect the true genetic diversity of the cod-ing regions of the genome. Therefore, EST-SSRs are believed to be superior to other markers due to their abundance in the gene-rich chicken genome, their higher level of transferability and the fact that they provide better estimates of genetic diversity, despite exhibiting lower levels of polymorphism compared to genomic SSRs (Thiel et al., 2003).
We analyzed chicken UniGenes from GenBank in order to 1) screen chicken ESTs for the type, frequency, and distribution of SSR motifs, 2) develop a set of EST-SSR markers, 3) cluster the EST-SSR markers, and 4) annotate the gene ontology of the markers.
MATERIAL AND METHODS
Retrieval of UniGene sequences
All chicken ESTs used in this project were retrieved from the NCBI UniGene website (ftp://ftp.ncbi.nih.gov/repository/UniGene/) on October 7, 2010 and were saved as FASTA for-matted text files. There were 31,576 chicken UniGene clusters that contained 544,150 ESTs.
EST data mining and SSR identification
The chicken UniGene databases were loaded into the SSRLocator software (da Maia et al., 2008). SSRLocator is a tool for the detection and characterization of micro- and minis-atellites in DNA sequences. The software may also be used for primer design for PCRs and global alignment between homologous regions obtained via PCR simulation (da Maia et al., 2008). We considered EST-derived SSRs to contain motifs ranging in length from 2 to 6 nucle-otides that have ≥7 dinucleotide repeats, ≥6 trinucleotide repeats, ≥5 tetranucleotide repeats, ≥5 pentanucleotide repeats, and ≥5 hexanucleotide repeats.
Development of EST-SSR primer pairs
For each microsatellite-containing EST, primers were designed using Primer3 in

1561
©FUNPEC-RP www.funpecrp.com.brGenetics and Molecular Research 11 (2): 1558-1574 (2012)
Functional genome analysis for efficient EST-SSRs in chicken
batch mode with the assistance of the SSRLocator interface module. The primer design func-tion was used to determine if the sequences had a sufficient amount of flanking sequence to design primers. The parameters for primer design were set as follows: a PCR product size of 100-300 bp, a primer length of 18-25 bp (optimum of 20 bp), an annealing temperature of 58-63°C with an optimum temperature of 60°C, and a minimum GC content of 30% with an optimum of 50%.
Gene ontology
To define the functions of the genes containing SSRs, the sequences were compared to the non-redundant NCBI protein database using the Blast2GO software (Conesa et al., 2005). EST-SSRs with an E value of 10-6 or less were assigned a putative identity.
To detect overrepresented gene ontology categories, we analyzed the functional cluster-ing and the chromosomal distribution of EST-SSRs that were successfully annotated to known proteins with the Database for Annotation Visualization and Integrated Discovery (DAVID) Bioinformatics Functional Annotation Tool software (http://david.abcc.ncifcrf.gov/) (Conesa et al., 2005). The gene annotation of the whole genome was used as the background model with the default DAVID settings, using false-discovery rate (FDR)-corrected P values <0.05.
RESULTS
Characterization of EST-SSRs
From a total of 544,150 redundant EST sequences that clustered into 31,576 Unigenes, only 1544 contained SSRs. Of these, 1378 (89%) contained a single SSR, while 133 (9%), 24 (1.5%) and 5 (0.003%) of the sequences contained 2, 3 and 4 SSRs, respectively. Only three sequences contained five SSRs, and one of the sequences contained six SSRs of different motif types (Table 1).
Parameter Number
Total number of ESTs 544,150Total number of UniGene sequences 31,576Total sequences containing SSRs 1,544Sequences containing one SSR 1,378Sequences containing two SSRs 133Sequences containing three SSRs 24Sequences containing four SSRs 5Sequences containing five SSRs 3Sequences containing six SSRs 1Total SSR-ESTs identified 1,757
ESTs = expressed sequence tags; SSRs = simple sequence repeats.
Table 1. Summary of EST and EST-derived SSR (EST-SSR) distributions in the UniGene chicken sequence.
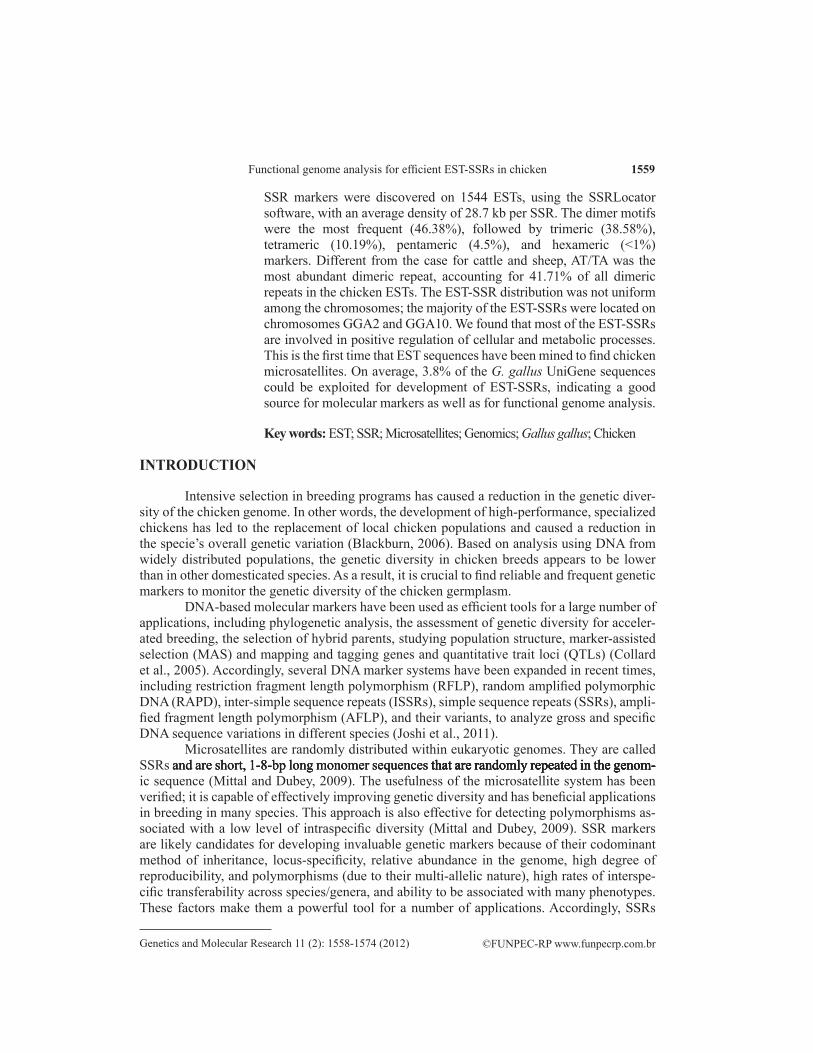
Of 1757 EST sequences with SSRs, 46.38, 38.58, 10.19, and 4.5% showed dimeric, tri-.38, 38.58, 10.19, and 4.5% showed dimeric, tri-38, 38.58, 10.19, and 4.5% showed dimeric, tri-meric, tetrameric, and pentameric motifs, respectively (Figure 1). Only 0.3% of the sequences showed hexameric SSR motifs.
1562
©FUNPEC-RP www.funpecrp.com.brGenetics and Molecular Research 11 (2): 1558-1574 (2012)
M.R. Bakhtiarizadeh et al.
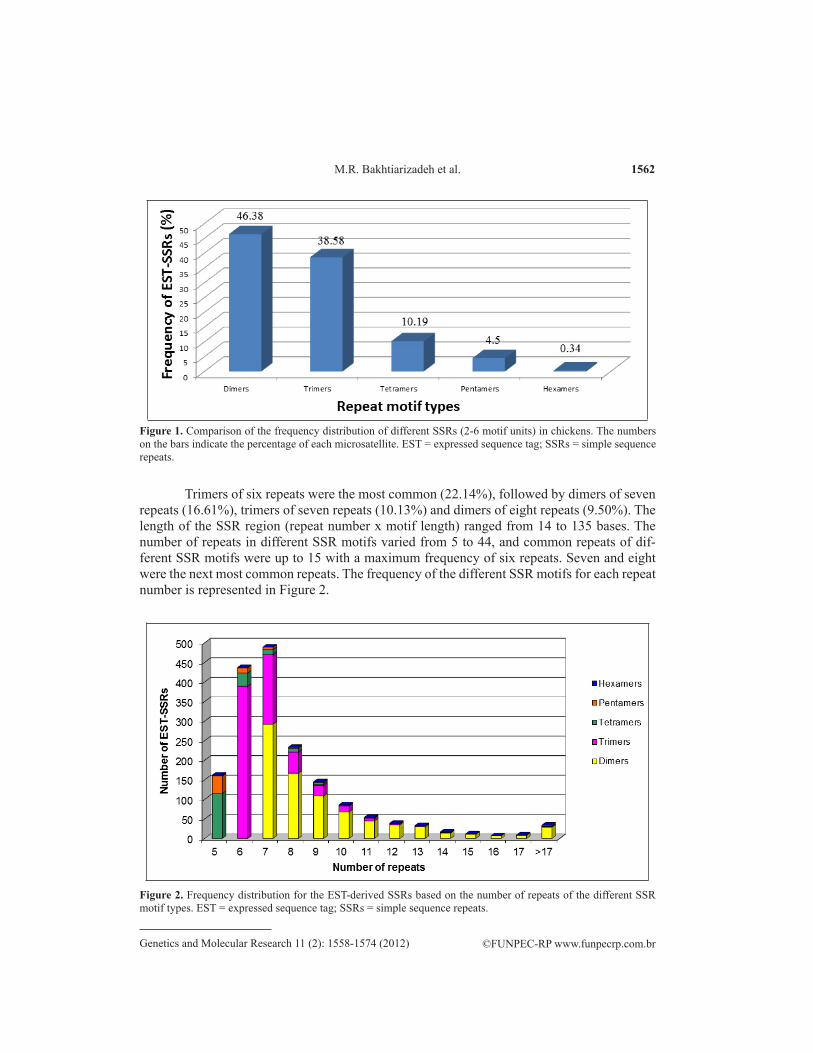
Trimers of six repeats were the most common (22.14%), followed by dimers of seven repeats (16.61%), trimers of seven repeats (10.13%) and dimers of eight repeats (9.50%). The length of the SSR region (repeat number x motif length) ranged from 14 to 135 bases. The number of repeats in different SSR motifs varied from 5 to 44, and common repeats of dif-ferent SSR motifs were up to 15 with a maximum frequency of six repeats. Seven and eight were the next most common repeats. The frequency of the different SSR motifs for each repeat number is represented in Figure 2.
Figure 1. Comparison of the frequency distribution of different SSRs (2-6 motif units) in chickens. The numbers on the bars indicate the percentage of each microsatellite. EST = expressed sequence tag; SSRs = simple sequence repeats.
Figure 2. Frequency distribution for the EST-derived SSRs based on the number of repeats of the different SSR motif types. EST = expressed sequence tag; SSRs = simple sequence repeats.

1563
©FUNPEC-RP www.funpecrp.com.brGenetics and Molecular Research 11 (2): 1558-1574 (2012)
Functional genome analysis for efficient EST-SSRs in chicken
The SSRs were categorized into two groups based on the length of the SSR motifs and their potential to be informative genetic markers. Class I contains perfect repeats greater than 20 nucleotides in length, while Class II contains perfect repeats between 10 and 20 nucleotides in length. Of 1757 SSRs, 800 (45.53%) and 957 (54.47%) repeats were categorized as belong-ing to Class I and Class II, respectively (Figure 3).
Figure 3. Frequency of Class I and Class II SSRs in EST-SSR repeat motifs identified. EST = expressed sequence tag; SSRs = simple sequence repeats.
Frequencies of chicken SSRs with different repeat motifs
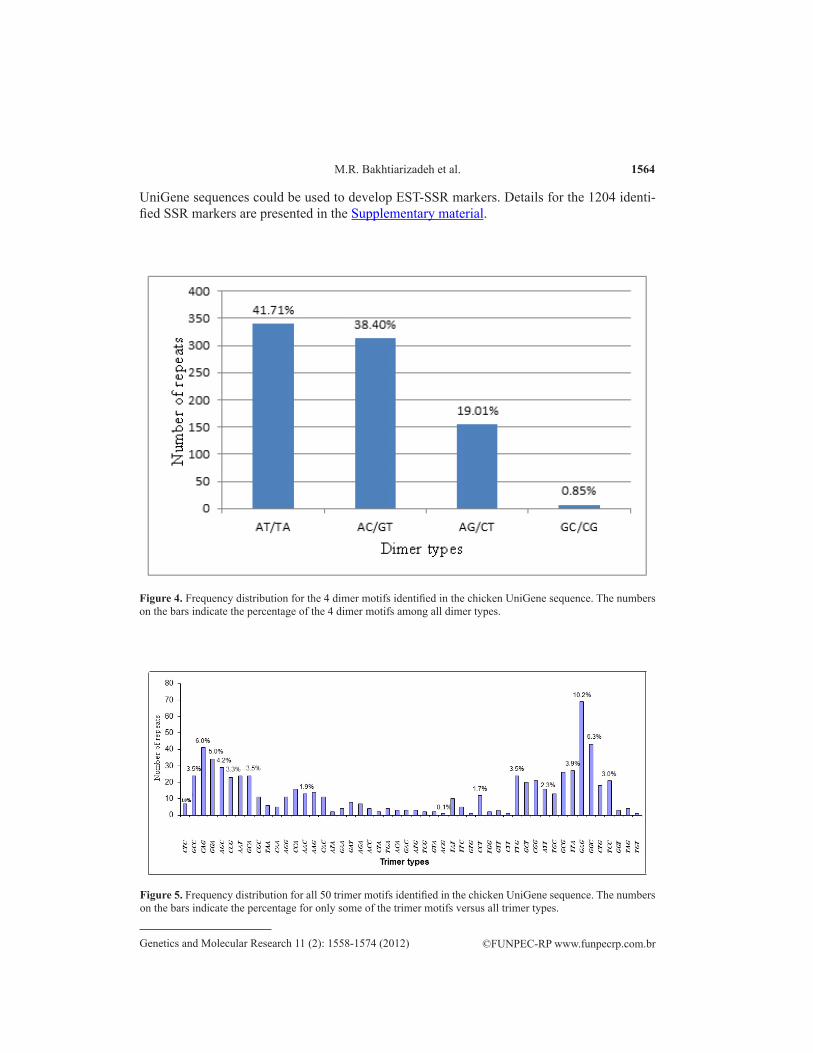
The frequency of various motifs in SSRs is shown in Figures 3-7. The SSRs com-prised 4 types of dimer motifs, 50 types of trimer, 57 types of tetramer, 58 types of pen-tamer, and just 6 types of hexamer motifs. The most abundant dimer motif was AT/TA (41.71%) (Figure 4) followed by the AC/GT (38.40%) and AG/CT (19.01%) motifs. The GC/CG motif occurred in less than 1% of sequences. The most abundant trimer motif (Figure 5) was GAG (10.2%), followed by GGC (6.3%) and CAG (6.0%). The AAAC (16.2%), TTTG (11.7%) and AAAT (7.2%) motifs were common among the tetramers (Figure 6), while GCGGT (6.3%) and TTTTA (5.0%) were among the most common pentamer motifs (Figure 7). The hexamer motifs (Figure 8) were found to have identical frequencies.
Development of EST-SSR markers
All 1544 sequences that contained SSRs were used to design primer pairs. Only 1349 (87.37%) were able to be used to design primer pairs; the remaining 195 (12.63%) SSR-containing sequences did not have proper flanking sequences for primers. Of the 1349 primer pairs, 1204 produced qualifying products in PCR modeling. In total, 3.8% of the Gallus gallus
1564
©FUNPEC-RP www.funpecrp.com.brGenetics and Molecular Research 11 (2): 1558-1574 (2012)
M.R. Bakhtiarizadeh et al.
Figure 4. Frequency distribution for the 4 dimer motifs identified in the chicken UniGene sequence. The numbers on the bars indicate the percentage of the 4 dimer motifs among all dimer types.
Figure 5. Frequency distribution for all 50 trimer motifs identified in the chicken UniGene sequence. The numbers on the bars indicate the percentage for only some of the trimer motifs versus all trimer types.
UniGene sequences could be used to develop EST-SSR markers. Details for the 1204 identi-fied SSR markers are presented in the Supplementary material.

1565
©FUNPEC-RP www.funpecrp.com.brGenetics and Molecular Research 11 (2): 1558-1574 (2012)
Functional genome analysis for efficient EST-SSRs in chicken
Figure 8. Frequency distribution for the 6 hexamer motifs identified in the UniGene chicken sequence. There is one of each repeat type, and the occurrence percentage for every type is 16.6% for all hexamer types.
Figure 6. Frequency distribution for all 57 tetramer motifs identified in the UniGene chicken sequence. The percentage for some of the tetramer motifs is shown on the column.
Figure 7. Frequency distribution for all 58 pentamer motifs identified in the UniGene chicken sequence. The repeat type ranged from one to five as shown for the motifs. The percentage for every type number (1-5 numbers) is shown on the column.

1566
©FUNPEC-RP www.funpecrp.com.brGenetics and Molecular Research 11 (2): 1558-1574 (2012)
M.R. Bakhtiarizadeh et al.
Annotation and gene ontology (GO) analysis of sequences containing EST-SSRs
BLASTX at NCBI (http://www.ncbi.nlm.nih.gov/blast) was used to examine the 1544 sequences identified as containing SSRs. Due to the incomplete annotation of the chicken ge-nome, only 762 of the 1544 G. gallus SSR sequences (49.35%) could be successfully mined by BLASTX; 563 (36.46%) were annotated. The remaining sequences all corresponded to unannotated genes.
The majority of SSR-containing sequences were found to be involved in the positive regulation of cellular and metabolic processes (Figure 9A). The majority of the SSRs mapped to cellular components were related to nucleus gene sequences and membranes (Figure 9B). The GO assignments for molecular function indicated that the majority of the chicken EST sequences containing SSRs were involved in DNA binding and transcriptional regulation (Figure 9C). The higher incidence of SSR loci with this ontology demonstrates a potential use of these molecular markers to saturate the molecular pathways associated with the functions described above.
Figure 9. Percentages for the EST-SSRs within different categories according to the descriptive terms of gene ontology. A. Biological processes. B. Cellular components. C. Molecular functions.

1567
©FUNPEC-RP www.funpecrp.com.brGenetics and Molecular Research 11 (2): 1558-1574 (2012)
Functional genome analysis for efficient EST-SSRs in chicken
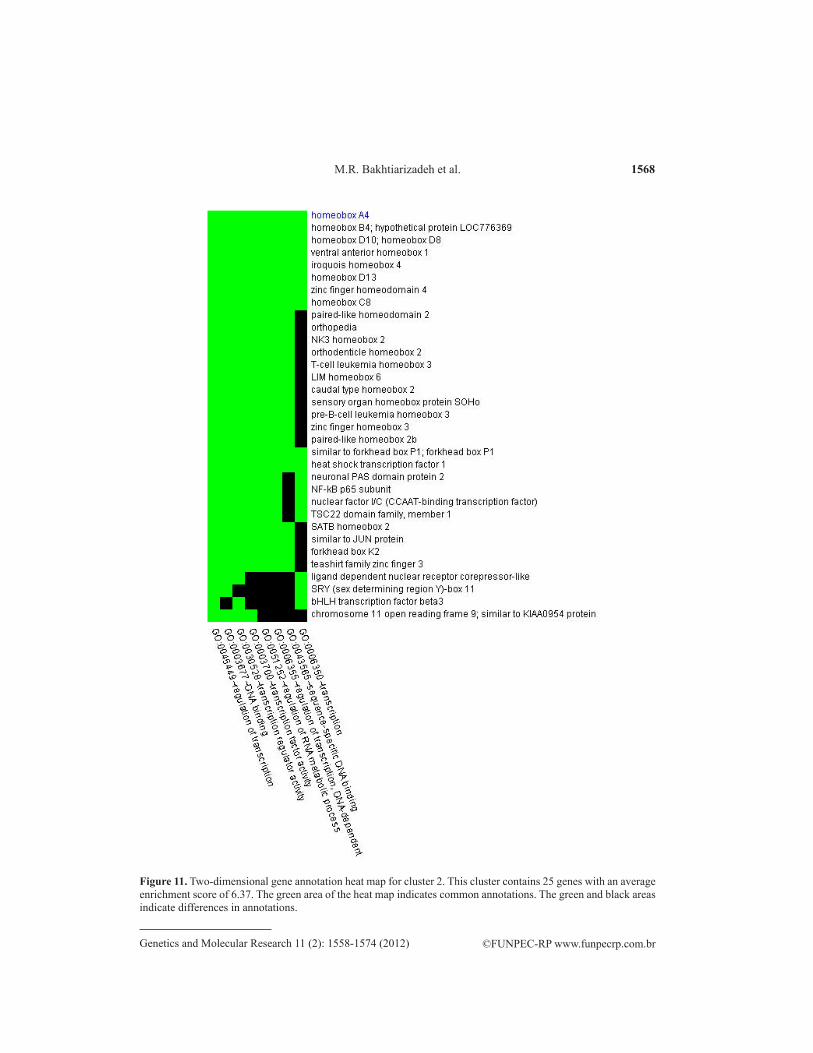
Functional annotation clustering showed 10 enriched functional category terms associ-ated with the identified genes. All results passed the specified thresholds (by default, max. prob. ≤0.1 and min. count ≥0.2), ensuring that only statistically significant genes were displayed. Clus-ter 1 had the highest enrichment score (8.13) based on the overall EASE scores of all enriched annotation terms and contained 33 genes (Figure 10). Cluster 2 contained 25 genes and had an enrichment score of 6.37 (Figure 11). Two-dimensional heat maps allow for the examination of the similarities and differences in annotations across the groups’ gene members.
Figure 10. Two-dimensional gene annotation heat map for cluster 1. This cluster contains 33 genes with an average enrichment score of 8.13. The green area of the heat map indicates common annotations. The green and black areas indicate differences in annotations.
Chromosomal distribution of the chicken SSR loci
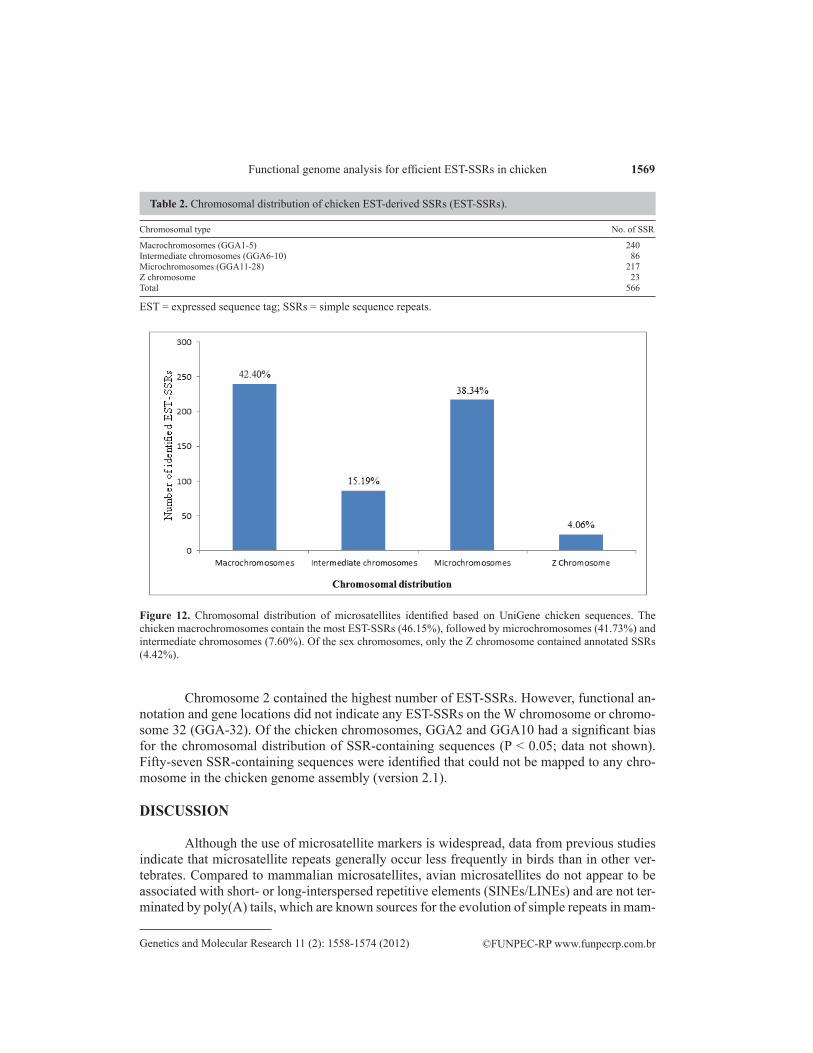
The distribution of SSR loci was restricted to chromosomes with complete (or near-ly complete) genomic sequences; this excludes the W chromosome and microchromosomes smaller than GGA28 (with the exception of GGA32). Of the 563 annotated genes, 509 were found on G. gallus chromosomes. The overall number of EST-SSR loci declined markedly with decreasing chromosome length. The chromosomal distributions indicate that the majority of EST-SSRs are located on large macrochromosomes (GGA1-5; 42.40%), followed by mi-crochromosomes (GGA11-28; 38.34%) and intermediate chromosomes (GGA6-10; 15.19%). The Z chromosome contained 4.06% of the EST-SSRs (Table 2 and Figure 12).
1568
©FUNPEC-RP www.funpecrp.com.brGenetics and Molecular Research 11 (2): 1558-1574 (2012)
M.R. Bakhtiarizadeh et al.
Figure 11. Two-dimensional gene annotation heat map for cluster 2. This cluster contains 25 genes with an average enrichment score of 6.37. The green area of the heat map indicates common annotations. The green and black areas indicate differences in annotations.
1569
©FUNPEC-RP www.funpecrp.com.brGenetics and Molecular Research 11 (2): 1558-1574 (2012)
Functional genome analysis for efficient EST-SSRs in chicken
Chromosome 2 contained the highest number of EST-SSRs. However, functional an-notation and gene locations did not indicate any EST-SSRs on the W chromosome or chromo-some 32 (GGA-32). Of the chicken chromosomes, GGA2 and GGA10 had a significant bias for the chromosomal distribution of SSR-containing sequences (P < 0.05; data not shown). Fifty-seven SSR-containing sequences were identified that could not be mapped to any chro-mosome in the chicken genome assembly (version 2.1).
DISCUSSION
Although the use of microsatellite markers is widespread, data from previous studies indicate that microsatellite repeats generally occur less frequently in birds than in other ver-tebrates. Compared to mammalian microsatellites, avian microsatellites do not appear to be associated with short- or long-interspersed repetitive elements (SINEs/LINEs) and are not ter-minated by poly(A) tails, which are known sources for the evolution of simple repeats in mam-
Chromosomal type No. of SSR
Macrochromosomes (GGA1-5) 240Intermediate chromosomes (GGA6-10) 86Microchromosomes (GGA11-28) 217Z chromosome 23Total 566
Table 2. Chromosomal distribution of chicken EST-derived SSRs (EST-SSRs).
Figure 12. Chromosomal distribution of microsatellites identified based on UniGene chicken sequences. The chicken macrochromosomes contain the most EST-SSRs (46.15%), followed by microchromosomes (41.73%) and intermediate chromosomes (7.60%). Of the sex chromosomes, only the Z chromosome contained annotated SSRs (4.42%).
EST = expressed sequence tag; SSRs = simple sequence repeats.
1570
©FUNPEC-RP www.funpecrp.com.brGenetics and Molecular Research 11 (2): 1558-1574 (2012)
M.R. Bakhtiarizadeh et al.
mals (Hillier et al., 2004). It should be noted that birds have one of the smallest known genome sizes among vertebrates and contain relatively little noncoding DNA compared to most mam-mals (Primmer et al., 1997). The absolute numbers of microsatellites tend to positively cor-relate with genome size (Wierdl et al., 1997). The identification of the occurrence, frequency, and distribution of EST-derived microsatellites is a free by-product of EST sequencing proj-ects and may be used to help reveal the functional significance of these sequences in chicken.
To extend the available chicken SSR markers, the NCBI database containing 31,576 UniGene clusters from 544,150 chicken ESTs was systematically searched for microsatellite motifs. A non-redundant set of SSR primers was designed that targeted 3.8% of the total num-ber of clustered ESTs. However, previous studies have indicated that approximately 3.7% of zebra finch UniGenes contain EST-SSRs (Slate et al., 2007). The number ranges from 4.0% in cattle (Yan et al., 2008) and 7.3% in zebrafish (Ju et al., 2005) to ~15% in mice (Slate et al., 2007) and rabbits (Van Lith and Van Zutphen, 1996). These results indicate that chicken ESTs are an invaluable source for identifying SSR markers. The frequency of EST-SSRs was 4.9%; there was an average of one microsatellite for every 28.7 kb of EST sequence. The obvious difference between our results and the previous reports for chicken EST-SSR frequency may be due to criteria used in EST mining.
In this study, dimeric repeats were found to be the most abundant, which is in agree-ment with several other animal species (Slate et al., 2007). Trimers were the second most abundant repeat motifs (38.58%), followed by tetramer (10.19%), pentamer (4.5%) and hex-.58%), followed by tetramer (10.19%), pentamer (4.5%) and hex-58%), followed by tetramer (10.19%), pentamer (4.5%) and hex-amer (0.3%) nucleotide repeats. Unlike cattle and sheep, the frequency of hexamer repeats in chickens was less than 1%. The smaller repeat motifs were predominant among the identified SSRs. The occurrence of repeat units decreases as the length of the repeat unit increases. This can be explained by the fact that longer repeats have higher mutation rates and are therefore less stable (Toth et al., 2000). Additionally, dimeric and trimeric repeat sequences tended to be longer than other repeats.
Among the dimeric repeats, the AT/TA repeat was the most abundant (unlike cattle and sheep, in which AC/GT is the most abundant one) and made up 41.71% of all dimeric repeats found in chicken ESTs. AC/GT was the second most abundant repeat and accounted for 38.40% of dimeric repeats. This dimeric SSR distribution was different than what had been previously found in catfish (Serapion et al., 2004), zebrafish (Zhang et al., 2010), sheep (Zhang et al., 2010), and cattle (Yan et al., 2008). A previous study indicated that the AT/TA repeats in genic and non-genic sequences in vertebrate genomes (including G. gallus) are less common than AC/GT repeats (Toth et al., 2000). This pattern may be related to the lower fre-quency of AT/TA repeats in the non-coding sequences of the chicken genome.
The most abundant trimeric repeat motif detected in this study was CAG (10.2%), followed by GGC (6.3%). Theoretically, the repeats that are able to form alternative, slipped DNA structures during DNA polymerase slippage would be generated more frequently than others (Toth et al., 2000). The (CAG)n motif is one of the repeats that shows a considerable potential to form alternative DNA conformations (Toth et al., 2000). The abundance of CAG repeats in chicken ESTs that code for (Gln)n is in parallel with its abundance in mammals, yeast, Drosophila, and C. elegans coding regions (Katti et al., 2001). However, the second most abundant trimeric repeat found in this study, GGC, is relatively abundant in mammalian exons but is uncommon in yeast genes (Li et al., 2004). The distribution of trimeric motifs in the chicken was different from catfish (Serapion et al., 2004) and zebrafish (Ju et al., 2005), in

1571
©FUNPEC-RP www.funpecrp.com.brGenetics and Molecular Research 11 (2): 1558-1574 (2012)
Functional genome analysis for efficient EST-SSRs in chicken
which the AAT/TAA motif is the most abundant motif and trimeric motifs consisting of only Gs and/or Cs or combinations of G/C are rare. However, this is similar to plant species, in which the CCG/GGC motif is the most abundant (Peng and Lapitan, 2005). The triplet repeat with the same base composition (AGC=CAG) is found much more frequently in cattle (AGC; 12%) (Yan et al., 2008). Unlike the distribution of the trimeric and pentameric repeat motifs, the AT-rich tetrameric repeat motifs were the most frequent type of chicken EST-SSRs (Figures 5-7). In addition, the overall composition of SSRs in coding regions is similar to that in vertebrates and shows that A/T repeats are more frequent than G/C repeats in chicken coding sequences.
Among the EST-SSRs that were ≥20 bp in length (Class I SSRs), the trimeric repeats were the most abundant type of repeat motif, followed by dimeric repeats (Figure 3). There-fore, AT/TA is the most abundant Class I dimeric SSR, and the abundance of GGC is higher than GAC in the Class I trimeric SSRs (data not shown). In general, the microsatellites show a decrease in repeat abundance with increasing repeat length (Grover et al., 2007). The rationale for the Class I and Class II categories of SSRs is that longer perfect repeats (Class I) are highly polymorphic, as evidenced by the experimental data originally reported in humans (Weber, 1990) and confirmed by studies in many other organisms, including rice (Cho et al., 2000). Microsatellites in Class II tend to be less variable and represent sites where SSR expansion may occasionally occur but is likely limited due to a lower chance of slipped-strand impair-ment over the shorter SSR template (Temnykh et al., 2001).
The chromosomal location of the SSR-containing sequences was predicted by in silico mapping of the chicken genome. Of the 39 chicken chromosome pairs, nine micro-chromosomes (GGA29, GGA30, GGA31, GGA33, GGA34, GGA35, GGA36, GGA37, and GGA38) have not been assembled in version 2.1 of the genome. We therefore supposed that the unknown annotated genes occur in microchromosomes. EST-SSRs appear to be dispersed unevenly across the G. gallus genome, and there is a higher density of EST-SSRs on macro-chromosomes (GGA1-5+GGAZ) than on microchromosomes. This observation is consistent with reports that the gene density of microchromosomes is higher in chickens (Hillier et al., 2004). This may be due to higher recombination rates on microchromosomes because there is a strong negative correlation between repeat density and the recombination rate. Despite ~75% of chicken genes being located on microchromosomes (McQueen et al., 1998), EST-SSRs are more abundant on macrochromosomes. There is a significant distribution bias for the GGA2 and GGA10 chicken chromosomes, indicating that these two chromosomes have significantly more SSR-containing sequences in their genes than genes on the other chromosomes.
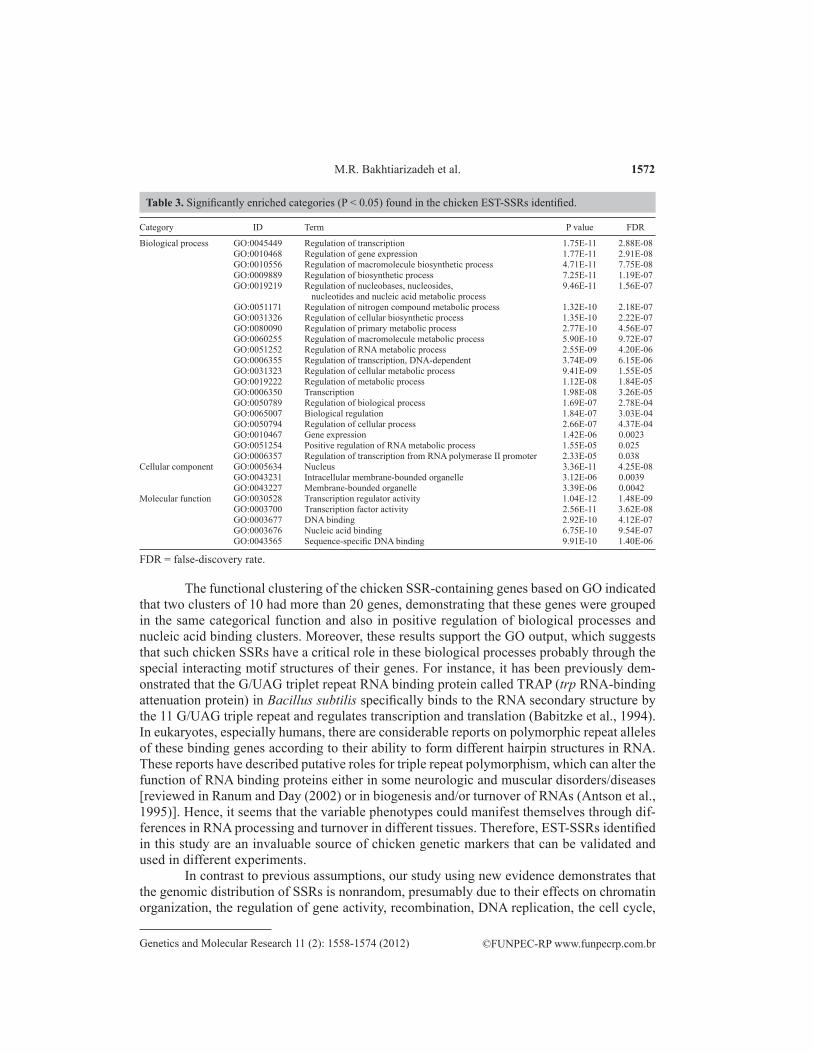
Annotating the SSR-containing sequences provides an opportunity to examine the functional diversity of the different proteins. GO is a useful tool for looking for common traits that are shared within a list of genes (Ashburner et al., 2000). In order to gain insight into the biological significance of the genes that contain SSR repeats, we performed GO analysis and functional annotation clustering at all three levels of GO classification (biological processes, molecular functions and cellular components). The results were filtered at an FDR of 1% or less. At the GO biological process level, 20 of the 162 assignments were significant after mul-tiple-testing correction for the enriched GO terms in the gene lists. At the cellular component level, 3 of the 16 hits were significant after multiple-testing correction, and 5 of the 15 molecu-lar function level hits were significant after multiple testing (Table 3). We implemented this method in order to satisfy GO assignment through the use of a suitable FDR. The top-ranking biological GO terms are listed in Table 3 along with the genes associated with the GO term.
1572
©FUNPEC-RP www.funpecrp.com.brGenetics and Molecular Research 11 (2): 1558-1574 (2012)
M.R. Bakhtiarizadeh et al.
The functional clustering of the chicken SSR-containing genes based on GO indicated that two clusters of 10 had more than 20 genes, demonstrating that these genes were grouped in the same categorical function and also in positive regulation of biological processes and nucleic acid binding clusters. Moreover, these results support the GO output, which suggests that such chicken SSRs have a critical role in these biological processes probably through the special interacting motif structures of their genes. For instance, it has been previously dem-onstrated that the G/UAG triplet repeat RNA binding protein called TRAP (trp RNA-binding attenuation protein) in Bacillus subtilis specifically binds to the RNA secondary structure by the 11 G/UAG triple repeat and regulates transcription and translation (Babitzke et al., 1994). In eukaryotes, especially humans, there are considerable reports on polymorphic repeat alleles of these binding genes according to their ability to form different hairpin structures in RNA. These reports have described putative roles for triple repeat polymorphism, which can alter the function of RNA binding proteins either in some neurologic and muscular disorders/diseases [reviewed in Ranum and Day (2002) or in biogenesis and/or turnover of RNAs (Antson et al., 1995)]. Hence, it seems that the variable phenotypes could manifest themselves through dif-ferences in RNA processing and turnover in different tissues. Therefore, EST-SSRs identified in this study are an invaluable source of chicken genetic markers that can be validated and used in different experiments.
In contrast to previous assumptions, our study using new evidence demonstrates that the genomic distribution of SSRs is nonrandom, presumably due to their effects on chromatin organization, the regulation of gene activity, recombination, DNA replication, the cell cycle,
Category ID Term P value FDR
Biological process GO:0045449 Regulation of transcription 1.75E-11 2.88E-08 GO:0010468 Regulation of gene expression 1.77E-11 2.91E-08 GO:0010556 Regulation of macromolecule biosynthetic process 4.71E-11 7.75E-08 GO:0009889 Regulation of biosynthetic process 7.25E-11 1.19E-07 GO:0019219 Regulation of nucleobases, nucleosides, 9.46E-11 1.56E-07 nucleotides and nucleic acid metabolic process GO:0051171 Regulation of nitrogen compound metabolic process 1.32E-10 2.18E-07 GO:0031326 Regulation of cellular biosynthetic process 1.35E-10 2.22E-07 GO:0080090 Regulation of primary metabolic process 2.77E-10 4.56E-07 GO:0060255 Regulation of macromolecule metabolic process 5.90E-10 9.72E-07 GO:0051252 Regulation of RNA metabolic process 2.55E-09 4.20E-06 GO:0006355 Regulation of transcription, DNA-dependent 3.74E-09 6.15E-06 GO:0031323 Regulation of cellular metabolic process 9.41E-09 1.55E-05 GO:0019222 Regulation of metabolic process 1.12E-08 1.84E-05 GO:0006350 Transcription 1.98E-08 3.26E-05 GO:0050789 Regulation of biological process 1.69E-07 2.78E-04 GO:0065007 Biological regulation 1.84E-07 3.03E-04 GO:0050794 Regulation of cellular process 2.66E-07 4.37E-04 GO:0010467 Gene expression 1.42E-06 0.0023 GO:0051254 Positive regulation of RNA metabolic process 1.55E-05 0.025 GO:0006357 Regulation of transcription from RNA polymerase II promoter 2.33E-05 0.038Cellular component GO:0005634 Nucleus 3.36E-11 4.25E-08 GO:0043231 Intracellular membrane-bounded organelle 3.12E-06 0.0039 GO:0043227 Membrane-bounded organelle 3.39E-06 0.0042Molecular function GO:0030528 Transcription regulator activity 1.04E-12 1.48E-09 GO:0003700 Transcription factor activity 2.56E-11 3.62E-08 GO:0003677 DNA binding 2.92E-10 4.12E-07 GO:0003676 Nucleic acid binding 6.75E-10 9.54E-07 GO:0043565 Sequence-specific DNA binding 9.91E-10 1.40E-06
FDR = false-discovery rate.
Table 3. Significantly enriched categories (P < 0.05) found in the chicken EST-SSRs identified.

1573
©FUNPEC-RP www.funpecrp.com.brGenetics and Molecular Research 11 (2): 1558-1574 (2012)
Functional genome analysis for efficient EST-SSRs in chicken
and the mismatch repair system. In addition, EST-SSRs provide a framework for analyzing alternative splicing in future studies.
CONCLUSION
The huge amount of genomic and functional genomic information generated by se-quencing projects in recent years provides new opportunities and approaches for various branches of biological science, including the study of molecular markers. EST-SSR marker identification is one of the side effects of progress in genomics and provides the opportu-nity for application in functional genomics in addition to classical marker applications. In this study, an in silico analysis of chicken UniGenes using the SSRLocator tool identified 1204 SSR markers. These markers may not be functionally constrained and may therefore be polymorphic, especially the trimeric Class I microsatellite repeats, which are supposed to be highly polymorphic SSR repeats. The cost-effective development of microsatellite markers from EST-SSRs can create tools for ongoing genetic studies in birds, including gene mapping, analysis of genetic diversity, and comparative and population genomic studies.
ACKNOWLEDGMENTS
Research supported by the Tehran University Department of Animal Science. We thank Luciano C. da Maia for support with the primary SSRLocator software output.
REFERENCES
Adams MD, Kelley JM, Gocayne JD, Dubnick M, et al. (1991). Complementary DNA sequencing: expressed sequence tags and human genome project. Science 252: 1651-1656.
Antson AA, Otridge J, Brzozowski AM, Dodson EJ, et al. (1995). The structure of trp RNA-binding attenuation protein. Nature 374: 693-700.
Ashburner M, Ball CA, Blake JA, Botstein D, et al. (2000). Gene ontology: tool for the unification of biology. The gene ontology consortium. Nat. Genet. 25: 25-29.
Babitzke P, Stults JT, Shire SJ and Yanofsky C (1994). TRAP, the trp RNA-binding attenuation protein of Bacillus subtilis, is a multisubunit complex that appears to recognize G/UAG repeats in the trpEDCFBA and trpG transcripts. J. Biol. Chem. 269: 16597-16604.
Blackburn HD (2006). The national animal germplasm program: challenges and opportunities for poultry genetic resources. Poult. Sci. 85: 210-215.
Brown GR, Kadel EE, III, Bassoni DL, Kiehne KL, et al. (2001). Anchored reference loci in loblolly pine (Pinus taeda L.) for integrating pine genomics. Genetics 159: 799-809.
Cho YG, Ishii T, Temnykh S and Chen X (2000). Diversity of microsatellites derived from genomic libraries and GenBank sequences in rice (Oryza sativa L.). Theor. Appl. Genet. 100: 713-722.
Collard B, Jahufer M, Brouwer J and Pang E (2005). An introduction to markers, quantitative trait loci (QTL) mapping and marker-assisted selection for crop improvement: The basic concepts. Euphytica 142: 169-196.
Conesa A, Gotz S, Garcia-Gomez JM, Terol J, et al. (2005). Blast2GO: a universal tool for annotation, visualization and analysis in functional genomics research. Bioinformatics 21: 3674-3676.
da Maia LC, Palmieri DA, de Souza VQ, Kopp MM, et al. (2008). SSR locator: tool for simple sequence repeat discovery integrated with primer design and PCR simulation. Int. J. Plant Genomics 2008: 412696.
Grover A, Aishwarya V and Sharma PC (2007). Biased distribution of microsatellite motifs in the rice genome. Mol. Genet. Genomics 277: 469-480.
Hillier LW, Miller W, Birney E and Warren W (2004). Sequence and comparative analysis of the chicken genome provide unique perspectives on vertebrate evolution. Nature 432: 695-716.
Joshi RK, Kar B and Nayak S (2011). Exploiting EST databases for the mining and characterization of short sequence
1574
©FUNPEC-RP www.funpecrp.com.brGenetics and Molecular Research 11 (2): 1558-1574 (2012)
M.R. Bakhtiarizadeh et al.
repeat (SSR) markers in Catharanthus roseus L. Bioinformation 5: 378-381.Ju Z, Wells MC, Martinez A, Hazlewood L, et al. (2005). An in silico mining for simple sequence repeats from expressed
sequence tags of zebrafish, medaka, Fundulus, and Xiphophorus. In Silico Biol. 5: 439-463.Katti MV, Ranjekar PK and Gupta VS (2001). Differential distribution of simple sequence repeats in eukaryotic genome
sequences. Mol. Biol. Evol. 18: 1161-1167.Li YC, Korol AB, Fahima T and Nevo E (2004). Microsatellites within genes: structure, function, and evolution. Mol.
Biol. Evol. 21: 991-1007.McQueen HA, Siriaco G and Bird AP (1998). Chicken microchromosomes are hyperacetylated, early replicating, and gene
rich. Genome Res. 8: 621-630.Mittal N and Dubey AK (2009). Microsatellite markers - A new practice of DNA based markers in molecular genetics.
Pharmacogn. Rev. 3: 235-246.Peng JH and Lapitan NL (2005). Characterization of EST-derived microsatellites in the wheat genome and development
of eSSR markers. Funct. Integr. Genomics 5: 80-96.Primmer CR, Raudsepp T, Chowdhary BP, Moller AP, et al. (1997). Low frequency of microsatellites in the avian genome.
Genome Res. 7: 471-482.Ranum LP and Day JW (2002). Dominantly inherited, non-coding microsatellite expansion disorders. Curr. Opin. Genet.
Dev. 12: 266-271.Serapion J, Kucuktas H, Feng J and Liu Z (2004). Bioinformatic mining of type I microsatellites from expressed sequence
tags of channel catfish (Ictalurus punctatus). Mar. Biotechnol. 6: 364-377.Slate J, Hale MC and Birkhead TR (2007). Simple sequence repeats in zebra finch (Taeniopygia guttata) expressed
sequence tags: a new resource for evolutionary genetic studies of passerines. BMC Genomics 8: 52.Temnykh S, DeClerck G, Lukashova A, Lipovich L, et al. (2001). Computational and experimental analysis of
microsatellites in rice (Oryza sativa L.): frequency, length variation, transposon associations, and genetic marker potential. Genome Res. 11: 1441-1452.
Thiel T, Michalek W, Varshney RK and Graner A (2003). Exploiting EST databases for the development and characterization of gene-derived SSR-markers in barley (Hordeum vulgare L.). Theor. Appl. Genet. 106: 411-422.
Toth G, Gaspari Z and Jurka J (2000). Microsatellites in different eukaryotic genomes: survey and analysis. Genome Res. 10: 967-981.
Van Lith HA and Van Zutphen LF (1996). Characterization of rabbit DNA microsatellites extracted from the EMBL nucleotide sequence database. Anim. Genet. 27: 387-395.
Victoria FC, da Maia LC and de Oliveira AC (2011). In silico comparative analysis of SSR markers in plants. BMC Plant Biol. 11: 15.
Weber JL (1990). Informativeness of human (dC-dA)n.(dG-dT)n polymorphisms. Genomics 7: 524-530.Wierdl M, Dominska M and Petes TD (1997). Microsatellite instability in yeast: dependence on the length of the
microsatellite. Genetics 146: 769-779.Yan Q, Zhang Y, Li H, Wei C, et al. (2008). Identification of microsatellites in cattle unigenes. J. Genet. Genomics 35:
261-266.Zhang W, Wang Z, Zhao Z and Zeng X (2010). Using bioinformatics methods to develop EST-SSR markers from sheep’s
ESTs. J. Anim. Vet. Adv. 9: 2759-2762.