application of fuzzy logic and topsis in the taguchi...
TRANSCRIPT

Application of Fuzzy Logic and TOPSIS in the Taguchi Method for Multi-Response Optimization in
Electrical Discharge Machining (EDM)
Thesis submitted in partial fulfillment of the requirements for the Degree of
Bachelor of Technology (B. Tech.)
In
Mechanical Engineering
By
UMAKANTA BEHERA
Roll No. 108ME017
Under the Guidance of
Prof. SAURAV DATTA
NATIONAL INSTITUTE OF TECHNOLOGY ROURKELA 769008, INDIA

2
NATIONAL INSTITUTE OF TECHNOLOGY ROURKELA 769008, INDIA
Certificate of Approval
This is to certify that the thesis entitled APPLICATION OF FUZZY LOGIC AND
TOPSIS IN THE TAGUCHI METHOD FOR MULTI-RESPONSE OPTIMIZATION IN
ELECTRICAL DISCHARGE MACHINING (EDM) submitted by Sri Umakanta
Behera has been carried out under my supervision in partial fulfillment of the
requirements for the Degree of Bachelor of Technology in Mechanical
Engineering at National Institute of Technology, Rourkela, and this work has not
been submitted elsewhere before for any other academic degree/diploma.
------------------------------------------
Dr. Saurav Datta
Assistant Professor Department of Mechanical Engineering
National Institute of Technology, Rourkela Rourkela-769008
Date:

3
Acknowledgement
I wish to express my profound gratitude and indebtedness to Dr. Saurav Datta, Assistant
Professor, Department of Mechanical Engineering, National Institute of Technology,
Rourkela, for introducing the present topic and for their inspiring guidance, constructive
criticism and valuable suggestion throughout this project work.
I am also thankful to Prof. Kalipada Maity, Professor and Head, Department of
Mechanical Engineering, National Institute of Technology, Rourkela, for his constant
support and encouragement.
I am also grateful to Prof. Chandan Kumar Biswas, Associate Professor, Department of
Mechanical Engineering, National Institute of Technology, Rourkela, for his help and
support in providing us valuable inputs and permitting us to use the Production
Engineering Laboratory for the experiments.
I would also like to thank Mr. Kunal Nayak, Staff Member of the Production
Engineering Laboratory, Sri Shailesh Debangan, Ph. D. Scholar, Sri Kumar Abhishek,
Sri Chitrasen Samantra, M. Tech. Scholar of Production Engineering specialization for
their assistance and help in carrying out experiments.
Last but not the least, my sincere thanks goes to all our friends who have patiently
extended all sorts of help for accomplishing this undertaking.
UMAKANTA BEHERA

4
Abstract
Recently optimization of multi-response problems is a most focusing area of research.
This study highlights application of fuzzy logic and TOPSIS in the Taguchi method to
optimize a multi-response problem on Electrical Discharge Machining (EDM). In many
manufacturing/production contexts, it is still necessary to rely on the engineering
judgment to optimize the multi-response problem; therefore uncertainty seems to be
increased during the decision-making process. Therefore, development of efficient multi-
response optimization philosophies is indeed required. In this work, the experiment has
been carried out by using 304L grade stainless steel as a work material and a copper as
a tool electrode in EDM. Conversely, optimal process parameter setting has been
selected successfully based on requirements of quality as well as productivity. A case
study has been reported towards optimizing material removal rate (MRR) and roughness
average of the EDM machined product in order to make a compromise balance between
quality and productivity.

5
Index
Item Page No.
Title Page 01
Certificate 02
Acknowledgement 03
Abstract 04
Index 05
1. Introduction and State of Art 06
2. Experiments 12
3. Fuzzy Inference System (FIS) 13
4. TOPSIS Method 13
5. Data Analysis: Application of FIS 16
6. Data Analysis: Application of TOPSIS 17
7. Conclusions 17
8. Bibliography 28
Appendix 31
Communication 33

6
1. Introduction and State of Art
Electric discharge machining (EDM) is a nonconventional machining process whereby a
desired shape is obtained using electrical discharges (sparks). Material is removed from
the work piece by a series of rapidly recurring current discharges between two electrodes,
separated by a dielectric liquid and subject to an electric voltage. One of the electrodes is
called the tool-electrode, while the other is called the work piece-electrode, or ‘work
piece’.
Tzeng and Chen (2003) presented a simple approach for optimizing high-speed
electrical-discharge machining (EDM). The approach began with designing the ideal
function of an EDM system coupled with Taguchi methods for process optimization. It
was proposed that the ideal function had linear relationship between the input signal
(intended dimension) and the output response (product dimension). This model aimed to
develop a robust machining process enabling high precision and accuracy of machining a
product. In this study, a two-step optimization strategy was applied. The first step was to
reduce the functional variability of the EDM system to enhance process robustness. The
second step was to increase the machining accuracy by adjusting the slope of the best-fit
line between the input signals and the output responses. Experimental results showed that
the use of the proposed model was simple, effective, and efficient in the development of
robust and high-quality EDM machining processes.
Wu et al. (2005) investigated the effect of surfactant and Al powders added in the
dielectric on the surface status of the work piece after EDM. An optimal surface
roughness (Ra) value was achieved under the following parameter positive polarity,
discharge current, pulse duration time, open circuit potential, gap voltage and surfactant

7
concentration. The surface roughness status of the work piece was improved up to 60%
as compared to that EDM under pure dielectric with high surface roughness.
Ghoreishi and Assarzadeh (2006) used two supervised neural networks, namely back
propagation (BP), and radial basis function (RBF) for modeling EDM process. The
networks had three inputs of current, voltage and period of pulses as the independent
process variables, and two outputs of material removal rate (MRR) and surface roughness
(Ra) as performance characteristics. Experimental data, employed for training the
networks and capabilities of the models in predicting the machining behaviour were
verified. For comparison, quadratic regression model was also applied to estimate the
outputs. The outputs obtained from neural and regression models were compared with
experimental results, and the amounts of relative errors were calculated. Based on these
verification errors, it was shown that the radial basis function of neural network was
superior in this particular case, and has the average errors of 8.11% and 5.73% in
predicting MRR and Ra, respectively. Further analysis of machining process under
different input conditions was investigated and comparison results of modeling with
theoretical considerations shows a good agreement, which also proved the feasibility and
effectiveness of the adopted approach.
Mahapatra and Patnaik (2006) used Taguchi’s parameter design to identify significant
machining parameters: discharge current, pulse duration, pulse frequency, wire speed,
wire tension, and dielectric flow affecting the performance measures of WEDM. The
relationship between control factors and responses like metal removal rate (MRR),
surface finish (SF) and cutting width (kerf) were established by means of nonlinear
regression analysis, resulting in a valid mathematical model. Finally, genetic algorithm, a

8
popular evolutionary approach, was employed to optimize the wire electrical discharge
machining process with multiple objectives. The study demonstrated that the WEDM
process parameters could be adjusted to achieve better metal removal rate, surface finish
and cutting width simultaneously.
Kansal et al. (2006) described an investigation towards optimization of EDM process in
which silicon powder was suspended into the dielectric fluid. Taguchi’s method with
multiple performance characteristics has been adopted to obtain an overall utility value
that represented the overall performance of powder mixed EDM (PMEDM). The four
input process parameters, viz. silicon powder concentration added into dielectric fluid,
peak current, pulse duration and duty cycle, were optimized with consideration of
multiple performance characteristics including machining rate, surface roughness and
tool wear rate.
Routara et al. (2007) studied the influence of machining parameters of EDM for
machining of tungsten carbide (WC) using electrolyte copper of negative polarity on
machining characteristics. The second order mathematical models in terms of machining
parameters were developed for surface roughness prediction using response surface
methodology (RSM) on the basis of experimental results.
Reesa et al. (2008) investigated the technological capabilities of a micro machining
process for performing Wire Electro Discharge Grinding (WEDG). In this study, the
effects of different factors on the achievable surface finish after WEDG were
investigated. An experimental study employing the Taguchi parameter design method
was conducted to identify the most important main cut machining parameters that affect
the surface quality of the machined parts. The obtained results were used to analyze the

9
effects of the investigated parameters on the achievable surface roughness, and ultimately
to select the optimum technological parameters for performing WEDG.
Singh and Garg (2009) investigated the effects of various process parameters of WEDM
(like pulse on time, pulse off time, gap voltage, peak current, wire feed and wire tension)
to reveal their impact on material removal rate of hot die steel (H-11) using one variable
at a time approach. The optimal set of process parameters was also predicted to maximize
the material removal rate. It was found that material removal rate (MRR) directly
increased with increase in pulse on time and peak current while decreased with increase
in pulse off time and servo voltage.
Esme et al. (2009) used two techniques, namely factorial design and neural network
(NN) for modeling and predicting the surface roughness of AISI 4340 steel. Surface
roughness was taken as a response variable measured after WEDM and pulse duration,
open voltage, wire speed and dielectric flushing pressure were taken as input parameters.
Relationships between surface roughness and WEDM cutting parameters were
investigated. The level of importance of the WEDM cutting parameters on the surface
roughness was determined by using the analysis of variance method (ANOVA). The
mathematical relation between the work piece surface roughness and WEDM cutting
parameters were established by regression analysis method. Finally, predicted values of
surface roughness by techniques, NN and regression analysis, were compared with the
experimental values and their closeness with the experimental values determined. Results
show that, NN seemed to be a good alternative to empirical modeling based on full
factorial design.

10
Rao and Rao (2010) aimed at optimizing the hardness of surface produced in die sinking
electric discharge machining (EDM) by considering the simultaneous affect of various
input parameters. The experiments were carried out on Ti6Al4V, HE15, 15CDV6 and M-
250 by varying the peak current and voltage and the corresponding values of hardness
were measured. Multiperceptron neural network models were developed using Neuro
solutions package. Genetic algorithm concept was used to optimize the weighing factors
of the network. Sensitivity analysis was also carried out to find the relative influence of
factors on the performance measures. It was observed that type of material effectively
influences the performance measures.
Balc et al. (2010) presented research and case studies undertaken in order to improve the
EDM-wire cutting. Both, the draft cutting and the finishing cutting were discussed, in
order to increase the dimensional accuracy of the part and to keep a high material
removal rate.
Khan et al. (2011) proposed artificial neural network (ANN) models for the prediction of
surface roughness on first commenced Ti-15-3 alloy in electrical discharge machining
(EDM) process. The proposed models used peak current, pulse on time, pulse off time
and servo voltage as input parameters. Multilayer perceptron (MLP) with three hidden
layer feed forward networks were applied. An assessment was carried out with the
models of distinct hidden layer. Training of the models was performed with data from an
extensive series of experiments utilizing copper electrode as positive polarity. The
predictions based on the above developed models were verified with another set of
experiments and were found to be in good agreement with the experimental results.

11
Rao et al. (2011) considered wire-cut electric discharge machining of aluminum-24345
with experimentation done by using Taguchi’s orthogonal array under different
conditions of parameters. The response of surface roughness was considered for
improving the machining efficiency. Optimal combinations of parameters were obtained
by this method.
Rahman et al. (2011) presented the influence of EDM parameters in terms of peak
ampere, pulse on time and pulse off time on surface roughness of titanium alloy (Ti-6Al-
4V). A mathematical model for surface finish was developed using response surface
method (RSM) and optimum machining setting in favor of surface finish were evaluated.
Design of experiments (DOE) techniques was implemented. Analysis of variance
(ANOVA) was performed to verify the fit and adequacy of the developed mathematical
models. The acquired results yield that the increasing pulse on time caused fine surface
till a certain value and then deteriorated the surface finish.
Sivapirakasam et al. (2011) aimed to develop a combination of Taguchi and fuzzy
TOPSIS methods to solve multi-response parameter optimization problems in green
manufacturing. Electrical Discharge Machining (EDM), a commonly used non-traditional
manufacturing process was considered in this study. A decision making model for the
selection of process parameters in order to achieve green EDM was developed. An
experimental investigation was carried out based on Taguchi L9 orthogonal array to
analyze the sensitivity of green manufacturing attributes to the variations in process
parameters such as peak current, pulse duration, dielectric level and flushing pressure.
Weighing factors for the output responses were determined using triangular fuzzy
numbers and the most desirable factor level combinations were selected based on

12
TOPSIS technique. The model developed in this study could be used as a systematic
framework for parameter optimization in environmentally conscious manufacturing
processes.
2. Experimentation
The work material selected for this study was 304L grade stainless steel which is used
widely for making the heat exchangers and chemical containers. The chemical
composition of this material is: 0.03% C, 2.0% Mn, 0.75% Si, 0.045% P, 0.03% S, 18-
20% Cr, 8-12 Ni% and 0.1% N. Hardness of the supplied steel is about 92 HR B. The
material is machined directly with pre-hardened condition and no heat treatment is
required to be carried out. Cupper tool-electrode (30 mm diameter) has been selected as a
machining tool for this EDM process. The process parameters and their ranges
considered based on the idea of literature review and experience of some preliminary
experiments shown in Table 1. The experimental work has been carried out on Electric
Discharge Machine, model ELECTRONICA- ELECTRAPULS PS 50ZNC (die-sinking
type). Commercial grade EDM oil (specific gravity= 0.763, freezing point= 94˚C) was
used as dielectric fluid. The machining performance has been evaluated by two important
process responses namely surface roughness (SR), and material removal rate (MRR). The
surface roughness has been measured by the Talysurf (Taylor Hobson, Surtronic 3+).
Table 2 represents selected orthogonal array design and corresponding response data.

13
3. Fuzzy Inference System (FIS)
Fuzzy inference is a computer paradigm unit based on fuzzy set theory, fuzzy IF-THEN-
rules and fuzzy reasoning through which multiple input objectives can be successfully
converted in to equivalent single output. A fuzzy inference structure comprises with a
fuzzifier, an inference engine, a knowledge base, and defuzzifier. Fuzzifier converts the
crisp input to a linguistic variable using the membership functions stored in the fuzzy
knowledge base. Inference engine converts fuzzy input to the fuzzy output using IF-
THEN type fuzzy rules. Then, defuzzifier converts the fuzzy output of the inference
engine to crisp using membership functions analogous to the ones used by the fuzzifier.
Generally defuzzification of output values is done in centre of area (COA) method.
4. TOPSIS Method
TOPSIS (technique for order preference by similarity to ideal solution) method was
firstly proposed by (Hwang and Yoon, 1981). The basic concept of this method is that
the chosen alternative (appropriate alternative) should have the shortest distance from the
positive ideal solution and the farthest distance from negative ideal solution. Positive
ideal solution is a solution that maximizes the benefit criteria and minimizes adverse
criteria, whereas the negative ideal solution minimizes the benefit criteria and maximizes
the adverse criteria. The steps involved in TOPSIS method are as follows:
Step 1: This step involves the development of matrix format. The row of this matrix is
allocated to one alternative and each column to one attribute. The decision making matrix
can be expressed as:

14
mnmjmm
ijii
nj
nj
m
i
xxxx
xxx
xxxx
xxxx
A
A
A
A
.
.....
..
.....
.
.
.
.
21
21
222221
111211
2
1
D (1)
Here, iA ( ).......,,2,1( mi represents the possible alternatives;
njx j ........,,2,1 represents the attributes related to alternative performance,
nj .,,.........2,1 and ijx is the performance of iA with respect to attribute .jX
Step 2: Obtain the normalized decision matrix ijr .This can be represented as:
m
i
ij
ij
ij
x
xr
1
2
(2)
Here, ijr represents the normalized performance of iA with respect to attribute .jX
Step 3: obtain the weighted normalized decision matrix, ijvV can be found as:
ijj rwV (3)
Here,
n
j
jw1
1
Step 4: Determine the ideal (best) and negative ideal (worst) solutions in this step. The
ideal and negative ideal solution can be expressed as:
a) The ideal solution:
miJjvJjvA iji
iji
,..........,2,1min,max ' (4)
nj vvvv ,.....,........,, 21
b) The negative ideal solution:
15
miJjvJjvA iji
iji
........,,2,1max,min ' (5)
nj vvvv ,....,........,, 21
Here,
:,.......,2,1 jnjJ Associated with the beneficial attributes
:,.......,2,1' jnjJ Associated with non beneficial adverse attributes
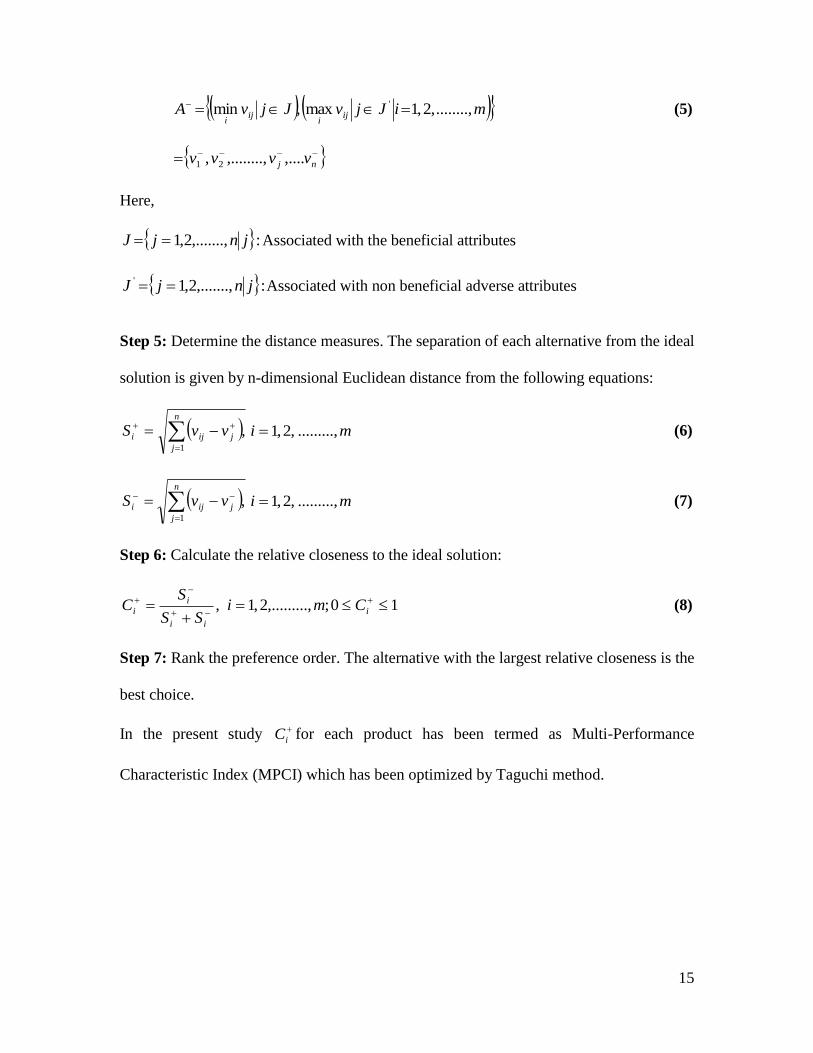
Step 5: Determine the distance measures. The separation of each alternative from the ideal
solution is given by n-dimensional Euclidean distance from the following equations:
n
j
jiji vvS1
, mi .........,,2,1 (6)
n
j
jiji vvS1
, mi .........,,2,1 (7)
Step 6: Calculate the relative closeness to the ideal solution:
10;,,.........2,1,
i
ii
ii Cmi
SS
SC (8)
Step 7: Rank the preference order. The alternative with the largest relative closeness is the
best choice.
In the present study
iC for each product has been termed as Multi-Performance
Characteristic Index (MPCI) which has been optimized by Taguchi method.

16
5. Data Analysis: Application of FIS
Data analysis has been carried out by the procedural hierarchy as shown below.
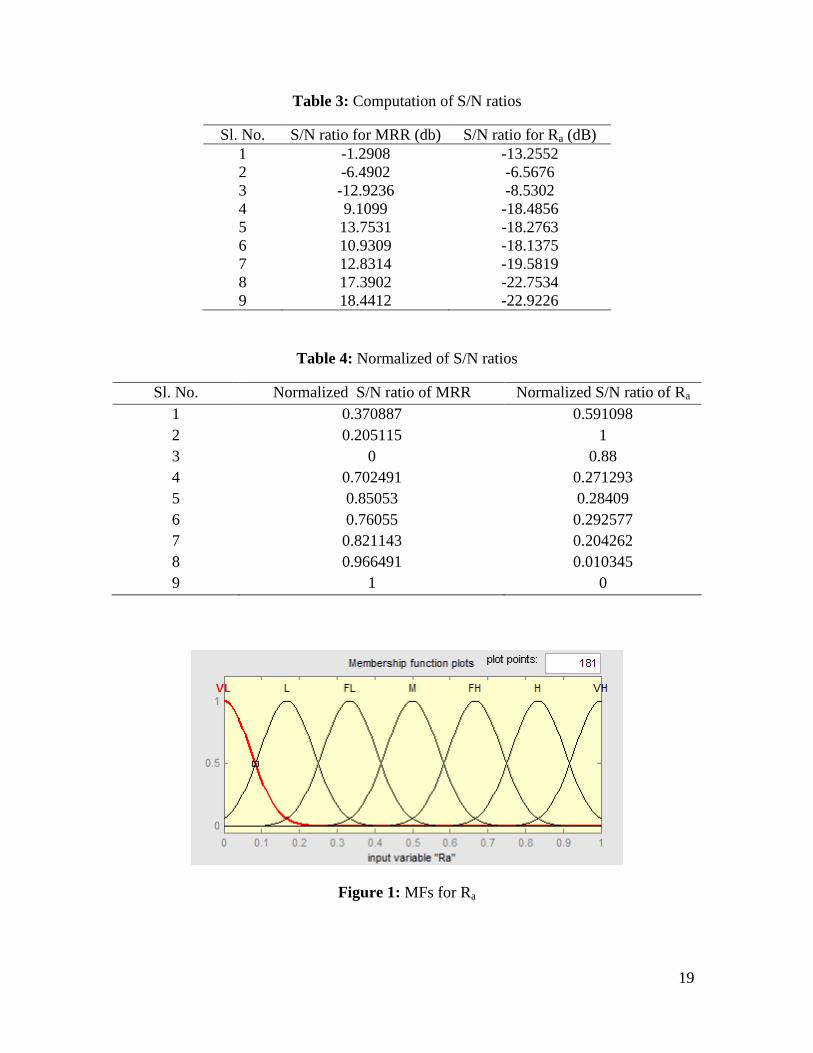
1. Computation of (Signal-to-Noise Ratio) S/N ratio of experimental data (Table 3). For
calculating S/N ratio of MRR, a Higher-the-Better (HB) criterion and for Ra, a
Lower-the-Better (LB) criterion has been selected.
2. S/N ratios have been normalized based on Higher-the-Better (HB) criterion (Table 4).
3. Normalized S/N ratios corresponding to individual responses have been fed as inputs
to a Fuzzy Inference System (FIS). For each of the input parameters seven Gaussian
type membership functions (MFs) have been chosen as: Very Low (VL), Low (L),
Fairly Low (FL), Medium (M), Fairly High (FH), High (H) and Very High (VH).
Based on fuzzy association rule mapping (Table 5) FIS combined multiple inputs into
a single output termed as Multi-Performance Characteristic Index (MPCI). The
linguistic valuation of MPCI has been represented by seven Gaussian type
membership functions (MFs) have been chosen as: Very Low (VL), Low (L), Fairly
Low (FL), Medium (M), Fairly High (FH), High (H) and Very High (VH). These
linguistic values have been transformed into crisp values by defuzzification method.
4. The crisp values of MPCI (Table 2) have been optimized by using Taguchi’
philosophy. The predicted optimal setting has been evaluated from Mean Response
Plot of MPCIs and it became A3 B2 C1 D1.
5. Optimal setting has been verified by confirmatory test.

17
6. Data Analysis: Application of TOPSIS
In TOPSIS based Taguchi approach, experimental data have been normalized first using
Eq. (3). The normalized data have been furnished in Table 8. Elements of normalized
decision-making matrix have been multiplied with corresponding response weights to
obtain weighted normalized decision-making matrix shown in Table 9. Computed Ideal
and Negative-Ideal solutions have been furnished in Table 10. Computed distance
measures: S+ and S
- have been tabulated in Table 11. Closeness Coefficient (CC) against
each experimental run has been calculated using Eq. (8) and shown in Table 12-13. CC
has been optimized (maximized) finally using Taguchi method. Fig. 8 reveals S/N ratio
plot of closeness coefficient values. Optimal parameter combination becomes: which has
been verified by confirmatory test. Ranking of factors according to their influence on CC
has been shown in Table 14 (mean response table for S/N ratio of CCs).
7. Conclusions
Taguchi method is an efficient method used in off-line quality control in that the
experimental design is combined with the quality loss. This method including three
stages of systems design, parameter design, and tolerance design. It is obvious that most
industrial applications solved by Taguchi method refer to single-response problems.
However, in the real world more than one quality characteristic should be considered
simultaneously for most industrial products, i.e. most problems customers concern about
optimization of multiple responses. To this end the present study highlights application
feasibility of fuzzy logic in Taguchi’s optimization philosophy to optimize multiple
18
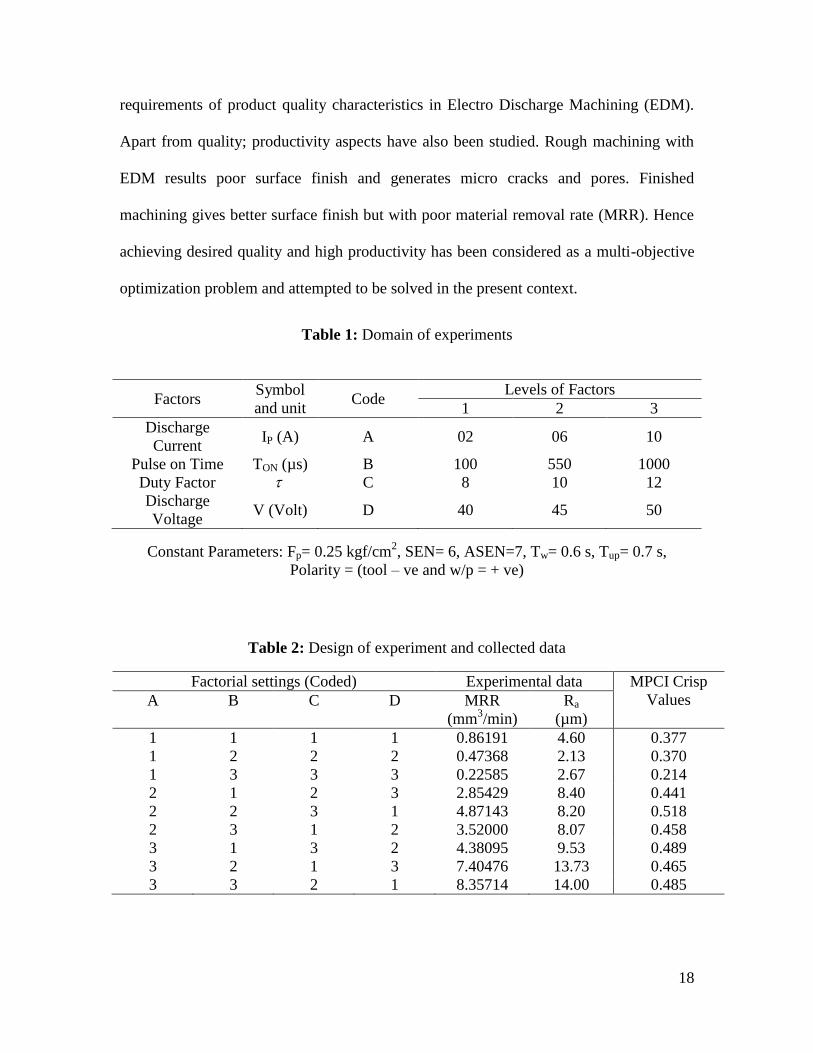
requirements of product quality characteristics in Electro Discharge Machining (EDM).
Apart from quality; productivity aspects have also been studied. Rough machining with
EDM results poor surface finish and generates micro cracks and pores. Finished
machining gives better surface finish but with poor material removal rate (MRR). Hence
achieving desired quality and high productivity has been considered as a multi-objective
optimization problem and attempted to be solved in the present context.
Table 1: Domain of experiments
Factors Symbol
and unit Code
Levels of Factors
1 2 3
Discharge
Current IP (A) A 02 06 10
Pulse on Time TON (µs) B 100 550 1000
Duty Factor C 8 10 12
Discharge
Voltage V (Volt) D 40 45 50
Constant Parameters: Fp= 0.25 kgf/cm
2, SEN= 6, ASEN=7, Tw= 0.6 s, Tup= 0.7 s,
Polarity = (tool – ve and w/p = + ve)
Table 2: Design of experiment and collected data
Factorial settings (Coded) Experimental data MPCI Crisp
Values A B C D MRR
(mm3/min)
Ra
(µm)
1 1 1 1 0.86191 4.60 0.377
1 2 2 2 0.47368 2.13 0.370
1 3 3 3 0.22585 2.67 0.214
2 1 2 3 2.85429 8.40 0.441
2 2 3 1 4.87143 8.20 0.518
2 3 1 2 3.52000 8.07 0.458
3 1 3 2 4.38095 9.53 0.489
3 2 1 3 7.40476 13.73 0.465
3 3 2 1 8.35714 14.00 0.485
19
Table 3: Computation of S/N ratios
Sl. No. S/N ratio for MRR (db) S/N ratio for Ra (dB)
1 -1.2908 -13.2552
2 -6.4902 -6.5676
3 -12.9236 -8.5302
4 9.1099 -18.4856
5 13.7531 -18.2763
6 10.9309 -18.1375
7 12.8314 -19.5819
8 17.3902 -22.7534
9 18.4412 -22.9226
Table 4: Normalized of S/N ratios
Sl. No. Normalized S/N ratio of MRR Normalized S/N ratio of Ra
1 0.370887 0.591098
2 0.205115 1
3 0 0.88
4 0.702491 0.271293
5 0.85053 0.28409
6 0.76055 0.292577
7 0.821143 0.204262
8 0.966491 0.010345
9 1 0
Figure 1: MFs for Ra

20
Figure 2: MFs for MRR
Figure 3: MFs for MPCI

21
Figure 4: Fuzzy rule viewer
Table 5: Fuzzy rule matrix
MPCI Normalized S/N Ratio of MRR
VL L FL M FH H VH
Normalized
S/N Ratio
of Ra
VL VL VL L L FL FL M
L VL VL L FL FL M M
FL L L FL FL M M FH
M L L FL M M FH H
FH L FL FL M FH H H
H L FL M FH FH H VH
VH FL FL M FH H H VH

22
Figure 5: Computation of MPCI

23
Figure 6: Fuzzy inference surface plot
Table 6: Computed MPCI values and corresponding S/N ratios
Sl. No. Factorial Settings MPCI
S/N Ratio of MPCI (dB)
A B C D Experiments Predicted at Optimal setting
1 1 1 1 1 0.377 -8.4732 -4.42356
2 1 2 2 2 0.370 -8.6360
3 1 3 3 3 0.214 -13.3917
4 2 1 2 3 0.441 -7.1112
5 2 2 3 1 0.518 -5.7134
6 2 3 1 2 0.458 -6.7827
7 3 1 3 2 0.489 -6.2138
8 3 2 1 3 0.465 -6.6509
9 3 3 2 1 0.485 -6.2852

24
Figure 7: S/N ratio plot for MPCI (Evaluation of optimal setting) A3 B2 C1 D1
Table 7: Response table for S/N ratios of MPCI
Level A B C D
1 -10.167 -7.266 -7.302 -6.824
2 -6.536 -7.000 -7.344 -7.211
3 -6.383 -8.820 -8.440 -9.051
Delta 3.784 1.820 1.137 2.227
rank 1 3 4 2

25
Table 8: Normalized decision-making matrix
Sl. No. Ra MRR
1 0.172503 0.062669
2 0.079876 0.034442
3 0.100127 0.016422
4 0.315006 0.207536
5 0.307506 0.354202
6 0.302631 0.25594
7 0.357382 0.31854
8 0.514885 0.538401
9 0.52501 0.607649
Table 9: Weighted normalized decision-making matrix
Sl. No. Ra MRR
1 0.086252 0.031335
2 0.039938 0.017221
3 0.050063 0.008211
4 0.157503 0.103768
5 0.153753 0.177101
6 0.151315 0.12797
7 0.178691 0.15927
8 0.257442 0.269201
9 0.262505 0.303825
Table 10: Ideal and negative-ideal solutions
Sl. No. Ideal Negative-Ideal
1 0.039938 0.262505
2 0.303825 0.008211

26
Table 11: Computed distance measures
Sl. No. S+ S
-
1 0.276398 0.177763
2 0.286604 0.222749
3 0.295787 0.212442
4 0.232044 0.141974
5 0.170332 0.200875
6 0.208158 0.163418
7 0.200371 0.172753
8 0.220243 0.261039
9 0.222567 0.295614
Table 12: Closeness coefficient
Sl. No. C+
1 0.60859
2 0.562682
3 0.581996
4 0.620409
5 0.45886
6 0.560203
7 0.537009
8 0.457617
9 0.429516

27
Table 13: Computed S/N ratios of closeness coefficients
Sl. No. Factorial
Settings C+ S/N Ratio
S/N Ratio at predicted optimal
setting A B C D
1 1 1 1 1 0.608590 -4.31350 -3.31612
2 1 2 2 2 0.562682 -4.99473
3 1 3 3 3 0.581996 -4.70161
4 2 1 2 3 0.620409 -4.14644
5 2 2 3 1 0.458860 -6.76640
6 2 3 1 2 0.560203 -5.03309
7 3 1 3 2 0.537009 -5.40037
8 3 2 1 3 0.457617 -6.78995
9 3 3 2 1 0.429516 -7.34041
Figure 8: Prediction of optimal setting A1 B1 C1 D2
(S/N ratio plot for closeness coefficient)

28
Table 14: Response table for S/N ratios of MPCI
Level A B C D
1 -4.670 -4.620 -5.379 -6.140
2 -5.315 -6.184 -5.494 -5.143
3 -6.510 -5.692 -5.623 -5.213
Delta 1.840 1.564 0.244 0.997
rank 1 2 4 3
8. Bibliography
1. Tzeng Yih-fong and Chen Fu-chen (2003) ‘A simple approach for robust design of
high-speed electrical discharge machining technology’, International Journal of
Machine Tools and Manufacture, Vol. 43, pp. 217–227.
2. Wu K.L., Yan B.H., Huang F.Y., Chen S.C. (2005) ‘Improvement of surface finish on
SKD steel using electro-discharge machining with aluminum and surfactant added
dielectric’, International Journal of Machine Tools and Manufacture, Vol. 45, pp.
1195–1201.
3. Ghoreishi M. and Assarzadeh S. (2006) ‘Prediction of material removal rate and
surface roughness in Electro-Discharge Machining (EDM) process based on neural
network models’, Modares Technical and Engineering, No. 24, pp. 102-87.
4. Mahapatra S.S. and Patnaik A. (2006) ‘Optimization of wire electrical discharge
machining (WEDM) process parameters using Taguchi method’, Vol. 34, No. 9-10,
pp. 911-925.
29
5. Kansal H.K., Singh S. and Kumar P. (2006) ‘Performance parameters optimization
(multi-characteristics) of powder mixed electric discharge machining (PMEDM)
through Taguchi’s method and utility concept’, Indian Journal of Engineering and
Materials Sciences, Vol. 13, pp. 209-216.
6. Routara B.C., Sahoo P. and Bandyopadhyay A. (2007) ‘Application of response
surface method for modelling of statistical roughness parameters on Electric
Discharge Machining’, Proceedings of the International Conference on Mechanical
Engineering 2007 (ICME2007), 29- 31 December 2007, Dhaka, Bangladesh.
7. Reesa A., Brousseaua E., Dimova S.S., Gruberb H. and Paganettib I. (2008) ‘Wire
electro discharge grinding: surface finish optimisation’, Multi-Material Micro
Manufacture, S. Dimov and W. Menz (Eds.) 2008 Cardiff University, Cardiff, UK,
Published by Whittles Publishing Ltd.
8. Singh H. and Garg R. (2009) ‘Effects of process parameters on material removal rate
in WEDM’, Journal of Achievements in Materials and Manufacturing Engineering,
Vol. 32, No. 1, pp. 70-74.
9. Esme U., Sagbas A. and Kahraman F. (2009) ‘Prediction of surface roughness in wire
electrical discharge machining using design of experiments and neural networks’,
Iranian Journal of Science and Technology, Transaction B, Engineering, Vol. 33, No.
B3, pp 231-240.
10. Rao G.K.M.
and Rao D.H. (2010) ‘Hybrid modeling and optimization of hardness of
surface produced by electric discharge machining using artificial neural networks and
genetic algorithm’, ARPN Journal of Engineering and Applied Sciences, Vol. 5, No.
5, pp. 72-81.
30
11. Balc N., Balas M., Popan A., Luca A. (2010) ‘Methods of improving the efficiency of
the EDM-wire cutting’, Annals of the Oradea University, Fascicle of Management
and Technological Engineering, Vol. 9, No. 19, NR4, pp. 4.69-4.72.
12. Khan Md. A.R., Rahman M.M., Kadirgama K., Maleque M.A. and Bakar R.A. (2011)
‘Artificial intelligence model to predict surface roughness of Ti-15-3 alloy in EDM
process’, World Academy of Science, Engineering and Technology, Vol. 74, pp. 198-
202.
13. Rao P.S., Ramji K. and Satyanarayana B. (2011) ‘Effect of WEDM conditions on
surface roughness: A parametric optimisation using Taguchi method’, International
Journal of Advanced Engineering Sciences and Technologies, Vol. 6, No. 1, pp. 41-
48.
14. Rahman M.M., Khan Md. A.R., Noor M.M., Kadirgama K. and Bakar R.A. (2011)
‘Optimization of machining parameters on surface roughness in EDM of Ti-6Al-4V
using response surface method’, Advanced Materials Research, Vol. 213, pp. 402-
408.
15. Sivapirakasam S.P., Mathew J. and Surianarayanan M. (2011) ‘Multi-attribute
decision making for green electrical discharge machining’, Expert Systems with
Applications, Vol. 38, pp. 8370–8374.
16. Hwang C. L. and Yoon K. (1981) ‘Multiple Attribute Decision Making Methods and
Applications’, A State-of-the-Art Survey, Springer Verlag, New York.

31
Appendix
EDM machined surface (Sample No. 6)
EDM machined surface (Sample No. 7)

32
EDM machined surface (Sample No. 8)
EDM machined surface (Sample No. 9)

33
SACALE: 4” ~720 Pixels
Communication
Umakanta Behera, Chitrasen Samantra, Saurav Datta, Siba Sankar Mahapatra,
“Application of Fuzzy Logic in the Taguchi Method for multi-response optimization in
EDM”, International Conference on Modeling, Optimization and Computing (ICMOC
2012), Noorul Islam University, Noorul Islam Centre for Higher Education, Kumaracoil,
Thuckalay, Kanyakumari District, Tamilnadu State, India- 629 180, April 10-11 2012.
(Accepted)