application of geophysical methods in foundation
TRANSCRIPT

GSJ: Volume 8, Issue 3, March 2020, Online: ISSN 2320-9186
www.globalscientificjournal.com
APPLICATION OF GEOPHYSICAL METHODS IN
FOUNDATION INVESTIGATION FOR CONSTRUCTION
PURPOSES AT OLKARIA (V) FIELDS, KENYA. Author 1. James omwoyo obare Department of legal Metrology, KisiiCounty, Kenya. Email: [email protected],Phone:
0716175750 Supervisors 2. Prof. Nicholas O. Mariita Director Geothermal Training & Research Institute DedanKimathi University of Technology
Kenya. Email: [email protected] Phone: 0723297815 3. Dr. NjengaMburu Director Department of Civil Engineering, DedanKimathi University of Technology, Kenya.
Email: [email protected], Phone: 0728777573
ABSTRACT
Geophysical methods were used in structural foundation investigation at Olkaria (V) field in
Kenyan rift valley prior to the construction works. Geophysical techniques were of preference
because they are faster, cost effective and non-destructive compared to conventional way such as
boring and drilling which are expensive, invasive and provide information in discrete area.
Geophysical investigations provide a wider picture of the subsurface that aid in evaluation of
ground fitness for construction purposes. The objective of this investigation was to determine the
depth to bedrock that forms a firm foundation for development purposes. Electrical resistivity
and seismic methods were used in ground assessment for its suitability in structural development.
GSJ: Volume 8, Issue 3, March 2020 ISSN 2320-9186 121
GSJ© 2020 www.globalscientificjournal.com

Data was collected using electrical resistivity imaging system, geographical positioning system
(GPS), receiver and seismograph. The RES2DINV and Geometrics SeisImager Software
respectively were used to process results obtained from these investigations. The methods used
gave results that are significant in the preliminary stages of site assessment for foundation works.
The techniques probe the depth to the bedrock and reveal weak soils zones. The analysis and
interpretation of geophysical data provide a better understanding into the subsurface geology for
foundation works.
Compact rock materials were observed from a depth of 14m below ground level extending down
to greater depths. Further, the area was characterized by weak Silty material, which has low
bearing and consolidation ability. Such materials are prone to frequent washout under conditions
of percolating waters hence require utmost care during the placement of engineering structures.
Utilization of piles is necessary and should be anchored to a depth greater than 14m below
ground level such that they rest directly on the competent bed. In-situ compaction should go
before utilization of reinforced concrete amid the development of shallow foundation to achieve
the maximum compaction limits due to the anticipated load of the proposed infrastructure.
Equally, excavation of the top soil is necessary and thereafter refilling with competent material
such as gravel and laterite in order to have a strong basement.
Key words: Electrical resistivity, Seismic refraction, Shear wave velocity and Geotechnical
exploration.
1.0 Introduction The principle target of this study is to describe the use of electrical resistivity and seismic
method in foundation investigation at Olkaria (v) fields, with the perspective of determining the
depth to bedrock that forms a firm foundation for development purposes.The proposed Olkaria V
power plant (Figure 1.1) is found inside the Olkaria Domes Production Field inside the Olkaria
Geothermal area which is the primary point of this investigation. The Olkaria Domes Production
field aids the Olkaria (IV) power plant, producing 140 MWe and a progression of wellhead
generators at different wells inside the field. The volcanic and basic improvement of the Kenya
Rift has been contemplated for a long time utilizing chronologic and litho-stratigraphic
relationship strategies (Thompson and Dodson, 1963; Baker and Wohlenberg, 1971). It is well
GSJ: Volume 8, Issue 3, March 2020 ISSN 2320-9186 122
GSJ© 2020 www.globalscientificjournal.com

understood that volcanic activites began amid the early Miocene with broad basaltic and
phonolitic volcanism on the top of the raised dome.
Figure 1.1: Map of the proposed Olkaria V power station (KenGen Internal Report, 2014)
This paper provides fundamental information on the subsurface geology using electrical resistivity
tomography and seismic methods that were deployed at Olkaria geothermal fields.Thesemethods
provide subsurface information with little cost involved and wider area of coverage for a short
time. Further theyidentify anomalies and describe the complexity of the subsurface geology with
ease compared to conventional methods such as boring and drilling that takes a very long time to
acquire data and costly. In engineering works, undetected subsurface structures such as faults,
fractures and inhomogeneity in geological material can adversely affect the integrity of the
foundation structure. Thereby information regarding the bearing ability of soil is vital for risk
assessment and thereafter mitigation.The surveys will evaluate the physical properties of the
subsurface in terms of soil competence, depth to bedrock and the lithological sequence.
Foundation examination is a critical program in building and designing structures that ought to
be undertaken prior to any engineering works. Geophysical techniques such as seismic and
resistivity are utilized for the achievement of a better foundation investigation. Electrical
resistivity review in site examination is a prime decision due to cheap cost that is included and
the way that it saves time, simple to complete and can used to decide land structures. (Al-Sayed
GSJ: Volume 8, Issue 3, March 2020 ISSN 2320-9186 123
GSJ© 2020 www.globalscientificjournal.com

and El-Qady 2007). It can be used in a wide area within a short time and the information
acquired can be interpreted with ease.
Geophysical strategies are executed in a wide scope of utilizations extending from ground
examinations in building developments aiming towards the investigation of land structures and
the assurance of the physical parameters of the rock formations. Because of building
development, geophysics can be applied for investigation purposes to give helpful data in regards
to the early identification of conceivably unsafe subsurface conditions. This enables the
engineers to design the structure bearing in mind the foundation defects and the mitigation
measures.
Geophysical investigation for development purpose requires analyzing soil properties and related
features such as faults dispersion and bedrock properties on and beneath the investigation site.
The investigation helps in understanding the subsurface on which the engineering works is done.
It in-cooperates evaluating the hazards the features may have to property and people. Weak
regions with faults and fractures are avoided for a better base establishment. Usually this
problem is articulated in regions where the superimposed materials are non-homogeneous in
nature. Geophysical methods in ground investigation for building construction aim at exploring
the subsurface structures and determining the physical parameters of the rock formation.
In understanding the subsurface using geophysical methods, the physical properties of the
underlain material are of major concern. The physical properties measured by geophysical
methods include; acoustic velocity, electrical resistivity and density. The parameters of interest
in the study of these physical properties are depth to bedrock and rock density.
Electrical resistivity technique is utilized in outlining the different litho units at a proposed
building site. (Omowumi 2014). These measurements taken show layers of rocks from top layer
down with varying conductivity. The electrical current injected into the ground penetrates
through masses of rocks with different conductivity levels. These rocks have been altered and
bare different water content and mineralogy making them to have low or high resistivity values.
In the study of the subsurface this resistivity values become of interest as they give the rock
arrangements depending on the resistivity of each rock. This technique is able to show compact
masses of rocks that are dry and unconsolidated material that have water content. Solid rock
materials have high resistivity values while loose unconsolidated materials have low resistivity.
The sources of perils in structural building disciplines result from undetected close surface
GSJ: Volume 8, Issue 3, March 2020 ISSN 2320-9186 124
GSJ© 2020 www.globalscientificjournal.com

structures, for example, cavities and in homogeneities in the establishment geo-materials. Data
identified with the local soil conditions is fundamental for hazard evaluation and mitigation
(Soupois et al., 2007). Soil conditions such as wetness and dryness play a key role in
understanding the bearing ability of the foundation. The sources of risks in structural designing
controls result from undetected close surface structures, for example in-homogeneities in the
establishment geo-materials. An essential factor frequently considered in foundation
investigation is the water table as it induces unsteadiness of the overlying structure (Othman,
2005). The utilization of the geo-electrical technique is a successful instrument for studying into
the subsurface structure, specifically, for distinguishing abnormalities and characterizing the
multilayered nature of the subsurface topography (Soupois et al., 2007; Lapenna et al., 2005).
The resistivity of ordinary rocks, soil materials and compounds (Keller and Frischknecht 1966,
Daniels and Alberty 1966) as in (Figure 1.2) demonstrates the conductivity in this rocks relying
upon their resistivity. The resistivity of these rocks is dependent on the dimension of cracks, and
the dimension of the cavities occupied with ground water. Molten and metamorphic rocks
normally have high resistivity regards. Thus a given rock type can have an immense extent of
resistivity, subject upon its wetness or dryness. This feature is useful in the distinguishing proof
of crack zones and other weathering features, for instance, in structure and groundwater
inspections.
GSJ: Volume 8, Issue 3, March 2020 ISSN 2320-9186 125
GSJ© 2020 www.globalscientificjournal.com

Figure 1.2: The resistivity of rocks, soils and minerals (Daniels and Alberty 1966)
1.1 Resistivity Theory
Electrical tomography technique aims to build up a picture of the electrical properties of the
subsurface by passing an electrical current along many different paths and measuring the
associated voltage (R. D. Barker 1997).Current flows through the subsurface which consist of
layers with varying resistivity. From one material to another variation in measured resistivity
provide useful information on the physical property of the subsurface. From these
measurements, the true resistivity of the subsurface can be estimated. Electrical resistivity
ofrocks is measured in ohm-meters (Ω-m) which is associated to various geological parameters
such as mineral and fluid content, porosity and degree of water saturation in the rock. (M. N.
Nawawi 2010).It is established thatIgneous and metamorphic rocks typically have high
resistivity values while clay has a significantly lower resistivity than sand. Electrical resistivity is
GSJ: Volume 8, Issue 3, March 2020 ISSN 2320-9186 126
GSJ© 2020 www.globalscientificjournal.com

carried using different electrical configuration (such as wenner and schlumberger) placed at the
surface to send current into the ground to measure the generated voltage signal. (Figure 1.3)
Figure 1.3: Sketch of the electrodes for the 2D electrical resistivity survey and the sequence of measurements for building the pseudo-section [Loke, 2011]
1.2 Seismic Refraction Theory Seismic refraction procedures principally includes creating waves into the ground through blasts
or mallet blows and the subsequent seismic waves are refracted and reflected at interfaces
between materials with various densities in the ground, and their movement times are recorded
utilizing varieties of geophones. Each seismic ray that strikes a thickness divergence a ratio of
the energy is refracted into the underlain layer and the other is reflected.
This strategy utilizes Snell's law to study about the layers underneath the earth surface. From the
movement of waves in a medium, various layers and structures underlain the subsurface can be
determined.
Fractures can be recognized utilizing seismic strategies that are sensitive to rock mechanical
properties and electrical technique that are touchy to rock electrical properties. Electrical
technique is especially valuable when the crack porosity is loaded up with a conductive material,
for example, water, mud, and mineralization. At shallow depths, seismicrefraction is typically
the method of choice since it utilizes the first arrival of seismic energy from explosion to an
array of ground geophones. The speed at which the seismic energy travels varies with the
density of the subsurface materials making it possible to have profiles of seismic velocity from
the variations beneath the geophone array.
GSJ: Volume 8, Issue 3, March 2020 ISSN 2320-9186 127
GSJ© 2020 www.globalscientificjournal.com

1.3 Geotechnical exploration These studies are majorly aimed at establishing the soil strength that will support the load. The
stability of structures is influenced by geotechnical properties of soils, which include density,
compaction, permeability, shear strength, particle analysis, and consistency limits. In the study of
these properties geotechnical investigation such as test pits and trenches are deployed by directly
excavating the ground to obtain samples. The samples are taken to be tested in the laboratory.
These methods have been considered to provide reliable information where boring and drilling is
difficult though these methods are slow and expensive when exploring to greater depths as they
are limited to shallow depths. During excavation the ground is destructed which is likely to alter
even the samples extracted. As geotechnical methods prove to be expensive and destructive,
geophysical investigation use faster, cheaper and non-destructive techniques to determine
subsurface anomalies (Barker, 1993). These methods enhance the reliability and speed by
decrease the cost and time spent by geotechnical investigation (Anderson et al., 2008).
Trial pits are done to obtain large bulk samples of soil particularly where visual investigation of
the strata is required. This method is of preference compared to drilling because of the relative
speed with which it can be carried out. However, this method is not comparable with geophysical
methods because of the level of surface disturbance and the difficulty involved in doing effective
excavation. This method is carried out when the ground is stable and able to stand unsupported,
that is in areas where there is water; excavation becomes problematic due to instability of the
walls. Further in obtaining samples in such areas they may not be a true representative sample
due washout of fine material. Tranches areextension of test pits where the excavator excavates
channels. These trenches provide a continuous exposure of the subsurface material. The
disadvantage of this technique is surface destruction of the site during excavation.
Geotechnical boring allows materials to be extracted from the soil either in small or large
diameter boring. The materials obtained help in developing the insight of the subsurface
topography. However the operation of boring is fundamentally obtaining samples, meaning you
cannot obtain data from the boring activity. This therefore implies that the investment in the
equipment, labour and time gives a sample that ought to be tested. Further, the soil samples are
taken for testing in laboratory where laboratory equipment should be available. The equipment
are expensive, require high skilled operator with high maintenance cost. In sample management,
GSJ: Volume 8, Issue 3, March 2020 ISSN 2320-9186 128
GSJ© 2020 www.globalscientificjournal.com

large samples have to be taken from the site and safely availing them in laboratory and wait for
results. If the data obtained conflicts and need evaluation, the whole process is done again.
Another major shortcoming of geotechnical boring is that during the boring and extraction
process, samples can change the physical characterization. During boring samples loosen and
solid soil samples can be less dense than it actually is due to disturbance from their natural state,
which consequently affects the grain size of the sample. Boring does not provide the accuracy
and efficiency due to getting sample from ground and sending them to the laboratory for testing.
The samples are disturbed from their natural state and thereby may not give the exact
information on ground.
Drilling is majorly aimed at expanding the knowledge obtained from surface mapping, test pits
and trenching at limited depths to provide samples from greater depths and provide access for
test equipment for measurement of water level and permeability. The advantage of drilling is
restricted to depth of investigation. Drilling has slight effect on environment because the hole
can easily be backfilled due to the small size of the hole. Surface disruption is restricted to
preparing a drilling pad on a slope ground. The disadvantage of drilling is that the information
obtained is indirect either from observation of resistance to bit penetration, measurement in situ
properties with equipment being lowered down the hole or by logging of samples recovered by
the drilling, a lot of time is taken in drilling and finally it is expensive in maintenance of drilling
rigs and require high skilled labor in operation.
In order to describe the geotechnical conditions during site investigation it becomes difficult to
access the area with an irregular terrain. Geophysical techniques provide an alternative to
evaluating the subsurface formations and thus provide appropriate soil properties (Rucker, 2006).
Cone penetration testing (CPT) is a geotechnical in-situ investigation tool where you get data to
a depth you want. It reduces time, energy and resources of digging the ground to get samples and
taking them to the laboratory for analysis and possibly sealing off the holes made on the ground.
CPT provides immediate data thus saving time, expense and risk of handling the samples. The
CPT measures the soil properties in natural state with no disturbance making the data to be
correct representation of the actual subsurface conditions. However this method has limitations
which makes unsuitable especially when investigating in areas with boulder deposits. Further
when investigating a wide area for a better presentation more soundings ought to be taken to
have a good representation, which is expensive, time consuming and requires high skilled labour.
GSJ: Volume 8, Issue 3, March 2020 ISSN 2320-9186 129
GSJ© 2020 www.globalscientificjournal.com

2.0 Statement of the Problem Study within the Olkaria Geothermal installations revealed that, the inconsistency in the
structural integrity of foundation anchorage could adversely compromise the strength of the
structure. Site interpretation for development purposes is extremely vital since it enables
designers to adopt prudent safety strategies. Subsurface geological features such faults, fractures,
voids and nearness of depth to bedrock are main dangers that are associated to building's
establishments in areas that have undergone volcanic activities. This necessitated the need for the
study on the proposed site using electrical resistivity methods. This method is of preference
compered to geotechnical methods such as boring, pitting, and trenching which are soil
disturbing, expensive and time consuming in sample acquiring and laboratory analysis. This
geophysical method improve the speed, reliability and minimize the cost of geotechnical
investigation.
2.1 Main Objective To determine the depth to bedrock that forms a firm foundation for development purposes at
Olkariav fields using electrical resistivity and seismic methods.
3.0 METHODOLOGY 3.1 Electrical Resistivity tomography Electrical resistivity is a property that shows how the flow of electric current is opposed in a
material. Rock resistivity relies on electrical resistivity of the constituent minerals in the rock,
water and air in the pores. Ground electrical resistivity is measured by injecting current into the
ground through steel terminals conveyed at specific intervals and another electrode extracts the
current. The voltage between the two electrodes that are collinear with the current electrodes is
measured. The spacing between the electrodes probes the ground to different depths. Several
electrodes are arranged in a straight line with spacing between all electrodes constant. These
electrodes are connected to a data-collection instrument that selects four electrodes for a single
measurement. The device changes the combination of electrodes so that it measures for all the
orderings and spacing.
GSJ: Volume 8, Issue 3, March 2020 ISSN 2320-9186 130
GSJ© 2020 www.globalscientificjournal.com
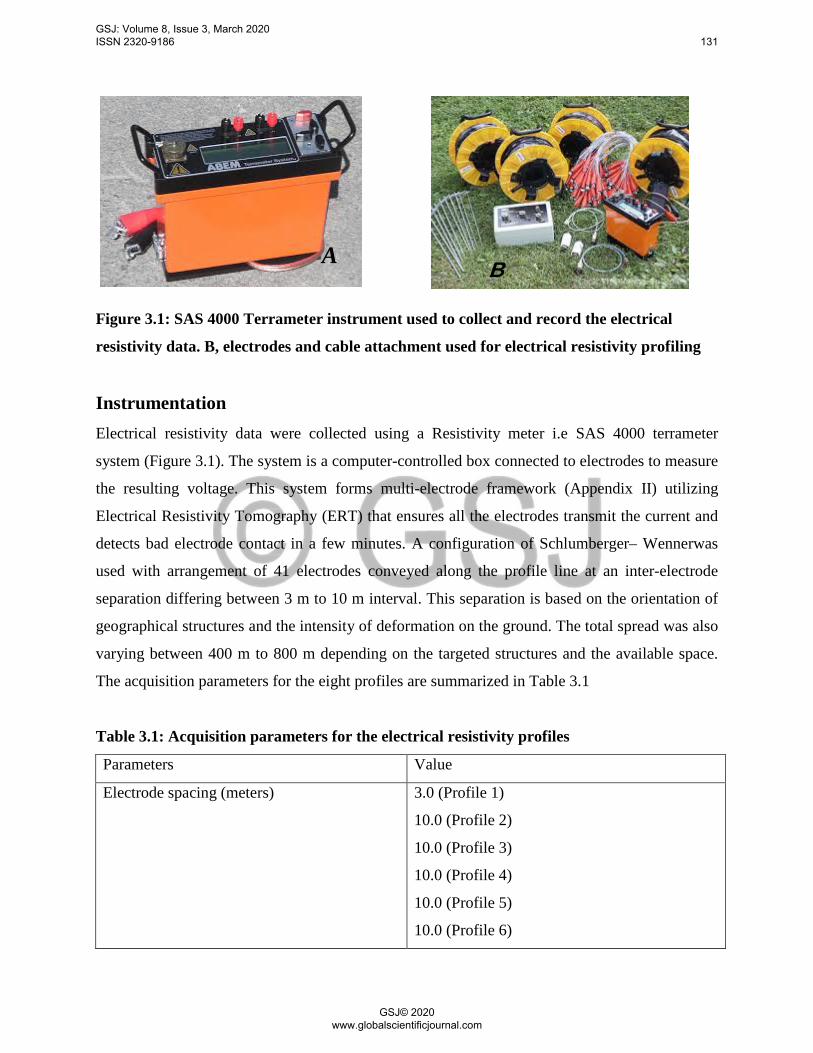
Figure 3.1: SAS 4000 Terrameter instrument used to collect and record the electrical
resistivity data. B, electrodes and cable attachment used for electrical resistivity profiling
Instrumentation Electrical resistivity data were collected using a Resistivity meter i.e SAS 4000 terrameter
system (Figure 3.1). The system is a computer-controlled box connected to electrodes to measure
the resulting voltage. This system forms multi-electrode framework (Appendix II) utilizing
Electrical Resistivity Tomography (ERT) that ensures all the electrodes transmit the current and
detects bad electrode contact in a few minutes. A configuration of Schlumberger– Wennerwas
used with arrangement of 41 electrodes conveyed along the profile line at an inter-electrode
separation differing between 3 m to 10 m interval. This separation is based on the orientation of
geographical structures and the intensity of deformation on the ground. The total spread was also
varying between 400 m to 800 m depending on the targeted structures and the available space.
The acquisition parameters for the eight profiles are summarized in Table 3.1
Table 3.1: Acquisition parameters for the electrical resistivity profiles
Parameters Value
Electrode spacing (meters) 3.0 (Profile 1)
10.0 (Profile 2)
10.0 (Profile 3)
10.0 (Profile 4)
10.0 (Profile 5)
10.0 (Profile 6)
A B
GSJ: Volume 8, Issue 3, March 2020 ISSN 2320-9186 131
GSJ© 2020 www.globalscientificjournal.com

10.0 (profile 7)
10.0 (profile 8)
Profile length (meters) 800 (Profile 1)
600 (Profile 2)
400 (Profile 3)
600 (Profile 4)
600 (Profile 5)
600 (Profile 6)
600 (profile 7)
600 (profile 8)
The data was recorded through a complex combination of current and potential electrode pairs
developing a pseudo cross-section of apparent resistivity underneath the profile. The depth of
investigation was dependent on electrode separation and geometry with greater electrode
separations resulting to greater resistivity measurements from deeper depths. In electrical
resistivity study, depth of investigation is dependent on the relative position of electrodes (Roger
Sala, 2007). Eight profiles soundings were done with the traverse acquired in NW-SE direction
within the zone of interest (Figure 3.2).
GSJ: Volume 8, Issue 3, March 2020 ISSN 2320-9186 132
GSJ© 2020 www.globalscientificjournal.com

Figure 3.2: Resistivity Profile Lines in the Project Site
Electrical resistivities of different zones on the ground composition were distinguished. The
achievement of investigation depended principally on the distinctions in material resistivities, in
light of the fact that the more prominent the distinctions, the more exact interpretation results can
be interpreted.
Data Processing The data collected was moved to a PC for purposes of processing. The voltage measurements
were used to estimate the electrical resistivity with an inversion utilizing RES2DINV software.
The inversion displayed electrical resistivity both lateral and vertical. For the inversion, voltages
and currents are combined into a single parameter called “apparent resistivity” (Zohdy and
others, 1974); the apparent resistivities calculated from the field measurements and from the
model are matched during the inversion by varying the electrical resistivities within the model.
Typical Results Figure 3.3 shows a representative of the cross section of electrical resistivity of profile 3. The
vertical axis indicates the elevation, and the horizontal axis indicates the horizontal distance
1
8
2
3
4
5 6
7
GSJ: Volume 8, Issue 3, March 2020 ISSN 2320-9186 133
GSJ© 2020 www.globalscientificjournal.com

along the ground. The cross section represents a vertical slice through the ground, beneath the
line of electrodes. The top of the cross section corresponds to the ground surface. The shape of
the cross section is trapezoidal. Only this trapezoidal region was thoroughly probed with
electrical current; other regions that were partially probed are not shown. The colors in the cross
section indicate the estimated electrical resistivity: the red and orange colors indicate high
resistivity; the purple and blue colors indicate low resistivity.
Figure 3.3: Typical results from an electrical resistivity profile (profile 3).
3.2 Seismic Refraction Method The method uses shear‑waves generated on ground to describe geologic heterogeneity in the
ground. The Shear‑waves are generated on the surface by the source i.e. a metal plates with a
small sledgehammer. When the metal plate is hit with the hammer, it generates an impulse force
that is transmitted into the ground, generating an S‑wave. After the S‑waves are generated by the
source, they propagate downward, some is reflected and the other is refracted at interfaces of
rock layers then propagate upward. At the surface, the waves are detected by geophones (Figure
3.4) which generates a time varying voltage that is recorded by a Seismograph. The goal of
processing the S‑wave refraction data is to make a seismic cross section that can be related to the
geology of the study site. The recorded voltage from each geophone is called a “trace,” and it
contains fluctuations in the voltage that correspond to refracted waves, together with other
unwanted waves and background noise. Traces from many different locations of the source and
the geophones were recorded and this was to enhance the probe at interfaces with the S‑waves.
Using computer algorithms, the unwanted waves and noise were removed leaving the refractions.
These refractions were consequently used to generate an image that similar to a geologic cross
section.
GSJ: Volume 8, Issue 3, March 2020 ISSN 2320-9186 134
GSJ© 2020 www.globalscientificjournal.com

. Figure 3.4: Apparatus used for S‑wave seismic refraction profiling. A, Geophone used to detect the S‑wave. B, Seismograph used to record the time-varying voltages generated by the geophones.
Figure 3.5: Seismic Profile Lines in the Project Site
Data Collection Data was collected along 5 profiles where the acquisition parameters for each profile is shown in
Table 3.2. All the five profiles were parallel to the road. The sourceand geophone were spaced at
shorter distance such that the subsurface interfacewas thoroughly probed. The five profiles ran
A
B
GSJ: Volume 8, Issue 3, March 2020 ISSN 2320-9186 135
GSJ© 2020 www.globalscientificjournal.com

50m from each other and trended in the NW-SE direction. Analyses of the seismic cross sections
for these five profiles showed how the waves propagated in the ground.
Table 3.2: Acquisition Parameters for the S-Wave Seismic Refraction Profiling.
Data Processing The travel time inversion procedure was conducted for the 2-D analysis using Geometrics
SeisImager software (Geometrics, Inc, 2009):
i. Primary recognition of surface waves
ii. Creating the dispersionpicture board and afterward removing the flag scattering bend
iii. Back-computing Vs difference with depth (2D inversion)
iv. Generation of Vs cross-sections from inversion results
The cross-sections were analyzed based on the wave travel to estimate the depth of different
strata in the subsurface. This data processing procedure is called and is a type of optimization.
Typical Results The seismic cross section for profile 1 (Figure 3.6), the vertical axis indicates the elevation, and
the horizontal axis indicates the horizontal distance along profile 1. The top of the cross section
corresponds to the ground surface, and the other sides indicate the region probed by the S‑waves.
The cross section has three layers, the top layer has the S‑wave velocity less than 160 m/s; the
middle layer has the S‑wave velocity ranging from 160 to 280 m/s; and finally the bottom layer,
S‑wave velocity is greater than 300 m/s.
Parameter Profile 1 Profile 2 Profile 3 Profile 4 Profile 5
Number of geophones
Geophone spacing
Natural frequency of geophones
Source type
Sledgehammer weight in kg
Profile length (meters)
83
3
10 Metal plate
10
250
156
3
10 Metal plate
10
470
153
3
10 Metal plate
10
460
200
3
10 Metal plate
10
600
200
3
10 Metal plate
10
600
GSJ: Volume 8, Issue 3, March 2020 ISSN 2320-9186 136
GSJ© 2020 www.globalscientificjournal.com

Figure 3.6: Vs Profile 1
4.0 RESULTS AND DISCUSSION
4.1 Electrical Resistivity Results i. Bedrock mapping This ERT survey was conducted to assess the bedrock profile prior to power plant construction
project and to characterize the soil layers above the bedrock. Inversion models from the acquired
data gave reliable information with regard to the ground stability. The qualitative analysis of the
profiles is relatively clear from the colour boundaries. The resistivity zones in the profiles are
attributed to sediments in layers. Solid bedrock is attributed to the high-resistivity zones (> 112
Ωm). This ERT survey was able to achieve its main goal, namely to describe the soil below the
site, determine the depth to bedrock.
Figure 4.1: ERT profile-3
GSJ: Volume 8, Issue 3, March 2020 ISSN 2320-9186 137
GSJ© 2020 www.globalscientificjournal.com

A very shallow bedrock is observed in the NW part of profile 3 (Figure 4.1) from -100 to -200
with resistivity value of 66 Ωm to about 140 Ωm and this can be seen to extend up to to 75m
deep at the central profile zone. It is interpreted as consolidated formation. It forms a very good
basement for foundation. Some pockets of high resistivity formations with a resistivity value of
above 146 Ωm are also evident at depths below 30m deep below -110m and +200m. This can be
interpreted as compact formation and forms a good ground for establishing a foundation.
Figure 4.2: ERT profile-1
The ERT profile 1 (Figure 4.2). The resistivity displayed in this profile which is a reflective of
subsurface conditions with top superficial layer range from 0 m to about 2 m below ground level
and comprising of materials of varying conductivities with resistivity range of 55.8 Ωm to 164
Ωm. This is interpreted to be dry pyroclastic. A very low resistivity ranging from 18.9 Ωm to 55
Ωmis observed below this layer that is irregular in shape on the entire stretch and is characterized
by a resistivity which is interpreted as moist pyroclastic with some clays < 18.9 Ωm. This low
resistivity of 18.9 Ωm seems to extend deep forming the irregular resistivity structure an
indication of the weak points along the profile.
ERT-Profile 2 (NW-SE direction)
GSJ: Volume 8, Issue 3, March 2020 ISSN 2320-9186 138
GSJ© 2020 www.globalscientificjournal.com

Figure 4.3: ERT profiles 2, 4, 6, 7 and 8
Profile 2, 4, 6, 7 and 8 (Figure 4.3) shows a varying topography with complex resistivity
structure due to heterogeneous geology of the area. The top layers consist of very low resistivity
penetrating to a depth of about 13m. This layer is interpreted to consist of loose superficial
deposits. Below this layer is a bedrock boundary with high resistivity values (> 112 Ωm)
interpreted as stable formation for ground construction. As also noted in the profiles are high
resistivity pockets rooted from underneath indicating the presence compact geological formation
that is more stable.
ERT-Profile 7 (NW-SE direction)
ERT-Profile 4 (NW-SE direction)
ERT-Profile 6 (NW-SE direction)
ERT-Profile 8 (NW-SE direction)
GSJ: Volume 8, Issue 3, March 2020 ISSN 2320-9186 139
GSJ© 2020 www.globalscientificjournal.com

Figure 4.4: ERT Profiles 5
Profile 5 (Figure 4.4) poses a unique resistivity structure that has not been evident in the previous
profiles. The near surface resistivity value ranges between 36 Ωm to 306 Ωm. This is composed
of loose superficial deposits and some parts are composed of compact formation. Beneath this is
a layer with high resistivity value range of between 151 Ωm to 600 Ωm interpreted as composed
of stable to very stable formation. The stable formation starts at 3m below ground level and
beneath.
The lithology of the Olkaria V field with respect to depth and resistivity based on electrical
resistivity can be summarized as in Table 4.1.
Table 4.1: Summary of ERT data interpretation Profiles Resistivity Depth Probable lithology
18.9-55 2 m Dry pyroclastic
1. 164 25 m Compact material
30-60 13 m loose superficial deposits
2. 112-200 75 m Compact geological formation
29.9-66.2 6 m Superficial deposits of dry unconsolidated pyroclastic
3. 66-140 75 m Compact formation
31-74 13 m Loose superficial deposits
4. 116 75 m Compact formation
36-306 3 m Loose superficial deposits
5. 151-600 75 m Compact formation
60 13 m Loose superficial deposits
6 112 75 m Compact solid rocks
40-55 13 m Loose superficial deposits
7 125-216
and above
75 m Solid rocks
35-76 15 m Loose superficial deposits
8 123-156 75 m Stable ground formation
ERT-Profile 5 (NW-SE direction)
GSJ: Volume 8, Issue 3, March 2020 ISSN 2320-9186 140
GSJ© 2020 www.globalscientificjournal.com

From Table 4.1, it is evident that the resistivity of the first layer is very low (18.9-76) pointing to
a high level of loose material i.e. clay, sands and alluvium. The second layer shows a compact
material with very high resistivity values ranging from 76-216 Ohm-m i.e. quartzite, limestone
and dolomites.
The ERT results were used to infer the depth of lithological units comprising the top soil
(resistivity varying from 18.9-76 Ohm-m and thickness range from 2-13 m);the second layer
composed of compact material (resistivity varying from 76-216 Ohm-m and thickness range
from 13-75). The high resistivity predicted competent geological material such as limestone and
quartz. Very low resistivity suggested clay or sand deposits or water saturated material less
competent to support the stability of heavy engineering structures.
In summary, the resistivity displayed in the area under study reflected the subsurface conditions
with the top layer dominated with superficial deposits which were composed of unconsolidated
pyroclastic. The deposits went to a depth of 13m. Beneath this layer was observed a
stable/compact formation. This layer had very high resistivity material which was interpreted to
be composed of solid rock materials. This second layer forms the stable formation recommended
for structural foundation.
In general, resistivity values were low to a depth of 13m a clear indication that the bedrock is
just 13 meters below the surface. The existence of some weak zones along the profiles indicate
that the area need excavations before any construction works in the site. These zones of
weakness distinguished in the profiles confirmed discontinuous bedrock topography.
4.2 Seismic Refraction Results
Identification of the bedrock and weak zones This seismic survey was used to characterize the soil stiffness, which was dependent on the wave
propagation. The geological features of the subsurface were investigated and the velocity of the
wave and depth to the underlying layers were determined. The seismic sections showed three
layers from the colour boundaries. The low velocity band had a velocity of 100-160 m/s which
is interpreted to be loose soft soil materials as in Profile 1 (Figure 4.5). These materials are weak
and have low bearing capacity to be subjected to any load. High velocity band (blue) had a
velocity ranging above 220m/s, which is attributed to solid bedrock at depths below 25m. This
GSJ: Volume 8, Issue 3, March 2020 ISSN 2320-9186 141
GSJ© 2020 www.globalscientificjournal.com

band indicates stiff soils which are averagely good for any construction development. The profile
runs parallel about 50m offset from the tarmac road and coincided with the ERT survey Profile
1. Both profiles indicated weak and loose materials to depths of 25m drawing a very good
correlation between the two cross sections.
Figure 4.5: Shear wave velocity cross section Profile 1, 2
Very shallow bedrock is observed stretching along Profile 2 extending deep to a depth of 50m.
The velocity of wave is high vs>280m/s indicating the presence of stiff soils which are
competent formation. The Vs profile indicates the area is characterized by stiff soil formation to
a depth of 20m. These suitable formations can support load.
Profile 1
Profile 2
GSJ: Volume 8, Issue 3, March 2020 ISSN 2320-9186 142
GSJ© 2020 www.globalscientificjournal.com

Figure 4.6: Shear wave velocity cross section Profile 3
The seismic Profile 3 (Figure 4.6) indicates the area is characterized by very loose soil formation
to a depth of about 2m. This region highly requires site specific evaluation to determine its
suitability for engineering foundation. Thin lenses of soft rock and dense formation are also
observed at 5m and 20m. At about 250m along the profile, a perpendicular band of 200<Vs
m/sec>240 is also observed. This may be because of steeply dipping structure cutting through the
profile an indication of a weak zone vulnerable to movement. This band is interpreted to be a
potential fluid transmission zone that is highly susceptible to relative movements.
Figure 4.7: Shear wave velocity cross section Profile 4
The seismic Profile 4 (Figure 4.7) indicates an area characterized by loose soft soil formation to
a depth of about 5m. A thick bed of soft rock and dense formation is also observed at 5-10m. At
about 420m along the profile, a perpendicular band of 330<Vs m/sec>500 is also observed. This
is assimilated to a rock outcrop almost emerging at the surface. Excavation and backfilling with
suitable material to a depth of about 5m is highly recommended to stabilize the ground.
Profile 3
GSJ: Volume 8, Issue 3, March 2020 ISSN 2320-9186 143
GSJ© 2020 www.globalscientificjournal.com

Figure 4.8: Shear wave velocity cross section Profile 5
The seismic Profile 5 (Figure 4.8) indicates the area is characterized by very loose soil formation
to a depth of about 2m. Below 2m, the profile soft formation dominates to deeper depths of 60m.
This soil formation is not suitable for establishing an engineering foundation.
In summary, shear wave velocity characterized the area with very loose soils to a depth of 2 m
and some to a depth of 5m, which had low bearing capacity and required compaction before
subjected to any load. Observed also was a perpendicular band which may be a result of dipping
cutting structure or a rock outcrop which can be a potential fluid transmission zone that is highly
susceptible to relative movement. Thick bed of soft rocks and dense formation was also observed
at a depth of 5-10m
5.0 Conclusions The geophysical studies reveal the structural weakness at shallow depth that is associated to the
weak and unconsolidated materials. Compact rock materials were observed from a depth of 14m
below ground level. This necessitates mitigation measures such as the utilization of piling such
that the proposed infrastructure rest directly on the competent bed. The piles should be anchored
to a depth greater than 14m below ground level because the size of the structure to be erected is
enormous thus need a stable ground.
The area is characterized by weak Silty material, which has low bearing and consolidation
ability. Such materials are prone to frequent washout under conditions of percolating waters
hence require utmost care during the placement of engineering structures. In-situ compaction
should go before utilization of reinforced concrete amid the development of shallow
GSJ: Volume 8, Issue 3, March 2020 ISSN 2320-9186 144
GSJ© 2020 www.globalscientificjournal.com

foundationto achieve the maximum compaction limits due to the anticipated load of the proposed
infrastructure. Further excavation of the top soil and refilling with competent material such as
gravel and laterite is crucial to have a strong basement.
5.1 Recommendations There is need for a more geological study to be carried out and other new geophysical
methodologies integrated into this research for vast, quick and competitive results within the
Olkaria and its environs. An integrated approach in study of the subsurface conditions should be
employed for a wider understanding of soil properties. Similarly, continuous monitoring and
evaluation of the site and its environment after the construction of the project should be initiated
to establish the ground response towards loading conditions.
Acknowledgement I wish to express gratitude toward The Almighty for His gifts and quality amid the whole time of
research. Besides, I recognize my supervisors Prof. Nicholas O. Mariita and Dr.NjengaMburu for
their profitable research direction they stretched out to me. I likewise want to thank my relatives
for the help they extended during this research. At last, I pay my tribute to the Kenya Electricity
Generating Company – (KenGen) for enabling me to do my research utilizing information from
one of their sites.
References Al-Sayed, E. A., El-Qady, G. (2007): Evaluation of Sea Water Intrusion using the Electrical
Resistivity and Transient Electromagnetic Survey: Case Study at Fan of WadiFeiran,
Sinai, Egypt, EGM International Workshop Innovation in EM, Grav and Mag
Methods: a new Perspective for Exploration Capri, Italy, April 15 – 18, .
Anderson, N., Hoover, R. AND Sirles, P. (2008). Geophysical Methods Commonly Employed
For Geotechnical Site Characterization. Transportation Research Research Broad of the
National Academies.
Baker, B.H., and Wohlenberg, J., (1971): Structural evolution of the Kenya Rift Valley. Nature,
229, 538-542.
GSJ: Volume 8, Issue 3, March 2020 ISSN 2320-9186 145
GSJ© 2020 www.globalscientificjournal.com

Barker R. D., (1997).“Electrical imaging and its application in engineering investigations:
Modern geophysics in engineering geology,” Geological Society Engineering Geology
Special Publication No. 12.
Barker, P. 1993. Techniques of archeological excavation.Taylor and Francis e-Library.
Daniels F. and Alberty R.A., (1966).Physical Chemistry.John Wiley and Sons, Inc. de Groot-
Hedlin, C. and Constable, S., 1990. Occam's inversion to generate smooth, two
Keller G.V. and Frischknecht F.C., (1966).Electrical methods in geophysical
prospecting.Pergamon Press Inc., Oxford
KenGen Internal Report, 2014.An updated geological conceptual model of Olkaria Geothermal
field.Unpublished.
Lapenna V, Piscitelli S, (2005). 2d electrical resistivity imaging of some complex landslides in
the lucanianapennine chain, southern Italy. Geophysics, 70(3).
Loke MH (2011). Tutorial: 2-D and 3-D Electrical Imaging Survey. Manual.
M. N. Nawawi, H. M. T. Baddrul and S. Rosli (2010), “Application of geophysical methods in
civil engineering: Mapping bedrocks and subsurface boulders,” Seminar
GeofizikKejuruteraandanSekitaran,
Omowumi FP. (2014). Application of Electrical Resistivity in Buildings Foundation
Investigation in Ibese Southwestern Nigeria.Asia Pacific Journal of Energy and
Environment, 1, 95-106.
Othman, A.A.A. (2005): Construed Geotechnical Characteristics of Foundation Beds by Seismic
method.
Roger Sala, (2007)Visualising the Ibero-Roman site of Puig-Ciutat (Catalonia, Spain) from
magnetic variation maps and GPR time-slices. 7th InternationalConference on
Archaeological Prospection. «Archaeological
Prospectioin».Archaeologickéhoústavuslovenskejakadémie vied, StudijnéZvesti[Nitra,
Eslovàquia] p. 234-238.
GSJ: Volume 8, Issue 3, March 2020 ISSN 2320-9186 146
GSJ© 2020 www.globalscientificjournal.com

Rucker, M. (2006). Surface geophysics as a tool for characterization existing bridge foundation
and scour conditions. Proceedings of the conference on applied geophysics, Missouri,
U.S.A., December 4-7 2006.
Soupois PM et al., (2007). Use of engineering geophysics to investigate a site for a building
foundation.Journal Geophysics. Eng., 4:94–103.
Thompson, A.O., andDodson., (1963). Geology of the Naivasha area.Government of Kenya
Geological Survey, reportno. 55 (1963), p. 80.
GSJ: Volume 8, Issue 3, March 2020 ISSN 2320-9186 147
GSJ© 2020 www.globalscientificjournal.com