application of hydrographic data in ship squat analysis · to other experiments. it is shown how...
TRANSCRIPT
GIStechnical
36 PositionIT – October 2010
Application of hydrographic data in ship squat analysis
by A Härting and J Reinking, University of Applied Sciences
This article discusses the possibility of predicting squat and under-keel-clearance in confined navigation channels with tidal influence. It presents a case study with a container vessel on the river Elbe and also refers to other experiments. It is shown how hydrographic data, i.e. bottom profile, tide gauge readings and current measurements, enter the analysis and affect the interpretation of results.
A vessel moving through water creates a system of stream lines around her hull which in
turn, according to Bernoulli's equation, changes the distribution of pressure. This simple picture is enough to understand how, in principle, the bow and stern waves and the trough alongside a moving ship are generated. The change of draft and trim of a moving ship with respect to the unperturbed water level is called squat.
As the cross section available for the stream lines is reduced in shallow water and narrow channels, the water alongside the ship is accelerated more intensely and the squat effect is more pronounced. Awareness of squat in the shipping community has been aroused in recent decades as more and more large sized ships use restricted waterways to their limits. It is not uncommon in these cases to allow for a squat effect of more than 1 m.
Essentially the amount of squat depends on speed-through-water, size and shape of the ship's hull and the cross section of the waterway. Detailed numerical calculations are computationally very intensive and yield a result only for one particular stationary situation at a time. For practical purposes, it is customary to use empirical formulas that have been developed since the 1970s from the few experimental data available then or from model tank experiments. A review can be found e.g. in PIANC-IPAH [1] or, more recently, in Beaulieu et al [2]. The mathematical structure is usually based on an analytic approach made by Tuck [3]. Most of the empirical formulas are only valid for a restricted range of parameters and in cases where comparisons are possible, results
differ substantially. To have access to reliable values of squat shipping authorities, with their responsibility of defining the maximum permissible draft for a particular waterway, often call for full-scale measurements with up-to-date technology.
Measurement of squat
All methods nowadays rely on DGPS.
The SHIPS method
The SHIPS (Shore Independent Precise Squat observation) method has been
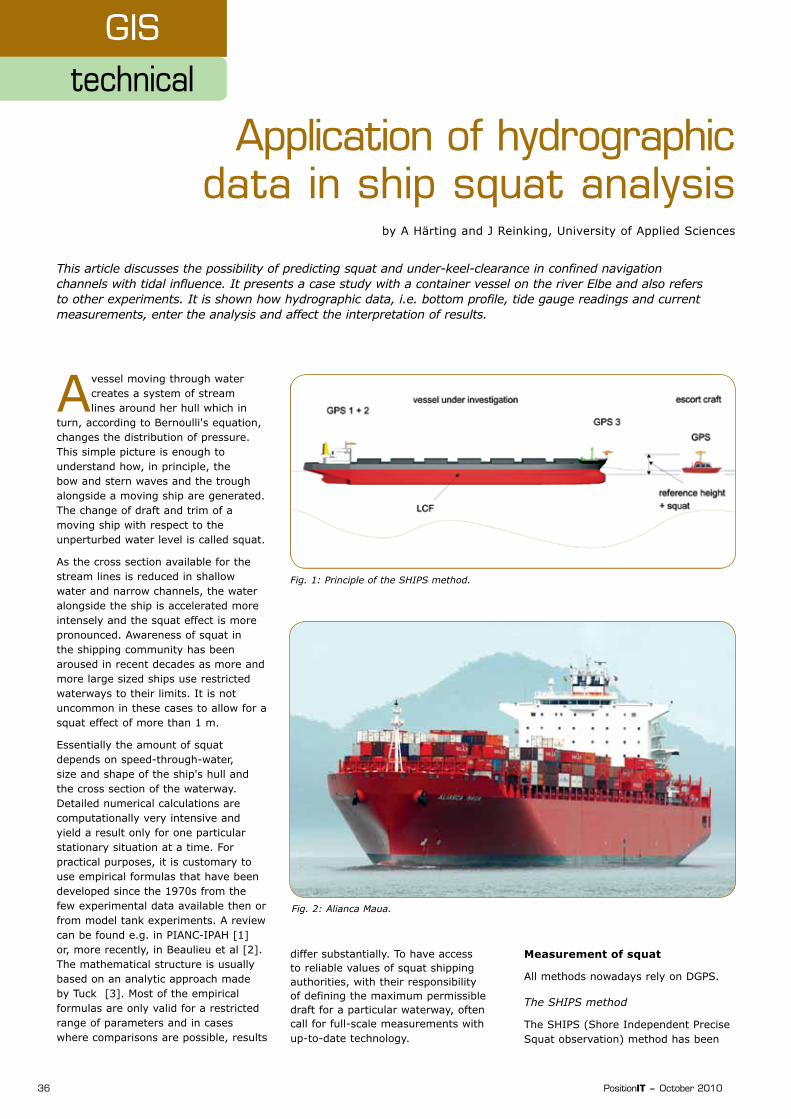
Fig. 1: Principle of the SHIPS method.
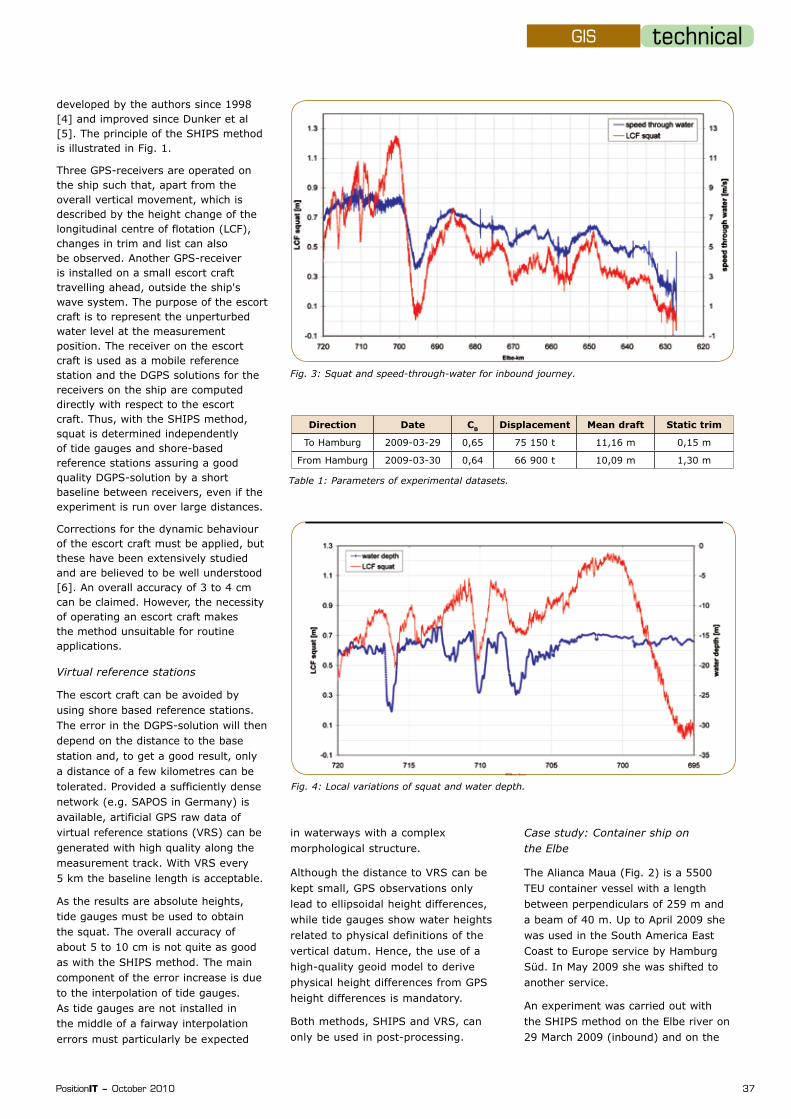
Fig. 2: Alianca Maua.
technicalGIS
PositionIT – October 2010 37
developed by the authors since 1998 [4] and improved since Dunker et al [5]. The principle of the SHIPS method is illustrated in Fig. 1.
Three GPS-receivers are operated on the ship such that, apart from the overall vertical movement, which is described by the height change of the longitudinal centre of flotation (LCF), changes in trim and list can also be observed. Another GPS-receiver is installed on a small escort craft travelling ahead, outside the ship's wave system. The purpose of the escort craft is to represent the unperturbed water level at the measurement position. The receiver on the escort craft is used as a mobile reference station and the DGPS solutions for the receivers on the ship are computed directly with respect to the escort craft. Thus, with the SHIPS method, squat is determined independently of tide gauges and shore-based reference stations assuring a good quality DGPS-solution by a short baseline between receivers, even if the experiment is run over large distances.
Corrections for the dynamic behaviour of the escort craft must be applied, but these have been extensively studied and are believed to be well understood [6]. An overall accuracy of 3 to 4 cm can be claimed. However, the necessity of operating an escort craft makes the method unsuitable for routine applications.
Virtual reference stations
The escort craft can be avoided by using shore based reference stations. The error in the DGPS-solution will then depend on the distance to the base station and, to get a good result, only a distance of a few kilometres can be tolerated. Provided a sufficiently dense network (e.g. SAPOS in Germany) is available, artificial GPS raw data of virtual reference stations (VRS) can be generated with high quality along the measurement track. With VRS every 5 km the baseline length is acceptable.
As the results are absolute heights, tide gauges must be used to obtain the squat. The overall accuracy of about 5 to 10 cm is not quite as good as with the SHIPS method. The main component of the error increase is due to the interpolation of tide gauges. As tide gauges are not installed in the middle of a fairway interpolation errors must particularly be expected
Direction Date CB Displacement Mean draft Static trim
To Hamburg 2009-03-29 0,65 75 150 t 11,16 m 0,15 m
From Hamburg 2009-03-30 0,64 66 900 t 10,09 m 1,30 m
Table 1: Parameters of experimental datasets.
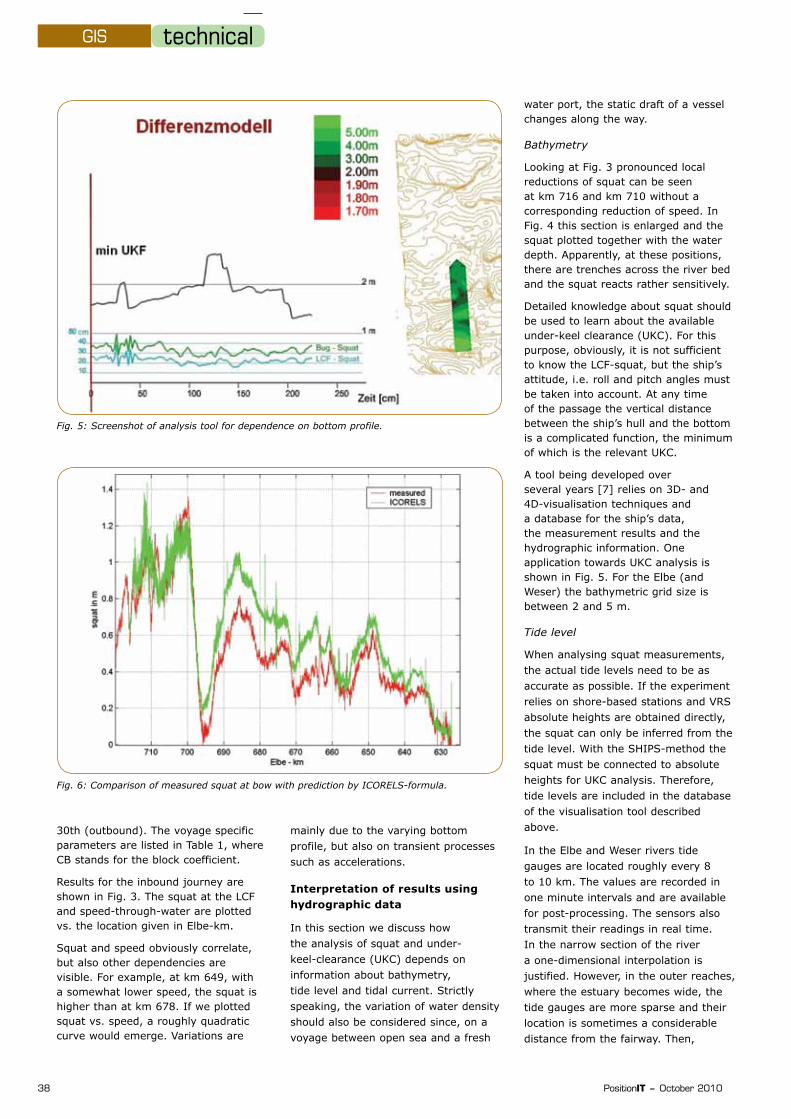
Fig. 3: Squat and speed-through-water for inbound journey.
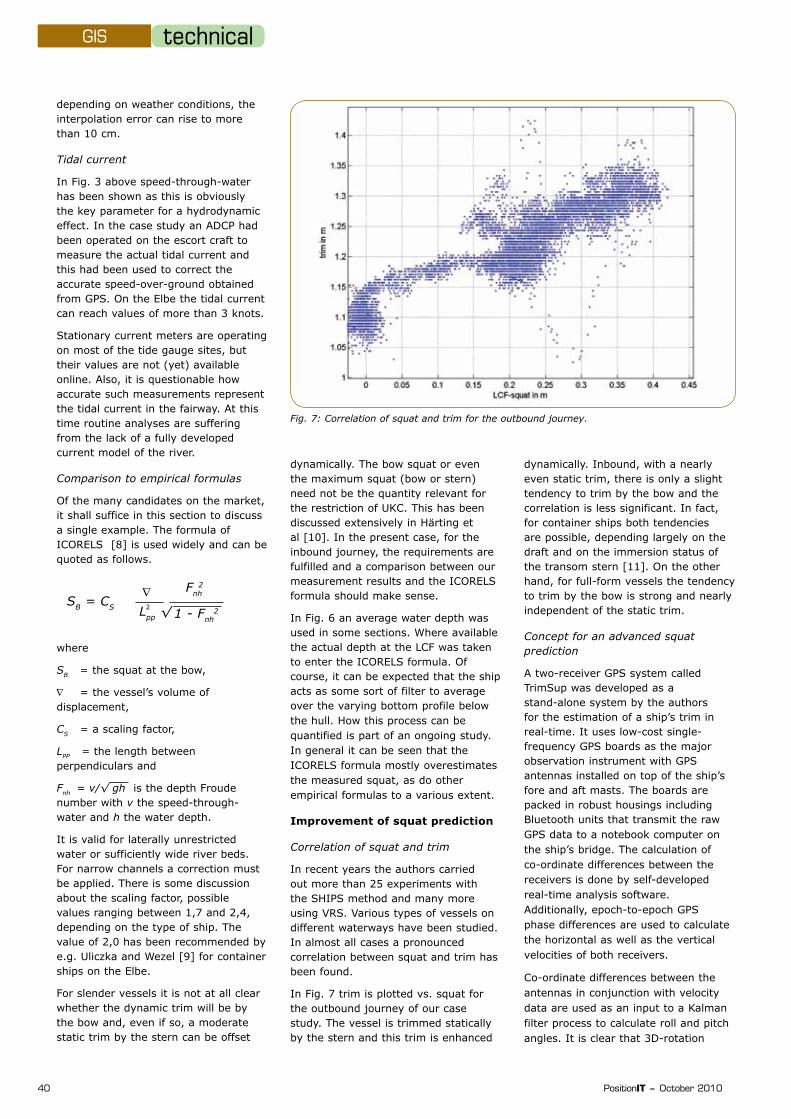
Fig. 4: Local variations of squat and water depth.
in waterways with a complex morphological structure.
Although the distance to VRS can be kept small, GPS observations only lead to ellipsoidal height differences, while tide gauges show water heights related to physical definitions of the vertical datum. Hence, the use of a high-quality geoid model to derive physical height differences from GPS height differences is mandatory.
Both methods, SHIPS and VRS, can only be used in post-processing.
Case study: Container ship on the Elbe
The Alianca Maua (Fig. 2) is a 5500 TEU container vessel with a length between perpendiculars of 259 m and a beam of 40 m. Up to April 2009 she was used in the South America East Coast to Europe service by Hamburg Süd. In May 2009 she was shifted to another service.
An experiment was carried out with the SHIPS method on the Elbe river on 29 March 2009 (inbound) and on the
technicalGIS
38 PositionIT – October 2010
30th (outbound). The voyage specific parameters are listed in Table 1, where CB stands for the block coefficient.
Results for the inbound journey are shown in Fig. 3. The squat at the LCF and speed-through-water are plotted vs. the location given in Elbe-km.
Squat and speed obviously correlate, but also other dependencies are visible. For example, at km 649, with a somewhat lower speed, the squat is higher than at km 678. If we plotted squat vs. speed, a roughly quadratic curve would emerge. Variations are
mainly due to the varying bottom profile, but also on transient processes such as accelerations.
Interpretation of results using hydrographic data
In this section we discuss how the analysis of squat and under-keel-clearance (UKC) depends on information about bathymetry, tide level and tidal current. Strictly speaking, the variation of water density should also be considered since, on a voyage between open sea and a fresh
water port, the static draft of a vessel changes along the way.
Bathymetry
Looking at Fig. 3 pronounced local reductions of squat can be seen at km 716 and km 710 without a corresponding reduction of speed. In Fig. 4 this section is enlarged and the squat plotted together with the water depth. Apparently, at these positions, there are trenches across the river bed and the squat reacts rather sensitively.
Detailed knowledge about squat should be used to learn about the available under-keel clearance (UKC). For this purpose, obviously, it is not sufficient to know the LCF-squat, but the ship’s attitude, i.e. roll and pitch angles must be taken into account. At any time of the passage the vertical distance between the ship’s hull and the bottom is a complicated function, the minimum of which is the relevant UKC.
A tool being developed over several years [7] relies on 3D- and 4D-visualisation techniques and a database for the ship’s data, the measurement results and the hydrographic information. One application towards UKC analysis is shown in Fig. 5. For the Elbe (and Weser) the bathymetric grid size is between 2 and 5 m.
Tide level
When analysing squat measurements, the actual tide levels need to be as accurate as possible. If the experiment relies on shore-based stations and VRS absolute heights are obtained directly, the squat can only be inferred from the tide level. With the SHIPS-method the squat must be connected to absolute heights for UKC analysis. Therefore, tide levels are included in the database of the visualisation tool described above.
In the Elbe and Weser rivers tide gauges are located roughly every 8 to 10 km. The values are recorded in one minute intervals and are available for post-processing. The sensors also transmit their readings in real time. In the narrow section of the river a one-dimensional interpolation is justified. However, in the outer reaches, where the estuary becomes wide, the tide gauges are more sparse and their location is sometimes a considerable distance from the fairway. Then,
Fig. 5: Screenshot of analysis tool for dependence on bottom profile.
Fig. 6: Comparison of measured squat at bow with prediction by ICORELS-formula.
technicalGIS
40 PositionIT – October 2010
Fig. 7: Correlation of squat and trim for the outbound journey.
depending on weather conditions, the interpolation error can rise to more than 10 cm.
Tidal current
In Fig. 3 above speed-through-water has been shown as this is obviously the key parameter for a hydrodynamic effect. In the case study an ADCP had been operated on the escort craft to measure the actual tidal current and this had been used to correct the accurate speed-over-ground obtained from GPS. On the Elbe the tidal current can reach values of more than 3 knots.
Stationary current meters are operating on most of the tide gauge sites, but their values are not (yet) available online. Also, it is questionable how accurate such measurements represent the tidal current in the fairway. At this time routine analyses are suffering from the lack of a fully developed current model of the river.
Comparison to empirical formulas
Of the many candidates on the market, it shall suffice in this section to discuss a single example. The formula of ICORELS [8] is used widely and can be quoted as follows.
where
SB = the squat at the bow,
∇ = the vessel’s volume of displacement,
CS = a scaling factor,
LPP = the length between perpendiculars and
Fnh = v/√ gh is the depth Froude number with v the speed-through-water and h the water depth.
It is valid for laterally unrestricted water or sufficiently wide river beds. For narrow channels a correction must be applied. There is some discussion about the scaling factor, possible values ranging between 1,7 and 2,4, depending on the type of ship. The value of 2,0 has been recommended by e.g. Uliczka and Wezel [9] for container ships on the Elbe.
For slender vessels it is not at all clear whether the dynamic trim will be by the bow and, even if so, a moderate static trim by the stern can be offset
dynamically. The bow squat or even the maximum squat (bow or stern) need not be the quantity relevant for the restriction of UKC. This has been discussed extensively in Härting et al [10]. In the present case, for the inbound journey, the requirements are fulfilled and a comparison between our measurement results and the ICORELS formula should make sense.
In Fig. 6 an average water depth was used in some sections. Where available the actual depth at the LCF was taken to enter the ICORELS formula. Of course, it can be expected that the ship acts as some sort of filter to average over the varying bottom profile below the hull. How this process can be quantified is part of an ongoing study. In general it can be seen that the ICORELS formula mostly overestimates the measured squat, as do other empirical formulas to a various extent.
Improvement of squat prediction
Correlation of squat and trim
In recent years the authors carried out more than 25 experiments with the SHIPS method and many more using VRS. Various types of vessels on different waterways have been studied. In almost all cases a pronounced correlation between squat and trim has been found.
In Fig. 7 trim is plotted vs. squat for the outbound journey of our case study. The vessel is trimmed statically by the stern and this trim is enhanced
dynamically. Inbound, with a nearly even static trim, there is only a slight tendency to trim by the bow and the correlation is less significant. In fact, for container ships both tendencies are possible, depending largely on the draft and on the immersion status of the transom stern [11]. On the other hand, for full-form vessels the tendency to trim by the bow is strong and nearly independent of the static trim.
Concept for an advanced squat prediction
A two-receiver GPS system called TrimSup was developed as a stand-alone system by the authors for the estimation of a ship’s trim in real-time. It uses low-cost single-frequency GPS boards as the major observation instrument with GPS antennas installed on top of the ship’s fore and aft masts. The boards are packed in robust housings including Bluetooth units that transmit the raw GPS data to a notebook computer on the ship’s bridge. The calculation of co-ordinate differences between the receivers is done by self-developed real-time analysis software. Additionally, epoch-to-epoch GPS phase differences are used to calculate the horizontal as well as the vertical velocities of both receivers.
Co-ordinate differences between the antennas in conjunction with velocity data are used as an input to a Kalman filter process to calculate roll and pitch angles. It is clear that 3D-rotation
√SB = CS
∇
Lpp2
1 - Fnh
Fnh2
2

technicalGIS
PositionIT – October 2010 41
information cannot be derived from only two points in space without additional assumptions. An auxiliary zero-parameter is introduced that takes the role of a righting moment for the rotation about the longitudinal axis. This parameter is introduced in the filter system as a pseudo-observation. The weight can be selected according to the present ship and wave conditions from pilotage to heavy sea. In pilotage on a river the influence of a poorly resolved roll angle on the pitch can be considered negligible. After a number of filter steps, the trim is calculated by low-pass filtering of the pitch angle. Tests have shown that the quality of the resulting trim can be quantified as 2 to 5 cm.
With accurate trim accessible in real-time it seems promising to develop an advanced tool for predicting squat and estimating UKC. Such a tool would, at first, be specific for a particular river and type of ship. The concept is to exploit the correlation between squat and trim and to feed the actually measured trim into a more elaborate empirical formula. The mathematical evaluation could be delegated to the computer running TrimSup as an additional function. This computer would contain a database with the bathymetric data (and, of course static draft and trim) and the tide level could easily be imported online. A remaining problem is to get the speed-through-water with sufficient accuracy.
Need for online tidal current
Speed-through-water is the velocity of a vessel relative to the surrounding, unperturbed body of water. Any
hydrodynamic log senses the flow of water in the vicinity of the ship’s hull. The log can be calibrated in open water but, in a situation with restricted UKC the very reason of the squat effect leads to an increased flow of water below the hull. In a shallow river it is not possible to measure speed-through-water accurately on board.
In Fig. 8 we show, for the inbound journey of our case study, the ICORELS prediction for the actually observed speed-through-water and with speed increased or decreased by 3 knots, respectively. The huge difference between the curves demonstrates what would happen, if a tidal current of 3 knots were ignored. For a reliable estimation of squat it is absolutely mandatory to have access to a good speed-through-water. For on board use, the only way to achieve this is a well established current model based on real-time measurements.
Conclusions
Estimation of ship squat takes an important role in the definition of permissible draft and the scheduling of tide-dependent passages. A case study of a container ship on the Elbe has been presented to show how hydrographic information enters the analysis of squat and under-keel-clearance.
While existing empirical formulas generally yield poor results, an improved concept has been suggested that would also be suitable for real-time use on board. This approach relies on the possibility of measuring the dynamic trim and exploits a correlation between squat and trim, which may be established for
different loading conditions on each type of vessel. For a successful prediction of squat and UKC not only the bathymetric data and tide levels are necessary, but also a reasonably accurate speed-through-water. The latter, however, depends on the development of a good tidal current model, supported by real-time current measurements.
Acknowledgement
This work has been supported in part by Volkswagenstiftung, grant number ZN2172.
This paper was presented at Hydro 09 and is republished here with permission.
References
[1] PIANC-IAPH, 1997. Approach Channels, A Guide for Design, Report of the joint working group II-30, PIANC-Bulletin Nr.95.
[2] C Beaulieu, S Gharbi, T Ouarda, O Seidou, 2008. A statistical approach to model the deep draft ships squat in the St. Lawrence waterway, Journal of Waterway, Port, Coastal and Ocean Engineering, to be published.
[3] E O Tuck, 1966. Shallow-water flows past slender bodies, J. Fluid Mech. (1966), Vol. 26, pp. 81-95.
[4] A Härting, J Reinking, 1999. Efficient determination of ship squat, Schiff und Hafen, 3, pp. 78-81.
[5] S Dunker, A Gollenstede, A Härting, J Reinking, 2002. Analysis and Comparison of SHIPS-derived Squat, Proceedings Hydro 2002, pp. 434-449, Kiel.
[6] A Härting, J Reinking, W Ellmer, 2004. Ship Squat in Hydrography – a Study of the Surveying Vessel Deneb. International Hydrographic Review, Vol. 5 No. 3 (New Series), November 2004.
[7] I Jaquemotte, J Reinking, 2005, 4D-Modellierung zur Analyse des Squat von Seeschiffen in : Hydrographie – Vermessung mit Tiefgang, DVW Schriftenreihe Band 47 /Beiträge zum 20. Hydrographentag 2005 in Wilhelmshaven.
[8] ICORELS (Int. Commission for the Reception of Large Ships): Report of Working Group IV, PIANC Bull. 35 (Suppl.) 1980.
[9] K Uliczka, M Wezel, 2005. Dynamisches Fahrverhalten Grosser Containerschiffe bei Revierfahrt auf Unter- und Außenelbe, HTG-Kongress Bremen, 2005.
[10] A Härting, A Laupichler, J Reinking, 2009. Considerations on the squat of unevenly trimmed ships, Ocean Engineering 36, 193-201.
[11] J Reinking, A Laupichler, A Härting, 2009, On the Dynamic Trim of Container Ships, 3rd Squat Workshop “Nautical Aspects of Ship Dynamics”, Elsfleth, October 2009, to be published.
Contact Prof. Dr. Alexander Härting, University of Applied Sciences, [email protected]
Fig. 8: Sensitivity of squat prediction to speed-through-water.